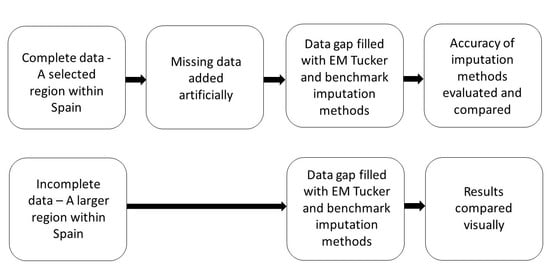
Gap-Filling of NDVI Satellite Data Using Tucker Decomposition: Exploiting Spatio-Temporal Patterns
Abstract
:1. Introduction
2. Study Region and Data Set
2.1. Study Region
2.2. Data Sets and Pre-Processing
3. Methods
3.1. Tucker Decomposition
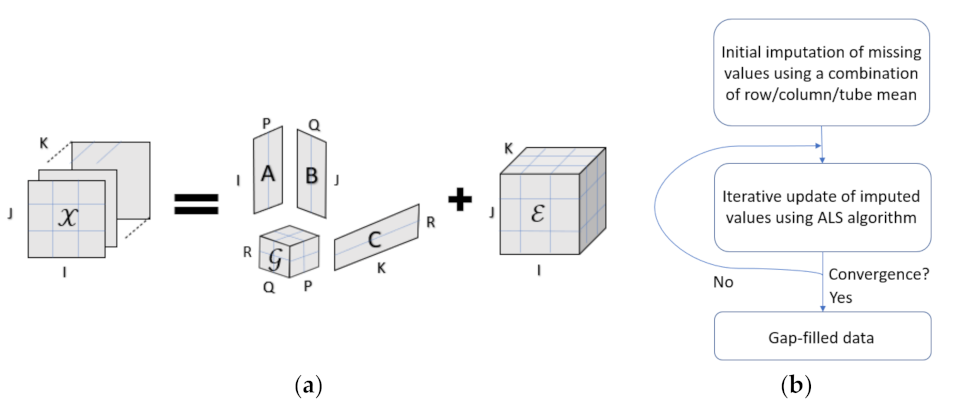
3.2. EM Tucker for Imputation of Missing Values
3.3. Model Selection
3.4. Metrics
3.5. Reference Methods
4. Results
5. Discussion
6. Conclusions
Author Contributions
Funding
Institutional Review Board Statement
Informed Consent Statement
Data Availability Statement
Conflicts of Interest
Abbreviations
| AIC | Akaike information criterion |
| ALS | Alternating least squares |
| AVHRR | Advanced very-high-resolution radiometer |
| BIC | Bayesian information criterion |
| EM | Expectation maximization |
| HOSVD | Higher order singular value decomposition |
| KNN | K-nearest neighbors |
| MAR | Missing at random |
| MCAR | Missing completely at random |
| MODIS | Moderate resolution imaging spectroradiometer |
| NDVI | Normalized difference vegetation index |
| PCA | Principal component analysis |
| RMSE | Root mean square error |
| RRMSE | Relative root mean square error |
| SI | Single imputation |
| SSIM | Structural similarity index |
References
- Shen, H.; Li, X.; Cheng, Q.; Zeng, C.; Yang, G.; Li, H.; Zhang, L. Missing Information Reconstruction of Remote Sensing Data: A Technical Review. IEEE Geosci. Remote Sens. Mag. 2015, 3, 61–85. [Google Scholar] [CrossRef]
- Wang, Q.; Wang, L.; Wei, C.; Jin, Y.; Li, Z.; Tong, X.; Atkinson, P.M. Filling gaps in Landsat ETM+ SLC-off images with Sentinel-2 MSI images. Int. J. Appl. Earth Obs. Geoinf. 2021, 101, 102365. [Google Scholar] [CrossRef]
- Zhang, L.; Wu, X. An edge-guided image interpolation algorithm via directional filtering and data fusion. IEEE Trans. Image Process. 2006, 15, 2226–2238. [Google Scholar] [CrossRef] [Green Version]
- Zhang, Q.; Yuan, Q.; Zeng, C.; Li, X.; Wei, Y. Missing Data Reconstruction in Remote Sensing Image With a Unified Spatial–Temporal–Spectral Deep Convolutional Neural Network. IEEE Trans. Geosci. Remote Sens. 2018, 56, 4274–4288. [Google Scholar] [CrossRef] [Green Version]
- Holben, B.N. Characteristics of maximum-value composite images from temporal AVHRR data. Int. J. Remote Sens. 1986, 7, 1417–1434. [Google Scholar] [CrossRef]
- Zhu, Z.; Woodcock, C.E.; Holden, C.; Yang, Z. Generating synthetic Landsat images based on all available Landsat data: Predicting Landsat surface reflectance at any given time. Remote Sens. Environ. 2015, 162, 67–83. [Google Scholar] [CrossRef]
- Lin, C.-H.; Lai, K.-H.; Chen, Z.-B.; Chen, J.-Y. Patch-Based Information Reconstruction of Cloud-Contaminated Multitemporal Images. IEEE Trans. Geosci. Remote Sens. 2013, 52, 163–174. [Google Scholar] [CrossRef]
- Lin, C.-H.; Tsai, P.-H.; Lai, K.-H.; Chen, J.-Y. Cloud Removal From Multitemporal Satellite Images Using Information Cloning. IEEE Trans. Geosci. Remote Sens. 2012, 51, 232–241. [Google Scholar] [CrossRef]
- Zhang, X.; Qin, F.; Qin, Y. Study on the Thick Cloud Removal Method Based on Multi-Temporal Remote Sensing Images. In Proceedings of the 2010 International Conference on Multimedia Technology, Ningbo, China, 29–31 October 2010; IEEE: Ningbo, China, 2010. [Google Scholar]
- Li, M.; Liew, S.C.; Kwoh, L.K. Producing Cloud Free and Cloud-Shadow Free Mosaic from Cloudy IKONOS Images. In Proceedings of the IGARSS 2003. 2003 IEEE International Geoscience and Remote Sensing Symposium, Toulouse, France, 21–25 July 2003; IEEE: Toulouse, France, 2003. Proceedings (IEEE Cat. No.03CH37477). [Google Scholar]
- Helmer, E.H.; Ruefenacht, B. Cloud-Free Satellite Image Mosaics with Regression Trees and Histogram Matching. Photogramm. Eng. Remote Sens. 2005, 71, 1079–1089. [Google Scholar] [CrossRef] [Green Version]
- Chen, J.; Jönsson, P.; Tamura, M.; Gu, Z.; Matsushita, B.; Eklundh, L. A simple method for reconstructing a high-quality NDVI time-series data set based on the Savitzky–Golay filter. Remote Sens. Environ. 2004, 91, 332–344. [Google Scholar] [CrossRef]
- Julien, Y.; Sobrino, J.A. Comparison of cloud-reconstruction methods for time series of composite NDVI data. Remote Sens. Environ. 2010, 114, 618–625. [Google Scholar] [CrossRef]
- Viovy, N.; Arino, O.; Belward, A.S. The Best Index Slope Extraction (BISE): A method for reducing noise in NDVI time-series. Int. J. Remote Sens. 1992, 13, 1585–1590. [Google Scholar] [CrossRef]
- Ma, M.; Veroustraete, F. Reconstructing pathfinder AVHRR land NDVI time-series data for the Northwest of China. Adv. Space Res. 2005, 37, 835–840. [Google Scholar] [CrossRef]
- Zhu, W.; Pan, Y.; He, H.; Wang, L.; Mou, M.; Liu, J. A Changing-Weight Filter Method for Reconstructing a High-Quality NDVI Time Series to Preserve the Integrity of Vegetation Phenology. IEEE Trans. Geosci. Remote Sens. 2011, 50, 1085–1094. [Google Scholar] [CrossRef]
- Song, C.; Huang, B.; You, S. Comparison of Three Time-Series NDVI Reconstruction Methods Based on TIMESAT. In Proceedings of the 2012 IEEE International Geoscience and Remote Sensing Symposium, Munich, Germany, 22–27 July 2012. [Google Scholar]
- Julien, Y.; Sobrino, J.A. Global land surface phenology trends from GIMMS database. Int. J. Remote Sens. 2009, 30, 3495–3513. [Google Scholar] [CrossRef] [Green Version]
- Jönsson, P.; Eklundh, L. Seasonality extraction by function fitting to time-series of satellite sensor data. IEEE Trans. Geosci. Remote Sens. 2002, 40, 1824–1832. [Google Scholar] [CrossRef]
- Beck, P.S.A.; Atzberger, C.; Høgda, K.A.; Johansen, B.; Skidmore, A.K. Improved Monitoring of Vegetation Dynamics at Very High Latitudes: A New Method Using MODIS NDVI. Remote Sens. Environ. 2006, 100, 321–334. [Google Scholar] [CrossRef]
- Sellers, P.J.; Tucker, C.J.; Collatz, G.J.; Los, S.O.; Justice, C.O.; Dazlich, D.A.; Randall, D.A. A global 1° by 1° NDVI data set for climate studies. Part 2: The generation of global fields of terrestrial biophysical parameters from the NDVI. Int. J. Remote Sens. 1994, 15, 3519–3545. [Google Scholar] [CrossRef]
- Ghaderpour, E.; Vujadinovic, T. Change Detection within Remotely Sensed Satellite Image Time Series via Spectral Analysis. Remote Sens. 2020, 12, 4001. [Google Scholar] [CrossRef]
- Lorenzi, L.; Melgani, F.; Mercier, G. Missing-Area Reconstruction in Multispectral Images Under a Compressive Sensing Perspective. IEEE Trans. Geosci. Remote Sens. 2013, 51, 3998–4008. [Google Scholar] [CrossRef]
- Li, X.; Shen, H.; Zhang, L.; Zhang, H.; Yuan, Q.; Yang, G. Recovering Quantitative Remote Sensing Products Contaminated by Thick Clouds and Shadows Using Multitemporal Dictionary Learning. IEEE Trans. Geosci. Remote Sens. 2014, 52, 7086–7098. [Google Scholar] [CrossRef]
- Wang, L.; Qu, J.J.; Xiong, X.; Hao, X.; Xie, Y.; Che, N. A New Method for Retrieving Band 6 of Aqua MODIS. IEEE Geosci. Remote Sens. Lett. 2006, 3, 267–270. [Google Scholar] [CrossRef]
- Zeng, C.; Shen, H.; Zhang, L. Recovering missing pixels for Landsat ETM+ SLC-off imagery using multi-temporal regression analysis and a regularization method. Remote Sens. Environ. 2013, 131, 182–194. [Google Scholar] [CrossRef]
- Cheng, Q.; Shen, H.; Zhang, L.; Yuan, Q.; Zeng, C. Cloud removal for remotely sensed images by similar pixel replacement guided with a spatio-temporal MRF model. ISPRS J. Photogramm. Remote Sens. 2014, 92, 54–68. [Google Scholar] [CrossRef]
- Benabdelkader, S.; Melgani, F. Contextual Spatiospectral Postreconstruction of Cloud-Contaminated Images. IEEE Geosci. Remote Sens. Lett. 2008, 5, 204–208. [Google Scholar] [CrossRef]
- Sarafanov, M.; Kazakov, E.; Nikitin, N.O.; Kalyuzhnaya, A.V. A Machine Learning Approach for Remote Sensing Data Gap-Filling with Open-Source Implementation: An Example Regarding Land Surface Temperature, Surface Albedo and NDVI. Remote Sens. 2020, 12, 3865. [Google Scholar] [CrossRef]
- Mørup, M. Applications of tensor (multiway array) factorizations and decompositions in data mining. Wiley Interdiscip. Rev. Data Min. Knowl. Discov. 2011, 1, 24–40. [Google Scholar] [CrossRef]
- Tomasi, G.; Bro, R. PARAFAC and missing values. Chemom. Intell. Lab. Syst. 2005, 75, 163–180. [Google Scholar] [CrossRef]
- Liu, J.; Musialski, P.; Wonka, P.; Ye, J. Tensor Completion for Estimating Missing Values in Visual Data. IEEE Trans. Pattern Anal. Mach. Intell. 2012, 35, 208–220. [Google Scholar] [CrossRef]
- Asif, M.T.; Mitrovic, N.; Dauwels, J.; Jaillet, P. Matrix and Tensor Based Methods for Missing Data Estimation in Large Traffic Networks. IEEE Trans. Intell. Transp. Syst. 2016, 17, 1816–1825. [Google Scholar] [CrossRef]
- Bro, R. Review on Multiway Analysis in Chemistry—2000–2005. Crit. Rev. Anal. Chem. 2006, 36, 279–293. [Google Scholar] [CrossRef]
- Carroll, J.D.; Chang, J.-J. Analysis of individual differences in multidimensional scaling via an n-way generalization of “Eckart-Young” decomposition. Psychometrika 1970, 35, 283–319. [Google Scholar] [CrossRef]
- Tan, H.; Feng, J.; Chen, Z.; Yang, F.; Wang, W. Low Multilinear Rank Approximation of Tensors and Application in Missing Traffic Data. Adv. Mech. Eng. 2014, 6, 157597. [Google Scholar] [CrossRef] [Green Version]
- Lasanta, T.; Vicente-Serrano, S.M. Complex land cover change processes in semiarid Mediterranean regions: An approach using Landsat images in northeast Spain. Remote Sens. Environ. 2012, 124, 1–14. [Google Scholar] [CrossRef]
- Stellmes, M.; Röder, A.; Udelhoven, T.; Hill, J. Mapping syndromes of land change in Spain with remote sensing time series, demographic and climatic data. Land Use Policy 2013, 30, 685–702. [Google Scholar] [CrossRef]
- Kuemmerle, T.; Levers, C.; Erb, K.; Estel, S.; Jepsen, M.R.; Müller, D.; Plutzar, C.; Stürck, J.; Verkerk, P.J.; Verburg, P.; et al. Hotspots of land use change in Europe. Environ. Res. Lett. 2016, 11, 064020. [Google Scholar] [CrossRef]
- Hill, J.; Stellmes, M.; Udelhoven, T.; Röder, A.; Sommer, S. Mediterranean desertification and land degradation: Mapping related land use change syndromes based on satellite observations. Glob. Planet. Chang. 2008, 64, 146–157. [Google Scholar] [CrossRef]
- Gouveia, C.M.; Páscoa, P.; Russo, A.; Trigo, R.M. Land Degradation Trend Assessment over Iberia during 1982–2012. Cuad. Investig. Geogr. 2016, 42, 89. [Google Scholar] [CrossRef] [Green Version]
- Spinoni, J.; Barbosa, P.; Bucchignani, E.; Cassano, J.; Cavazos, T.; Christensen, J.H.; Christensen, O.B.; Coppola, E.; Evans, J.; Geyer, B.; et al. Future Global Meteorological Drought Hot Spots: A Study Based on CORDEX Data. J. Clim. 2020, 33, 3635–3661. [Google Scholar] [CrossRef]
- Noguera, I.; Domínguez-Castro, F.; Vicente-Serrano, S.M. Flash Drought Response to Precipitation and Atmospheric Evaporative Demand in Spain. Atmosphere 2021, 12, 165. [Google Scholar] [CrossRef]
- Del Barrio, G.; Puigdefábregas, J.; Sanjuán, M.E.; Stellmes, M.; Ruiz, A. Assessment and monitoring of land condition in the Iberian Peninsula, 1989–2000. Remote Sens. Environ. 2010, 114, 1817–1832. [Google Scholar] [CrossRef]
- Lanfredi, M.; Coppola, R.; Simoniello, T.; Coluzzi, R.; D’Emilio, M.; Imbrenda, V.; Macchiato, M. Early Identification of Land Degradation Hotspots in Complex Bio-Geographic Regions. Remote Sens. 2015, 7, 8154–8179. [Google Scholar] [CrossRef] [Green Version]
- Dardel, C.; Kergoat, L.; Hiernaux, P.; Mougin, E.; Grippa, M.; Tucker, C.J. Re-greening Sahel: 30years of remote sensing data and field observations (Mali, Niger). Remote Sens. Environ. 2014, 140, 350–364. [Google Scholar] [CrossRef]
- Vicente-Serrano, S.; Cabello, D.; Tomás-Burguera, M.; Martín-Hernández, N.; Beguería, S.; Azorin-Molina, C.; Kenawy, A. Drought variability and land degradation in semiarid regions: Assessment using remote sensing data and drought indices (1982–2011). Remote Sens. 2015, 7, 4391–4423. [Google Scholar] [CrossRef] [Green Version]
- Vicente-Serrano, S.M.; Martín-Hernández, N.; Reig, F.; Azorin-Molina, C.; Zabalza, J.; Beguería, S.; Domínguez-Castro, F.; El Kenawy, A.; Peña-Gallardo, M.; Noguera, I.; et al. Vegetation greening in spain detected from long term data (1981–2015). Int. J. Remote Sens. 2019, 41, 1709–1740. [Google Scholar] [CrossRef]
- Gazol, A.; Camarero, J.J.; Vicente-Serrano, S.M.; Sánchez-Salguero, R.; Gutierrez, E.; de Luis, M.; Sangüesa-Barreda, G.; Novak, K.; Rozas, V.; Tíscar, P.A.; et al. Forest resilience to drought varies across biomes. Glob. Chang. Biol. 2018, 24, 2143–2158. [Google Scholar] [CrossRef]
- Vicente-Serrano, S.M.; Azorin-Molina, C.; Peña-Gallardo, M.; Tomas-Burguera, M.; Domínguez-Castro, F.; Martín-Hernández, N.; Beguería, S.; El Kenawy, A.; Noguera, I.; García, M. A high-resolution spatial assessment of the impacts of drought variability on vegetation activity in Spain from 1981 to 2015. Nat. Hazards Earth Syst. Sci. 2019, 19, 1189–1213. [Google Scholar] [CrossRef] [Green Version]
- Vicente-Serrano, S.M.; Martín-Hernández, N.; Camarero, J.J.; Gazol, A.; Sánchez-Salguero, R.; Peña-Gallardo, M.; El Kenawy, A.; Domínguez-Castro, F.; Tomas-Burguera, M.; Gutiérrez, E.; et al. Linking tree-ring growth and satellite-derived gross primary growth in multiple forest biomes. Temporal-scale matters. Ecol. Indic. 2019, 108, 105753. [Google Scholar] [CrossRef]
- D’Odorico, P.; Bhattachan, A. Hydrologic variability in dryland regions: Impacts on ecosystem dynamics and food security. Philos. Trans. R. Soc. B. Biol. Sci. 2012, 367, 3145–3157. [Google Scholar] [CrossRef] [Green Version]
- Scheffer, M. Foreseeing tipping points. Nature 2010, 467, 411–412. [Google Scholar] [CrossRef]
- Afanador, N. Expectation Maximization (EM) For Imputation of Missing Values. mvdalab v1.4. Available online: https://rdrr.io/cran/mvdalab/man/imputeEM.html (accessed on 3 October 2021).
- Walczak, B.; Massart, D.L. Dealing with missing data: Part I. Chemom. Intell. Lab. Syst. 2001, 58, 15–27. [Google Scholar] [CrossRef]
- Moon, T.K. The expectation-maximization algorithm. IEEE Signal Process. Mag. 1996, 13, 47–60. [Google Scholar] [CrossRef]
- Andersson, C.A.; Bro, R. The N-Way Toolbox for MATLAB. Chemom. Intell. Lab. Syst. 2000, 52, 1–4. [Google Scholar] [CrossRef]
- Atkinson, P.M.; Jeganathan, C.; Dash, J.; Atzberger, C. Inter-comparison of four models for smoothing satellite sensor time-series data to estimate vegetation phenology. Remote Sens. Environ. 2012, 123, 400–417. [Google Scholar] [CrossRef]
- Wang, Z.; Bovik, A.C.; Sheikh, H.R.; Simoncelli, E.P. Image Quality Assessment: From Error Visibility to Structural Similarity. IEEE Trans. Image Process. 2004, 13, 600–612. [Google Scholar] [CrossRef] [Green Version]
- Dempster, A.P.; Laird, N.M.; Rubin, D.B. Maximum Likelihood from Incomplete Data Via The EM Algorithm. J. R. Stat. Soc. Ser. B (Methodol.) 1977, 39, 1–22. [Google Scholar] [CrossRef]
- MATLAB. 1.8.0121 (R2017b), The MathWorks Inc.: Natick, MA, USA, 2017.
- R Core Team. R: A Language and Environment for Statistical Computing; R Foundation for Statistical Computing: Vienna, Austria, 2020. [Google Scholar]
- Henson, R.; Cetto, L. The MATLAB bioinformatics toolbox. In Encyclopedia of Genetics, Genomics, Proteomics and Bioinformatics; John Wiley & Sons, Ltd.: Hoboken, NJ, USA, 2005. [Google Scholar]
- Shin, Y.; Lee, S.; Tariq, S.; Lee, M.S.; Jung, O.; Chung, D.; Woo, S.S. ITAD. In Proceedings of the 29th ACM International Conference on Information and Knowledge Management, New York, NY, USA, 19 October 2020; ACM: New York, NY, USA, 2020. [Google Scholar]
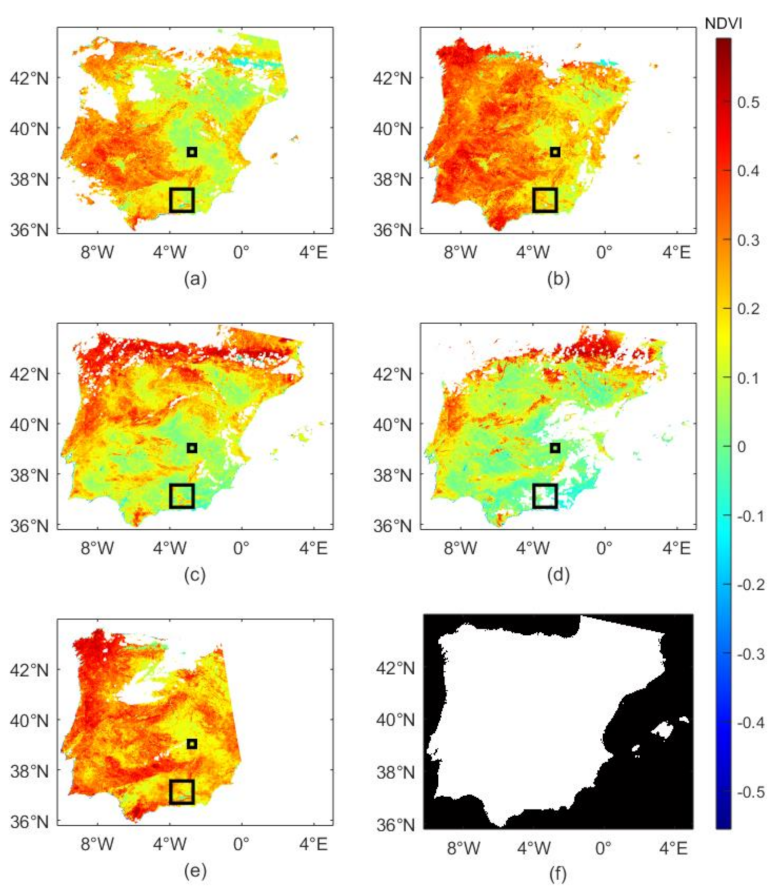
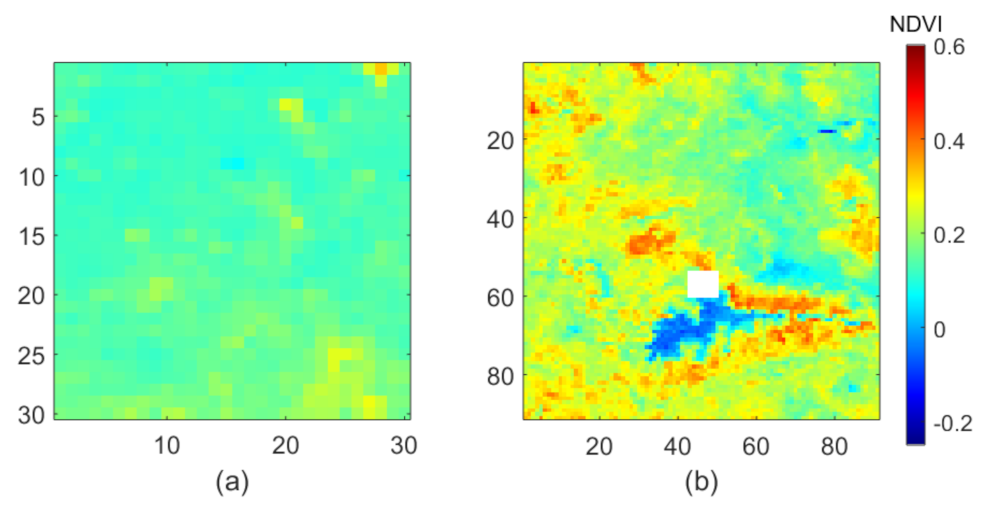
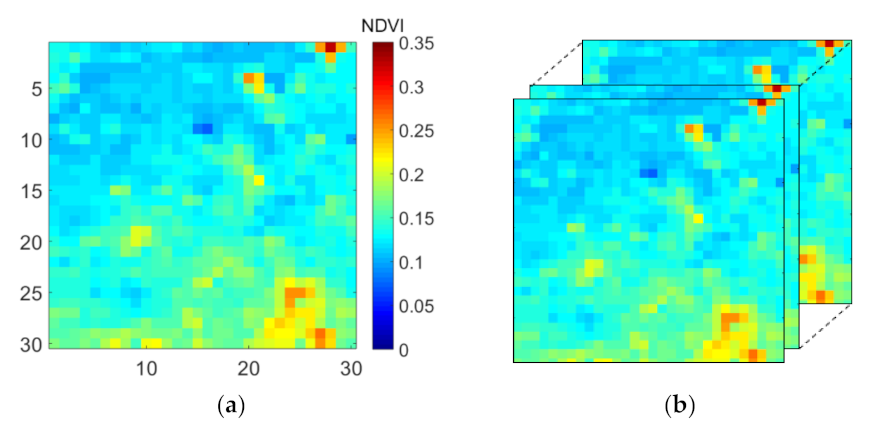
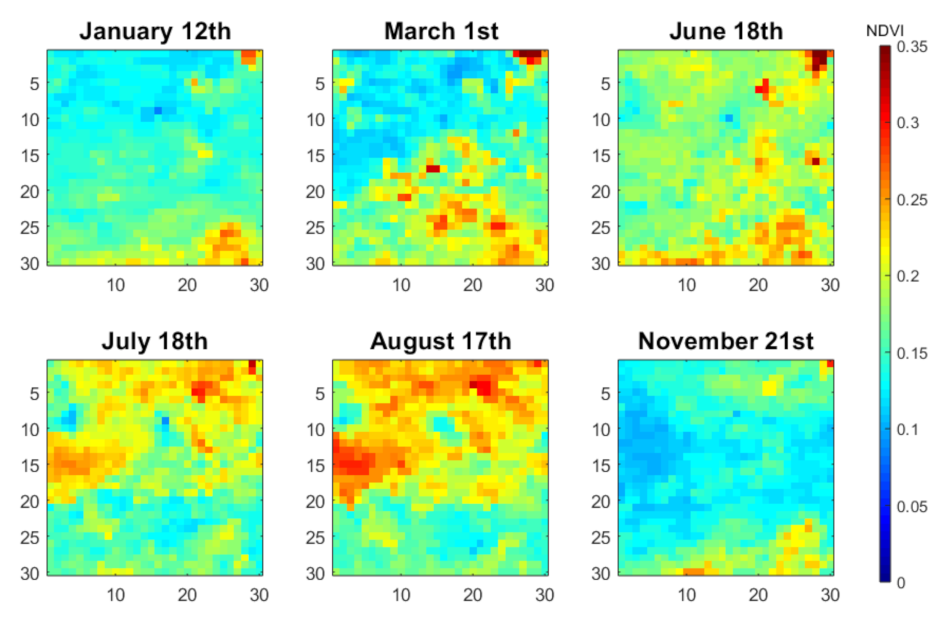
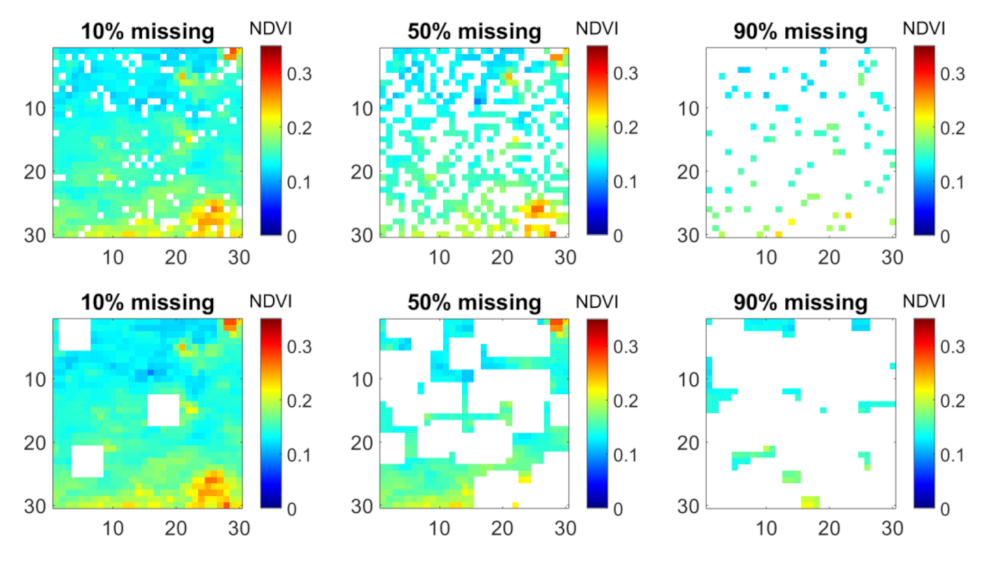
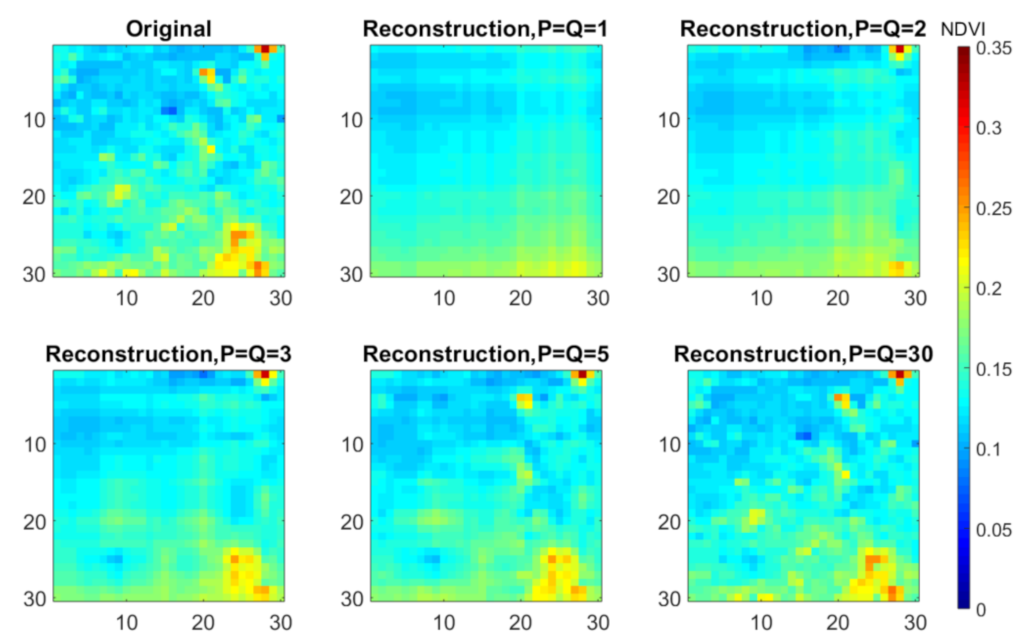
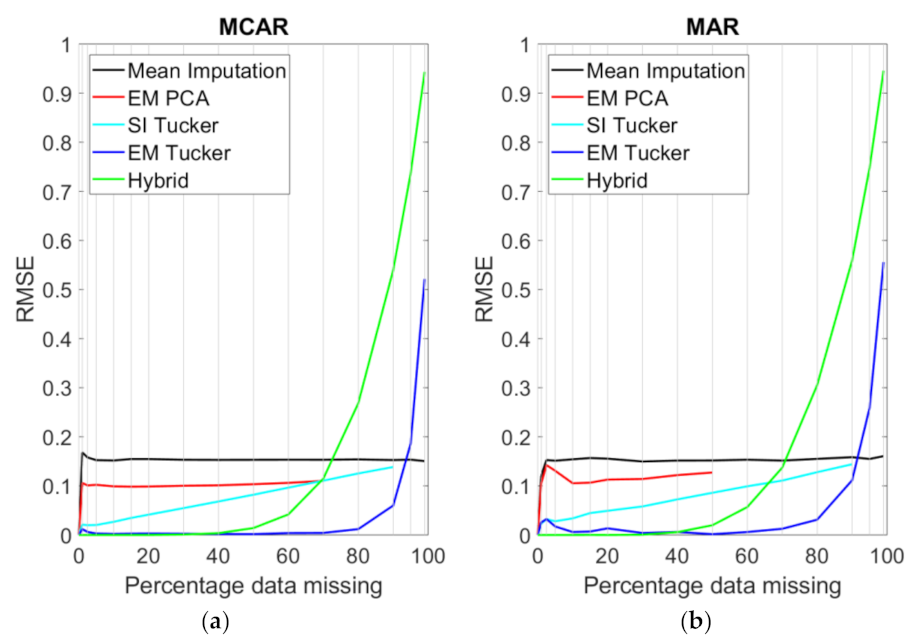
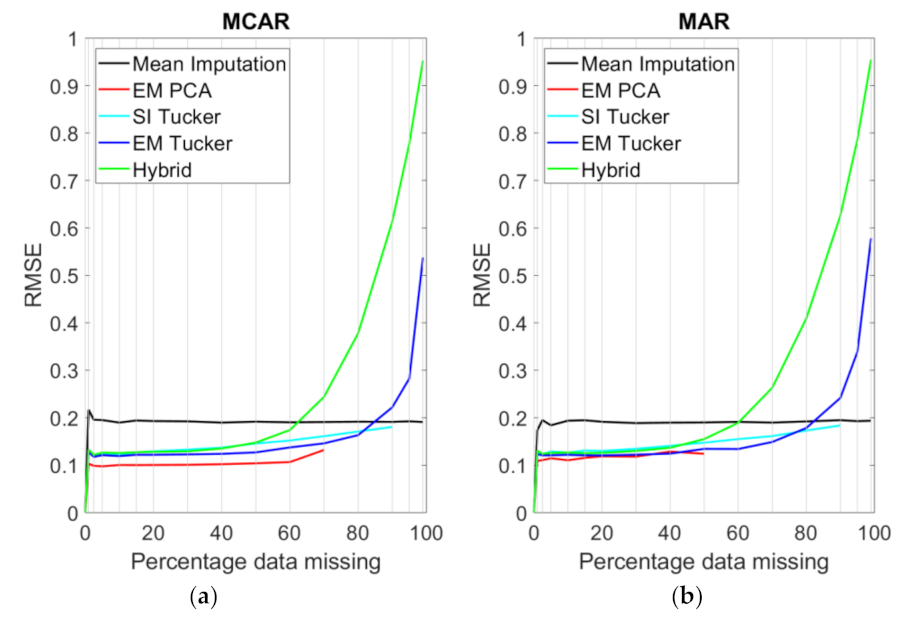

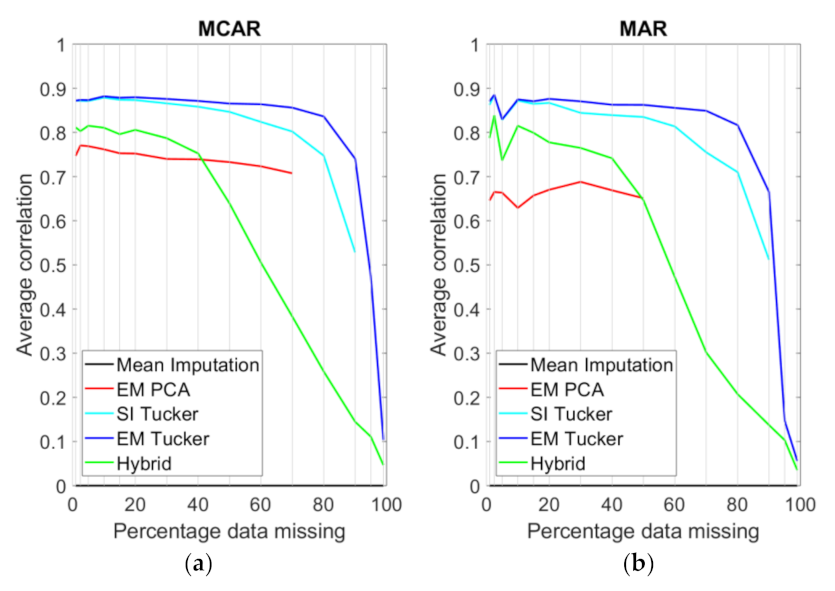
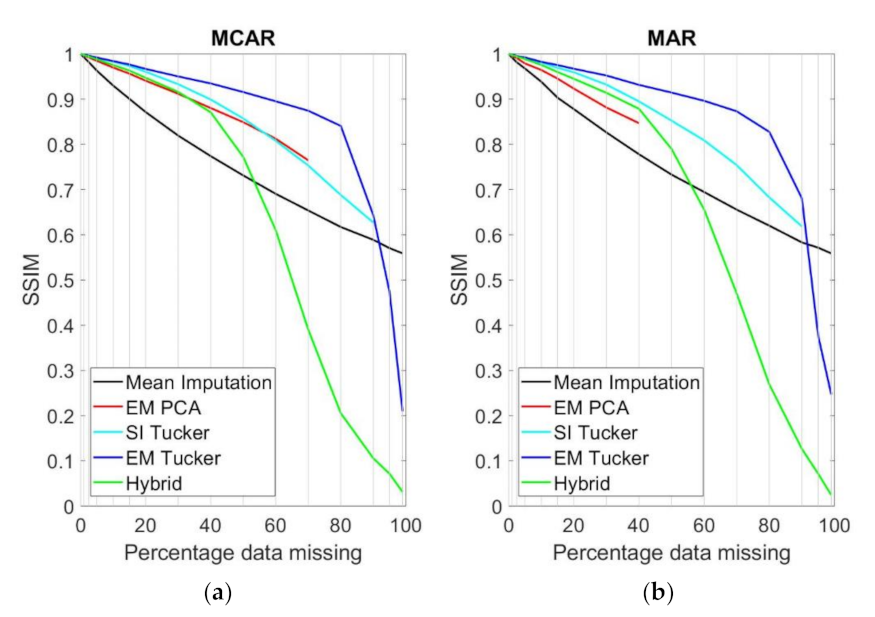
| Alias | Description | Dimension |
|---|---|---|
| SIM1 | Constructed by repeating a single time frame from study region 1 with no missing data. Missing data were added artificially. Used for model evaluation. | 30 × 30 × 30 |
| SIM2 | Constructed by adding noise to SIM1. Missing data were added artificially. Used for model evaluation. | 30 × 30 × 30 |
| SPAIN1 | All time frames from study region 1 with no missing data. Missing data were added artificially. Used for model evaluation. | 30 × 30 × 54 |
| SPAIN2 | Study region 2 with natural missing data. No ground truth data available. Used to demonstrate the performance of the models visually. | 90 × 90 × 66 |
| Alias | Description | Software |
|---|---|---|
| Single mean imputation | Tensor mean imputed for missing values | No external code used |
| Single imputation Tucker (SI Tucker) | Tensor mean was imputed for missing values prior to decomposition | “tucker” function, N-Way Toolbox, Matlab [54] |
| Hybrid method | Running-window temporal imputation. Remaining missing data then imputed with KNN | “knnimpute” function, Bioinformatics toolbox, Matlab [63] |
| EM PCA | Column mean was imputed prior to iterative PCA decomposition | “imputeEM” function, mvdlab package, R [55] |
| EM Tucker | A combination of row and column mean was imputed prior to iterative decomposition | “tucker” function, N-Way Toolbox, Matlab [54] |
| Method | Total Computation Time [s] |
|---|---|
| Simple mean imputation | 0.03 |
| Single imputation Tucker | 5.11 |
| Hybrid method | 1.26 |
| EM PCA | 6.06 |
| EM Tucker | 363.94 |
Publisher’s Note: MDPI stays neutral with regard to jurisdictional claims in published maps and institutional affiliations. |
© 2021 by the authors. Licensee MDPI, Basel, Switzerland. This article is an open access article distributed under the terms and conditions of the Creative Commons Attribution (CC BY) license (https://creativecommons.org/licenses/by/4.0/).
Share and Cite
Þórðarson, A.F.; Baum, A.; García, M.; Vicente-Serrano, S.M.; Stockmarr, A. Gap-Filling of NDVI Satellite Data Using Tucker Decomposition: Exploiting Spatio-Temporal Patterns. Remote Sens. 2021, 13, 4007. https://doi.org/10.3390/rs13194007
Þórðarson AF, Baum A, García M, Vicente-Serrano SM, Stockmarr A. Gap-Filling of NDVI Satellite Data Using Tucker Decomposition: Exploiting Spatio-Temporal Patterns. Remote Sensing. 2021; 13(19):4007. https://doi.org/10.3390/rs13194007
Chicago/Turabian StyleÞórðarson, Andri Freyr, Andreas Baum, Mónica García, Sergio M. Vicente-Serrano, and Anders Stockmarr. 2021. "Gap-Filling of NDVI Satellite Data Using Tucker Decomposition: Exploiting Spatio-Temporal Patterns" Remote Sensing 13, no. 19: 4007. https://doi.org/10.3390/rs13194007
APA StyleÞórðarson, A. F., Baum, A., García, M., Vicente-Serrano, S. M., & Stockmarr, A. (2021). Gap-Filling of NDVI Satellite Data Using Tucker Decomposition: Exploiting Spatio-Temporal Patterns. Remote Sensing, 13(19), 4007. https://doi.org/10.3390/rs13194007


