3.1. Use Case 1: Hyperspectral Image Segmentation Using Deep Earth
The training of the Deep Earth (using the ADAM optimizer [
32] with the categorical cross-entropy loss, and the learning rate of
,
, and
) finished if after 15 consecutive epochs, the accuracy over the validation set
(
of randomly picked training pixels) does not increase.
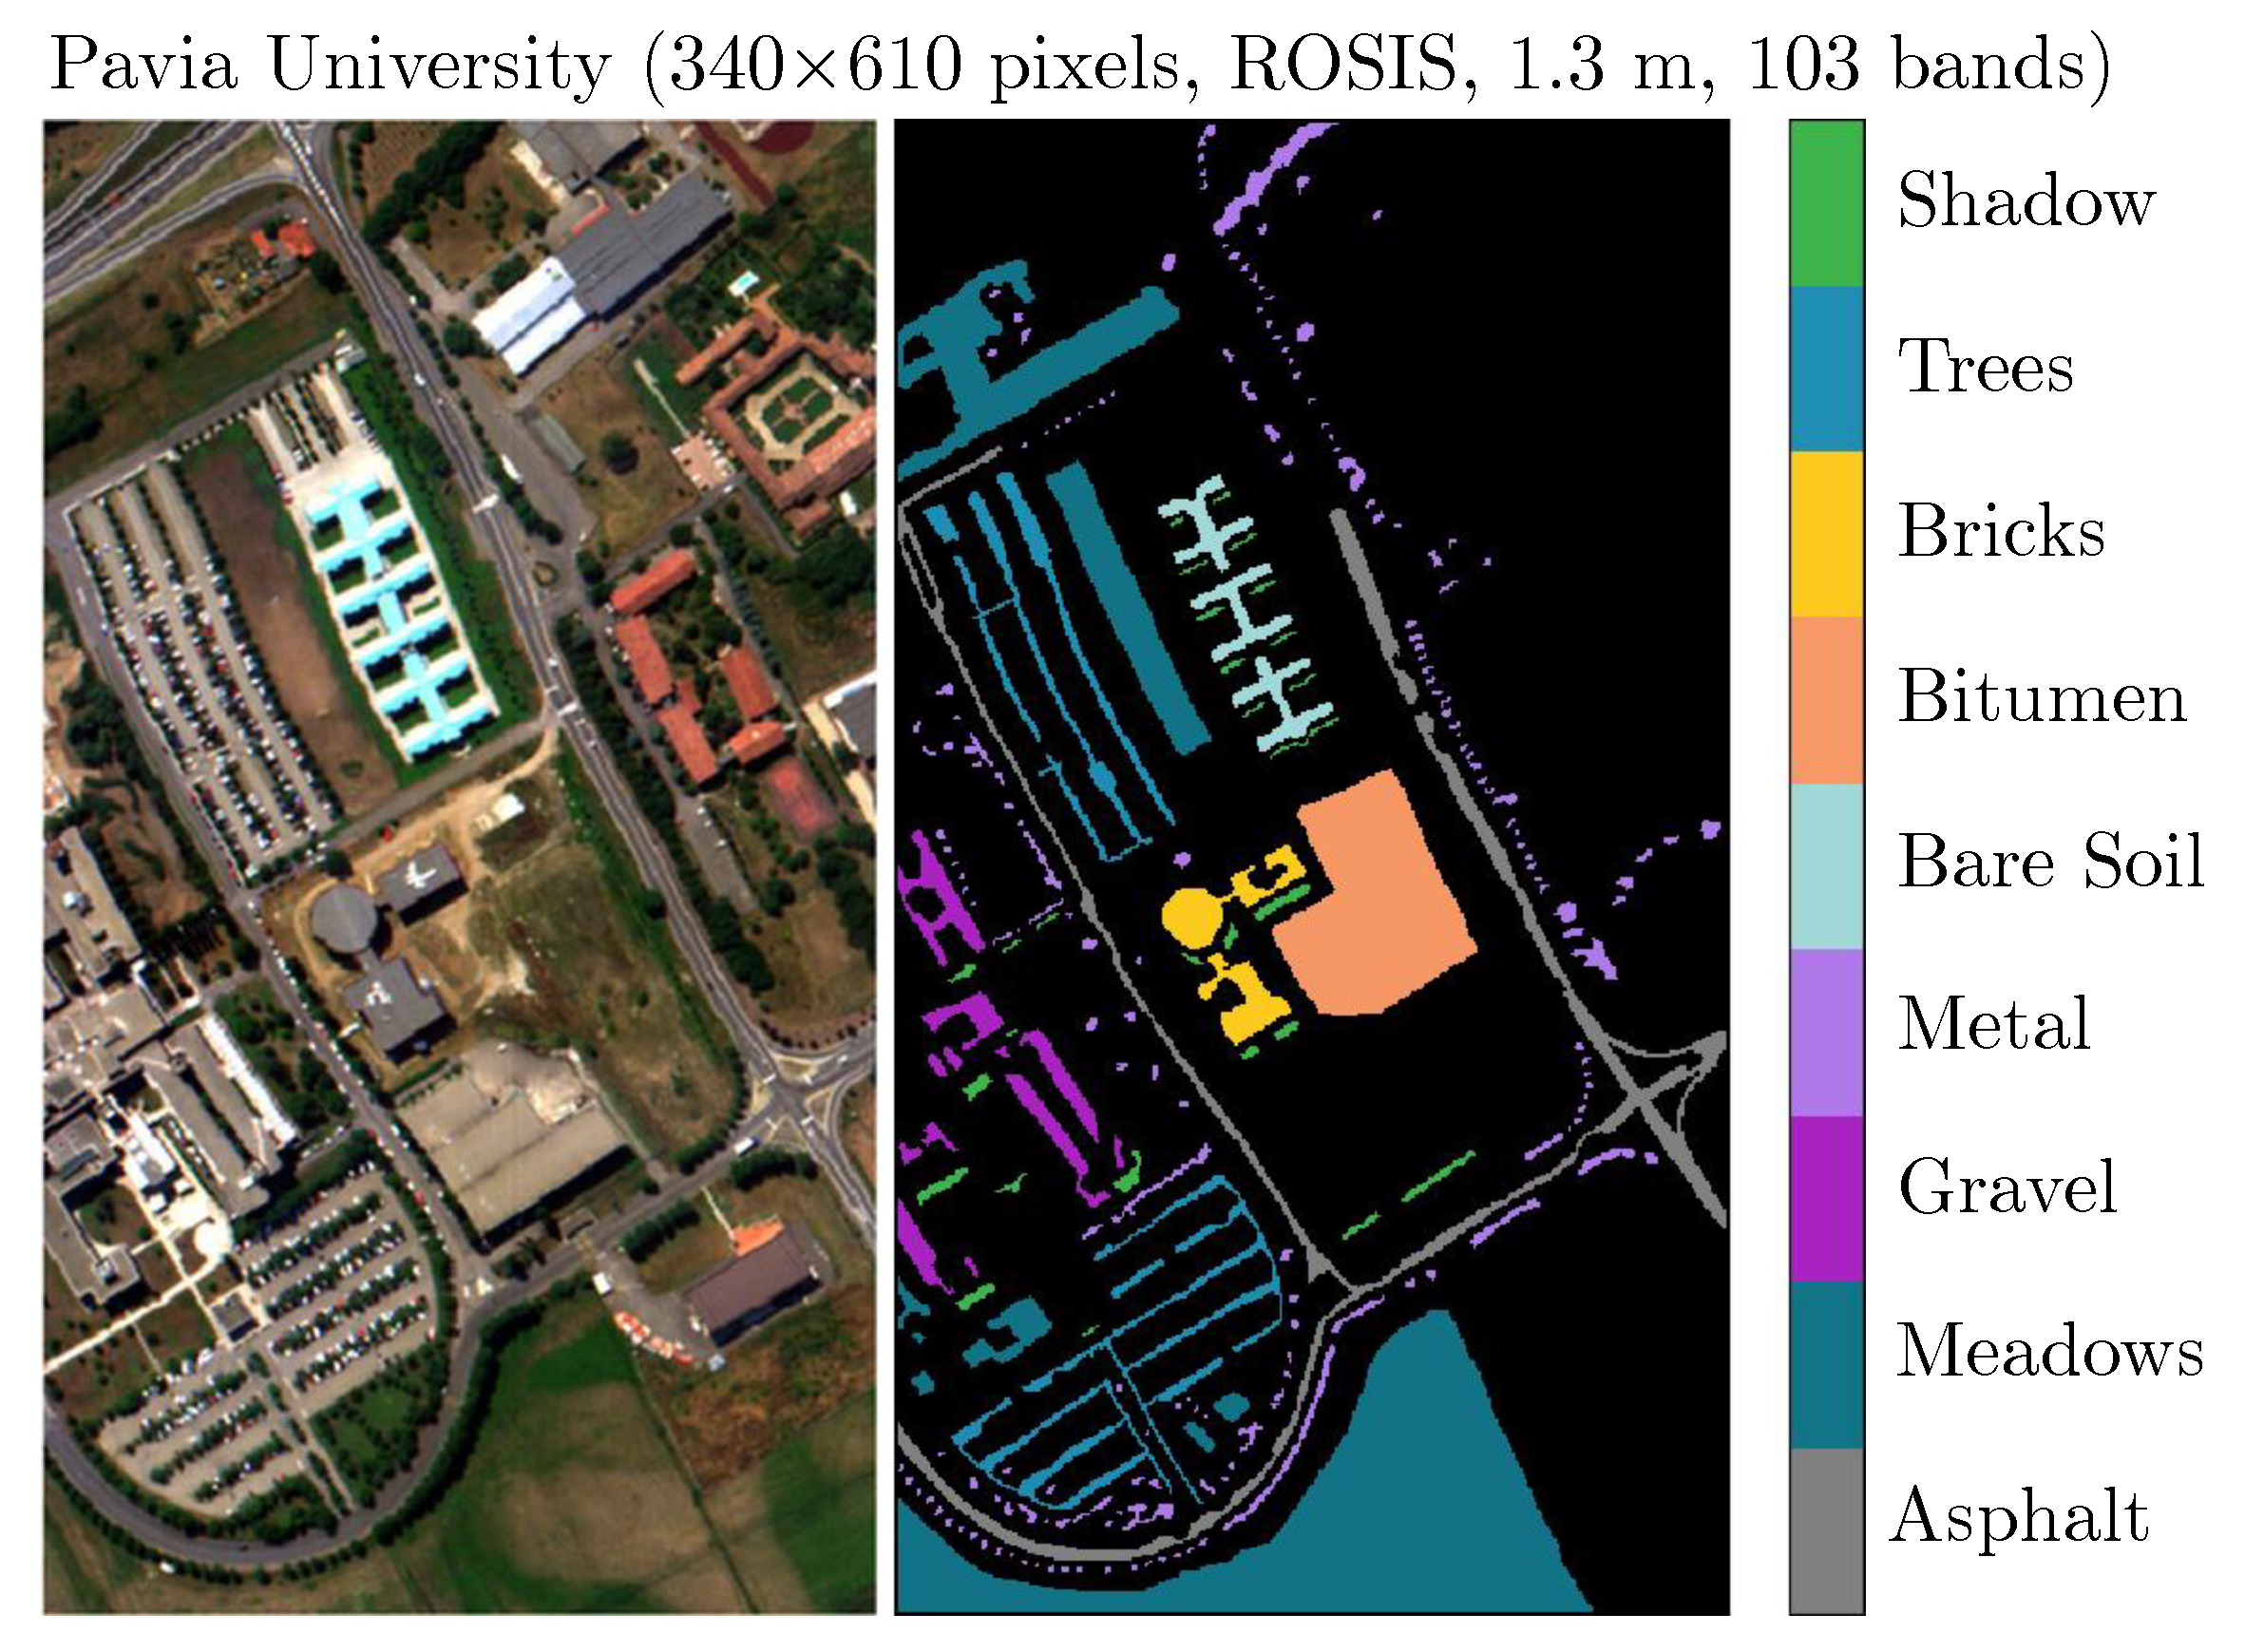
To quantify the performance of Deep Earth, the overall and balanced accuracy (OA and BA, respectively) for all classes, together with the values of the Cohen’s kappa
, where
and
are the observed and expected agreement (assigned vs. correct label) and
[
33], are reported. To train the model, a dataset consisting of 225 samples per class was incorporated. All metrics are obtained for the remaining (unseen) test data. Note that this approach can be used for quantifying the classification performance of spectral CNNs without the training-test information leak that would have happened for spectral-spatial models, which utilize the pixel’s neighborhood information during the classification [
22].
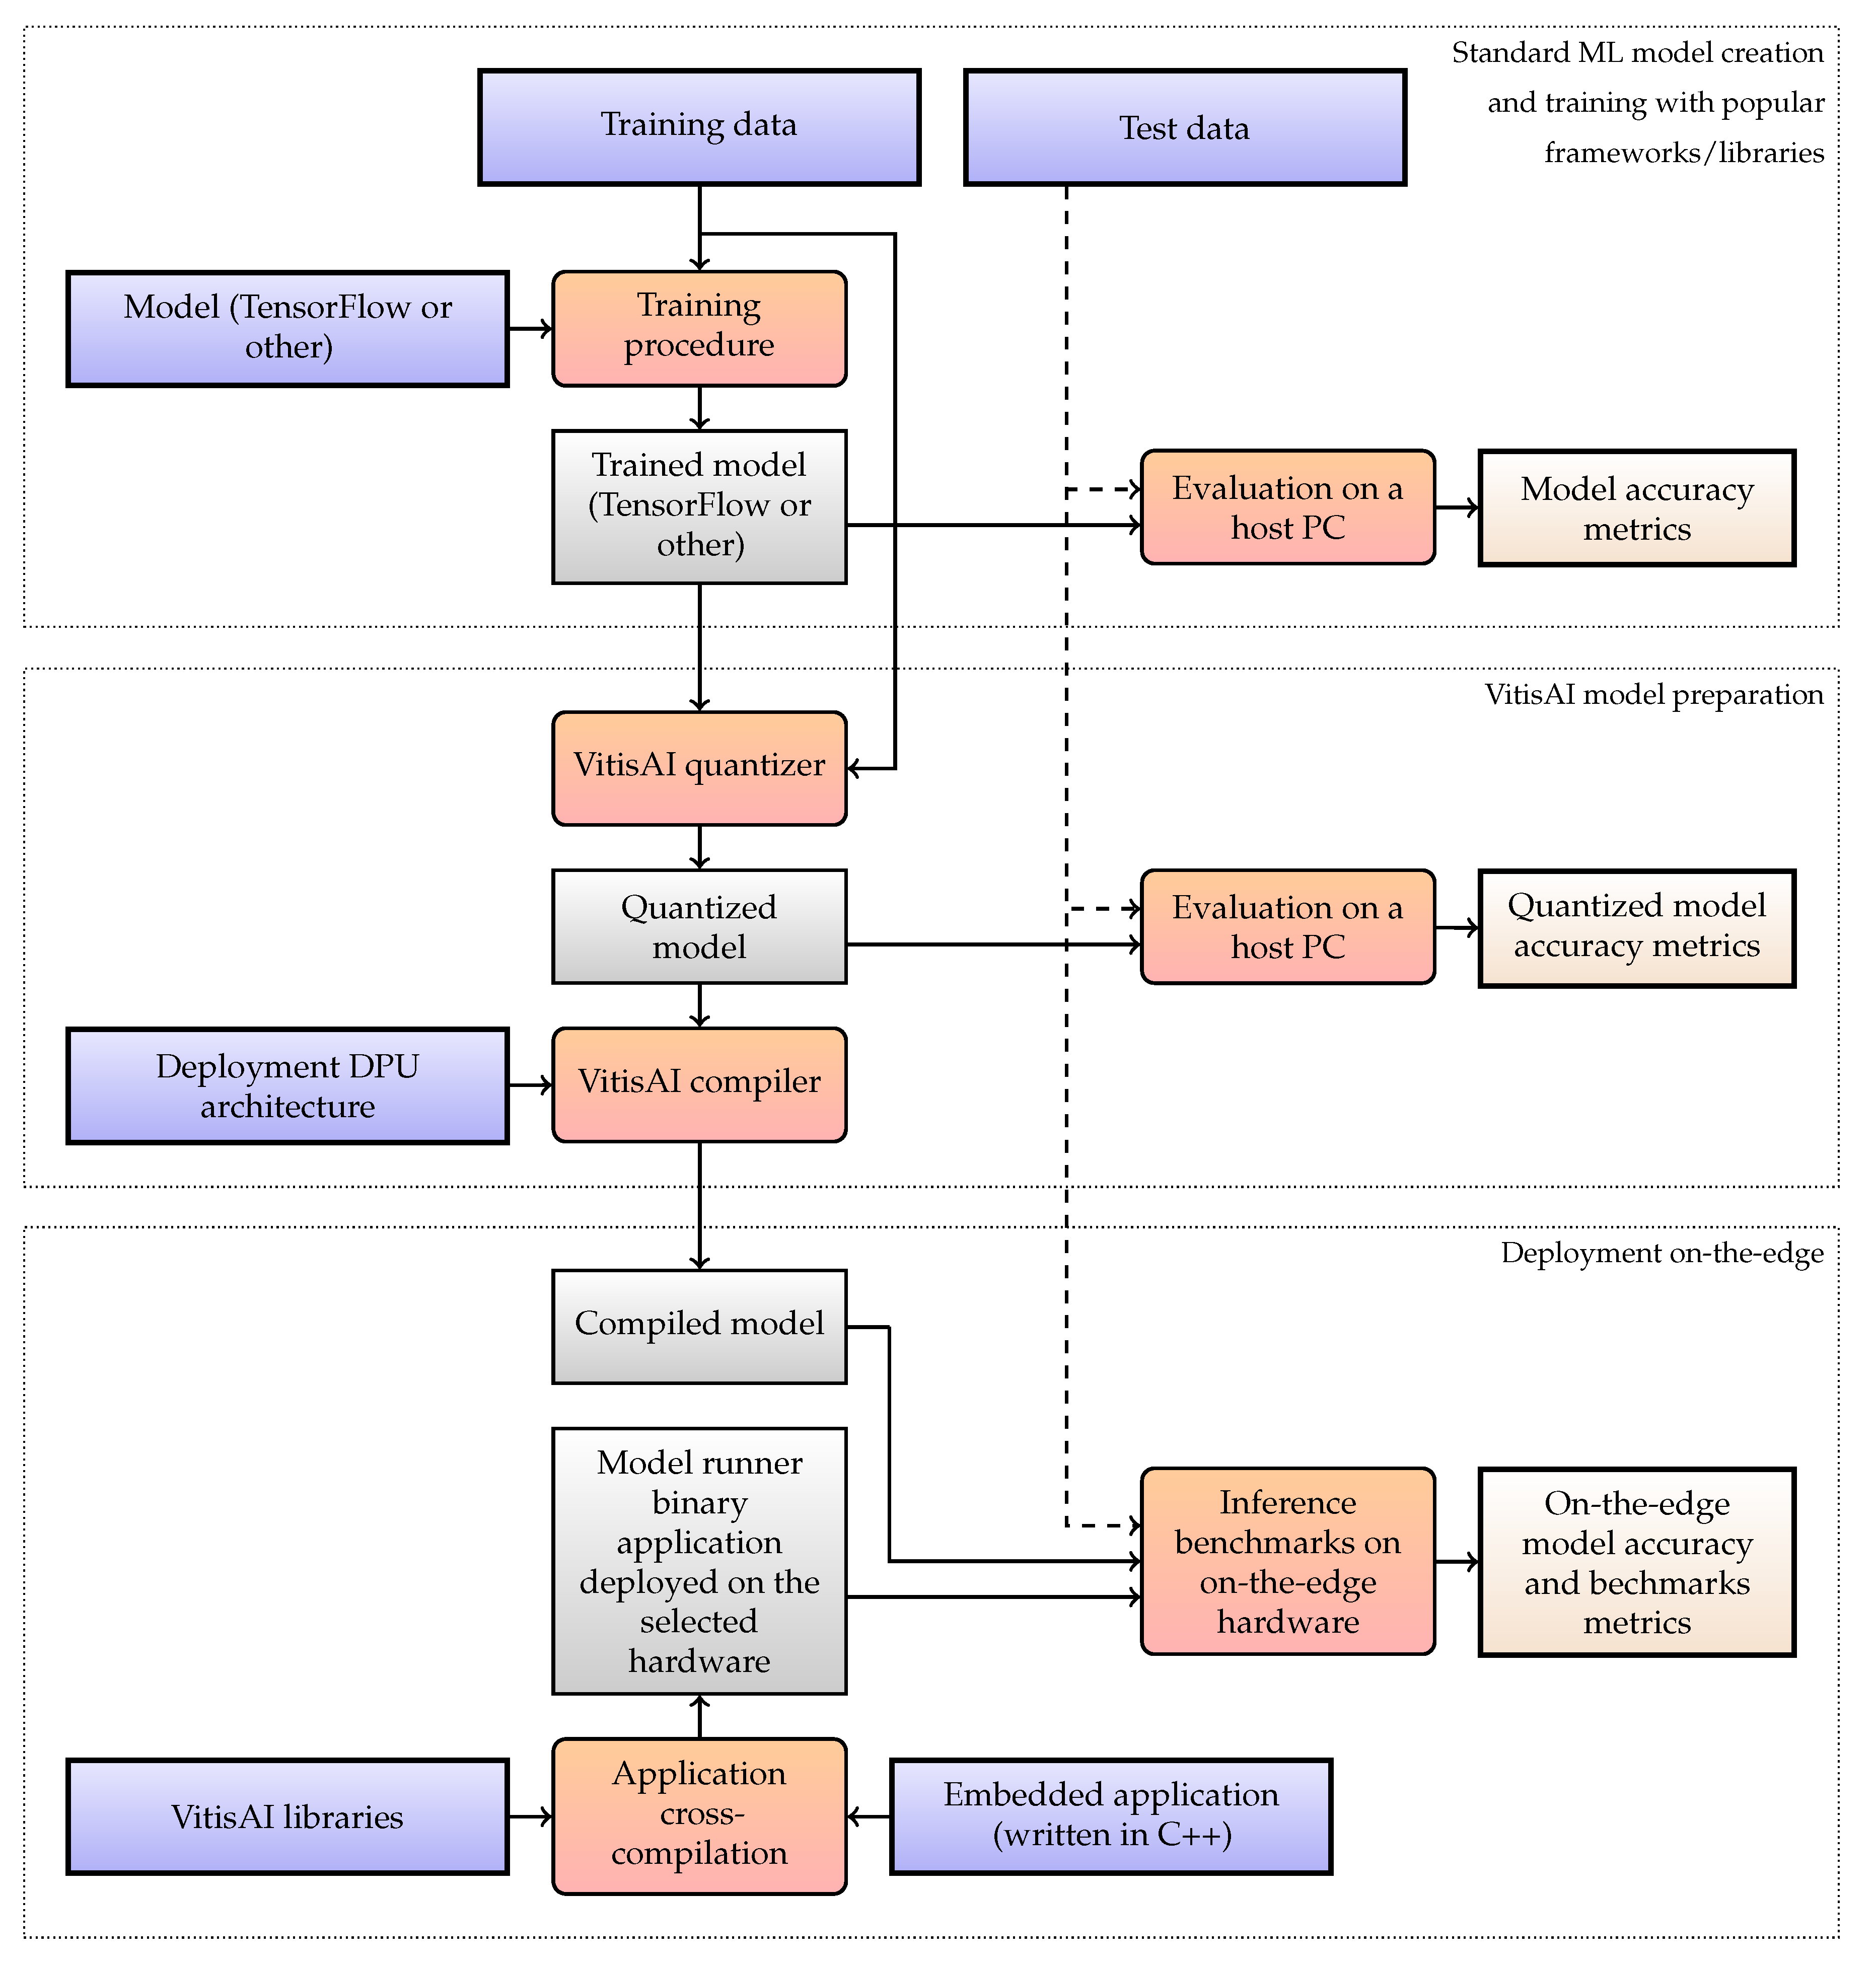
The initial approach consisted in exploiting 1-D convolutions within the spectral CNN. However, the current implementation of the Vitis AI TensorFlow 2 quantizer does not support any 1-D operations [
30]; hence, all such layers were expressed in terms of 2-D convolutions. The model was thus recreated to fit the framework requirements without any significant impact on its abilities. In
Table 6, the quality metrics captured for all versions of Deep Earth that were generated within the deployment pipeline (i.e., the original model trained and utilized in full precision, the model after quantization and compilation) are gathered. One can appreciate that all metrics are consistently very high without any significant performance deterioration across all versions of Deep Earth.
3.2. Use Case 2: Classification of Mars Images Using Deep Mars
Deep Mars was trained using 80% of the dataset (10% was held out for each validation and training sets). The data are available through the Jet Propulsion Laboratory webpage at
https://pds-imaging.jpl.nasa.gov/, accessed on 30 September 2021. It was trained using an ADAM optimizer (categorical cross entropy loss), with a learning rate of
and 32 samples per batch. The training was stopped after five epochs.
While deploying the original Deep Mars model (presented in
Table 3), we encountered a compilation error that the maximum kernel size of a 2-D convolution was exceeded. According to the documentation, the Vitis AI compiler tries to optimize the (Flatten → Dense) connection by expressing the underlying operation as a 2-D convolution. Such an optimization, being reasonable from the mathematical point of view (since any dense layer can be expressed in terms of convolutions losslessly), introduces heavy restrictions on the scale of the operands (specifically: the size of the input tensor). To succeed, the convolutional kernel of the new artificial layer needs to fit the whole incoming tensor at once. Only then can it efficiently convolve over the dense layer weights, each time producing a single number (which, indeed, is a dot product between flattened input and the weights vector). The current Xilinx implementation does not allow disabling this behavior, yet the authors claim to remove the limitation of the kernel size in future releases.
For this experiment, the dimensionality of the tensor coming into the flattened layer was reduced, so two more sets of (convolution+pooling) layers were added before the flattened one (they are boldfaced on the architecture scheme, see
Table 3). The weights of the initial layers were preserved, needing to retrain only the newly added (or modified) ones. Having the same training setup as for the original layer (except utilizing 9 epochs instead of 5), the accuracy was improved by about 5%. As a side effect, the number of trainable parameters of the model shrank by over 93%. The model could be compiled without any disruptions afterward. Although there is a visible drop in BA for the compiled Deep Mars model that is ready to be deployed on the edge device (
Table 7), other classification metrics reveal that the deployed model still offers high-quality performance.
3.3. Use Case 3: Detection of Craters on Moon Using Deep Moon
The Deep Moon model was trained with the subset of 30,000 training images, whereas the validation and test sets contained 5000 images each. The training process utilized the Adam optimizer (with the binary cross-entropy acting as the loss function), four epochs (with no early stopping), a learning rate of 0.0001, 0.15 dropout probability, and a batch size of 32 images.
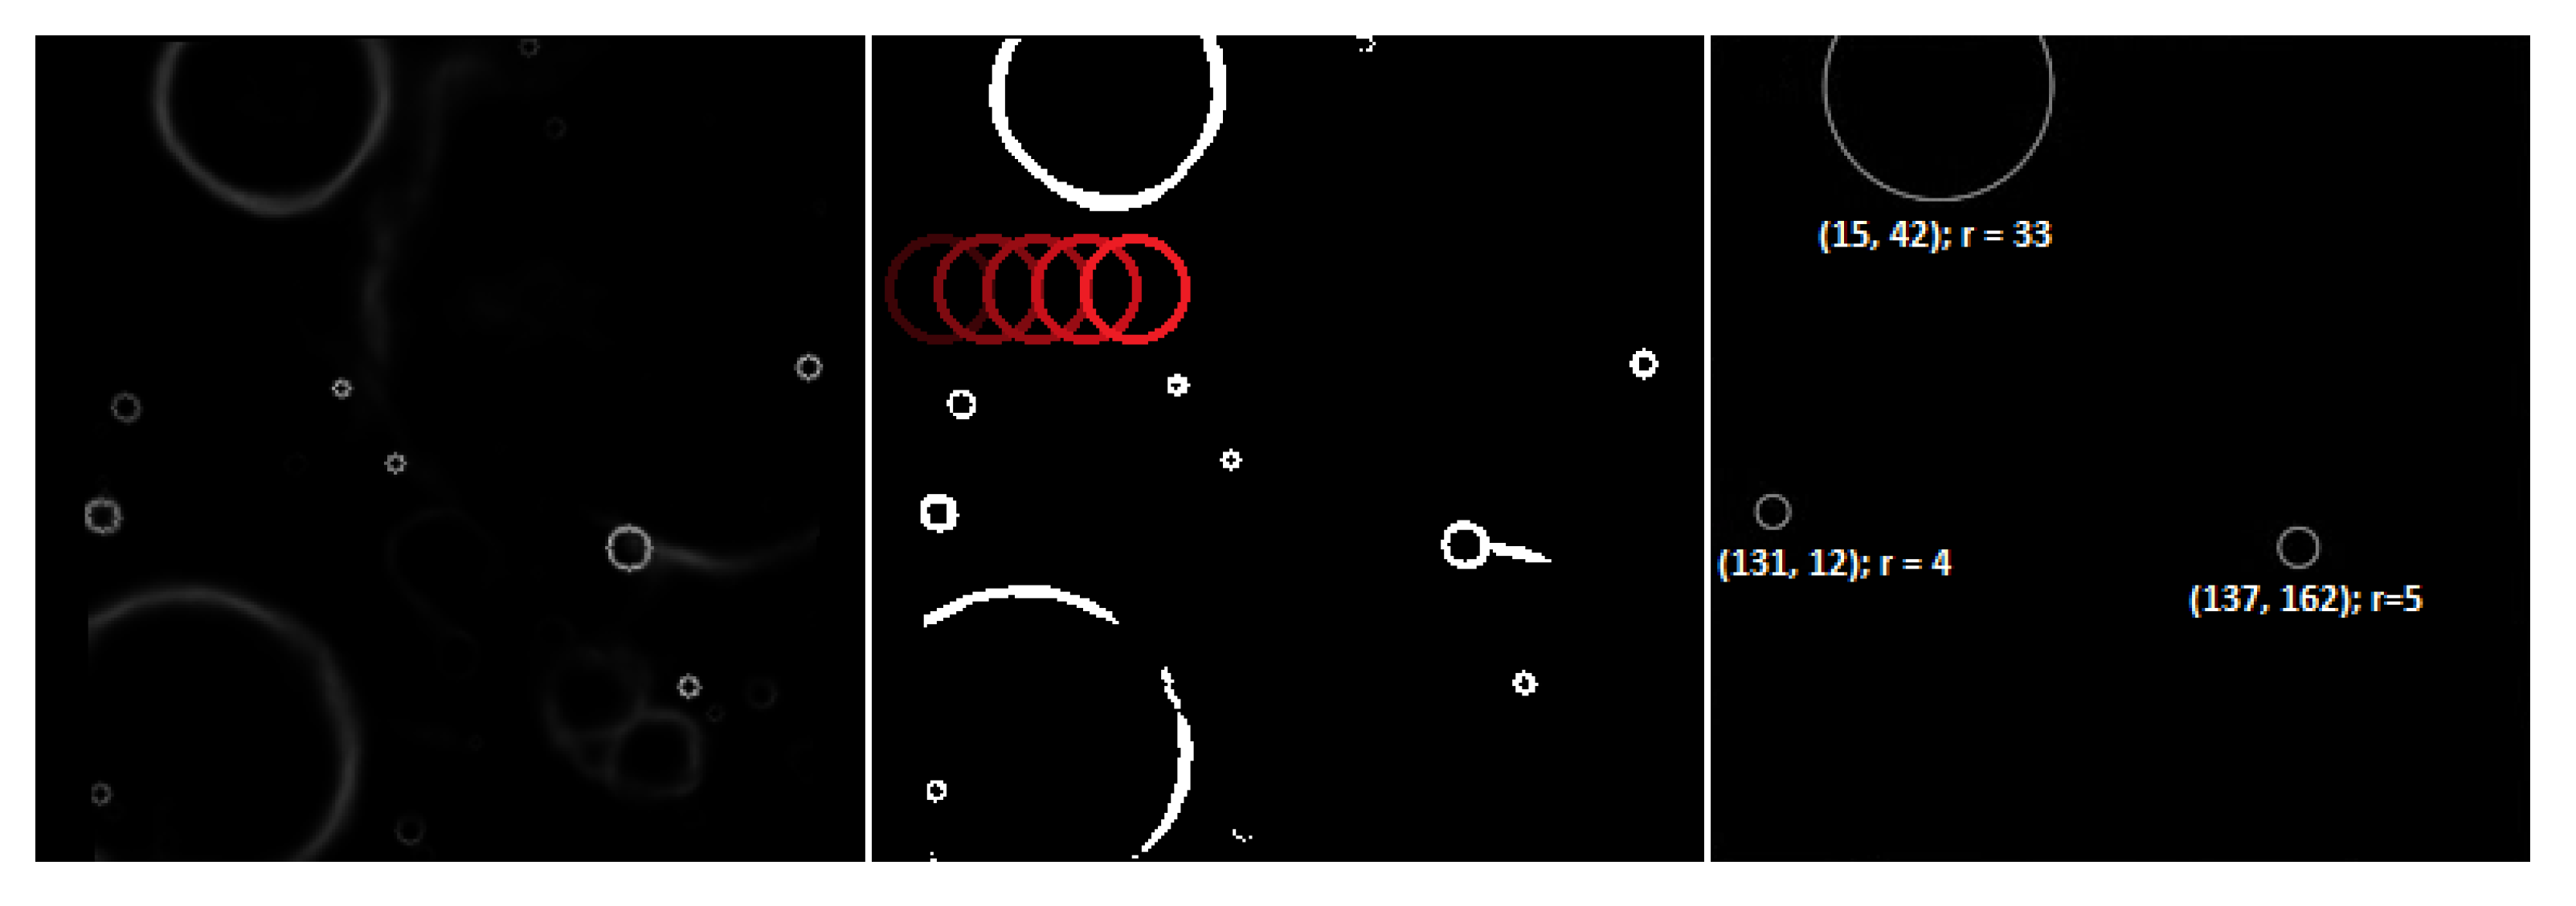
The output of the CNN model is a mask of candidate craters’ edge locations. To create a list of detected craters with their spatial parameters (such as radius and coordinates), the mask needs to be quantized to 0–1 values at a given threshold and then processed by the template matching-based algorithm. The algorithm involves sliding rings of radii
through the image in an iterative manner, seeking the areas for which the correlation with the ring is the highest. If the score exceeds a threshold (being a hyper-parameter of the algorithm that could be fine-tuned over the validation images), a crater of radius
r in that location is registered. In case the neighboring pixels are also highly correlated, the dominant one is selected, whereas others are rejected in order to prevent registering multiple detections that all refer to the same crater. The process is depicted in
Figure 5.
The very two-stage nature of the system (i.e., detection of crater candidates using a deep model, and then pruning false positives through template matching) compels the two-stage evaluation approach. Firstly, the quality of the segmentation masks generated by the CNN model using binary cross-entropy between the predicted and ground truth images is evaluated. It fulfills the role of being a loss function during training but does not provide much insight into the quantitative assessment of the spotted craters. For this purpose, the whole system after the template matching step using the Average Precision (AP) metric is evaluated.
Since the Deep Moon detection system differs from the traditional bounding-box-oriented approaches, the following way of calculating the metric in the Deep Moon case is utilized:
Gather all predictions (correct and incorrect) over the whole test dataset and sort them according to their confidence level in descending order. The confidence of the detection is its correlation registered during the template matching. Note that only detections that have surpassed the template matching threshold and were dominant in their neighborhood are considered.
Count the number of all (n) and correct (c) detections.
Iteratively, for : calculate the current recall as: and the current precision as: . Note that the recall will slowly increase from 0 to 1 as correct detections increase.
Plot the precision-recall plot and calculate the area under the curve (AUC). Opposite to recall, precision will act “chaotically” at first, (e.g., when the sequence of detections starts with a correct detection followed by an incorrect one), but the impact on AUC of such peaks is negligible.
To make the assessment exhaustive, the basic statistics, such as global recall (
), global precision (
), global F1-score (
), and loss (binary cross entropy), are also attached. These, however, should be treated secondarily in the case of the object detection task. In
Table 8, the metrics obtained for all versions of the Deep Moon model are gathered. As in the previous algorithms, the deployment process does not adversely affect the abilities of the technique. These experiments show that quantizing and compiling the model for the target edge device allow us to maintain high-quality operational capabilities of the algorithms in a variety of computer vision tasks.
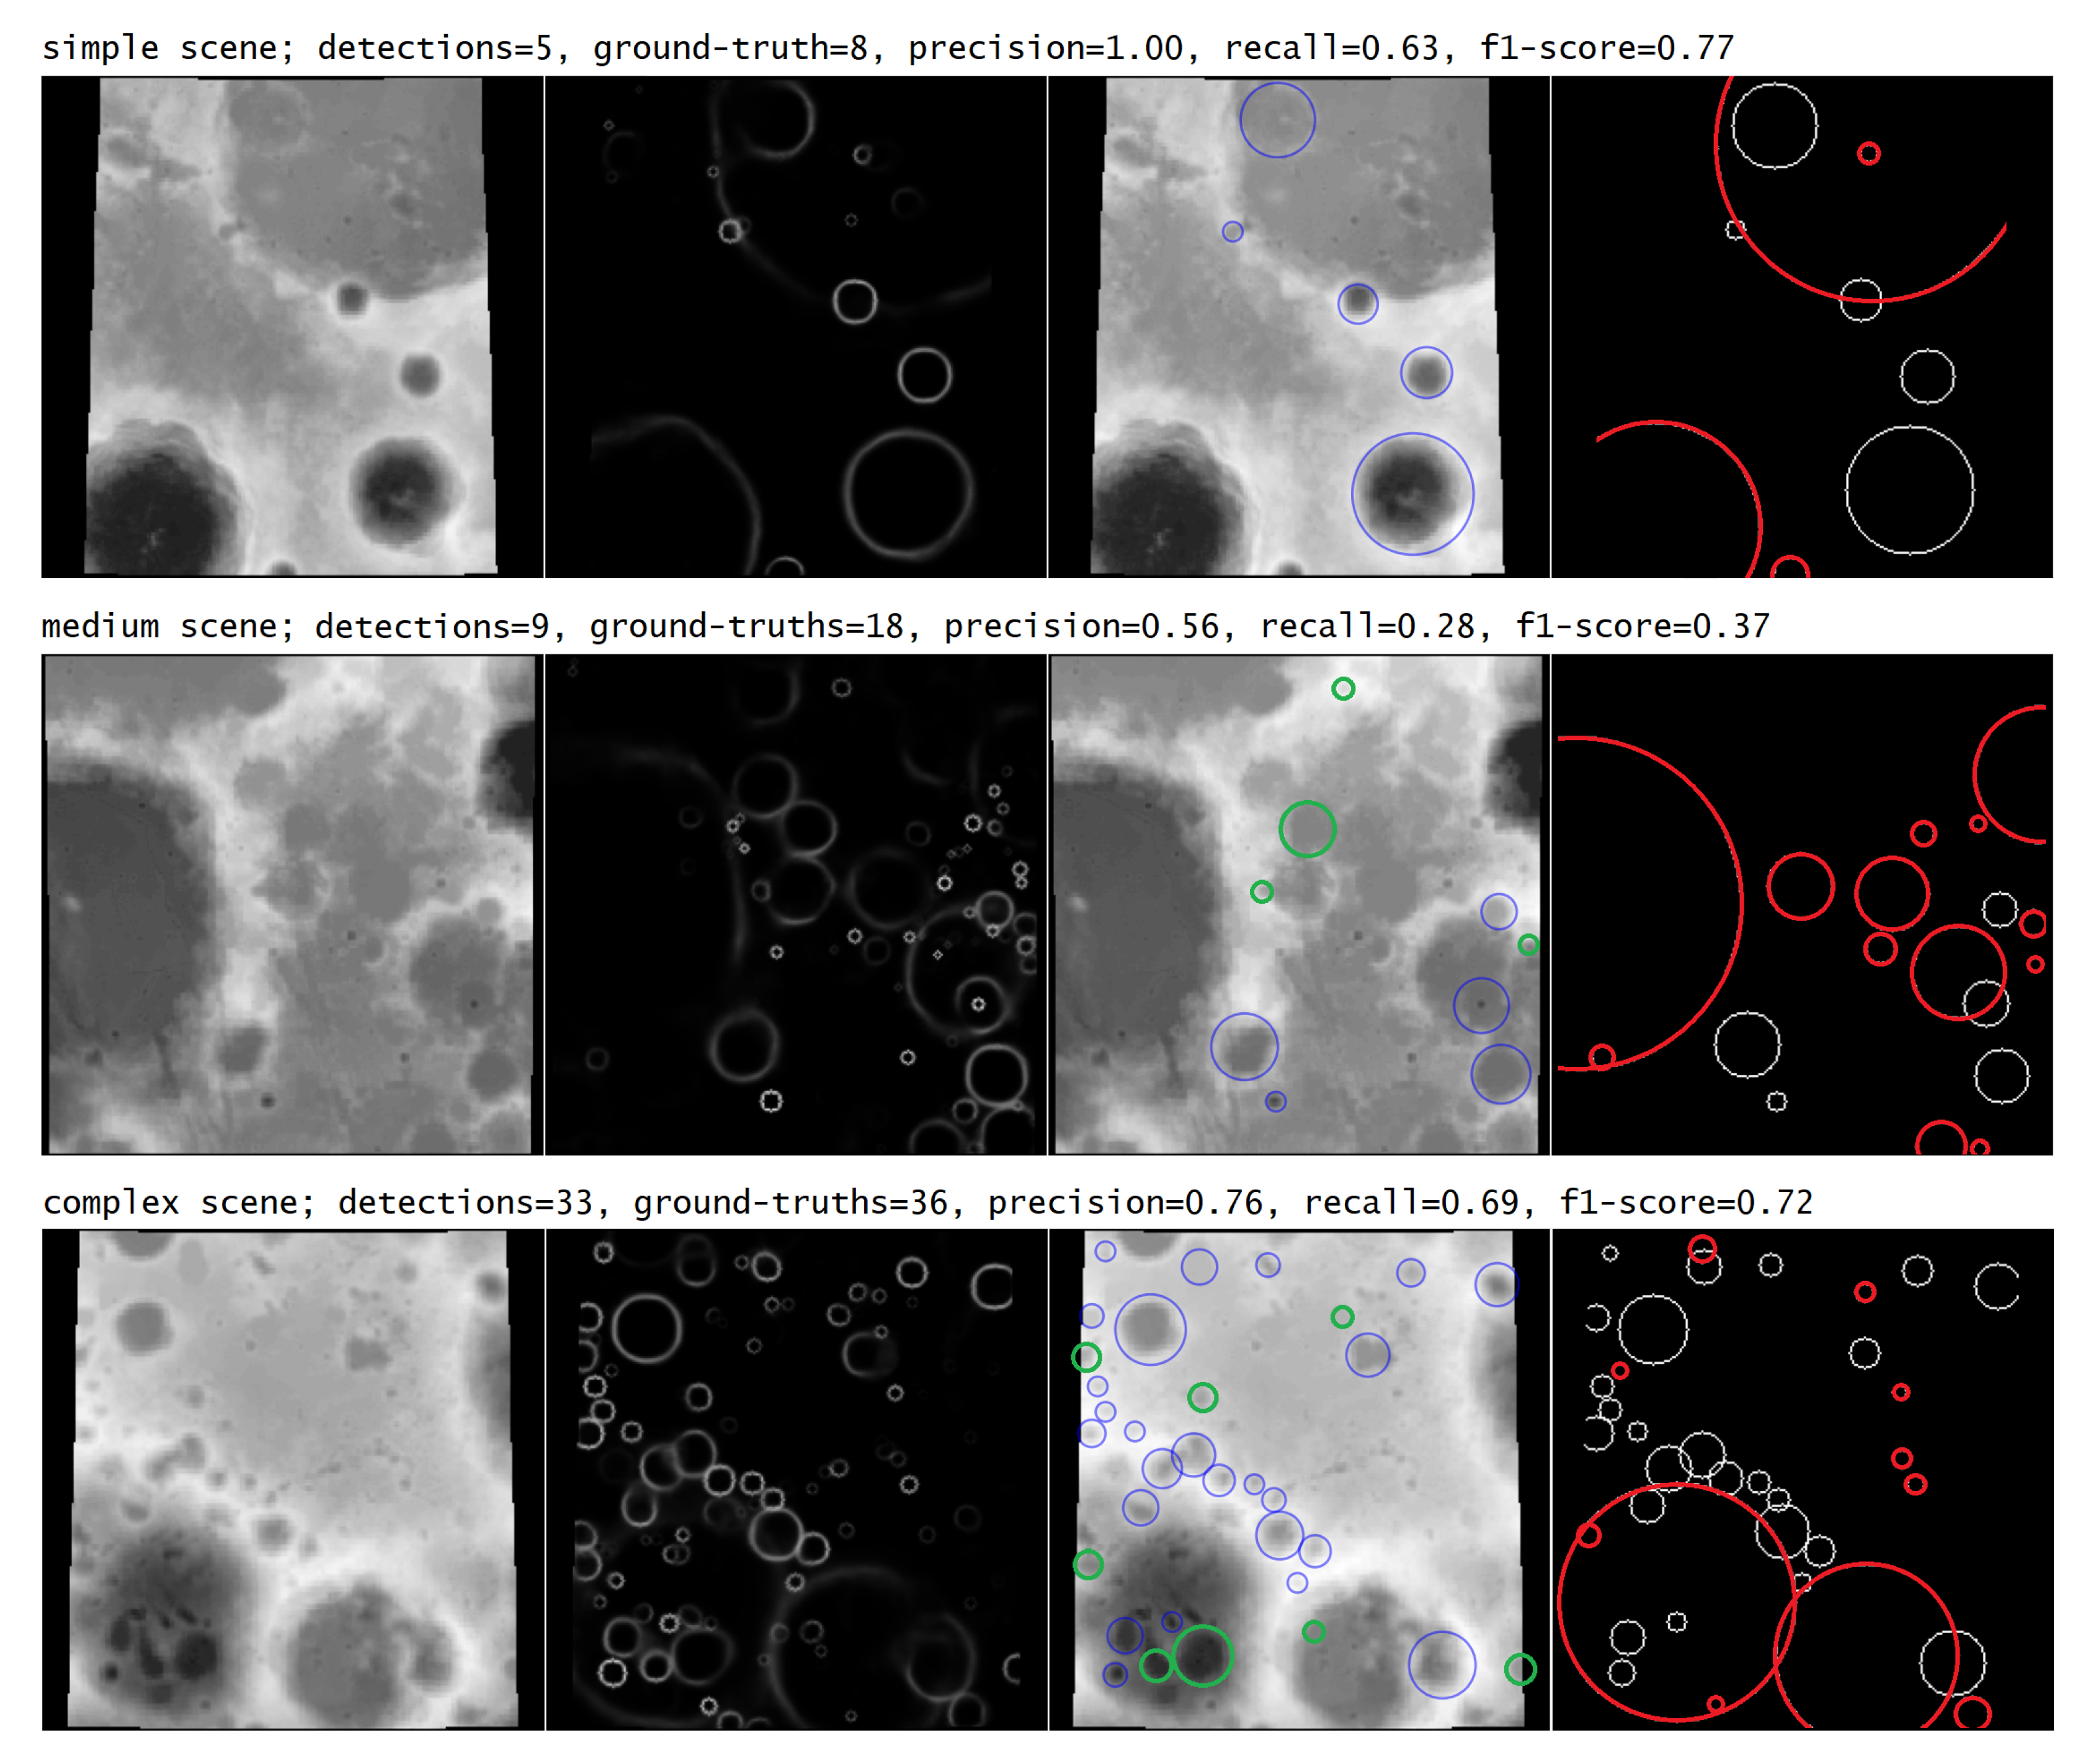
In
Figure 6, the examples of selected scenes (of varying complexity), together with the corresponding detections elaborated using the original deep model, are rendered (the false positives are annotated in green, whereas false negatives are in red; additionally, the corresponding quality metrics are presented). Note that the number of craters in the input images can significantly vary. However, the algorithm’s performance does not seem to be impaired by numerous detections in a single frame. Such qualitative analysis can help better understand the capabilities of the algorithms in image analysis tasks and should be an important part of any experimental study [
34].
3.4. Benchmarking Hardware Architectures for On-Board Processing
As stated in
Section 2.3, the MLPerf-inspired benchmarks (with different scenarios) are performed for models deployed on the edge hardware (
Section 2.2)—note that the device can be configured in different ways, as discussed later in this section. However, running the benchmarks on an on-the-edge device imposes additional memory constraints, as the memory capacities are much smaller than those of standard workstations. For this reason, the test sets have to be limited in size in order to fit in RAM (this is especially important for the Offline mode, where the entire dataset has to be loaded into a continuous memory region). Since the Deep Mars test set contains only 382 samples, it is copied three times in order to extend the benchmarking time. Overall, the test sets included 40,526 samples for Deep Earth, 1146 samples for Deep Mars, and 500 for Deep Moon. Even though these numbers are much smaller than recommended by MLPerf, they are specific to the hardware constraints. Finally, the idle power consumption of Leopard is slightly over 12 W without any energy-saving optimizations. The Multi-Stream scenario is parameterized by the time interval value
T. MLPerf suggests this parameter to be 50 ms, which was used for Deep Mars and Deep Moon. However, Deep Earth, which is a fairly small CNN, can reach a very high number of streams processed in 50 ms. Hence, the interval value of 5 ms for Deep Earth was used to keep the benchmark execution time reasonable.
Given the available hardware resources, a subset of possible DPU configurations for the benchmarks was selected. It includes the most parallelized versions of the simplest B512 architecture—4 × B512 (with 4 CPU threads) and 6 × B512 (with 6 CPU threads). For the intermediate architecture B1024, the 2 × B1024 (with 2 and 4 CPU threads), 4 × B1024 (with 4 CPU threads), and 6 × B1024 (with 6 CPU threads) configurations are used. The most powerful B4096 DPU setup is utilized in 1 × B4096 (1, 2, and 4 CPU threads), 2 × B4096 (2 and 4 CPU threads), and 3 × B4096 (3 and 6 CPU threads) parallelization variants. The 6 × B512, 6 × B1024, and 3 × B4096 architectures are the most complex configurations that can be synthesized on the Leopard DPU.
One can appreciate the fact that using more advanced DPU architectures results in larger throughput values in the Offline mode. For example, see 6 × B1024 vs. 6 × B512 (both with 6 CPU threads) for Deep Mars—it results in 46% better throughput per second (
Table 9 and
Table 10). This is universal to all models; however, the increase may vary between the models and DPUs. Here, when comparing 4 × B1024 and 4 × B512, one can observe the 16% improvement for Deep Earth, 51% for Deep Mars, and 92% for Deep Moon (all with 4 CPU threads;
Table 9 and
Table 10). It indicates that larger models benefit more from the complex hardware architectures. Additionally, exploiting the DPUs with more inference cores also improves the throughput. One can notice that utilizing 4 × B1024 instead of 2 × B1024 improves the metric by 70% for Deep Mars (both configurations with 4 CPU threads;
Table 10). An increase in the number of cores may lead to a nearly directly proportional increase in performance. For example, 3 × B4096 (3 CPU threads) vs. 2 × B4096 (2 CPU threads) vs. 1 × B4096 (1 CPU thread) leads to gains of 187% and 99% of throughput for Deep Moon (
Table 11).
Increasing the number of CPU threads often leads to an improvement in throughput. For the 2 × B4096 architecture, changing the number of threads from 2 to 4 increases the throughput by 21% for Deep Earth, by 39% for Deep Mars, and 9% for Deep Moon (
Table 11). However, using too many CPU threads in regard to the available DPU cores can lead to worse throughput, as many CPU threads can compete for DPU access at the same time and various problems, such as starvation may occur. For example, for the 1 × B4096 architecture, using 4 threads instead of 2 leads to slight decrease in throughput for all models (
Table 11). The best throughput for Deep Earth was obtained for the 6 × B1024 architecture with 6 CPU threads (
Table 10). In the case of Deep Mars and Deep Moon, the best Offline results were achieved with 3 × B4096 (6 CPU threads for Deep Mars and 3 for Deep Moon) architecture (
Table 11). Deep Moon, being the most complex network, demands a lot of memory to establish connections with the DPU. For the configurations with the largest number of threads, there was not enough space to allocate memory for the DPU connections. This problem was marked as OOM (
out-of-memory) in the tables.
The Single-Stream metrics also benefit from more advanced architectures.
Table 12,
Table 13 and
Table 14 show that the more complex architectures lead to smaller values of latency. Since this mode processes sample by sample (one at a time), it does not benefit from parallelization. Thus, increasing the number of DPU cores and CPU threads does not improve latency. Using more CPU cores leads to a slight increase in the Single-Stream metrics, as the number of parallel threads increases while they are of no use. The best Single-Stream results for all networks were achieved by the single threaded configuration of the most complex 4 × B4096 architecture (with a single CPU thread;
Table 14).
The Multi-Stream scenario metrics scale similarly to the Offline ones. Utilizing better DPU architectures, more DPU cores, and CPU threads increases the number of streams. Going from the 1 × B1024 (1 CPU thread) to 2 × B1024 (2 CPU threads) architecture yields a doubled stream number for Deep Mars and 72% increase for Deep Earth (
Table 16). The slight decrease in the metrics for 1 × B4096 with four CPU threads is visible (
Table 17). The best Multi-Stream score for Deep Earth was achieved with 6 × B1024 and 6 CPU threads configuration (
Table 16). For Deep Mars, the largest stream number was obtained for the 3 × B4096 architecture with 6 CPU threads (
Table 17). One can observe that Deep Moon is not able to deliver real-time operation with the given time interval of 50 ms. Interestingly, the number of streams for 6 × B512 and 3 × B4096 (both with 6 CPU threads) was the same (
Table 15 and
Table 17). When comparing these two results in the Offline mode, 6 × B512 achieves slightly better throughput (
Table 9 and
Table 11). Both of these are the configurations with the largest number of cores for the selected DPU architectures. However, 6 × B512 uses 16% less power in peak while performing better than 3 × B4096 (
Table 18 and
Table 20). With smaller network architectures, it may be more beneficial to use simpler DPU cores than fewer intricate ones (when parallel processing is considered).
The power consumption raises with the number of DPU cores and DPU architecture complexity. More advanced models are also more power demanding—while the peak power for Deep Earth with 6 × B1024 (6 CPU threads) and 3 × 4096 (6 CPU threads) is nearly the same, it raises over 27% for Deep Mars (
Table 19 and
Table 20). The peak power consumption for all models was highest when using the most intricate 3 × B4096 DPU architecture (
Table 20). Additionally, measuring the operations per second on the DPU was done using Xilinx tools—the maximum performance was achieved for Deep Moon with 3 × b3096 architecture and 3 CPU threads. The DPU peaked at 1.094182 TOP/s (tera-operations per second) per core (over 3 TOP/s total).
The benchmarks indicated that Deep Moon is not able to operate in real-time within a 50 ms time interval. However, the U-Net architecture was not designed with real-time operations in mind. Usually, real-time computer vision systems utilize specific network architectures optimized for fast inference, such as YOLO [
35], Fast R-CNN [
36], and RetinaNet [
37]. Importantly, Vitis AI is able to exploit such networks for more efficient real-time tasks (there is a YOLO-v3 example provided by Xilinx).
One can observe that using multiple CPU threads is beneficial to speed up the inference process. However, some notes about possible CPU starvation in regard to fewer DPU cores were made. The extra threads in the system may be exploited in different ways to utilize DPU potential as best as possible. Finally, a more advanced parallelization scheme may be used to achieve better inference.
