
Suitability of Earth Engine Evaporation Flux (EEFlux) Estimation of Evapotranspiration in Rainfed Crops


Abstract
:1. Introduction
2. Data and Methods
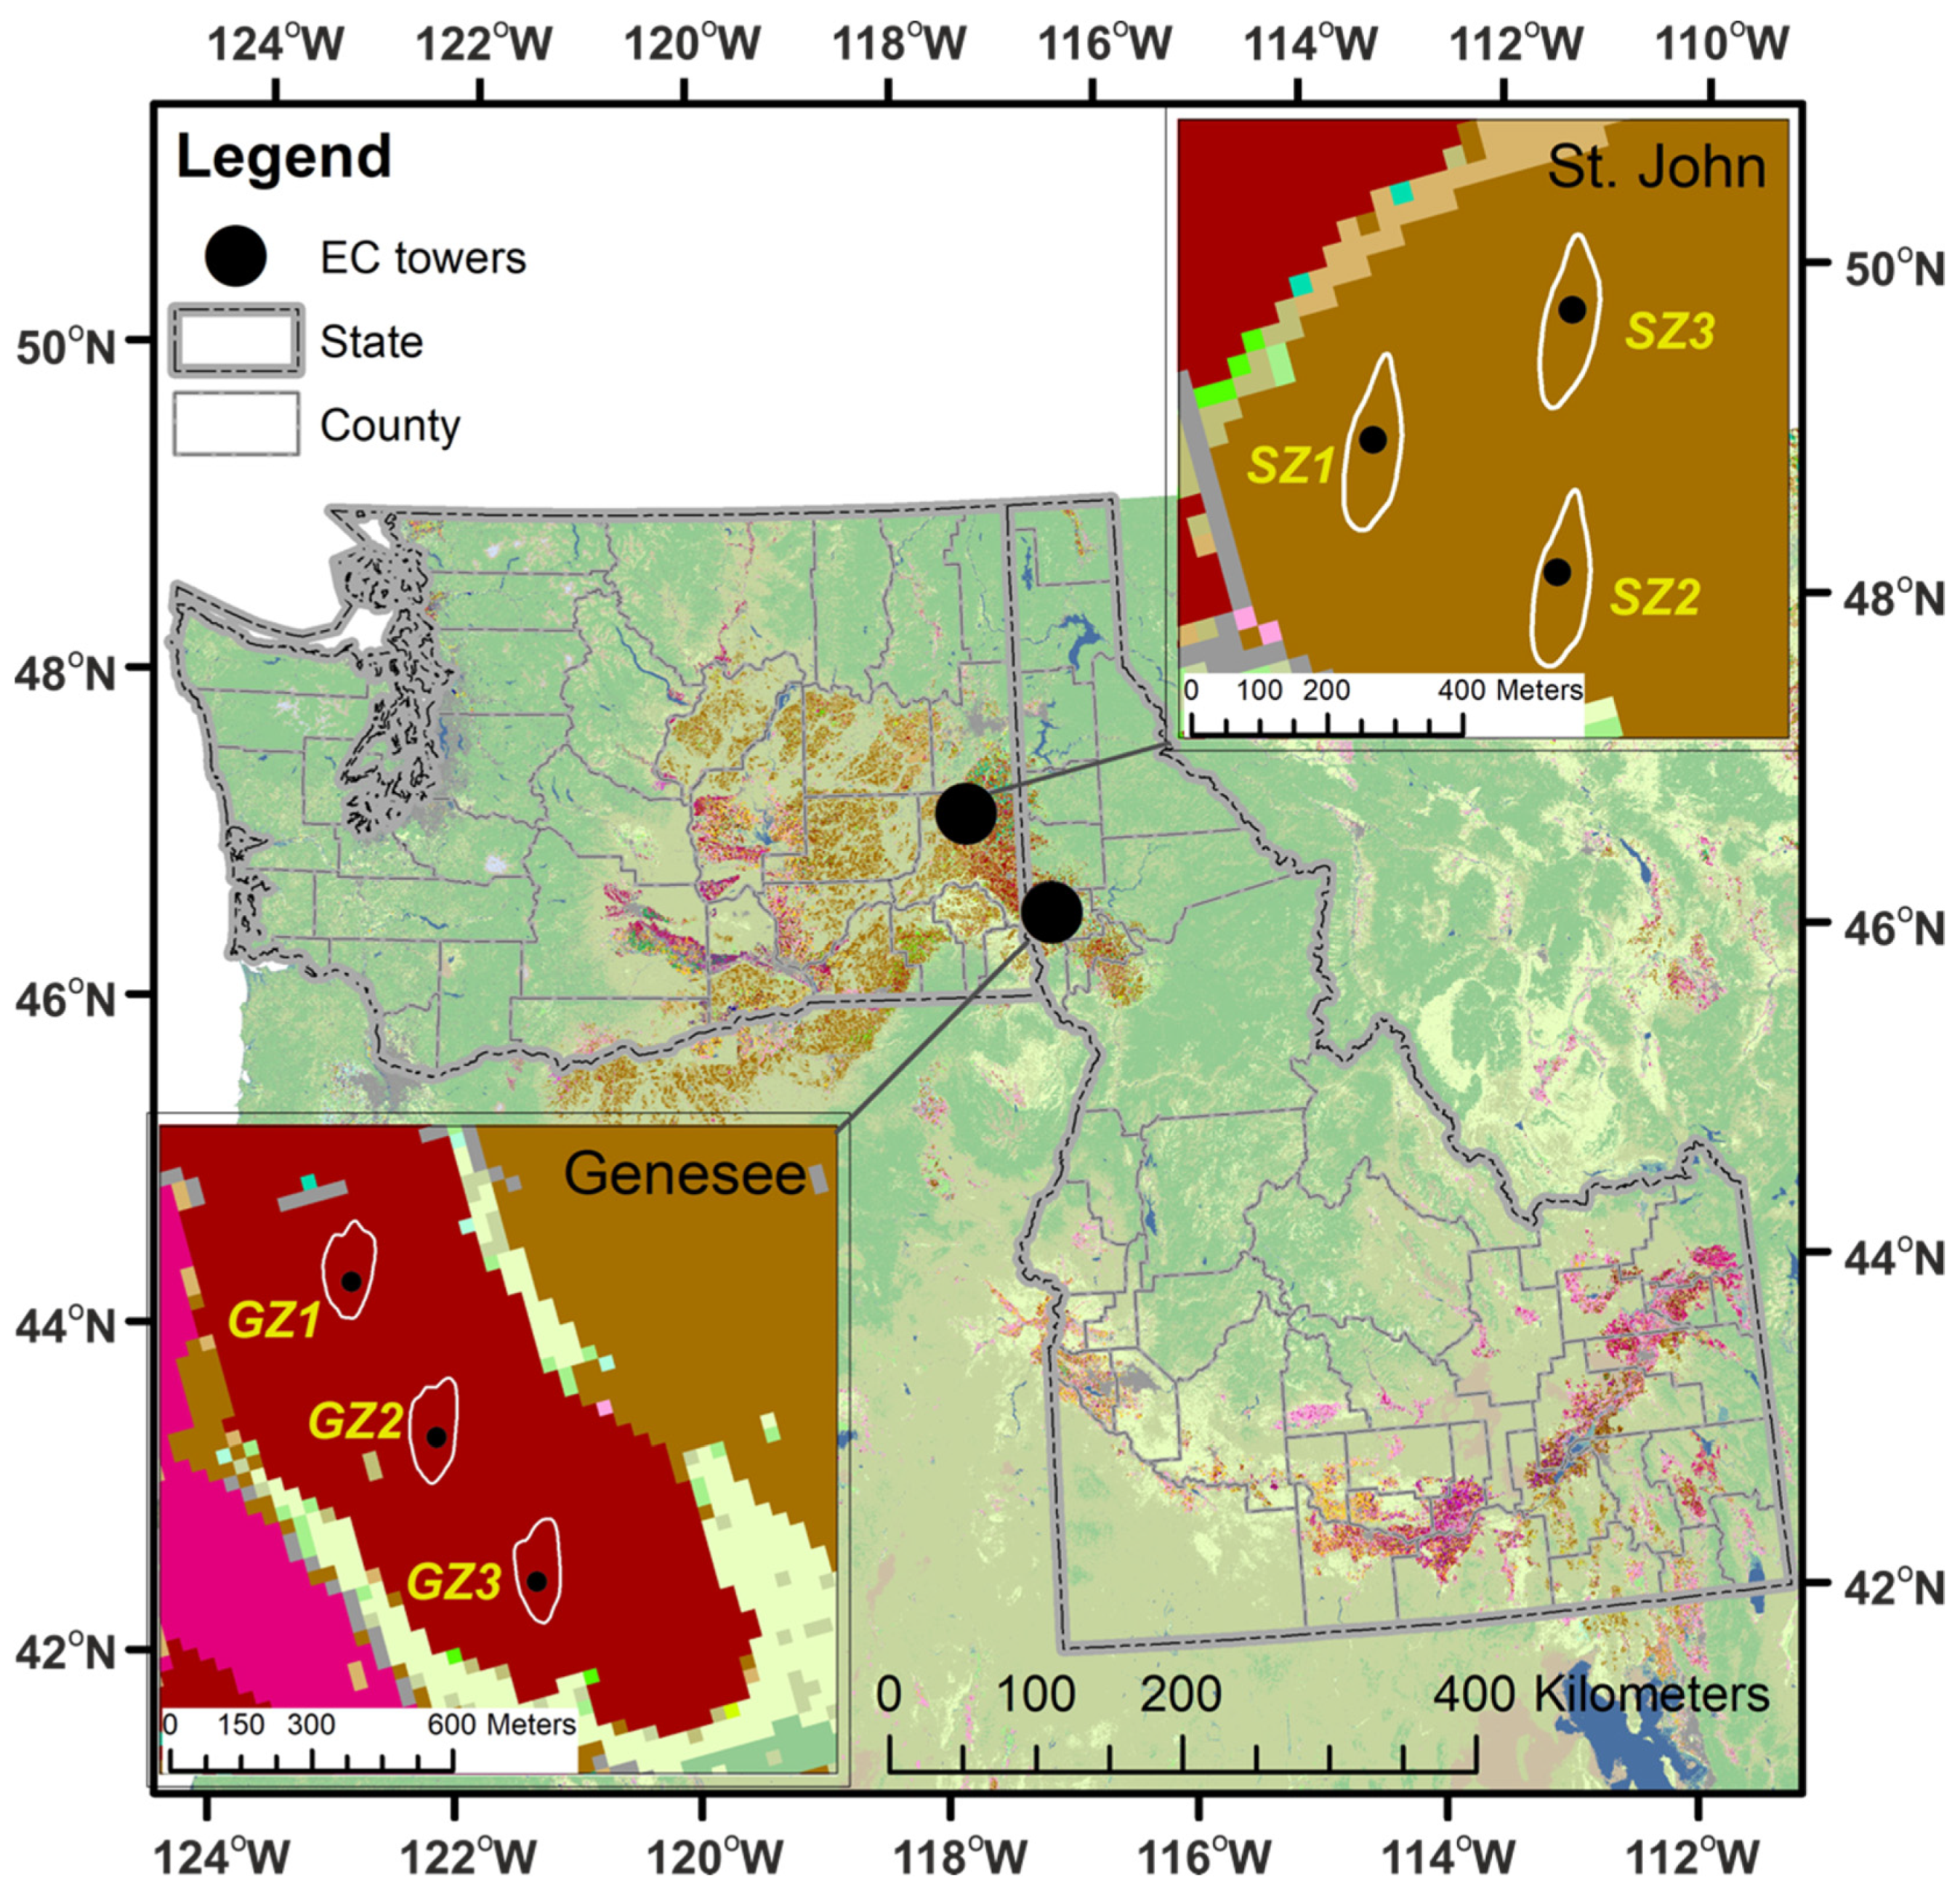
2.1. Study Sites
2.2. Satellite Data
2.3. Field Data Collection
2.3.1. Eddy Covariance ET (EC ET)
2.3.2. Weather Data
2.4. Methods
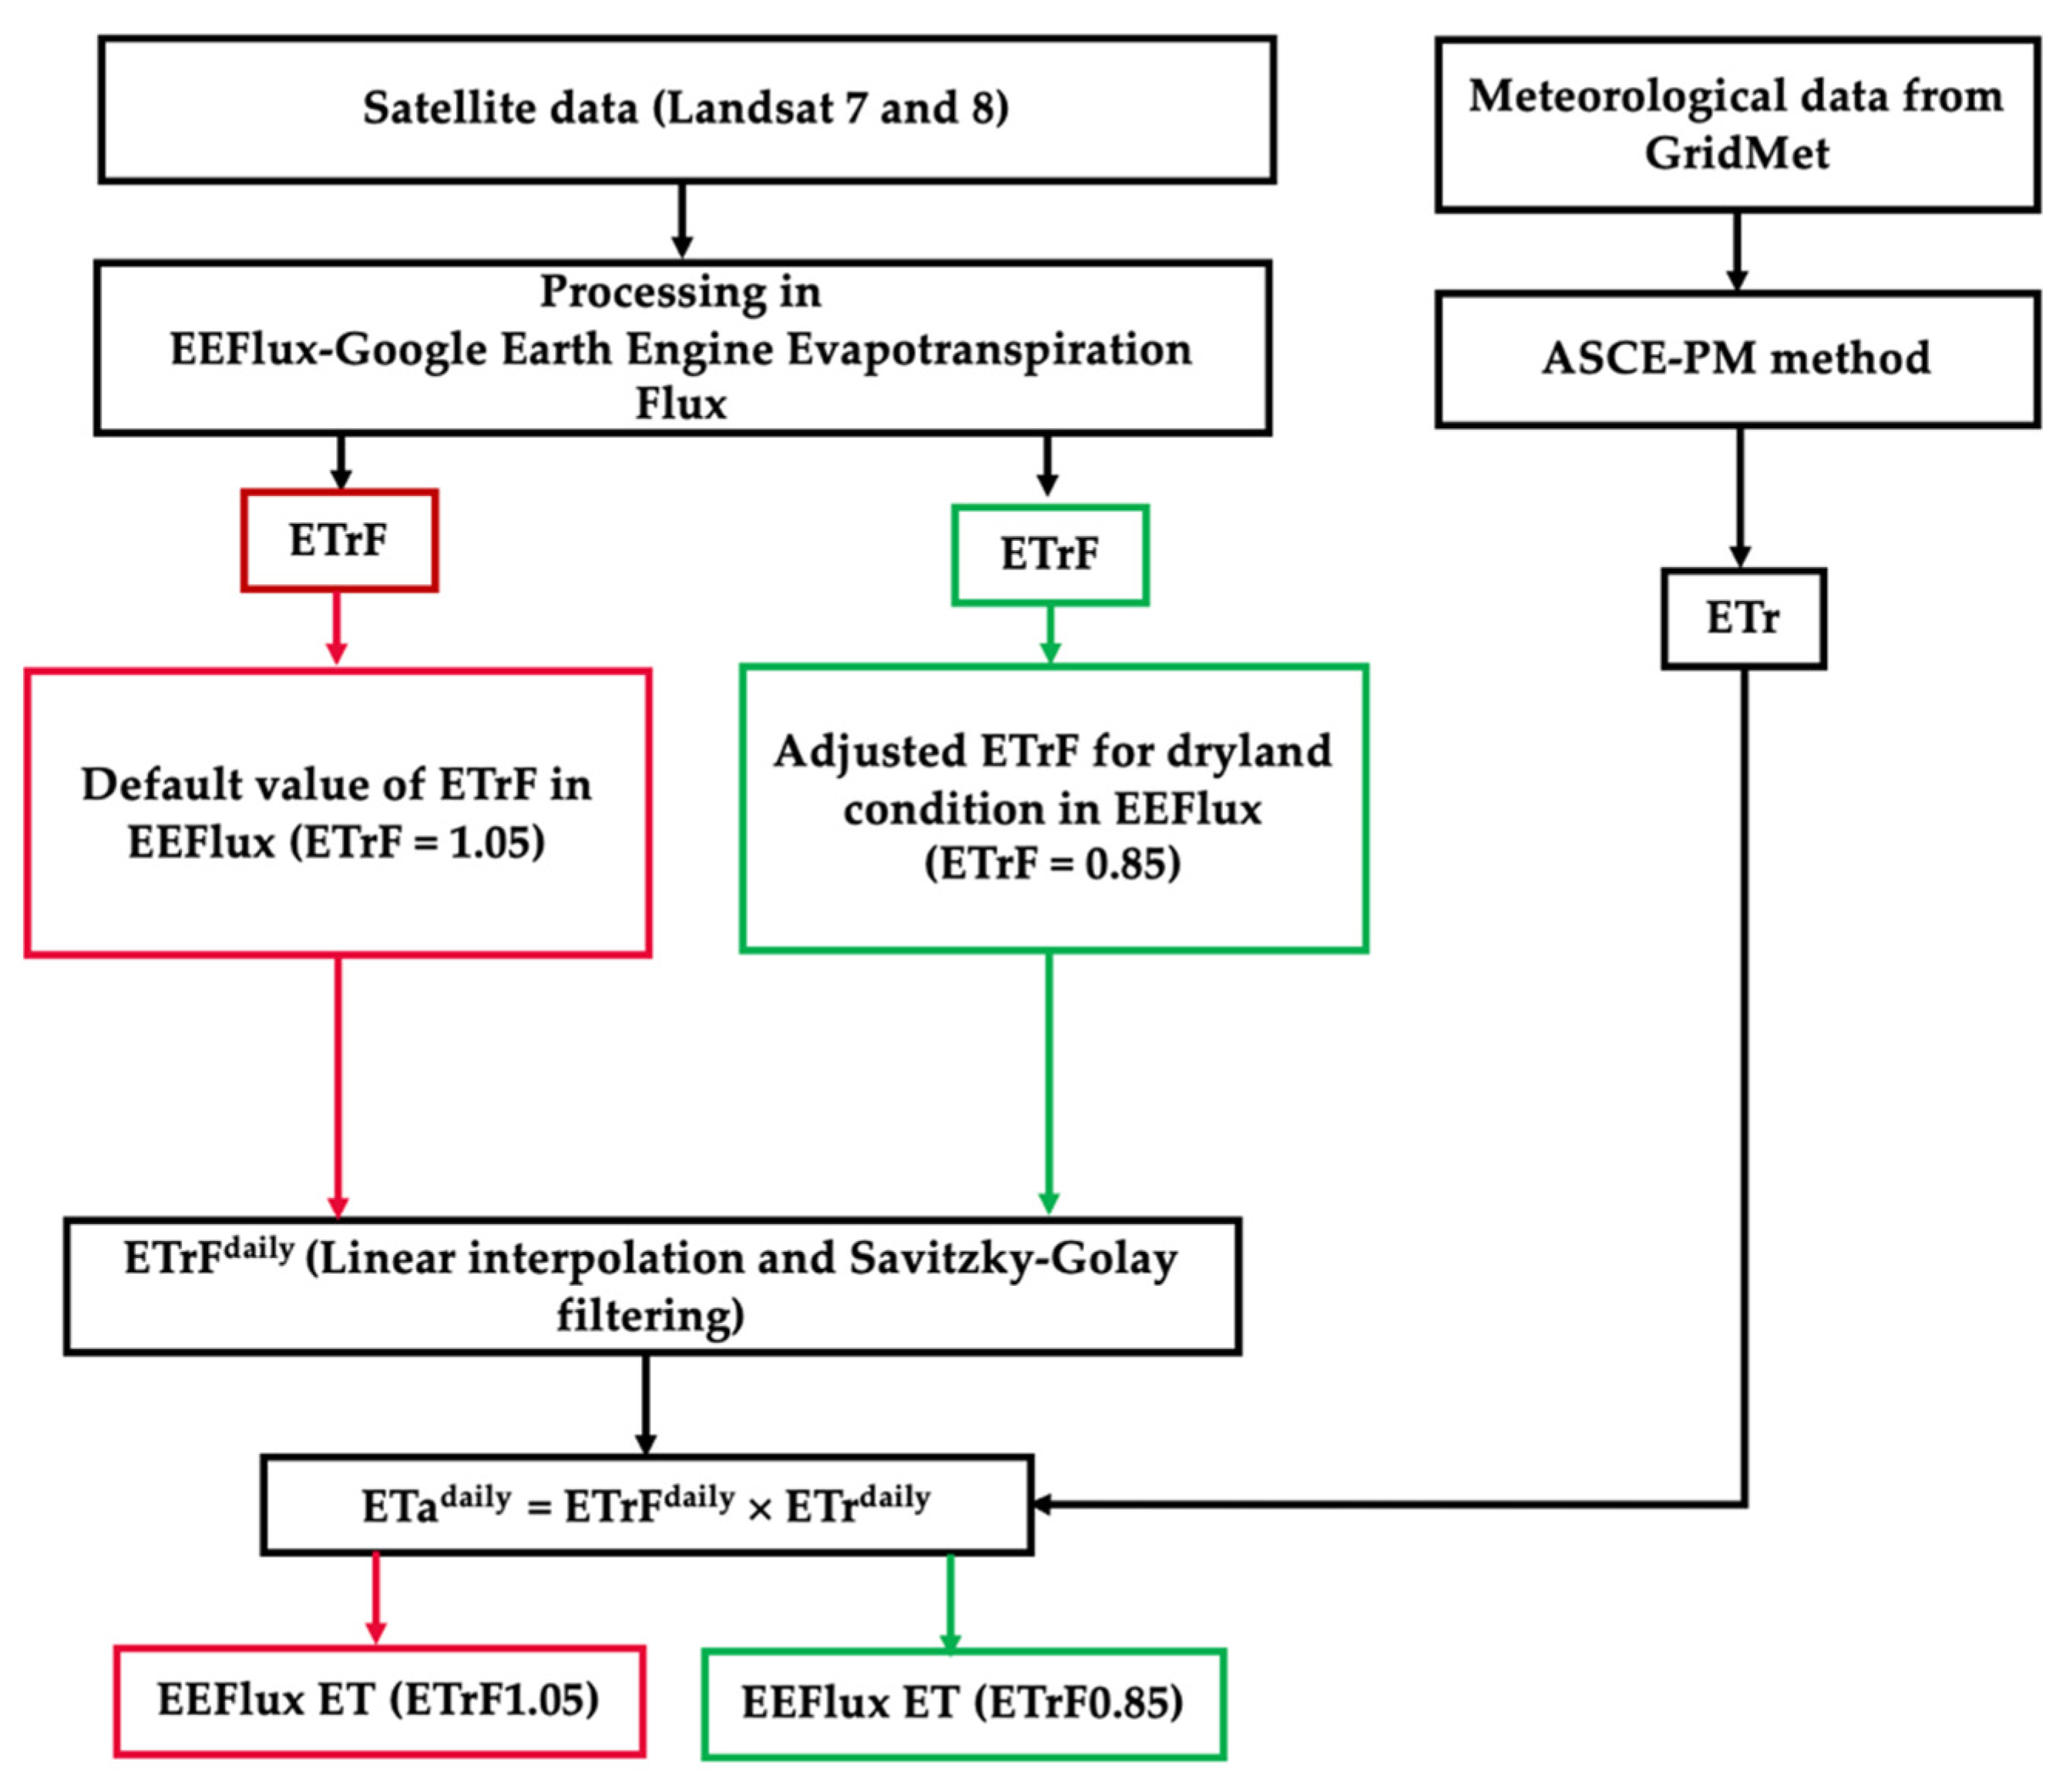
2.4.1. EEFlux
2.4.2. Evaluation of EEFlux Performance
3. Results
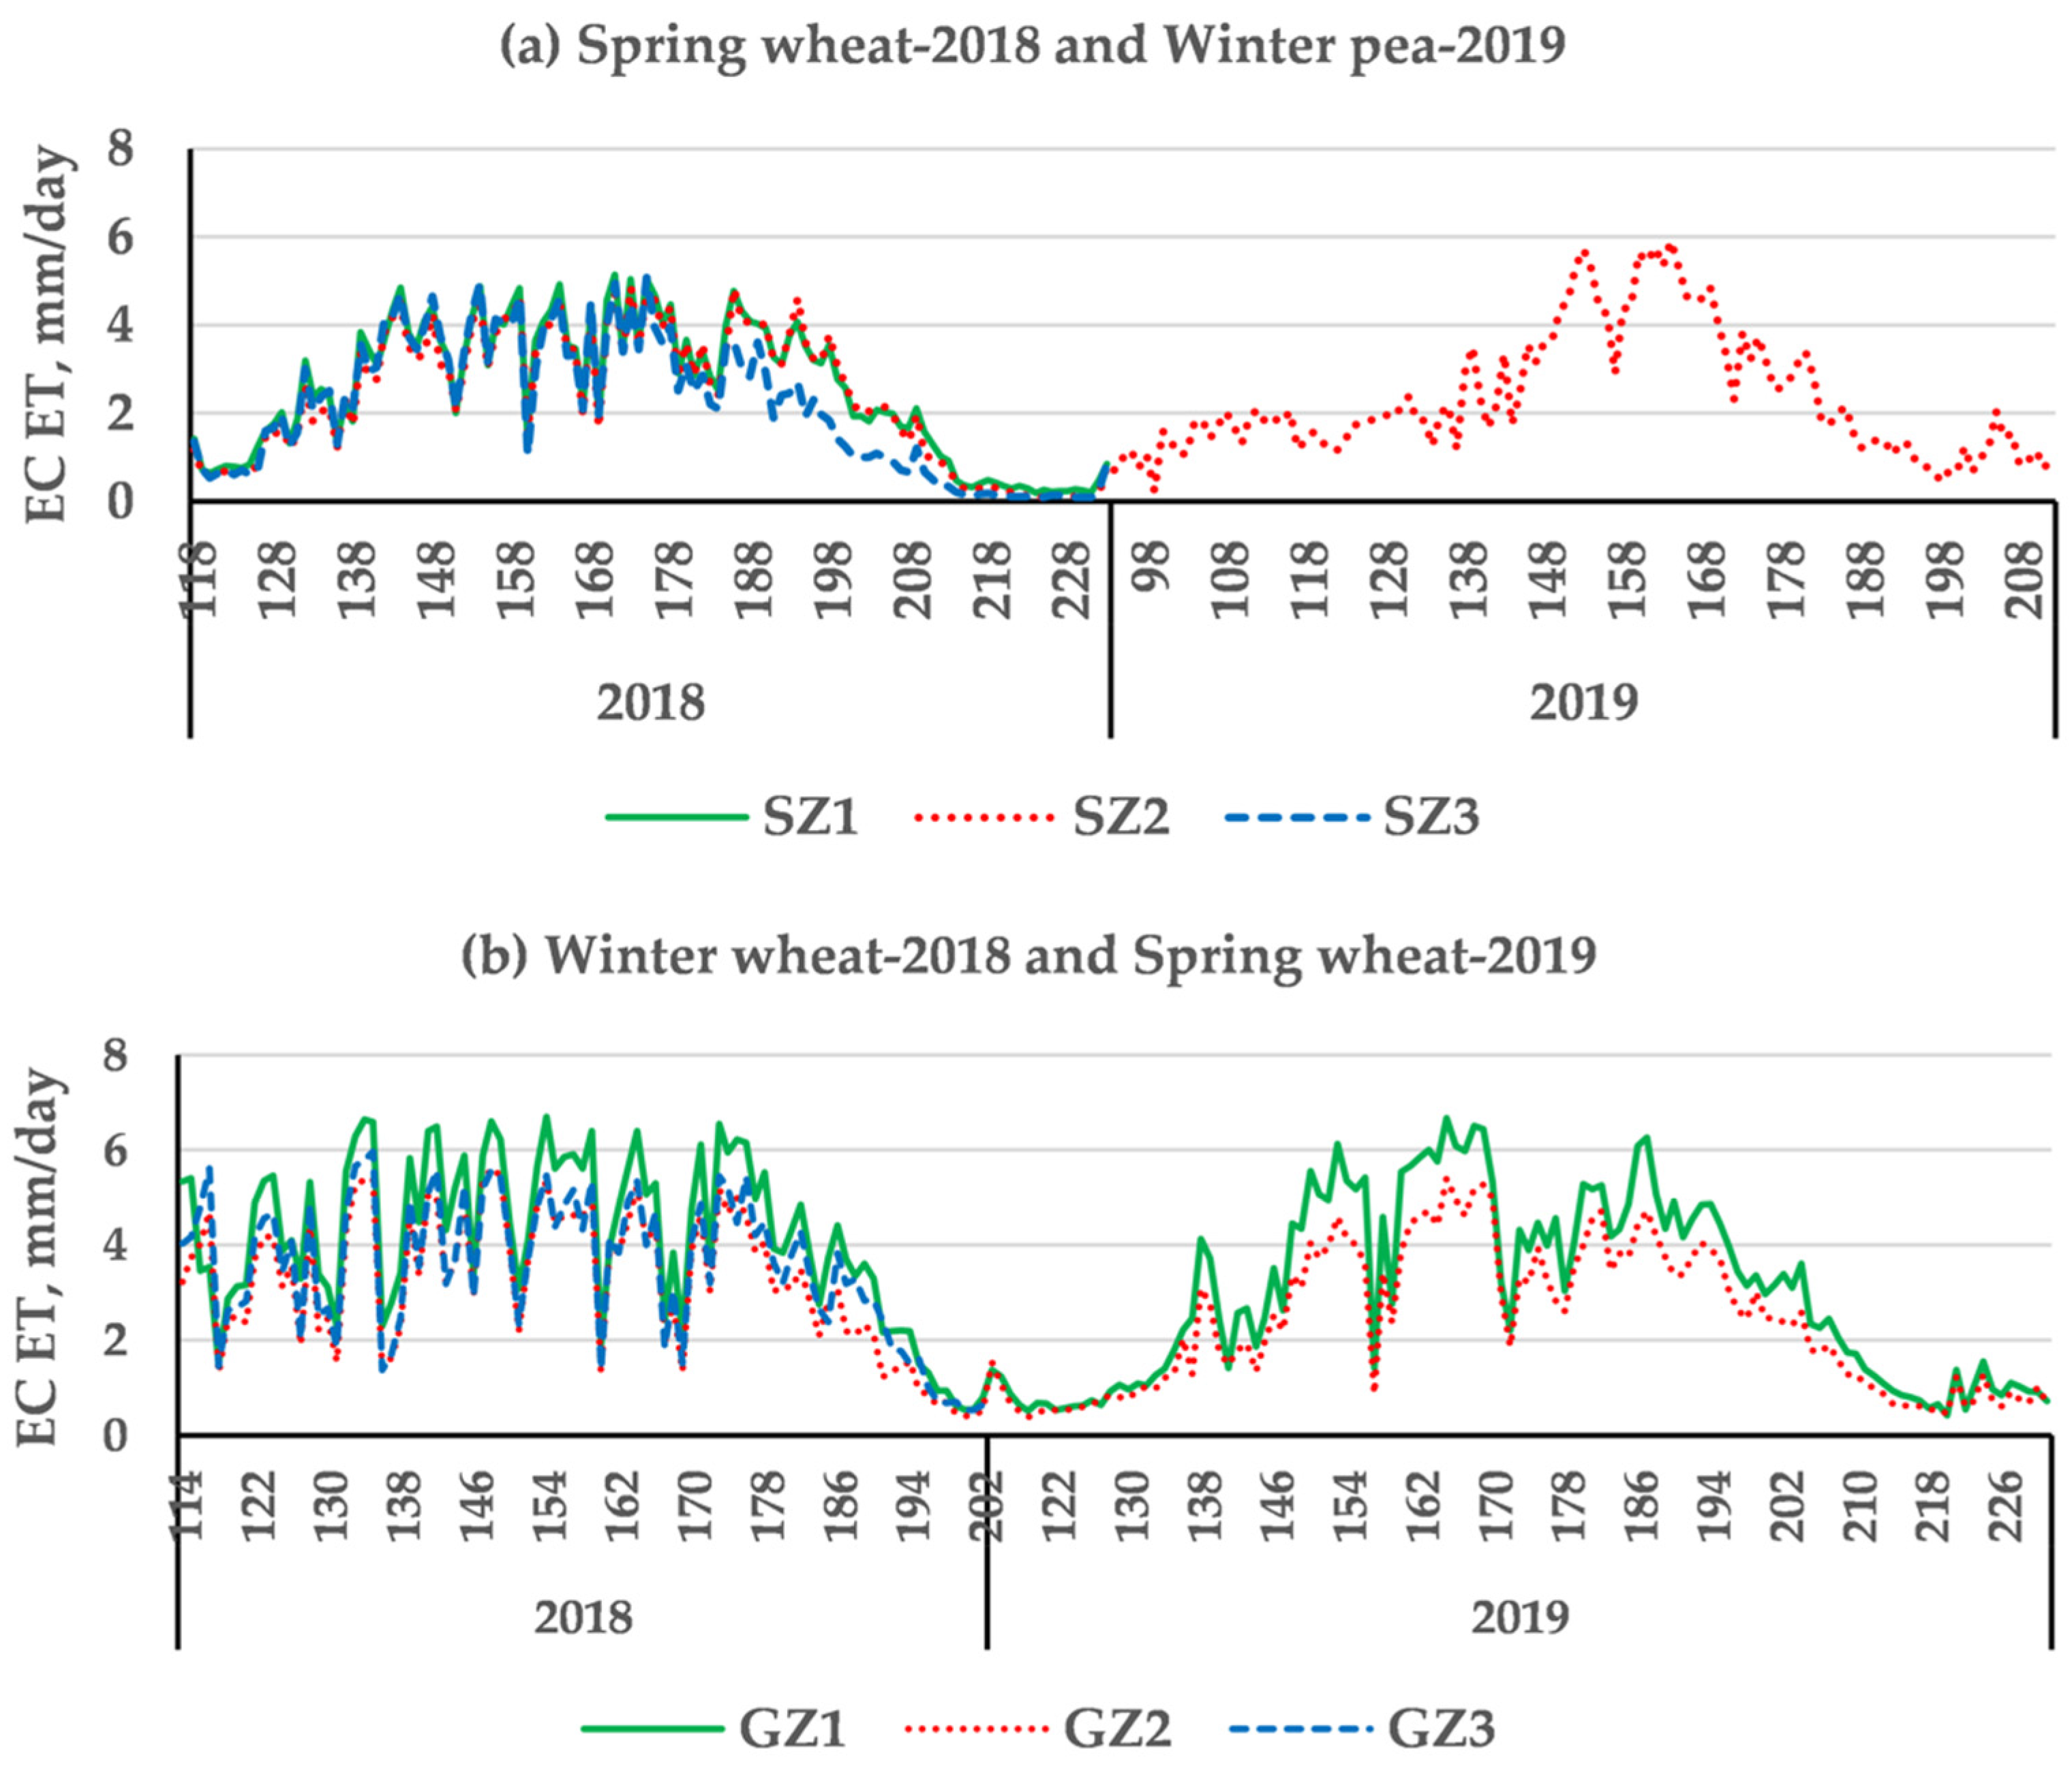
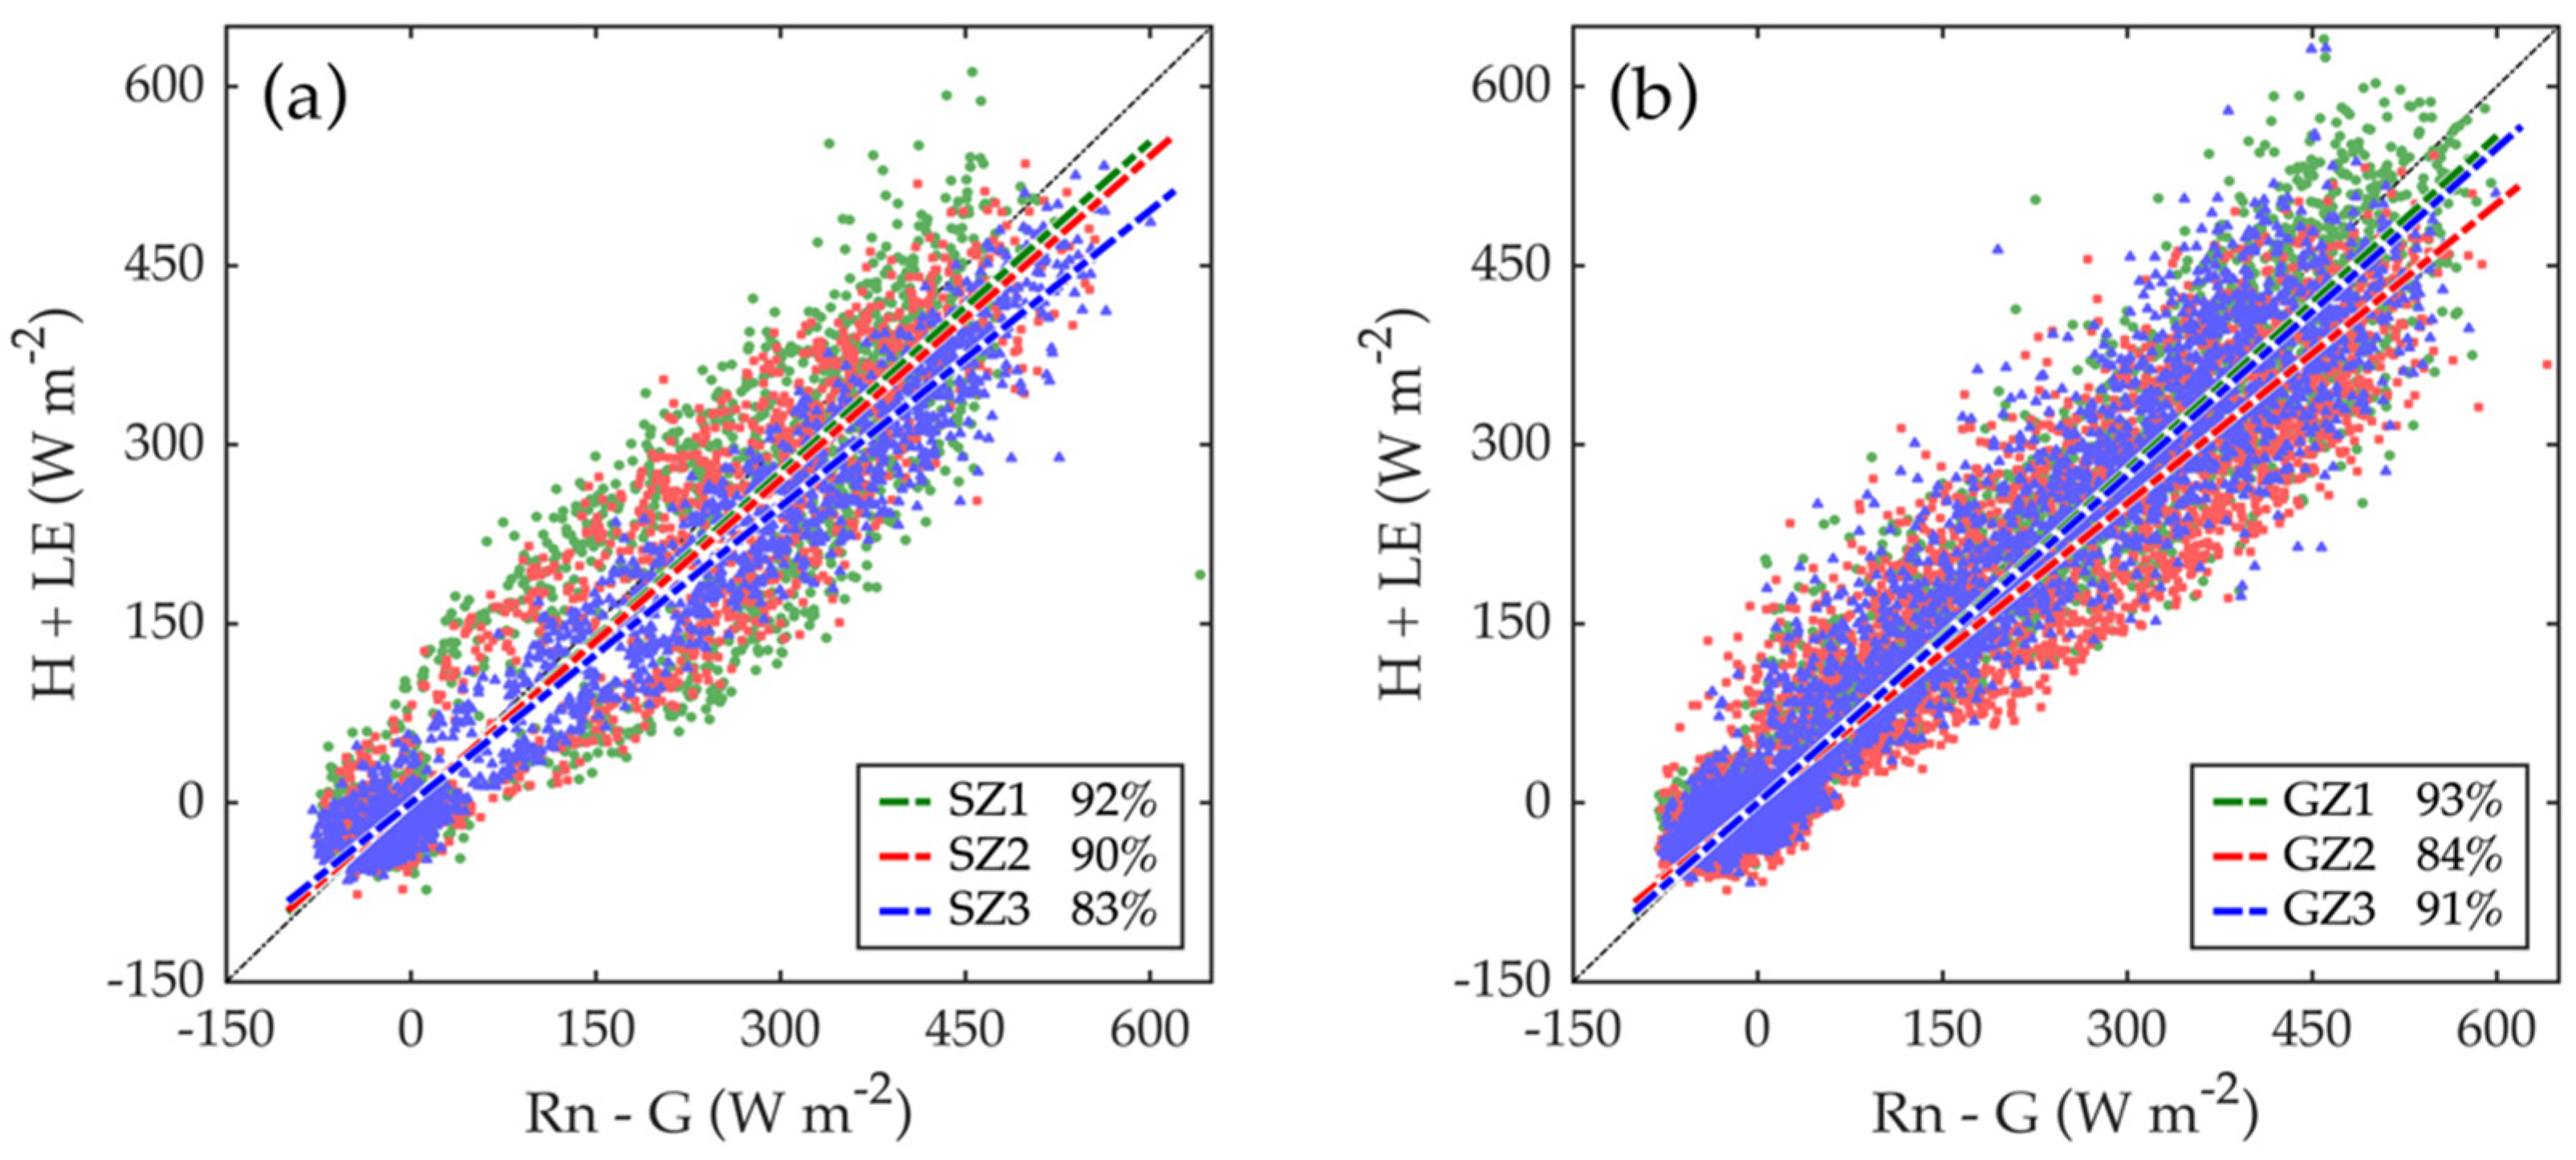
3.1. Eddy Covariance Flux Tower ET
3.2. Comparison of EEFlux and EC ET
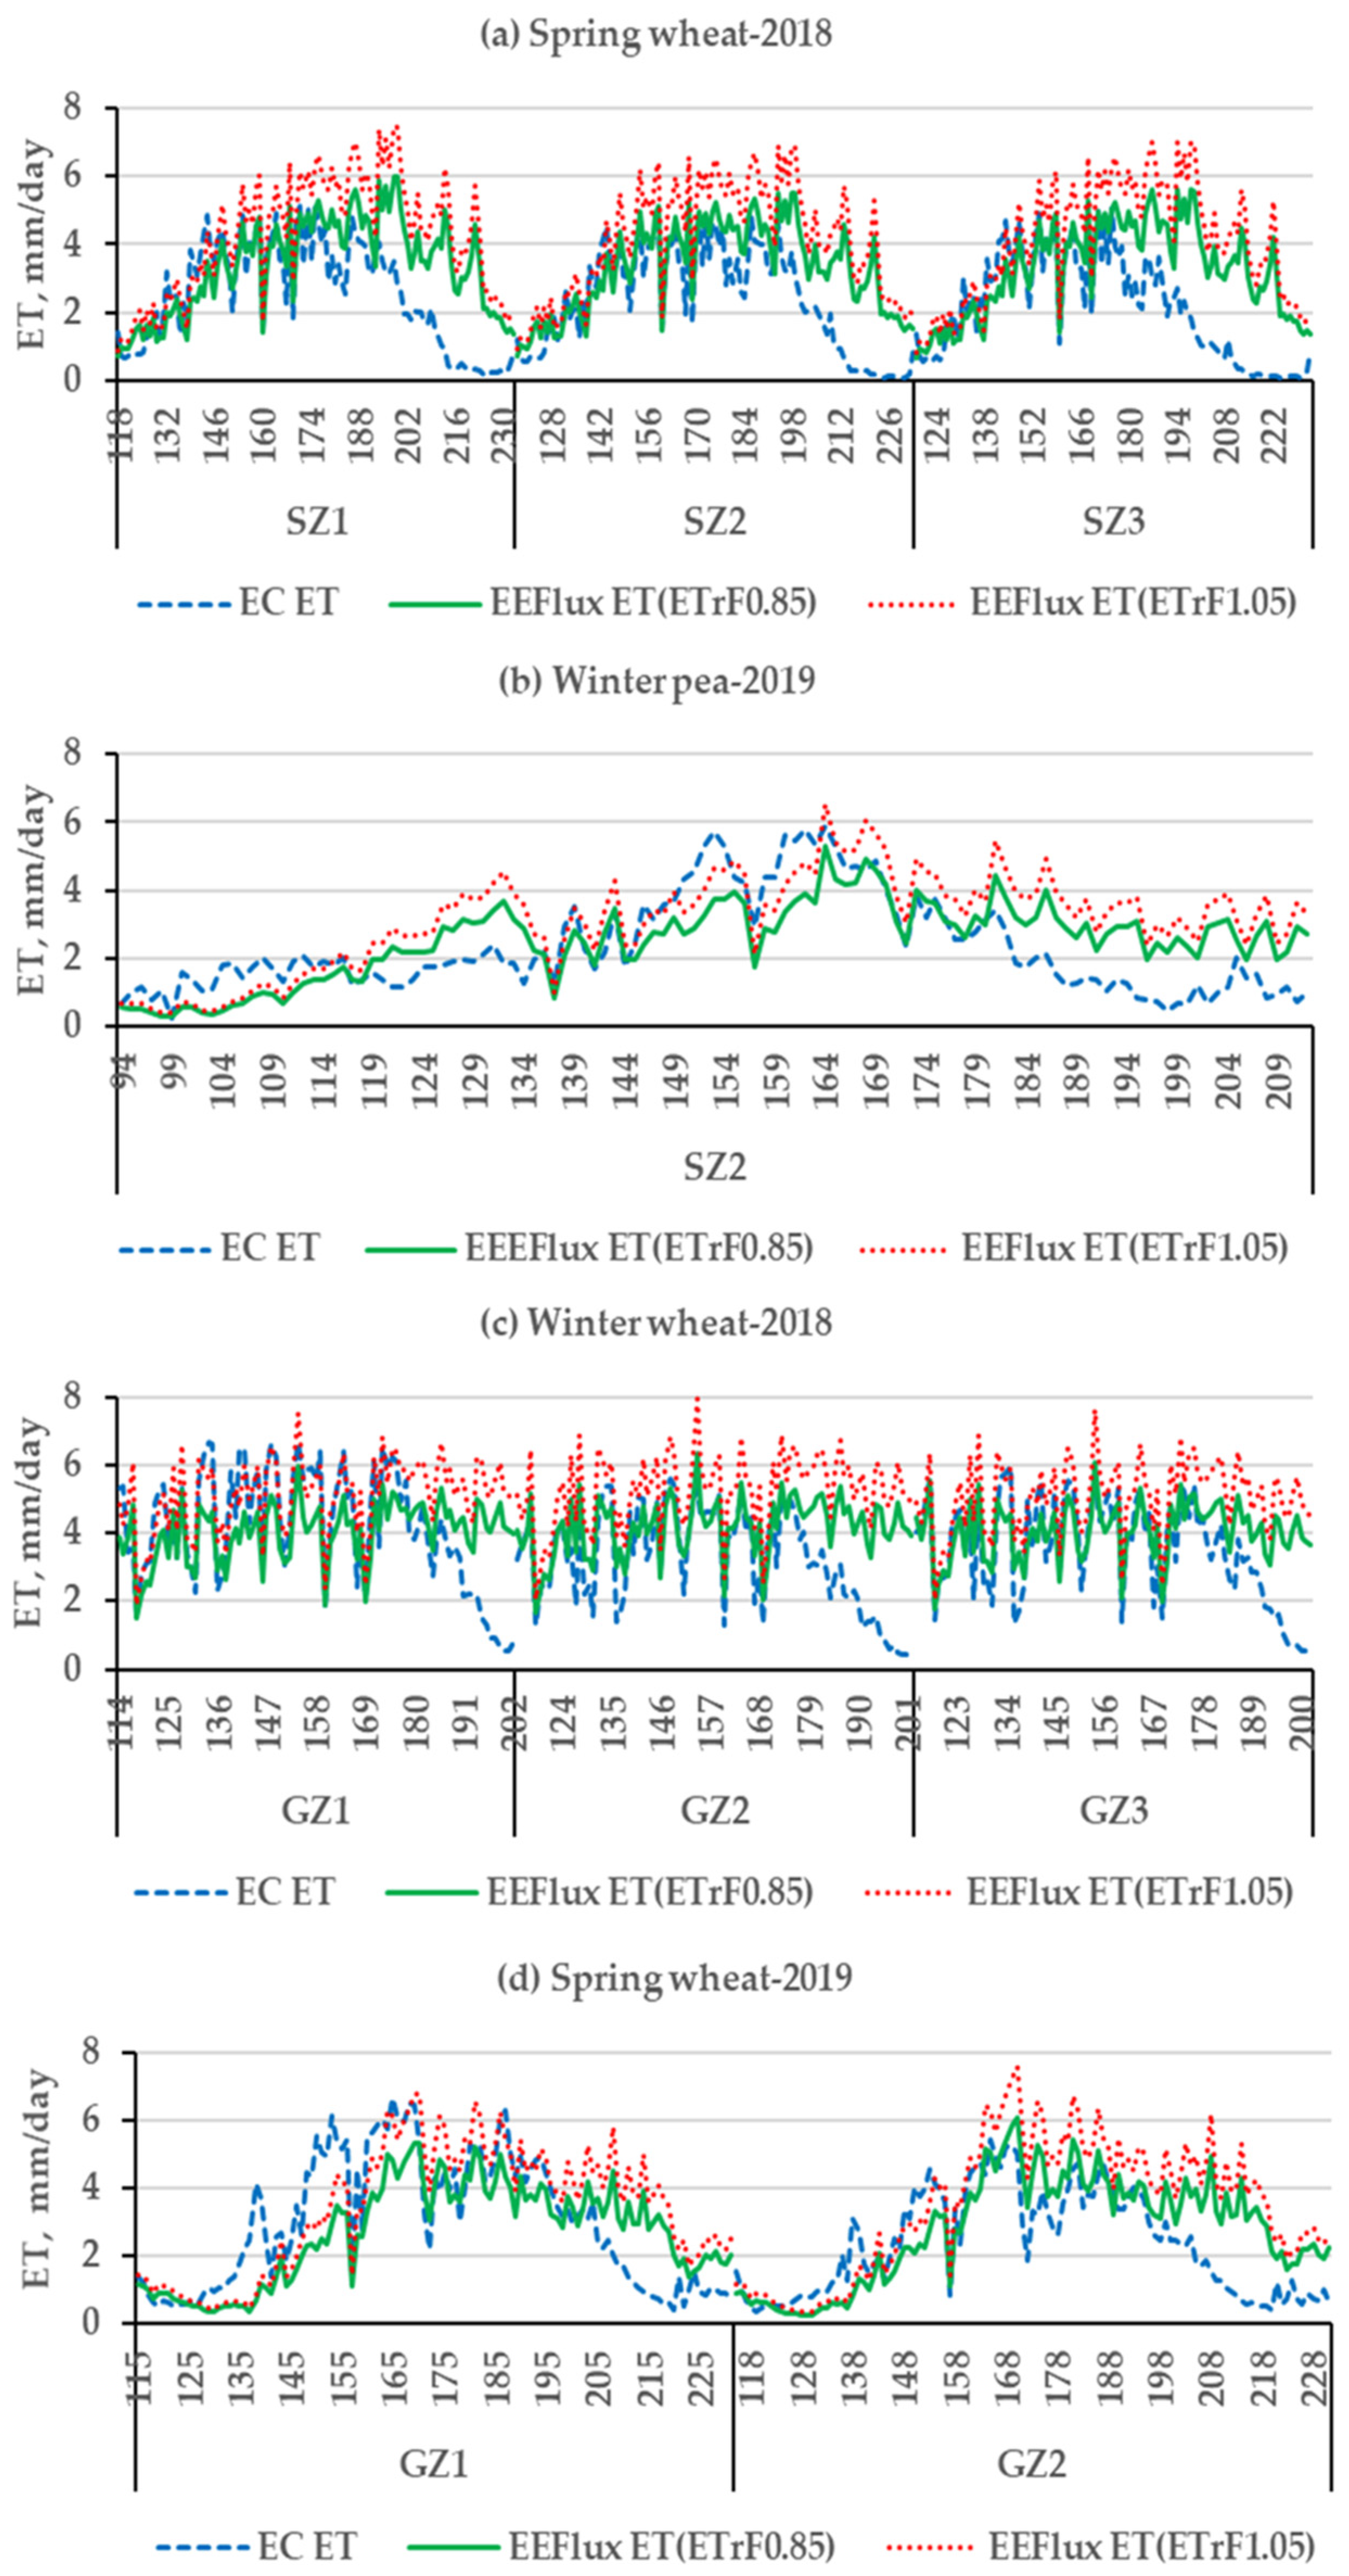
3.2.1. Daily Patterns
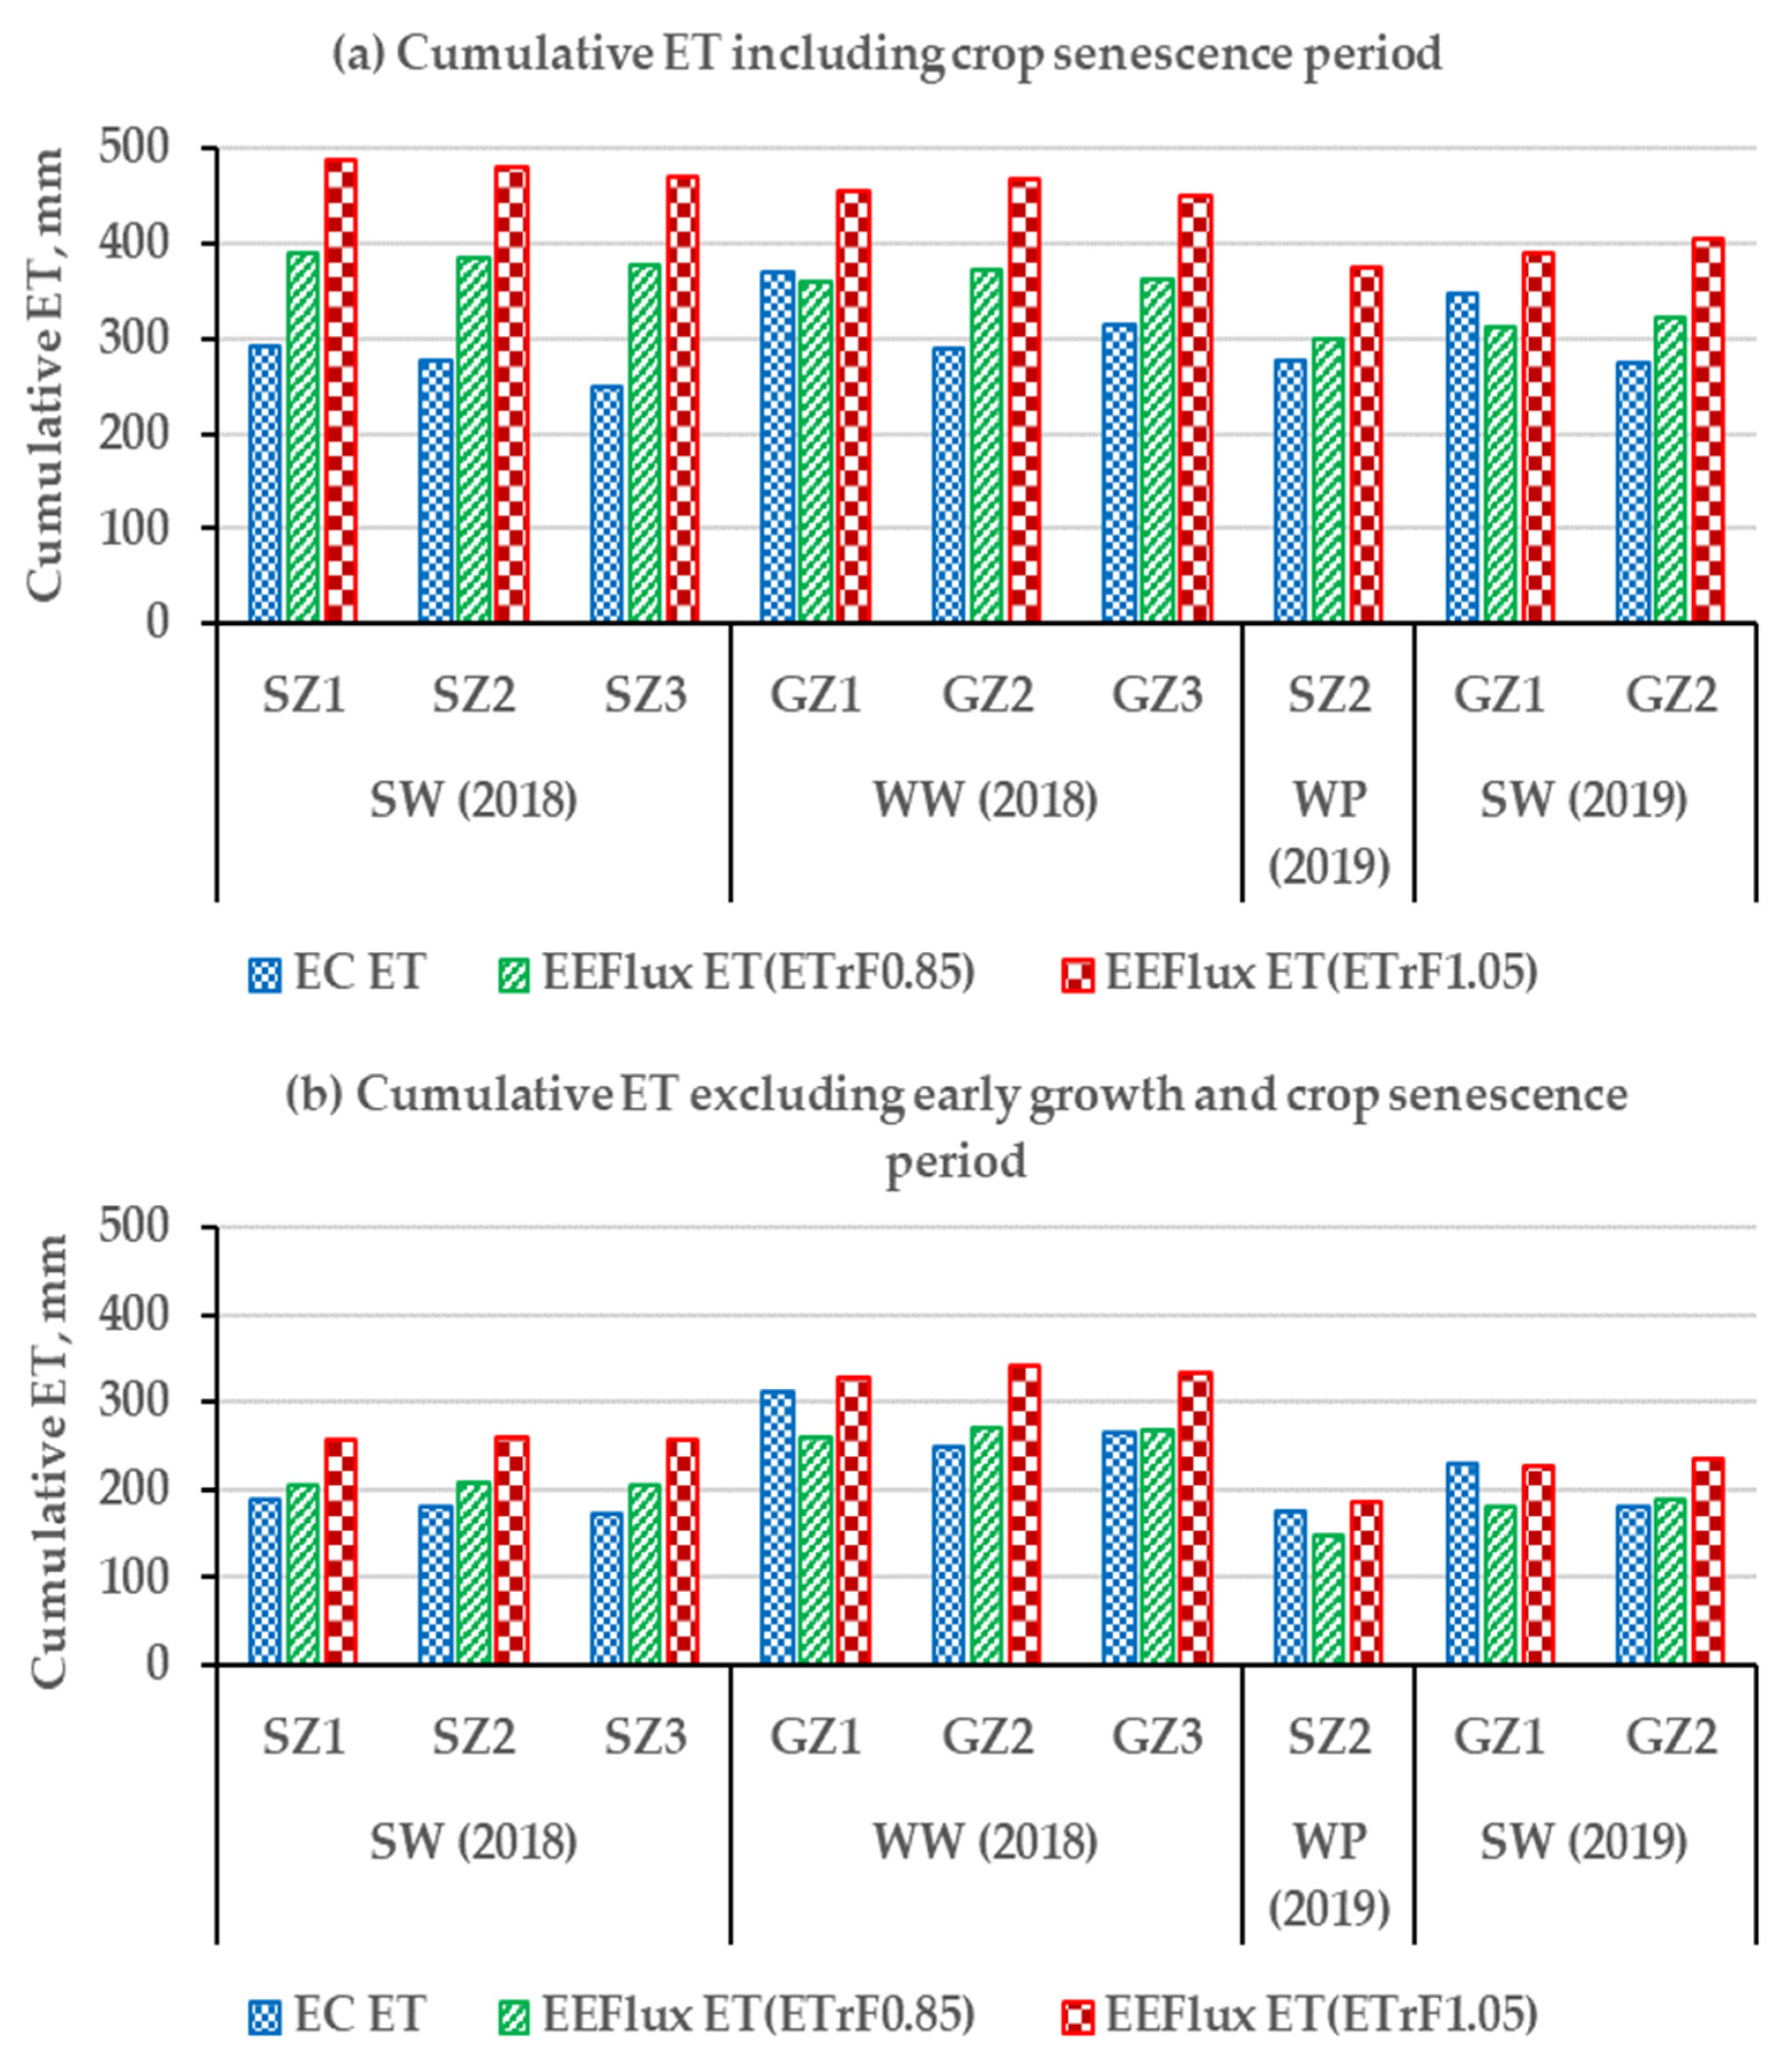
3.2.2. Cumulative Measured and Estimated ET in the Growing Season
4. Discussion
- ET overprediction during canopy senescence
- Choice of cold pixel ETrF
- EEFlux performance
5. Conclusions
Author Contributions
Funding
Institutional Review Board Statement
Informed Consent Statement
Data Availability Statement
Acknowledgments
Conflicts of Interest
References
- Allen, R.G.; Pereira, L.S.; Howell, T.A.; Jensen, M.E. Evapotranspiration Information Reporting: I. Factors Governing Measurement Accuracy. Agric. Water Manag. 2011, 23, 899–920. [Google Scholar] [CrossRef] [Green Version]
- Rana, G.; Nader, K. Measurement and Estimation of Actual Evapotranspiration in the Field under Mediterranean Climate: A Review. Eur. J. Agron. 2000, 13, 125–153. [Google Scholar] [CrossRef]
- Chávez, J.L.; Gowda, P.H.; Howell, T.A.; Copeland, K.S. Radiometric Surface Temperature Calibration Effects on Satellite Based Evapotranspiration Estimation. Int. J. Remote Sens. 2009, 30, 2337–2354. [Google Scholar] [CrossRef]
- Drexler, J.Z.; Snyder, R.L.; Spano, D.; Paw, U.K.T. A review of models and micrometeorological methods used to estimate wetland evapotranspiration. Hydro. Process. 2004, 18, 2071–2101. [Google Scholar] [CrossRef]
- Moran, M.S.; Jackson, R.D. Assessing the Spatial Distribution of Evapotranspiration Using Remotely Sensed Inputs. J. Environ. Qual. 1991, 20, 725–737. [Google Scholar] [CrossRef]
- Courault, D.; Seguin, B.; Olioso, A. Review on Estimation of Evapotranspiration from Remote Sensing Data: From Empirical to Numerical Modeling Approaches. Irrig. Drain. Syst. 2005, 19, 223–249. [Google Scholar] [CrossRef]
- Kutas, W.P.; Norman, J.M. Use of Remote Sensing for Evapotranspiration Monitoring over Land Surfaces. Hydrol. Sci. J. 1996, 41, 495–516. [Google Scholar] [CrossRef]
- Bastiaanssen, W.G.M.; Menenti, M.; Feddes, R.A.; Holtslag, A.A.M. A Remote Sensing Surface Energy Balance Algorithm for Land (SEBAL). 1. Formulation. J. Hydrol. 1998, 212–213, 198–212. [Google Scholar] [CrossRef]
- Bastiaanssen, W.G.M.; Noordman, E.J.M.; Pelgrum, H.; Davids, G.; Thoreson, B.P.; Allen, R.G. SEBAL Model with Remotely Sensed Data to Improve Water-Resources Management under Actual Field Conditions. J. Irrig. Drain. Eng. 2005, 131, 85–93. [Google Scholar] [CrossRef]
- Allen, R.G.; Tasumi, M.; Morse, A.; Trezza, R.; Wright, J.L.; Bastiaanssen, W.; Kramber, W.; Lorite, I.; Robison, C.W. Satellite-Based Energy Balance for Mapping Evapotranspiration with Internalized Calibration (METRIC)—Applications. J. Irrig. Drain. Eng. 2007, 133, 395–406. [Google Scholar] [CrossRef]
- Zhang, K.; Kimball, J.S. A review of remote sensing based actual evapotranspiration estimation. WIREs Water 2016, 3, 834–853. [Google Scholar] [CrossRef]
- Anderson, M.C.; Norman, J.M.; Diak, G.R.; Kustas, W.P.; Mecikalski, J.R. A Two-Source Time-Integrated Model for Estimating Surface Fluxes Using Thermal Infrared Remote Sensing. Remote Sens. Environ. 1997, 60, 195–216. [Google Scholar] [CrossRef]
- Roerink, G.J.; Su, Z.; Menenti, M. S-SEBI: A Simple Remote Sensing Algorithm to Estimate the Surface Energy Balance. Phys. Chem. Earth Part B Hydrol. Ocean. Atmos. 2000, 25, 147–157. [Google Scholar] [CrossRef]
- Su, Z. The Surface Energy Balance System (SEBS) for Estimation of Turbulent Heat Fluxes. Hydrol. Earth Syst. Sci. 2002, 6, 85–100. [Google Scholar] [CrossRef]
- Cosgrove, B.A.; Lohmann, D.; Mitchell, K.E.; Houser, P.R.; Wood, E.F.; Schaake, J.C.; Robock, A.; Marshall, C.; Sheffield, J.; Duan, Q.; et al. Real-Time and Retrospective Forcing in the North American Land Data Assimilation System (NLDAS) Project. J. Geophys. Res. Atmos. 2003, 108. [Google Scholar] [CrossRef] [Green Version]
- Norman, J.M.; Anderson, M.C.; Kustas, W.P.; French, A.N.; Mecikalski, J.; Torn, R.; Diak, G.R.; Schmugge, T.J.; Tanner, B.C.W. Remote Sensing of Surface Energy Fluxes at 101-m Pixel Resolutions. Water Resour. Res. 2003, 39. [Google Scholar] [CrossRef] [Green Version]
- Allen, R.; Tasumi, M.; Trezza, R. Satellite-Based Energy Balance for Mapping Evapotranspiration With Internalized Calibration (METRIC)-Model. J. Irrig. Drain. Eng. 2007, 133. [Google Scholar] [CrossRef]
- Foolad, F.; Blankenau, P.; Kilic, A.; Allen, R.G.; Huntington, J.L.; Erickson, T.A.; Ozturk, D.; Morton, C.G.; Ortega, S.; Ratcliffe, I.; et al. Comparison of the Automatically Calibrated Google Evapotranspiration Application—EEFlux and the Manually Calibrated METRIC Application. Prepr. Eng. 2018. [Google Scholar] [CrossRef]
- Allen, R.; Morton, C.; Kamble, B.; Kilic, A.; Huntington, J.; Thau, D.; Erickson, T.; Moore, R.; Trezza, R.; Ratcliffe, I.; et al. EEFlux: A Landsat-Based Evapotranspiration Mapping Tool on the Google Earth Engine. In 2015 ASABE/IA Irrigation Symposium: Emerging Technologies for Sustainable Irrigation-A Tribute to the Career of Terry Howell, Sr. Conference Proceedings; American Society of Agricultural and Biological Engineer: St. Joseph, MI, USA, 2015; Volume 12, pp. 1–11. [Google Scholar]
- Chávez, J.L.; Gowda, P.H.; Howell, T.A.; Copeland, K.S. Evaluating Three Evapotranspiration Mapping Algorithms with Lysimetric Data in the Semi-Arid Texas High Plains. In Proceedings of the 28th Annual International Irrigation Show, San Diego, CA, USA, 9–11 December 2007. [Google Scholar]
- Hankerson, B.; Kjaersgaard, J.; Hay, C. Estimation of Evapotranspiration from Fields with and without Cover Crops Using Remote Sensing and in Situ Methods. Remote Sens. 2012, 4, 3796–3812. [Google Scholar] [CrossRef] [Green Version]
- Healey, N.C.; Irmak, A.; Arkebauer, T.J.; Billesbach, D.P.; Lenters, J.D.; Hubbard, K.G.; Allen, R.G.; Kjaersgaard, J. Remote Sensing and in Situ-Based Estimates of Evapotranspiration for Subirrigated Meadow, Dry Valley, and Upland Dune Ecosystems in the Semi-Arid Sand Hills of Nebraska, USA. Irrig. Drain. Syst. 2011, 25, 151–178. [Google Scholar] [CrossRef]
- Singh, R.; Kilic, A. Treatment of Anchor Pixels in the METRIC Model for Improved Estimation of Sensible and Latent Heat Fluxes. Hydrol. Sci. J. 2011, 56, 895–906. [Google Scholar] [CrossRef]
- Carrasco-Benavides, M.; Ortega-Farías, S.; Lagos, L.; Kleissl, J.; Morales-Salinas, L.; Kilic, A. Parameterization of the Satellite-Based Model (METRIC) for the Estimation of Instantaneous Surface Energy Balance Components over a Drip-Irrigated Vineyard. Remote Sens. Basel Switz. 2014, 6, 11342–11371. [Google Scholar] [CrossRef] [Green Version]
- Folhes, M.T.; Rennó, C.D.; Soares, J.V. Remote Sensing for Irrigation Water Management in the Semi-Arid Northeast of Brazil. Agric. Water Manag. 2009, 96, 1398–1408. [Google Scholar] [CrossRef]
- Liebert, R.; Huntington, J.; Morton, C.; Sueki, S.; Acharya, K. Reduced Evapotranspiration from Leaf Beetle Induced Tamarisk Defoliation in the Lower Virgin River Using Satellite-Based Energy Balance: Reduced ET from Tamarisk Defoliation in the Lower Virgin River. Ecohydrology 2015, 9, 179–193. [Google Scholar] [CrossRef]
- Madugundu, R.; Al-Gaadi, K.A.; Abdalhaleem, E.T.; Hassaballa, A.; Patil, V.C. Performance of the METRIC Model in Estimating Evapotranspiration Fluxes over an Irrigated Field in Saudi Arabia Using Landsat-8 Images. Hydrol. Earth Syst. Sci. 2017, 21, 6135–6151. [Google Scholar] [CrossRef] [Green Version]
- Niza, Z.; Khan, M.Z.; Govind, A.; Marchetti, M.; Lasserre, B.; Magliulo, E.; Manco, A. Evaluation of SEBS, METRIC-EEFlux, and QWaterModel Actual Evapotranspiration for a Mediterranean Cropping System in Southern Italy. Agronomy 2021, 11, 345. [Google Scholar] [CrossRef]
- Allen, R.G.; Tasumi, M.; Morse, A.; Trezza, R. A Landsat-Based Energy Balance and Evapotranspiration Model in Western US Water Rights Regulation and Planning. Irrig. Drain. Syst. 2005, 19, 251–268. [Google Scholar] [CrossRef]
- Singh, R.K.; Liu, S.; Tieszen, L.L.; Suyker, A.E.; Verma, S.B. Estimating Seasonal Evapotranspiration from Temporal Satellite Images. Irrig. Sci. 2011, 30, 303–313. [Google Scholar] [CrossRef] [Green Version]
- Khan, A.; Stöckle, C.O.; Nelson, R.L.; Peters, T.; Adam, J.C.; Lamb, B.; Chi, J.; Waldo, S. Estimating Biomass and Yield Using METRIC Evapotranspiration and Simple Growth Algorithms. Agron. J. 2019, 111, 536–544. [Google Scholar] [CrossRef] [Green Version]
- Khand, K.; Bhattarai, N.; Taghvaeian, S.; Wagle, P.; Gowda, P.H.; Alderman, P.D. Modeling Evapotranspiration of Winter Wheat Using Contextual and Pixel-Based Surface Energy Balance Models. Trans. ASABE 2021, 64, 507–519. [Google Scholar] [CrossRef]
- Duijndam, L.M. Evaluation of Two Automated Remote Sensing- Based Surface Energy Balance Models for Estimating Daily Evapotranspiration. Master’s Thesis, Delft University of Technology, Delft, The Netherlands, October 2016. [Google Scholar]
- Wilczak, J.M.; Oncley, S.P.; Stage, S.A. Sonic Anemometer Tilt Correction Algorithms. Bound. Layer. Meteorol. 2001, 99, 127–150. [Google Scholar] [CrossRef]
- Massman, W.J. A Simple Method for Estimating Frequency Response Corrections for Eddy Covariance Systems. Agric. For. Meteorol. 2000, 104, 185–198. [Google Scholar] [CrossRef]
- Massman, W.J. Reply to Comment by Rannik on ‘A Simple Method for Estimating Frequency Response Corrections for Eddy Covariance Systems. Agric. For. Meteorol. 2001, 107, 247–251. [Google Scholar] [CrossRef]
- Moncrieff, J.; Clement, R.; Finnigan, J.; Meyers, T. Averaging, Detrending, and Filtering of Eddy Covariance Time Series. In Handbook of Micrometeorology; Kluwer Academic Publishers: Amsterdam, The Netherlands, 2004; pp. 7–31. [Google Scholar] [CrossRef]
- Webb, E.K.; Pearman, G.I.; Leuning, R. Correction of Flux Measurements for Density Effects Due to Heat and Water Vapour Transfer. Q. J. R. Meteorol. Soc. 1980, 106, 85–100. [Google Scholar] [CrossRef]
- Mauder, M.; Foken, T. Documentation and Instruction Manual of the Eddy Covariance Software Package TK2. Bayreuth Abt. Mikrometeorol. 2004, 26, 26–42. [Google Scholar]
- Wutzler, T.; Lucas-Moffat, A.; Migliavacca, M.; Knauer, J.; Sickel, K.; Šigut, L.; Menzer, O.; Reichstein, M. Basic and Extensible Post-Processing of Eddy Covariance Flux Data with REddyProc. Biogeosciences 2018, 15, 5015–5030. [Google Scholar] [CrossRef] [Green Version]
- Kljun, N.; Calanca, P.; Rotach, M.W.; Schmid, H.P. A simple two-dimensional parameterisation for Flux Footprint Prediction (FFP). Geosc. Model Dev. 2015, 8, 3695–3713. Available online: http://www.geosci-model-dev.net/8/3695/2015/gmd-8-3695-2015.html (accessed on 26 July 2020). [CrossRef] [Green Version]
- Russell, E.S.; Liu, H.; Gao, Z.; Finn, D.; Lamb, B. Impacts of soil heat flux calculation methods on the surface energy balance closure. Agric. For. Meteorol. 2015, 214–215, 189–200. [Google Scholar] [CrossRef]
- Gao, Z.; Russell, E.S.; Missik, J.E.C.; Huang, M.; Chen, X.; Strickland, C.E.; Clayton, R.; Arntzen, E.; Ma, Y.; Liu, H. A Novel Approach to Evaluate Soil Heat Flux Calculation: An Analytical Review of Nine Methods. J. Geophys. Res. Atmos. 2017, 122, 6934–6949. [Google Scholar] [CrossRef]
- Abatzoglou, J.T. Development of Gridded Surface Meteorological Data for Ecological Applications and Modelling. Int. J. Climatol. 2013, 33, 121–131. [Google Scholar] [CrossRef]
- Technical Committee on Standardization of Reference Evapotranspiration. The ASCE Standardized Reference Evapotranspiration Equation; Ivan AWalter Elliott, R.L., Howell, T.A., Itenfisu, D., Jensen, M.E., Snyder, R.L., Eds.; American Society of Civil Engineers: Reston, VA, USA, 2005. [Google Scholar] [CrossRef]
- Kilic, A.; Allen, R. Google Earth Engine Evapotranspiration Flux—EEFlux. INOVAGRI 2015, 1, 2015. [Google Scholar]
- Irmak, A.; Allen, R.G.; Jeppe, K.; Justin, H.; Kamble, B.; Ricardo, T.; Ian, R. Operational Remote Sensing of ET and Challenges. In Evapotranspiration—Remote Sensing and Modeling; IntechOpen: London, UK, 2012; pp. 467–492. [Google Scholar]
- Conrad, C.; Dech, S.W.; Hafeez, M.; Lamers, J.; Martius, C.; Strunz, G. Mapping and assessing water use in a Central Asian irrigation system by utilizing MODIS remote sensing products. Irrig. Drain. Syst. 2007, 21, 197–218. [Google Scholar] [CrossRef] [Green Version]
- Liaqat, U.W.; Choi, M. Surface Energy Fluxes in the Northeast Asia Ecosystem: SEBS and METRIC Models Using Landsat Satellite Images. Agric. For. Meteorol. 2015, 214–215, 60–79. [Google Scholar] [CrossRef]
- Willmott, C.J. Some comments on the evaluation of model performance. Bull. Am. Meteorol. Soc. 1982, 63, 1309–1313. [Google Scholar] [CrossRef] [Green Version]
- Wilson, K.; Goldstein, A.; Falge, E.; Aubinet, M.; Baldocchi, D.; Berbigier, P.; Bernhofer, C.; Ceulemans, R.; Dolman, H.; Field, C.; et al. Energy Balance Closure at FLUXNET Sites. Agric. For. Meteorol. 2002, 113, 223–243. [Google Scholar] [CrossRef] [Green Version]
- Oncley, S.; Foken, T.; Vogt, R.; Kohsiek, W.; DeBruin, H.A.R.; Bernhofer, C.; Christen, A.; Van Gorsel, E.; Grantz, D.; Feigenwinter, C.; et al. The energy balance experiment ebex-2000. Part I: Overview and energy balance. Bound.-Layer Meteorol. 2007, 123, 1–28. [Google Scholar] [CrossRef]
- Kumari, N.; Srivastava, A.; Dumka, U.C. A Long-Term Spatiotemporal Analysis of Vegetation Greenness over the Himalayan Region Using Google Earth Engine. Climate 2021, 9, 109. [Google Scholar] [CrossRef]
- Singh, R.K.; Senay, G.B. Comparison of Four Different Energy Balance Models for Estimating Evapotranspiration in the Midwestern United States. Water 2016, 8, 9. [Google Scholar] [CrossRef] [Green Version]
- Chandel, A.K.; Khot, L.R.; Molaei, B.; Peters, R.T.; Stöckle, C.O.; Jacoby, P.W. High-Resolution Spatiotemporal Water Use Mapping of Surface and Direct-Root-Zone Drip-Irrigated Grapevines Using UAS-Based Thermal and Multispectral Remote Sensing. Remote Sens. 2021, 13, 954. [Google Scholar] [CrossRef]
- Mkhwanazi, M.M.; Chávez, J.L. Mapping evapotranspiration with the remote sensing ET algorithms METRIC and SEBAL under advective and non-advective conditions: Accuracy determination with weighing lysimeters. Hydrol. Days 2013. [Google Scholar] [CrossRef]
- Lima, J.G.; Sánchez, J.M.; Piqueras, J.G.; Espínola, J.; Viana, P.C.; Alves, A.D.S. Evapotranspiration of Sorghum from the Energy Balance by METRIC and STSEB. Rev. Bras. Eng. Agric. Ambient. 2020, 24, 24–30. [Google Scholar] [CrossRef]
- Hashem, A.A.; Engel, B.A.; Bralts, V.F.; Marek, G.W.; Moorhead, J.E.; Radwan, S.A.; Gowda, P.H. Assessment of Landsat-Based Evapotranspiration Using Weighing Lysimeters in the Texas High Plains. Agronomy 2020, 10, 1688. [Google Scholar] [CrossRef]


| Site | 2017–2018 | 2018–2019 | ||||||||
|---|---|---|---|---|---|---|---|---|---|---|
| Crop | Planting Date | Harvest Date | Period (Days) | Images (Counts) | Crop | Planting Date | Harvest Date | Period (Days) | Images (Counts) | |
| SZ1 | SW | 26 April 2018 | 21 August 2018 | 118 | 9 | --- | --- | --- | --- | --- |
| SZ2 | SW | 26 April 2018 | 21 August 2018 | 118 | 9 | WP | 12 October 2018 | 31 July 2019 | 293 | 9 |
| SZ3 | SW | 26 April 2018 | 21 August 2018 | 118 | 9 | --- | --- | --- | --- | --- |
| GZ1 | WW | 30 September 2017 | 21 July 2018 | 295 | 14 | SW | 25 April 2019 | 19 August 2019 | 117 | 15 |
| GZ2 | WW | 30 September 2017 | 21 July 2018 | 295 | 14 | SW | 25 April 2019 | 19 August 2019 | 117 | 15 |
| GZ3 | WW | 30 September 2017 | 21 July 2018 | 295 | 14 | --- | --- | --- | --- | --- |
| Location | Crop | Year | Tmax (°C) | Tmin (°C) | RHmax (%) | RHmin (%) | Rs (W/m2) | Uz (m/s) | ETr (mm/Day) | Annual Rainfall (mm) |
|---|---|---|---|---|---|---|---|---|---|---|
| St. John | SW | 2018 | 26.2 | 9.9 | 81.4 | 31.5 | 293.9 | 3.2 | 6.78 | 404.9 |
| WP | 2019 | 21.9 | 7.9 | 81.9 | 36.5 | 285.1 | 3.5 | 5.94 | 395.6 | |
| Genesee | WW | 2018 | 23.8 | 10.8 | 69.1 | 35.3 | 287.4 | 2.9 | 6.32 | 499.7 |
| SW | 2019 | 25.3 | 10.7 | 64.1 | 29.0 | 292.8 | 3.0 | 6.87 | 510.5 |
| Site | Tower | 2018 | 2019 | ||||||||
|---|---|---|---|---|---|---|---|---|---|---|---|
| Crop | Min (mm/Day) | Max (mm/Day) | Avg. (mm/Day) | Total (mm) | Crop | Min (mm/Day) | Max (mm/Day) | Avg. (mm/Day) | Total (mm) | ||
| St. John | SZ1 | SW | 0.20 | 5.14 | 2.57 | 292.7 | --- | --- | --- | --- | --- |
| SZ2 | SW | 0.09 | 4.86 | 2.42 | 276.1 | WP | 0.22 | 5.91 | 2.33 | 277.2 | |
| SZ3 | SW | 0.08 | 5.07 | 2.17 | 248.3 | --- | --- | --- | --- | --- | |
| Genesee | GZ1 | WW | 0.54 | 6.69 | 4.12 | 369.5 | SW | 0.42 | 6.67 | 2.96 | 346.5 |
| GZ2 | WW | 0.41 | 5.61 | 3.24 | 288.6 | SW | 0.37 | 5.40 | 2.34 | 274.1 | |
| GZ3 | WW | 0.52 | 5.96 | 3.52 | 314.3 | --- | --- | --- | --- | --- | |
| Year | Site | Tower | Crop | Days | % Departure | |
|---|---|---|---|---|---|---|
| EEFlux ET(ETrF0.85) | EEFlux ET(ETRF1.05) | |||||
| 2018 | St. John | SZ1 | SW | 118 | 33.2 | 66.5 |
| SZ2 | SW | 118 | 39.1 | 73.9 | ||
| SZ3 | SW | 118 | 51.7 | 89.7 | ||
| Genesee | GZ1 | WW | 89 | −2.3 (2.3) | 23.1 | |
| GZ2 | WW | 89 | 28.9 | 62.3 | ||
| GZ3 | WW | 89 | 15.1 | 43.7 | ||
| 2019 | St. John | SZ2 | WP | 119 | 8.2 | 35.2 |
| Genesee | GZ1 | SW | 117 | −9.9 (9.9) | 12.7 | |
| GZ2 | SW | 117 | 17.9 | 47.6 | ||
| Overall average | 20.2 (22.9) | 50.5 (50.5) | ||||
| Year | Site | Tower | Crop | Days | % Departure | |
|---|---|---|---|---|---|---|
| EEFlux ET(ETrF0.85) | EEFlux ET(ETRF1.05) | |||||
| 2018 | St. John | SZ1 | SW | 118 | 8.3 | 35.4 |
| SZ2 | SW | 118 | 14.6 | 43.2 | ||
| SZ3 | SW | 118 | 19.3 | 49.2 | ||
| Genesee | GZ1 | WW | 89 | −16.6 (16.6) | 5.3 | |
| GZ2 | WW | 89 | 8.8 | 37.4 | ||
| GZ3 | WW | 89 | 0.6 | 25.7 | ||
| 2019 | St. John | SZ2 | WP | 119 | −14.7 (14.7) | 6.7 |
| Genesee | GZ1 | SW | 117 | −20.7 (20.7) | −0.8 (0.8) | |
| GZ2 | SW | 117 | 3.5 | 29.3 | ||
| Overall average | 0.35 (11.9) | 25.7 (25.9) | ||||
Publisher’s Note: MDPI stays neutral with regard to jurisdictional claims in published maps and institutional affiliations. |
© 2021 by the authors. Licensee MDPI, Basel, Switzerland. This article is an open access article distributed under the terms and conditions of the Creative Commons Attribution (CC BY) license (https://creativecommons.org/licenses/by/4.0/).
Share and Cite
Kadam, S.A.; Stöckle, C.O.; Liu, M.; Gao, Z.; Russell, E.S. Suitability of Earth Engine Evaporation Flux (EEFlux) Estimation of Evapotranspiration in Rainfed Crops. Remote Sens. 2021, 13, 3884. https://doi.org/10.3390/rs13193884
Kadam SA, Stöckle CO, Liu M, Gao Z, Russell ES. Suitability of Earth Engine Evaporation Flux (EEFlux) Estimation of Evapotranspiration in Rainfed Crops. Remote Sensing. 2021; 13(19):3884. https://doi.org/10.3390/rs13193884
Chicago/Turabian StyleKadam, Sunil A., Claudio O. Stöckle, Mingliang Liu, Zhongming Gao, and Eric S. Russell. 2021. "Suitability of Earth Engine Evaporation Flux (EEFlux) Estimation of Evapotranspiration in Rainfed Crops" Remote Sensing 13, no. 19: 3884. https://doi.org/10.3390/rs13193884
APA StyleKadam, S. A., Stöckle, C. O., Liu, M., Gao, Z., & Russell, E. S. (2021). Suitability of Earth Engine Evaporation Flux (EEFlux) Estimation of Evapotranspiration in Rainfed Crops. Remote Sensing, 13(19), 3884. https://doi.org/10.3390/rs13193884