Abstract
The Geostationary Lightning Mapper (GLM) on the Geostationary Operational Environmental Satellite 16 (GOES-16) detects total lightning continuously, with a high spatial resolution and detection efficiency. Coincident data from the GLM and the Advanced Baseline Imager (ABI) are used to explore the correlation between the cloud top properties and flash activity across the continental United States (CONUS) sector from May to September 2020. A large number of collocated infrared (IR) brightness temperature (TBB), cloud top height (CTH) and lightning data provides robust statistics. Overall, the likelihood of lightning occurrence and high flash density is higher if the TBB is colder than 225 K. The higher CTH is observed to be correlated with a larger flash rate, a smaller flash size, stronger updraft, and larger optical energy. Furthermore, the cloud top updraft velocity (w) is estimated based on the decreasing rate of TBB, but it is smaller than the updraft velocity of the convective core. As a result, the relationship between CTH and lightning flash rate is investigated independently of w over the continental, oceanic and coastal regimes in the tropics and mid-latitudes. When the CTH is higher than 12 km, the flash rates of oceanic lightning are 38% smaller than those of both coastal and continental lightning. In addition, it should be noted that more studies are necessary to examine why the oceanic lightning with low clouds (CTH < 8 km) has higher flash rates than lightning over land and coast. Finally, the exponents of derived power relationship between CTH and lightning flash rate are smaller than four, which is underestimated due to the GLM detection efficiency and the difference between IR CTH and 20 dBZ CTH. The results from combining the ABI and GLM products suggest that merging multiple satellite datasets could benefit both lightning activity and parameterization studies, although the parallax corrections should be considered.
1. Introduction
Lightning occurs on the Earth with an average flash rate of between 25 and 55 s [1]. The World Meteorological Organization and the Global Climate Observing System have declared lightning as a new essential climate variable for climate science and service applications [2,3,4,5,6]. Lightning is not only one of the leading causes of forest fires and weather-related fatalities [7], but also produces 2–8 Tg nitrogen (N) per year [8]. Furthermore, ozone (O) production can be enhanced by the lightning-generated nitrogen oxides (LNO) in the convection outflow [9,10,11]. As O is known as an absorber of ultraviolet radiation and greenhouse gas, the contribution of LNO to O has an effect on climate forcing [12]. Therefore, proper understanding of the lightning distribution and frequency is essential for the hazard forecast and climate research.
Previous studies have investigated the relationships among cloud properties, meteorological fields, and lightning. Cloud top temperature is reported to have a negative correlation with lightning when it is colder than −55 C [13,14]. The updraft volume in the charging zone with a vertical velocity exceeding 5 m s has positive correlations with the total lightning activity [15,16]. Several lightning parameterizations have been developed for chemistry transport and climate models and have been used to predict future trends in lightning activity due to global warming. Studies have found that the cloud top height (CTH) and convective available potential energy times the precipitation rate P (CAPE × P) proxy predict more tropical lightning with global warming, the convective ice flux on the 260-K isotherm (IFluxT) proxy sees little change, while the vertical integral of the ice and graupel densities (I × G) proxy predicts a decrease in tropical lightning [17,18]. The mechanisms leading to different responses of these proxies are clarified in Romps [19] who claims these differences are due to small changes of water mass fluxes, higher CAPE, and lower cloud ice columns. However, it remains unclear which proxy is the most accurate to forecast the lightning future changes.
While the CTH can be diagnosed in both cloud-resolving and convective schemes, it is still the default lightning parameterization in most of the global chemistry transport models [20,21]. The most widely used CTH proxy was developed by Price and Rind [22] (hereafter PR92), which built on work by Vonnegut [23] and Williams [24]. As revealed by the comparisons between simulations and satellite observations, the PR92 works well over land but significantly underestimates the flash frequency over the ocean [25,26]. This is caused by the assumption that the relationship between the maximum updraft and flash frequency is independent of location. Luhar et al. [26] resolves this unrealistic oceanic proxy by combining Boccippio [27] with PR92 and the new results agree with previous studies. However, the CTH proxies are mostly based on the limited ground observations and few studies utilize the Lightning Imaging Sensor (LIS) on the Tropical Rainfall Measuring Mission (TRMM) satellite, which covers both land and ocean [28,29].
The geostationary (GEO) satellites can monitor convection continuously with high-resolution imagery and extensive spatial coverage [30]. It makes the estimation of CTH and cloud top vertical velocity (w) possible during convection [31,32]. Furthermore, several lightning instruments (e.g., Lightning Mapping Imager (LMI), Geostationary Lightning Mapper (GLM)) currently exist aboard these GEO satellites [33,34,35,36]. The combination of CTH, w, and lightning data provides a unique opportunity to investigate the lightning activity and CTH proxy directly, regardless of land or ocean.
The objective of this study is to present some initial results deriving the lightning activity and CTH proxy by GEO satellite measurements. Section 2 describes the datasets with the method of tracking convection and estimating w. The results are presented in Section 3, and Section 4 summarizes the conclusions.
2. Data and Methodology
2.1. Data
The GLM is an optical instrument consisting of a 1372 × 1300 pixel charge-coupled device (CCD) array, monitoring the narrow spectral band at 777.4 nm where a prominent oxygen triplet exists [35,37,38,39]. The ground-processing software filters out the non-lightning events and then the Lightning Cluster Filter Algorithm (LCFA) sorts and clusters events into groups and flashes [40,41].
An event is a single illuminated pixel that exceeds the background threshold during a single 2-ms frame. A group consists of all adjacent events within the same 2-ms frame, and its location is the radiance-weighted centroid from all the registered events. A flash comprises all groups within 16.5 km and 330 ms in the weighted euclidean distance [39,42]. These data are available in the GLM level 2 (L2) data files and are similar to the definitions used in the LIS and Optical Transient Detector (OTD) instrument processing [42,43,44]. More details of the GLM design and data are available in Goodman et al. [39]. The GLM onboard the Geostationary Operational Environmental Satellite 16 (GOES-16) is used in this study because both continental United States (CONUS) land and ocean observations are available for the CTH proxy. The GOES-16 GLM general flash detection efficiency is over 90% [45] as evaluated by the World Wide Lightning Location Network (WWLLN) [46], Earth Networks Total Lightning Network (ENTLN) [47], National Lightning Detection Network (NLDN) [48], and the Vaisala’s Global Lightning Dataset (GLD360) [49]. ENTLN is a network of ground-based sensors that continuously measure lightning stroke occurrence time, location, type (IC and CG), polarity, and peak current. The network consists of over 1800 wideband sensors that detect lightning in the range of 1 Hz–12 MHz. Groups of ENTLN pulses are clustered into a flash if they are within 700 ms and 10 km. For more about the ENTLN see Liu et al. [47].
Because the footprint sizes of GLM ranges from 8 km at nadir to 14 km near the limb, the GLM L2 data are processed into 5-min and 20-km gridded data following Thiel et al. [14], using a Python package called glmtools [50]. In glmtools, the GLM grids are produced in the GOES fixed grid coordinates, which is the standard coordinate of the Advanced Baseline Imager (ABI) observations and other geostationary satellite observations. Then, the GLM events are stored on the fixed grid coordinates and connected to flashes through the parent–child relationship information. The gridded data include three products for lightning characteristics and visualization: flash extent density (FED), minimum flash area (MFA) and total optical energy (TOE) [51]. The FED is the accumulated flash counts passing through each grid. Because the FED relies on the fraction of defined grid and event pixels, the values could be decimals. The MFA reports the minimum size of any GLM flash, and TOE is the sum of all optical energy that GLM observes within each 20 km × 20 km grid cell during a 5 min time period. Previous observations have shown that strengthening storm cores produce smaller and more frequent flashes [52,53,54].
Both GOES-16 ABI level 1 (L1) 2-km infrared brightness temperature (central wavelength: 10.3 m, TBB) and L2 10-km CTH data are resampled to 20-km, utilizing the minimum and maximum values, respectively. The height and temperature variables for estimating w are obtained from the hourly 0.25× 0.25 ECMWF atmospheric reanalysis (ERA5) data [55].
2.2. Tracking Convection
A Python library called tobac is applied to track convection continuously using the ABI TBB data. The tracking algorithm of tobac can be found in Heikenfeld et al. [56] and is briefly illustrated here with customized parameters.
First, a Gaussian filter is used to filter the original 10-km TBB data and the weighted minimum TBB features are identified by multiple thresholds, decreasing from 280 to 195 K by the step of 5 K. The multiple thresholds allow tracking of warmer cloud tops within the initial or decaying stage of convective clouds. Next, a watershed technique [57] is applied to associate area masks with each feature. Then, another Python library called trackpy [58] links the features into tracks with an upper limit on velocity (≤50 m s). The tracks are saved only when the featured TBB decreases for at least three steps (30 min). Finally, the features are filtered by the other three conditions: initial TBB > 265 K, final TBB < 240 K, and the nearest FED in 10 km > 0.
Consequently, we obtained 798,476 valid convective pixels between 1 May and 30 September 2020. Several boundaries are defined in Table 1 and Figure 1 to investigate the regional dependency. The land and ocean are classified by the 50 m Natural Earth data [59], where the coastal region is defined as a 500 m radius around the coastline.

Table 1.
Definitions of the regions used in this study.
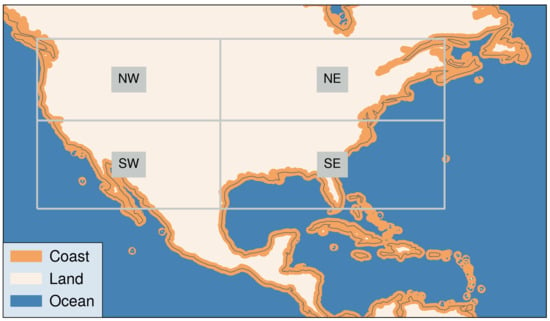
Figure 1.
The blue background stands for the ocean, while the white and orange ones represent land and coast, respectively. Only the land parts are considered into NW, NE, SW, and SE regions. See also Table 1.
2.3. Estimation of Cloud Top Vertical Velocity (w)
Following Adler and Fenn [31] and Hamada and Takayabu [32], the cloud top vertical velocity (w) is estimated as:
where represents the tracked TBB differences at each time interval ( = 5 min), and the lapse rate is calculated from the nearest hourly ERA5 temperature and height data.
Note that w is the averaged cloud top vertical velocity in the resampled 20-km pixels, instead of the maximum vertical velocity (w) of convective cores. w can be estimated by the shape, size, and velocity of updrafts [31]. However, the calculated w is highly sensitive and overshooting convection can cause small w with large w.
The whole procedure of processing and merging ABI and GLM data is summarized in Figure 2a with one representative case (Figure 2b).
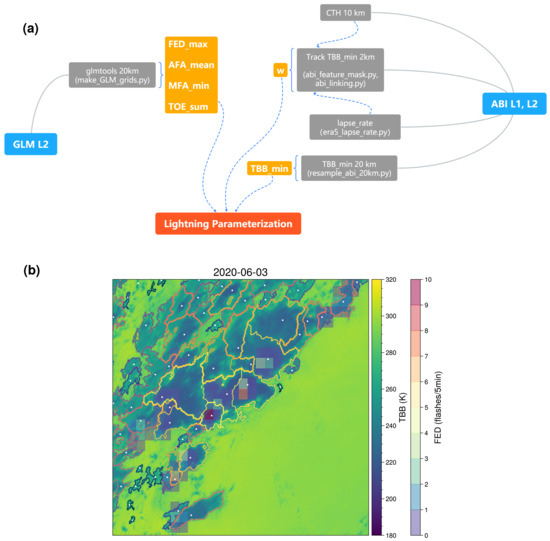
Figure 2.
(a) The workflow of processing and merging the Advanced Baseline Imager (ABI) and Geostationary Lightning Mapper (GLM) data. The blue squares are original data, the gray ones are algorithms, and the orange ones are the input products for the lightning parameterizations. (b) The illustration of tracking convection at one specific timestamp. The background is the ABI infrared brightness temperature (TBB). The colorful lines represent the convection masks and the minimum TBB in each mask is marked by white dots. The filled squares are the flash extent densities (FEDs) detected by GLM in the 5 min duration.
3. Results and Discussion
3.1. Regional Variations
The distributions of CTH, FED, MFA, and the number of cases are shown in Figure 3. Coinciding with Table 1, 70% of the lightning occurs over land and coast with a higher frequency of intense storms (Figure 3a,c). This is consistent with previous observations that there are ten times more lightning occurring over land with intense convection [60,61,62,63]. Oceanic lightning, however, exhibits a larger MFA than continental lightning (Figure 3d). This implies that an organized system is necessary for oceanic convection to produce lightning with supercooled water and graupel [64,65]. There is no systematic difference between the continental and oceanic CTH (Figure 3b). Some low CTHs exist over the ocean near Baja California, this may be due to the limited number of cases (<5) and by being located at the edge of the GOES-16 CONUS field-of-view. To ensure there are neither artifacts nor reflections off low clouds from an adjacent deeper storm, Figure 4 compares the ENTLN data with GOES observations of that storm. The low cloud with lightning (red rectangles) was a local oceanic convection, which was captured by ENTLN regardless of the offsets due to the parallax effect. Thus, this special case is valid and we keep similar convection cases in the data analysis.
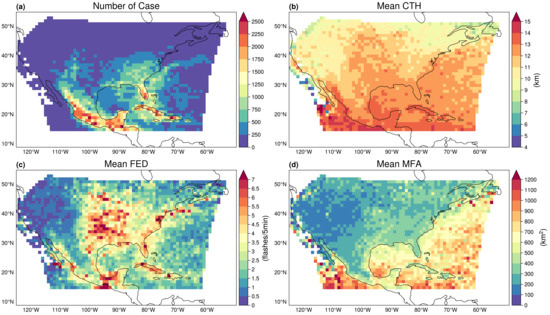
Figure 3.
The spatial distributions of the (a) case number, (b) cloud top height (CTH), (c) FED, and (d) minimum flash area (MFA) in each 1× 1 grid within the CONUS sector.
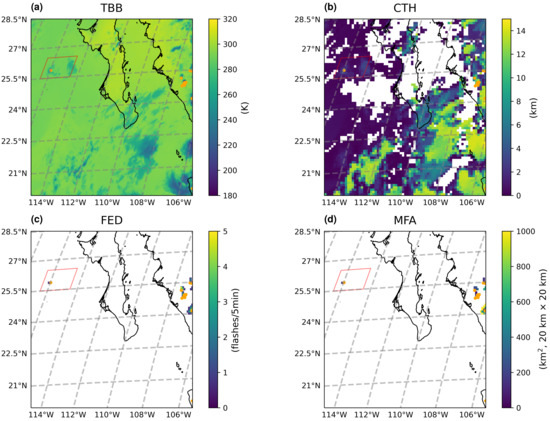
Figure 4.
The ABI and GLM gridded imageries from 00:05 to 00:10 UTC on 27 August 2020 near Baja California. (a) TBB, (b) CTH, (c) FED, and (d) MFA. The clouds annotated by the red rectangle are weak storms and the overlaid orange dots are total lightning detected by the Earth Networks Total Lightning Network (ENTLN).
3.2. ABI-GLM Relationships
Figure 5 shows the 2-D histogram of CTH and TBB, with the median values of GLM products every 200 m and 1 K. As examined in Thiel et al. [14], the higher cloud is generally accompanied by lower TBB. This inverse relationship is significant for cold clouds (TBB < 225 K), where the infrared (IR) window is sensitive to the thickness of cloud top ice layer [66]. It is consistent with Molinie and Jacobson [13], showing that the CG lightning density increases with decreasing TBB only for TBB colder than 218 K. The 7 K difference between 225 K and 218 K may be caused by the resolutions of TBB data (GOES-16 2 km vs. GOES-8 10 km) and the extra IC lightning detected by GLM (as considered here) compared with the CG lightning data used in Molinie and Jacobson [13], Boccippio et al. [67]. At the same height level, the warmer cloud has smaller FED with a larger MFA (Figure 5a,b). For high clouds (CTH > 14 km), the MFA (Figure 5b) drops to less than 200 km and the FED (Figure 5a) is greater than 6.4 flashes per 5 min with TOE (Figure 5c) larger than 1200 Femtojoule (fJ). The threshold of FED is in the range of previous FED observations [14], where the median FED values range from four to eight flashes per 5 min when the IR CTH is between 10 and 15 km. This indicates that the deep convection (CTH > 14 km) is more intense with a threefold increase in flash rates compared to weak or developing convection (CTH < 14 km). Although the 2-D histogram is similar for the mid-latitudes and tropics, the mean tropical FED is 22% larger when the TBB is smaller than 220 K and CTH is larger than 14 km. Therefore, the CTH proxy, which will be discussed in Section 3.4, should be calculated for mid-latitudes and tropics separately.
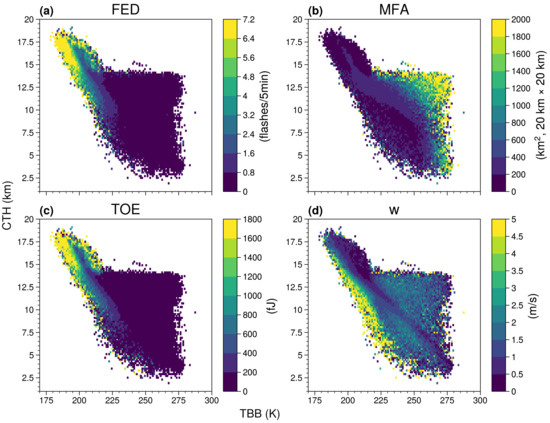
Figure 5.
The 2-D histogram of CTH and TBB with the median values of GLM and ABI products every 200 m and 1 K: (a) FED, (b) MFA, (c) total optical energy (TOE), and (d) cloud top updraft velocity (w).
Yoshida et al. [68] suggested that a stronger updraft in the thunderstorms could produce more energetic lightning due to the charge separation. However, Figure 5d implies that w begins decreasing with larger FED and TOE when the CTH is above 12 km. This coincides with the comparison of frequency distributions (Figure 6a–c,g–i), where the FED increases with higher clouds while w has already reached a maximum (∼45 m s) between 10–14 km. Both phenomena can be explained by the difference between w and w. The estimation of w using the Moderate Resolution Imaging Spectroradiometer (MODIS) IR temperature reveals that w is 1–2 km lower than the CTH and w at the cloud top is less than 6 m s when the CTH is above 12 km [69,70].
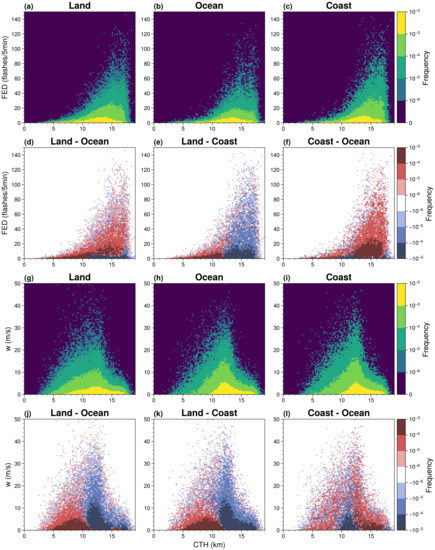
Figure 6.
(a–c) The frequency distributions of FED versus CTH every 1.5 flashes/5 min and 200 m over the continental, oceanic, and coastal regions. (g–i) Same as (a–c) but for w versus CTH every 0.5 m/s and 200 m. (d–f) The differences of frequency distributions of FED versus CTH between every two regions as annotated by the column names. (j–l) Same as (d–f) but for w versus CTH.
Furthermore, the frequency distributions of FED and w in different regimes are illustrated in Figure 6. Interestingly, the height of 12 km is also the demarcation for the differences of frequency distribution among land, ocean, and coast. Similar to the TRMM LIS observations [28], the FED is generally the lowest over the ocean (38% lower than that of land and coast) when the CTH is larger than 12 km. Forty-five percent of the continental lightning is accompanied with a CTH lower than 12 km, while 74% (67%) of the coastal (oceanic) lightning occurs with a CTH higher than 12 km (Figure 6d–f,j–l). Many previous studies have pointed out the differences of lightning activity between land and ocean. The air over land tends to have a larger Bowen ratio (sensitive heat/latent heat) and the land-ocean updraft ratio is greater than two [71]. The stronger updraft then increases the chance of collisions between ice and graupel [64,72,73]. Our study is partly consistent with previous studies until the CTH is higher than 12 km where the estimated w of oceanic convection is 25% stronger than that of continental convection (Figure 6j). This indicates that the direct relationship between CTH and w is valid for low cloud (CTH < 12 km), but careful consideration of the radius of updraft is necessary for interpreting w based on w [31,74].
3.3. Case Studies
Two cases are discussed below to investigate the detailed relationships between ABI and GLM features. Both convections are tracked by tobac for more than two hours. The features are defined following Section 2.2 and the time series of each feature are determined.
The first case on 14 June 2020 was a weak convection where the minimum TBB was 239 K at 84.9 W, 22.25 N during the tracking period (Figure 7a). The track initiates at the height of 4.07 km with w of 0.65 m s (Figure 7b). Over the proceeding 90 min, the updraft continues to increase and reaches 3.03 m s at 4.63 km, FED increases to 1.44 flashes per 5 min, TOE enhances to 1555 fJ, and MFA falls below 70 km (Figure 7b–e). While w and MFA drop rapidly once reaching the summit, the decrease of FED is one time step behind. This rapid change indicates the importance of high time resolution satellite data to observe and track thunderstorms. The changes become more complicated for the dissipation period, but the trend is obvious: smaller w with larger MFA coincides with decreasing FED and smaller TOE. Finally, the track ends at 5.06 km with 0.25 flashes per 5 min.
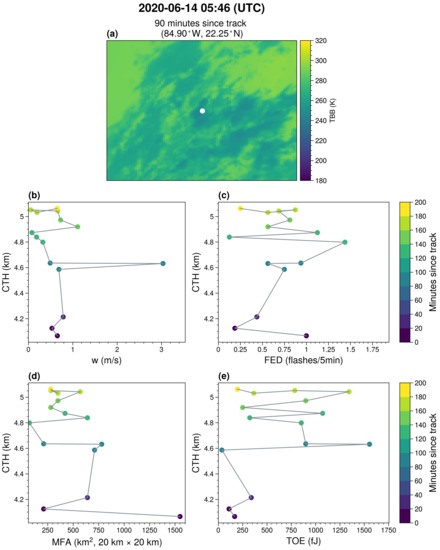
Figure 7.
(a) The TBB of weak convection occurring on 14 June 2020. The white dot corresponds to the location of minimum TBB in the mask of tracked convection. Profiles of (b) w, (c) FED, (d) MFA, and (e) TOE are plotted during the tracking period.
For the second case, a supercell developed around 86.39 W, 15.91 N on 25 June 2020 (Figure 8a). Because of the strong updraft, the track initiates at a higher level (6.74 km) and w strengthens from 2.0 m s to 13.9 m s in 5 min. At the height of 11.59 km, FED and TOE rise to 2.13 flashes per 5 min and 441 fJ, respectively, with an MFA of 150 km. After 25 min, w decreases to 1.2 m s with a small FED (1.06 flashes per 5 min), TOE (89 fJ), and large MFA (300 km). While the lightning intensifies again and the FED reaches a plateau of 8.25 flashes per 5 min at 16.37 km with 1836 fJ and 70 km, w still stays below 0.7 m s. As discussed in Section 3.2, this is consistent with the issue that the IR CTH is higher than the 20 dBZ CTH [75,76] and thus cannot represent the updraft speed of the convective core. Although w remains around 1.6 m s between 15.35 and 15.86 km, it declines to 0.2 m s during the dissipation period as indicated by the smaller FED (2 flashes per 5 min) and TOE (421 fJ) with almost invariant CTH.
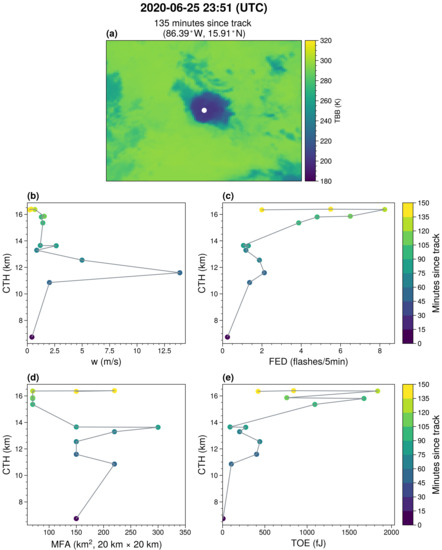
Figure 8.
Same as Figure 7 but for the severe storm on 25 June 2020. (a) The TBB field with a white dot which corresponds to the location of minimum TBB in the mask of tracked convection. Profiles of (b) w, (c) FED, (d) MFA, and (e) TOE are plotted during the tracking period.
These two case analyses reveal the variation of w and lightning activity for weak and deep convection and demonstrate the ability to track and analyze the changeable characteristics for the general relationship. It suggests that the higher time resolution observations like 1-min rapid scan mode could improve the track and capture more detailed changes of cloud structure, which influences the lightning density and optical energy.
3.4. CTH Proxy
Because the estimated w at the IR cloud top could be smaller than in the convection core [32], the CTH proxy based on the correlation between w and CTH is not suitable for our study, which relies on cloud top w. Instead, the CTH proxy is derived by CTH and FED directly without the intermediate variable w.
Following Price and Rind [22] and Luhar et al. [26], the empirical relationship between FED and CTH is assumed as:
Equation (2) is fitted directly to FED vs. CTH data, in which the FED is averaged every 1 km in CTH. The standard deviation of the bin values is smaller than 1.5 flashes/5 min for CTH lower than 9 km and it ranges from 11 flashes/5 min to 30 flashes/ 5 min when CTH increases from 10 km to 20 km. In Figure 9, a similar overall trend is shown for the land, ocean, and coast: taller convection tends to have higher FED.
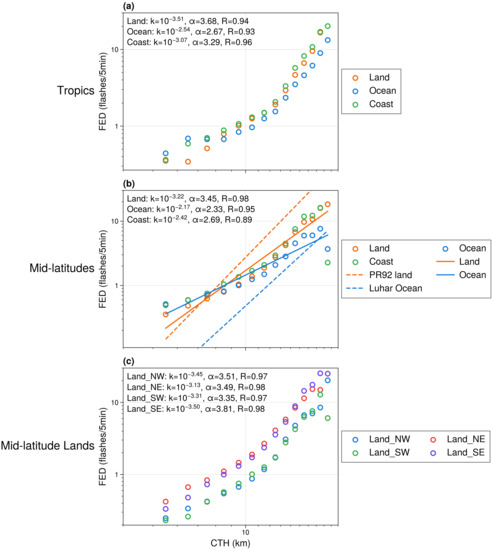
Figure 9.
Relationships between FED and CTH in the (a) tropics, (b) mid-latitudes, and (c) mid-latitude lands as defined in Table 1 and Figure 1. The solid lines in panel (b) are the best fits of this study data, while the dashed lines are from the empirical relationships in Price and Rind [22] and Luhar et al. [26], but compiled by the CTH data in this study. The coefficients and exponents are annotated in the upper left corner.
Similar to Figure 5a and Ushio et al. [28], there is a turning point at the height of 12 km, where the exponent () is larger than 1.9. Two possible factors could explain this phenomenon and lead to the underestimation of exponent: (1) the optical lightning emission is blocked by dense clouds [77]; and (2) the higher IR CTH compared with 20 dBZ CTH. The solution of missed lightning due to the first factor is to adjust the GLM FED by the detection efficiency relative to the clustered ENTLN data [45,78] in future work. The second factor has been studied using the TRMM data [75,76] and the results indicate that the distance between IR CTH and 20 dBZ CTH ranges from 2.7 km to 6 km. Here, the TRMM precipitation feature database (details in the work of Liu et al. [79]) is applied over the CONUS (Figure 10). The difference is smaller than 1.5 km when the IR CTH is lower than 10 km. It increases continuously with a higher IR CTH, and finally reaches 5 km when the IR CTH is 20 km, indicating that the mean FED values in Figure 9 should be larger, especially for bins with CTH > 10 km. This can be fixed by combining GLM observations with the Dual-frequency Precipitation Radar (DPR) onboard the Global Precipitation Measurement (GPM) once the collection of data is large enough. Note that both solutions need accurate parallax corrections of satellite data in future work, otherwise the features would be mismatched [50].
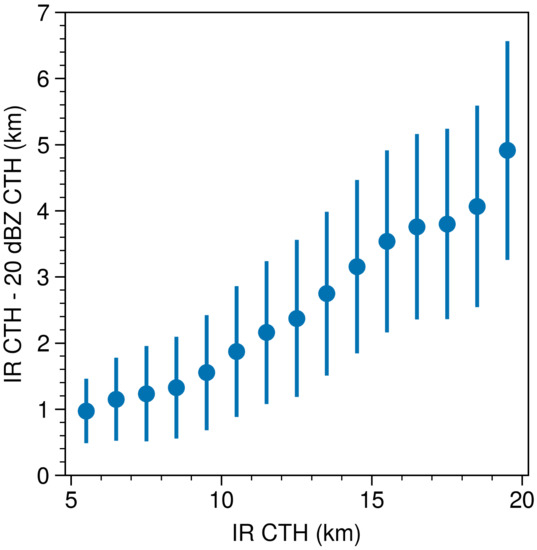
Figure 10.
The difference between infrared (IR) CTH and 20 dBZ CTH versus the IR CTH. Both CTH data are from the Tropical Rainfall Measuring Mission (TRMM) precipitation feature database [79]. The dots are the mean values in every 1 km IR CTH and the error bars represent the standard deviation.
Although a polynomial regression would better fit the scatter data, we applied a linear regression to Figure 9 for the comparison with previous studies. Figure 9a,b show that the flash rates in the tropics are larger resulting in larger exponent values when compared with those in the mid-latitudes. Specifically, the is 3.68 (3.45), 2.67 (2.33), and 3.29 (2.69) over land, ocean, and coast in the tropics (mid-latitudes), respectively. Unexpectedly, the oceanic lightning does not consist of the smallest FED when the CTH is lower than 8 km. This has not ever been demonstrated in previous TRMM data analysis and ground observations, due to the lack of lightning with low cloud data over the ocean [26,28]. Figure 11 presents the histogram of case numbers with 1 km CTH bins and indicates that the GLM can observe enough lightning cases over ocean. Because the non-inductive charging process is temperature sensitive, and the TBB only provides the temperature at the cloud top, it is important to utilize more soundings and high resolution simulations to better understand why the oceanic lightning with low cloud has a higher FED when compared with the continental and coastal lightning. Additional research is also required to determine the influence of instrument observing artifacts [35,80] on the oceanic FED.
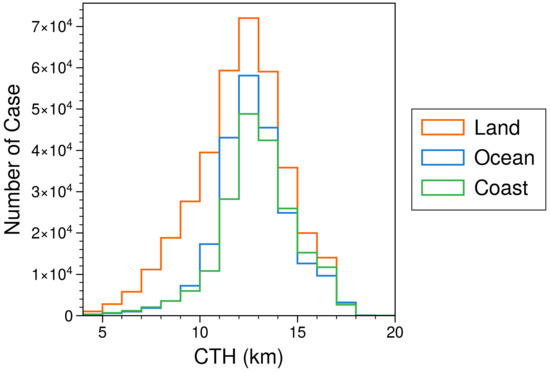
Figure 11.
The histograms between case numbers and CTHs every 1 km over land (orange), ocean (blue), and coast (green).
Because the lightning data used in the PR92 parameterization were in the mid-latitude, we then compare the linear regression results in Figure 9b. The exponents over land and ocean are 3.45 and 2.33, which are smaller than 4.9 and 4.38 in PR92 and Luhar et al. [26], respectively. While the exponents will be larger and probably close to prior studies if the two possible factors mentioned above are fixed, the differences of coefficient will still exist and more studies over ocean are needed. To explore the lightning properties which differ from region to region, the mid-latitude lands are divided into four regions: NE, SE, NW, and SW (Table 1 and Figure 1). The mean value (3.65) of NE and SE regions is higher than that (3.43) of NW and SW regions (Figure 9c). In contrast, Molinie and Jacobson [13] suggests that the NE and SE regions tend to have a lower FED compared with the NW and SW regions. The opposite conclusion is probably due to the reduced detection efficiencies at lower viewing angle elevations (<40) of NW and SW and needs to be examined by future works [45].
4. Conclusions
This study used GOES-16 satellite observations to examine three specific problems: (1) the fundamental relationships between the ABI cloud properties (CTH, TBB) and GLM lightning products (FED, MFA, TOE); (2) the differences of these relationships over the continental, oceanic, and coastal regions; and (3) the developments of lightning parameterization based on the geostationary satellite data. The GOES-16 ABI observations have been used to track thunderstorms and estimate the cloud top updraft velocity (w) from 1 May to 30 September 2020. The tracks are matched with GLM L2 products as the 5-min and 20-km merged products.
The combination of ABI and GLM data implies that the continental and coastal lightning is more intense (larger FED) than the oceanic lightning, which is more organized (larger MFA). Consistent with previous studies, storms with higher cloud tops are more powerful with larger flash rates and smaller flash sizes. However, the direct relationship between w and CTH is only valid for low clouds (CTH < 12 km), because w is the IR cloud top ascent rate instead of w, which is in the convective core. These statistical results are more closely examined using two case studies, one weak convection and another severe storm.
Therefore, a relationship between FED and IR CTH is derived independently of w and our results show that there is variation with location. Although the oceanic FED with a CTH higher than 12 km is 38% smaller than both continental and coastal FED, it contains the largest FED when the CTH is lower than 8 km. This suggests that a careful consideration of underlying surface type is essential for better lightning parameterizations and analysis of climate changing effects.
New satellites with improved instruments and temporal coverage will help refine the global lightning parameterizations. Specifically, the GLM, LMI, and Meteosat Third Generation (MTG) Lightning Imager (LI) [81] will provide almost global lightning distributions with high time resolution. These data can be combined with the GPM DPR, which detects the vertical cloud profile, to obtain more realistic lightning parameterizations instead of the single CTH parameter applied in this study.
Author Contributions
Conceptualization, X.Z., and Y.Y.; investigation, X.Z., Y.Y. and X.K.; methodology, X.Z. and Y.Y.; software, X.Z., J.K. and Y.L.; data curation, X.Z. and J.L.L.; writing—original draft preparation, X.Z.; writing—review and editing, X.Z., Y.Y., J.K. and J.L.L.; visualization, X.Z., C.H. and D.J.; funding acquisition, Y.Y. and J.C. All authors have read and agreed to the published version of the manuscript.
Funding
This research was funded by the National Natural Science Foundation of China (grant nos. 91644224 and 42075067) and Postgraduate Research & Practice Innovation Program of Jiangsu Province (KYCX20_0922).
Institutional Review Board Statement
Not applicable.
Informed Consent Statement
Not applicable.
Data Availability Statement
The merged ABI and GLM products are available at https://doi.org/10.5281/zenodo.5179871 [82]. The tracking algorithm and plotting scripts can be obtained from https://doi.org/10.5281/zenodo.5179927 [83]. The GOES-16 ABI and GLM data can be accessed from the Amazon Web Services (https://registry.opendata.aws/noaa-goes/), Google Cloud (https://console.cloud.google.com/marketplace/partners/noaa-public), and NOAA CLASS service (https://www.class.noaa.gov/). The TRMM precipitation database can be downloaded from http://atmos.tamucc.edu/trmm/data/trmm/v7/rpf_4pix/. The last accessed date is 21 September 2021 for all data.
Acknowledgments
We thank Earth Networks for providing the Earth Networks Total Lightning Network (ENTLN) datasets. We appreciate the discussions with Eric C. Bruning, Kevin C. Thiel, Scott Rudlosky, and Michael Peterson for the GLM data processing. We acknowledge Max Heikenfeld and William Jones for helping us develop the tracking algorithm. Finally, we thank all contributors of Python packages used in this paper, especially ProPlot and Satpy [84,85,86].
Conflicts of Interest
The authors declare no conflict of interest.
References
- Blakeslee, R.J.; Lang, T.J.; Koshak, W.J.; Buechler, D.; Gatlin, P.; Mach, D.M.; Stano, G.T.; Virts, K.S.; Walker, T.D.; Cecil, D.J.; et al. Three Years of the Lightning Imaging Sensor Onboard the International Space Station: Expanded Global Coverage and Enhanced Applications. J. Geophys. Res. Atmos. 2020, 125, e2020JD032918. [Google Scholar] [CrossRef]
- Aich, V.; Holzworth, R.; Goodman, S.; Kuleshov, Y.; Price, C.; Williams, E. Lightning: A New Essential Climate Variable. Eos 2018, 99. [Google Scholar] [CrossRef]
- Price, C. Will a Drier Climate Result in More Lightning? Atmos. Res. 2009, 91, 479–484. [Google Scholar] [CrossRef]
- Price, C.; Yair, Y.; Mugnai, A.; Lagouvardos, K.; Llasat, M.; Michaelides, S.; Dayan, U.; Dietrich, S.; Galanti, E.; Garrote, L.; et al. The FLASH Project: Using Lightning Data to Better Understand and Predict Flash Floods. Environ. Sci. Policy 2011, 14, 898–911. [Google Scholar] [CrossRef] [Green Version]
- Harel, M.; Price, C. Thunderstorm Trends over Africa. J. Clim. 2020, 33, 2741–2755. [Google Scholar] [CrossRef]
- Etten-Bohm, M.; Yang, J.; Schumacher, C.; Jun, M. Evaluating the Relationship Between Lightning and the Large-Scale Environment and Its Use for Lightning Prediction in Global Climate Models. J. Geophys. Res. Atmos. 2021, 126, e2020JD033990. [Google Scholar] [CrossRef]
- Yair, Y. Lightning Hazards to Human Societies in a Changing Climate. Environ. Res. Lett. 2018, 13, 123002. [Google Scholar] [CrossRef]
- Schumann, U.; Huntrieser, H. The Global Lightning-Induced Nitrogen Oxides Source. Atmos. Chem. Phys. 2007, 7, 3823–3907. [Google Scholar] [CrossRef] [Green Version]
- Pickering, K.E.; Thompson, A.M.; Tao, W.K.; Kucsera, T.L. Upper Tropospheric Ozone Production Following Mesoscale Convection during STEP/EMEX. J. Geophys. Res. Atmos. 1993, 98, 8737–8749. [Google Scholar] [CrossRef]
- Morris, G.A.; Thompson, A.M.; Pickering, K.E.; Chen, S.; Bucsela, E.J.; Kucera, P.A. Observations of Ozone Production in a Dissipating Tropical Convective Cell during TC4. Atmos. Chem. Phys. 2010, 10, 11189–11208. [Google Scholar] [CrossRef] [Green Version]
- Huntrieser, H.; Lichtenstern, M.; Scheibe, M.; Aufmhoff, H.; Schlager, H.; Pucik, T.; Minikin, A.; Weinzierl, B.; Heimerl, K.; Fütterer, D.; et al. On the Origin of Pronounced O3 Gradients in the Thunderstorm Outflow Region during DC3. J. Geophys. Res. Atmos. 2016, 121, 6600–6637. [Google Scholar] [CrossRef] [Green Version]
- Myhre, G.; Shindell, D.; Bréon, F.M.; Collins, W.; Fuglestvedt, J.; Huang, J.; Koch, D.; Lamarque, J.F.; Lee, D.; Mendoza, B. Climate Change 2013: The Physical Science Basis. Contribution of Working Group I to the Fifth Assessment Report of the Intergovernmental Panel on Climate Change; Tignor, M.K., Allen, S.K., Boschung, J., Nauels, A., Xia, Y., Bex, V., Midgley, P.M., Eds.; Cambridge University Press: Cambridge, UK; New York, NY, USA, 2013. [Google Scholar]
- Molinie, G.; Jacobson, A.R. Cloud-to-Ground Lightning and Cloud Top Brightness Temperature over the Contiguous United States. J. Geophys. Res. Atmos. 2004, 109. [Google Scholar] [CrossRef]
- Thiel, K.C.; Calhoun, K.M.; Reinhart, A.E.; MacGorman, D.R. GLM and ABI Characteristics of Severe and Convective Storms. J. Geophys. Res. Atmos. 2020, 125, e2020JD032858. [Google Scholar] [CrossRef]
- Tessendorf, S.A.; Miller, L.J.; Wiens, K.C.; Rutledge, S.A. The 29 June 2000 Supercell Observed during STEPS. Part I: Kinematics and Microphysics. J. Atmos. Sci. 2005, 62, 4127–4150. [Google Scholar] [CrossRef]
- Deierling, W.; Petersen, W.A. Total Lightning Activity as an Indicator of Updraft Characteristics. J. Geophys. Res. Atmos. 2008, 113. [Google Scholar] [CrossRef] [Green Version]
- Romps, D.M.; Seeley, J.T.; Vollaro, D.; Molinari, J. Projected Increase in Lightning Strikes in the United States Due to Global Warming. Science 2014, 346, 851–854. [Google Scholar] [CrossRef]
- Finney, D.L.; Doherty, R.M.; Wild, O.; Stevenson, D.S.; MacKenzie, I.A.; Blyth, A.M. A Projected Decrease in Lightning under Climate Change. Nat. Clim. Chang. 2018, 8, 210–213. [Google Scholar] [CrossRef]
- Romps, D.M. Evaluating the Future of Lightning in Cloud-resolving Models. Geophys. Res. Lett. 2019, 46, 14863–14871. [Google Scholar] [CrossRef]
- Hudman, R.C.; Jacob, D.J.; Turquety, S.; Leibensperger, E.M.; Murray, L.T.; Wu, S.; Gilliland, A.B.; Avery, M.; Bertram, T.H.; Brune, W.; et al. Surface and Lightning Sources of Nitrogen Oxides over the United States: Magnitudes, Chemical Evolution, and Outflow. J. Geophys. Res. Atmos. 2007, 112. [Google Scholar] [CrossRef] [Green Version]
- Gressent, A.; Sauvage, B.; Cariolle, D.; Evans, M.; Leriche, M.; Mari, C.; Thouret, V. Modeling Lightning-NOx Chemistry on a Sub-Grid Scale in a Global Chemical Transport Model. Atmos. Chem. Phys. 2016, 16, 5867–5889. [Google Scholar] [CrossRef] [Green Version]
- Price, C.; Rind, D. A Simple Lightning Parameterization for Calculating Global Lightning Distributions. J. Geophys. Res. Atmos. 1992, 97, 9919–9933. [Google Scholar] [CrossRef]
- Vonnegut, B. Some Facts and Speculations Concerning the Origin and Role of Thunderstorm Electricity. In Severe Local Storms; Atlas, D., Booker, D.R., Byers, H., Douglas, R.H., Fujita, T., House, D.C., Ludlum, F.H., Malkus, J.S., Newton, C.W., Ogura, Y., et al., Eds.; American Meteorological Society: Boston, MA, USA, 1963; pp. 224–241. [Google Scholar] [CrossRef]
- Williams, E.R. Large-Scale Charge Separation in Thunderclouds. J. Geophys. Res. Atmos. 1985, 90, 6013. [Google Scholar] [CrossRef]
- Clark, S.K.; Ward, D.S.; Mahowald, N.M. Parameterization-Based Uncertainty in Future Lightning Flash Density. Geophys. Res. Lett. 2017, 44, 2893–2901. [Google Scholar] [CrossRef]
- Luhar, A.K.; Galbally, I.E.; Woodhouse, M.T.; Abraham, N.L. Assessing and Improving Cloud-Height-Based Parameterisations of Global Lightning Flash Rate, and Their Impact on Lightning-Produced NOx and Tropospheric Composition in a Chemistry–Climate Model. Atmos. Chem. Phys. 2021, 21, 7053–7082. [Google Scholar] [CrossRef]
- Boccippio, D.J. Lightning Scaling Relations Revisited. J. Atmos. Sci. 2002, 59, 1086–1104. [Google Scholar] [CrossRef]
- Ushio, T.; Heckman, S.J.; Boccippio, D.J.; Christian, H.J.; Kawasaki, Z.I. A Survey of Thunderstorm Flash Rates Compared to Cloud Top Height Using TRMM Satellite Data. J. Geophys. Res. Atmos. 2001, 106, 24089–24095. [Google Scholar] [CrossRef]
- Futyan, J.M.; Genio, A.D.D. Relationships between Lightning and Properties of Convective Cloud Clusters. Geophys. Res. Lett. 2007, 34. [Google Scholar] [CrossRef] [Green Version]
- Sieglaff, J.M.; Cronce, L.M.; Feltz, W.F.; Bedka, K.M.; Pavolonis, M.J.; Heidinger, A.K. Nowcasting Convective Storm Initiation Using Satellite-Based Box-Averaged Cloud-Top Cooling and Cloud-Type Trends. J. Appl. Meteor. Climatol. 2011, 50, 110–126. [Google Scholar] [CrossRef]
- Adler, R.F.; Fenn, D.D. Thunderstorm Vertical Velocities Estimated from Satellite Data. J. Atmos. Sci. 1979, 36, 1747–1754. [Google Scholar] [CrossRef] [Green Version]
- Hamada, A.; Takayabu, Y.N. Convective Cloud Top Vertical Velocity Estimated from Geostationary Satellite Rapid-Scan Measurements. Geophys. Res. Lett. 2016, 43, 5435–5441. [Google Scholar] [CrossRef] [Green Version]
- Yang, J.; Zhang, Z.; Wei, C.; Lu, F.; Guo, Q. Introducing the New Generation of Chinese Geostationary Weather Satellites, Fengyun-4. Bull. Amer. Meteor. Soc. 2017, 98, 1637–1658. [Google Scholar] [CrossRef]
- Hui, W.; Zhang, W.; Lyu, W.; Li, P. Preliminary Observations from the China Fengyun-4A Lightning Mapping Imager and Its Optical Radiation Characteristics. Remote Sens. 2020, 12, 2622. [Google Scholar] [CrossRef]
- Rudlosky, S.D.; Goodman, S.J.; Virts, K.S.; Bruning, E.C. Initial Geostationary Lightning Mapper Observations. Geophys. Res. Lett. 2019, 46, 1097–1104. [Google Scholar] [CrossRef]
- Cao, D.; Lu, F.; Zhang, X.; Yang, J. Lightning Activity Observed by the FengYun-4A Lightning Mapping Imager. Remote Sens. 2021, 13, 3013. [Google Scholar] [CrossRef]
- Orville, R.E.; Henderson, R.W. Absolute Spectral Irradiance Measurements of Lightning from 375 to 880 Nm. J. Atmos. Sci. 1984, 41, 3180–3187. [Google Scholar] [CrossRef] [Green Version]
- Goodman, S.J.; Christian, H.J.; Rust, W.D. A Comparison of the Optical Pulse Characteristics of Intracloud and Cloud-to-Ground Lightning as Observed above Clouds. J. Appl. Meteor. 1988, 27, 1369–1381. [Google Scholar] [CrossRef] [Green Version]
- Goodman, S.J.; Blakeslee, R.J.; Koshak, W.J.; Mach, D.; Bailey, J.; Buechler, D.; Carey, L.; Schultz, C.; Bateman, M.; McCaul, E., Jr.; et al. The GOES-R Geostationary Lightning Mapper (GLM). Atmos. Res. 2013, 125-126, 34–49. [Google Scholar] [CrossRef] [Green Version]
- Edgington, S.; Tillier, C.; Anderson, M. Design, Calibration, and on-Orbit Testing of the Geostationary Lightning Mapper on the GOES-R Series Weather Satellite. In Proceedings of the International Conference on Space Optics—ICSO, Chania, Greece, 9–12 October 2018; Karafolas, N., Sodnik, Z., Cugny, B., Eds.; SPIE: Chania, Greece, 2019; p. 143. [Google Scholar] [CrossRef] [Green Version]
- Mach, D.M. Geostationary Lightning Mapper Clustering Algorithm Stability. J. Geophys. Res. Atmos. 2020, 125, e2019JD031900. [Google Scholar] [CrossRef]
- Mach, D.M.; Christian, H.J.; Blakeslee, R.J.; Boccippio, D.J.; Goodman, S.J.; Boeck, W.L. Performance Assessment of the Optical Transient Detector and Lightning Imaging Sensor. J. Geophys. Res. Atmos. 2007, 112, D09210. [Google Scholar] [CrossRef]
- Christian, H.; Blakeslee, R.; Goodman, S.; Mach, D. Algorithm Theoretical Basis Document (ATBD) for the Lightning Imaging Sensor (LIS); NASA/Marshall Space Flight Center: Huntsville, AL, USA, 2000; 53p. [Google Scholar]
- Goodman, S.; Mach, D.; Koshak, W.; Blakeslee, R. Algorithm Theoretical Basis Document (ATBD) for the GLM Lightning Cluster-Filter Algorithm; NESDIS Center for Satellite Applications and Research v2.0; NOAA: Washington, DC, USA, 2010. [Google Scholar]
- Bateman, M.; Mach, D.; Stock, M. Further Investigation into Detection Efficiency & False Alarm Rate for the Geostationary Lightning Mappers aboard GOES-16 and GOES-17. Earth. Space. Sci. 2020, 8, e2020EA001237. [Google Scholar] [CrossRef]
- Rodger, C.J.; Brundell, J.B.; Dowden, R.L.; Thomson, N.R. Location Accuracy of Long Distance VLF Lightning Locationnetwork. Ann. Geophys. 2004, 22, 747–758. [Google Scholar] [CrossRef] [Green Version]
- Liu, C.; Sloop, C.; Heckman, S. Application of Lightning in Predicting High Impact Weather. In Proceedings of the WMO Technical Conference on Meteorological and Environmental Instruments and Methods of Observation, Saint Petersburg, Russia, 7 July 2014; Volume 9. [Google Scholar]
- Cummins, K.L.; Murphy, M.J. An Overview of Lightning Locating Systems: History, Techniques, and Data Uses, with an In-Depth Look at the U.S. NLDN. IEEE Trans. Electromagn. Compat. 2009, 51, 499–518. [Google Scholar] [CrossRef]
- Murphy, M.J.; Said, R.K. Comparisons of Lightning Rates and Properties from the U.S. National Lightning Detection Network (NLDN) and GLD360 With GOES-16 Geostationary Lightning Mapper and Advanced Baseline Imager Data. J. Geophys. Res. Atmos. 2020, 125, e2019JD031172. [Google Scholar] [CrossRef]
- Bruning, E.C.; Tillier, C.E.; Edgington, S.F.; Rudlosky, S.D.; Zajic, J.; Gravelle, C.; Foster, M.; Calhoun, K.M.; Campbell, P.A.; Stano, G.T.; et al. Meteorological Imagery for the Geostationary Lightning Mapper. J. Geophys. Res. Atmos. 2019, 124, 14285–14309. [Google Scholar] [CrossRef]
- Bruning, E. Deeplycloudy/Glmtools: Glmtools Release to Accompany Publication. Zenodo 2019. [Google Scholar] [CrossRef]
- Calhoun, K.M.; MacGorman, D.R.; Ziegler, C.L.; Biggerstaff, M.I. Evolution of Lightning Activity and Storm Charge Relative to Dual-Doppler Analysis of a High-Precipitation Supercell Storm. Mon. Wea. Rev. 2013, 141, 2199–2223. [Google Scholar] [CrossRef]
- Mecikalski, R.M.; Bain, A.L.; Carey, L.D. Radar and Lightning Observations of Deep Moist Convection across Northern Alabama during DC3: 21 May 2012. Mon. Wea. Rev. 2015, 143, 2774–2794. [Google Scholar] [CrossRef]
- Rudlosky, S.D.; Goodman, S.J.; Virts, K.S. Lightning Detection: GOES-R Series Geostationary Lightning Mapper. In The GOES-R Series; Elsevier: Amsterdam, The Netherlands, 2020; pp. 193–202. [Google Scholar] [CrossRef]
- Hersbach, H.; Bell, B.; Berrisford, P.; Hirahara, S.; Horányi, A.; Muñoz-Sabater, J.; Nicolas, J.; Peubey, C.; Radu, R.; Schepers, D.; et al. The ERA5 Global Reanalysis. Q. J. R. Meteorol. Soc. 2020, 146, 1999–2049. [Google Scholar] [CrossRef]
- Heikenfeld, M.; Marinescu, P.J.; Christensen, M.; Watson-Parris, D.; Senf, F.; van den Heever, S.C.; Stier, P. Tobac 1.2: Towards a Flexible Framework for Tracking and Analysis of Clouds in Diverse Datasets. Geosci. Model Dev. 2019, 12, 4551–4570. [Google Scholar] [CrossRef] [Green Version]
- Soille, P.J.; Ansoult, M.M. Automated Basin Delineation from Digital Elevation Models Using Mathematical Morphology. Signal Process. 1990, 20, 171–182. [Google Scholar] [CrossRef]
- Allan, D.B.; Caswell, T.; Keim, N.C.; van der Wel, C.M.; Verweij, R.W. Soft-Matter/Trackpy: Trackpy v0.5.0. Zenodo, 2021. [Google Scholar] [CrossRef]
- Kelso, N.V. Nvkelso/Natural-Earth-Vector. 2021. Available online: https://www.naturalearthdata.com/downloads/ (accessed on 27 September 2021).
- Christian, H.J.; Blakeslee, R.J.; Boccippio, D.J.; Boeck, W.L.; Buechler, D.E.; Driscoll, K.T.; Goodman, S.J.; Hall, J.M.; Koshak, W.J.; Mach, D.M.; et al. Global Frequency and Distribution of Lightning as Observed from Space by the Optical Transient Detector. J. Geophys. Res. Atmos. 2003, 108, ACL-4-1–ACL-4-15. [Google Scholar] [CrossRef]
- Ramesh Kumar, P.; Kamra, A.K. Land–Sea Contrast in Lightning Activity over the Sea and Peninsular Regions of South/Southeast Asia. Atmos. Res. 2012, 118, 52–67. [Google Scholar] [CrossRef]
- Kaplan, J.O.; Lau, K.H.K. The WGLC Global Gridded Lightning Climatology and Time Series. Earth Syst. Sci. Data 2021, 13, 3219–3237. [Google Scholar] [CrossRef]
- Peterson, M.; Mach, D.; Buechler, D. A Global LIS/OTD Climatology of Lightning Flash Extent Density. J. Geophys. Res. Atmos. 2021, 126, e2020JD033885. [Google Scholar] [CrossRef]
- Zipser, E.J.; Lutz, K.R. The Vertical Profile of Radar Reflectivity of Convective Cells: A Strong Indicator of Storm Intensity and Lightning Probability? Mon. Wea. Rev. 1994, 122, 1751–1759. [Google Scholar] [CrossRef] [Green Version]
- Bang, S.D.; Zipser, E.J. Differences in Size Spectra of Electrified Storms over Land and Ocean. Geophys. Res. Lett. 2015, 42, 6844–6851. [Google Scholar] [CrossRef]
- Aumann, H.H.; DeSouza-Machado, S.G.; Behrangi, A. Deep Convective Clouds at the Tropopause. Atmos. Chem. Phys. 2011, 11, 1167–1176. [Google Scholar] [CrossRef] [Green Version]
- Boccippio, D.J.; Cummins, K.L.; Christian, H.J.; Goodman, S.J. Combined Satellite- and Surface-Based Estimation of the Intracloud–Cloud-to-Ground Lightning Ratio over the Continental United States. Mon. Weather Rev. 2001, 129, 108–122. [Google Scholar] [CrossRef]
- Yoshida, S.; Morimoto, T.; Ushio, T.; Kawasaki, Z. A Fifth-Power Relationship for Lightning Activity from Tropical Rainfall Measuring Mission Satellite Observations. J. Geophys. Res. Atmos. 2009, 114. [Google Scholar] [CrossRef]
- Liu, C.Y.; Chiu, C.H.; Lin, P.H.; Min, M. Comparison of Cloud-Top Property Retrievals From Advanced Himawari Imager, MODIS, CloudSat/CPR, CALIPSO/CALIOP, and Radiosonde. J. Geophys. Res. Atmos. 2020, 125, e2020JD032683. [Google Scholar] [CrossRef]
- Jeyaratnam, J.; Luo, Z.J.; Giangrande, S.E.; Wang, D.; Masunaga, H. A Satellite-Based Estimate of Convective Vertical Velocity and Convective Mass Flux: Global Survey and Comparison With Radar Wind Profiler Observations. Geophys. Res. Lett. 2021, 48, e2020GL090675. [Google Scholar] [CrossRef]
- Williams, E.; Stanfill, S. The Physical Origin of the Land–Ocean Contrast in Lightning Activity. Comptes Rendus Physique 2002, 3, 1277–1292. [Google Scholar] [CrossRef]
- Takahashi, T. Riming Electrification as a Charge Generation Mechanism in Thunderstorms. J. Atmos. Sci. 1978, 35, 1536–1548. [Google Scholar] [CrossRef]
- Zipser, E.J.; LeMone, M.A. Cumulonimbus Vertical Velocity Events in GATE. Part II: Synthesis and Model Core Structure. J. Atmos. Sci. 1980, 37, 2458–2469. [Google Scholar] [CrossRef] [Green Version]
- Romps, D.M.; Charn, A.B. Sticky Thermals: Evidence for a Dominant Balance between Buoyancy and Drag in Cloud Updrafts. J. Atmos. Sci. 2015, 72, 2890–2901. [Google Scholar] [CrossRef]
- Liu, C.; Zipser, E.J.; Nesbitt, S.W. Global Distribution of Tropical Deep Convection: Different Perspectives from TRMM Infrared and Radar Data. J. Climate 2007, 20, 489–503. [Google Scholar] [CrossRef]
- Song, H.J.; Kim, S.; Roh, S.; Lee, H. Difference Between Cloud Top Height and Storm Height for Heavy Rainfall Using TRMM Measurements. J. Meteorol. Soc. 2020, 98, 901–914. [Google Scholar] [CrossRef]
- Peterson, M.; Rudlosky, S.; Zhang, D. Changes to the Appearance of Optical Lightning Flashes Observed From Space According to Thunderstorm Organization and Structure. J. Geophys. Res. Atmos. 2020, 125, e2019JD031087. [Google Scholar] [CrossRef] [PubMed]
- Marchand, M.; Hilburn, K.; Miller, S.D. Geostationary Lightning Mapper and Earth Networks Lightning Detection Over the Contiguous United States and Dependence on Flash Characteristics. J. Geophys. Res. Atmos. 2019, 124, 11552–11567. [Google Scholar] [CrossRef]
- Liu, C.; Zipser, E.J.; Cecil, D.J.; Nesbitt, S.W.; Sherwood, S. A Cloud and Precipitation Feature Database from Nine Years of TRMM Observations. J. Appl. Meteor. Climatol. 2008, 47, 2712–2728. [Google Scholar] [CrossRef]
- Bateman, M.; Mach, D. Preliminary Detection Efficiency and False Alarm Rate Assessment of the Geostationary Lightning Mapper on the GOES-16 Satellite. J. Appl. Remote. Sens. 2020, 14, 032406. [Google Scholar] [CrossRef]
- Holmlund, K.; Grandell, J.; Schmetz, J.; Stuhlmann, R.; Bojkov, B.; Munro, R.; Lekouara, M.; Coppens, D.; Viticchie, B.; August, T.; et al. Meteosat Third Generation (MTG): Continuation and Innovation of Observations from Geostationary Orbit. Bull. Amer. Meteor. Soc. 2021, 102, E990–E1015. [Google Scholar] [CrossRef]
- Zhang, X. Xin_RS_2021_GOES_lightning_data. Zenodo, 2021. [Google Scholar] [CrossRef]
- Zhang, X. Zxdawn/Xin_RS_2021_GOES_lightning: Version 1.0. Zenodo, 2021. [Google Scholar] [CrossRef]
- Davis, L.L.B. ProPlot. Zenodo, 2021. [Google Scholar] [CrossRef]
- Raspaud, M.; Hoese, D.; Dybbroe, A.; Lahtinen, P.; Devasthale, A.; Itkin, M.; Hamann, U.; Rasmussen, L.Ø.; Neilsen, E.S.; Leppelt, T.; et al. PyTroll: An Open-Source, Community-Driven Python Framework to Process Earth Observation Satellite Data. Bull. Amer. Meteor. Soc. 2018, 99, 1329–1336. [Google Scholar] [CrossRef] [Green Version]
- Raspaud, M.; Hoese, D.; Lahtinen, P.; Finkensieper, S.; Holl, G.; Dybbroe, A.; Proud, S.; Meraner, A.; Zhang, X.; Joro, S.; et al. Pytroll/Satpy: Version 0.25.1. Zenodo 2021. [Google Scholar] [CrossRef]
Publisher’s Note: MDPI stays neutral with regard to jurisdictional claims in published maps and institutional affiliations. |
© 2021 by the authors. Licensee MDPI, Basel, Switzerland. This article is an open access article distributed under the terms and conditions of the Creative Commons Attribution (CC BY) license (https://creativecommons.org/licenses/by/4.0/).