Article

MTRC-Tolerated Multi-Target Imaging Based on 3D Hough Transform and Non-Equal Sampling Sparse Solution

College of Electronic Science and Technology, National University of Defense Technology, No. 109 Deya Road, Changsha 410073, China
*
Author to whom correspondence should be addressed.
Remote Sens. 2021, 13(19), 3817; https://doi.org/10.3390/rs13193817
Submission received: 31 August 2021 / Revised: 17 September 2021 / Accepted: 20 September 2021 / Published: 24 September 2021
(This article belongs to the Section Remote Sensing Image Processing)

Abstract

:
Distributed radar array brings several new forthcoming advantages in aerospace target detection and imaging. The two-dimensional distributed array avoids the imperfect motion compensation in coherent processing along slow time and can achieve single snapshot 3D imaging. Some difficulties exist in the 3D imaging processing. The first one is that the distributed array may be only in small amount. This means that the sampling does not meet the Nyquist sample theorem. The second one refers to echoes of objects in the same beam that will be mixed together, which makes sparse optimization dictionary too long for it to bring the huge computation burden in the imaging process. In this paper, we propose an innovative method on 3D imaging of the aerospace targets in the wide airspace with sparse radar array. Firstly, the case of multiple targets is not suitable to be processed uniformly in the imaging process. A 3D Hough transform is proposed based on the range profiles plane difference, which can detect and separate the echoes of different targets. Secondly, in the subsequent imaging process, considering the non-uniform sparse sampling of the distributed array in space, the migration through range cell (MTRC)-tolerated imaging method is proposed to process the signal of the two-dimensional sparse array. The uniformized method combining compressed sensing (CS) imaging in the azimuth direction and matched filtering in the range direction can realize the 3D imaging effectively. Before imaging in the azimuth direction, interpolation in the range direction is carried out. The main contributions of the proposed method are: (1) echo separation based on 3D transform avoids the huge amount of computation of direct sparse optimization imaging of three-dimensional data, and ensures the realizability of the algorithm; and (2) uniformized sparse solving imaging is proposed, which can remove the difficulty cause by MTRC. Simulation experiments verified the effectiveness and feasibility of the proposed method.

1. Introduction

Radar realizes target detection and ranging by emitting electromagnetic waves which has penetration ability. It is widely used in aerospace target surveillance because of its day to night and all-weather advantages [1]. Imaging radar can obtain target images, which can help to recognize targets more directly and easily [2,3]. Traditional target imaging radar utilizes 2D imaging with the synthetic method to improve the azimuth resolution. It is widely used in civil and military application including military surveillance, target detection, strategic warning, marine monitoring, biomedicine, and other fields [1,2,3,4,5].
Traditional imaging radar works in monostatic mode [6,7]. It employs inverse synthetic aperture radar (ISAR) imaging technology [8] to realize high resolution. With the help of motion compensation algorithm, the motion measurement errors are compensated. It has been developed from theoretical research to a wide application in practical cases. A large amount of ISAR images of aircrafts, satellites, missiles and other aerospace targets have been obtained [9,10,11,12].
As the aerospace technology develops in star constellations, missile multiple warheads, and aircraft fleet, there are more and more targets that should receive more attention. Because the ISAR technology based on monostatic radar has only two-dimensional data, it strongly limits the further application in solving complex condition. To obtain more precise information of targets and detect targets accurately, some scholars proposed three-dimensional imaging technology [13]. Among them, there is a three-dimensional imaging method of moving targets based on ISAR sequence images [13,14,15,16]. This method expands the imaging dimension by using the rotation information of the target, but the coherent time is long, and it also has certain requirements for the three-dimensional rotation of the target or needs to know the rotation trajectory of the target, so there are limitations in practical application. Another monopulse angle measurement method uses the sum difference beam in azimuth and pitch direction to solve the azimuth and pitch angle of scattering points on each range unit [17]. However, it cannot solve the angle error caused by angular flicker when there are multiple strong scattering points in the same range unit. In 2001, a three-dimensional imaging algorithm based on three-antenna interference was proposed [18,19,20,21]. However, this result is pseudo-three-dimensional. The distributed array radar is a new kind of radar forms with multi-static arrays. With the two-dimensional multi-static arrays, radar can provide four-dimensional data in range, azimuth, elevator, and slow-time. It will strongly support observation of the multi-targets simultaneously [22,23,24]. In 2003, Rabideau and Parker of Lincoln Lab propose the concept of MIMO radar for the first time [25], so the three-dimensional imaging method based on the two-dimensional array has attracted the attention of scholars. In 2007, Baraniuk of Rice University in the United States was the first to propose and apply a compressed sensing theory to radar imaging. He proposed using a low-speed A/D converter at the receiver as well as a restoration algorithm to reconstruct the target image [26]. This further promotes the process of imaging based on two-dimensional array radar and CS algorithm application on radar imaging area [27,28,29]. In 2010, Duan proposed the method of combining cross array MIMO radar with ISAR imaging technology to obtain 3D imaging results [30]; in 2011, Zhu designed a MIMO array for 3D imaging to achieve shorter time imaging [31]; and Gu combined MIMO technology and CS theory to propose a sparse L-shaped MIMO array single snapshot imaging algorithm [32].
The two-dimensional distributed array avoids the imperfect motion compensation in coherent processing along slow time and can achieve single snapshot 3D imaging. Some difficulties exist in the 3D imaging processing. The first one is that the distributed array may be only in small amount. It means that the sampling does not meet the Nyquist sample theorem. The second one is that echoes of objects in the same beam will be mixed together, which means that sparse optimization dictionary is too long to bring the huge computation burden in the imaging process. Furthermore, different range migrations of targets cannot be solved uniformly in the subsequent process.
In this paper, to solve above problems, an innovative method is proposed on 3D imaging of the aerospace targets in the wide-area of sparse array. Firstly, multiple targets are not suitable to be processed uniformly in the imaging process. We utilize 3D Hough transform to separate different targets based on the range profiles plane difference because the transform can detect planes in the 3D image. In this way, it’s feasible to solve the problem that the multi-target echo cannot be processed uniformly. Secondly, the migration through range ceil (MTRC)-tolerated imaging method is proposed in the subsequent imaging process. It combines compressed sensing in the azimuth direction and matched filtering in the range direction to overcome the non-uniform sparse sampling of the distributed array in space effectively and avoid the huge amount of computation of 3D data. Before imaging in the azimuth direction, interpolation in the range direction is carried out. The main contributions of this paper are: (1) a multi-target received signal separation method is proposed based on 3D Hough Transform; and (2) uniformized imaging which can overcome difficulties of MTRC and large amounts of computation while directly using compressed sensing algorithm to process the 3D data.
The rest of this work is organized as follows. Section 2 introduces the signal model and proposes a multi-target received signal separation process with 3D Hough transform. Because different targets’ range profiles are shown as different surfaces in the image, 3D Hough transform can detect and separate these surfaces. Section 3 introduces a two-step MTRC-tolerated imaging method. The traditional pulse compression in range direction and compressed sensing algorithm in two-dimensional azimuth are combined to realize three-dimensional imaging. Simulation experiments are carried out on the proposed algorithm, and the simulation results are shown in Section 4. Section 5 and Section 6 contains the discussion and conclusions of this study.

2. Multi-Target Echo Processing Based on 3D Hough Transform

Above all, the signal model should be built according to the geometrical relationship between targets and radar. After that, if the received signal containing several targets’ information is processed directly, it may lead to defocusing. So, the echo preprocessing to solve the problem of the multi-target echo must be considered.

2.1. Signal Model

Now that imaging radar works at high frequencies, targets can be regarded as a set of scattering points. The electromagnetic characteristics of targets can be described by multiple scattering points. It is assumed that the scattering function of the target does not change during the imaging process.
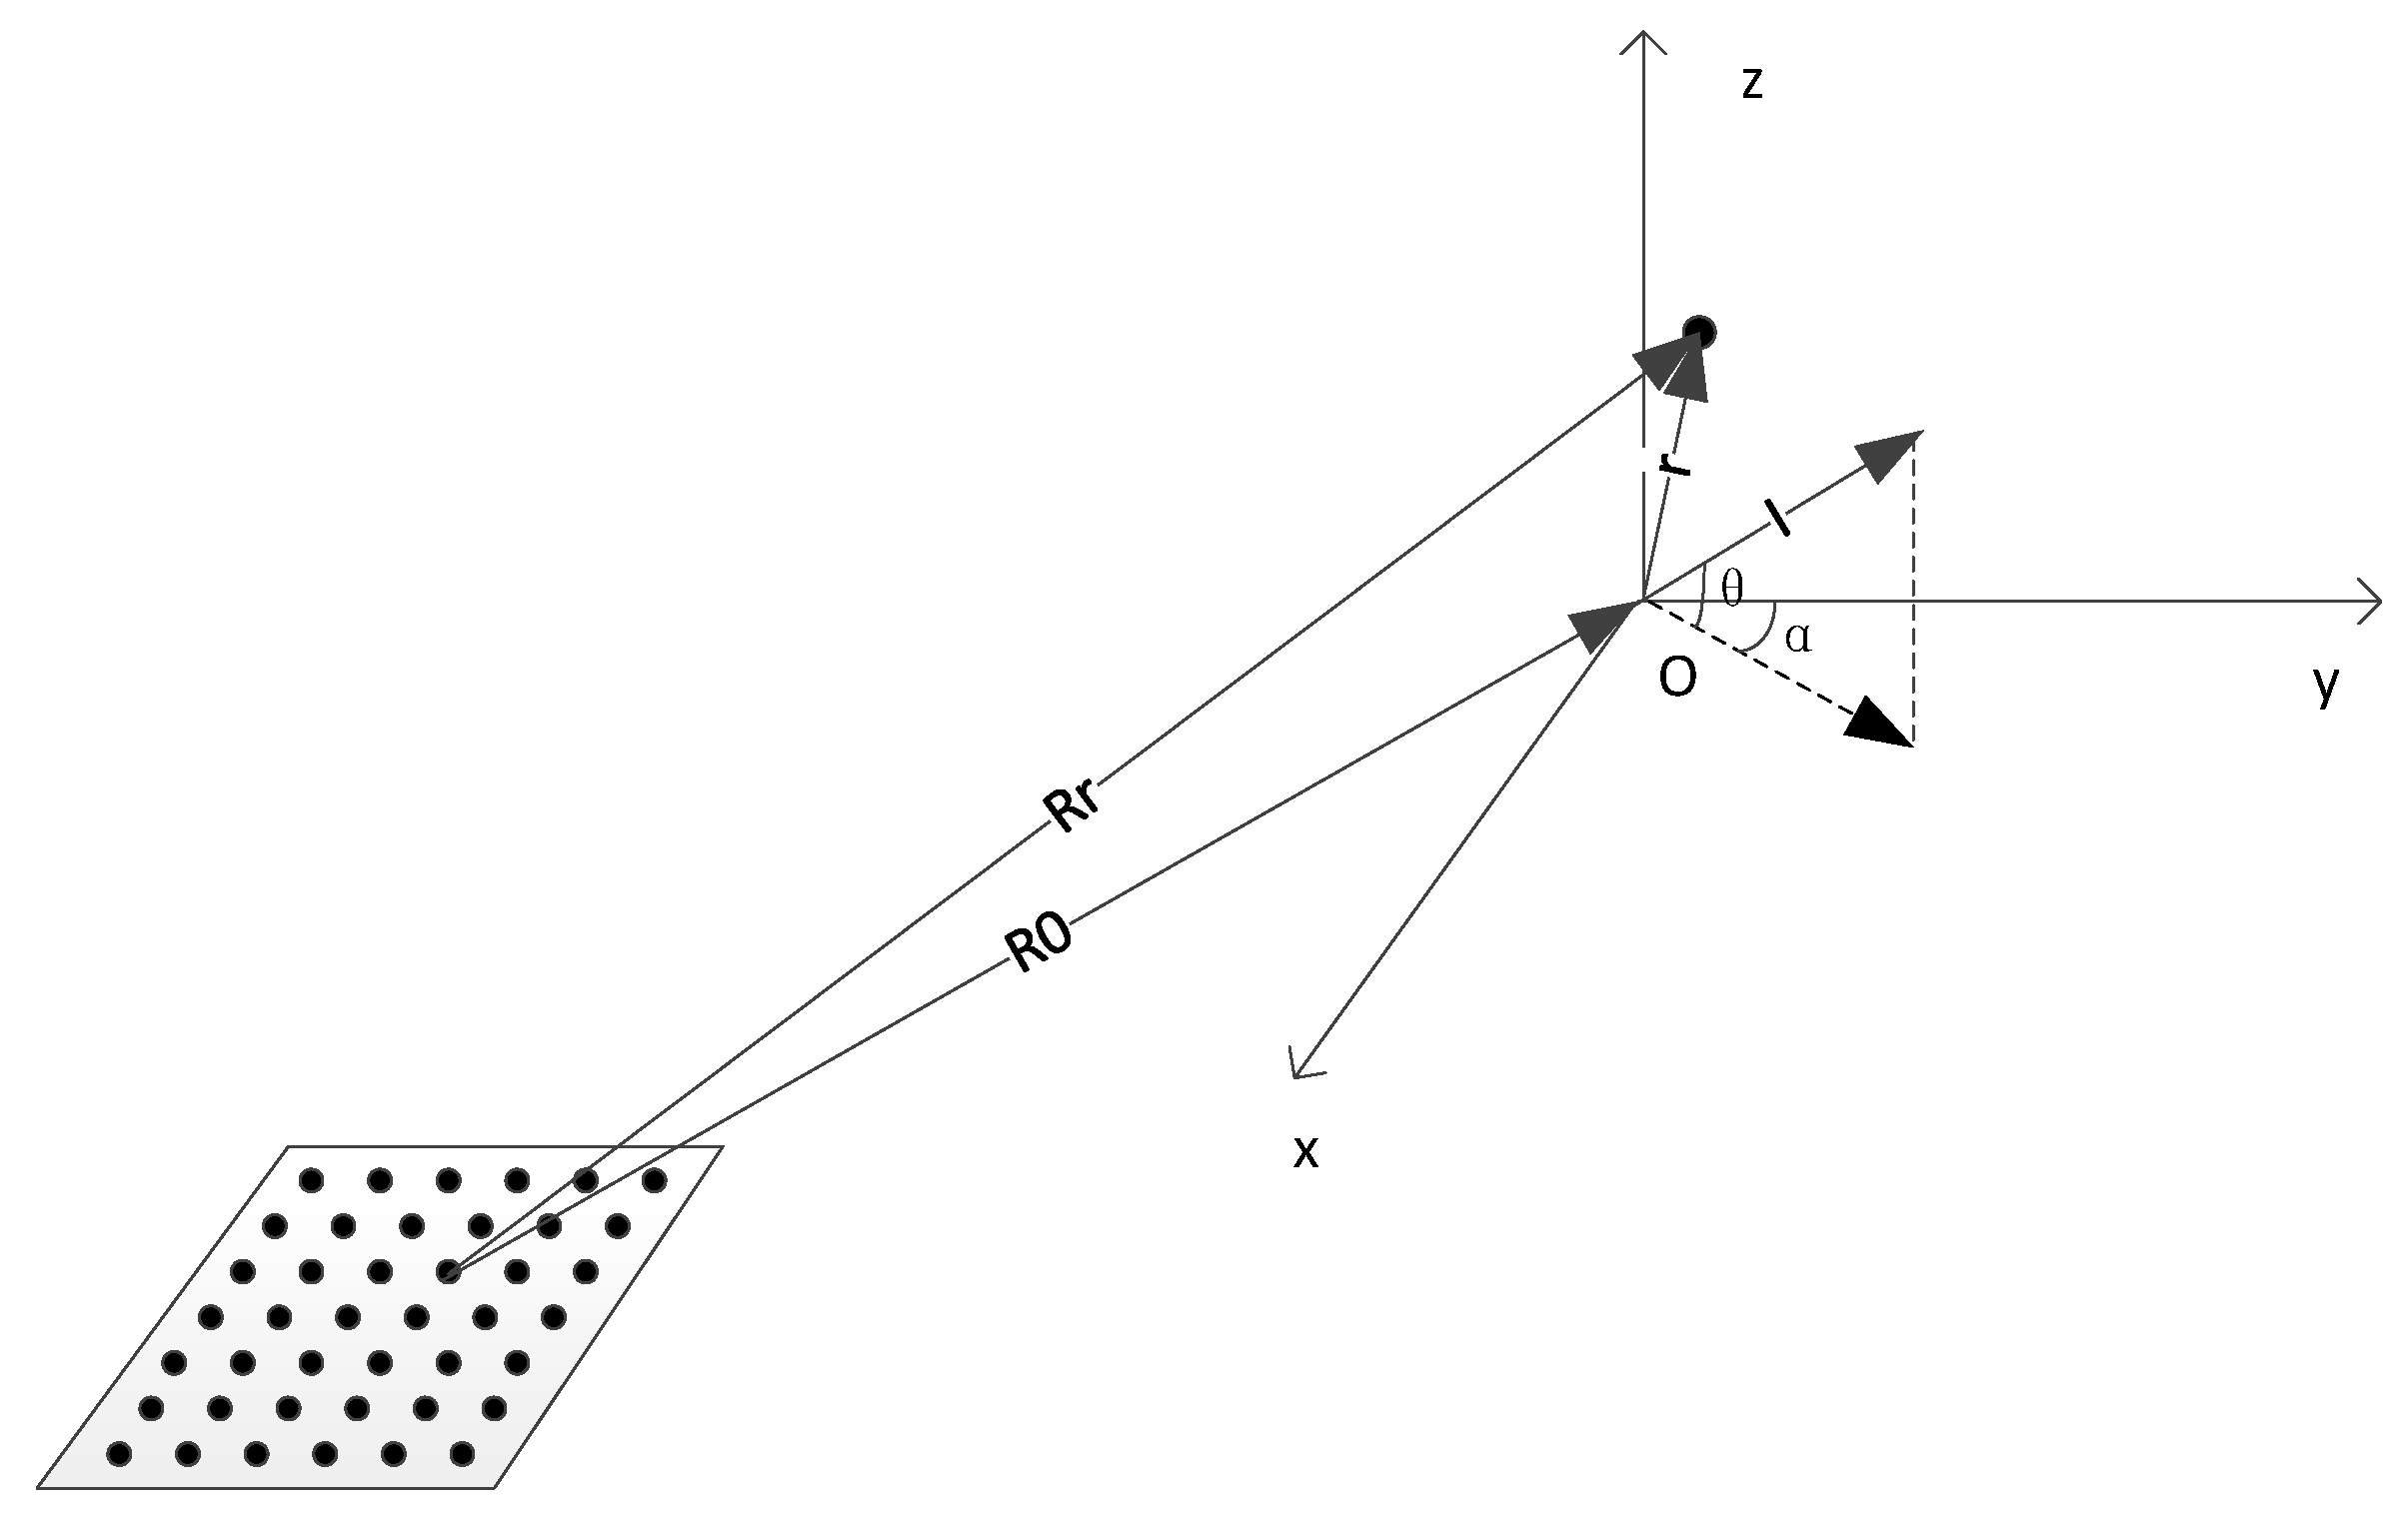
As shown in Figure 1, a reference point on the target is referred to as the origin to establish the target’s Cartesian coordinate system, and the reference point is set as O . The vector from the radar to the reference center is R 0 , and the vector direction is also the line of sight direction of the radar. I is the unit vector in R 0 , and the vector of the radar reaching the scattering point is R r . The vector from the reference center to the target scattering point is r . Suppose that the transmitted signal is s t ( t ) , and the bandwidth and center frequency are B , f 0 .
The received signal is:
s r ( t ) = Ω σ ( r ) s t ( t 2 R r c ) d r
where Ω is the spatial range of the target, and σ ( r ) represents the electromagnetic scattering function of the target. Based on the geometric relationship shown in the graph, R r = R 0 + r can be obtained. When the distance between the radar and the target is much larger than the size of the target itself, that is R 0 r , it can generally be approximated that:
| R r = R 0 + r | R 0 + r · I
The echo can be transformed to the frequency domain and substitute Equation (2) into Equation (1) to obtain:
s r ( f ) = s t ( f ) exp ( j 2 π f 2 R 0 c ) Ω σ ( r ) exp ( j 2 π f 2 r · I c ) d r
After matched filtering and coherent processing, the echo can be expressed as:
s r ( f ) = r e c t ( f f 0 B ) Ω σ ( r ) exp ( j 2 π f 2 r · I c ) d r
Let k = 2 I f / c be a spatial spectrum vector, then Equation (4) becomes:
s ( k ) = W ( k ) Ω σ ( r ) exp ( j 2 π r · k ) d r
The above Equation (5) shows that the echo of the target can be transformed into the form of the space spectrum after processing, and the relationship between space spectrum sampling points and the target electromagnetic scattering function is Fourier transform.
For radar imaging technology, the transmitted signal which meets the large time-bandwidth product will perform better. Therefore, LFM signals are often used as transmitting signals. Because of its characteristics, the echo can be dechirp processed, which can simplify the equipment and save the computation cost. Using LFM signal as the transmitting signal, the received target echo is:
s r ( t ) = k = 1 K σ k r e c t [ t τ k T p ] exp [ j 2 π ( f c ( t τ k ) + 1 2 K ( t τ k ) 2 ) ]
where T p is the pulse duration, f c is the central frequency, K is the frequency modulation ratio of the LFM signal, M represents the number of scattering points, σ k is the electromagnetic scattering of the scattering points, and τ k = 2 R k c , R k is the distance from the scattering points to the radar.
The LFM signal corresponding to the delay τ r e f = 2 R r e f c of the reference distance R r e f is used as the reference signal for dechirp processing. The result after processing is as follows:
s r ( t ) = k = 1 K r e c t [ t s T p ] exp { j 2 π ( f c + K t s ) τ Δ }
where τ Δ = 2 R k c 2 R r e f c is the difference of range delays between target and reference point.
For the planar array radar designed in this paper, the array elements are arranged on the uniform grid along the two edges of the rectangle, and the relationship between the radar line-of-sight direction and the target reference coordinate system is shown in Figure 2.
Where α is the angle between the projection of the radar line of sight in the XOY plane and the positive direction of the Y-axis, the range of values is 0 ° 360 ° , θ is the angle between the radar line of sight and the XOY plane, and the range of values is 0 ° 90 ° . As a result, Equation (7) is further processed to get:
s r ( t ) = k = 1 K σ k exp { j 4 π ( f c + K t s ) ( x k sin α cos θ + y k cos α cos θ + z k sin θ ) / c }
where τ Δ = 2 ( x k sin α cos θ + y k cos α cos θ + z k sin θ ) c is the range delay.

2.2. Multi-Target Echo Separation in the Sub-Block

For the multi-target received signal, because of the different line of sight direction from radar elements to different targets and the range migration of different targets in the echo being different, which cannot be processed uniformly in the subsequent imaging, the subsequent single three-dimensional imaging scene cannot contain the whole wide-area space at the same time. It is necessary to separate the echo signal containing multi-target information to obtain the signal of single target information and process them one by one. In the process of multi-target echo separation in traditional ISAR imaging, after the accumulation of coherence time, different targets reflect as multiple lines with different slopes in the range profile. Then, different lines are detected and separated by Hough transform in the image domain. In this paper, the array radar can take use of space instead of time to expand dimensions of the image, so the azimuth information can be obtained without coherent time accumulation. For the radar array that has resolution ability in two-dimensional azimuth, targets signals are displayed as different three-dimensional surfaces in the range profile. Referring to the idea that different lines are distinguished by detecting the slope and intercept of lines with Hough transform, the 3D Hough transform is proposed to detect different surfaces in three-dimensional space.
The plane in space can generally be expressed by equation as:
A x + B y + C z + D = 0
The normal vector of the plane is:
v = [ A B C ]
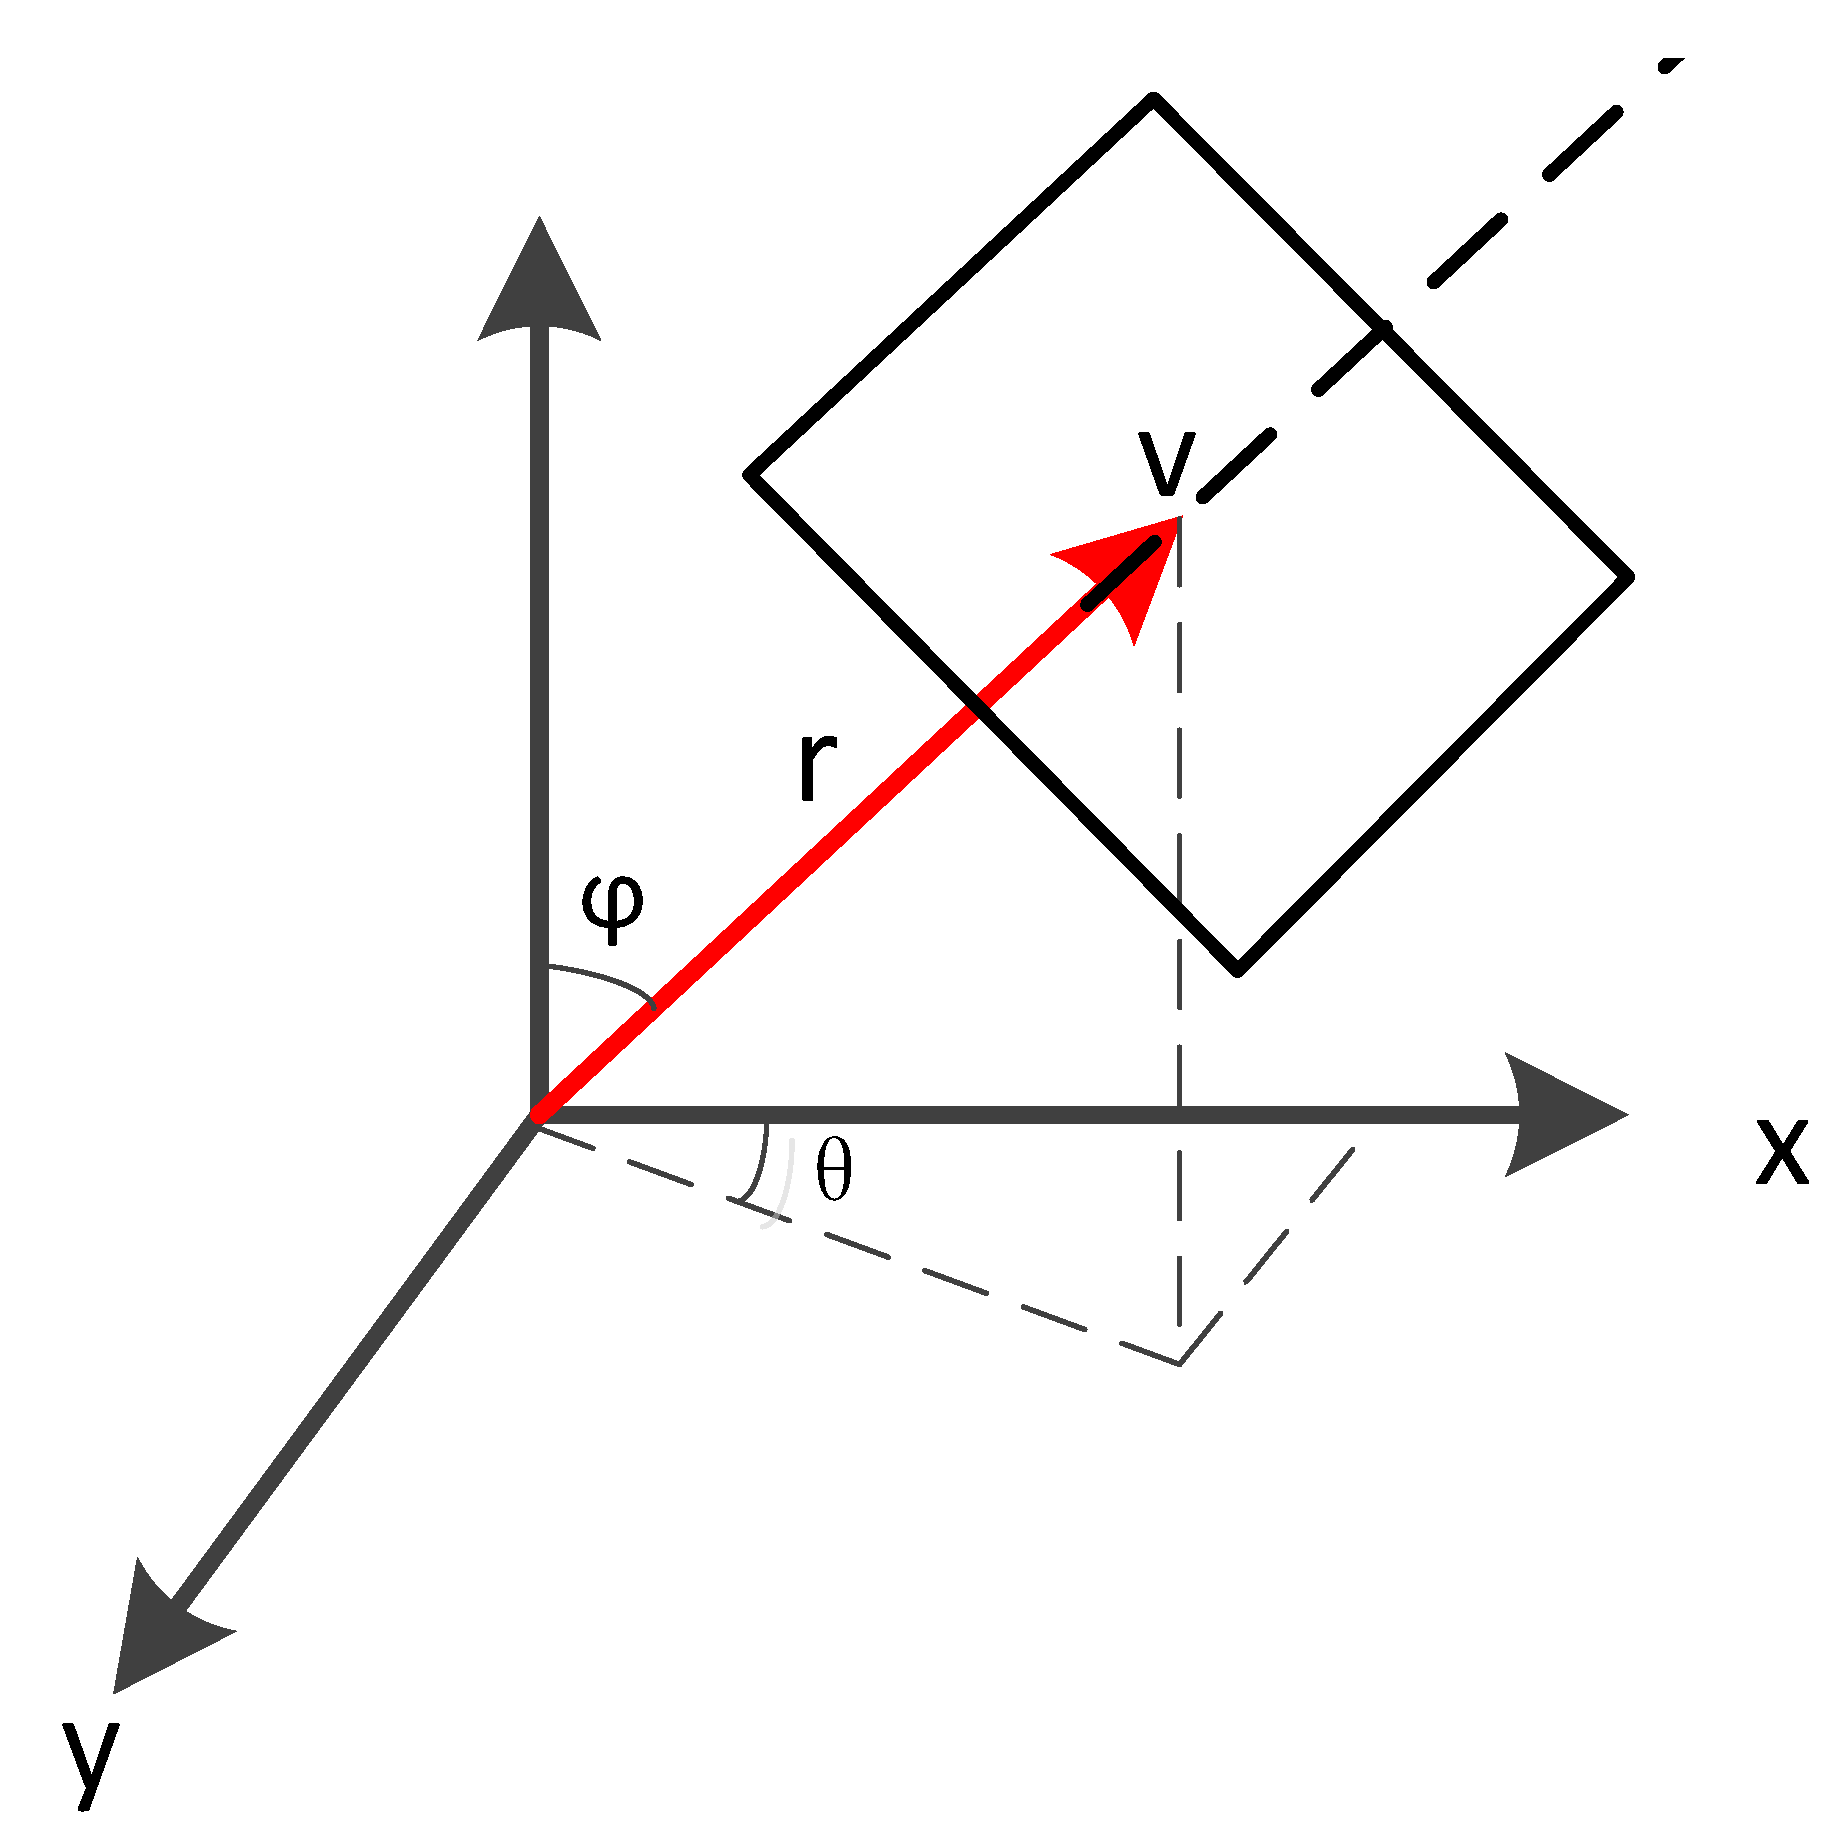
where D is the distance from the origin to the plane. Therefore, the plane can be expressed by a normal vector containing direction and distance information. Further, the direction of the normal vector can be expressed by its pitch angle φ and azimuth angle θ in the coordinate system (this angle is independent of the radar angle of line of sight in the previous section). The distance is expressed by r , as shown in Figure 3.
Therefore, Equation (9) of the plane can be expressed as a parametric formula by three parameters ( θ , φ , r ) , which is rewritten as:
x cos θ sin φ + y sin θ sin φ + z cos φ + r = 0
For each point in the image, converting it to the parameter space is a surface. Since the points on the same plane whose normal vector is ( θ 0 , φ 0 , r 0 ) meet the same parameter equation, the strong point will be accumulated at ( θ 0 , φ 0 , r 0 ) in the parameter space corresponding to the plane, and different planes will form maximum points at different positions in the parameter space. Therefore, the corresponding planes of different targets on the range image can be detected and separated by 3D Hough transform.
The detection process is an accumulation process. Through the discretization of θ , φ , r , the parameter space is discretized, and a three-dimensional data array ( θ , φ , r ) is constructed as the accumulator. For each point in the image domain, its coordinates and a group ( θ i , φ i ) can obtain an r i with Equation (11). The value of the point in the image domain is used as the weight for accumulation at ( θ i , φ i , r i ) of the accumulator. The accumulation is completed after traversing the combination of all points and angles. Finally, the maximum value in the accumulator is found, which is the parameter of the plane.

2.3. Sub-Block Splicing

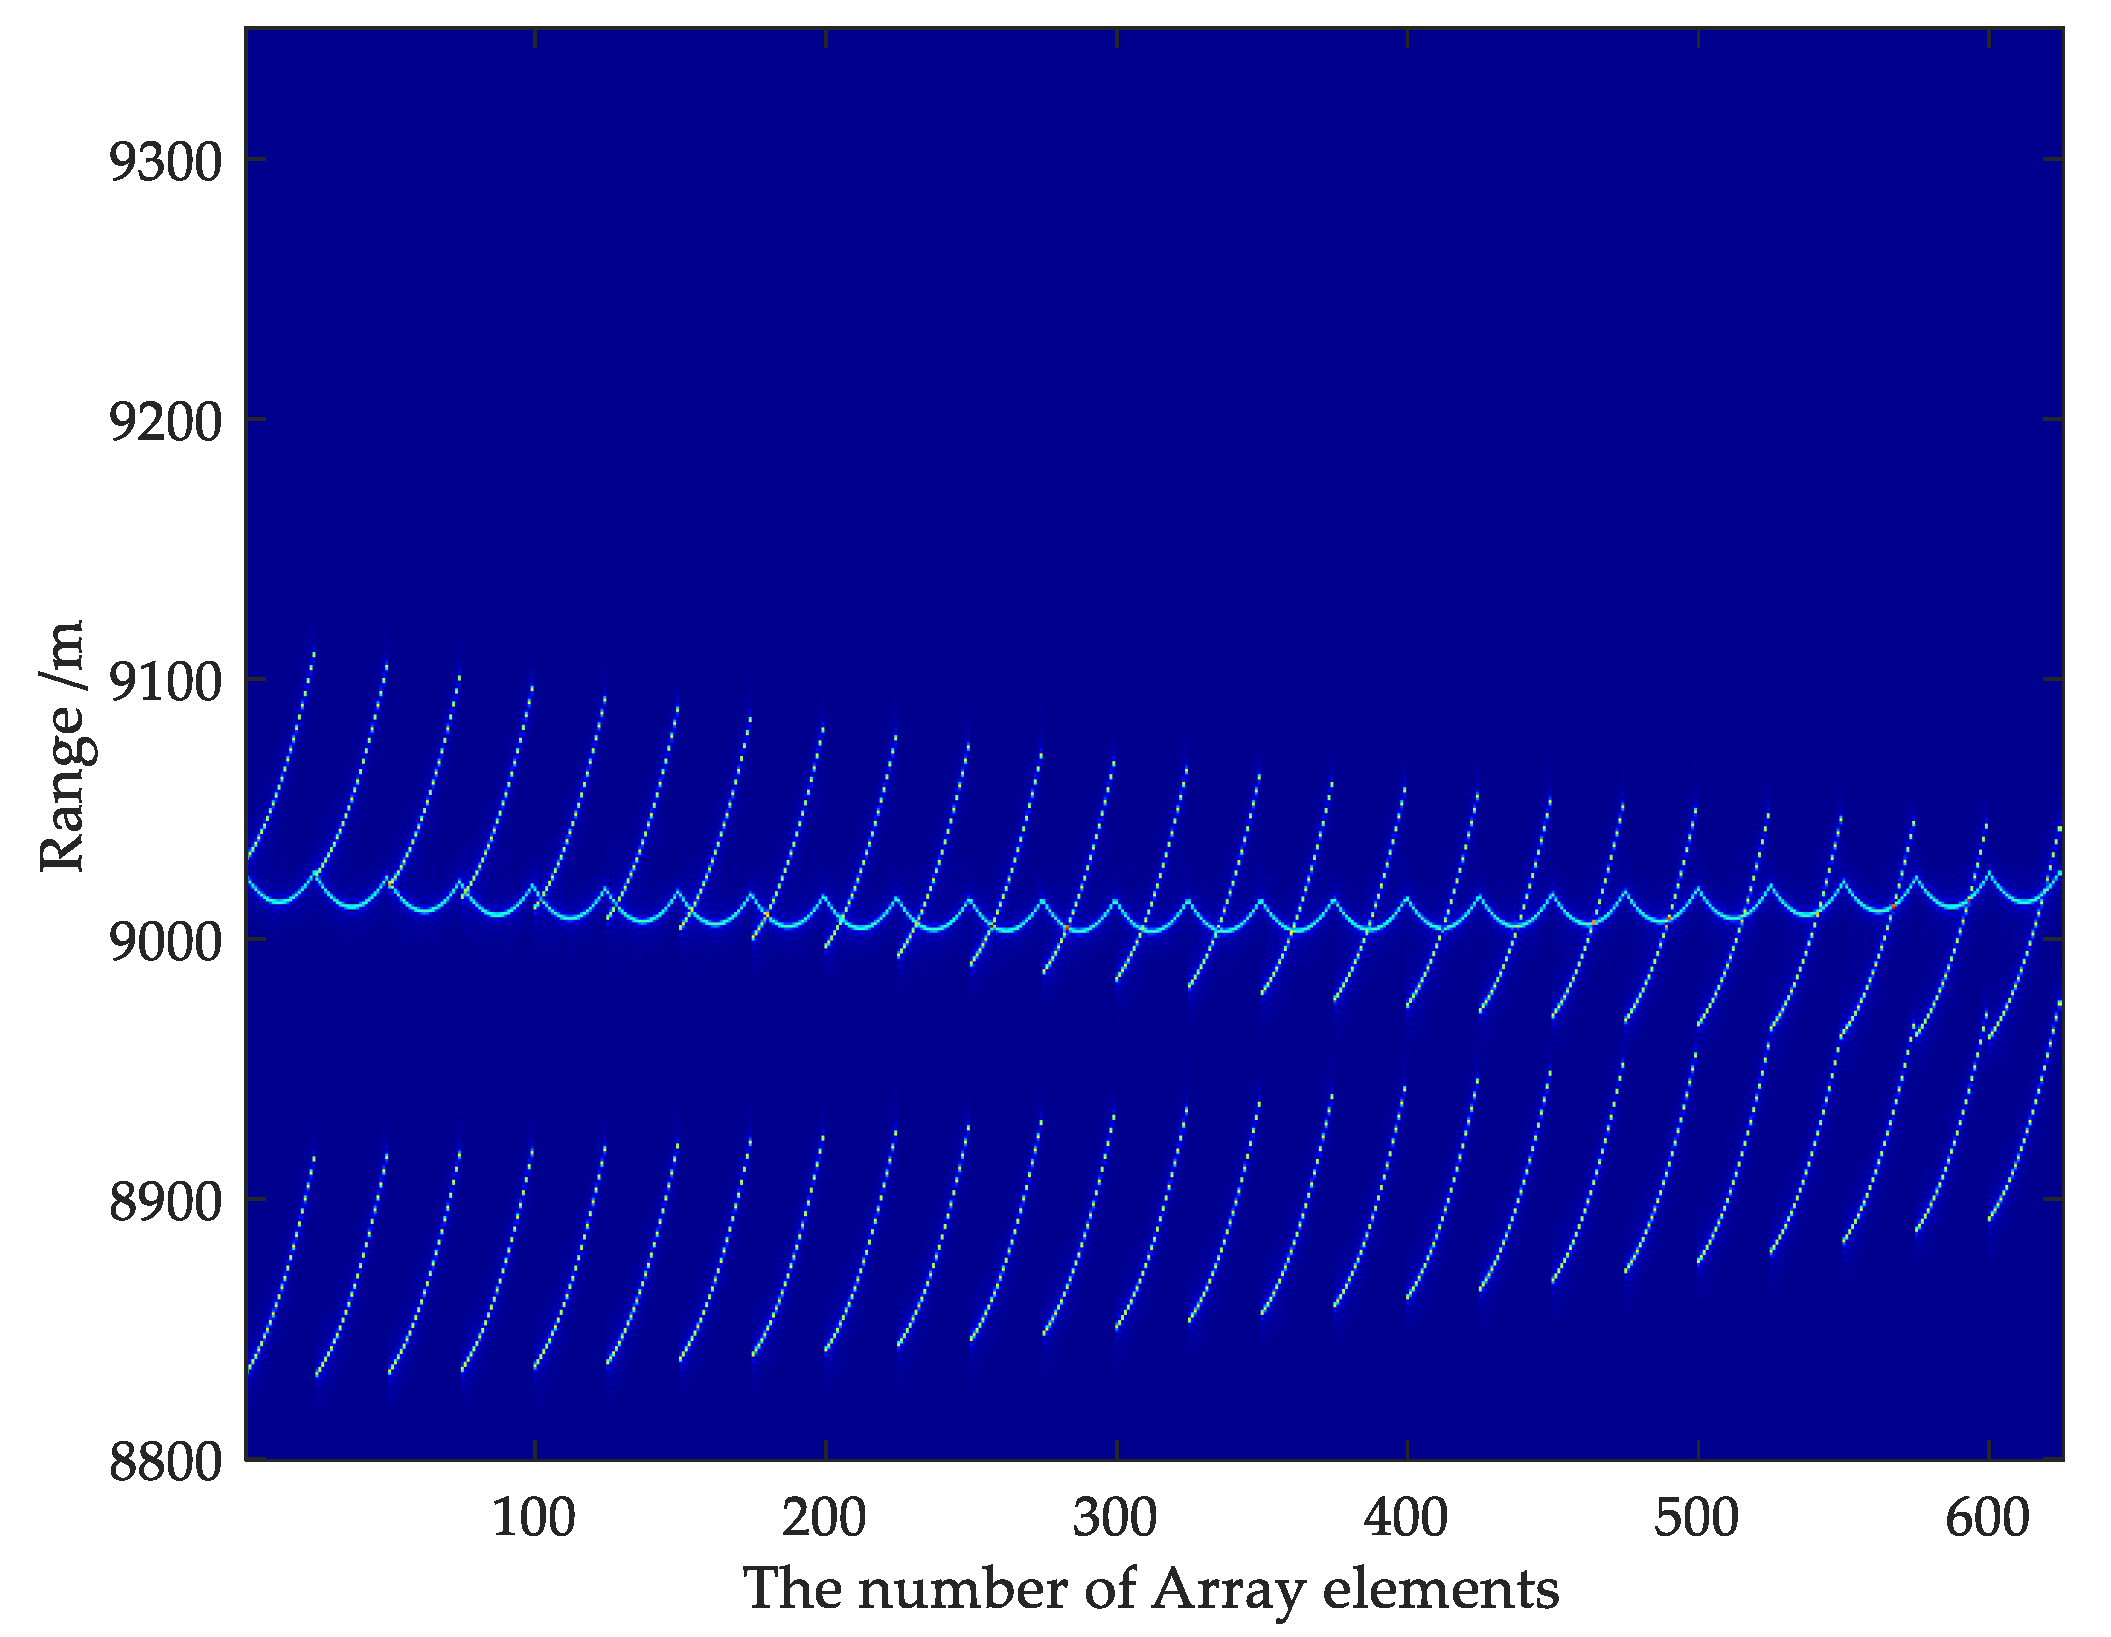
However, for the large size of the array, the angle of line of sight direction of radar changes greatly, and each scattering point is far away from the reference point, so the position of the same target in the range profile of each array element is quite different, as shown by Figure 4. Here, the array is arranged into a vector on this figure’s horizontal scale.
In the three-dimensional range profile, this difference in position makes the plane deform into a curved surface, so it cannot be simply regarded as a plane for detection and separation.
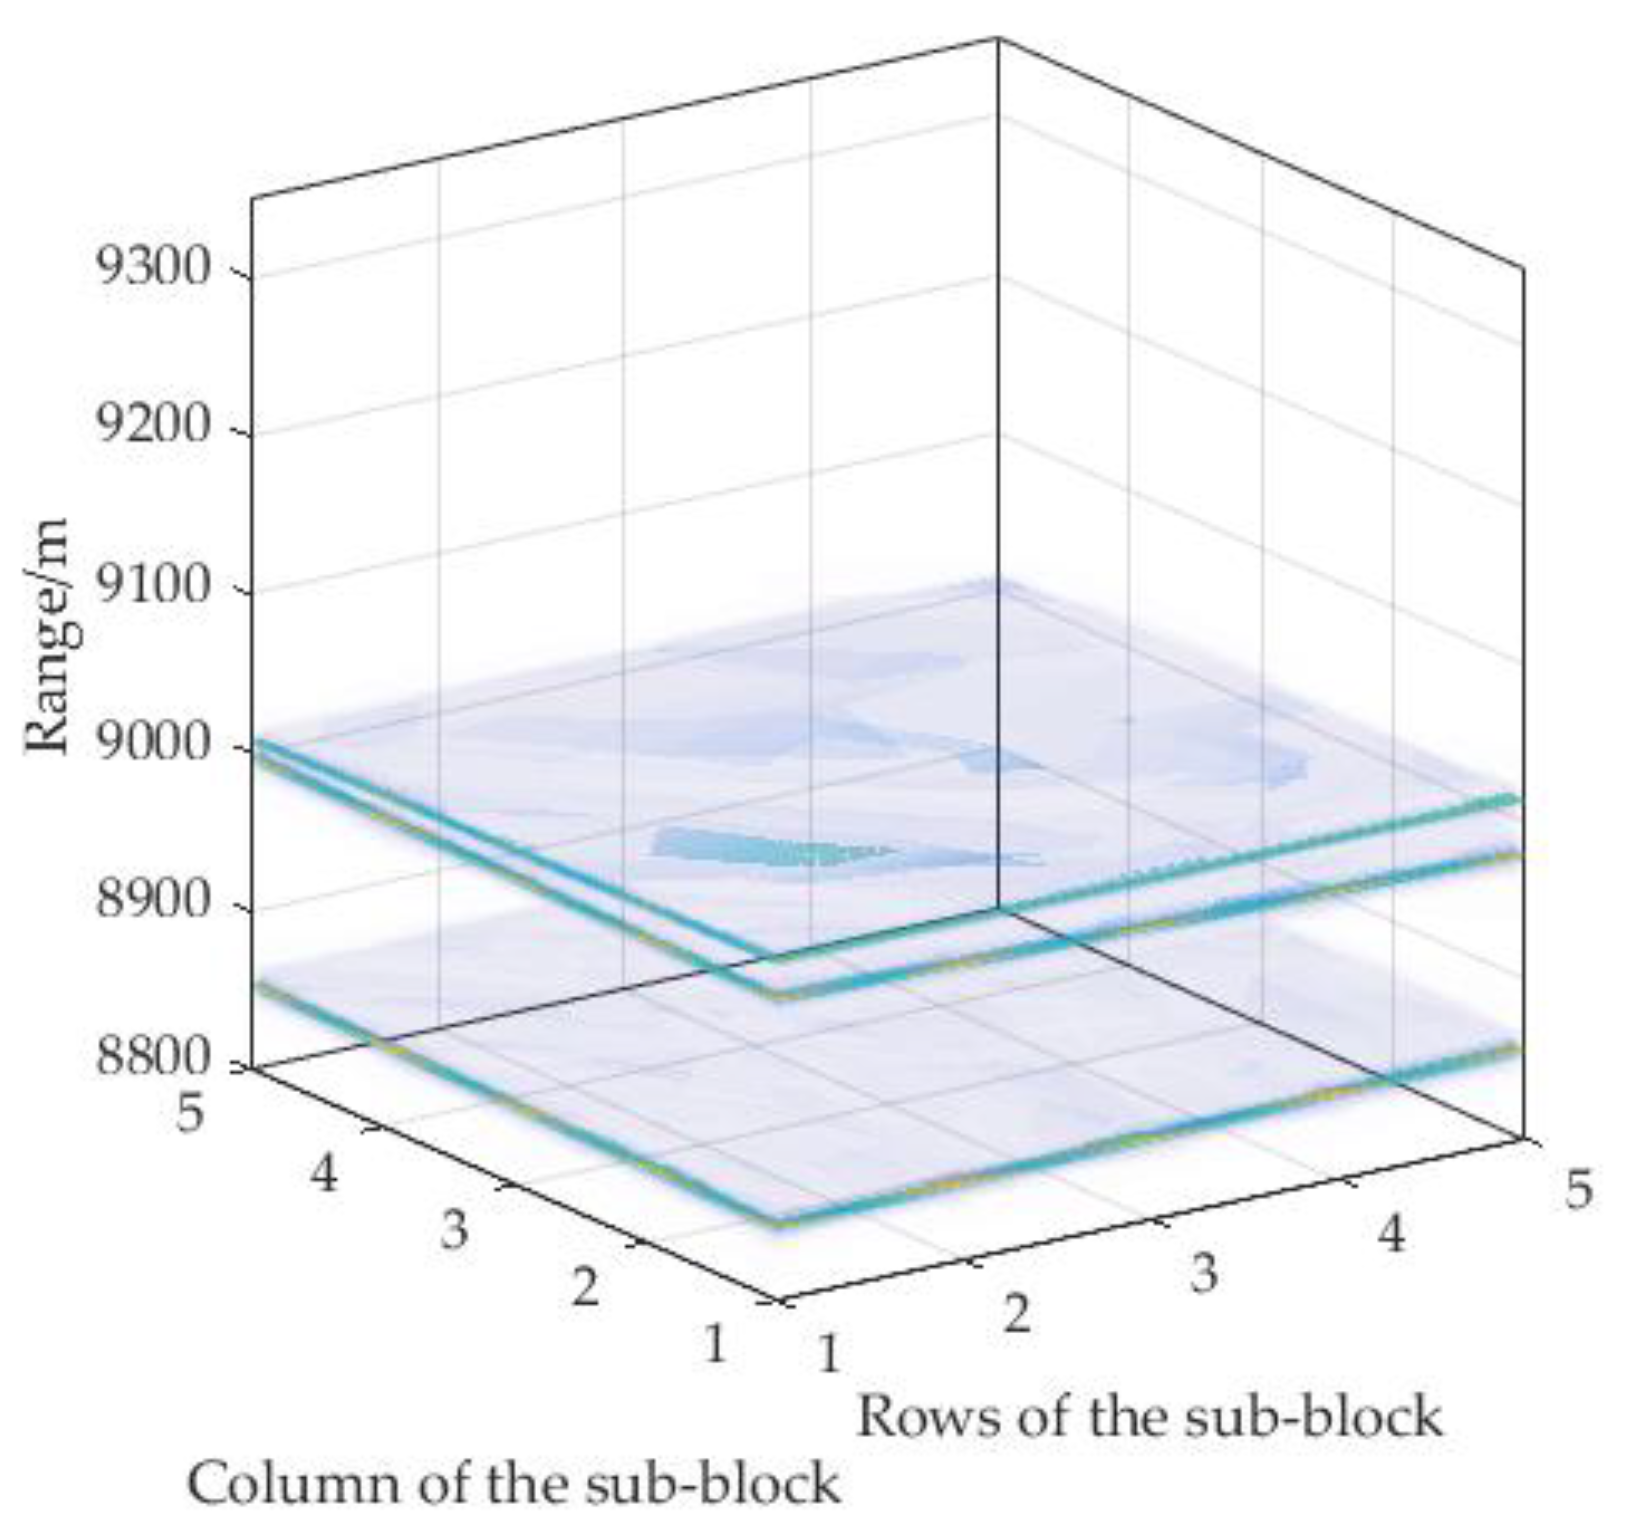
In order to make the image meet the conditions of plane detection, this paper cut the range profile in 3D space along the two-dimensional azimuth and divided it into sub-blocks of the same size. Furthermore, the profile of each target can be approximately planar for detection and separation in each sub-block as shown in Figure 5.
After the plane detection of each sub-block by 3D Hough transform, different targets in each sub-block can be separated. Then, single target echoes obtained in each sub-block needs to be stitched together to restore the echo signal of the same target.
If only one of ( θ , φ , r ) is used as the criterion to judge whether echoes of the two sub-blocks belong to the same target or not, the misjudgment may be caused by the excessive change in the parameters between the two sub-blocks, and the robustness is weak. Therefore, it is necessary to consider the joint judgment basis of all three parameters. This paper considers normal vectors included in angles between the two sub-blocks as the main judgment basis and the intercept difference as the verification condition. Suppose that the plane parameter of a target is ( θ 0 , φ 0 , r 0 ) after 3D Hough transform, and the normal vector of the plane is v 0 = ( cos θ 0 sin φ 0 , sin θ 0 sin φ 0 , cos φ 0 ) . Similarly, the normal vector of the corresponding plane of each target in the next sub-block is v 1 i = ( cos θ 1 i sin φ 1 i , sin θ 1 i sin φ 1 i , cos φ 1 i ) (where i represents different targets), and the angle between two normal vectors is calculated:
α = v 0 · v 1 | v 0 | | v 1 |
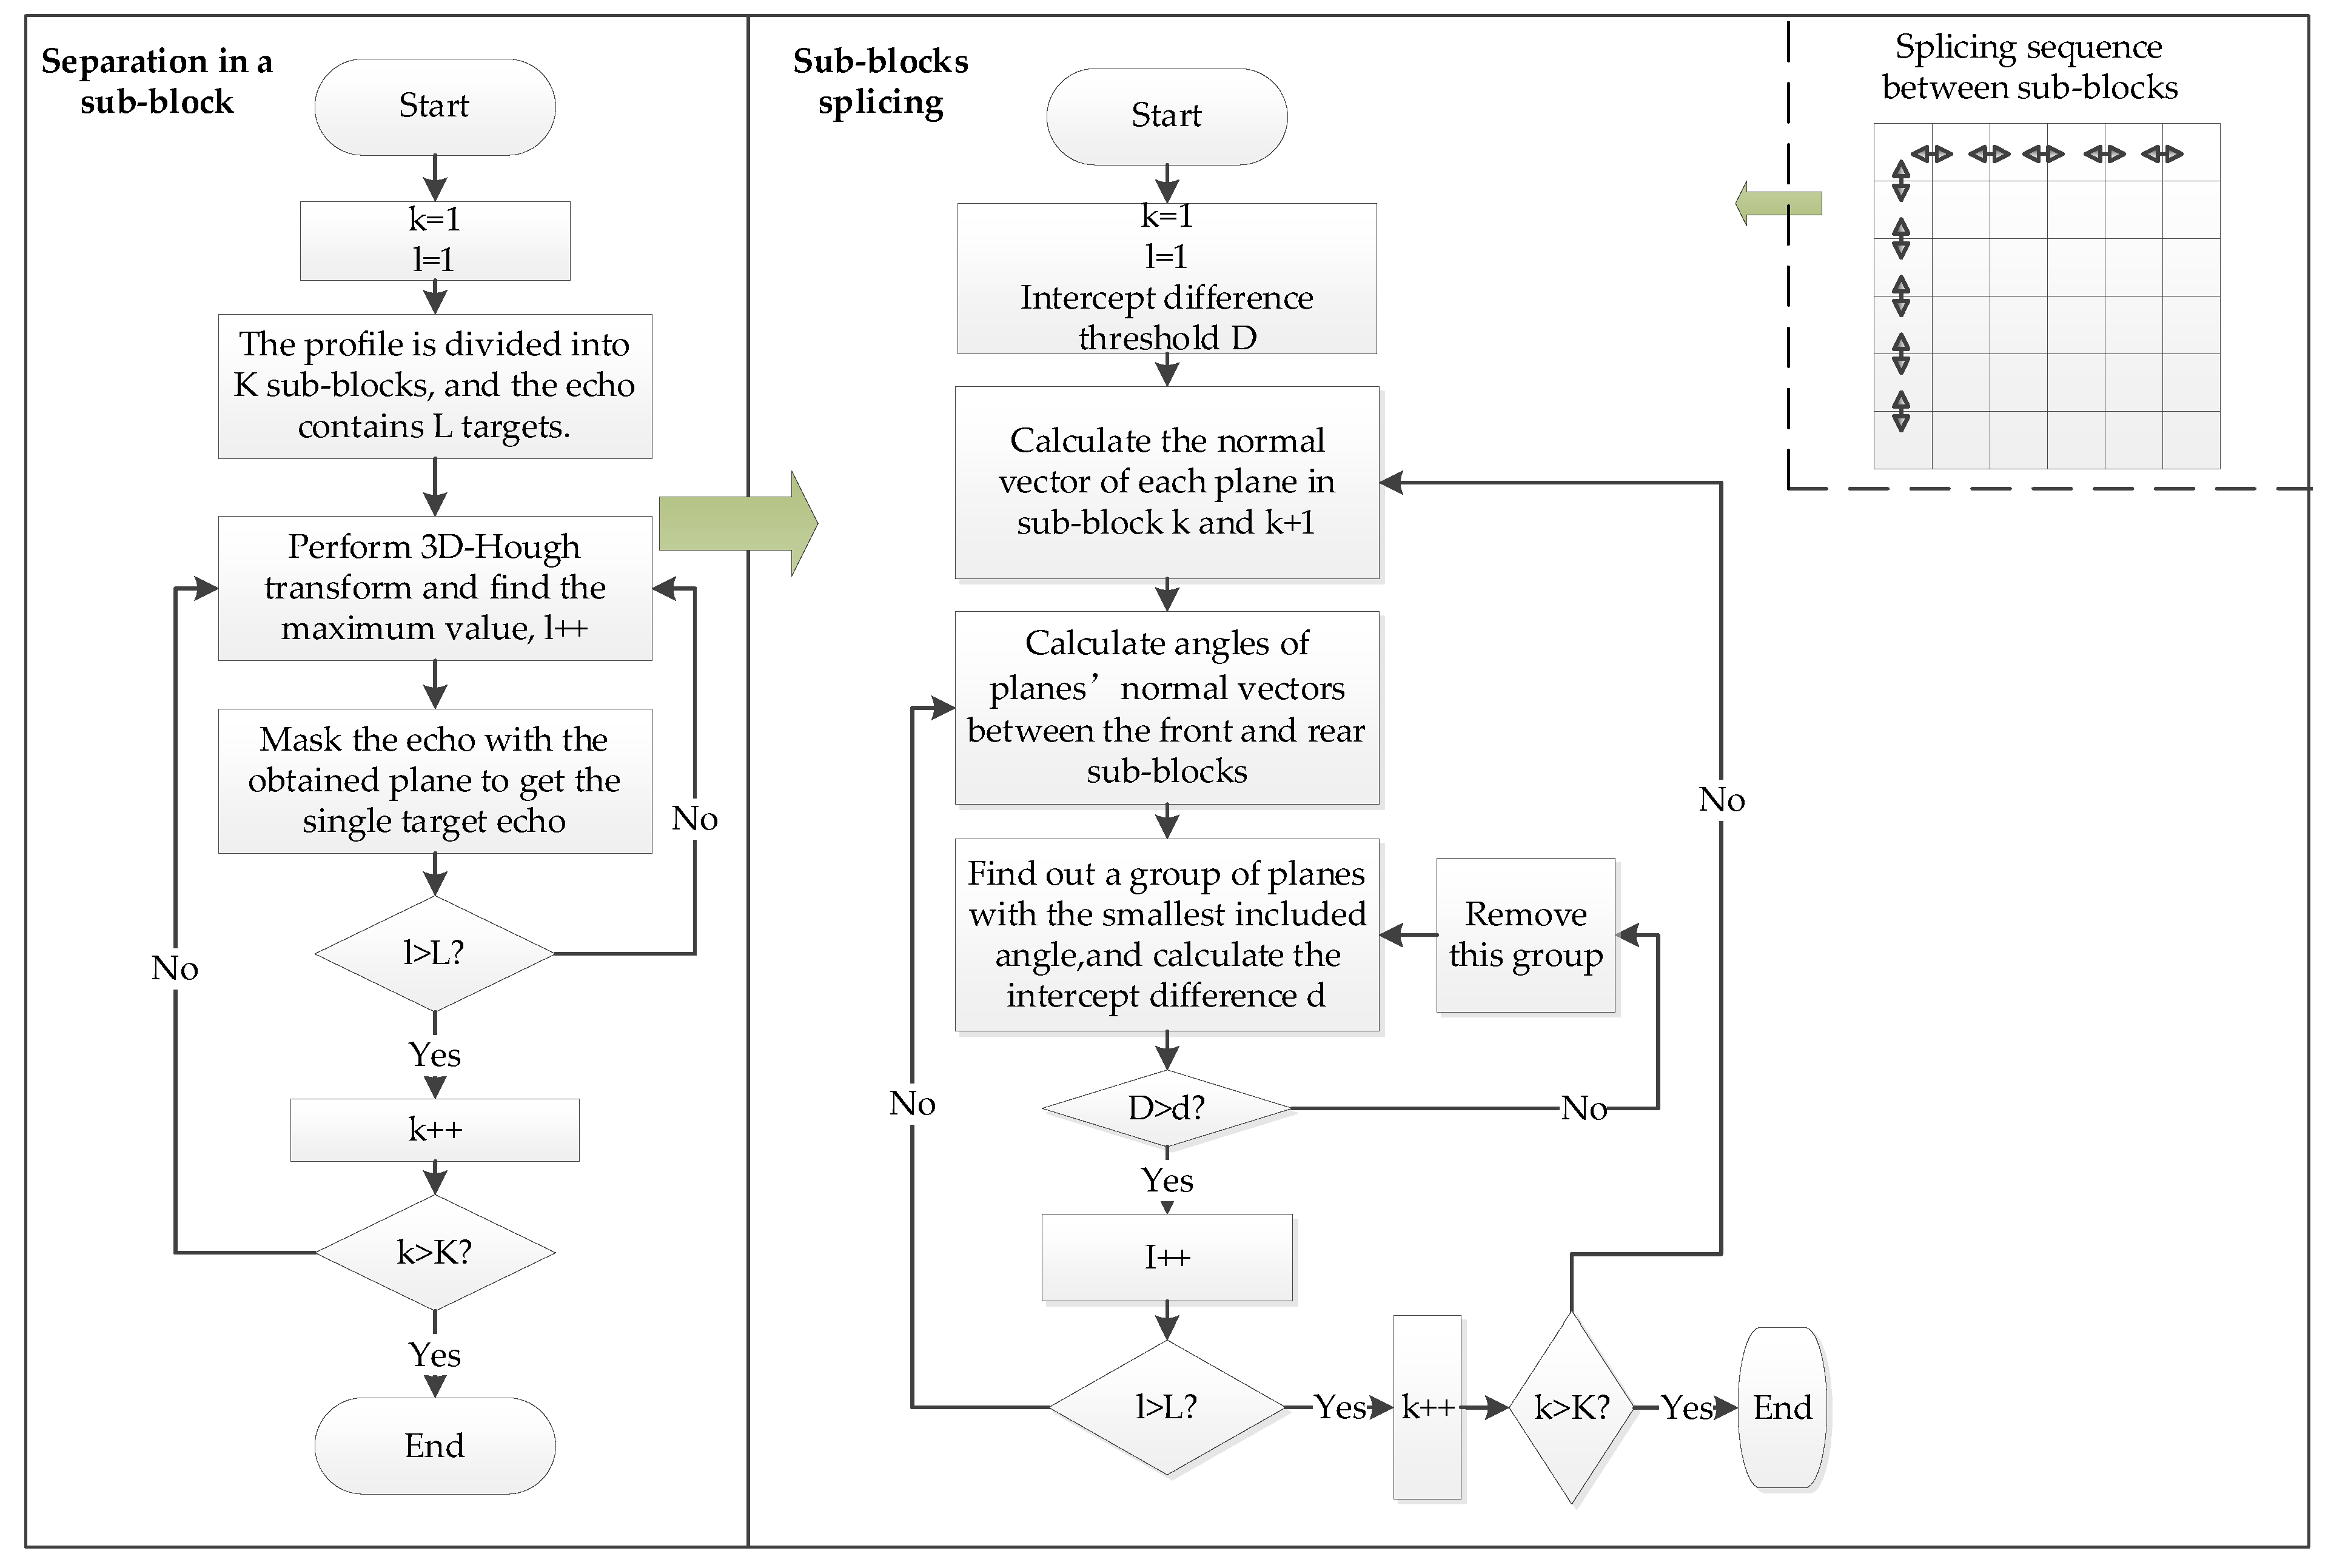
It is found that the two planes with the smallest angle may be the planes corresponding to the same target in the front and next subblocks. In order to make the judgment method more robust and avoid misjudgment caused by the similarity of the plane normal vectors of the two targets, after calculating the included angle, a distance difference threshold T is set; if the plane intercept difference between the front and next subblocks with the smallest angle is more than T, it is judged that the two planes do not belong to the same target. A plane with a smaller angle for splicing is then found. Furthermore, the first sub-block of the next row is not compared with the previous sub-block, but with the first sub-block of the previous row to make sure that two adjacent sub-blocks are compared. This can ensure the stability of the splicing process. The flow of the algorithm is shown in the following Figure 6.

3. MTRC-Tolerated Imaging Based on Compressed Sensing Imaging

According to the actual scene in this paper, aerial targets in wide-area space can be regarded as imaging under sparse conditions, which meets the conditions of compressed sensing. On the other hand, due to the actual requirements of large array design, the array is often sparse. So, the scene is sparsely sampled. Traditional radar imaging can be realized by matched filtering the received signal of the uniformly arranged array. However, compared with the uniform array radar, the sparse array radar’s spatial sampling is not uniform; thus, the signal does not satisfy the Nyquist sampling theorem in the azimuth direction so it cannot be processed by DFT. Therefore, after multi-target echo separation, this paper carries out compressed sensing imaging instead of traditional matched filtering in the subsequent imaging processing.

3.1. Compressed Sensing Method

For the mathematical model, compressed sensing raises problems in solving the equation,
s = A g
where s is the observation vector, A is the measurement matrix, g is the solution vector. A is an incomplete dictionary, solving a set of the sparsest coefficients to represent s . i.e.,
g ^ = min g s A g 2 2 + λ g p p
where λ is a normalization coefficient, . p is p norm,
g p = ( | g i | p ) 1 / p
The most direct representation of the sparsity is the 0 norm, which represent the number of non-zero elements. However, 0 norm is an N-P hard problem and cannot be solved [33]. Many algorithms have been developed to solve this problem in practical conditions.
This paper uses the basis pursuit algorithm [34,35] and the orthogonal matching pursuit algorithm (OMP) [36] as sparse reconstruction methods. The basis pursuit algorithm converts 0 norm into 1 norm under certain conditions to avoid the N-P problem. The current mainstream method is the linear programming method, which converts the optimization problem with 1 norm into a programming problem. Let g u v , v > 0 , u and v are the positive and negative parts of g , x ( u , v ) , A ( D , D ) , c ( 1 , 1 ) , c is the vector of all 1, b s . Aiming at the noiseless model and the noisy model, it is transformed into a quadratic programming problem and solved by mathematical method.
min c T x + 1 2 γ x 2 + 1 2 p 2     and     A x + δ p = b ,   x 0
where γ = 10 4 , δ = 1 in the noisy model, and δ = 10 4 in the noiseless model. The global optimal solution can be obtained stably by using the primal–dual interior-point algorithm to solve the above quadratic programming problem.
The orthogonal matching pursuit algorithm is an improved algorithm based on the matching pursuit algorithm, which establishes an over-complete atomic library. OMP algorithm selects the atom that best matches the signal for approximation in each iteration, and calculates the residual after the iteration. In the next iteration, the atom that best matches the residual of the signal is selected. In this process, the algorithm recursively orthogonalizes the selected atomic set to ensure the optimality of the iteration and avoid the possibility that the iterative result is suboptimal because of the non-orthogonality of the selected atoms. The steps are shown as Algorithm 1:
Algorithm 1. The Orthogonal Matching Pursuit Algorithm
Input: observation signal s and measurement matrix A
Output: sparse vector g
Step 1: Set the initial value of the residual as r 0 = s , the selected atomic as Ω 0 = 0 , and the number of iterations as k = 1
Step 2: Find the atom in the set (each column in the measurement matrix) that best matches the signal,
j k arg   max j | r k 1 , A j | ,   Ω k = Ω k 1 { j k } (17)
Step 3: Solve the solution of minimizing noise min x 1 2 s A g 2 2 according to the least square method,
g k = ( A Ω k H A Ω k ) 1 A Ω k H s (18)
Step 4: Update residual,
r k = s A Ω k g k (19)
Step 5: Let k = k + 1, keep looping steps 2 through 4 before meeting the condition to end the loop.
Step 6: Output the result
g ( i ) = { x k ( i ) , i Ω k 0 , else (20)

3.2. Imaging Algorithm Based on Compressed Sensing

The echo in Equation (8) is also applicable to the subsequent processing because the signal form does not change after multi-target echo separation. It is discretized in the range direction, and the azimuth angle changes with the array element. Assuming that the layout of the radar array elements is N a × N a and the number of sampling points in the range direction is N r , the echo is discretized as follows:
s r ( f n r , α n a 1 , θ n a 2 ) = k = 1 K σ k exp { j 2 π f n r τ Δ ( n a 1 , n a 2 , k ) }
the equation is rewritten in matrix form:
s = [ exp { j 2 π c f 1 τ Δ ( α 0 , θ 0 , 1 ) } exp { j 2 π c f 1 τ Δ ( α 0 , θ 0 , k ) } exp { j 2 π c f 1 τ Δ ( α 0 , θ 0 , K ) } exp { j 2 π c f N r τ Δ ( α 0 , θ 0 , 1 ) } exp { j 2 π c f N r τ Δ ( α 0 , θ 0 , k ) } exp { j 2 π c f N r τ Δ ( α 0 , θ 0 , K ) } exp { j 2 π c f N r τ Δ ( α N a , θ N a , 1 ) } exp { j 2 π c f N r τ Δ ( α N a , θ N a , k ) } exp { j 2 π c f N r τ Δ ( α N a , θ N a , K ) } ] · [ σ 1 σ k σ K ]
In the above model, to solve the optimization problem, it is necessary to determine the order of the model. Because the number of scattering centers in the actual scene is unknown, this paper effectively avoids this problem by discretizing the scene.
Change the point scattering model in Equation (21),
s r ( f n r , α n a 1 , θ n a 2 ) = l = 1 M N L σ l exp { j 2 π f n r τ Δ ( n a 1 , n a 2 , l ) }
The imaging scene is divided into M × N × L grids. This paper assume that each grid is a scattering point. When it is indeed a scattering point, the scattering coefficient σ l is not 0. When it is not the scattering point, the scattering coefficient σ l tends to 0. In this way, the problem of an uncertain number of scattering points is skillfully avoided, and the order of the above equation is determined.
In this way, the observation vector s and measurement matrix A are determined, which can be directly substituted into BP and OMP algorithms. However, in the process of practical application, because the range and azimuth sampling are three-dimensional, and the discrete imaging grid is also three-dimensional distribution, resulting in a sharp increase in the amount of data. For large scenes, the real-time performance of the imaging algorithm cannot be well guaranteed, and there is no possibility of practical implementation. This paper combines the traditional matched filtering with the compressed sensing algorithm effectively. In the range direction, because the sampling frequency meets the Nyquist sampling theorem, the DFT method can be used to focus the profile. Furthermore, compressed sensing imaging is only used in the two-dimensional azimuth direction, which greatly reduces the amount of computation.
Now, the imaging processing is separated into two parts: the pulse compression in the range direction and the compressed sensing imaging in the azimuth direction. As explained before, there will be range migration of target positions between different array elements in the range profile. If pulse compression is performed in the range direction before compressed sensing imaging performed in the azimuth direction, the range unit substituted for compressed sensing cannot be accurately ensured during imaging in the azimuth direction. Therefore, this paper first performs compressed sensing processing in the azimuth direction of each range unit and matched filtering in the range direction then, which realizes the MTDC-tolerated 3D imaging.
Simplify Equation (23):
s r ( f x , f y , f z ) = l = 1 M N L σ l exp { j 4 π c ( f x x + f y y + f z z ) }
where f x = f n r sin α cos θ , f y = f n r cos α cos θ , f z = f n r sin θ .
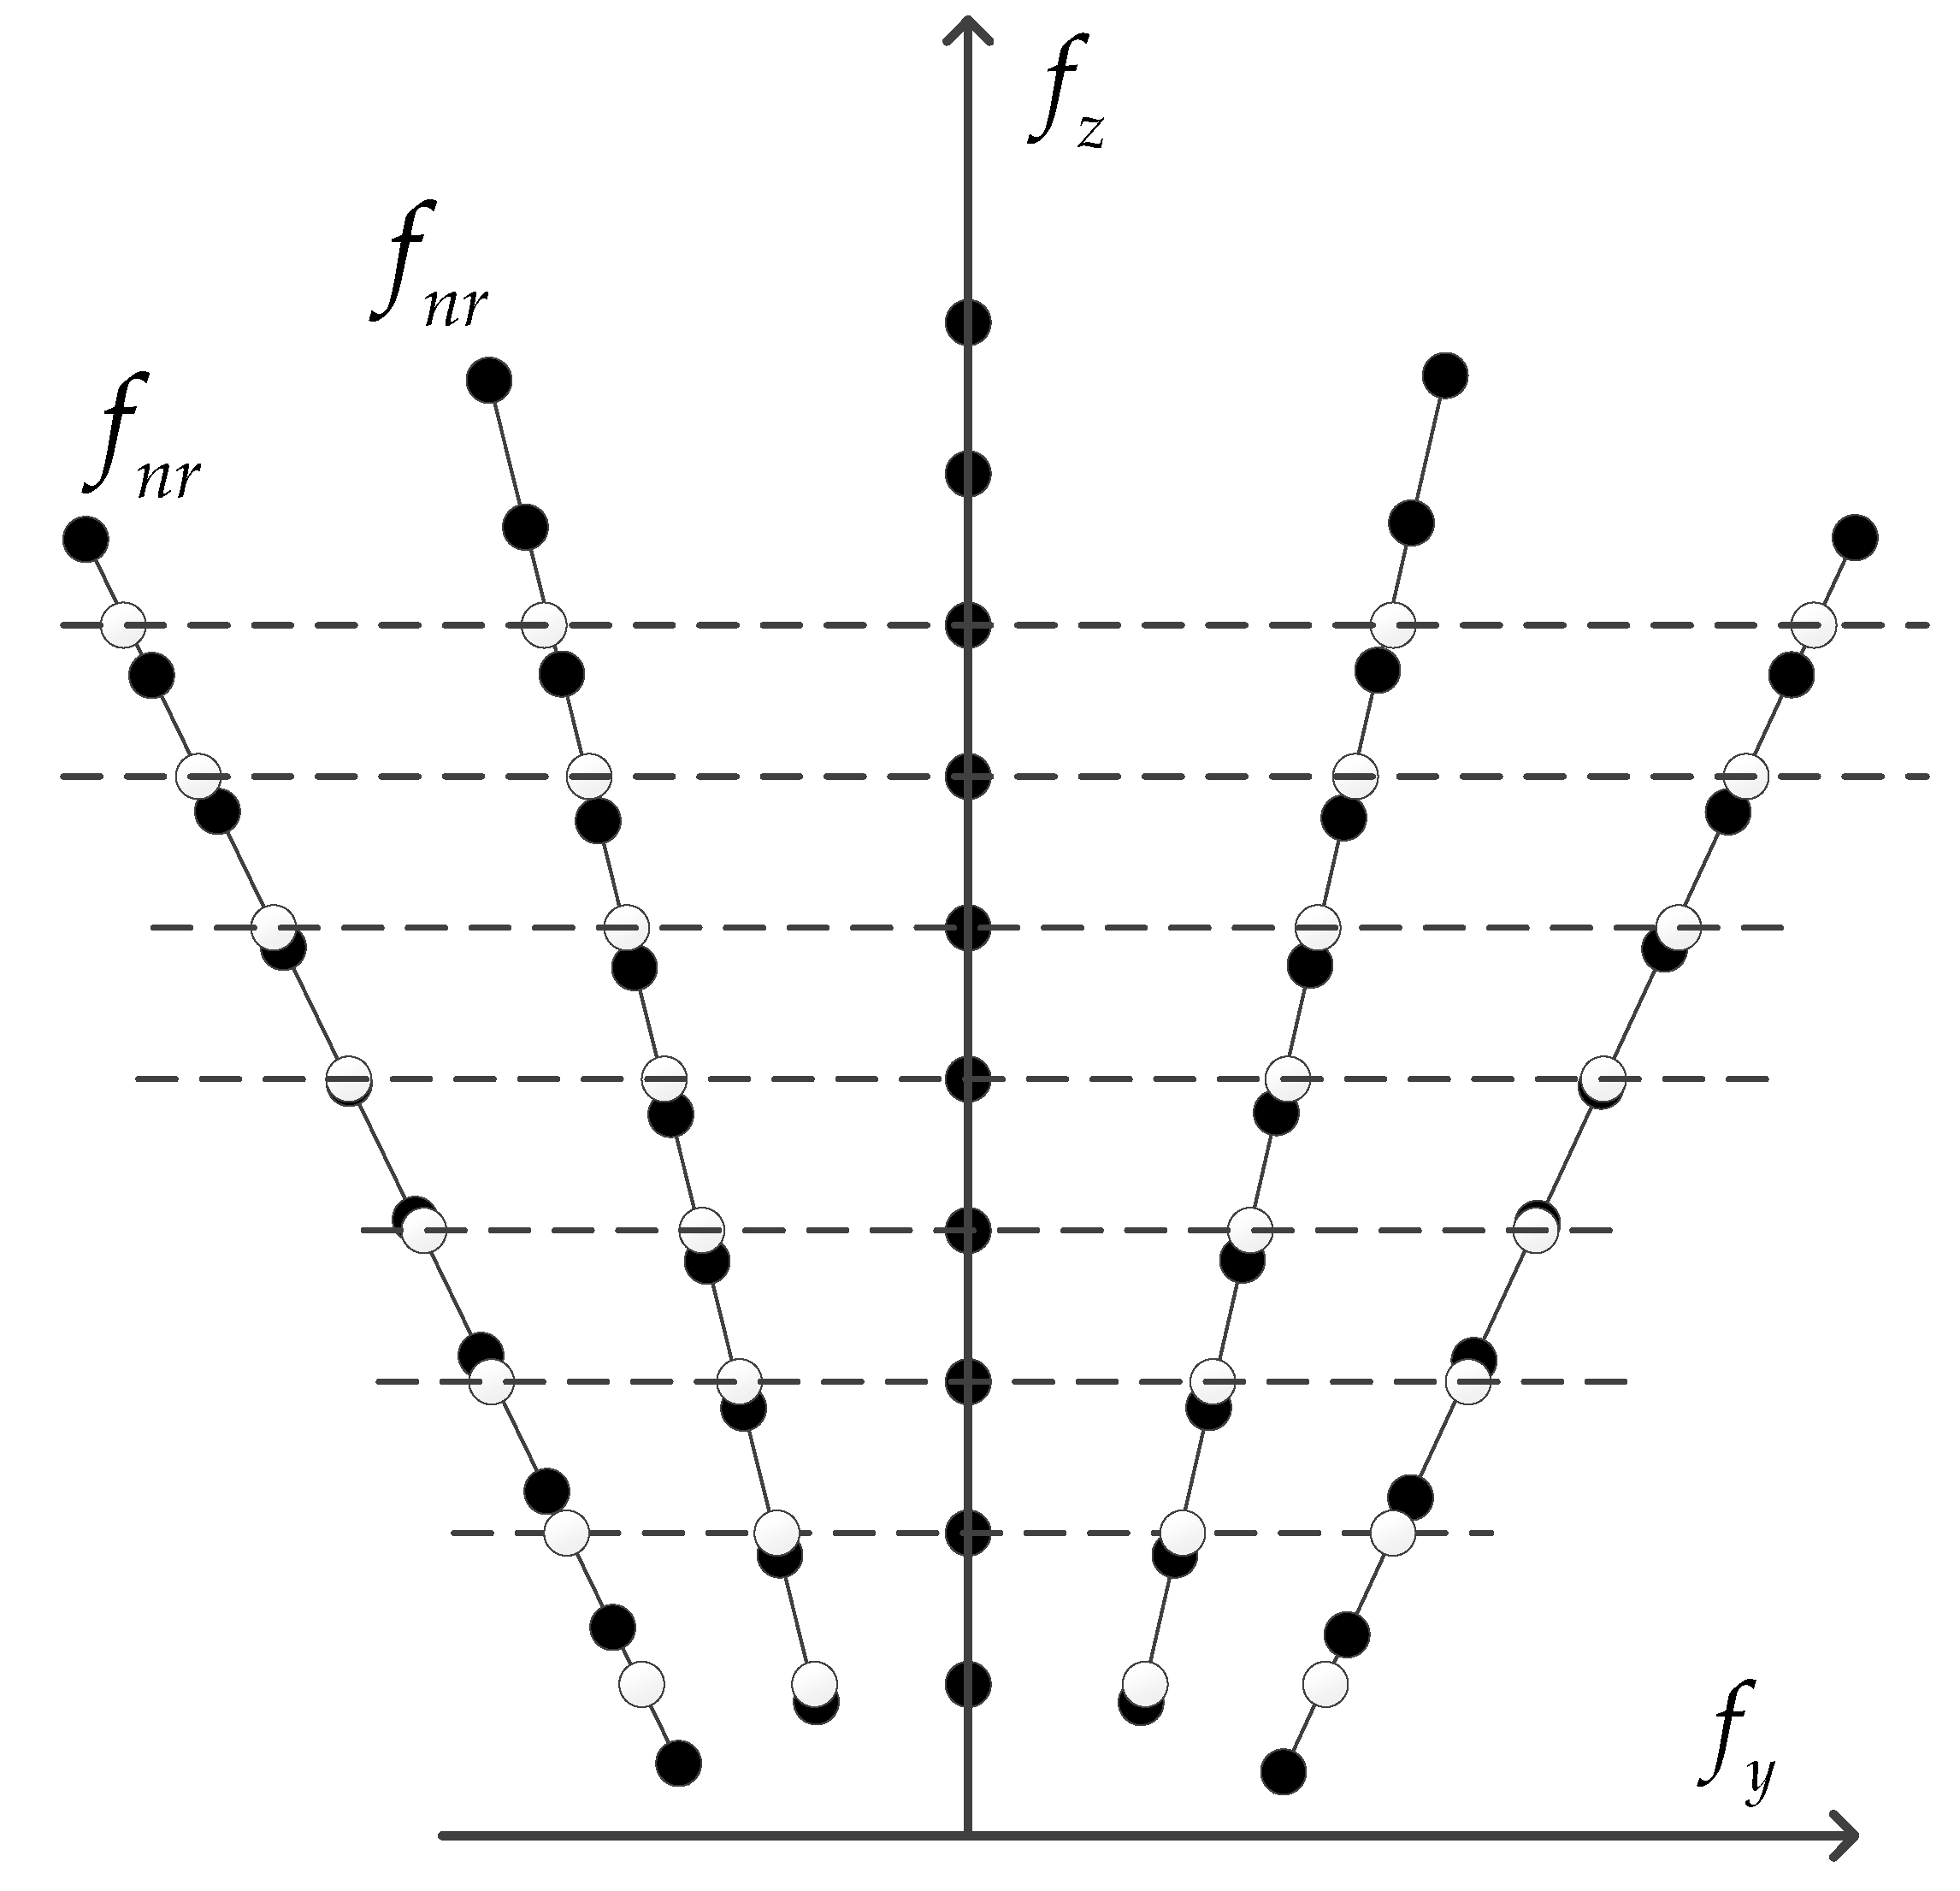
For Equation (24), if compressed sensing imaging in the azimuth direction is to be performed, f z z needs to be made constant in the same range unit. Compared with ISAR imaging technology, ISAR achieves the azimuth resolution through multiple pulses. In this paper, the azimuth resolution is achieved by sampling the space through the array elements at different positions, but its signal model has certain similarities. Figure 7 shows the spectrum support region.
As shown in Figure 7, when the echo of each array element is equal in f n r , f z varies. This is because the angle of line of sight of each array element is different. Therefore, to complete compressed sensing imaging in the azimuth direction, it is necessary to interpolate the echo in the range direction. Then, f z in the echo of each array element is constant. Take the line of sight direction of the central array element as the standard. The interpolation diagram is shown in Figure 8:
As shown in Figure 8, “ Remotesensing 13 03817 i001” is the received signal after interpolation, which is recorded as s v . in this way, imaging in azimuth direction can be performed for each f z i z i , i.e.,
s r ( f x , f y , f z i ) = l = 1 M N σ l exp { j 4 π c ( f x x + f y y ) } exp ( j 4 π c f z i z i )
The last phase terms are constants, which can be combined into the scattering coefficient σ l :
s r ( f x , f y , f z i ) = l = 1 M N σ l exp { j 4 π c ( f x x + f y y ) }
Perform compressed sensing imaging on Equation (26), and σ l ( x , y , f z ) can be solved for any f z . Then, pulse compression is performed on the σ l in the range direction, and finally the image is obtained. The imaging processing flowchart is shown as Figure 9.

4. Experiment Simulations

For the wide-area space multi-target echo signal, the multi-target echo separation and 3D imaging algorithm proposed in this paper constitute a complete imaging processing flow. The whole processing process is simulated with the same radar system. The parameters of radar signal and scene layout remain unchanged. This paper considers the sparse layout of array elements is carried out on the set grid.
Simulation radar parameter setting and array and scene layout are shown in Table 1 and Table 2, and the scattering coefficient of targets is assumed to be 1.
It is more reasonable to perform Fourier transform on the beat signal obtained after dechirp processing. At this time, the carrier frequency difference of the target is only determined by positions of different target points. If the range of the scene is Δ r , the range of the carrier frequency difference is 2 K Δ r c . Therefore, when sampling the beat signal, the sampling frequency only needs to meet the following requirements:
F s K 2 Δ r c
Because the imaging principles and processes of sparse array radar and full array radar are the same, in order to facilitate the display of methods and results, the next processing process will take the full array case as an example, coupled with the simulation results of the sparse array.

4.1. Multi-Target Echo Separation

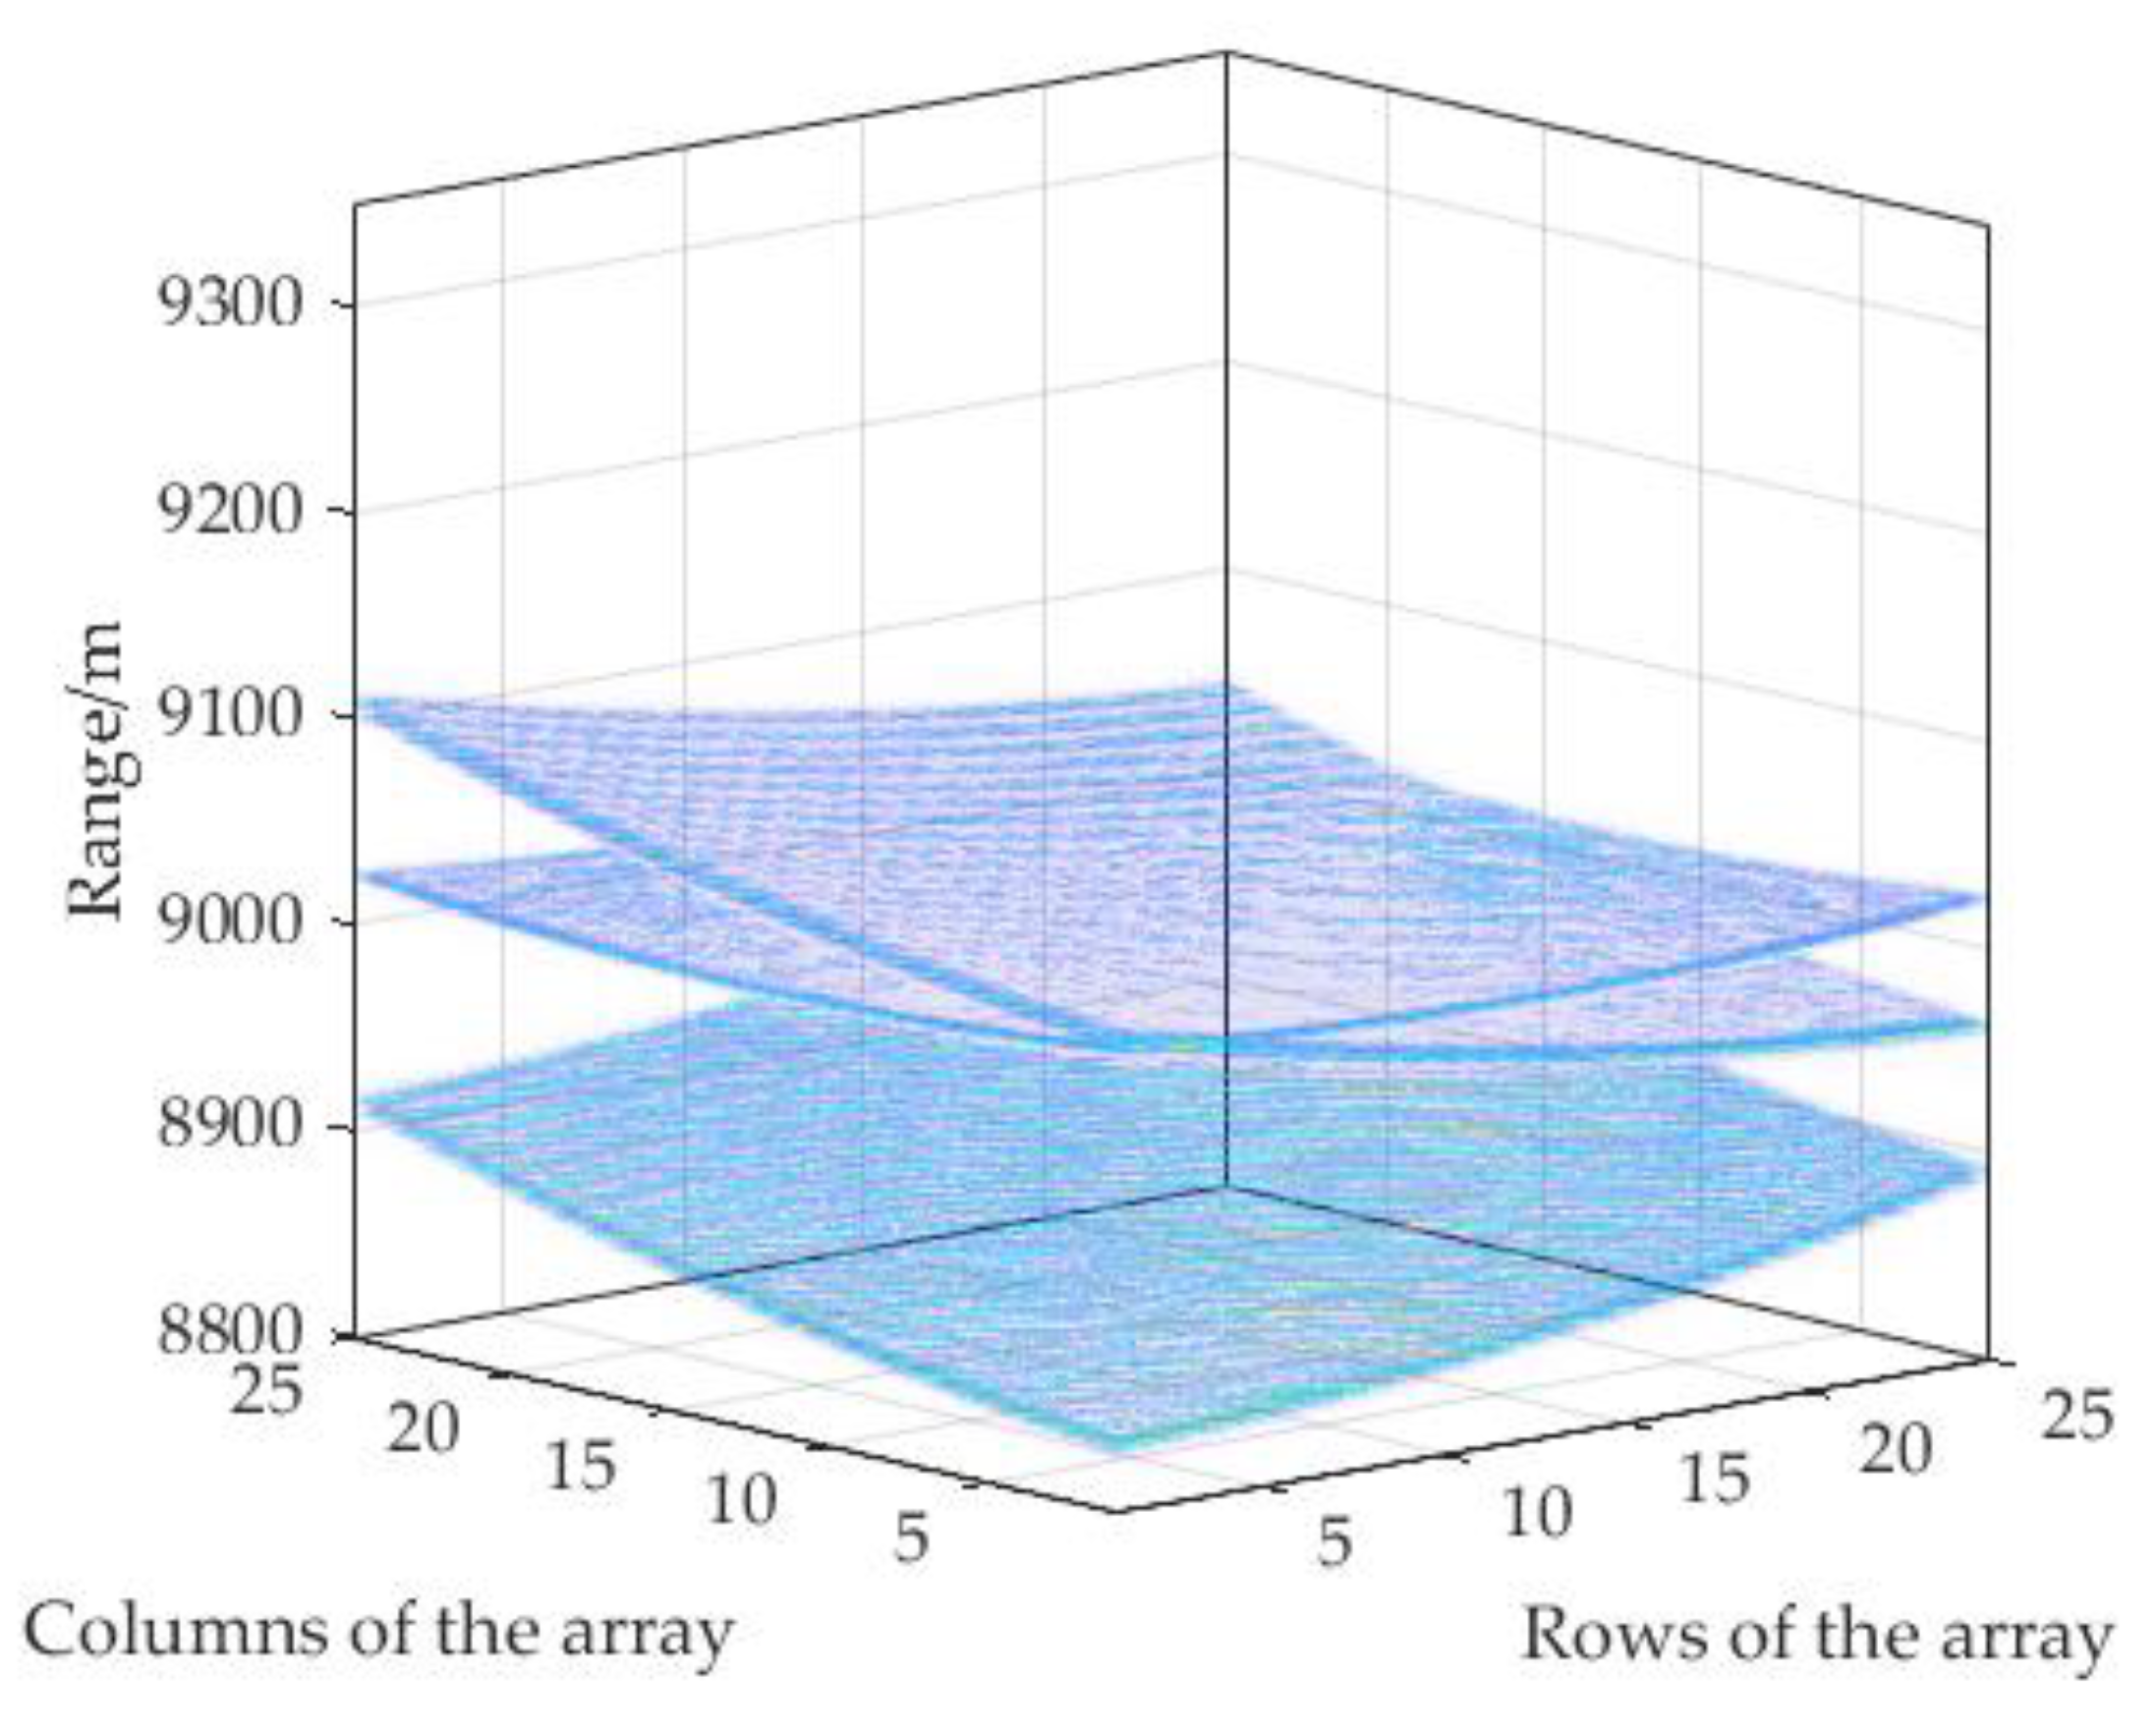
After dechirp processing, the result in 3D space is shown in Figure 10:
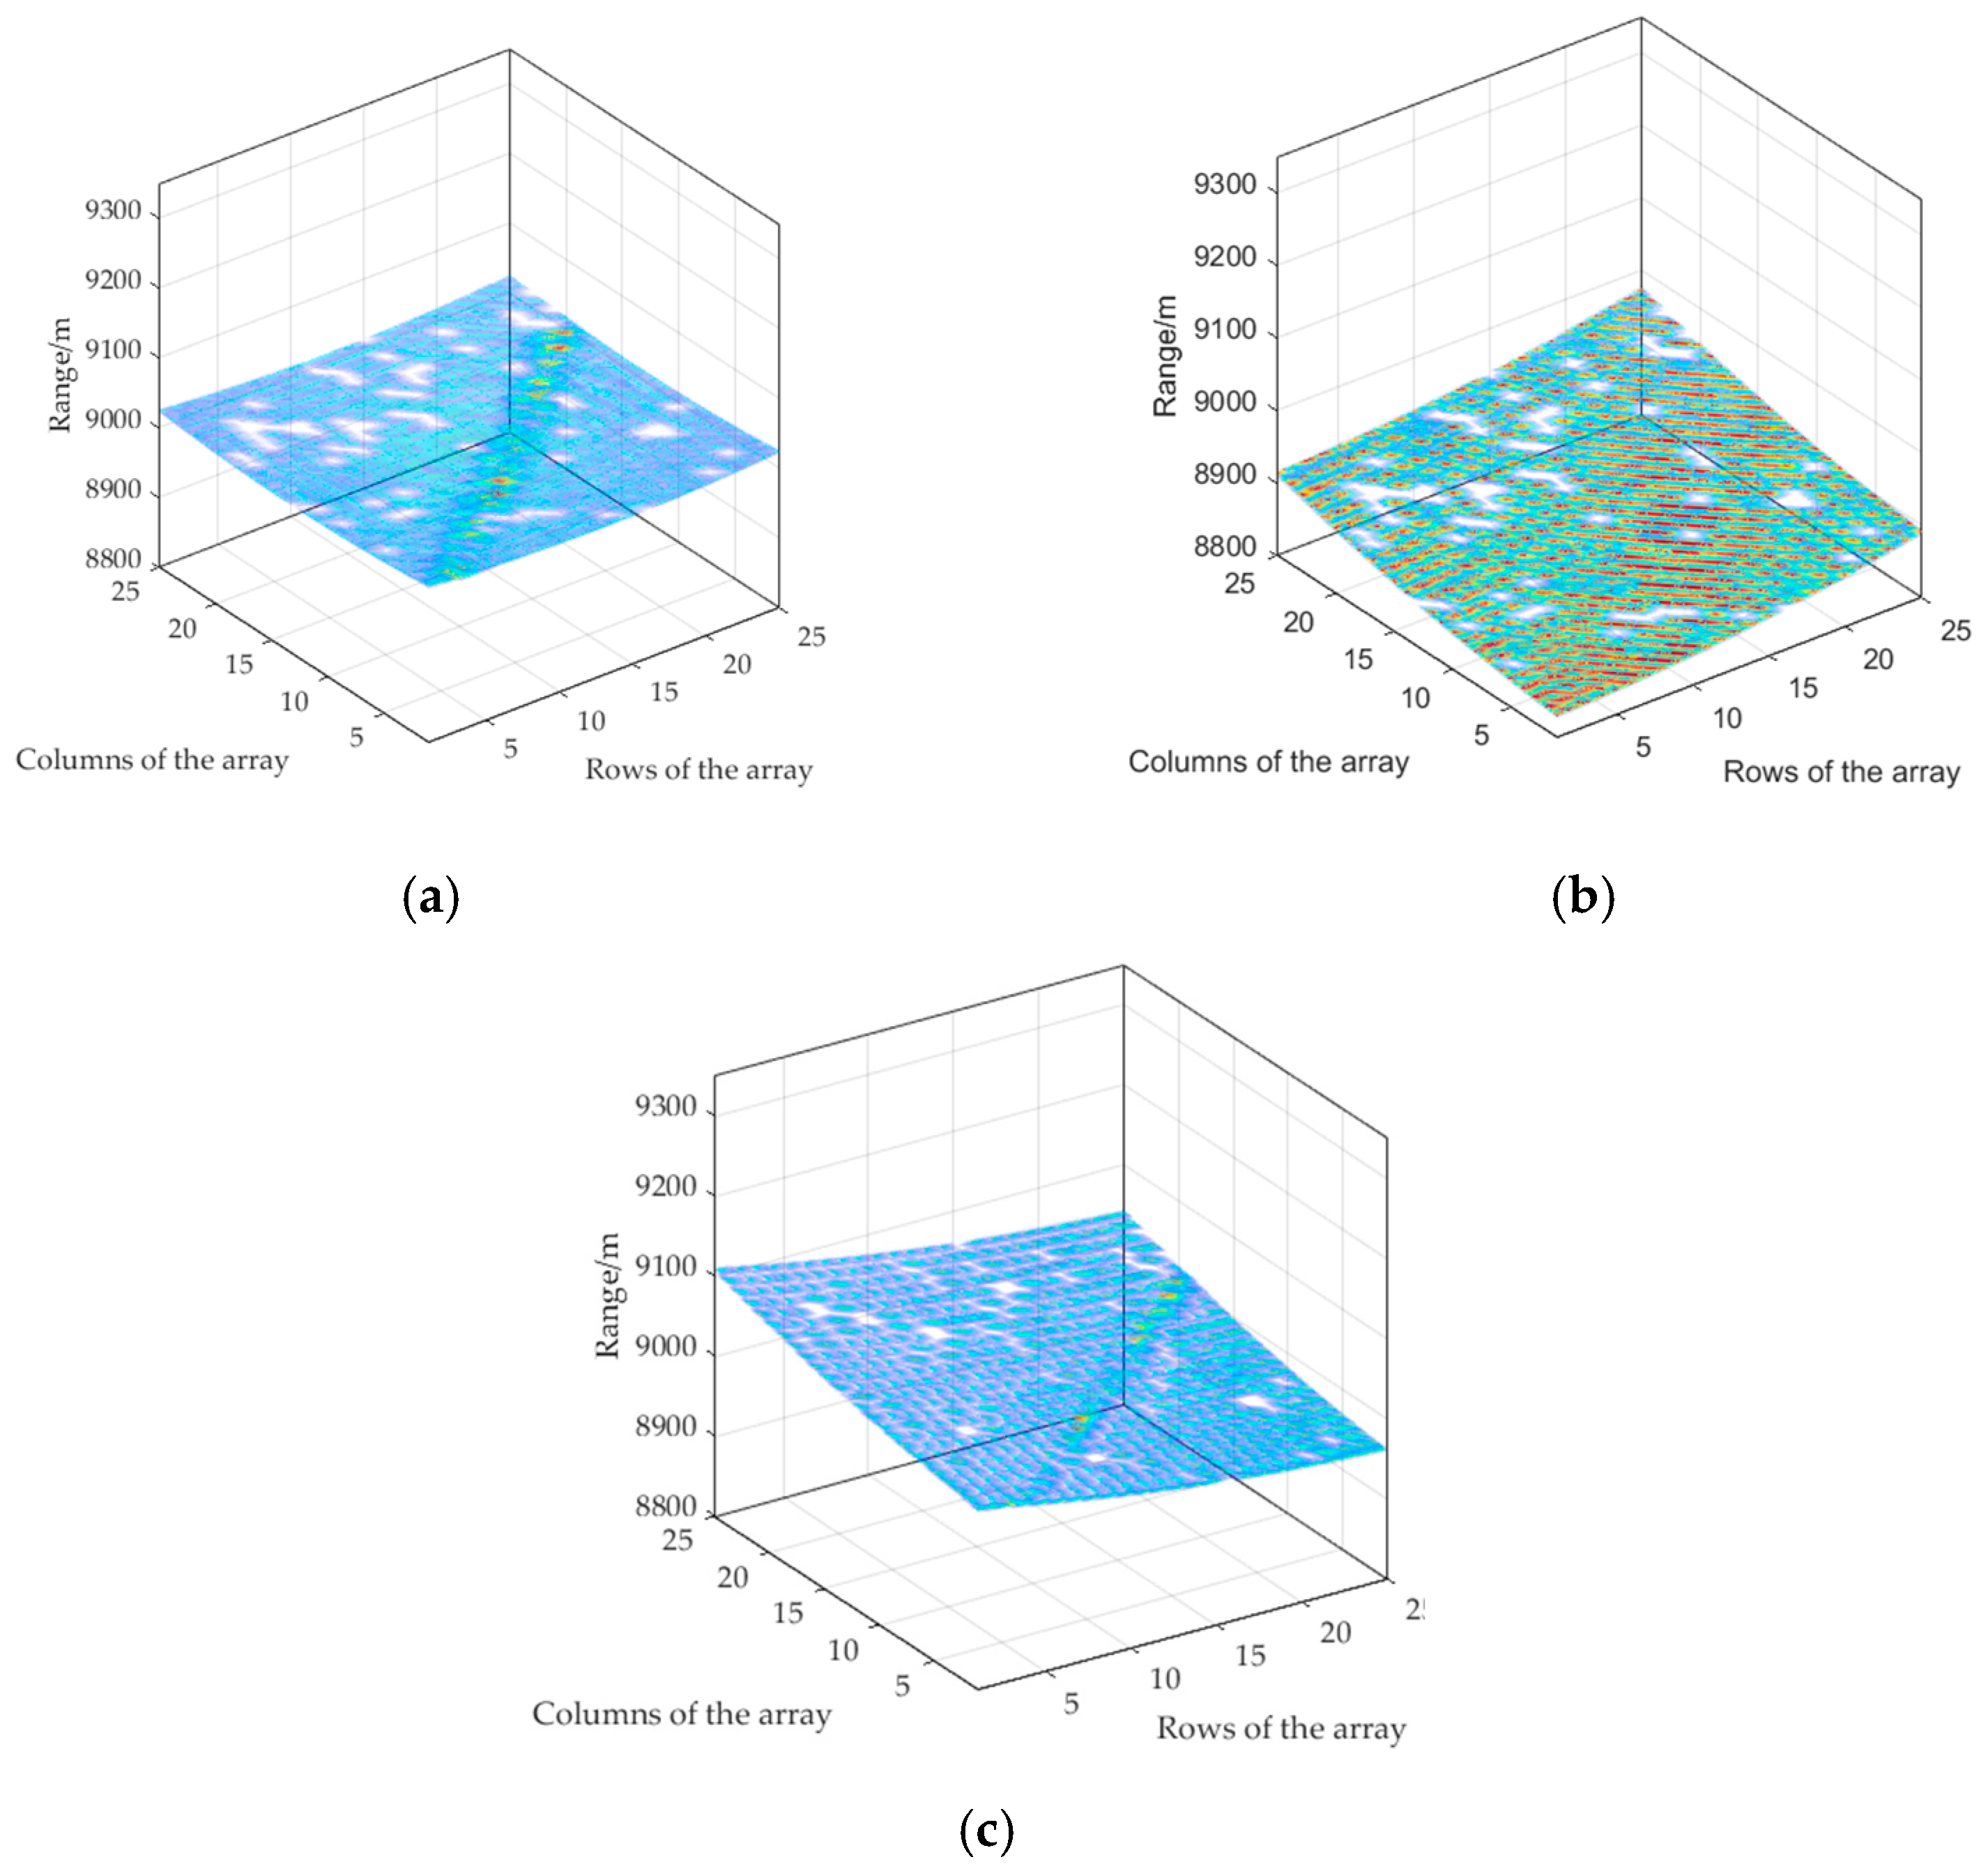
Obviously, it is impossible to separate the three surfaces directly in Figure 10. The range profile is divided into 25 sub-blocks along two edges of the array, so that targets’ range profiles can be approximately processed as planes in each sub-block. The parameters of the plane in the sub-block are detected according to the 3D Hough transform in Section 2.2. When using Equation (11), the imbalance between the range dimension and two azimuth dimensions of the 3D image may cause errors, so it is necessary to substitute the per unit actual distance d x , d y , d z into the equation.
x cos θ sin φ · d x + y sin θ sin φ · d y + z cos φ · d z + r = 0
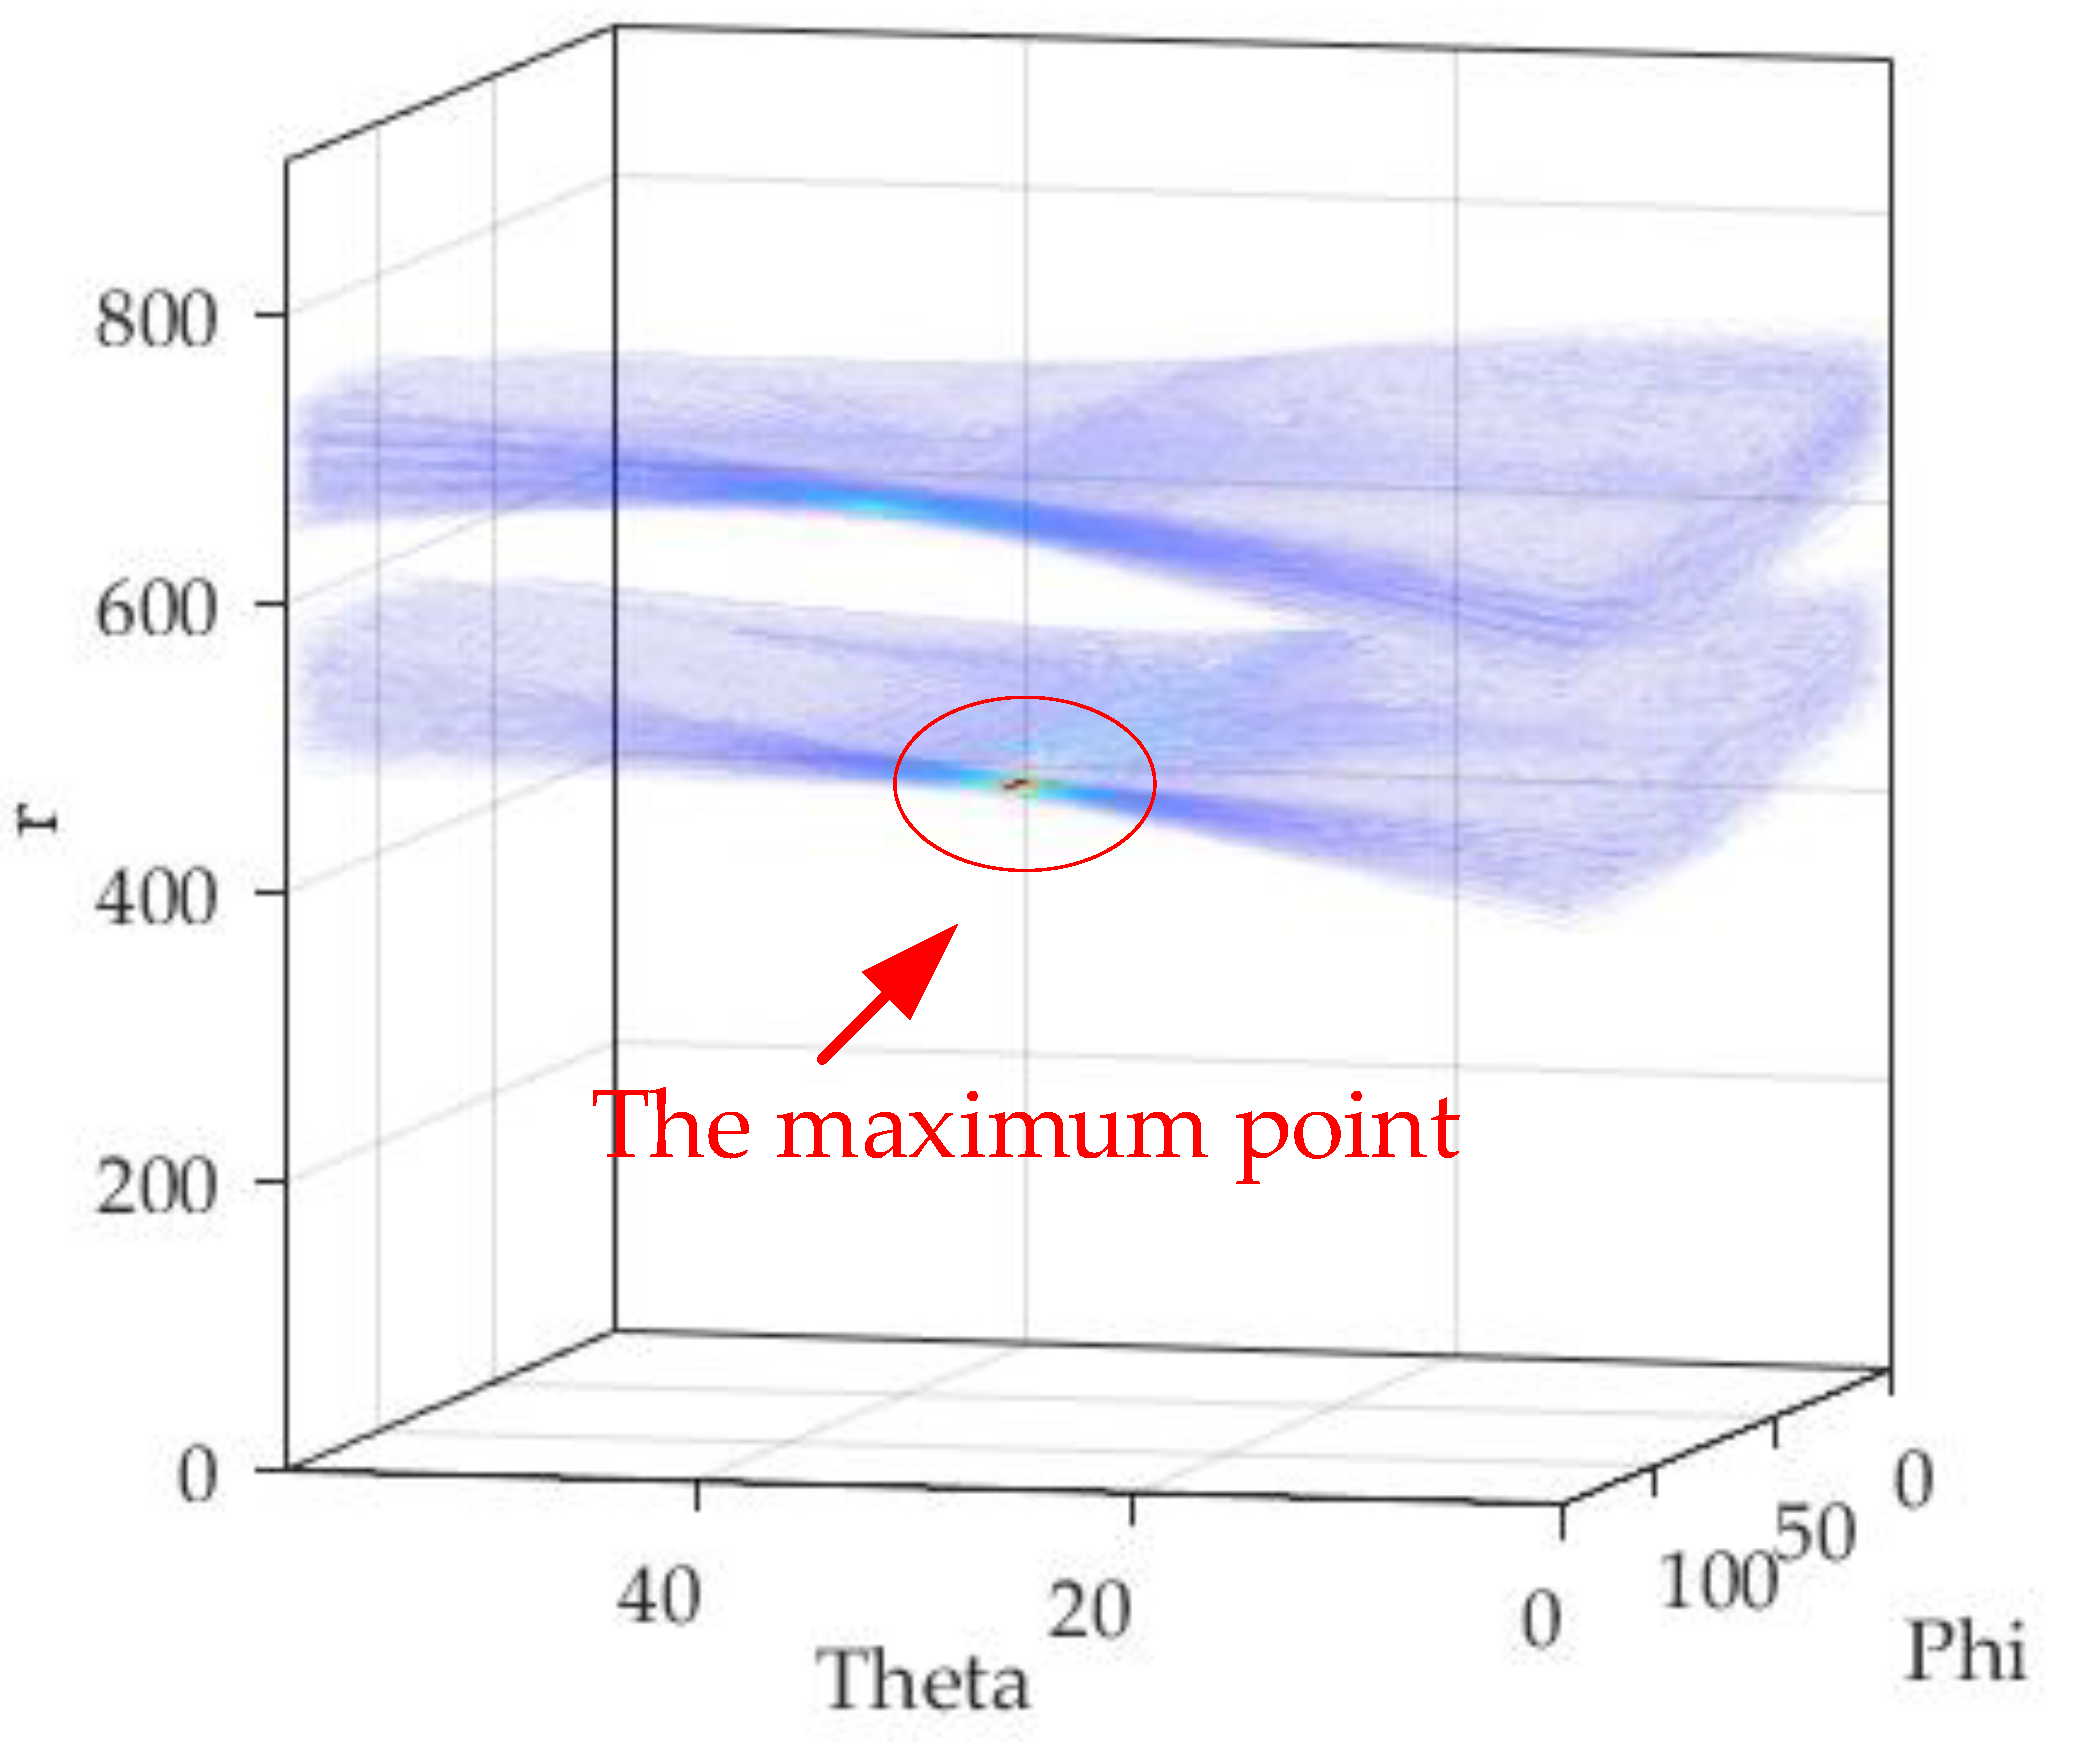
When range profiles to the parameter space are converted, as shown in Figure 11, the coordinate of this maximum point is the parameter of the plane.
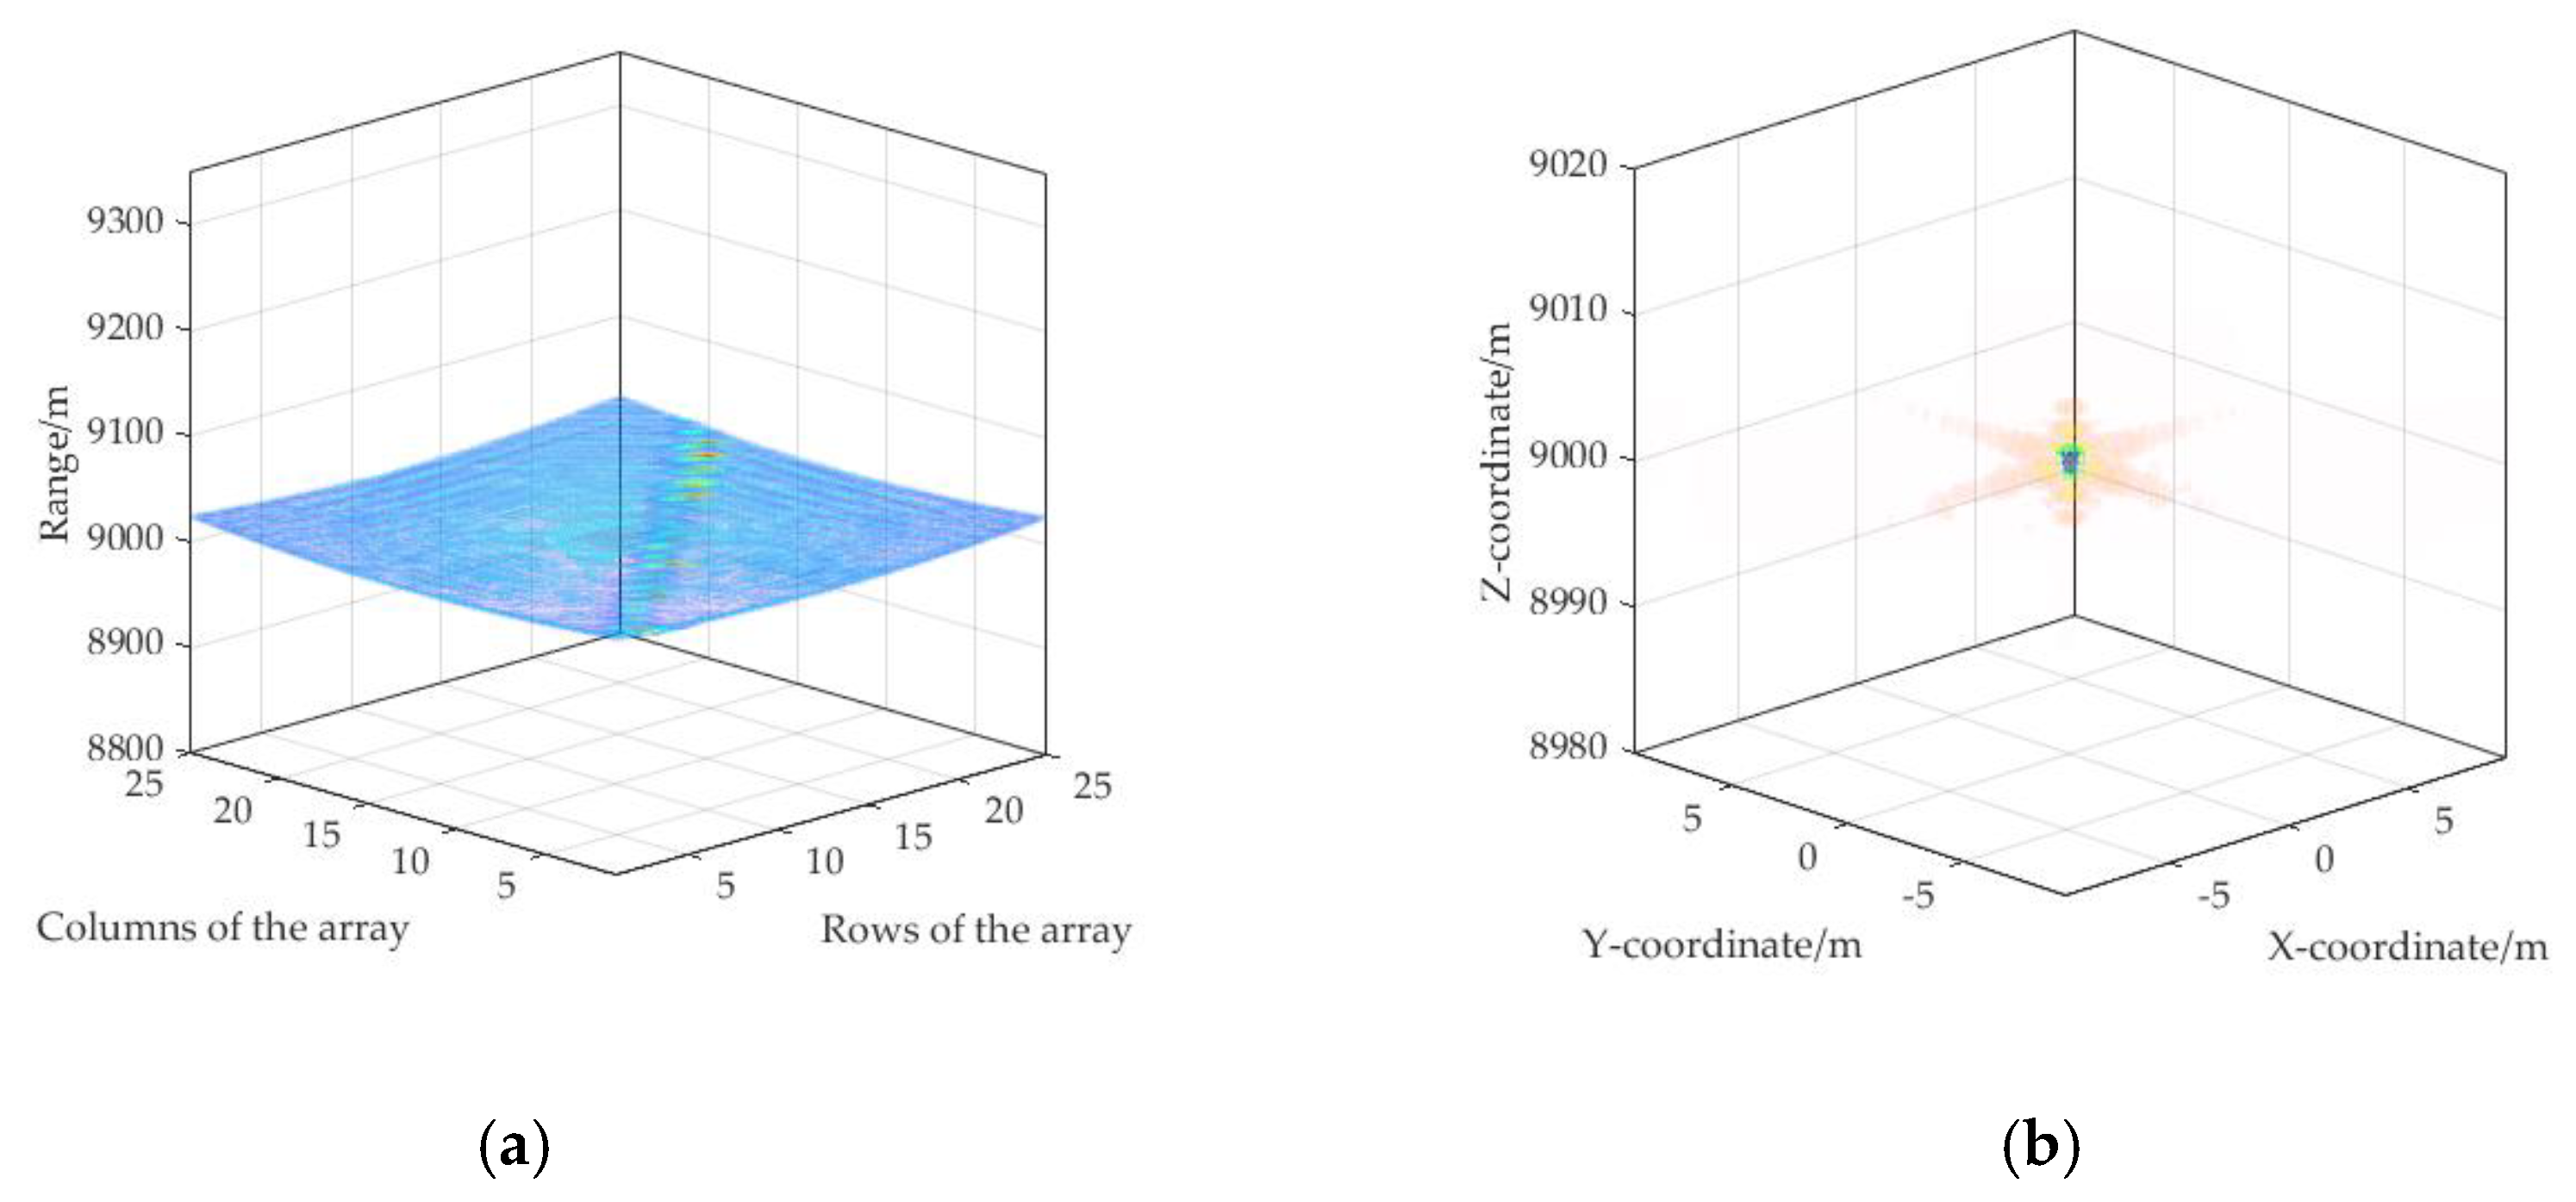
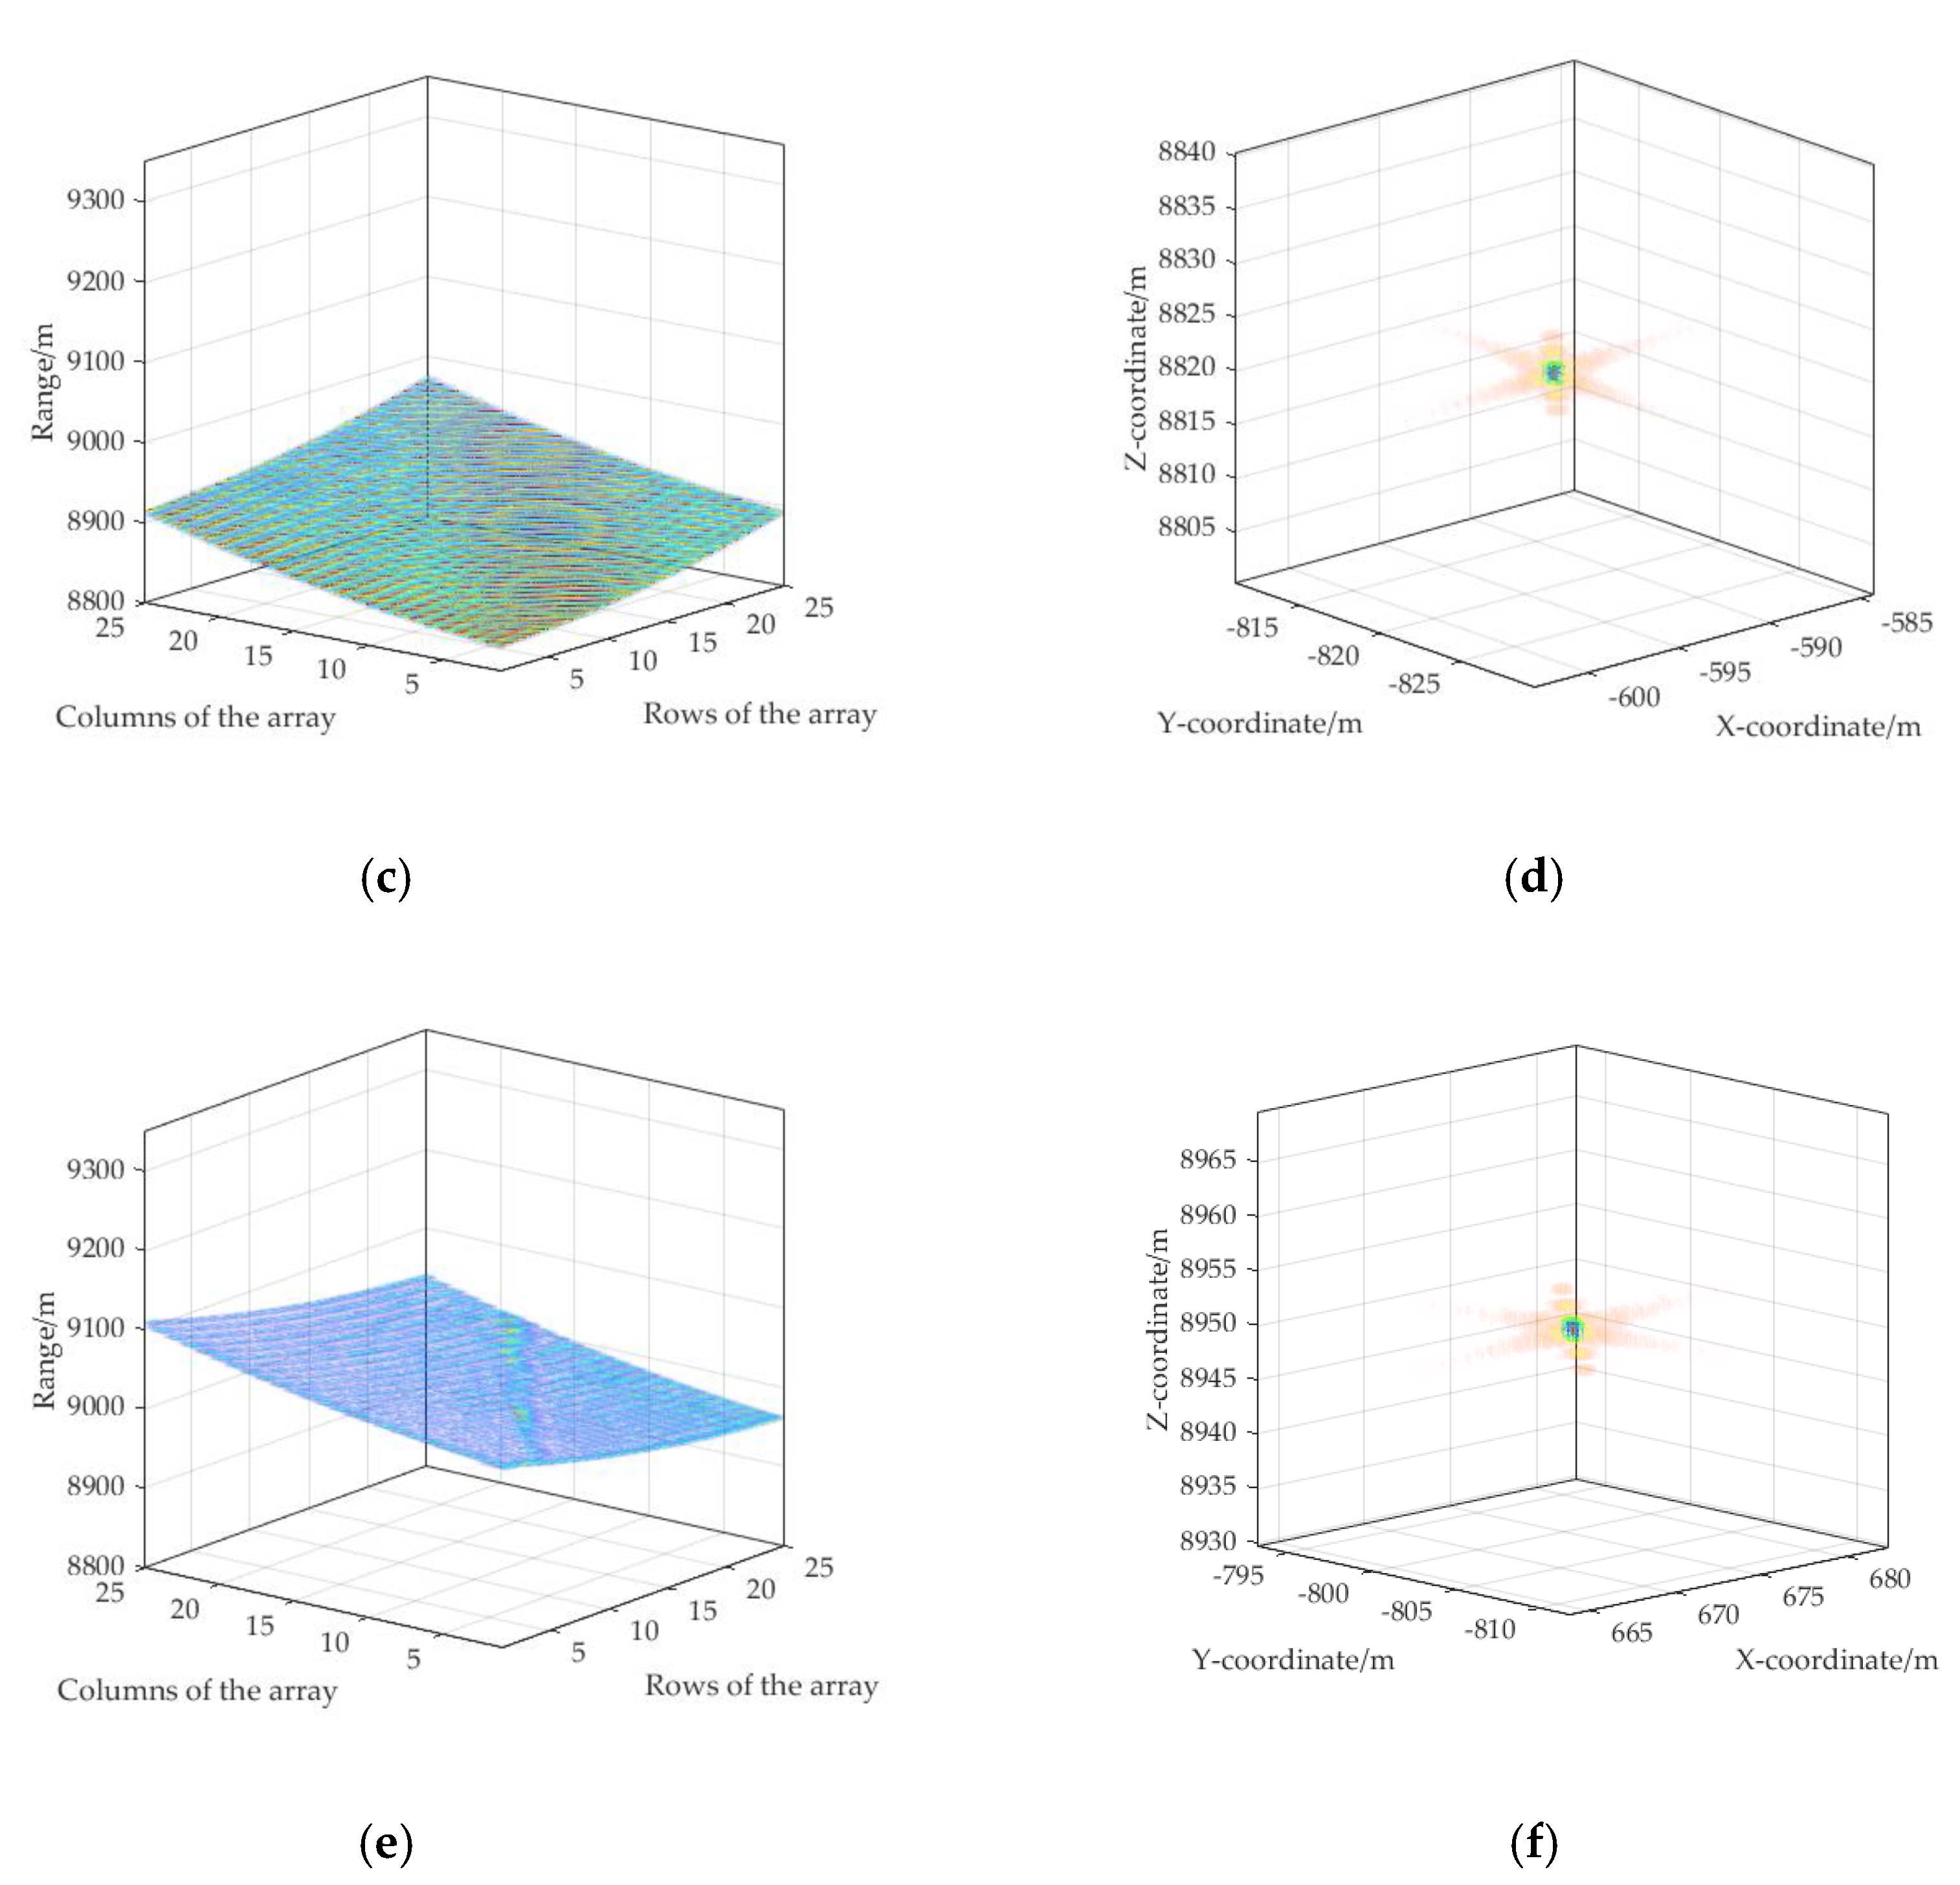
Figure 11 shows the 3D Hough transform result, from which the peaks can be detected easily. Furthermore, the corresponding plane in the range profile can be obtained, which means that the range profile of a single target in the sub-image can be extracted. After the separated single target range profile is processed according to the splicing flow of Section 2.3, the complete range profile of the single target is obtained. Each target can be effectively imaged by the back-projection algorithm as shown in Figure 12.

4.2. Compressed Sensing Imaging Algorithm

In order to show the resolution of the imaging algorithm in three dimensions, a single point target in the imaging scene is changed into three-point targets with differentiation in three dimensions. Assuming that the three-point targets are all in the imaging scene of target 1, the coordinates are (7, 7, 10), (7, 7, 10), and (−8, 6, 10). According to the method in Section 3.2, the echo is first interpolated in the range direction to get the echo signal s r , as shown in Figure 13.
After interpolation, in range units at the upper and lower ends, the data are partially zero. In order to avoid the impact of the window, the study abandons this part of the data and only keep middle parts of the data, as shown in Figure 14.
Then, basis pursuit and OMP algorithms are used for azimuth imaging of each range unit and obtain a two-dimensional azimuth image, as shown in Figure 15.
The data processed by compressive sensing in the azimuth direction are focused by matched filtering in the range direction, and finally, the three-dimensional image of the targets’ scene is obtained.
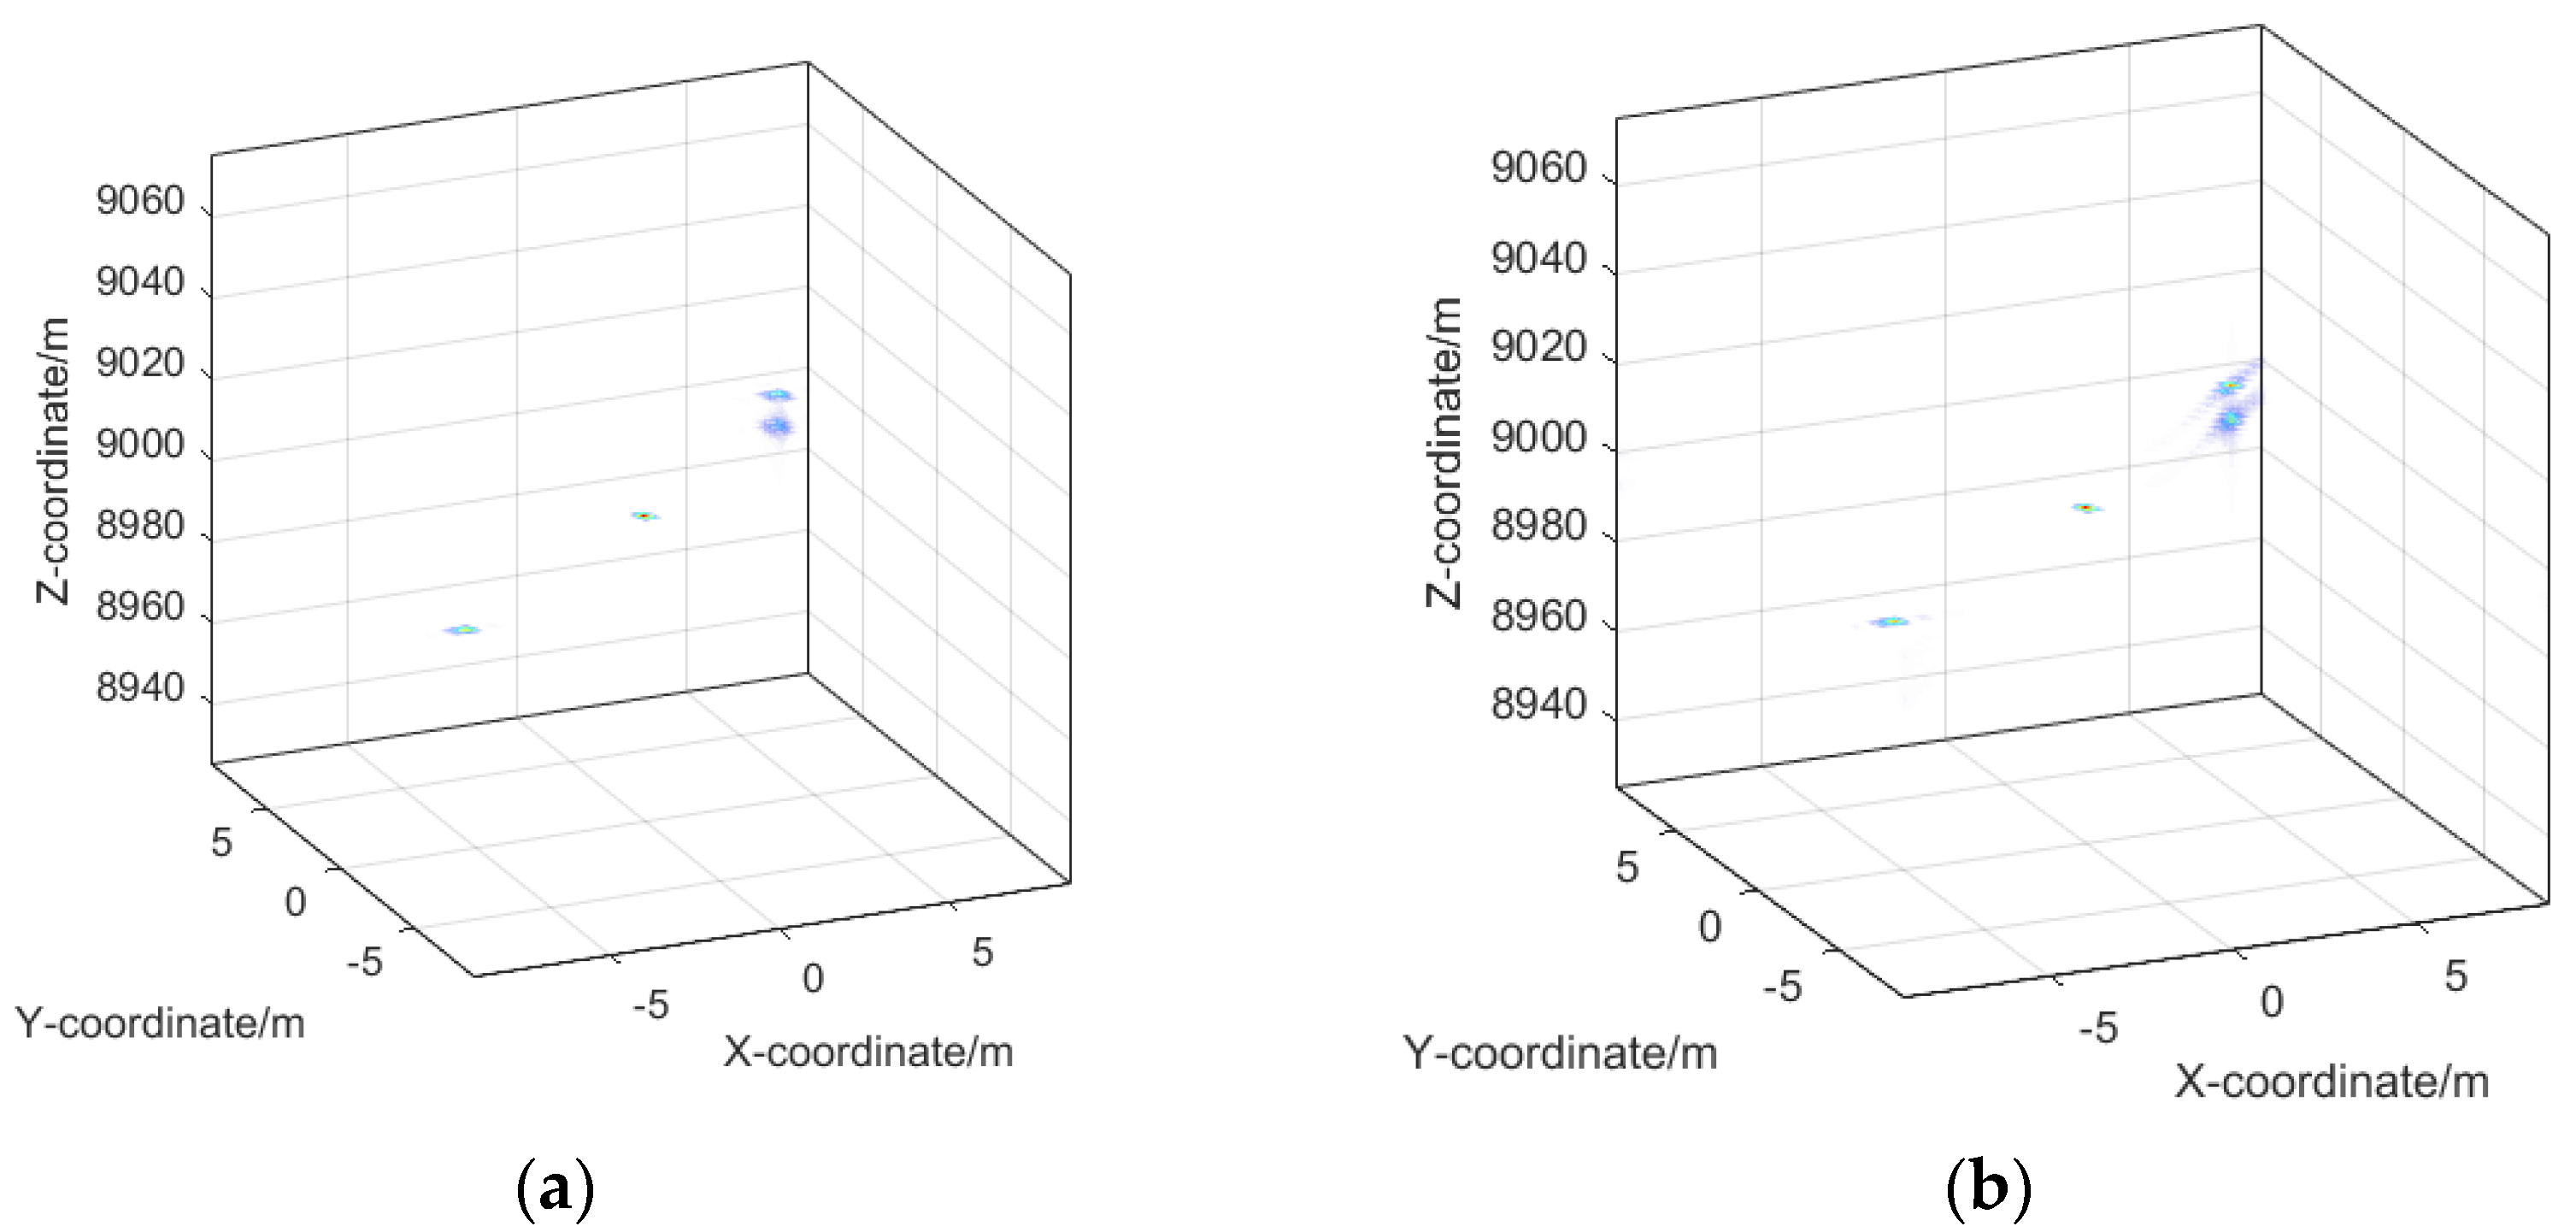
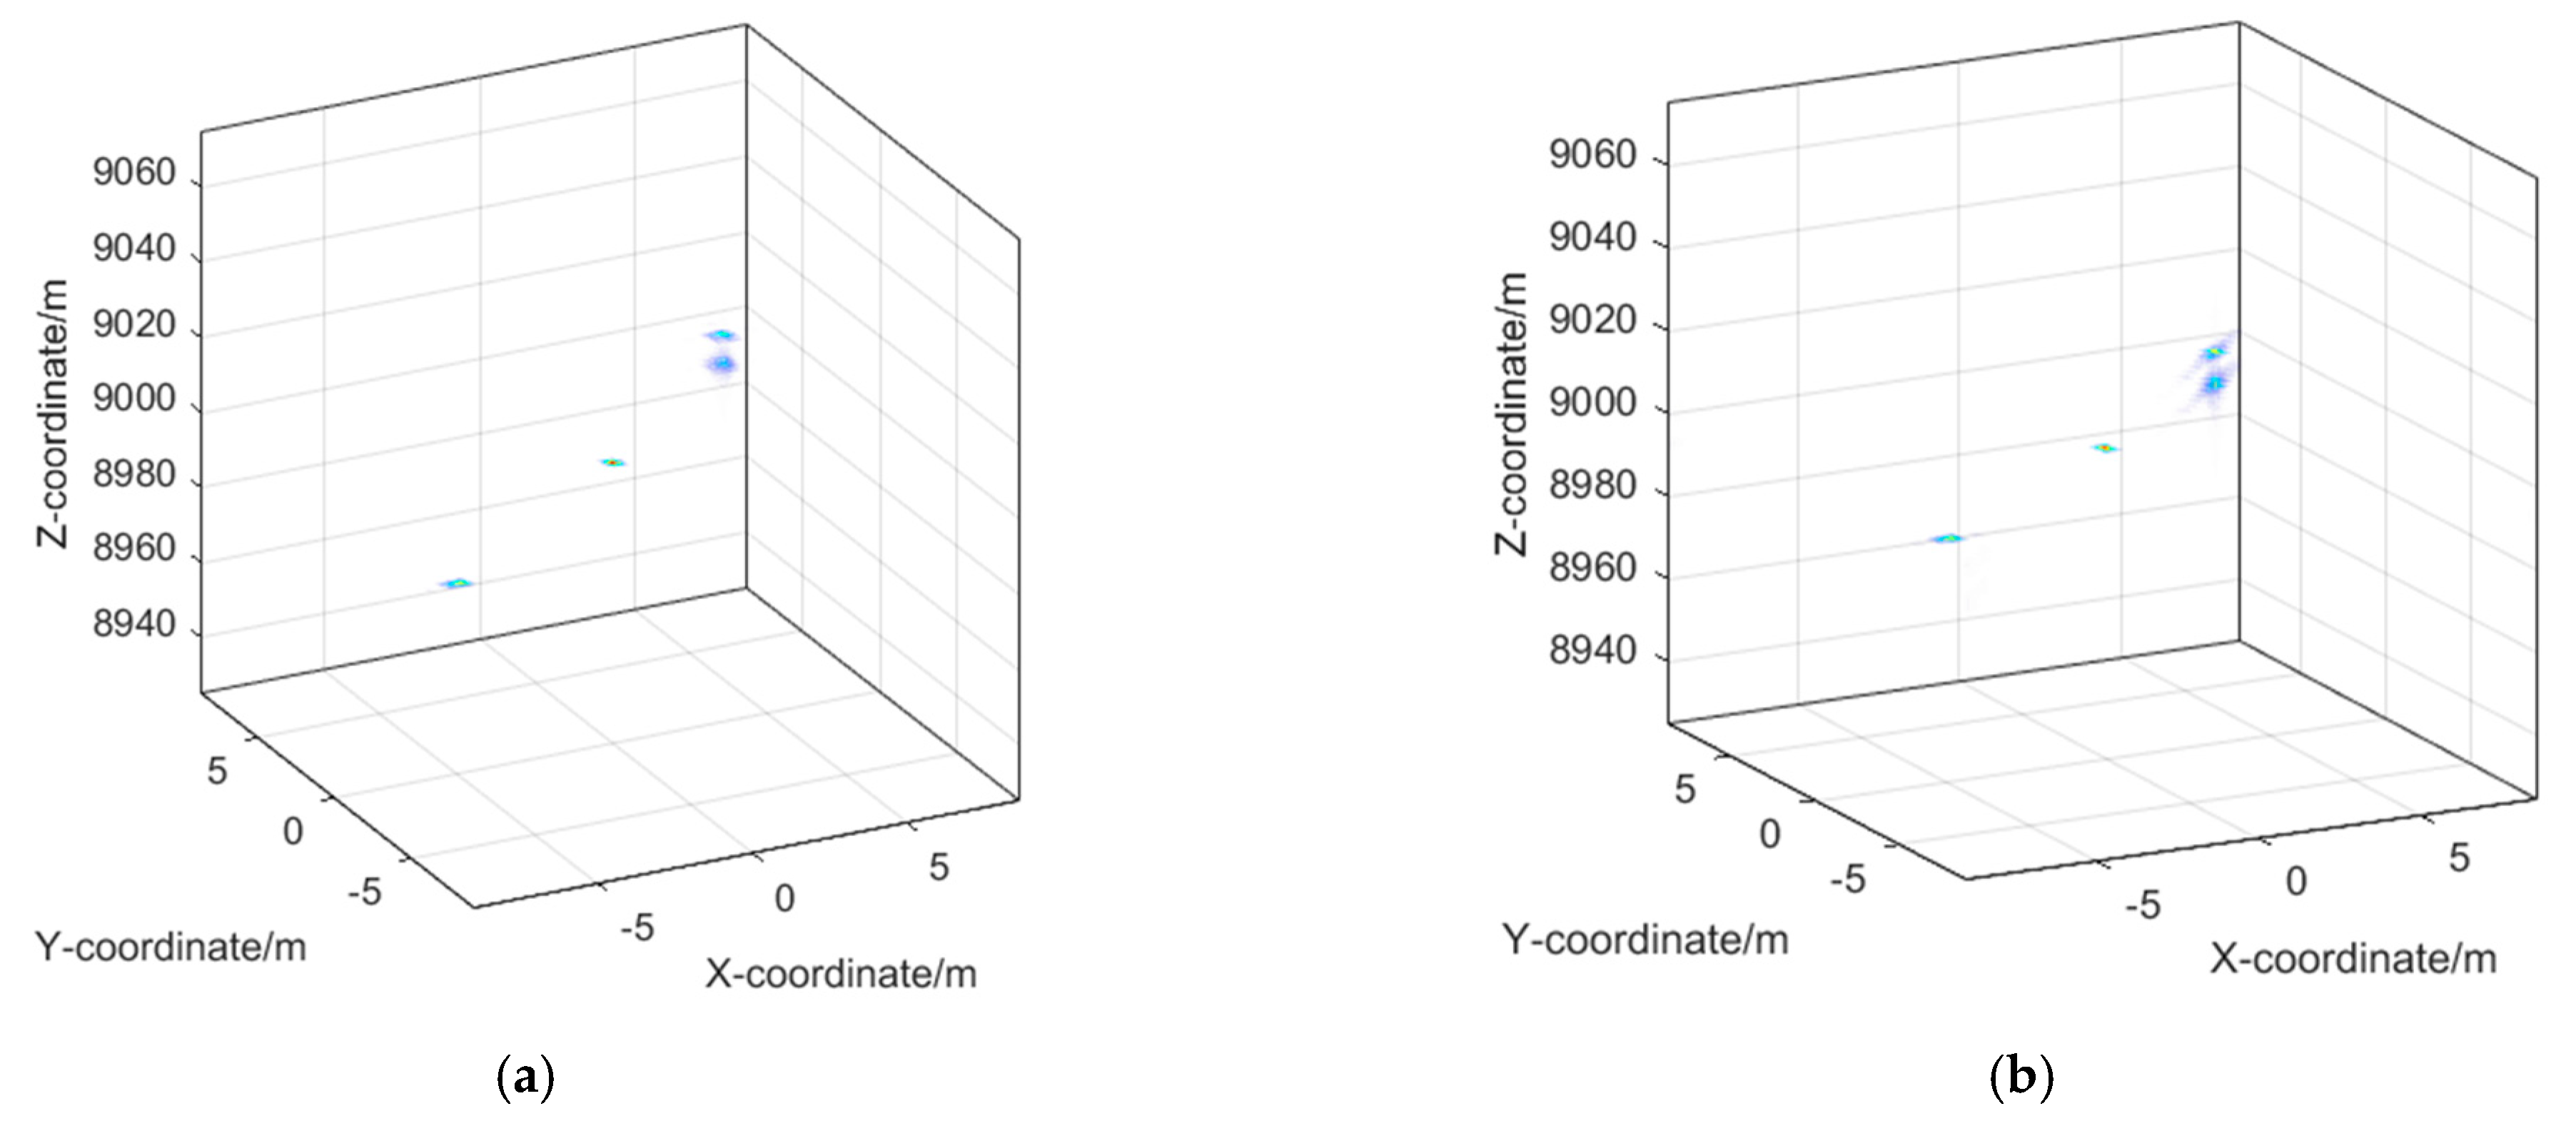
As shown in Figure 16, the proposed method can realize three-dimensional imaging and well distinguish the points arranged in the three dimensions.
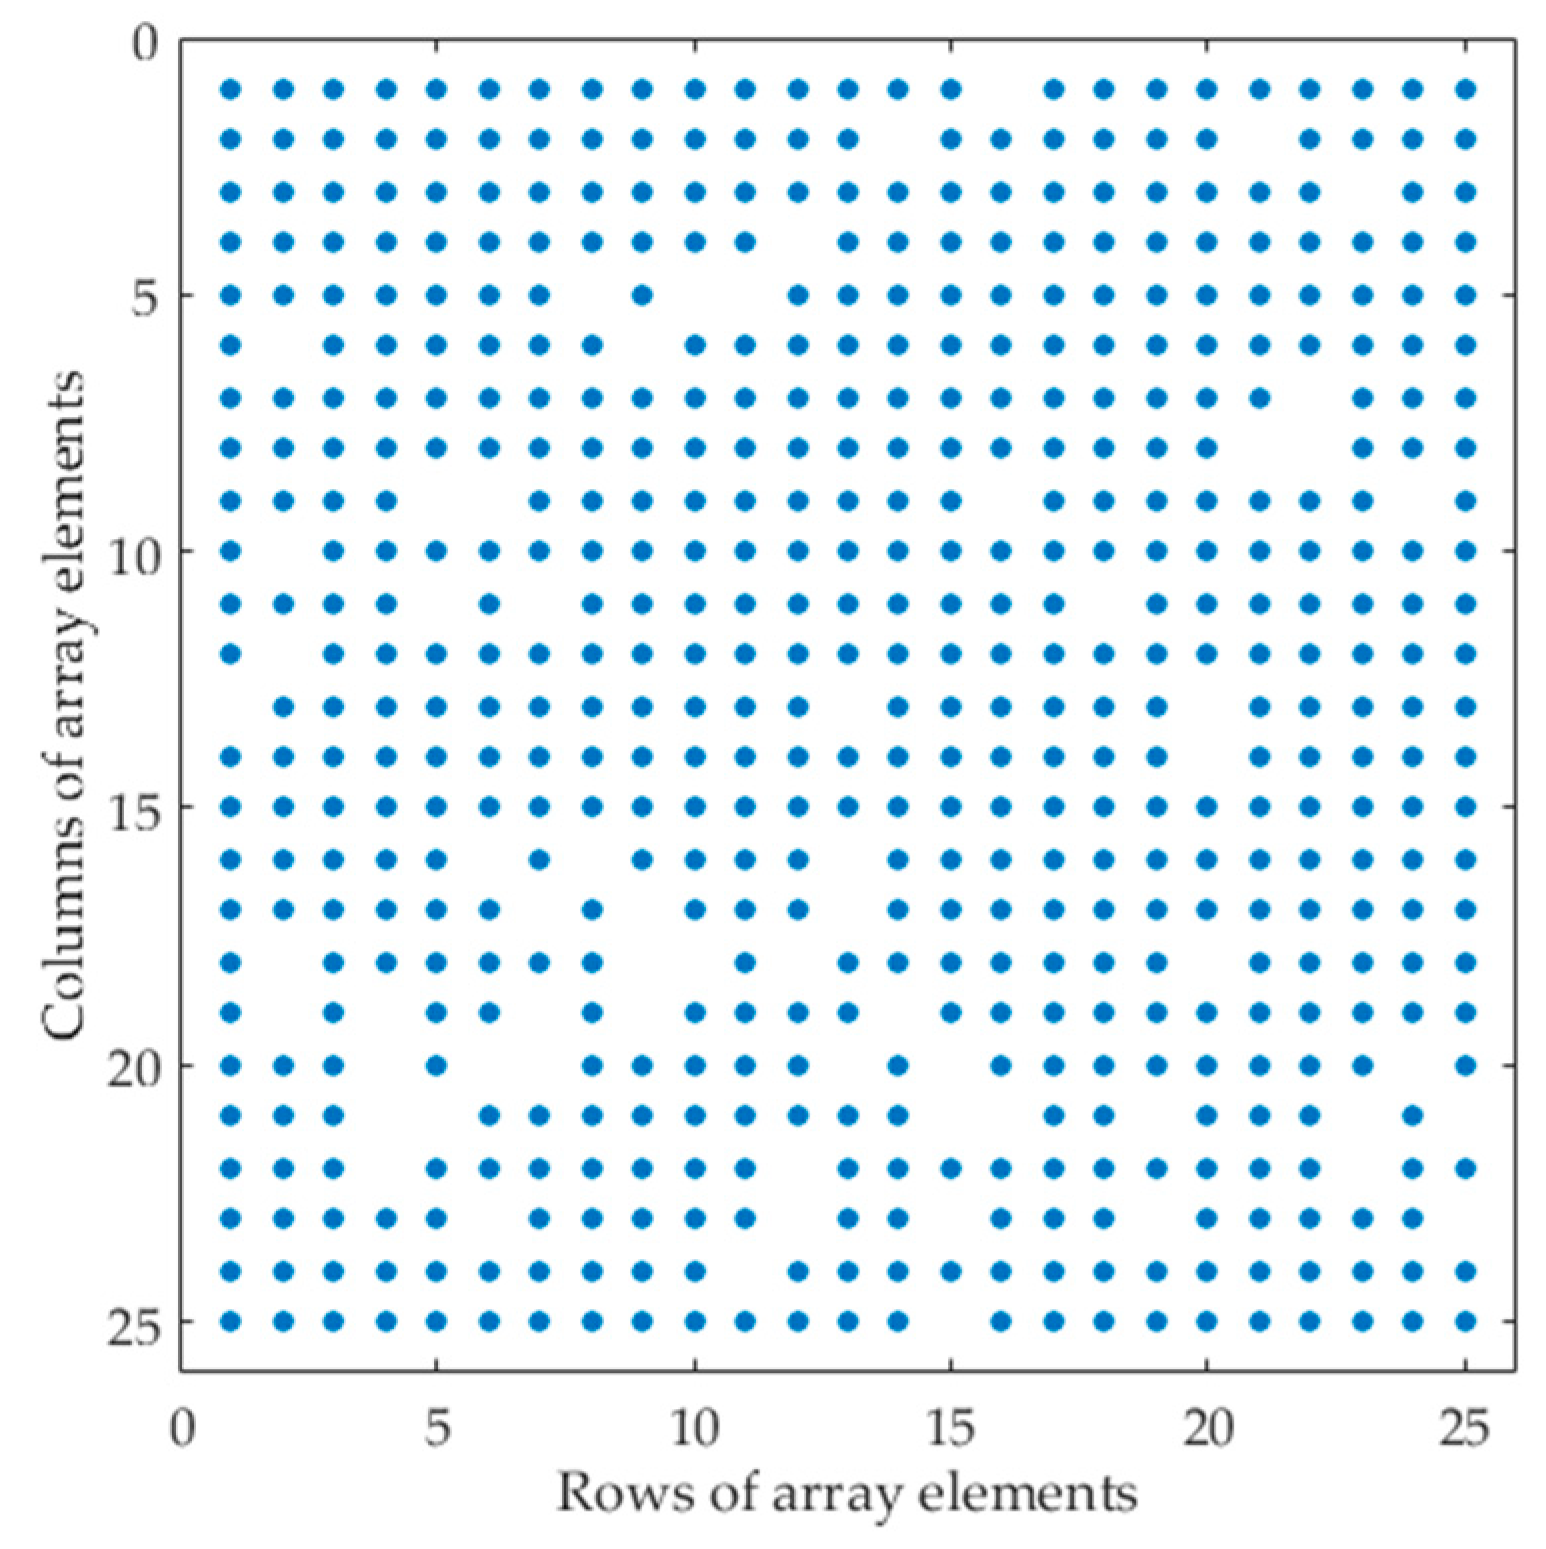
For the multi-target echo of the sparse array, the processing flow is the same as that of the above full array. The sparse array used in this paper is a random sparse array. A certain number of elements are randomly removed from 625 array elements. Here, this paper removes 65 array elements in the original array, leaving 560 array elements. The array elements distribution is shown in Figure 17.
The range profile obtained in 3D space is shown in Figure 18.
The echo of a single target can also be obtained by 3D Hough transform, and the separation result is shown in Figure 19.
For the signal of sparse array, because of its uneven spatial sampling, only the compressed sensing algorithm can achieve imaging goal in the imaging process. According to the above imaging process, the imaging result is shown in Figure 20.
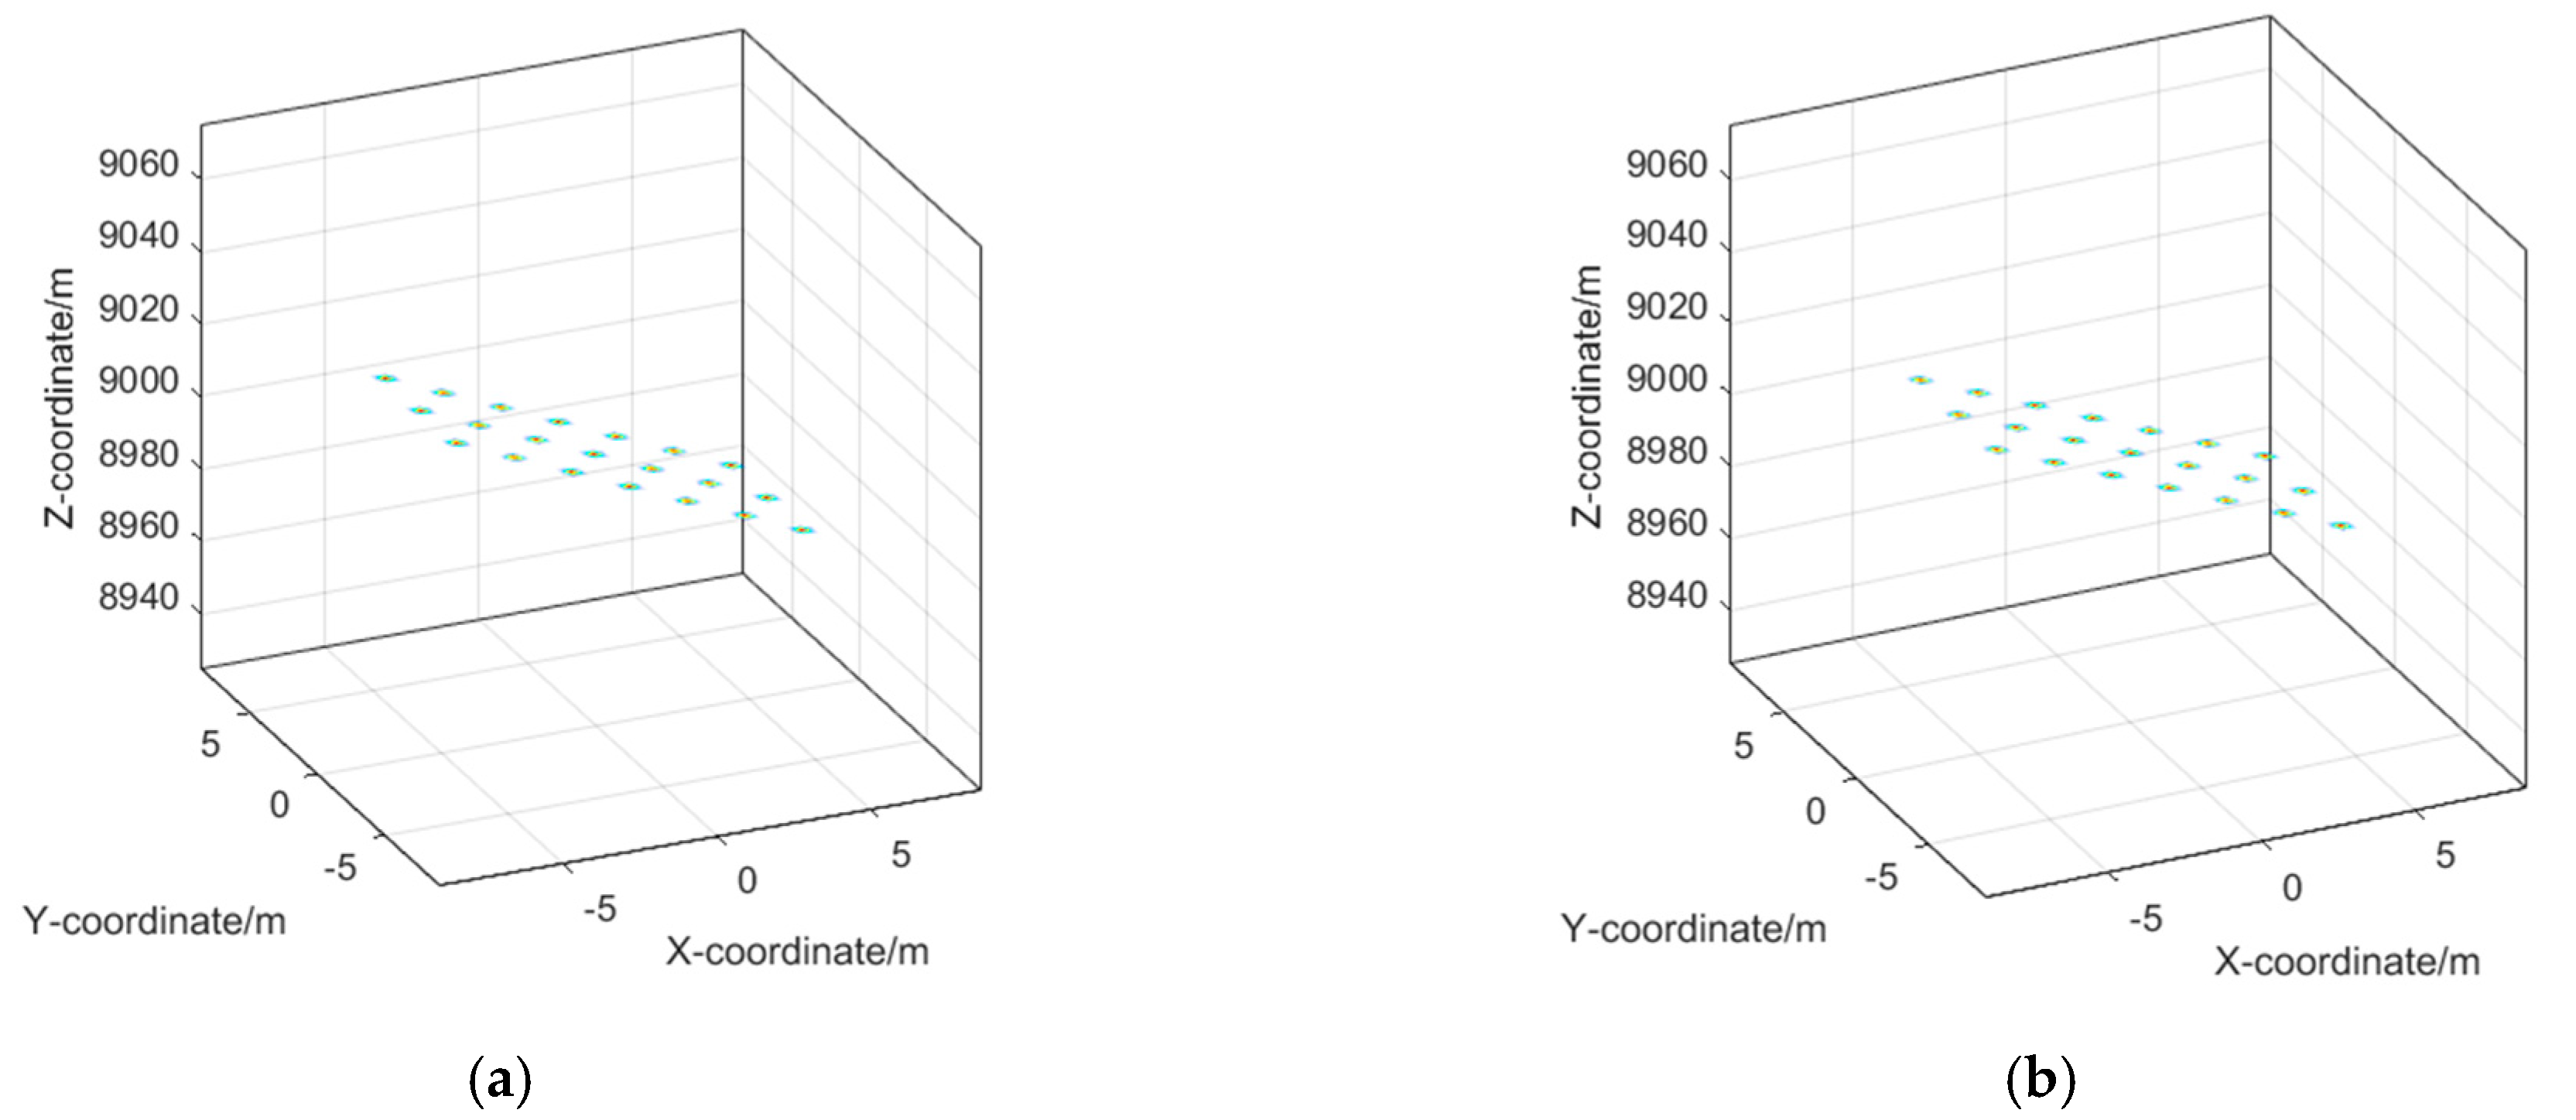
After simple point targets simulation, dot-matrix targets’ simulation is carried out as well. Targets information is set according to Table 3.
Simulation results are shown in below Figure 21. The electromagnetic characteristics of the model is displayed clearly.
These results of basis pursuit and OMP algorithm in the paper are not used for comparison. They can both verify the feasibility and effectiveness of the imaging algorithm proposed in this paper.

5. Discussion

The three-dimensional imaging technology of array radar obtains two-dimensional horizontal resolution by spatial sampling, and then realizes three-dimensional imaging in combination with the vertical resolution achieved by transmitting wide band signal. Because of sampling in space instead of time, the single snapshot imaging of the spatial target is realized. However, for the situation of many targets in the wide area, the range migrations of different targets cannot be solved uniformly. Therefore, this paper first proposes a multi-target echo separation method. By migrating the ability of Hough transform to detect straight lines in 2D space, this paper applies a 3D Hough transform in the three-dimensional range profile to separate the targets represented by different surfaces. In order to adapt to the condition that the target surface is not ideal, a method of dividing range profiles into sub-blocks is also proposed. Then, due to the non-uniform characteristics of the sparse array in spatial sampling, the traditional match filtering method cannot be used for imaging. This paper utilizes CS algorithms (both basis pursuit and orthogonal matching pursuit algorithms) in the imaging process to make use of the sparse characteristics of the single target echo. In this process, to avoid the huge amount of calculation in the direct processing of three-dimensional data and the influence caused by range migration, a MTDC-tolerated imaging method is proposed in this paper. Firstly, the echo is interpolated in the range direction according to the line of sight direction of the central array element. Then, the azimuth compressed sensing imaging is carried out in each range unit, and finally matched filtering is performed to make the data after CS focus in the range profile and realize 3D imaging. Both basis pursuit and OMP algorithms are utilized in simulations of point targets and dot-matrix targets, which can prove the feasibility and effectiveness of the proposed 3D imaging method.

6. Conclusions

To achieve the goal of 3D imaging, there must be enough dimensions of the radar system’s observation in principle. Methods mentioned before [13,14,15,16,17] are all based on ISAR imaging technology and expand another dimension by obtaining additional information such as targets’ rotation and angles variation, etc. Different from these methods, this paper based on the 2D radar array can avoid coherent time accumulation with two-dimensional space sampling and realize 3D imaging in a single snap. The study realizes 3D imaging based on the sparse 2D array. Because angles of line of sight from radar to targets are various, it is hard to process the signal containing all the targets uniformly. Three-dimensional Hough transform is utilized to separate different targets’ echoes before imaging processing by detecting and separating different planes which represent targets in range profiles. On the problem of sparse array, due to the non-uniform space sampling, matched filtering cannot be used for imaging in the azimuth direction. This paper proposes an MTDC-tolerated imaging method based on the CS theory. Firstly, it can successfully solve the huge computation burden of directly imaging processing on three-dimensional data with the CS algorithm. Besides, the method proposed in the paper combines the CS algorithm in azimuth direction with matched filtering in range direction in order, which can avoid MTDC problem in the imaging process. The simulation can show the great potential of the proposed method in the applications of radar 3D imaging.

Author Contributions

All authors have made substantial contributions to this work. Y.Z. (Yimeng Zou) and J.T. formulated the theoretical framework; Y.Z. (Yimeng Zou), G.J. and J.T. designed the simulations; Y.Z. (Yimeng Zou) carried out the simulation experiments; Y.Z. (Yimeng Zou), J.T. and G.J. analyzed the simulated data; Y.Z. (Yimeng Zou) wrote the manuscript; J.T., G.J. and Y.Z. (Yongsheng Zhang) reviewed and edited the manuscript; Y.Z. (Yongsheng Zhang) gave insightful and enlightening suggestions for this manuscript. All authors have read and agreed to the published version of the manuscript.

Funding

This research was supported by the National Natural Science Found of China under grant 61771478.

Institutional Review Board Statement

Not applicable.

Informed Consent Statement

Not applicable.

Data Availability Statement

Not applicable.

Acknowledgments

The authors would like to thank all the anonymous reviewers and editors for their useful comments and suggestions that greatly improved this paper.

Conflicts of Interest

The authors declare no conflict of interest.

References

  1. Sherwin, C.W.; Ruina, J.P.; Rawcliffe, R.D. Some Early Developments in Synthetic Aperture Radar Systems. IRE Trans. Mil. Electron. 1962, MIL-6, 111–115. [Google Scholar] [CrossRef]
  2. Skolnik, M.I. Fifty years of radar. IEEE Proc. 1985, 73, 182–197. [Google Scholar] [CrossRef]
  3. Soumekh, M. Synthetic Aperture Radar Signal Processing with Matlab Algorithms; Wiley: New York, NY, USA, 1999. [Google Scholar]
  4. Skolnik, M.I. Radar in the twentieth century. IEEE Aerosp. Electron. Syst. Mag. 2000, 15, 27–46. [Google Scholar]
  5. Burgmann, R.; Rosen, P.A.; Fielding, E.J. Synthetic Aperture Radar Interferometry to Measure Earth’s Surface Topography and Its Deformation. Annu. Rev. Earth Planet. Sci. 2000, 28, 169–209. [Google Scholar] [CrossRef]
  6. Avent, R.K.; Shelton, J.D.; Brown, P. The ALCOR C-band imaging radar. IEEE Antennas Propag. Mag. 1996, 38, 16–27. [Google Scholar] [CrossRef]
  7. Delaney, W.; Ward, W. An Overview of the First Fifty Years; Radar Development at Lincoln Laboratory: Lexington, KY, USA, 2001. [Google Scholar]
  8. Chen, C.; Andrews, H.C. Target-Motion-Induced Radar Imaging. IEEE Trans. Aerosp. Electron. Syst. 1980, AES–16, 2–14. [Google Scholar] [CrossRef]
  9. Jia, X.; Song, H.; He, W. A Novel Method for Refocusing Moving Ships in SAR Images via ISAR Technique. Remote Sens. 2021, 13, 2738. [Google Scholar] [CrossRef]
  10. Wang, T.; Wang, X.; Chang, Y.; Liu, J.; Xiao, S. Estimation of Precession Parameters and Generation of ISAR Images of Ballistic Missile Targets. IEEE Trans. Aerosp. Electron. Syst. 2010, 46, 1983–1995. [Google Scholar] [CrossRef]
  11. Karine, A.; Toumi, A.; Khenchaf, A.; El Hassouni, M. Radar Target Recognition Using Salient Keypoint Descriptors and Multitask Sparse Representation. Remote Sens. 2018, 10, 843. [Google Scholar] [CrossRef] [Green Version]
  12. Zhang, Y.; Liu, S.; Zhu, H. Interferometric ISAR 3D Imaging of Target Satellite in Low Earth Orbit. In Proceedings of the International Symposium on Test and Measurement (ISTM), Beijing, China, 5–8 August 2007. [Google Scholar]
  13. McFadden, F.E. Three-dimensional reconstruction from ISAR sequences. In Radar Sensor Technology and Data Visualization; SPIE Press: Bellingham, DC, USA, 2002; SPIE 4744. [Google Scholar]
  14. Lord, R.; Nel, W.; Abdul, G. Investigation of 3-D RCS Image formation of ships using ISAR. Physics 2006, 5, 320–325. [Google Scholar]
  15. Suwa, K.; Wakayama, T.; Iwamoto, M. Three-Dimensional Target Geometry and Target Motion Estimation Method Using Multistatic ISAR Movies and Its Performance. IEEE Trans. Geosci. Remote Sens. 2011, 49, 2361–2373. [Google Scholar] [CrossRef]
  16. Suwa, K.; Wakayama, T.; Iwamoto, M. Estimation of target motion and 3D target geometry using multistatic ISAR movies. In Proceedings of the IEEE International Geoscience and Remote Sensing Symposium (IGARSS), Boston, MA, USA, 6–11 July 2008; Volume 5, pp. V-429–V-432. [Google Scholar] [CrossRef]
  17. Skolnik, M.I. Introduction to RADAR Systems; McGraw-Hill: New York, NY, USA, 1990. [Google Scholar]
  18. Wang, G.; Xia, X.-G.; Chen, V. Three-dimensional ISAR imaging of maneuvering targets using three receivers. IEEE Trans. Image Process. 2001, 10, 436–447. [Google Scholar] [CrossRef] [PubMed]
  19. Xu, X.; Narayanan, R. Three-dimensional interferometric ISAR imaging for target scattering diagnosis and modeling. IEEE Trans. Image Process. 2001, 10, 1094–1102. [Google Scholar] [CrossRef] [PubMed]
  20. Ma, C.; Yeo, T.S.; Guo, Q.; Wei, P. Bistatic ISAR Imaging Incorporating Interferometric 3-D Imaging Technique. IEEE Trans. Geosci. Remote Sens. 2012, 50, 3859–3867. [Google Scholar] [CrossRef]
  21. Stagliano, D.; Martorella, M.; Casalini, E. Interferometric bistatic ISAR processing for 3D target reconstruction. In Proceedings of the 2014 11th European Radar Conference, Rome, Italy, 8–10 October 2014; pp. 161–164. [Google Scholar] [CrossRef]
  22. Jiao, Z.; Ding, C.; Liang, X.; Chen, L.; Zhang, F. Sparse Bayesian Learning Based Three-Dimensional Imaging Algorithm for Off-Grid Air Targets in MIMO Radar Array. Remote Sens. 2018, 10, 369. [Google Scholar] [CrossRef] [Green Version]
  23. Del-Rey-Maestre, N.; Mata-Moya, D.; Jarabo-Amores, M.-P.; Gómez-Del-Hoyo, P.-J.; Bárcena-Humanes, J.-L.; Rosado-Sanz, J. Passive Radar Array Processing with Non-Uniform Linear Arrays for Ground Target’s Detection and Localization. Remote Sens. 2017, 9, 756. [Google Scholar] [CrossRef] [Green Version]
  24. Monteith, A.R.; Ulander, L.M.H.; Tebaldini, S. Calibration of a Ground-Based Array Radar for Tomographic Imaging of Natural Media. Remote Sens. 2019, 11, 2924. [Google Scholar] [CrossRef] [Green Version]
  25. Rabideau, D.J.; Parker, P. Ubiquitous MIMO multifunction digital array radar. In Proceedings of the 37th Asilomar Conference on Signals, Systems & Computers, Pacific Grove, CA, USA, 9–12 November 2003. [Google Scholar] [CrossRef]
  26. Baraniuk, R.; Steeghs, P. Compressive Radar Imaging. In Proceedings of the 2007 IEEE Radar Conference, Boston, MA, USA, 17–20 April 2007; pp. 128–133. [Google Scholar]
  27. Uḡur, S.; Arıkan, O. SAR image reconstruction and autofocus by compressed sensing. Digit. Signal Process. 2012, 22, 923–932. [Google Scholar] [CrossRef]
  28. Haneche, H.; Ouahabi, A.; Boudraa, B. Compressed Sensing-Speech Coding Scheme for Mobile Communications. Circuits Syst. Signal Process. 2021, 40, 5106–5126. [Google Scholar] [CrossRef]
  29. Ender, J.H. On compressive sensing applied to radar. Signal Process. 2010, 90, 1402–1414. [Google Scholar] [CrossRef]
  30. Duan, G.Q.; Wang, D.W.; Ma, X.Y.; Su, Y. Three-Dimensional Imaging via Wideband MIMO Radar System. IEEE Geosci. Remote Sens. Lett. 2010, 7, 445–449. [Google Scholar] [CrossRef]
  31. Zhu, Y.; Su, Y. A type of M 2-transmitter N 2-receiver MIMO radar array and 3D imaging theory. Sci. China Inf. Sci. 2011, 54, 2147. [Google Scholar] [CrossRef]
  32. Gu, F.; Chi, L.; Zhang, Q.; Zhu, F.; Liang, Y. An imaging method for MIMO radar with sparse array based on Compressed Sensing. In Proceedings of the 2011 IEEE International Conference on Signal Processing, Communications and Computing (ICSPCC), Xi’an, China, 14–16 September 2011; pp. 1–4. [Google Scholar]
  33. Natarajan, B.K. Sparse approximate solutions to linear systems. Siam J. Comput. 1995, 24, 227–234. [Google Scholar] [CrossRef] [Green Version]
  34. Chen, S.S.; Saunders, D. Atomic Decomposition by Basis Pursuit. Siam J. Comput. 2001, 43, 129–159. [Google Scholar] [CrossRef] [Green Version]
  35. Donoho, D.L.; Elad, M. Optimally sparse representation in general (nonorthogonal) dictionaries via l~1 minimization. Proc. Natl. Acad. Sci. USA 2003, 100, 2197–2202. [Google Scholar] [CrossRef] [Green Version]
  36. Tropp, J.A.; Gilbert, A.C. Signal Recovery From Random Measurements Via Orthogonal Matching Pursuit. IEEE Trans. Inf. Theory 2007, 53, 4655–4666. [Google Scholar] [CrossRef] [Green Version]
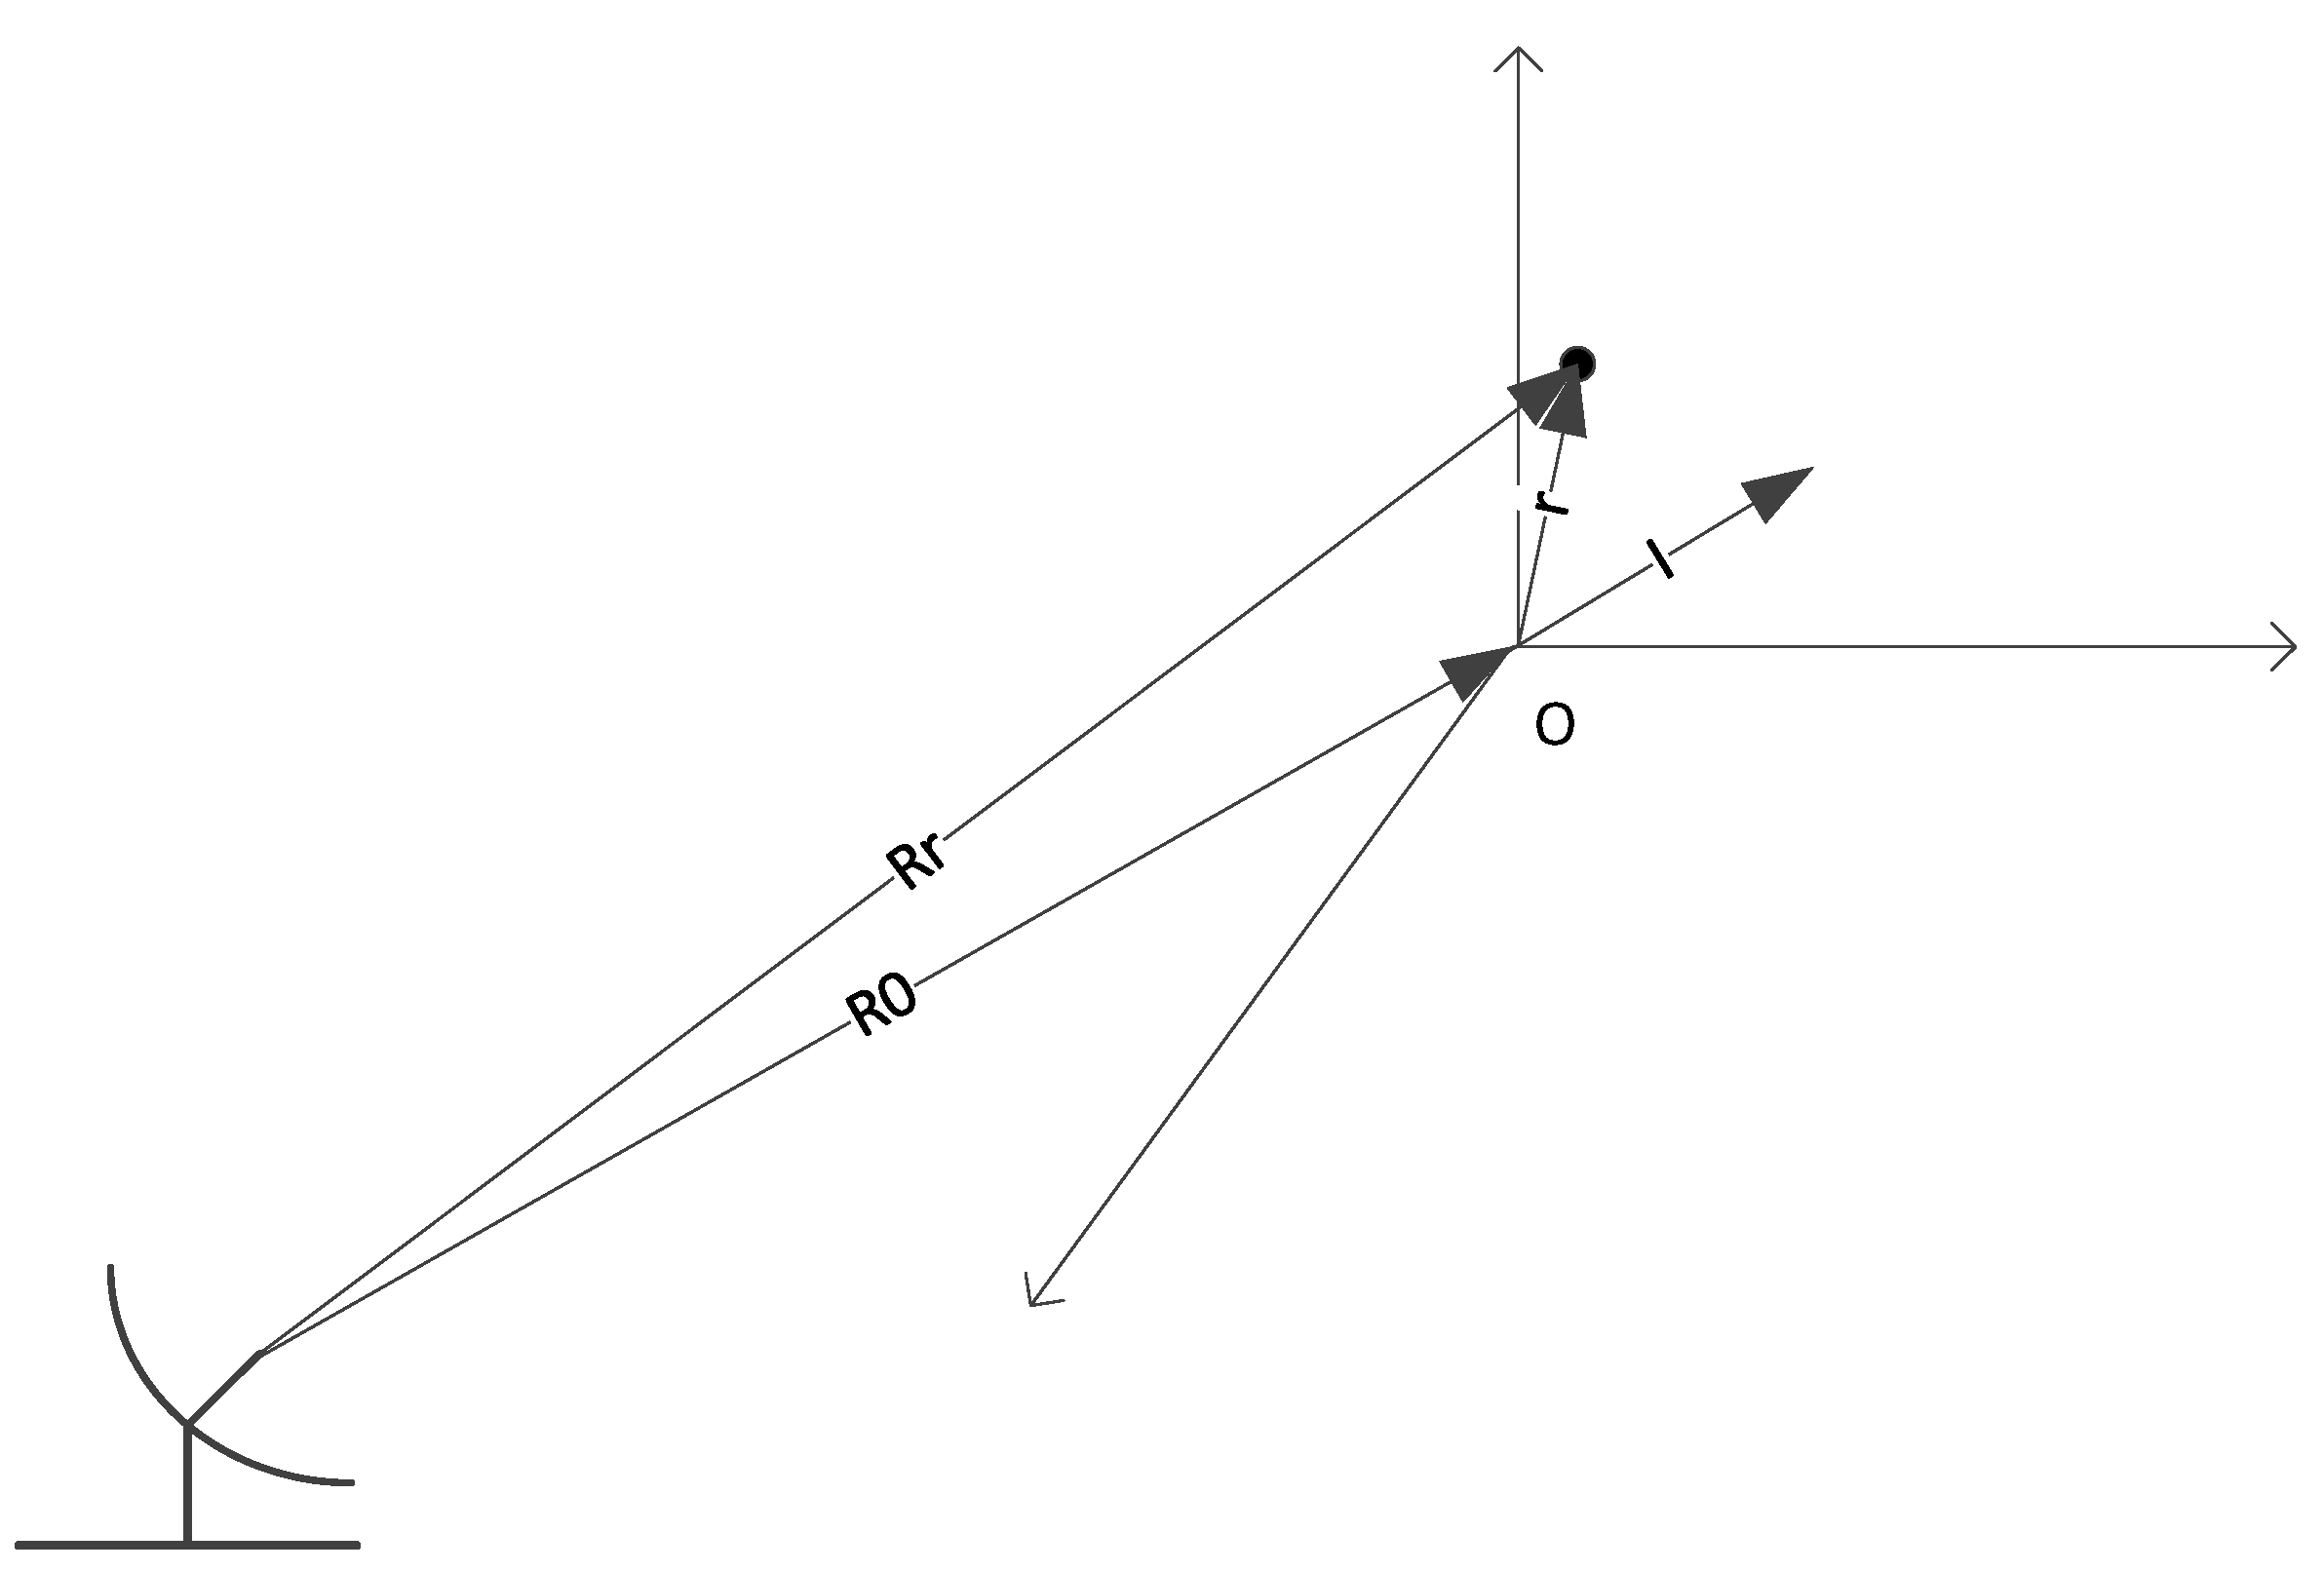
Figure 1. Schematic diagram of radar and target.
Remotesensing 13 03817 g001
Figure 2. Schematic diagram of radar line of sight direction and coordinate system.
Remotesensing 13 03817 g002
Figure 3. Parametric representation of plane normal vector.
Remotesensing 13 03817 g003
Figure 4. Range profile through stretching two-dimensional array elements into a vector.
Remotesensing 13 03817 g004
Figure 5. Range profiles of a sub-block in 3D space.
Remotesensing 13 03817 g005
Figure 6. Flowchart of multi-target separation algorithm.
Remotesensing 13 03817 g006
Figure 7. Spectrum support region.
Remotesensing 13 03817 g007
Figure 8. Interpolation diagram.
Remotesensing 13 03817 g008
Figure 9. Processing flowchart of the 3D imaging method.
Remotesensing 13 03817 g009
Figure 10. The range profile in 3D space.
Remotesensing 13 03817 g010
Figure 11. The 3D Hough transform result in parameter space.
Remotesensing 13 03817 g011
Figure 12. Results of multi-target range profile separation. (a) Range profile of target 1. (b) Imaging result of target 1. (c) Range profile of target 2. (d) Imaging result of target 2. (e) Range profile of target 3. (f) Imaging result of target 3.
Remotesensing 13 03817 g012aRemotesensing 13 03817 g012b
Figure 13. The images before and after interpolation are compared. (a) The echo signal s r before interpolation. (b) The echo signal s r after interpolation.
Remotesensing 13 03817 g013
Figure 14. Schematic diagram of the intercepted part after interpolation.
Remotesensing 13 03817 g014
Figure 15. Azimuth image on a single range unit. (a) The 22nd range unit’s azimuth image of basis pursuit algorithm; (b) The 22nd range unit’s azimuth image of OMP algorithm.
Remotesensing 13 03817 g015
Figure 16. The final imaging results of the two algorithms. (a) Final imaging result of BP algorithm. (b) Final imaging result of OMP algorithm.
Remotesensing 13 03817 g016
Figure 17. Random sparse array elements distribution.
Remotesensing 13 03817 g017
Figure 18. The range profile in 3D space of sparse array.
Remotesensing 13 03817 g018
Figure 19. Separation result of sparse array range profile. (a) The range profile of target 1 of sparse array. (b) The range profile of target 2 of sparse array. (c) The range profile of target 3 of sparse array.
Remotesensing 13 03817 g019
Figure 20. Sparse array 3D imaging results with two sparse imaging algorithms. (a) Sparse array imaging result with basis pursuit algorithm. (b) Sparse array imaging result with OMP algorithm.
Remotesensing 13 03817 g020
Figure 21. Imaging results of a set of scattering points with two sparse imaging algorithms. (a) Imaging result of Basis Pursuit algorithm; (b) Imaging result of OMP algorithm.
Remotesensing 13 03817 g021
Table 1. Radar signal parameters.
ParameterValueParameterValue
Pulse duration10 μ s Sampling Frequency70 MHz
Bandwidth100 MHzWavelength0.15 m
Carrier Frequency2 GHz
Table 2. Array and scene parameters.
ParameterValueParameterValue
Array Size25 × 25Target 1 Position(0, 0, 0) m
Baseline Length900 mTarget 2 Position(−593.5, −820.2, −179.7) m
Reference Point Position(0, 0, 9000) mTarget 3 Position(673.1, −802.5, −50.3) m
Table 3. Target information.
Scattering PointsPositionScattering PointsPositionScattering PointsPosition
T1(0, −5.25, 0) mT8(0, 0, 0) mT15(0, 5.25, 0) m
T2(−3.75, −5.25, 8991) mT9(−3.75, 0, 8991) mT16(−3.75, 5.25, 8991) m
T3(−7.5, −5.25, 8982) mT10(−7.5, 0, 8982) mT17(−7.5, 5.25, 8982) m
T4(−11.25, −5.25, 8973) mT11(−11.25, 0, 8973) mT18(−11.25,5.25, 8973) m
T5(3.75, −5.25, 9009) mT12(3.75, 0, 9009) mT19(3.75, 5.25, 9009) m
T6(7.5, −5.25, 9018) mT13(7.5, 0, 9018) mT20(7.5, 5.25, 9018) m
T7(11.25, −5.25, 9027) mT14(11.25, 0, 9027) mT21(11.25, 5.25, 9027) m
Publisher’s Note: MDPI stays neutral with regard to jurisdictional claims in published maps and institutional affiliations.