1. Introduction
Object detection is a popular direction in computer vision and digital image processing, and is widely used in many fields such as autonomous driving, disaster rescue, robot navigation, intelligent video surveillance, etc. Object detection is also a fundamental type of algorithm in the field of pan-identity recognition, and plays a crucial role in subsequent tasks such as face recognition, gait recognition, crowd size assessment, and instance segmentation.
From the comprehensive perspective of international-related research, most object detection studies are based on visible images. However, for images taken at nighttime or those with insufficient illumination conditions, it is difficult for visible light-based object detection methods to achieve the expected results. While thermal imaging can significantly compensate for the shortcomings of visible imaging, thermal images also have some defects such as high noise, low contrast, non-uniformity, and poor spatial resolution [
1], so the results are not ideal when applied to target detection alone. Moreover, because individual objects are represented differently in thermal infrared images, the temperature information contained in thermal infrared images can be applied as a priori knowledge for target detection.
Therefore, in the present study, the channel attention method is applied to the dynamic weighted fusion of multiple data sources. Furthermore, the temperature information of thermal infrared images is also applied to a deep learning model to improve the detection accuracy.
2. Related Works
In early research, Choi et al. [
2] used low-level image fusion to fuse the best features of two types of sensor to achieve superior performance in human detection. They proposed a new joint bilateral filter that is useful for the fusion of the edge information in a visible image and the white region in a thermal image. While the results of experiments demonstrated the effective and easy human detection by the proposed algorithm, its detection accuracy was found to be relatively low.
In recent years, the development of deep learning, models that fuse visible and thermal images have become a popular research direction, which has led to significant improvements in the accuracy of object detection. According to the location of fusion in the model, related studies can be divided into those conducted on data-level, feature-level, and decision-level fusion [
3], among which the most studied methods are feature-level and decision-level fusion. Wagner et al. [
4] was the first to conduct research on convolutional neural network (CNN)-based multispectral pedestrian detection, and he evaluated the results of feature-level-based early and late fusion, which showed that late fusion achieved superior accuracy. Chen et al. [
5] proposed a feature-level-based novel multi-layer fused CNN (MLF-CNN) for the detection of pedestrians under adverse illumination conditions, and they used the sum fusion method for the integration of the two convolutional layers. The detection accuracy of the proposed method was found to be 28.62% better than the baseline and 11.35% better than the well-known faster R-CNN halfway fusion [
6] in the KAIST multispectral pedestrian dataset.
These priori studies were all based on feature-level fusion without the consideration of the illumination conditions. In fact, the contribution proportions of visible and thermal images under different illumination conditions should be different; visible light contributes more under bright conditions, while thermal infrared light contributes more under dark conditions.
To consider the ratio of the contributions of different source images to the detection results, Li et al. [
7] designed an illumination-aware Faster R-CNN-based [
8] structure; they adaptively merged color and thermal sub-networks via a gate function defined over the illumination value. Furthermore, Guan et al. [
9] proposed a novel illumination-aware weighting mechanism that incorporates illumination information into two-stream deep CNNs to learn multispectral human-related features under different illumination conditions (daytime and nighttime) to accurately depict the illumination condition of a scene. These studied both improved detection accuracy of pedestrians, but the fusion strategies are decision-level, i.e., the detection results are obtained separately using two branched networks, and the results are then weighted and fused using the coefficients determined by the illumination conditions. However, both methods demand more network parameters, higher computational intensity, and higher platform requirements; in addition, the determination of the image illumination conditions is not specific.
The methods proposed in these studies all deal with thermal images in the same way as visible images, which means that only the semantic information of the visual layer is utilized, whereas the temperature information associated with the objects is not. In reality, the temperature of pedestrians on the road is distinct from that of the background; thus, in theory, the a priori knowledge of temperature can be fully exploited to further improve the object detection accuracy.
Zhao et al. [
10] constructed an image-temperature transformation formula based on infrared image formation theory, converted infrared images into corresponding temperature maps, and trained a temperature network for detection. However, the method first uses a deep learning network to obtain the pedestrian frame with the highest confidence, after which the original image is converted to the temperature map based on the pedestrian frame, and the converted temperature map is finally fed into the model for relearning. Thus, via this method, the model trained twice, making the process repetitive and time-consuming.
To this end, the present study explores a feature-level-based fusion method. First, the spatial attention method is used to dynamically learn different channel weights at the feature level to improve the rationality of the fusion process. Then, different fusion parameters are selected according to different illumination scenarios. Furthermore, the a priori knowledge of temperature is applied to the preliminary feature extraction, instead of spatial attention, to achieve guided a priori judgment, thereby achieving the reduction of the computational volume and the improvement of the detection accuracy. The contributions of this study are as follows:
- 1
Different fusion parameters are provided for different scenes in the visible-thermal image feature fusion process, which allows the effects caused by different illumination conditions to be taken into account;
- 2
The channel attention mechanism is used when fusing feature maps from different data sources to allow for the dynamic learning of the fusion weights;
- 3
Temperature information is used as a priori knowledge to accelerate model convergence and improve the detection accuracy;
- 4
As compared to previous similar studies (mainly refers to decision-level-based methods such as [
7,
9]), fewer parameters and simpler models are used;
- 5
The proposed temperature information module is plug-and-play, and can be applied to all temperature-related target detection applications.
The remainder of this paper is organized as follows.
Section 3 introduces the research methodology, and
Section 4 presents the experiments. Then,
Section 5 and
Section 6 analyze and discuss the experimental results. Finally,
Section 7 presents the conclusions of this research.
3. Methodology
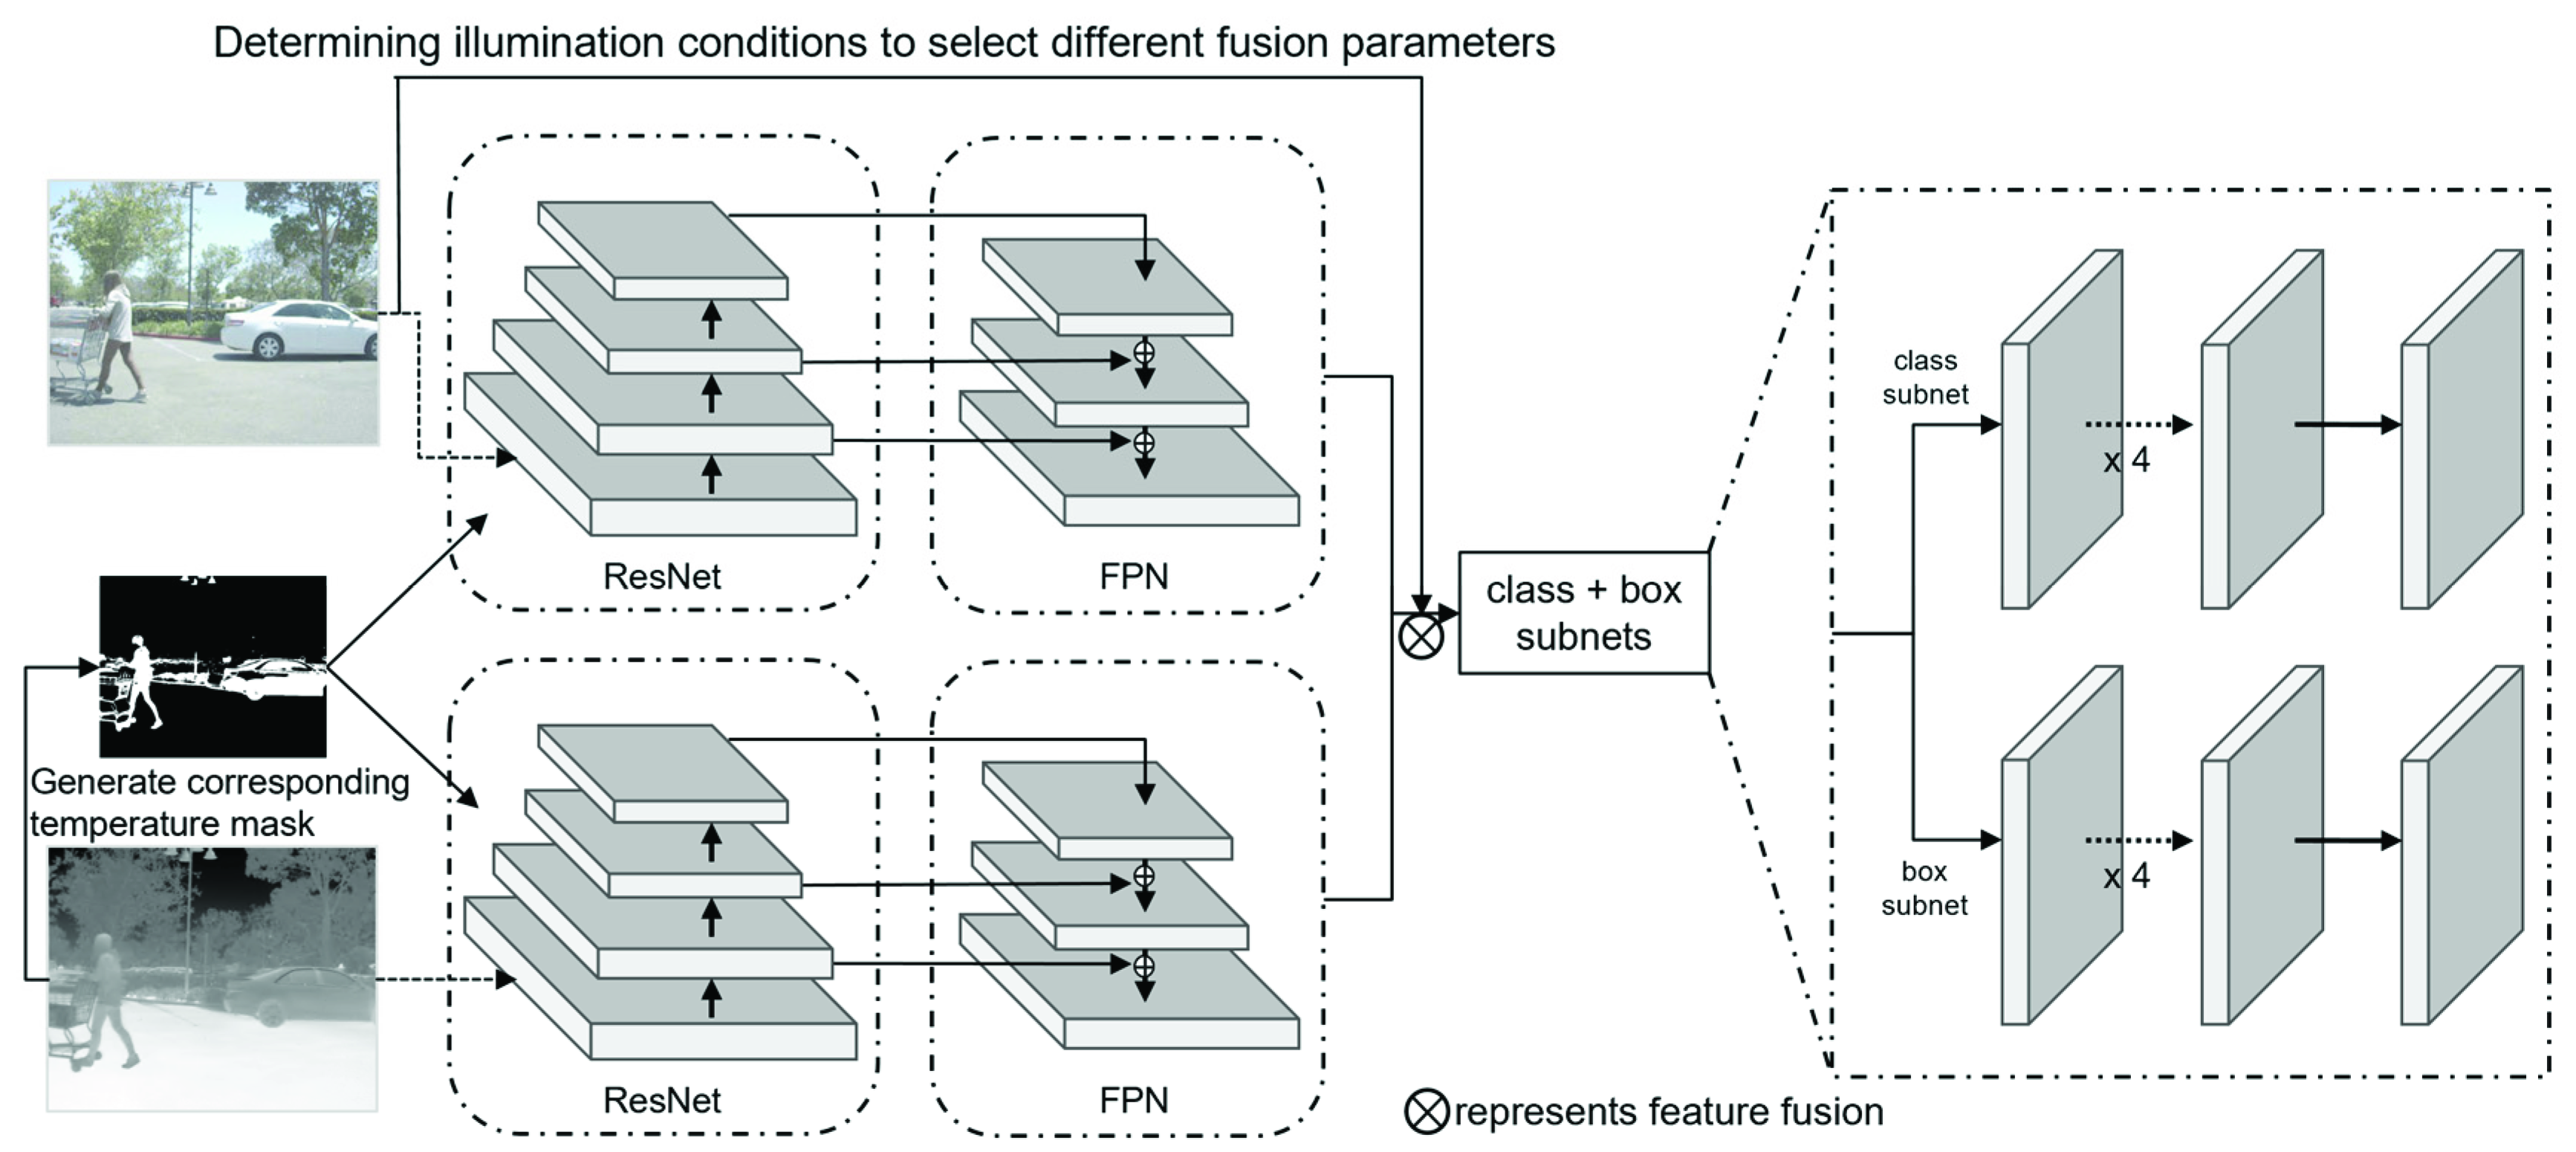
The flowchart of this research based on RetinaNet [
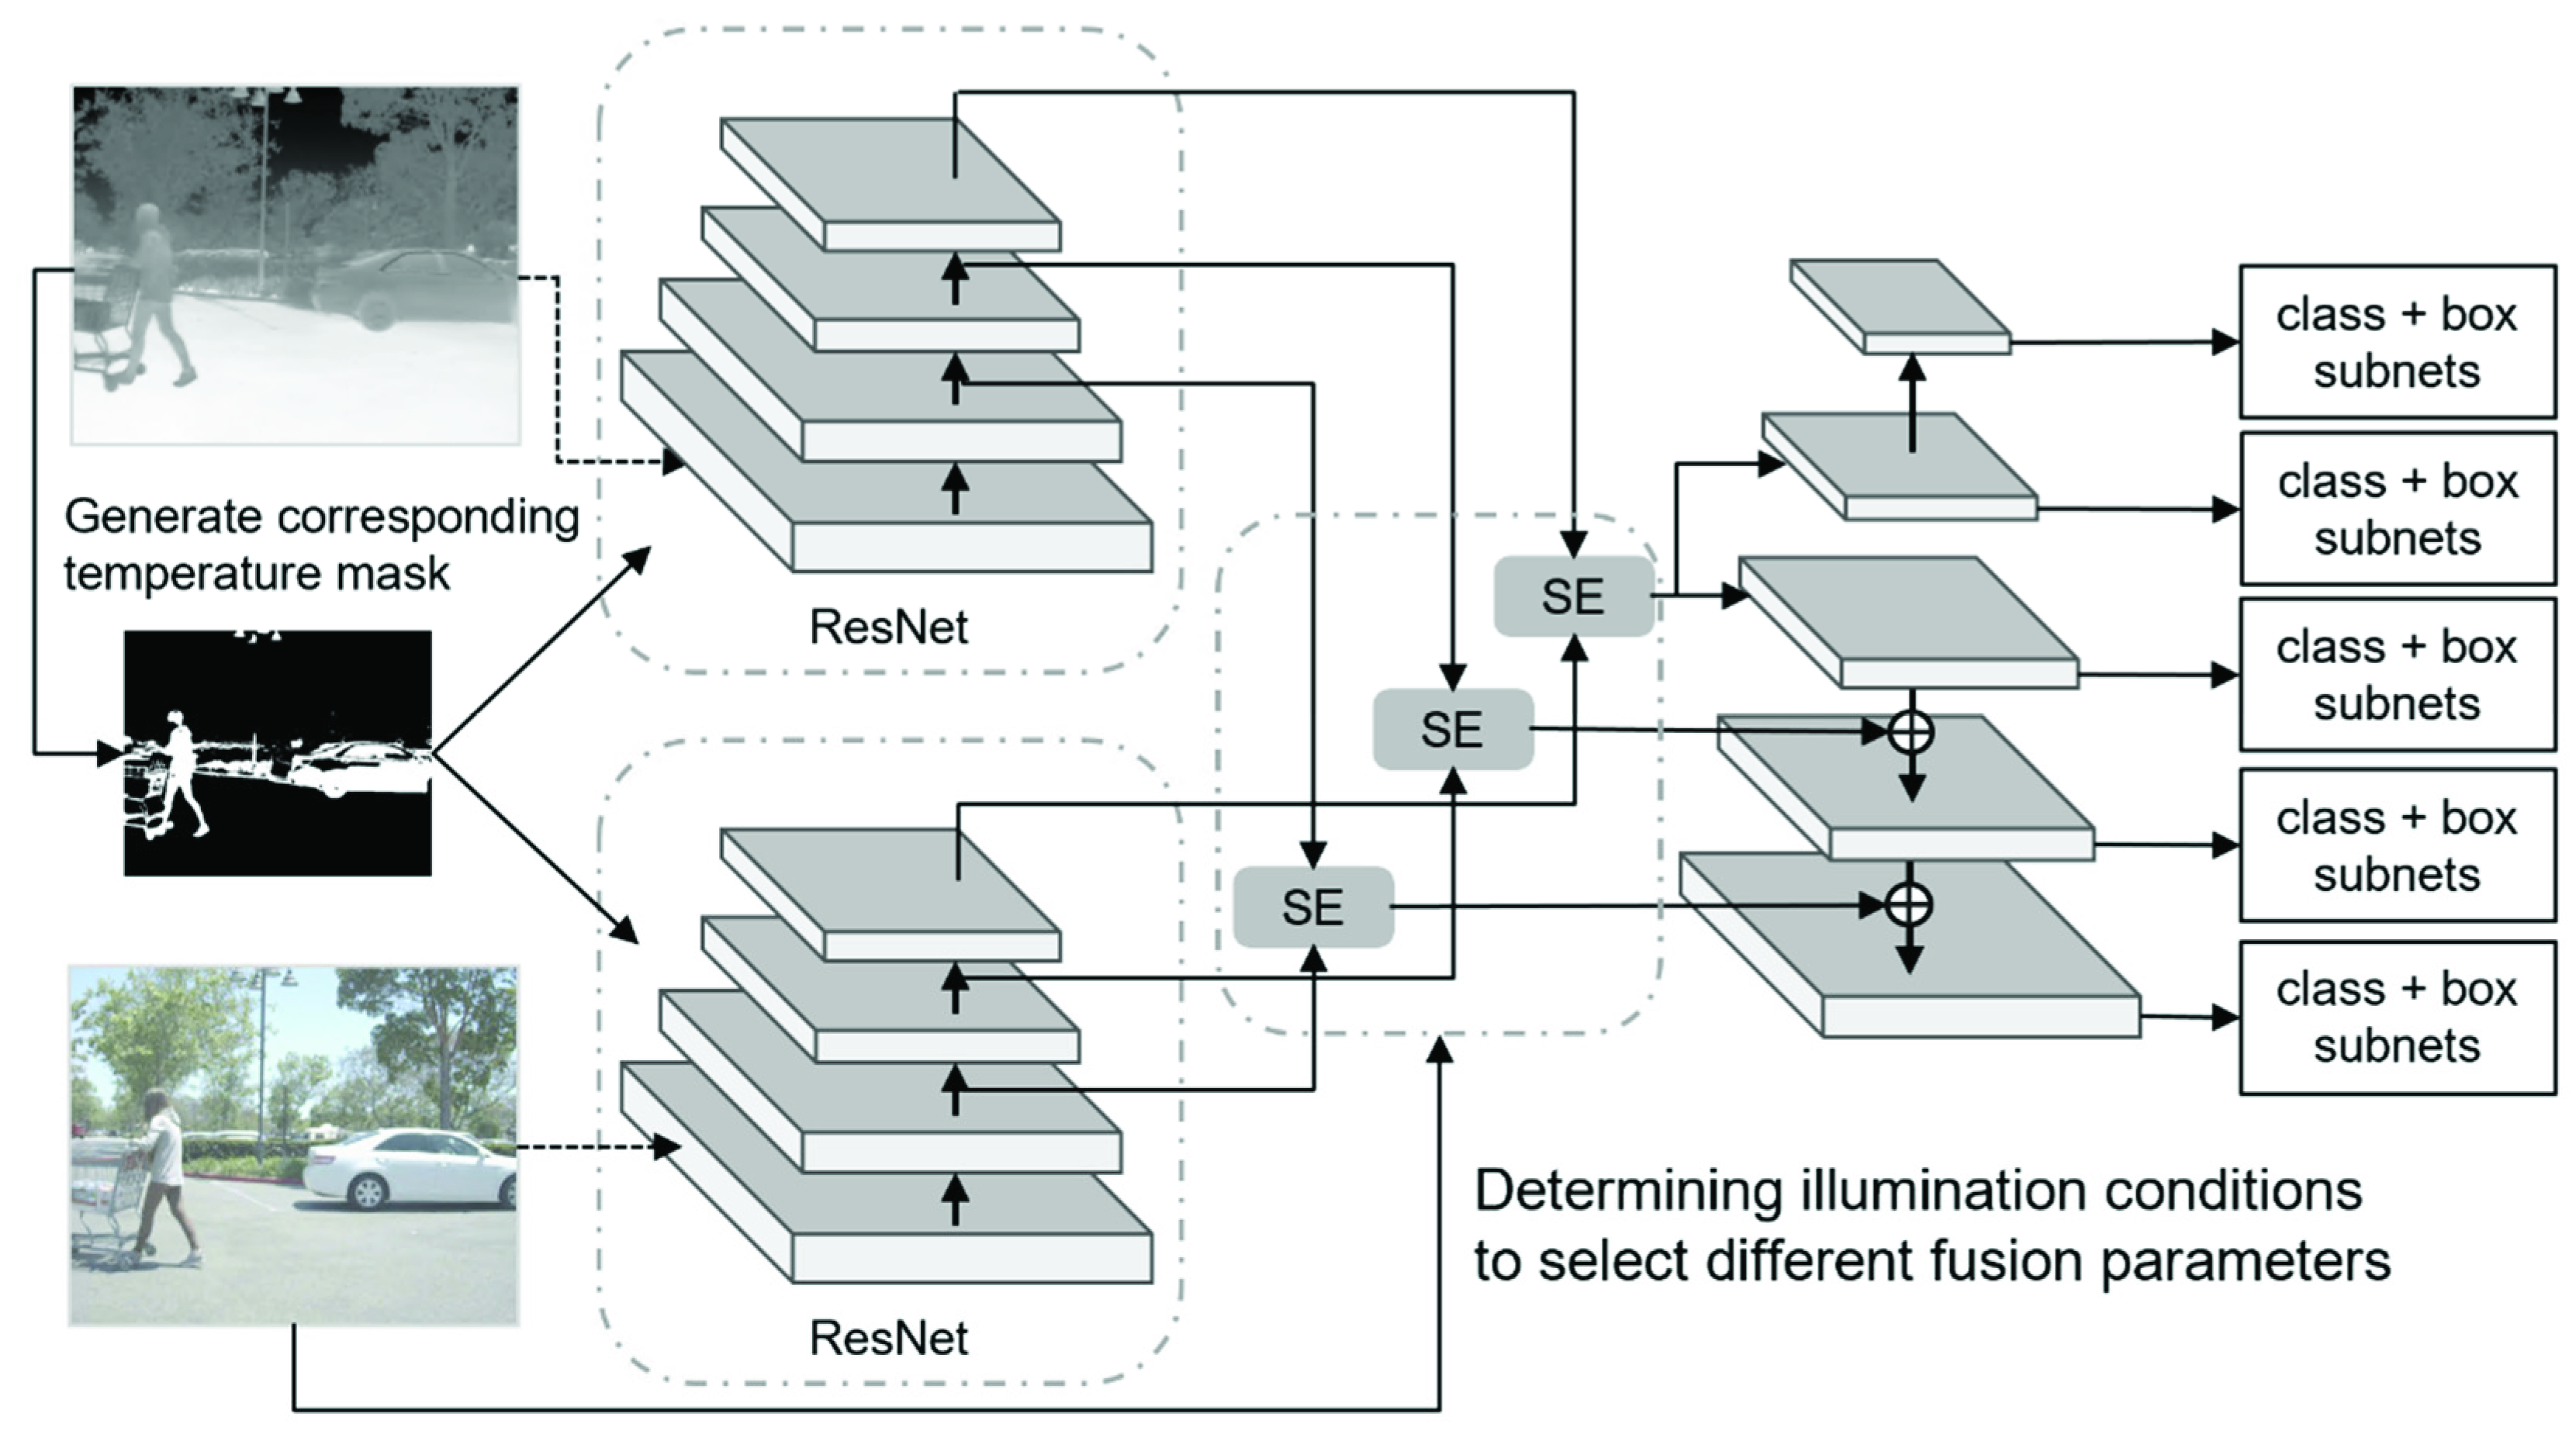
11] is presented in
Figure 1. First, the dataset is used to train an illumination condition classification model. Second, two branch networks are used to extract the feature information of visible and thermal images, respectively. Moreover, the channel attention and a priori temperature mask (CAPTM) module is proposed to facilitate feature extraction by using the temperature information as a priori knowledge. Third, based on the classification results, the features are fused before ResNet [
12] and followed by a feature pyramid network (FPN [
13]). The detailed fusion structure is presented in
Section 3.4. Different from the traditional sum fusion method, a channel attention mechanism is introduced and different channel weights are used for different illumination conditions to fully exploit the visible or thermal image information. Finally, the fused feature map is ultimately used to obtain the object detection results.
3.1. Illumination Conditions Discrimination
To choose the most suitable fusion parameters, the illumination conditions (day or night) of the image must be determined in advance.
In this study, the original FLIR dataset [
14] was used for model training. The original FLIR dataset [
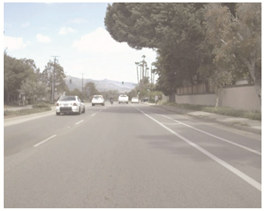
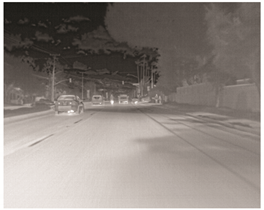
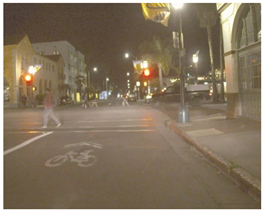
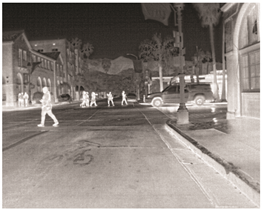
14] captured vehicles and pedestrians on the streets and highways of Santa Barbara, California, during daytime (60%) and nighttime (40%) from November to May. Given the computational intensity, the dataset was divided into only two categories—daytime and nighttime—according to the illumination scenario, thereby making full use of the visible and thermal information. For example, during the daytime, both visible and thermal images are clear, and can be complementary; in contrast, thermal images taken during nighttime have more semantic information. The examples of different illumination scenes in the FLIR dataset are shown in
Table 1.
The dichotomous classification of image scenarios is a simple and common classification task. In this study, ResNet50 [
12], in which only visible images were input, was used to accomplish the task. The classification details are described in
Section 4.2.1.
3.2. Fusing Visible and Thermal Feature Maps
The fusion operation occurs at the intersection of the two branch networks, which forms a composite feature map with the semantic information of both visible and thermal images via certain operations. The most common fusion operations include the concatenate, sum, max, and mean operations. Pei et al. [
15] explored the effects of these methods on fusion, and found that sum fusion is superior. The function of the summation operation can be expressed as Equation (1):
where
and
denote the values of visible and thermal infrared eigenmaps at
, respectively, and
,
,
, and
are the batch size, number of channels, height, and width of the feature maps. In this equation, the coefficients of the variables are the same, without distinction between different illumination conditions. However, strictly speaking, different data sources should be given different weights considering their diverse performance in different scenes, e.g., in dark nighttime situations, thermal images are the mainstay of object detection.
For the model to automatically learn the appropriate weights under different lighting conditions, three preconceived schemes were considered:
- 1
The first scheme was the improvement of a sum fusion method to a weighted summation, as given in Equation (2):
where
is a learnable parameter that can be learned in the network. The method is straightforward and has only one parameter, but the results of an experiment indicated that
was updated slowly.
- 2
The second scheme was convolving the concatenated feature map to a new one. While previous studies (e.g., [
16]) have used this type of method, it has a large number of parameters, which would substantially increase the model complexity and training time.
- 3
The third scheme was the use of the channel attention mechanism to score individual channels, i.e., to enhance the important channels and suppress the unimportant channels. This method has a moderate number of parameters and balances the weights not only of the data sources, but also the feature map channels.
Therefore, based on the comprehensive consideration of these schemes, scheme 3 was adopted in this work.
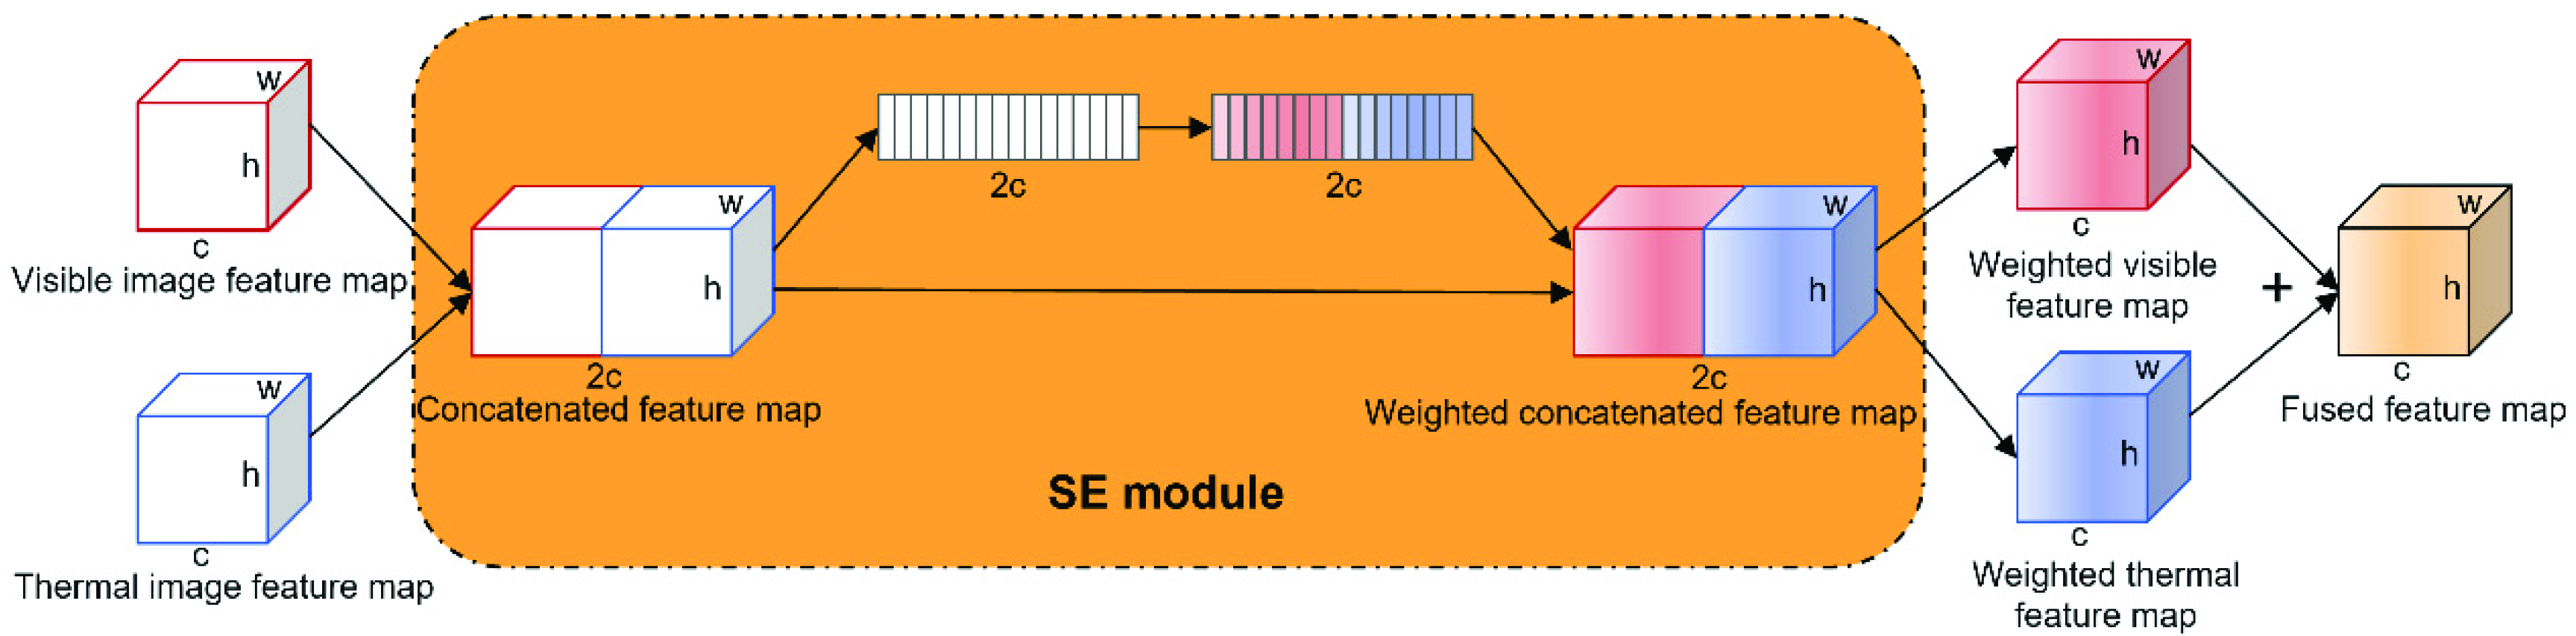
There are many available methods for channel attention. In this study, the squeeze-and-excitation (SE) block [
17] was used for feature fusion due to its fewer parameters and good performance. The SE block consists of three main components, namely the squeeze, excitation, and scale components. First, the feature map is compressed using a global pooling layer, after which the corresponding channel weights are learned using two fully connected (FC) layers, and, finally, the weights are mapped to the original feature map to enhance and suppress different channels.
Hu et al. [
17] embedded the SE block into the residual block, which enabled ResNet [
12] to learn the channel attention of the feature map continuously during extracting features. By contrast with this method, in the model proposed in the present study, the SE block is applied to feature map fusion to learn the weights of the visible and thermal feature map channels, as shown in
Figure 2. Two visible and thermal feature maps are first concatenated, the SE block is used once for the concatenated feature map, and the weighted feature map is finally split for the sum operation to obtain the required fused feature map.
3.3. Utilizing Temperature Information as a Priori Knowledge
As mentioned previously, thermal images provide temperature information in addition to texture features. Due to the different characteristics of various objects, the objects in a thermal image have different forms. By using this unique feature, the detection target is separated from the background by setting a certain pixel threshold, and this can be added to the model as a priori knowledge.
According to the detection objects considered in this study, the temperature of the human body is relatively stable; thus, it is easy to segment humans from the background. A car has a high temperature when the engine is running, but cars are also easy to segment when the engine is off due to the high reflectivity of the metal or glass material on their surface. Bicycles are the most challenging objects to differentiate due to their small size and surface material. According to the lighting scenes considered in this study, thermal images taken at nighttime are primarily sensitive to the heat emitted by the target itself, so the segmentation of a person and car is more accurate in nighttime scenes than in daytime scenes. However, it should be noted that the thresholds selected for segmentation would be different in the daytime due to the different lighting conditions.
Therefore, the dataset was roughly divided into three scenes, namely sunny day, cloudy day, and nighttime scenes, and different thresholds were set used to segment these different scenes. For example, suppose the pixel values of a person, bicycle, and car based on a thermal infrared sensor under the night condition are respectively 7400–7500, 7200–7400, and 7500–8000; the threshold value of 7200–8000 can be set to segment the targets from the background. It was experimentally proven that the background noise is not a concern because the temperature knowledge just provides a general direction for the detection model.
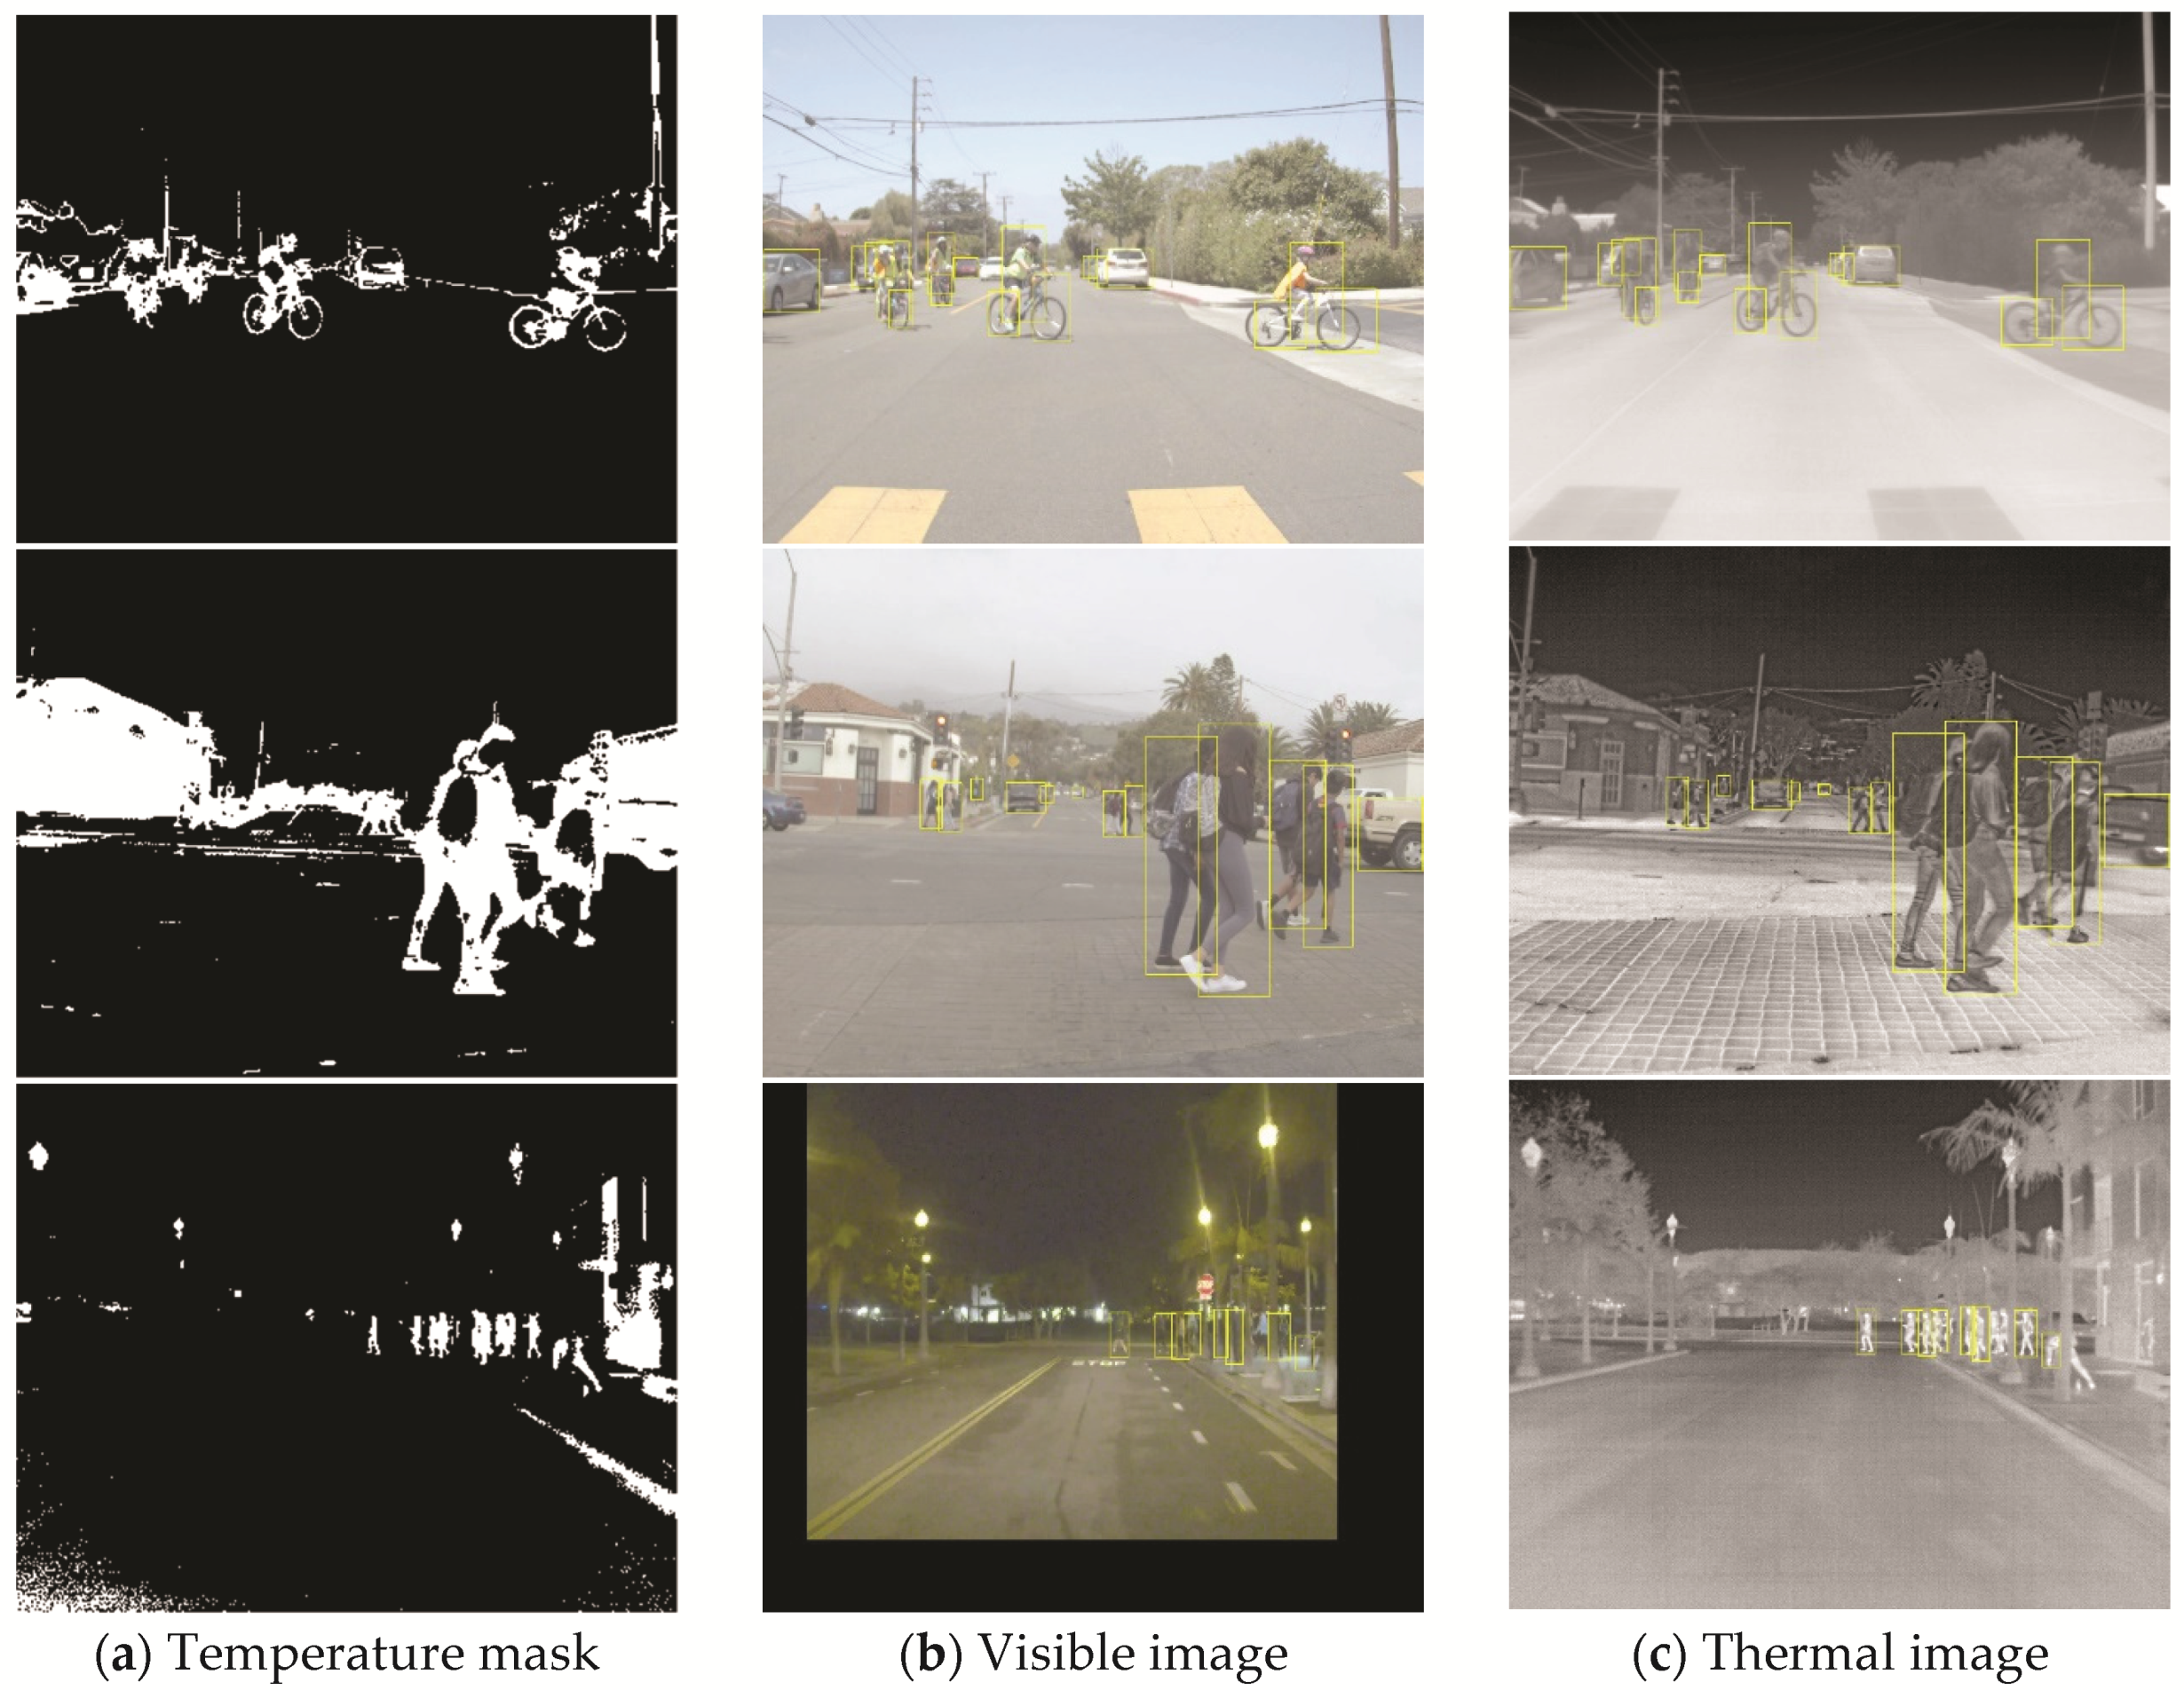
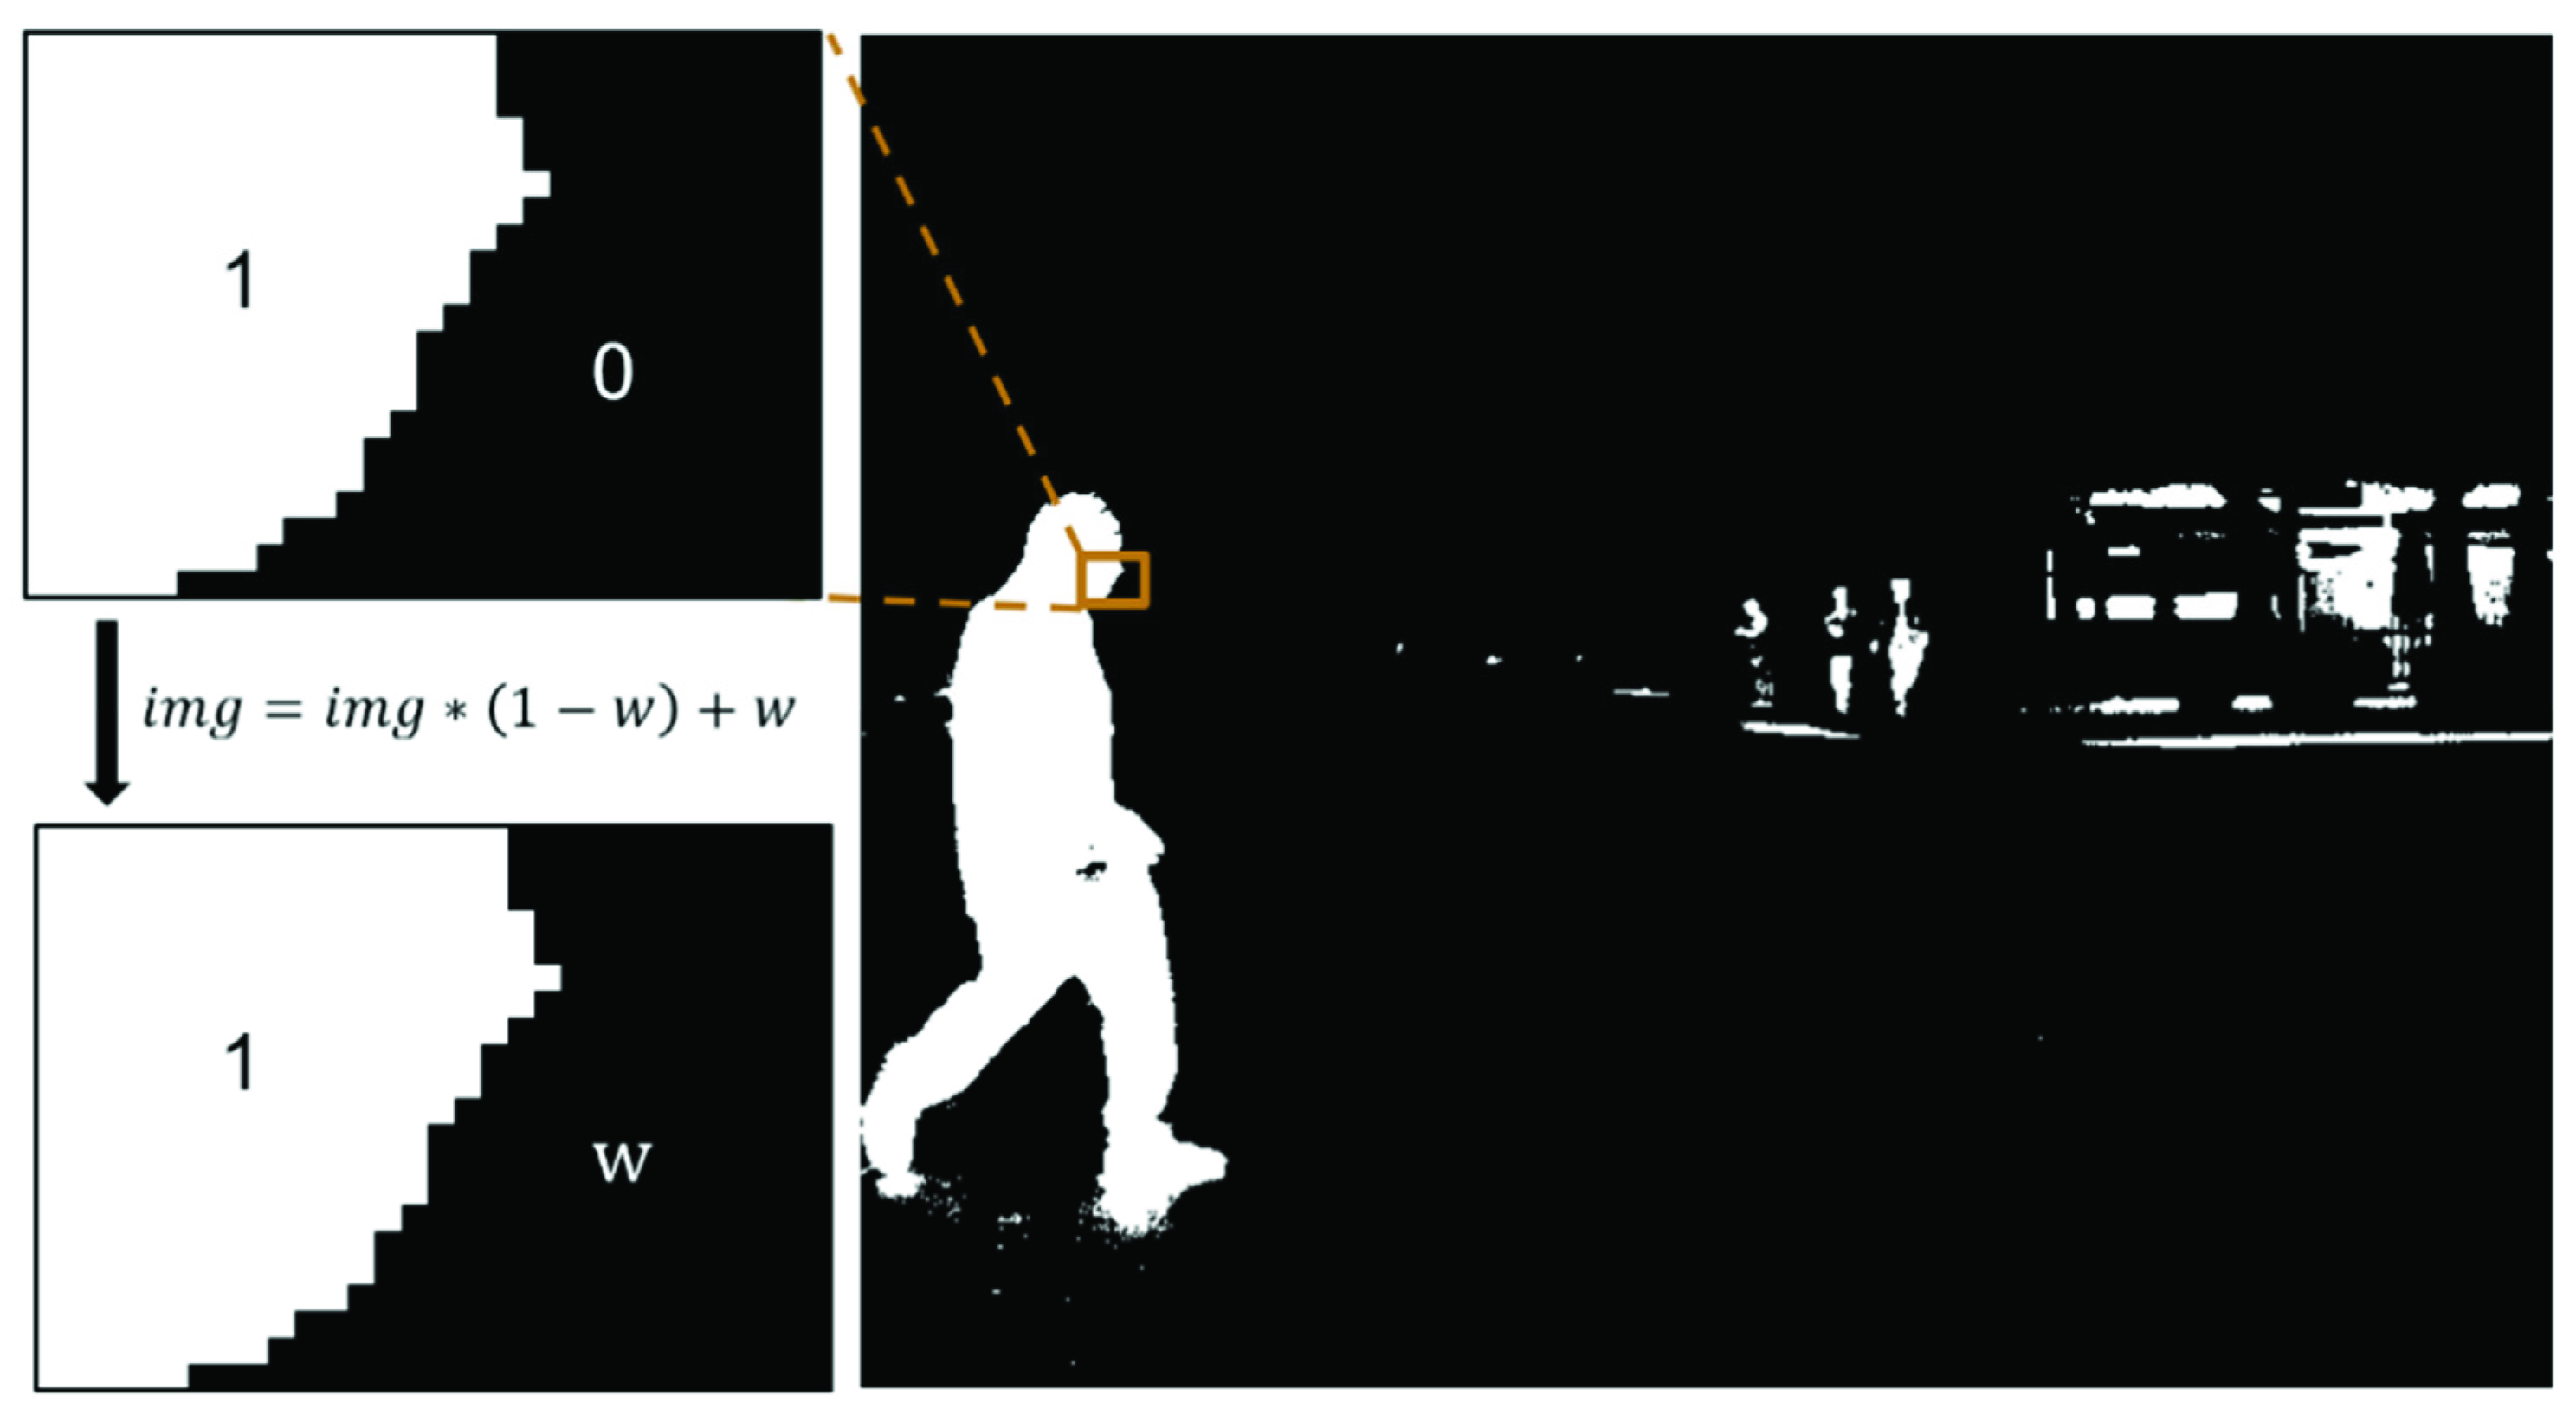
The part within the threshold was set as 1 and the part beyond the threshold was set as 0. The resulting visualization of the final temperature mask map is presented in
Figure 3. From top to bottom, the three rows respectively indicate segmentation under the scenes of a sunny day, cloudy day, and night. From the figure, it can be seen that during the daytime, people, cars, and bicycles were segmented well but with higher noise; at night, even a person in the distance was segmented accurately and with less noise. Taken together, these segmentation maps are relatively noisy, e.g., the street light in the night scene in the third row of the figure looks like a person in the masked image. However, the proposed model does not rely entirely on the temperature mask; it also relies on other semantic information in the original visible-thermal infrared image. Therefore, most of the noise would not be misidentified.
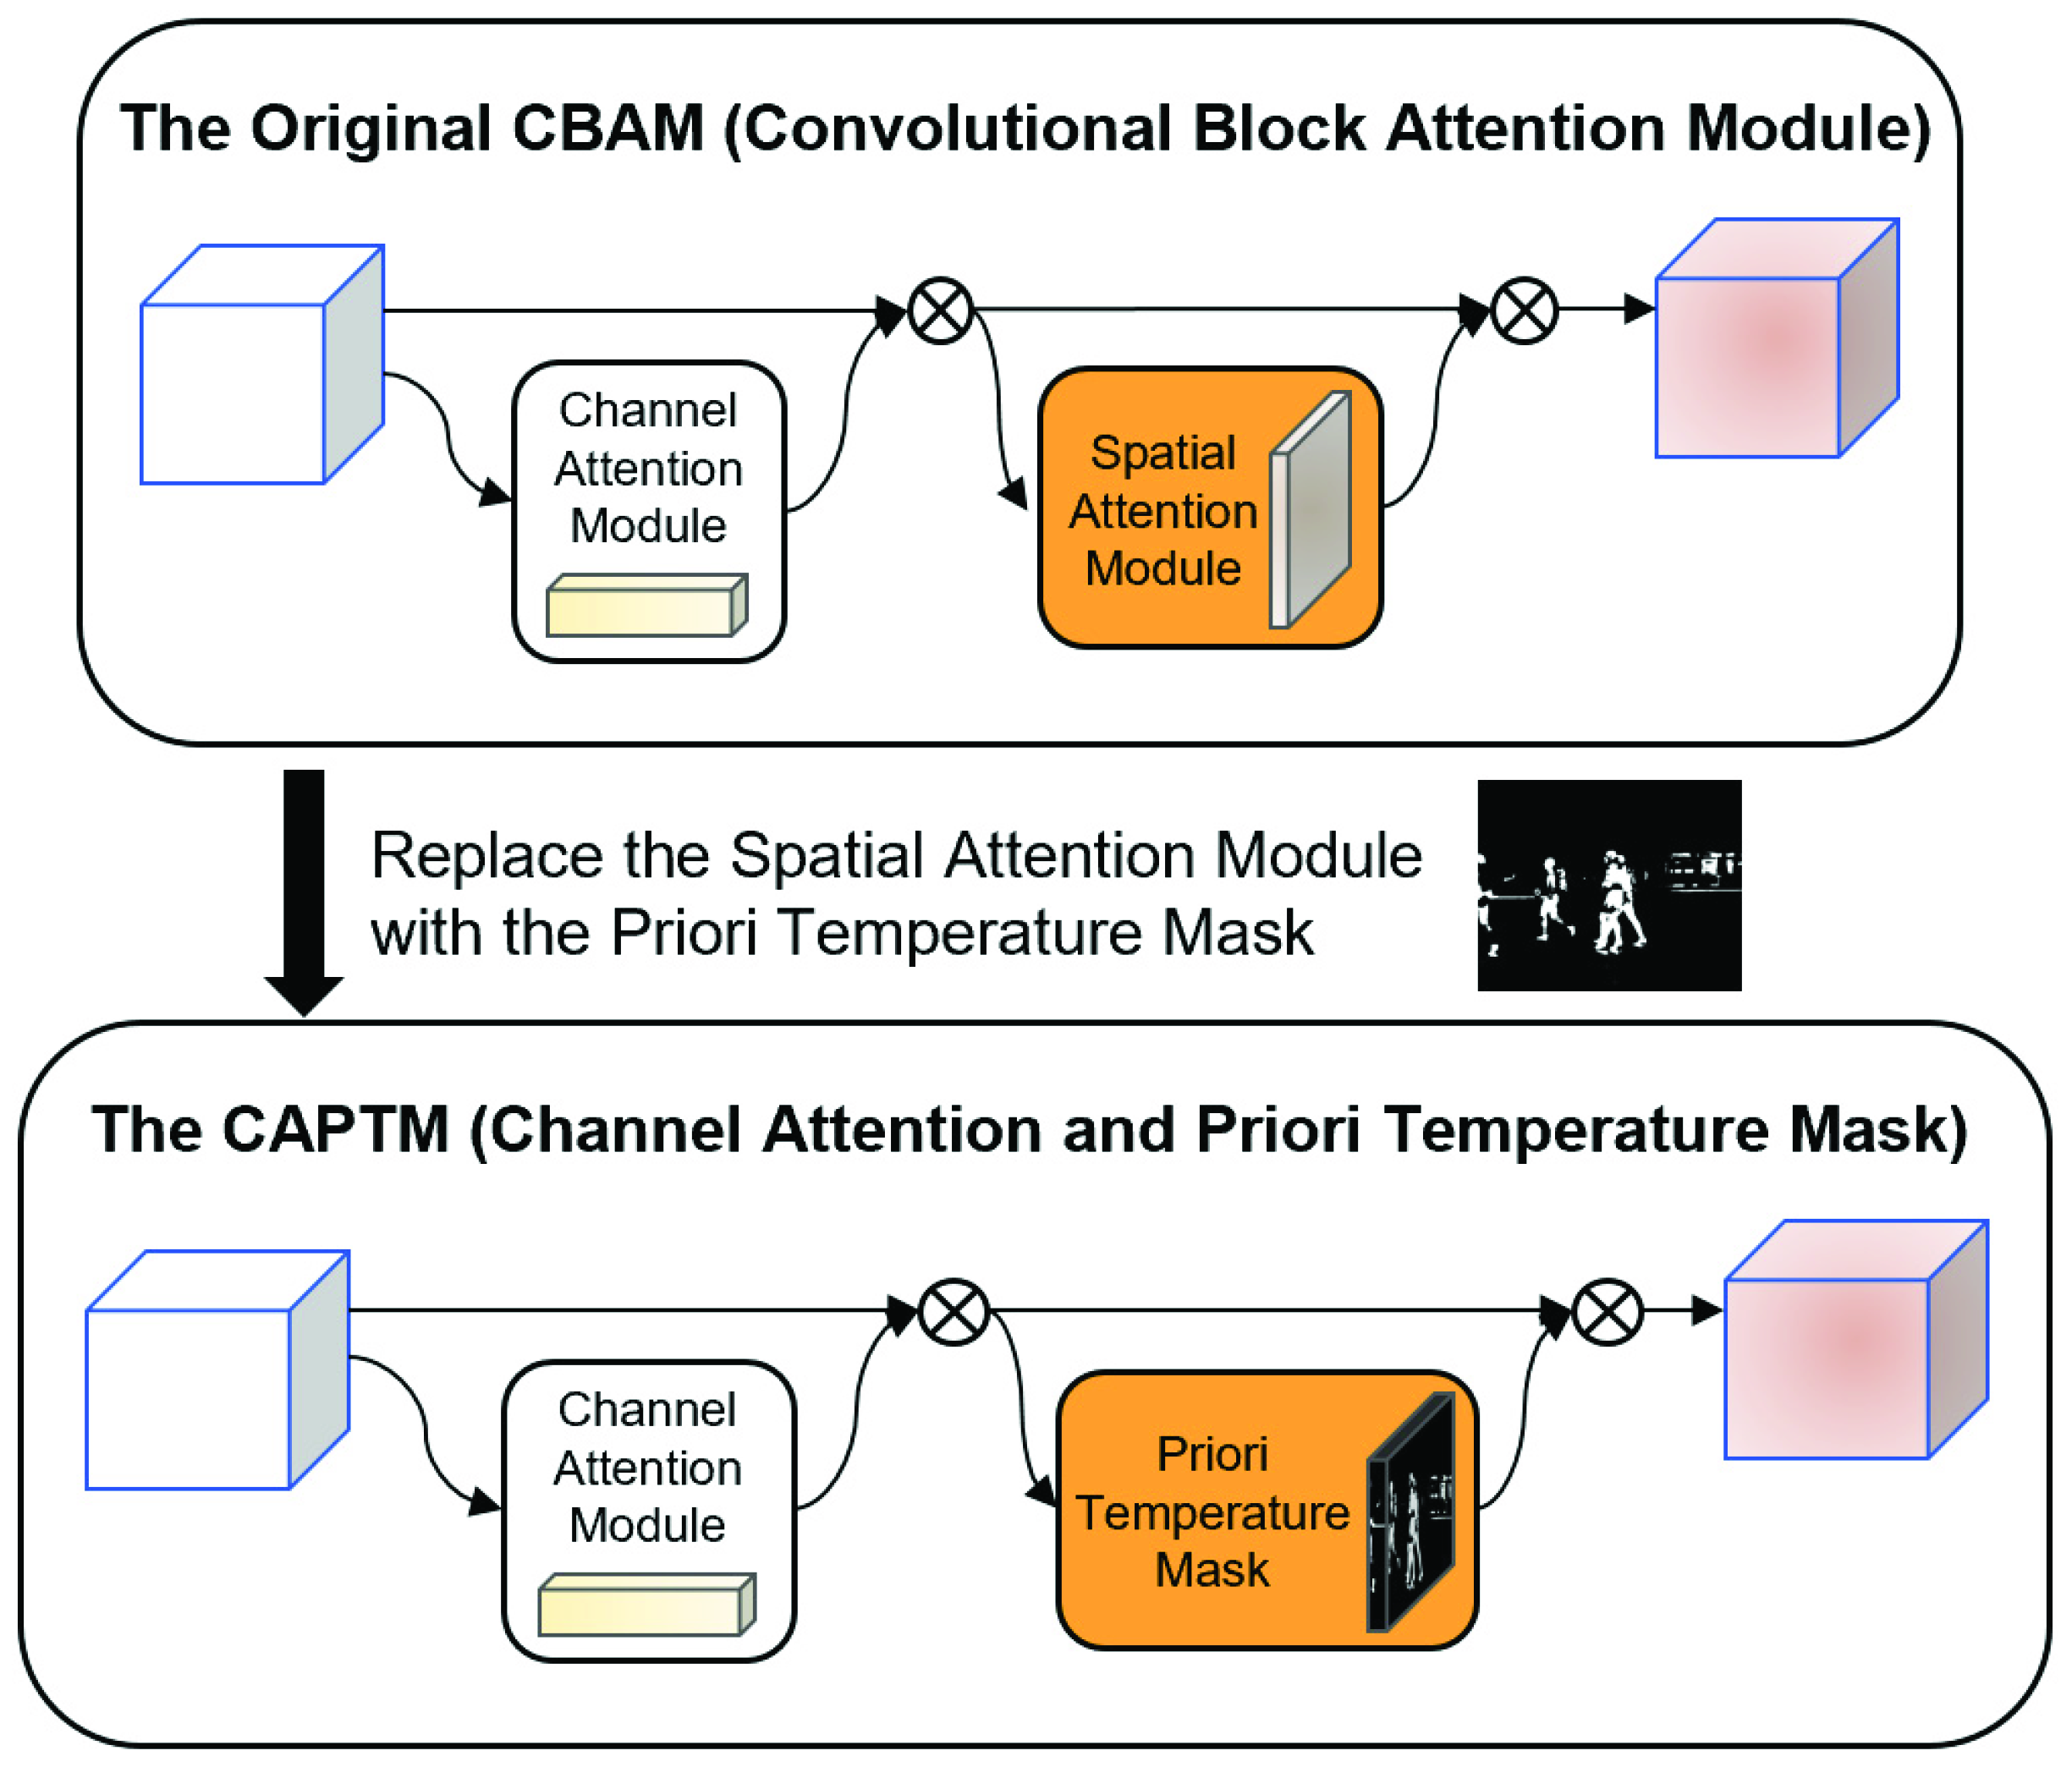
Spatial attention, i.e., focusing on local information in the spatial domain, aims to identify the regions on the feature map that deserve attention, and to ultimately achieve better detection results. Ordinary spatial attention is obtained computationally and is a posteriori knowledge. In contrast, the temperature mask obtained from thermal infrared images can be treated as parameter-free and a priori knowledge-based spatial attention. Therefore, the CAPTM module, which is based on the convolution block attention module (CBAM) [
18] and fuses the a priori knowledge of temperature, is proposed in this work. As shown in
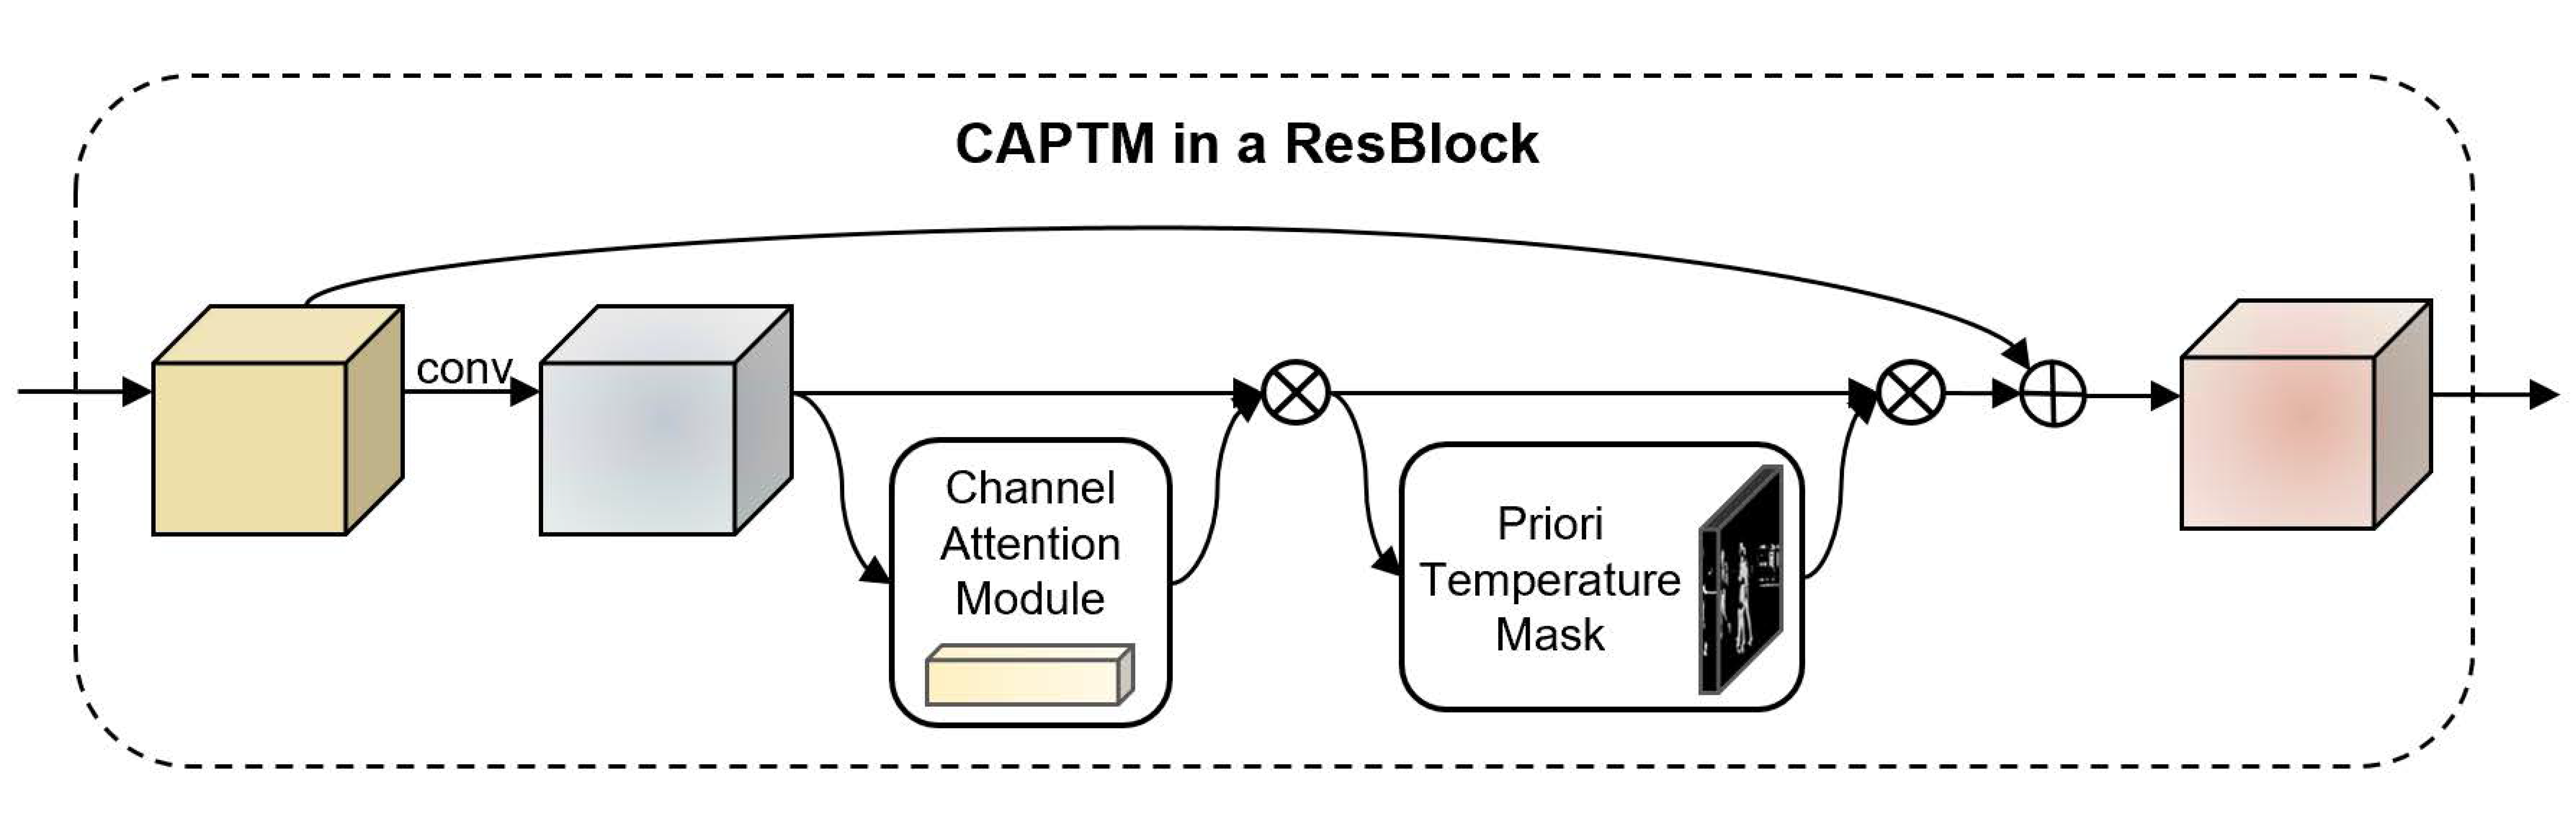
Figure 4, the spatial attention part of the original module is replaced with the temperature mask, thereby reducing the number of parameters and simplifying the complexity of the original CBAM. The channel attention module of the CAPTM module is identical to that of the original CBAM. However, the spatial attention module of the CAPTM omits the parameter operations and instead directly uses the weight matrix formed by the temperature mask. The vector obtained by the channel attention module is then element-wise multiplied with the weight matrix generated by the temperature mask to obtain the final output feature map. As shown in
Figure 5, the CAPTM module was inserted into ResNet [
12] for feature extraction in practical applications.
3.4. The Full Structure of the Model Framework
RetinaNet [
11] was used as the main framework in this study, and was chosen over other deep learning models for three reasons. First, RetinaNet is a one-stage detection method, which runs faster than two-stage detection methods. Second, RetinaNet has a simple structure but excellent performance, and the structure is clear when exploring different fusion locations. Finally, RetinaNet contains the FPN [
13] structure; thus, it is more effective for the FLIR dataset [
14], which is characterized by a large range of target sizes.
RetinaNet consists of three components; the first component is the feature extraction part composed of ResNet, the second component is the multi-scale feature extraction part composed of the FPN, and the third component includes the subnets used to classify and regress the prediction frame. Therefore, to explore the position of the fusion operation, it is explicit to locate the position before ResNet, before ResNet after FPN, and after FPN, which can be referred to as early fusion, middle fusion, and late fusion, respectively. Pei et al. [
15] found that middle fusion is superior; thus, middle fusion was used as the base framework in the present study for further exploration.
Middle fusion occurs after ResNet and before the FPN, as shown in
Figure 6. After determining the image illumination conditions, the visible and thermal images first respectively pass through two convolutional layers and ReLU layers with the same settings. Then, they pass through their respective branches of ResNet (where the CAPTM module is applied). The features extracted in the last three layers of ResNet are then fused layer-by-layer according to the illumination conditions. At this point, the two branch networks converge into one (Pei et al. [
15] used sum fusion at this stage, whereas the proposed model uses a dynamic fusion method based on spatial attention). Finally, the fused features pass through the class and box subnets to obtain the final result. It should be noted that the parameters of the branch networks used to extract the image features are not shared.
Lin et al. proposed an improved cross-entropy (CE loss) loss function called focal loss [
11]; in this function, the original CE loss is multiplied by an exponent that weakens the contribution of the easily detectable targets. This enables focal loss to successfully overcome the problem of common loss functions being swayed by a large number of negative samples under the condition of an extreme imbalance of positive and negative samples. This expression is given by Equation (3). However, the final focal loss [
11] also includes the introduction of the coefficient
so that it can balance the difficult and easy samples, and its expression is given by Equation (4). The model proposed in this paper employs the smooth
L1 as the prediction frame regression loss function, focal loss as the category classification loss function, and the sum of the two as the total loss function, as given by Equation (5).
5. Results
The performance of the CAPTM module when used for different layers of ResNet was evaluated, and the results are reported in
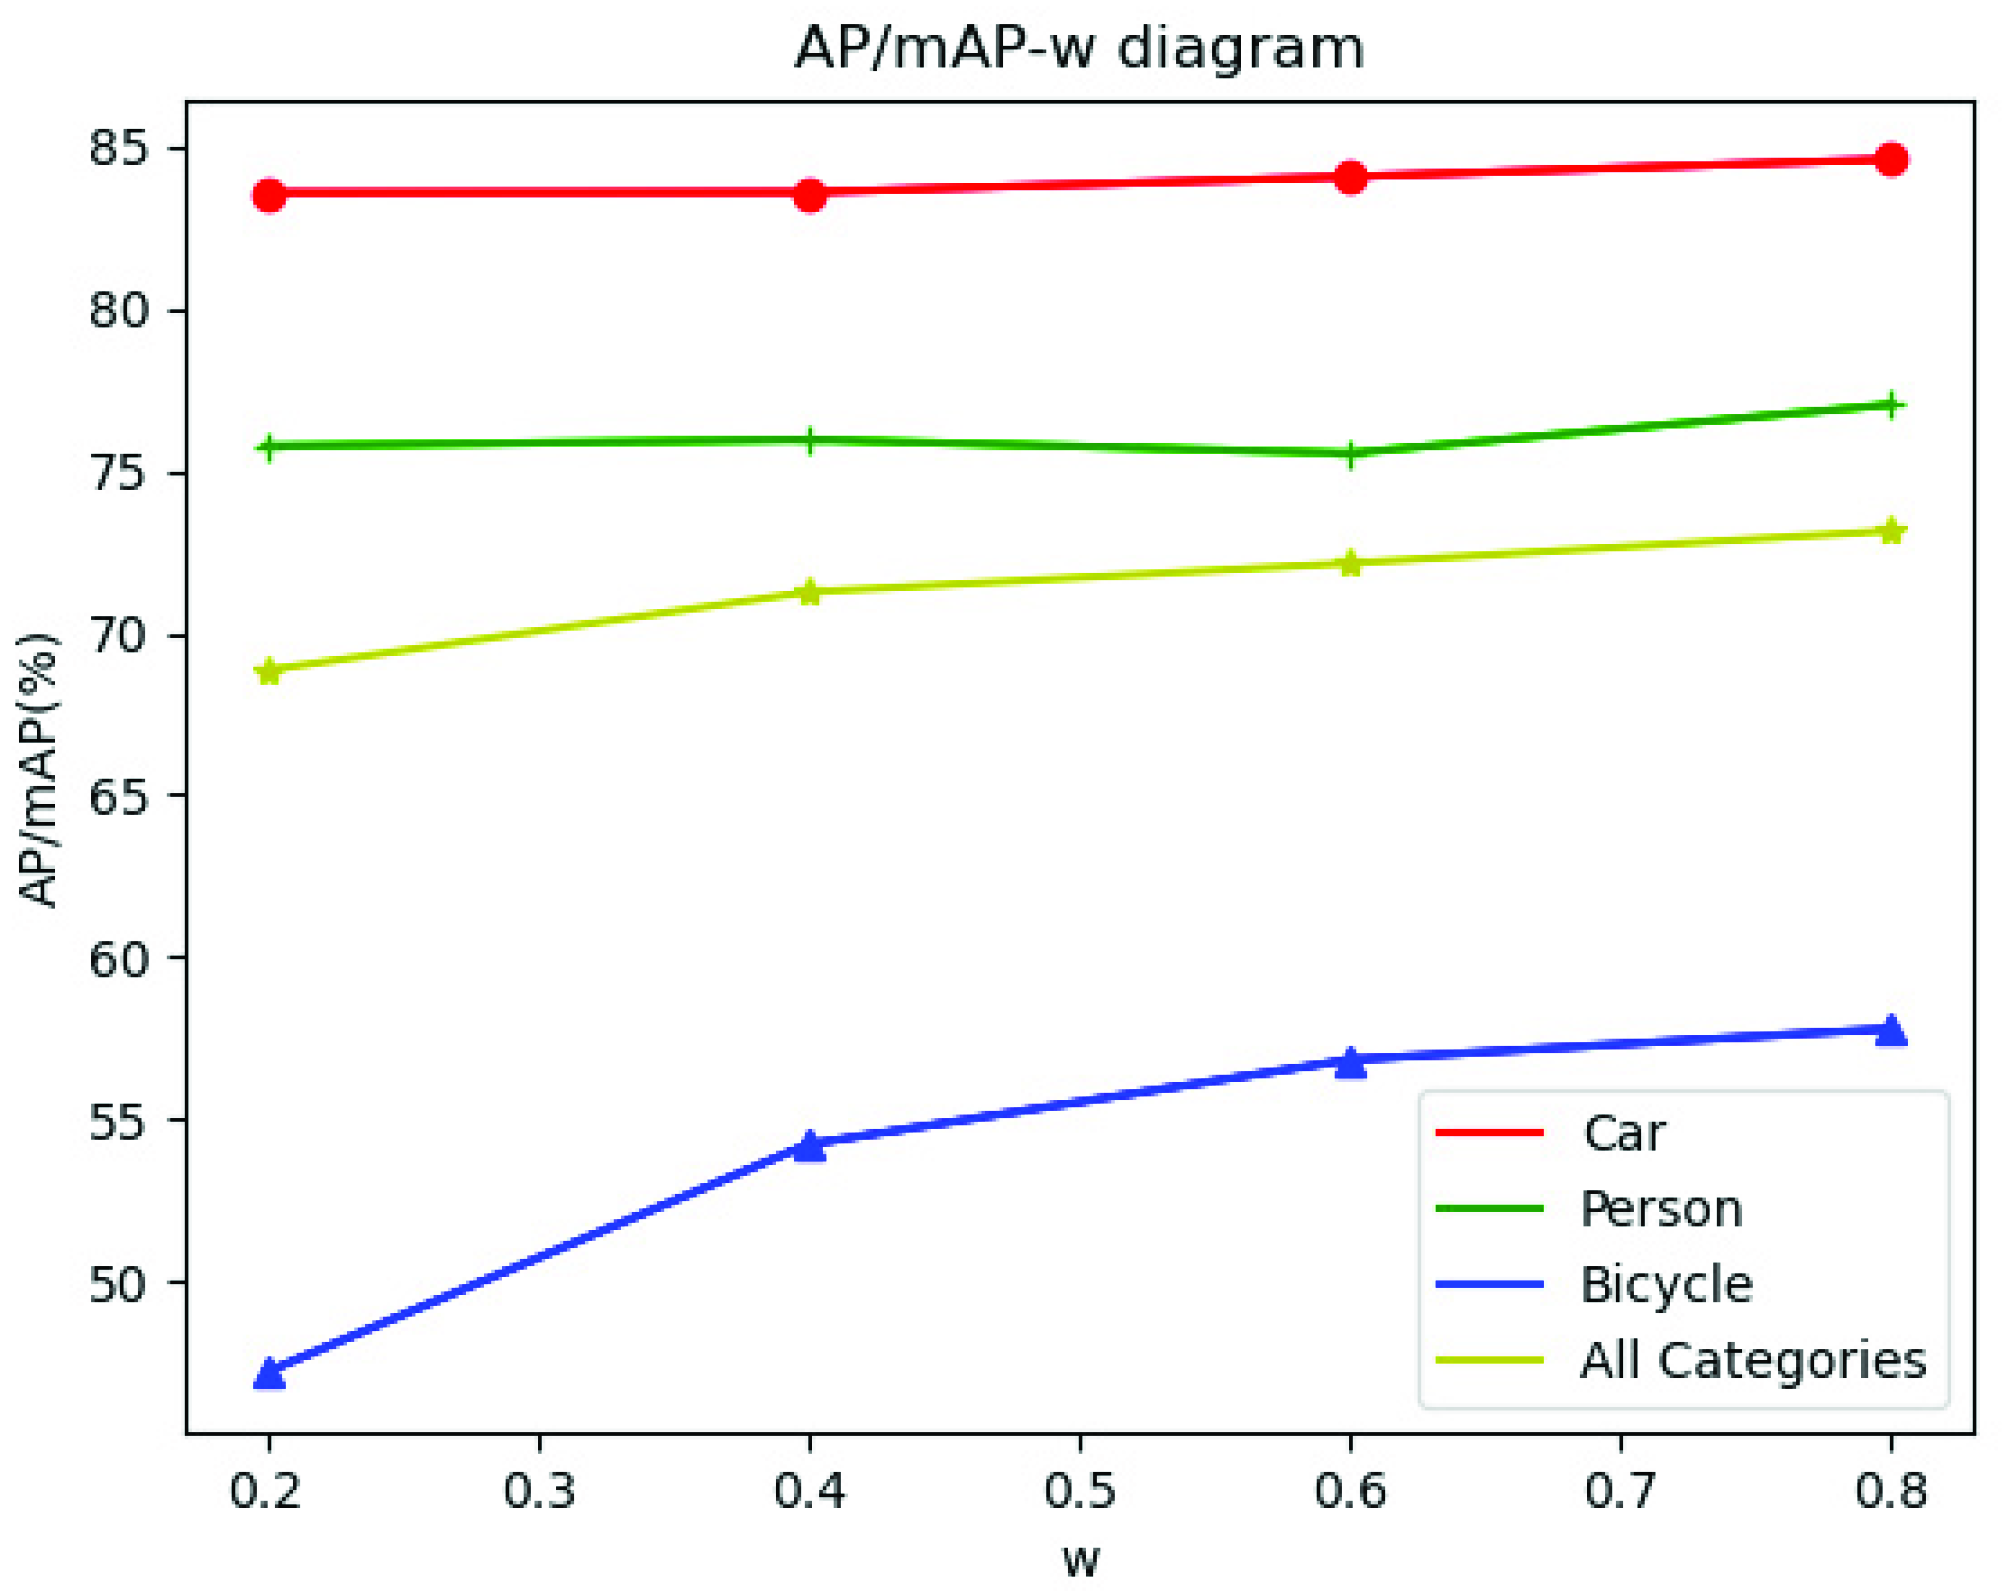
Table 4. As revealed by the table, the mean average precision (mAP) was the highest when the CAPTM was applied to the first three layers of ResNet; however, the accuracy decreased after the CAPTM was applied to all layers. It is posited that this is because the deeper layers in ResNet extract deeper semantic information, while the temperature mask is more effective for only primary object detection, which is prone to false recognition if applied to deeper layers. As shown in
Figure 9, the effects of different values of
of the temperature mask on the results were also evaluated. It can be seen from the figure that the best results were achieved when
. Thus, in the subsequent experiments, the relevant models were set with
.
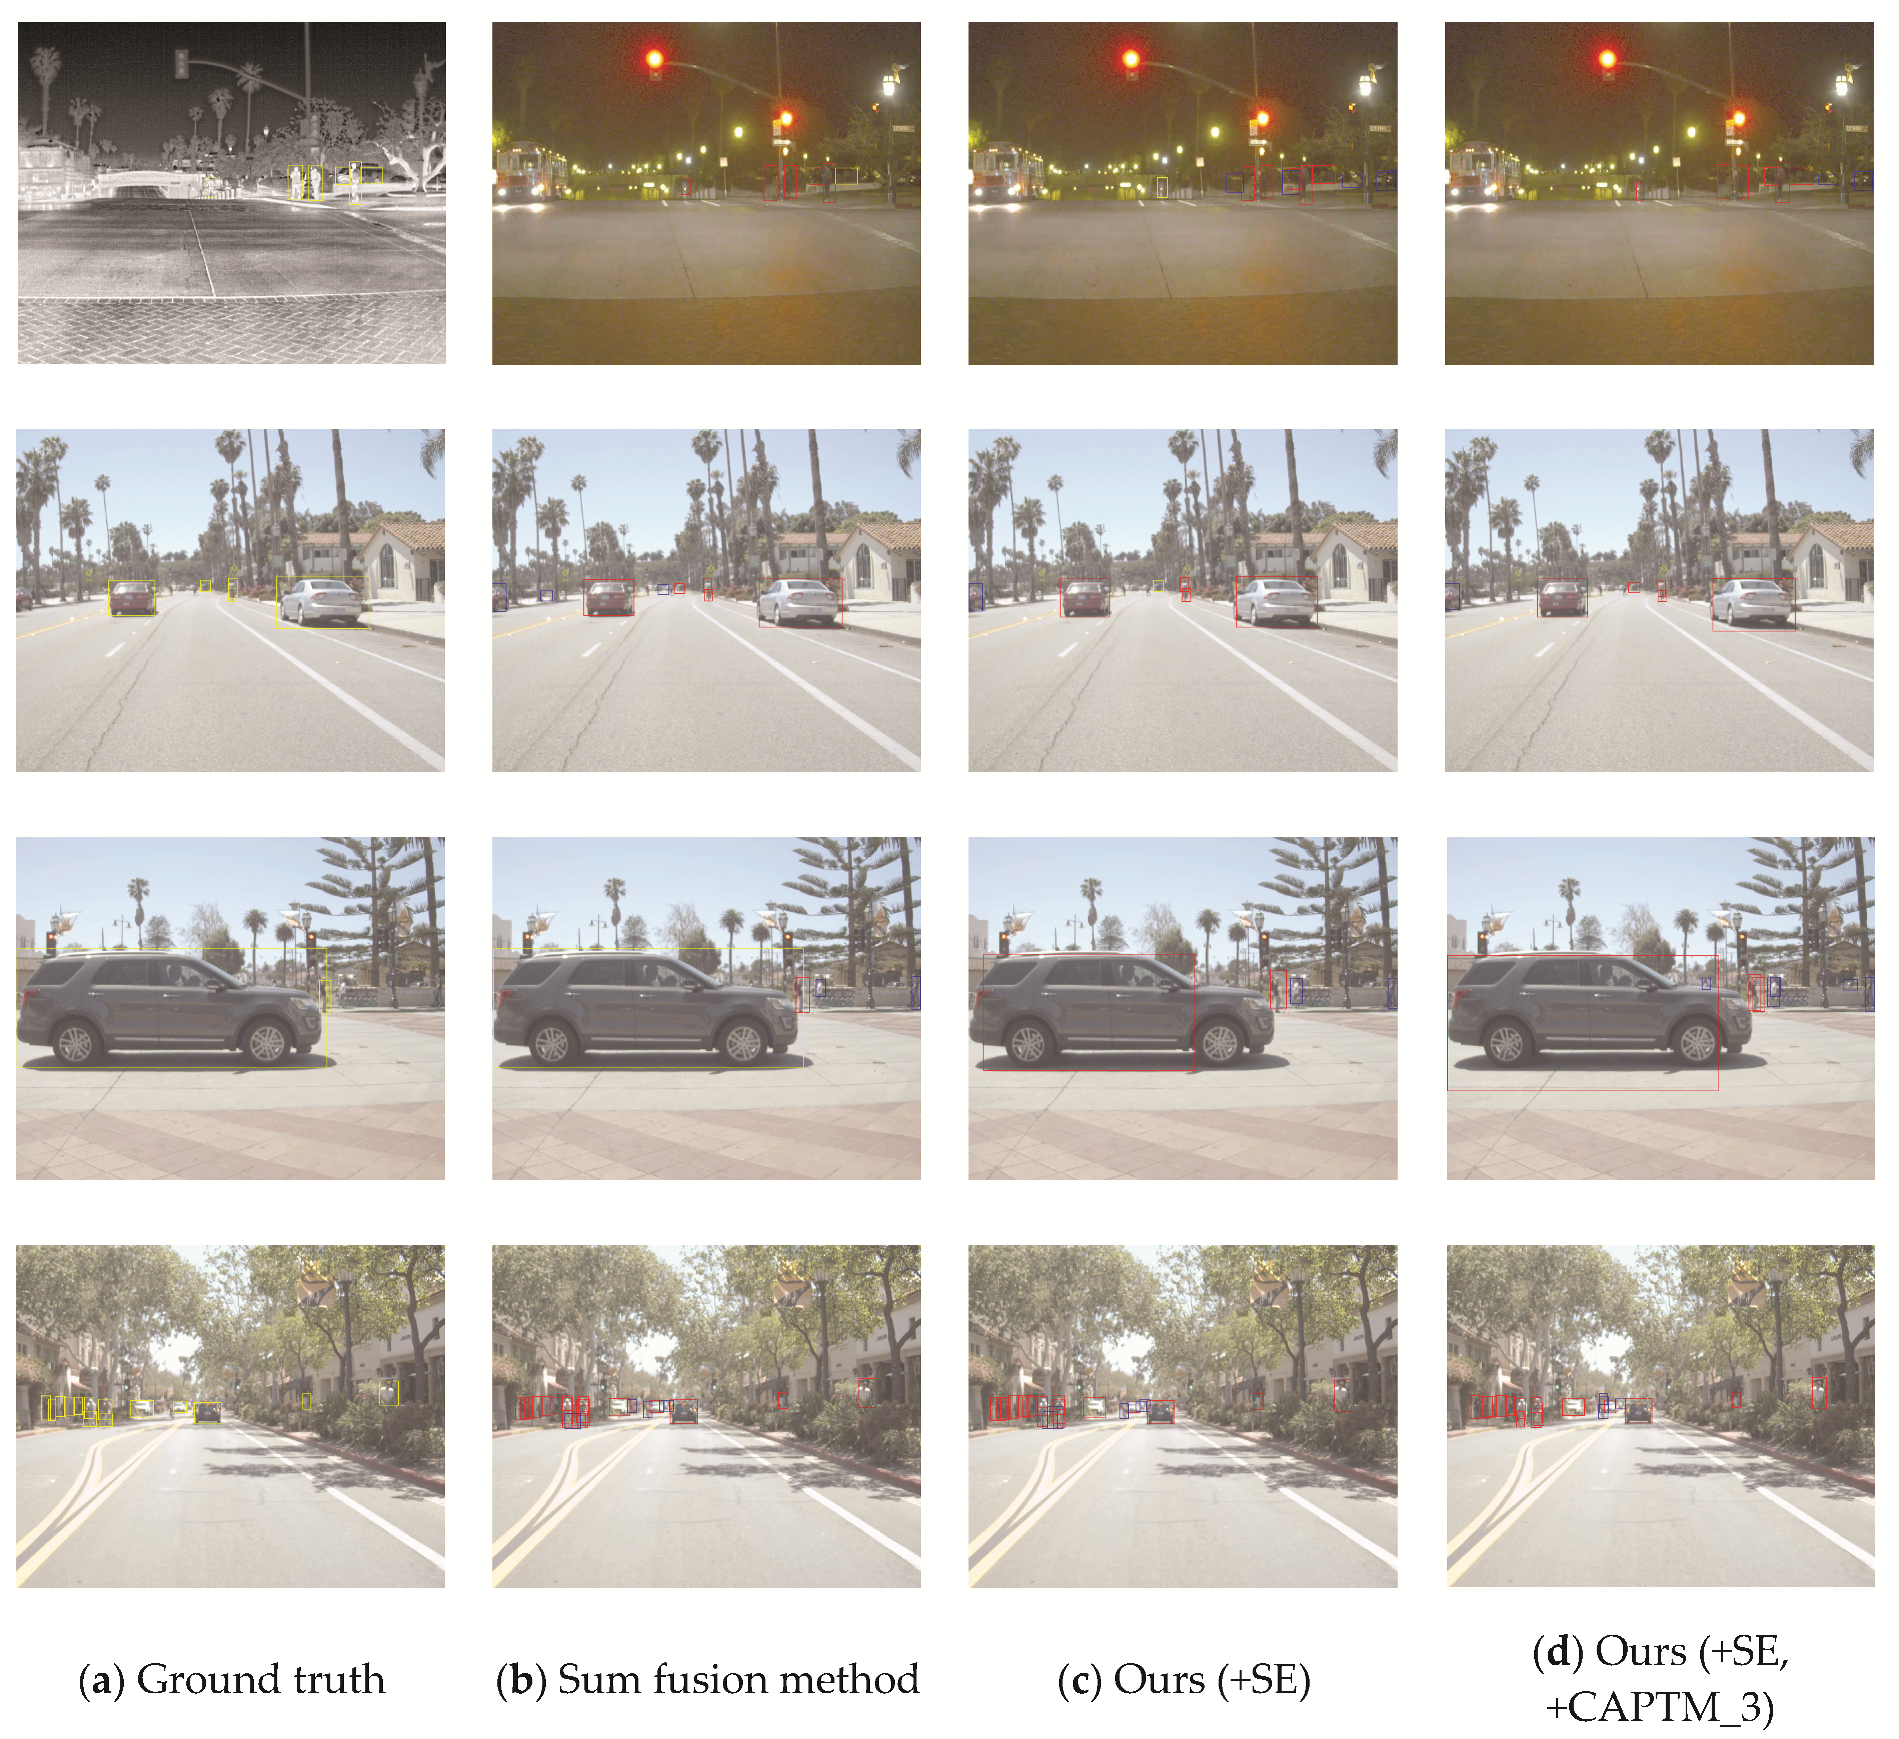
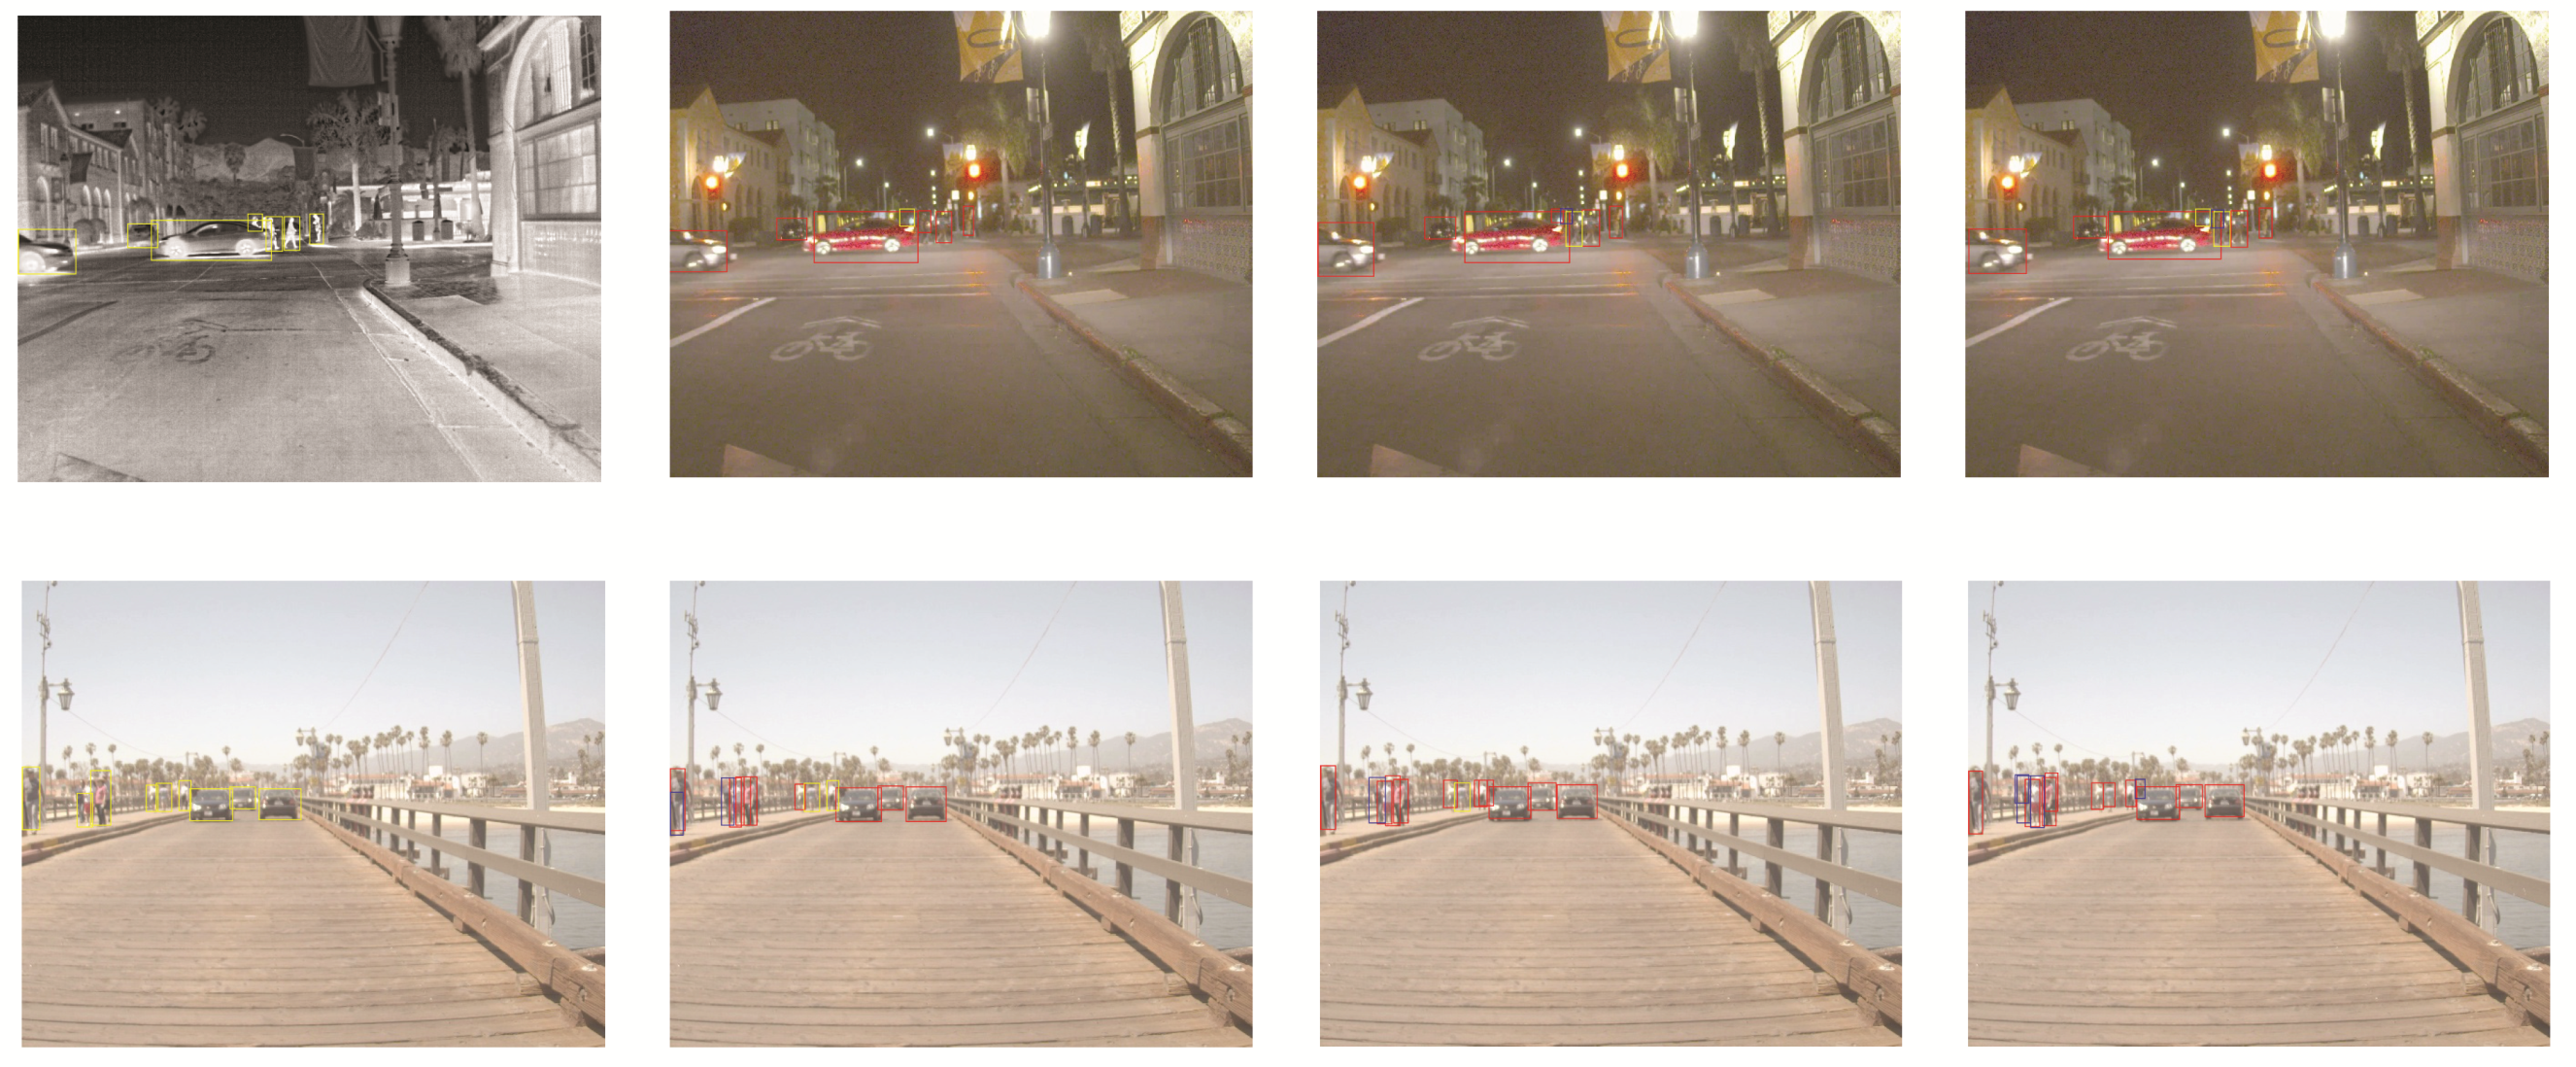
Some representative images were selected for visualization, and the results are shown in
Figure 10. It is evident from the figure that the results improved from left to right, and the proposed model using SE and CAPTM_3 was the best. The detection results of the proposed model using SE and CAPTM_3 were more accurate, and more small objects at farther distances were detected; moreover, many objects that were not labeled by the ground truth were detected. These findings prove the important role of the CAPTM module.
The floating point operations (FLOPs), the number of parameters and the average detection time per image of different models are shown in
Table 5. As can be seen from the table, the FLOPs, the number of parameters and the average detection time of all the models show a trend from rise to decline, reaching the maximum at Model 4. Compared with Model 4, the proposed model with SE and CAPTM_3 decreases in each metric and performs better, which indicates that using the temperature mask instead of the spatial attention method can both improve the accuracy and reduce the model complexity.
The proposed model was compared with other models, and the results are reported in
Table 6. Due to the misalignment in the original dataset, almost no studies have used the FLIR dataset for multispectral object detection. Zhang et al. [
19] published the aligned FLIR dataset and performed multispectral object detection; thus, it was considered as the current state-of-the-art (SOTA) method in this study. As presented in
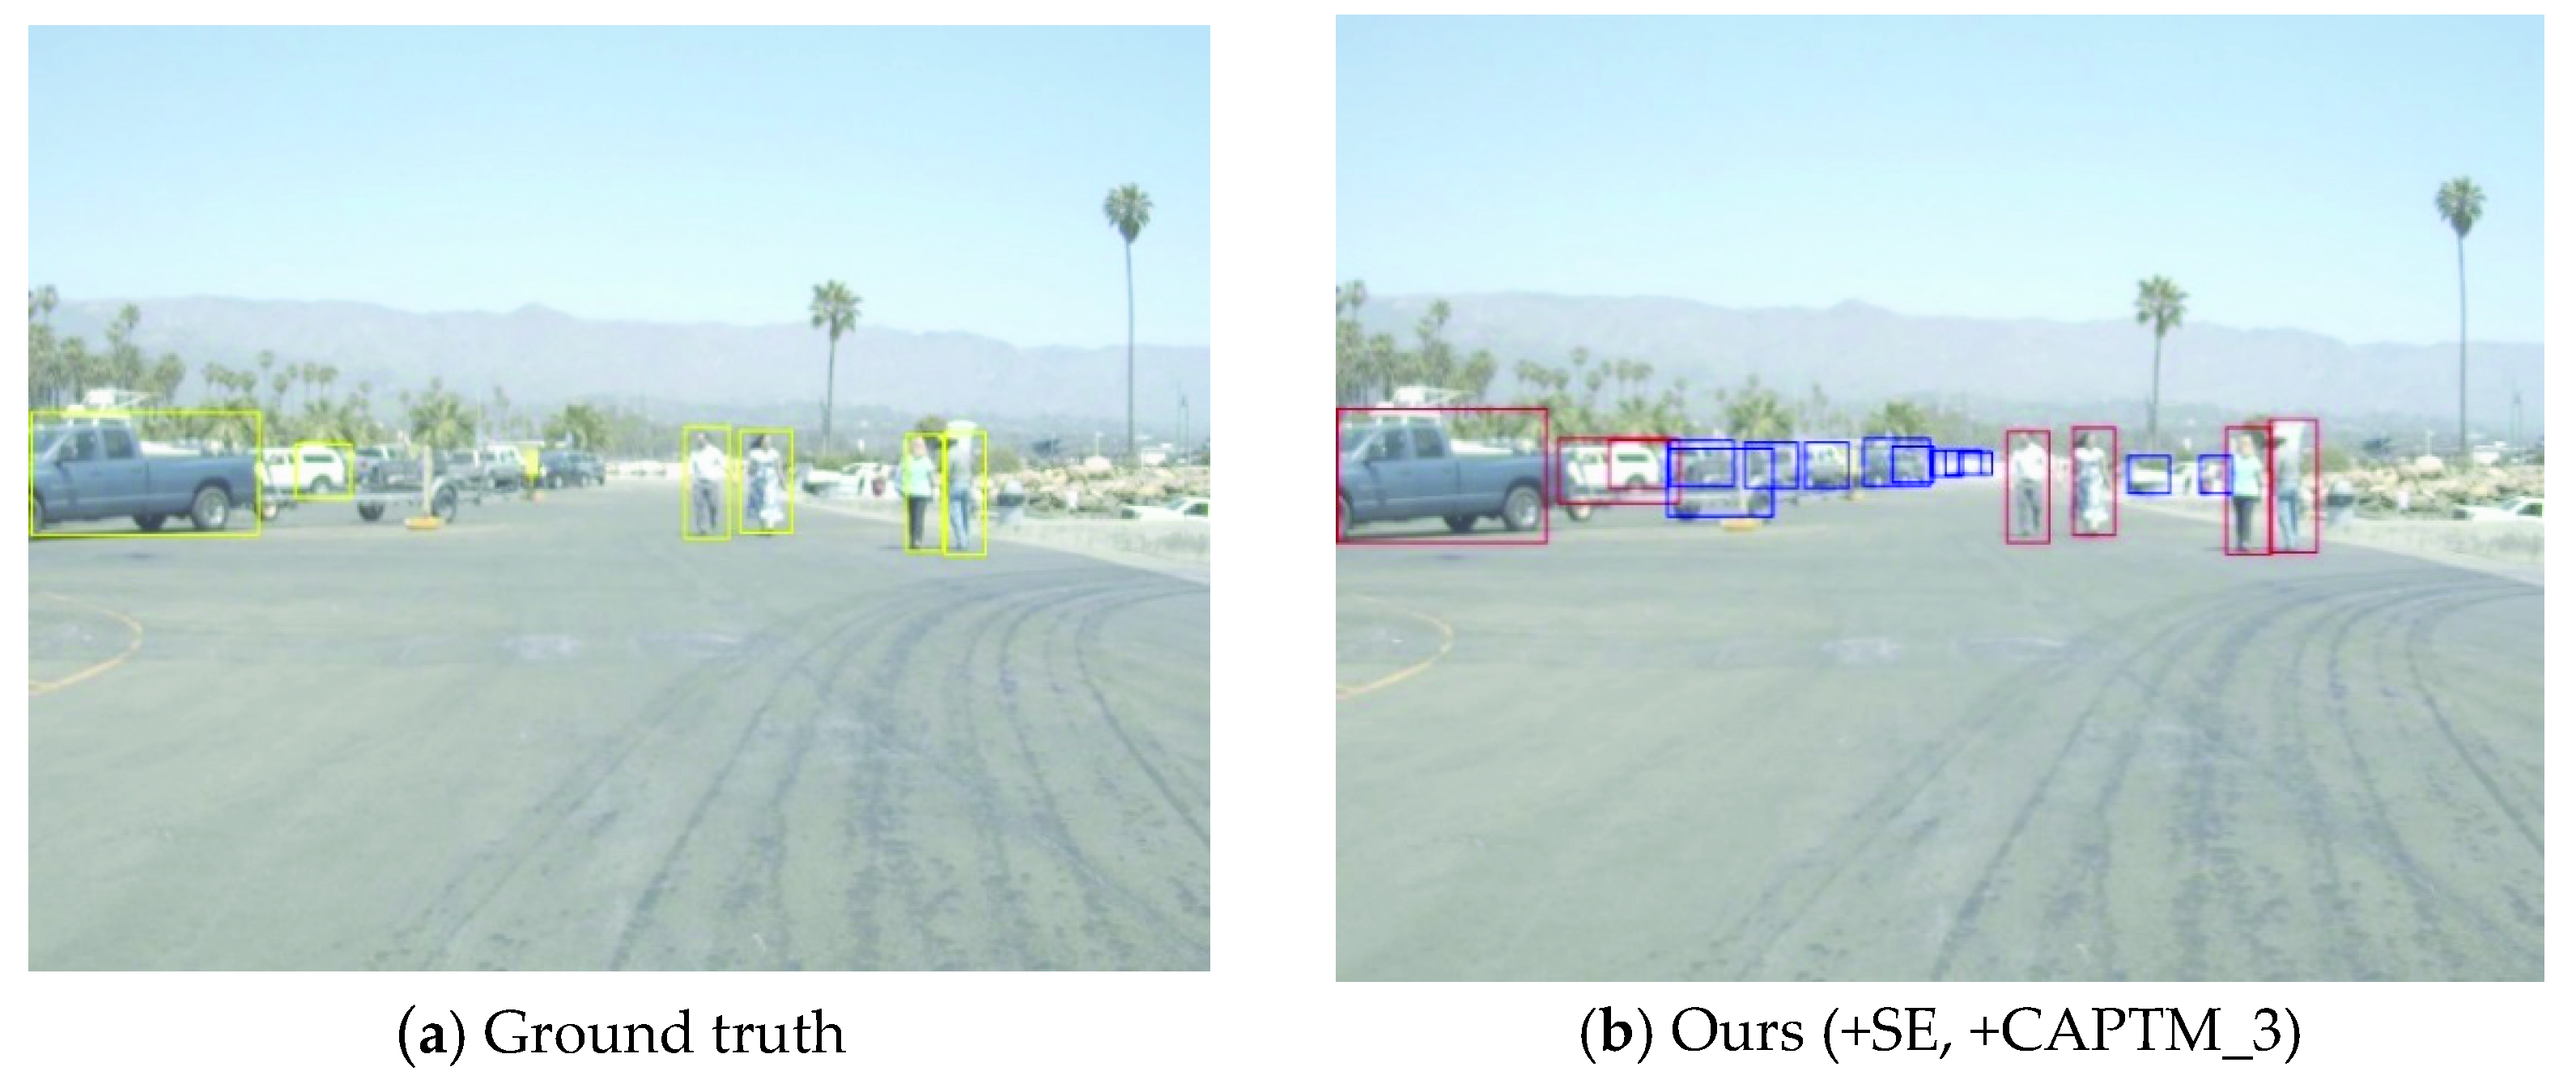
Table 5, Models 3 and 1 were compared to effectively prove the effectiveness of the proposed fusion method based on the illumination conditions and the channel attention mechanism; Models 5 (the proposed model) and 4 were compared to prove the effectiveness of the proposed CAPTM module; Models 5 and 2 (SOTA) were compared to prove the validity of all the proposed methods. It can be seen that the proposed model (Model 5) achieved a great improvement in accuracy as compared with Models 1, 3, and 4, and the accuracy on the Person object category exhibited a greater improvement as compared with that of Model 2, which proves that the proposed model is more suitable for the detection of objects with richer temperature information. However, compared with Models 2 and 3, the mAP of the Car object category was reduced, which is likely due to the existence of many unlabeled objects in the ground truth; as shown in
Figure 11, many vehicles parked on the roadside were detected by the proposed model while they were not labeled in the ground truth. These objects can increase the number of false-positive results and consequently reduce the mAP value.
6. Discussion
6.1. Whether the Aligned FLIR Dataset Has a Class Imbalance Problem
As described in
Section 4.1, the number ratio of daytime images to nighttime images in the aligned FLIR dataset is not close to 1:1 (80% of daytime images and 20% of nighttime images), so there is a high probability of class imbalance. To examine whether this ratio causes class imbalance, the daytime images and nighttime images in the test set were split for accuracy verification, and the results are shown in
Table 7. From the table, it can be seen that the mAP in the nighttime scene is similar to that in the daytime scene, which indicates that although the number of images in the nighttime is less than that in the daytime, it is sufficient for training to achieve the desired accuracy. Actually, the sample ratio of the class imbalance problem is generally 10:1 or higher.
From the horizontal comparison point of view, the accuracy of both Car and Person categories is higher at night than during the day; the accuracy of Bicycle category is lower at night than during the day. It is speculated that it is due to that both Car and Person categories have richer temperature information at night, while Bicycle category has weaker temperature information and can hardly be distinguished by thermal infrared sensors at night. From the longitudinal comparison point of view, the proposed model (Model 5) has higher accuracy in the Person category and reaches the highest accuracy in the nighttime scene; the Car category has higher accuracy than Models 1 and 4, but lower accuracy than Model 3. It is speculated that it is due to the Person category has the richest temperature information, in addition to the inaccurate labeling of the Car category in the dataset as mentioned above. Comprehensive results demonstrate the effectiveness of the proposed method for objects with rich temperature information.
6.2. Threshold Setting in Temperature Mask Extraction
One of the objectives of the experimental design of this study is to maximize the exploitation of thermal infrared images. The temperature information used in the CAPTM model proposed in this paper is a priori and known, which means that the environmental information of the application scene when using the model can be readily accessible, and then the appropriate threshold for extracting the corresponding temperature mask file can be set.
For this study, the most ideal dataset should have the following conditions:
- 1
Having visible and thermal infrared images in the same place and same time for feature fusion;
- 2
Having raw thermal infrared data (TIFF file) instead of stretched and processed thermal infrared images (jpg/jpeg file), for extracting temperature mask information;
- 3
Having environmental information, such as light, temperature, humidity, atmospheric pressure, etc., for extracting the temperature mask by constructing a TIFF file pixel value-temperature model.
If a dataset satisfies conditions 1 and 2 along with condition 3, then a TIFF file pixel value-temperature model can be constructed and the temperature mask can be extracted by setting a fixed temperature threshold, e.g., if the human body temperature is kept between 20–40 °C, then a threshold of 20–40 can be set for extracting the Person category.
However, there is no publicly available dataset that fulfills all the conditions, and only the FLIR dataset satisfies conditions 1 and 2. Therefore, a ResNet50 was used to classify the data illumination scenes and the thresholds with good results were used for mask extraction (any classifier can be used as long as good results can be obtained).
6.3. Noise in the Temperature Mask Files
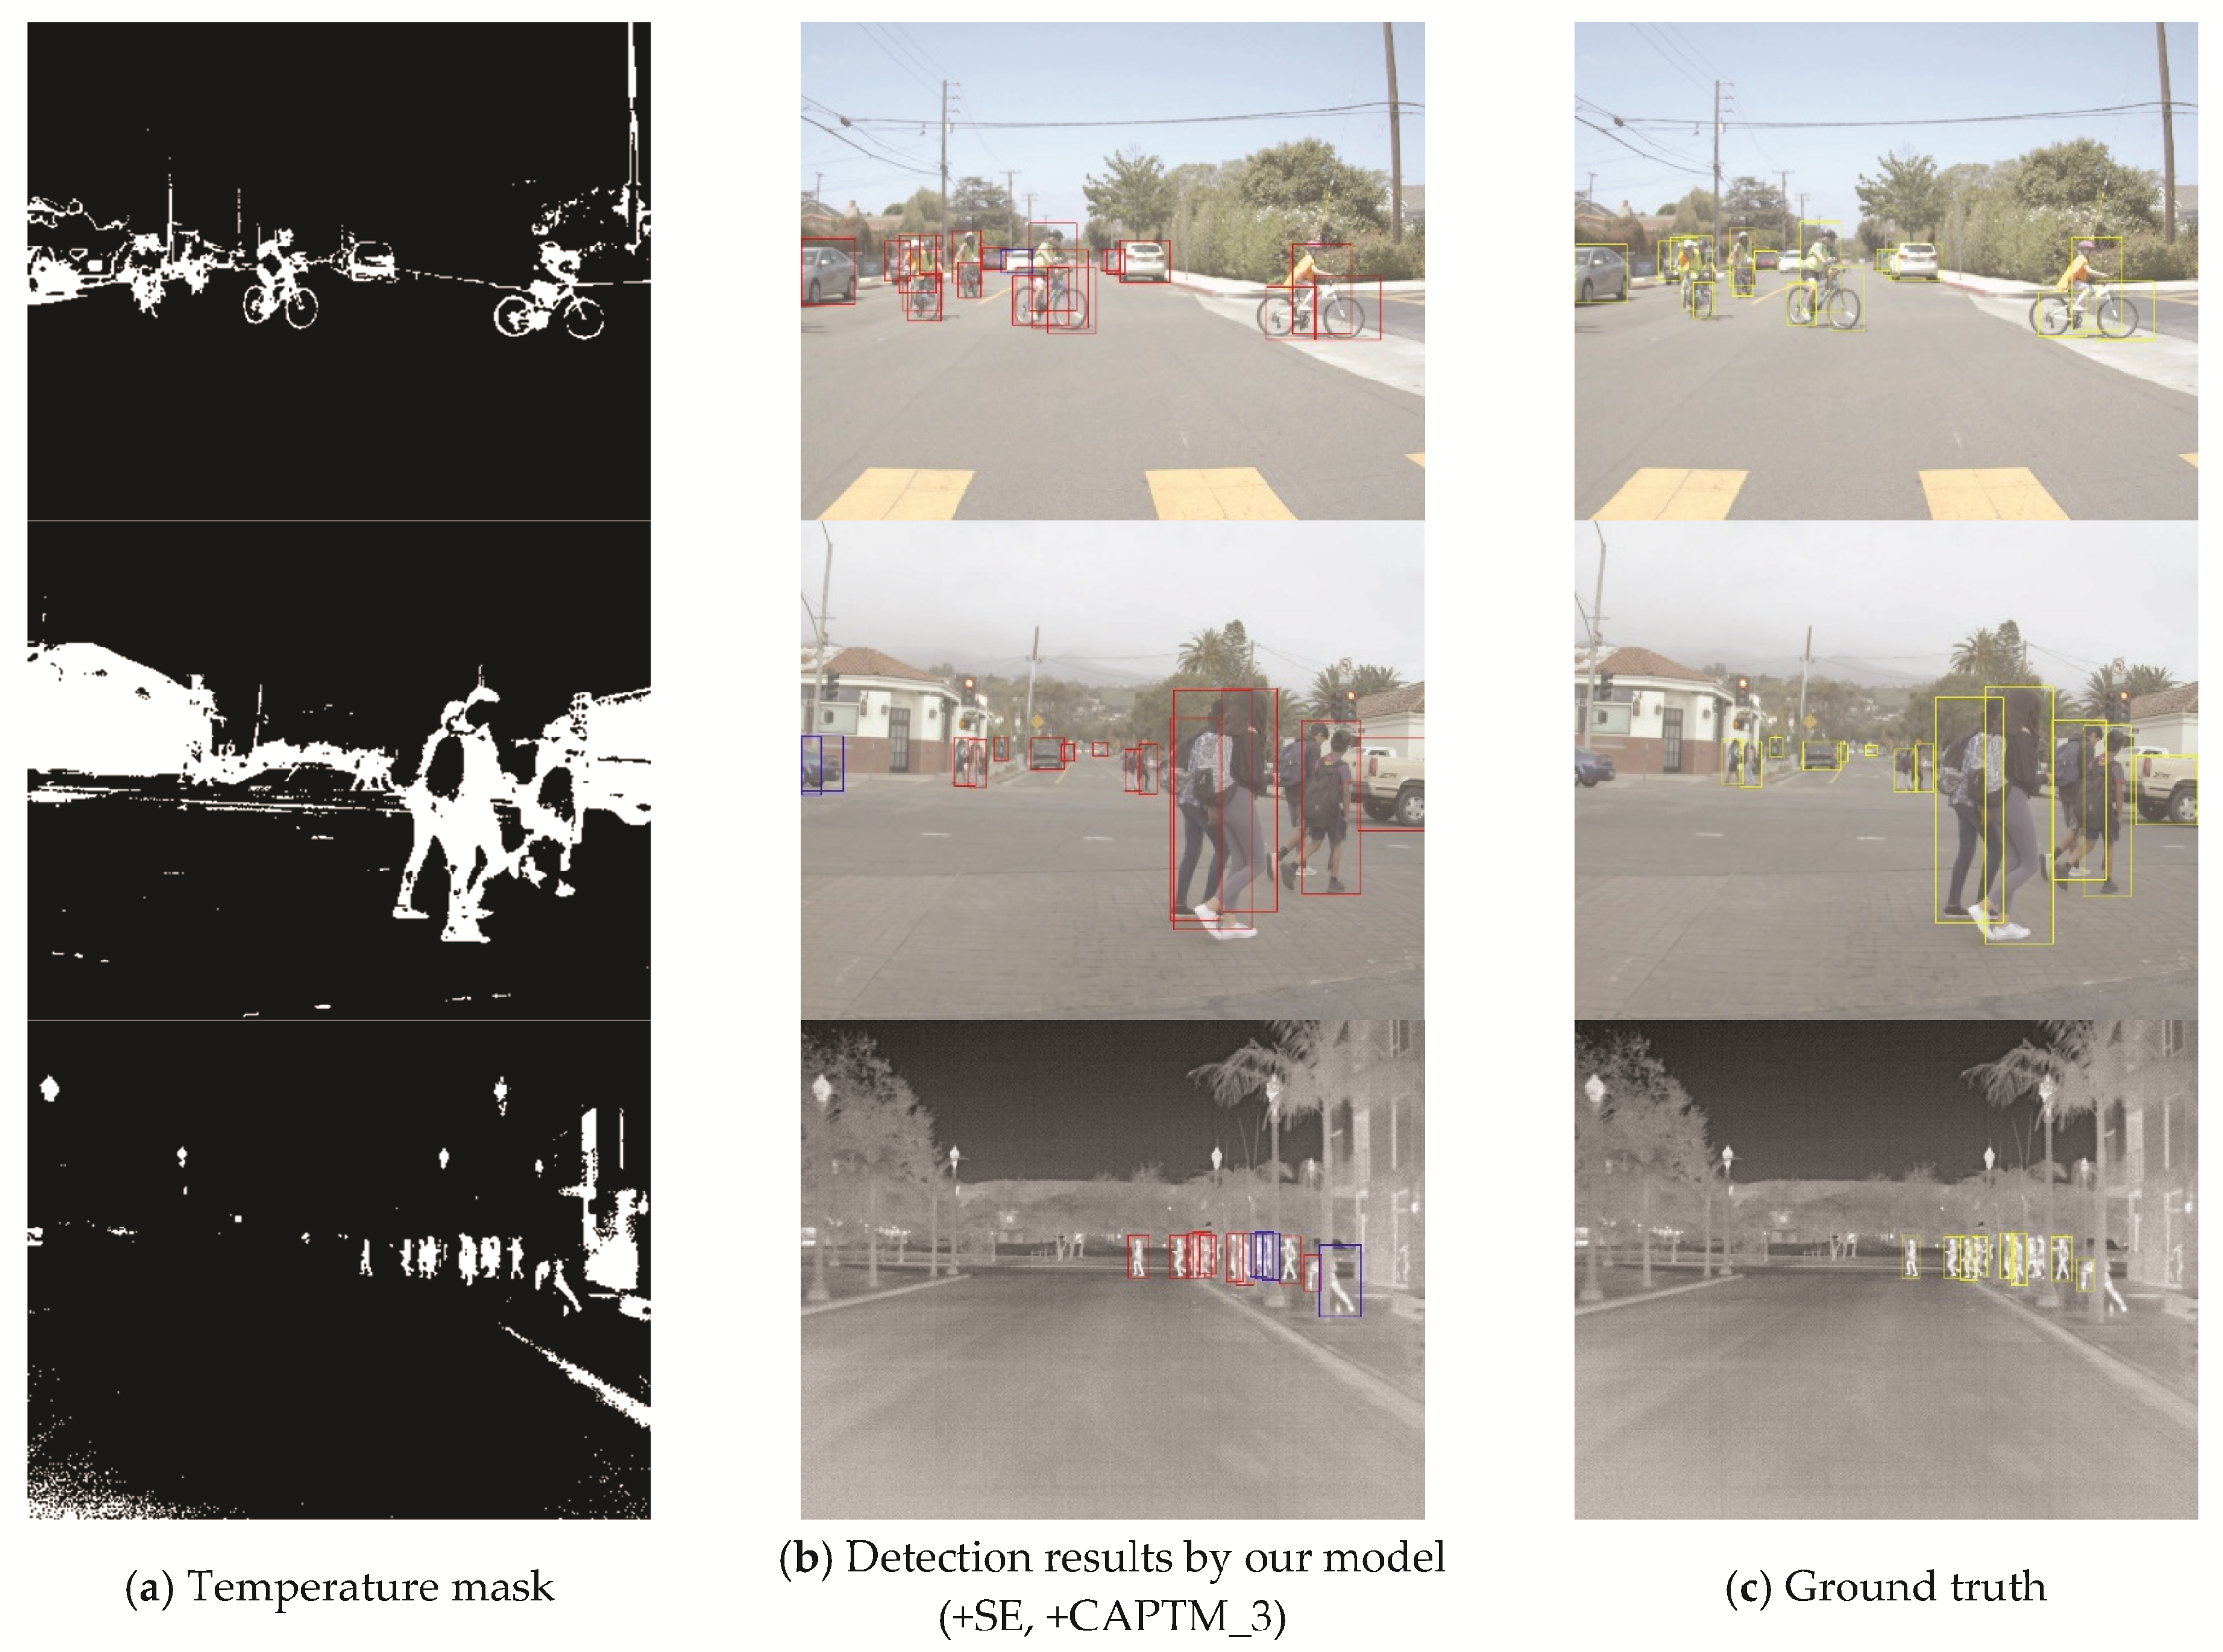
The background of the temperature mask file extracted by setting the temperature threshold generates lots of noise, and shadows, buildings, street lights, etc. may be extracted (as shown in
Figure 3a and
Figure 12a). However, this study only applies the CAPTM module to the shallower part of the feature extraction network (the first three layers of ResNet) to obtain the shallow semantic information. Moreover, in this study, the temperature mask as a priori information only provides a general direction for the object detection and does not directly interfere with the final detection results. The graph of the detection results in
Figure 12b can effectively prove the above arguments, and even the street light in the third row, which has a very person-like silhouette, was not falsely detected.
Since the noise of the temperature mask does not unduly affect the final detection results, the threshold values for extracting the mask file do not need to be too precise.
7. Conclusions
Based on previous studies, this research proposed a multi-data-source feature fusion method with a channel attention mechanism. Moreover, for the first time, the temperature information contained in thermal infrared images was used as a priori knowledge to improve the accuracy of object detection. First, the FLIR dataset [
14] was used to train an illumination condition classification model. Second, two branch networks were respectively used to extract the feature information of visible and thermal images with the proposed CAPTM module. Then, the features were fused based on the classification results with a channel attention method before ResNet followed by the FPN. Finally, the object detection results were obtained. The results of experiments demonstrate that the proposed method is very effective. Compared with the existing SOTA method, the overall mAP of the proposed model was found to be improved by 0.69%, and the AP of the Person object category was improved by 2.55%, which is because the temperature information of people is richer in any environment. The results also validate the effectiveness of the proposed methods and indicate their importance for many fields, such as autonomous driving, disaster rescue, robot navigation, and intelligent video surveillance.
However, the proposed method only classifies, and does not quantify, the illumination conditions, which is one direction that could be improved in the future. Secondly, because the FLIR dataset does not include specific environmental information (e.g., temperature, humidity, time, etc.), different thresholds were only set for temperature mask extraction according to different scenes. Furthermore, these experiments were not tested on other datasets. In future studies, the original images and corresponding environmental data can be collected to construct a pixel value-temperature model of TIFF files so that a single temperature threshold can be set for mask extraction, and the proposed methods can be tested on a bigger dataset.


