
Comparing Interpretation of High-Resolution Aerial Imagery by Humans and Artificial Intelligence to Detect an Invasive Tree Species

 , , , ,
Abstract
1. Introduction
2. Materials and Methods
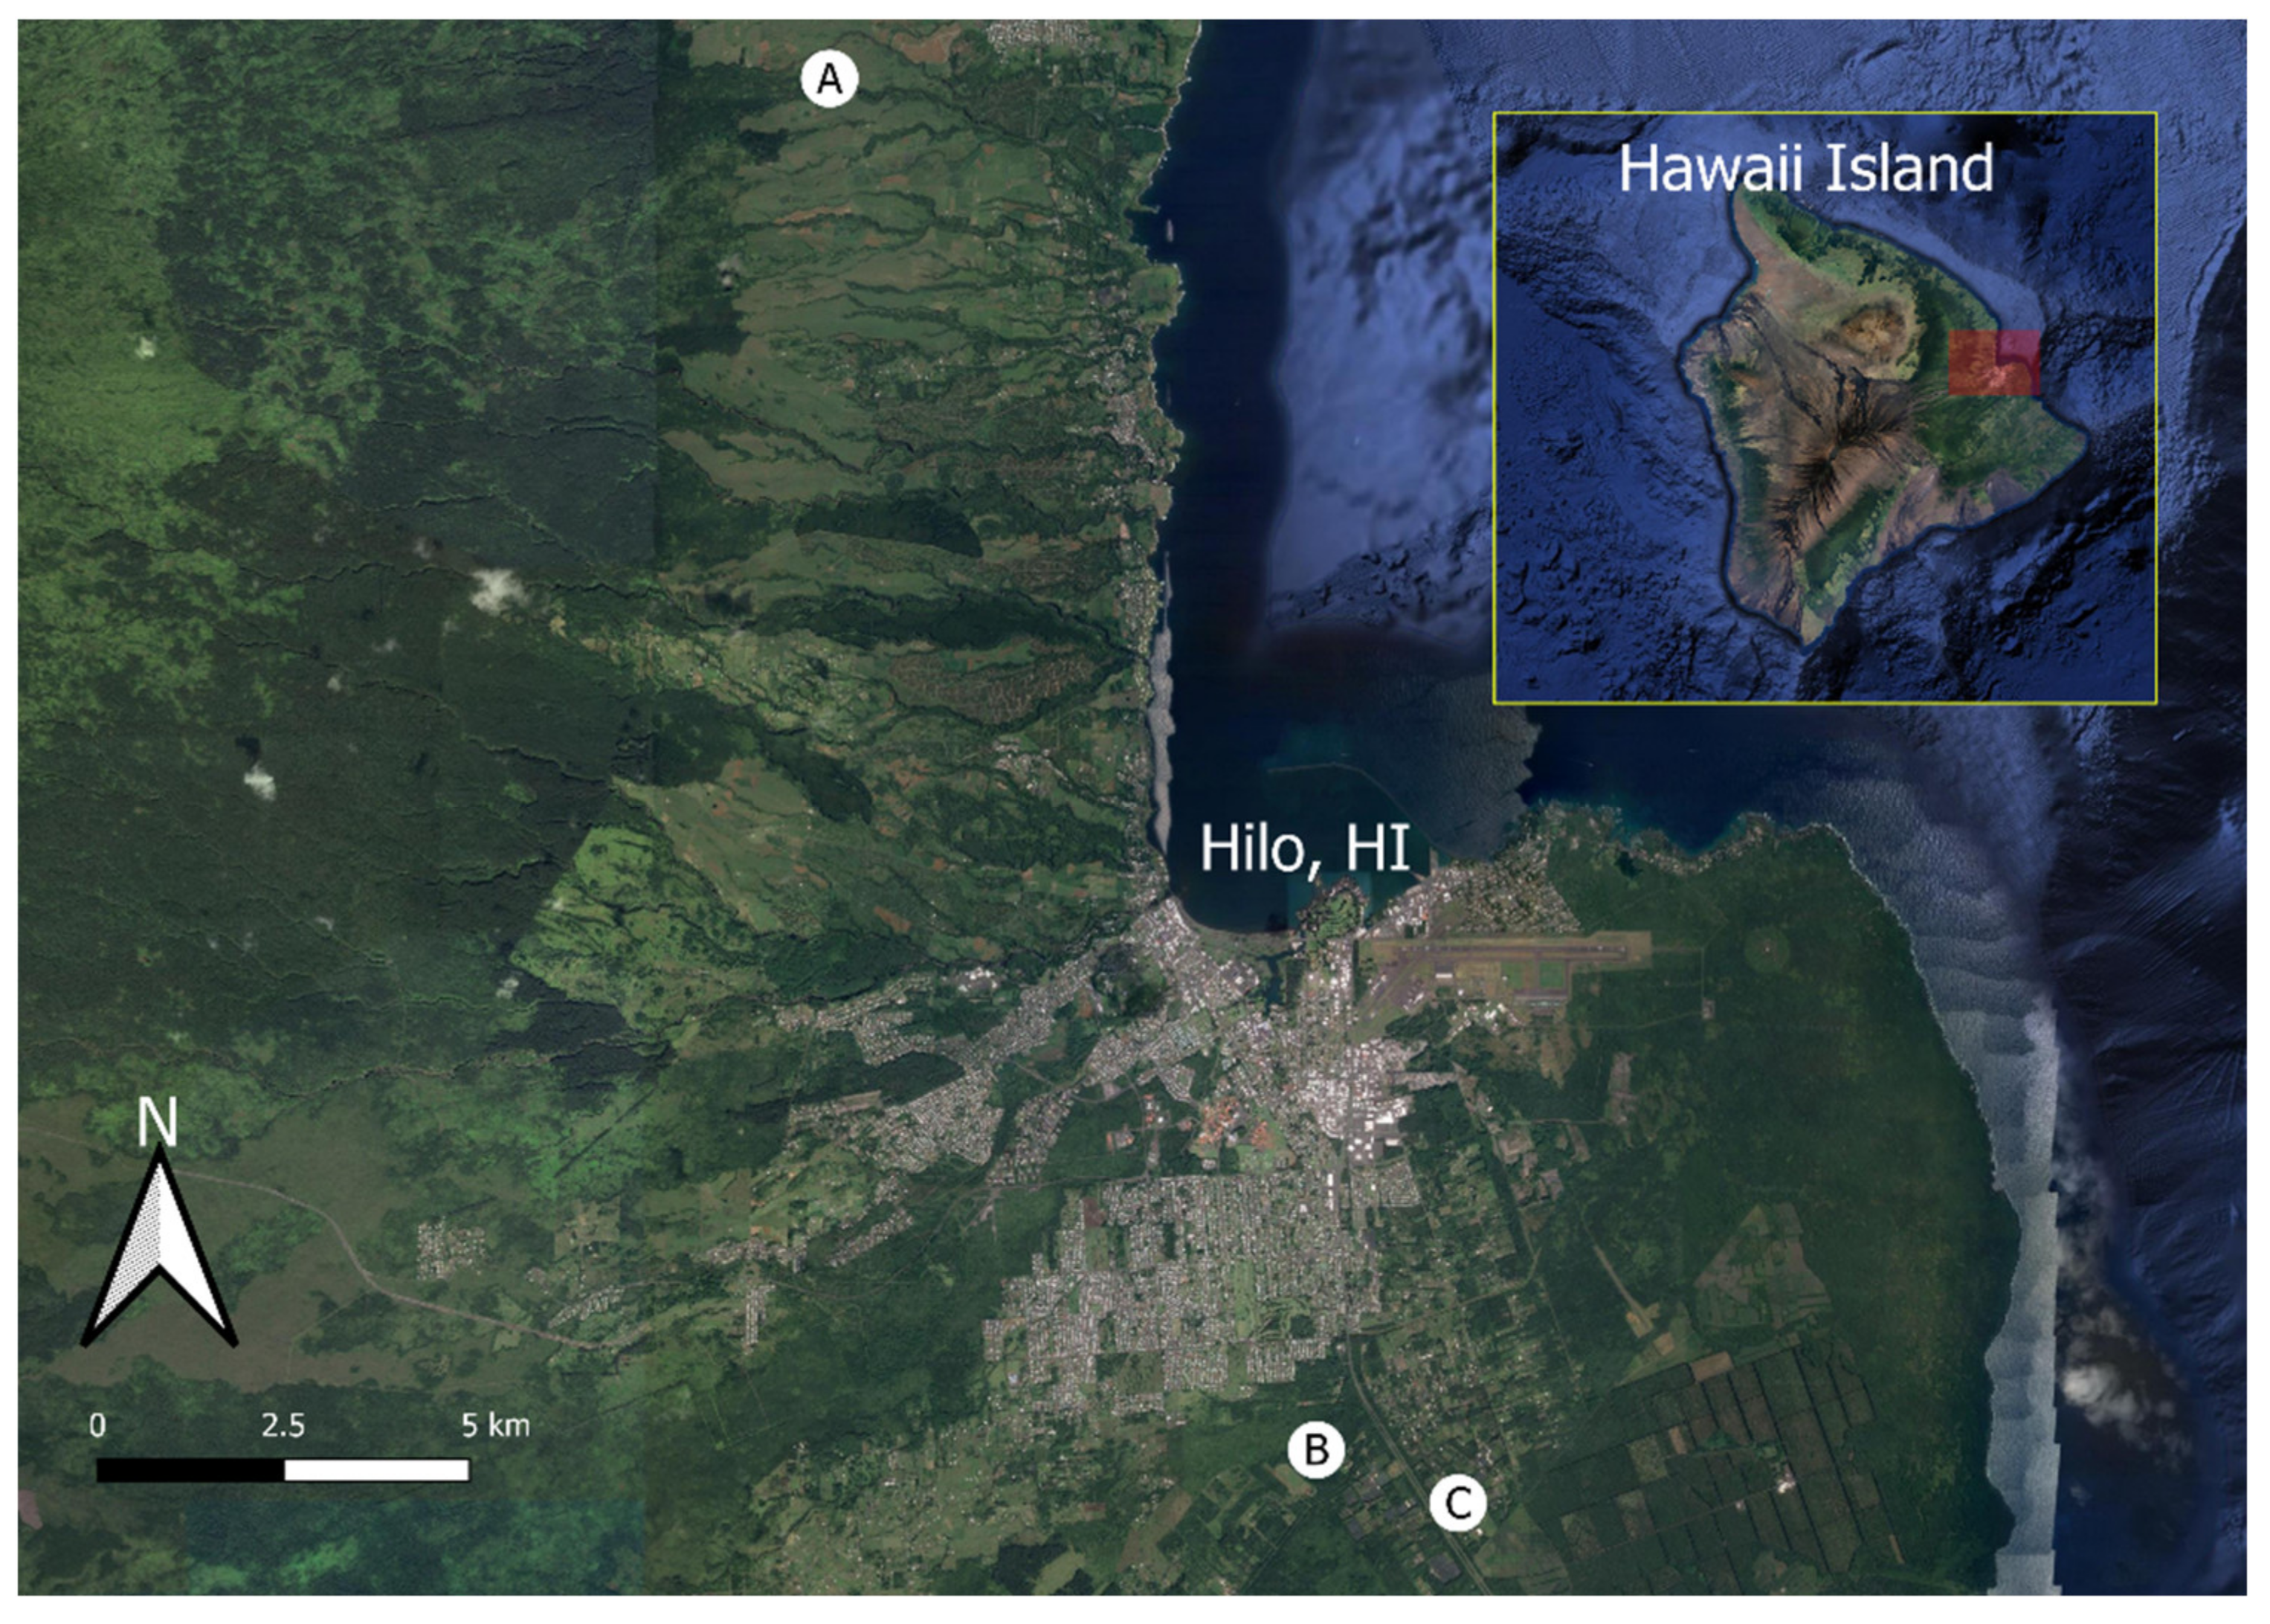
2.1. Image Collection
2.2. Human Analyst Trials
2.3. Deep Convolutional Neural Network Searches
2.4. Recall and Effect of Optical and Search Properties
Cost Model
3. Results
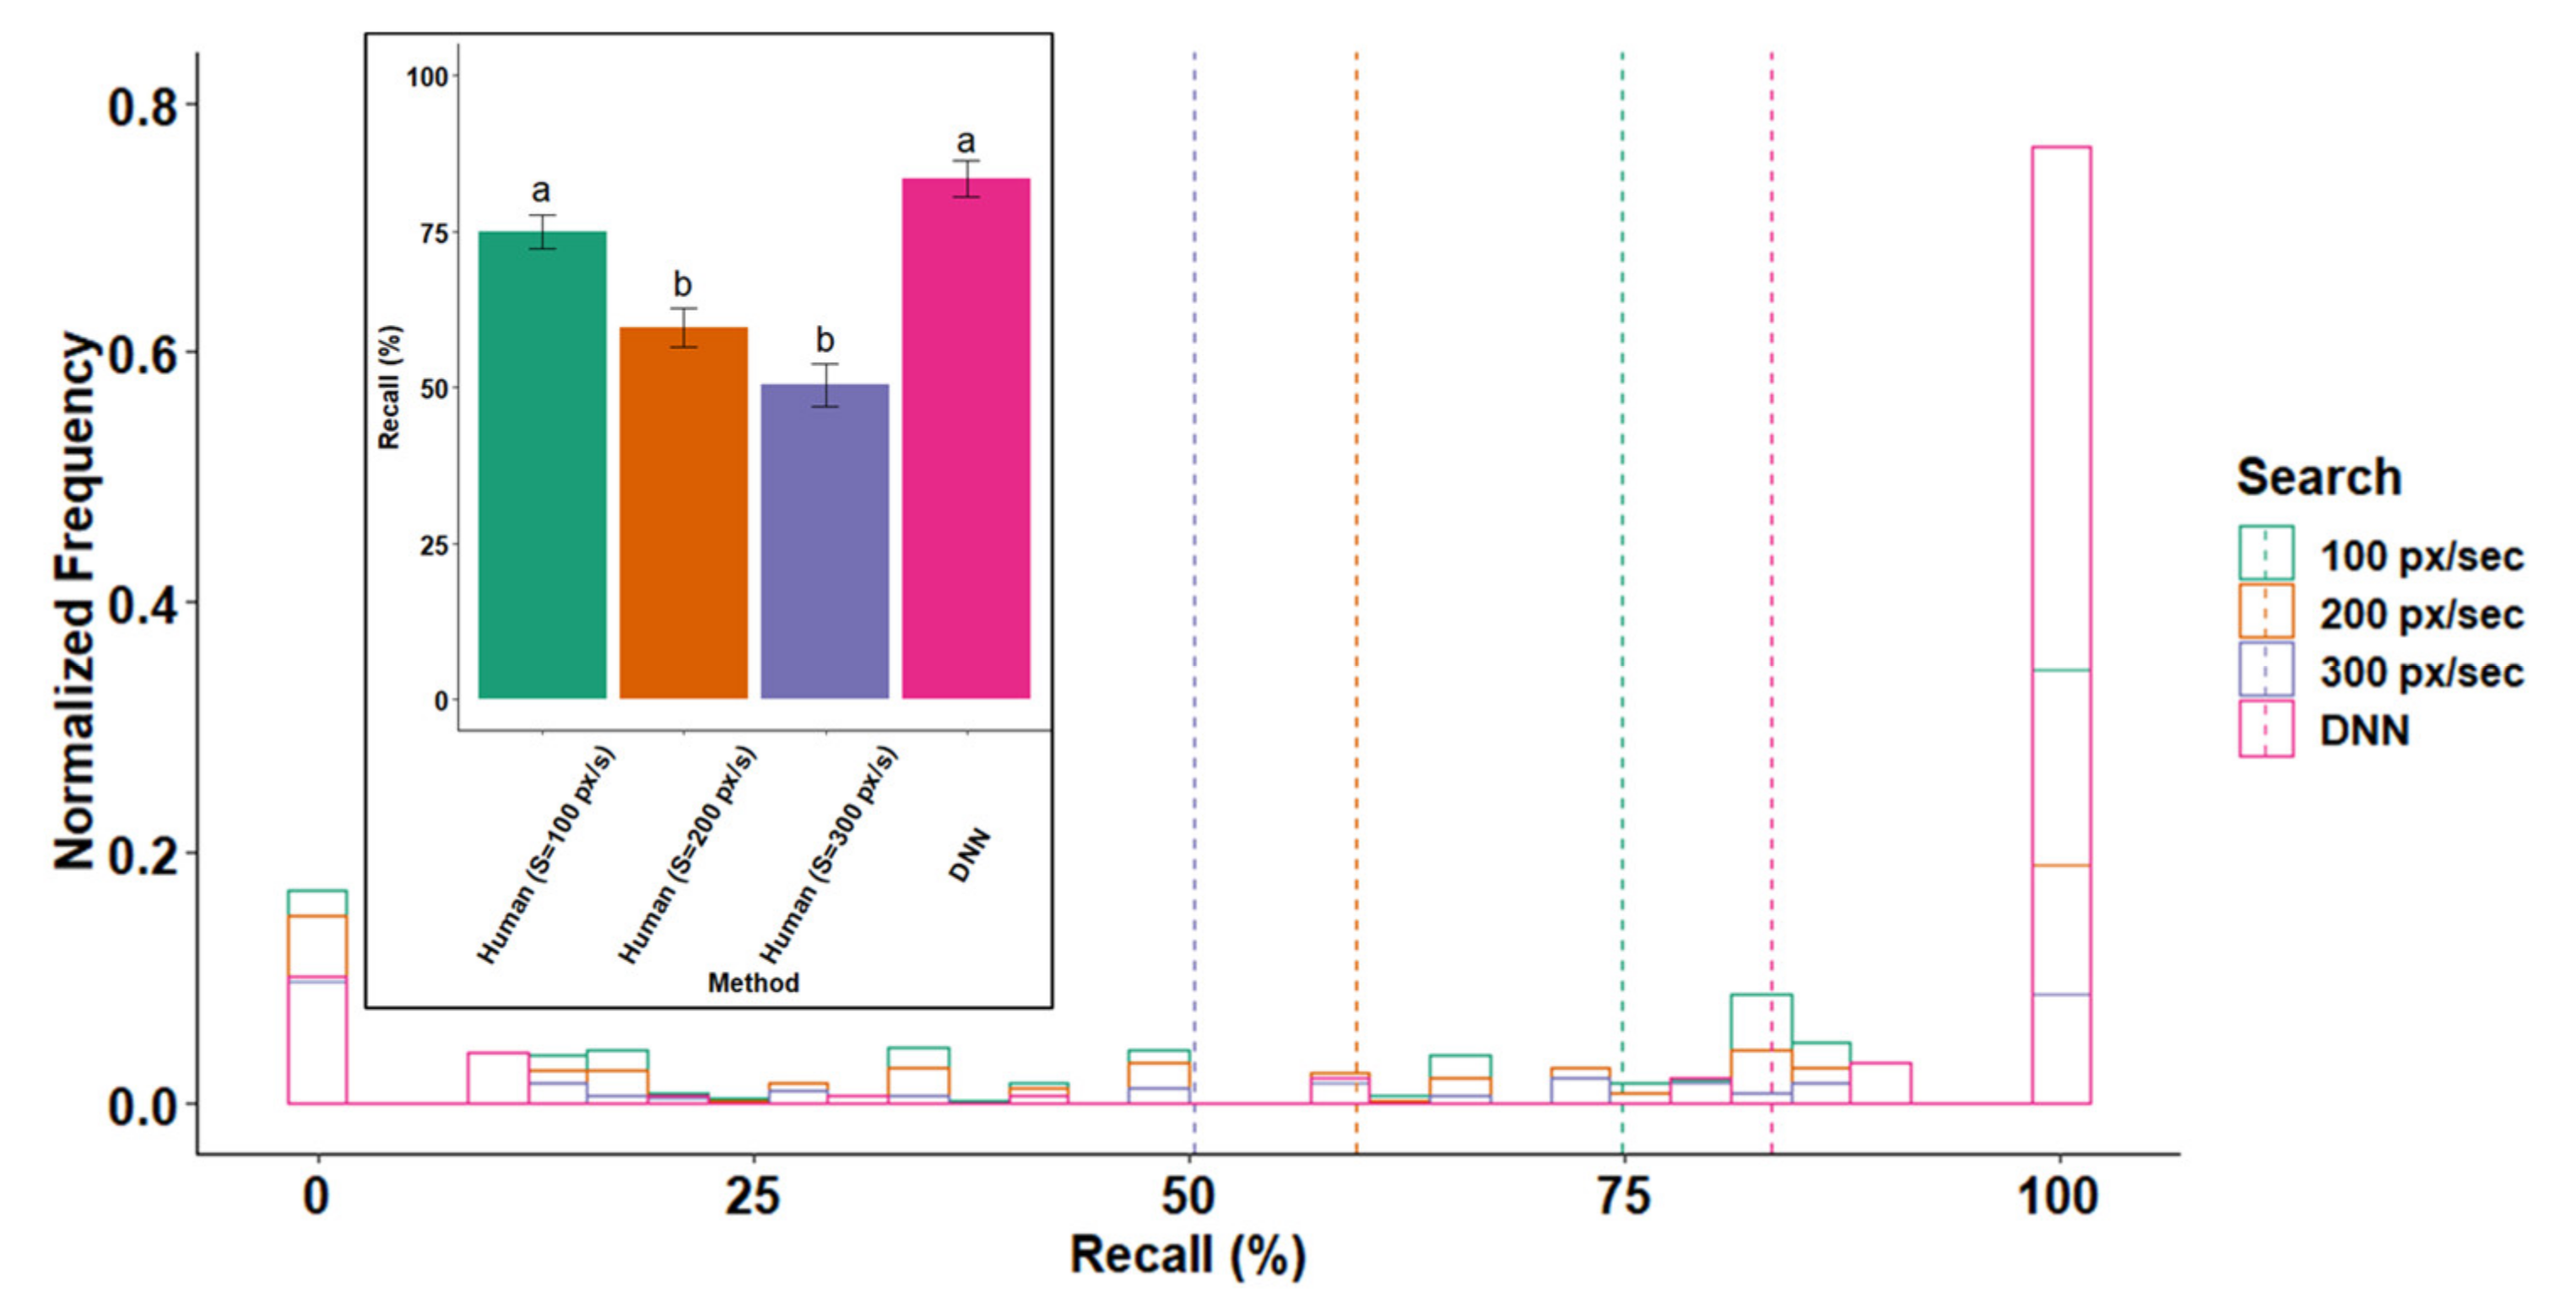
3.1. Recall
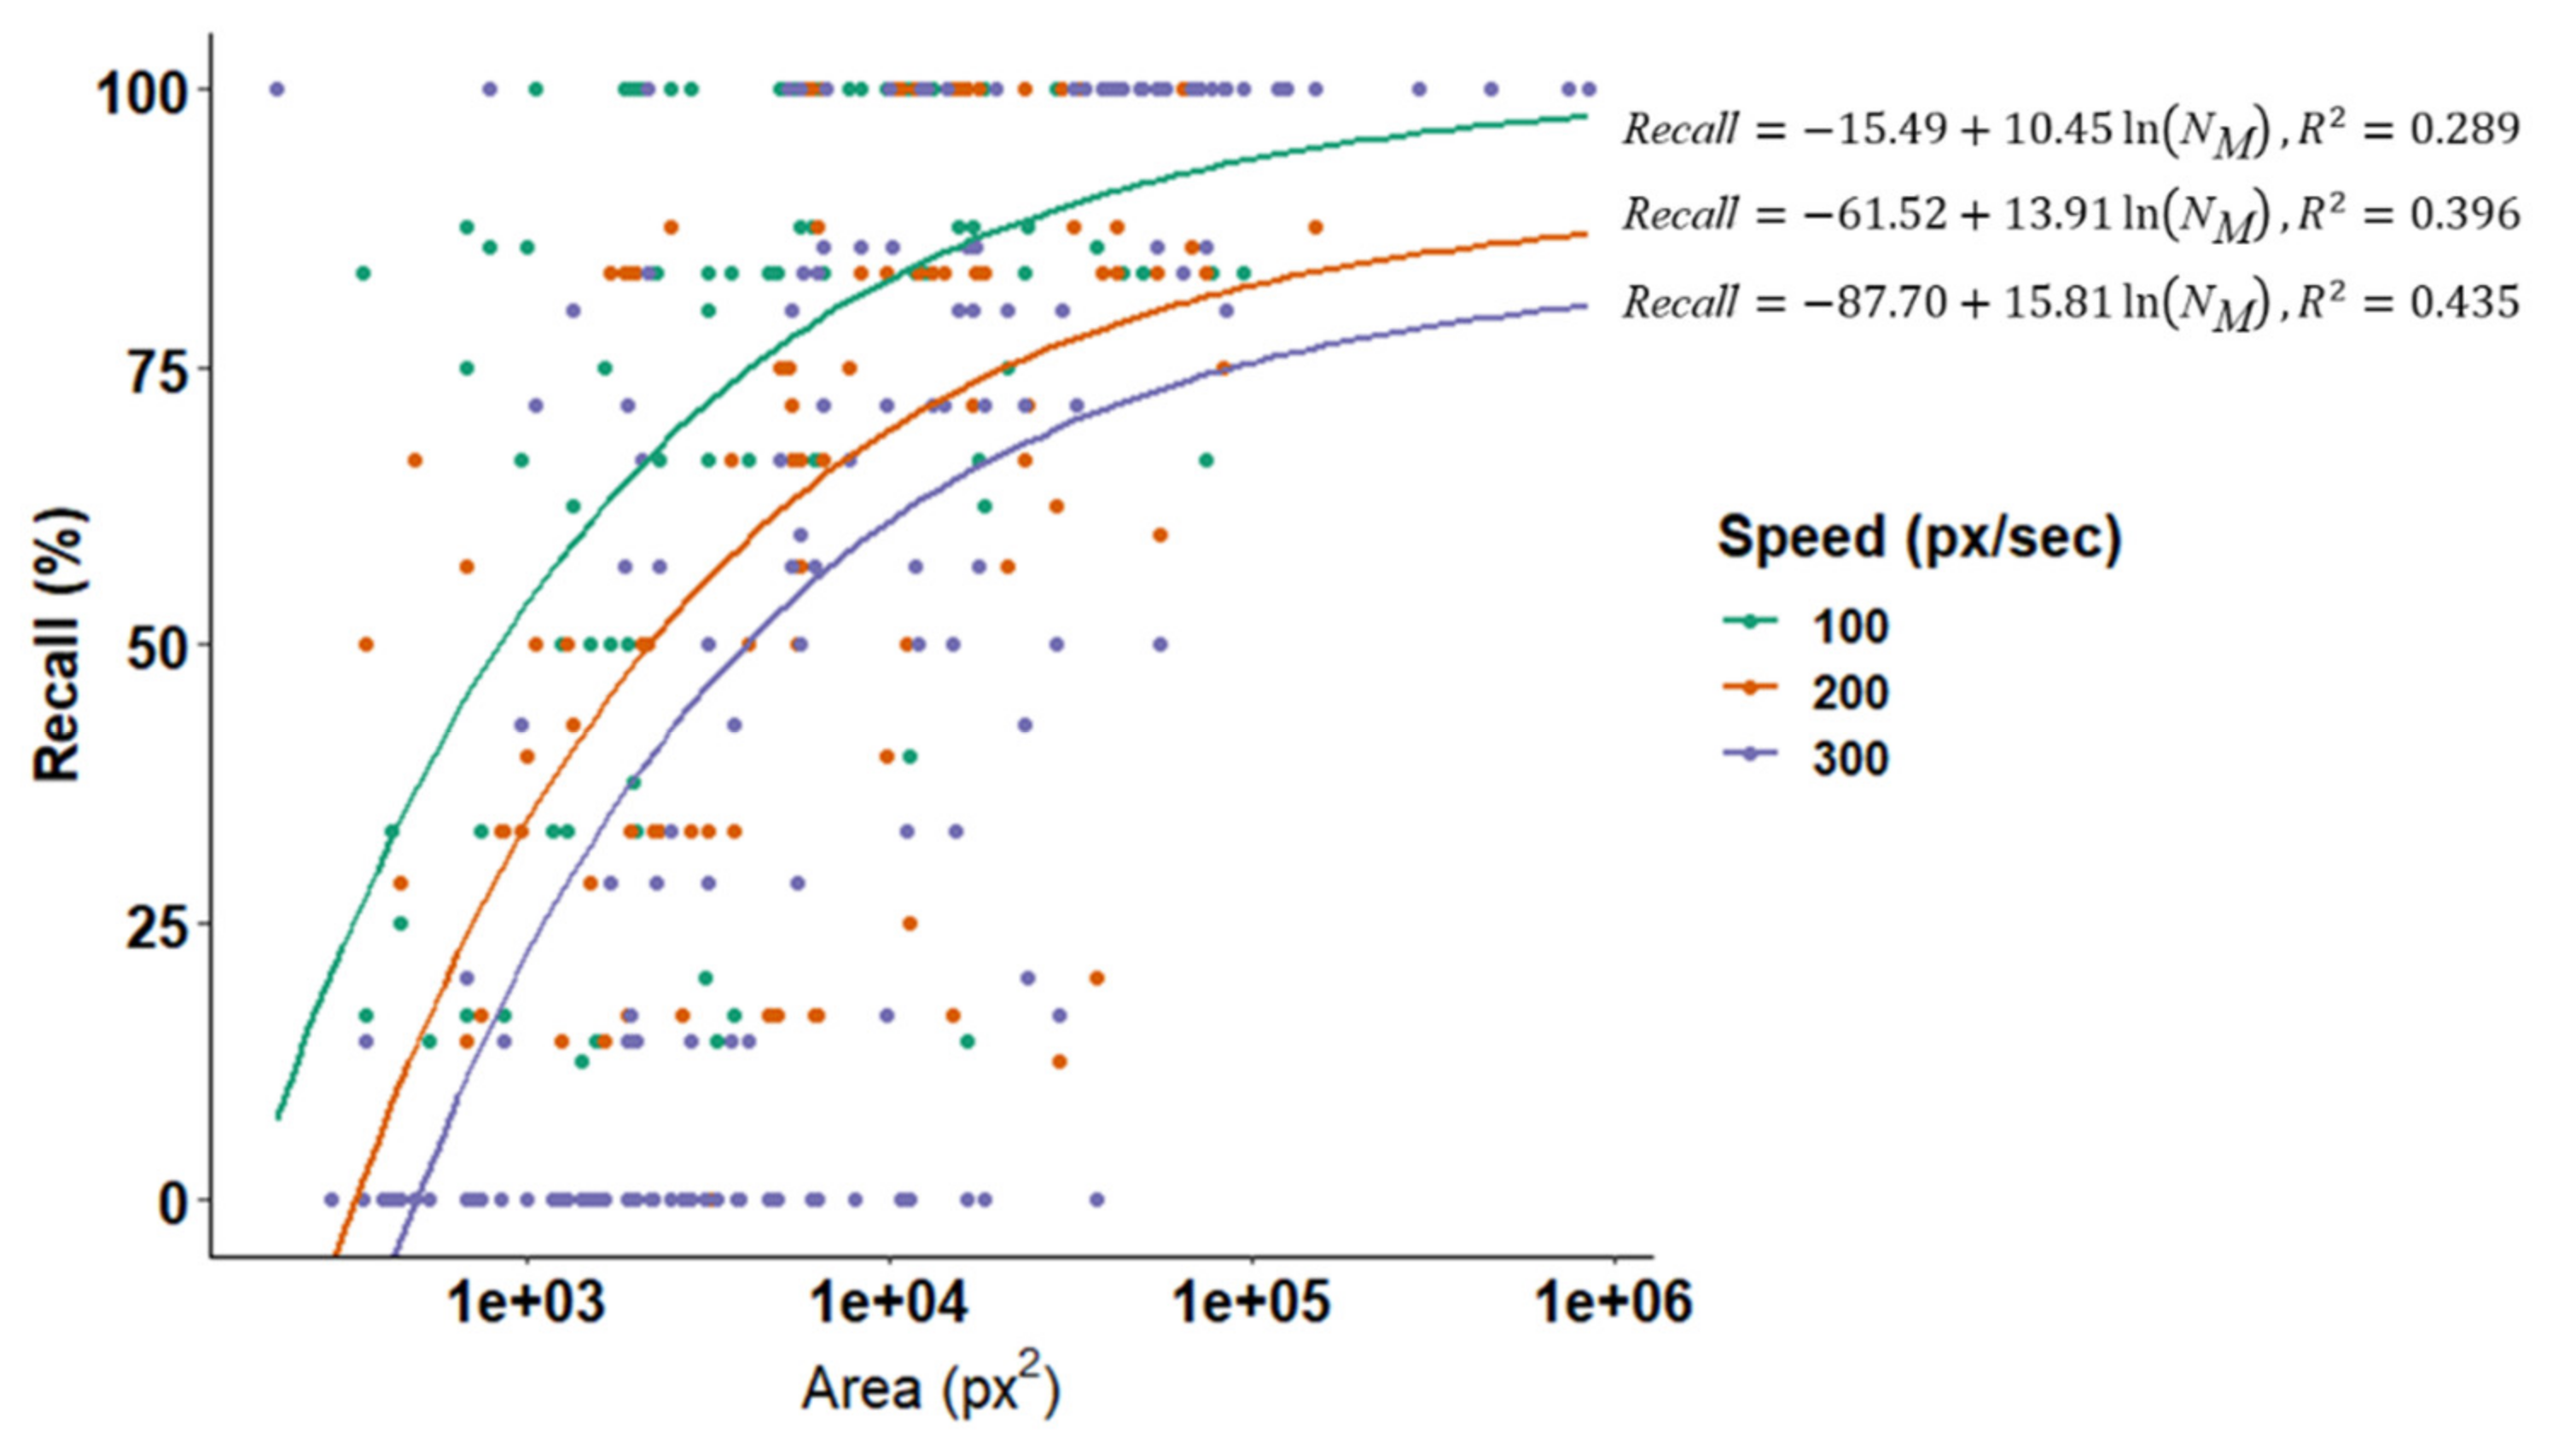
3.2. Effect of Optical and Search Properties on Recall
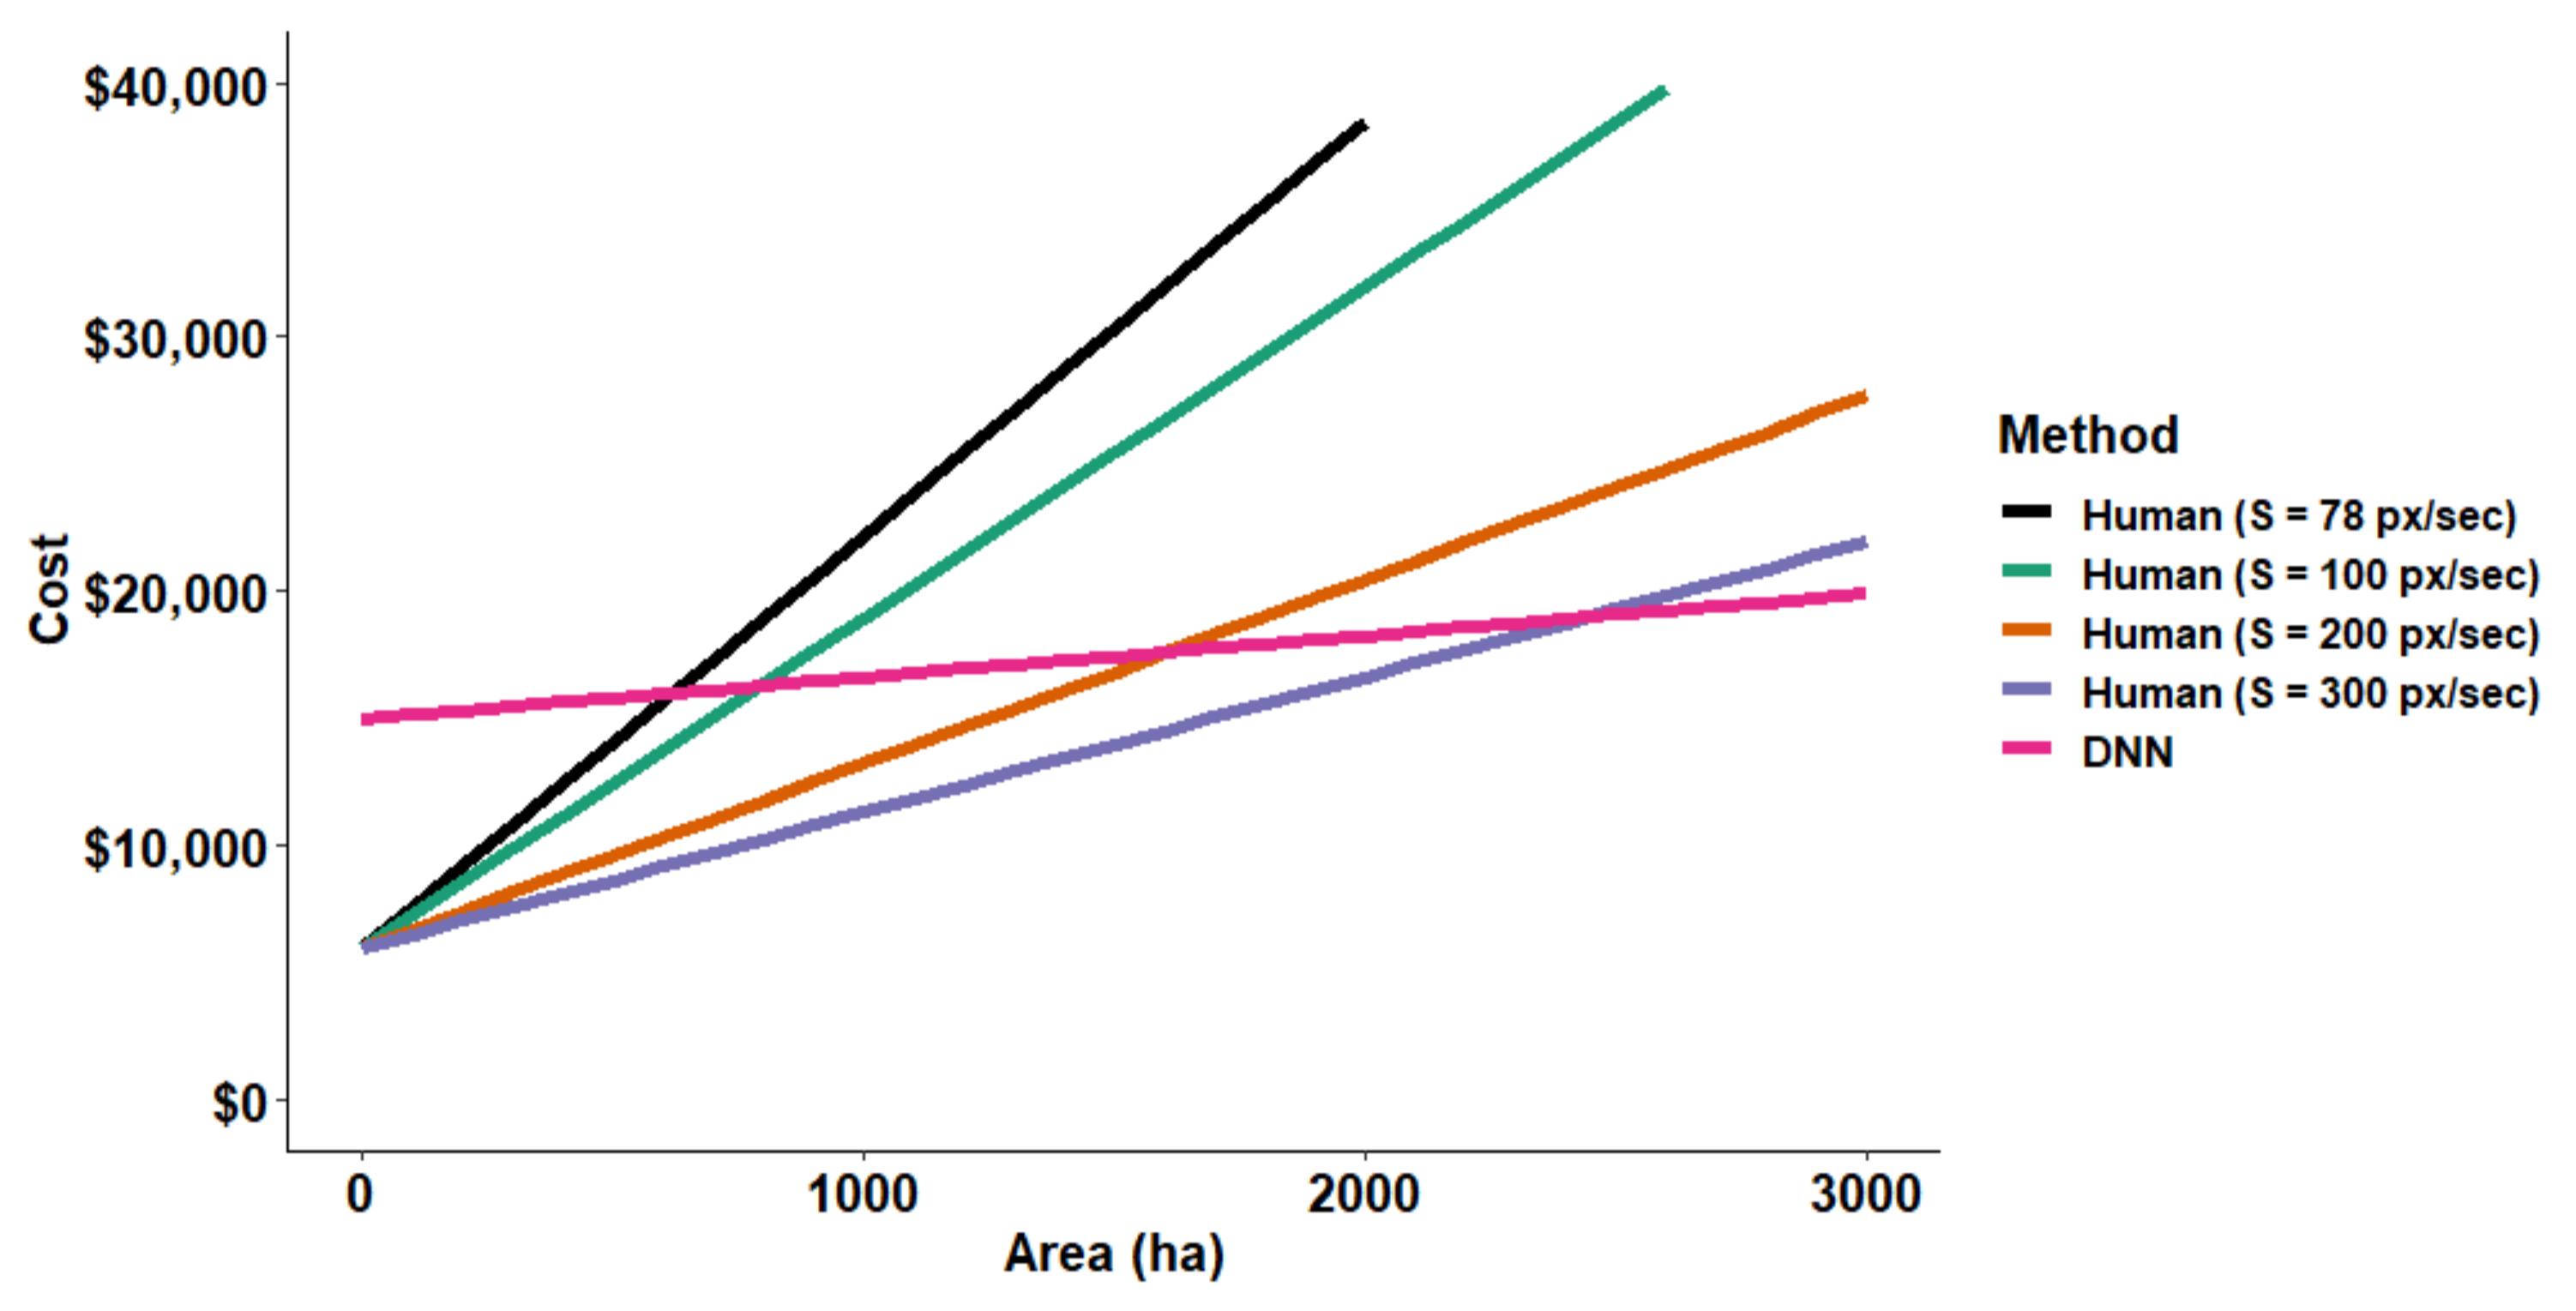
3.3. Cost Comparisons between Human and DNN Image Analyses
4. Discussion
5. Conclusions
Author Contributions
Funding
Institutional Review Board Statement
Informed Consent Statement
Data Availability Statement
Acknowledgments
Conflicts of Interest
References
- Pearson, D.E.; Ortega, Y.K.; Eren, Ö.; Hierro, J.L. Community Assembly Theory as a Framework for Biological Invasions. Trends Ecol. Evol. 2018, 33, 313–325. [Google Scholar] [CrossRef] [PubMed]
- Pejchar, L.; Mooney, H.A. Invasive Species, Ecosystem Services and Human Well-Being. Trends Ecol. Evol. 2009, 24, 497–504. [Google Scholar] [CrossRef] [PubMed]
- Vitousek, P.M.; D’Antonio, C.M.; Loope, L.L.; Remanek, M.; Westbrooks, R.G. Introduced Species: A Significant Component of Human-Caused Global Change. N. Z. J. Ecol. 1997, 21, 1–16. [Google Scholar]
- Weidlich, E.W.A.; Flórido, F.G.; Sorrini, T.B.; Brancalion, P.H.S. Controlling Invasive Plant Species in Ecological Restoration: A Global Review. J. Appl. Ecol. 2020, 57, 1806–1817. [Google Scholar] [CrossRef]
- Kirk, N.; Kannemeyer, R.; Greenaway, A.; MacDonald, E.; Stronge, D. Understanding Attitudes on New Technologies to Manage Invasive Species. Pac. Conserv. Biol. 2020, 26, 35–44. [Google Scholar] [CrossRef]
- Martinez, B.; Reaser, J.K.; Dehgan, A.; Zamft, B.; Baisch, D.; McCormick, C.; Giordano, A.J.; Aicher, R.; Selbe, S. Technology Innovation: Advancing Capacities for the Early Detection of and Rapid Response to Invasive Species. Biol. Invasions 2020, 22, 75–100. [Google Scholar] [CrossRef]
- Pejchar, L.; Lepczyk, C.A.; Fantle-Lepczyk, J.E.; Hess, S.C.; Johnson, M.T.; Leopold, C.R.; Marchetti, M.; McClure, K.M.; Shiels, A.B. Hawaii as a Microcosm: Advancing the Science and Practice of Managing Introduced and Invasive Species. BioScience 2020, 70, 184–193. [Google Scholar] [CrossRef]
- Reaser, J.K.; Burgiel, S.W.; Kirkey, J.; Brantley, K.A.; Veatch, S.D.; Burgos-Rodríguez, J. The Early Detection of and Rapid Response (EDRR) to Invasive Species: A Conceptual Framework and Federal Capacities Assessment. Biol. Invasions 2020, 22, 1–19. [Google Scholar] [CrossRef]
- Hobbs, R.J.; Humphries, S.E. An Integrated Approach to the Ecology and Management of Plant Invasions. Conserv. Biol. 1995, 9, 761–770. [Google Scholar] [CrossRef]
- Cacho, O.J.; Spring, D.; Pheloung, P.; Hester, S. Evaluating the Feasibility of Eradicating an Invasion. Biol. Invasions 2006, 8, 903–917. [Google Scholar] [CrossRef]
- Cacho, O.J.; Spring, D.; Hester, S.; Mac Nally, R. Allocating Surveillance Effort in the Management of Invasive Species: A Spatially-Explicit Model. Environ. Model. Softw. 2010, 25, 444–454. [Google Scholar] [CrossRef]
- Asner, G.P.; Jones, M.O.; Martin, R.E.; Knapp, D.E.; Hughes, R.F. Remote Sensing of Native and Invasive Species in Hawaiian Forests. Remote Sens. Environ. 2008, 112, 1912–1926. [Google Scholar] [CrossRef]
- Holcombe, T.; Stohlgren, T.J.; Jarnevich, C. Invasive Species Management and Research Using GIS. In Managing Vertebrate Invasive Species; USDA/APHIS Wildlife Services, National Wildlife Research Center: Fort Collins, CO, USA, 2007. [Google Scholar]
- Joshi, C.M.; de Leeuw, J.; van Duren, I.C. Remote Sensing and GIS Applications for Mapping and Spatial Modelling of Invasive Species. In Proceedings of the ISPRS 2004: Geo-Imagery Bridging Continents Congress, Istanbul, Turkey, 12–23 July 2004; pp. 669–677. [Google Scholar]
- Pettorelli, N.; Laurance, W.F.; O’Brien, T.G.; Wegmann, M.; Nagendra, H.; Turner, W. Satellite Remote Sensing for Applied Ecologists: Opportunities and Challenges. J. Appl. Ecol. 2014, 51, 839–848. [Google Scholar] [CrossRef]
- Duffy, D.C.; Martin, C. Cooperative Natural Resource and Invasive Species Management in Hawai’i. In Proceedings of the International Conference on Island Invasives 2017, Dundee, UK, 10–14 July 2017; IUCN: Gland, Switzerland, 2019; p. 497. [Google Scholar]
- Loope, L.; Kraus, F. Preventing establishment and spread of invasive species: Current status and needs. In Conservation of Hawaiian Forest Birds: Implications for Island Birds; Yale University Press: New Haven, CT, USA, 2009. [Google Scholar]
- Kaiser, B.A.; Burnett, K.M.; Roumasset, J.A. Control of Invasive Species: Lessons from Miconia in Hawaii; Agricultural and Applied Economics Association: Milwaukee, WI, USA, 2006. [Google Scholar]
- Chimera, C.G.; Medeiros, A.C.; Loope, L.L.; Hobdy, R.H. Status of Management and Control Efforts for the Invasive Alien Tree Miconia Calvescens DC. (Melastomataceae) in Hana, East Maui; Pacific Cooperative Studies Unit, Department of Botany, University of Hawaii at Manoa: Honolulu, HI, USA, 2000. [Google Scholar]
- Medeiros, A.C.; Loope, L.L.; Conant, P.; McElvaney, S. Status, Ecology and Management of the Invasive Plant Miconia Calvescens DC. (Melastomataceae) in the Hawaiian Islands. Bish. Mus. Occas. Pap. 1997, 48, 23–26. [Google Scholar]
- Jorgensen, N.; Leary, J.; Renz, M.; Mahnken, B. Characterizing the Suitable Habitat of Miconia Calvescens in the East Maui Watershed. Manag. Biol. Invasions 2020, 12, 313. [Google Scholar] [CrossRef]
- Leary, J.; Gooding, J.; Chapman, J.; Radford, A.; Mahnken, B.V.; Cox, L.J. Calibration of an Herbicide Ballistic Technology (HBT) Helicopter Platform Targeting Miconia Calvescens in Hawaii. Invasive Plant Sci. Manag. 2013, 6, 292–303. [Google Scholar] [CrossRef]
- Leary, J.; Mahnken, B.V.; Cox, L.J.; Radford, A.; Yanagida, J.; Penniman, T.; Duffy, D.C.; Gooding, J. Reducing Nascent Miconia (Miconia calvescens) Patches with an Accelerated Intervention Strategy Utilizing Herbicide Ballistic Technology. Invasive Plant Sci. Manag. 2014, 7, 164–175. [Google Scholar] [CrossRef]
- Perroy, R.L.; Sullivan, T.; Stephenson, N. Assessing the Impacts of Canopy Openness and Flight Parameters on Detecting a Sub-Canopy Tropical Invasive Plant Using a Small Unmanned Aerial System. ISPRS J. Photogramm. Remote Sens. 2017, 125, 174–183. [Google Scholar] [CrossRef]
- Rodriguez, R.; Jenkins, D.M.; Leary, J.J.K. Design and Validation of a GPS Logger System for Recording Aerially Deployed Herbicide Ballistic Technology Operations. IEEE Sens. J. 2015, 15, 2078–2086. [Google Scholar] [CrossRef]
- Rodriguez, R.; Leary, J.J.K.; Jenkins, D.M.; Mahnken, B.V. Herbicide Ballistic Technology: Spatial Tracking Analysis of Operations Characterizing Performance of Target Treatment. Trans. ASABE 2016, 59, 803–809. [Google Scholar] [CrossRef]
- Spotswood, E.N.; Meyer, J.-Y.; Bartolome, J.W. Preference for an Invasive Fruit Trumps Fruit Abundance in Selection by an Introduced Bird in the Society Islands, French Polynesia. Biol. Invasions 2013, 15, 2147–2156. [Google Scholar] [CrossRef]
- Moody, M.E.; Mack, R.N. Controlling the Spread of Plant Invasions: The Importance of Nascent Foci. J. Appl. Ecol. 1988, 25, 1009–1021. [Google Scholar] [CrossRef]
- Shigesada, N.; Kawasaki, K.; Takeda, Y. Modeling Stratified Diffusion in Biological Invasions. Am. Nat. 1995, 146, 229–251. [Google Scholar] [CrossRef]
- Martínez-Ghersa, M.A.; Ghersa, C.M. The Relationship of Propagule Pressure to Invasion Potential in Plants. Euphytica 2006, 148, 87–96. [Google Scholar] [CrossRef]
- Pearson, T.R.H.; Burslem, D.F.R.P.; Goeriz, R.E.; Dalling, J.W. Interactions of Gap Size and Herbivory on Establishment, Growth and Survival of Three Species of Neotropical Pioneer Trees. J. Ecol. 2003, 91, 785–796. [Google Scholar] [CrossRef]
- Leary, J.; Mahnken, B.; Wada, C.; Burnett, K. Interpreting Life-History Traits of Miconia (Miconia Calvescens) through Management over Space and Time in the East Maui Watershed, Hawaii (USA). Invasive Plant Sci. Manag. 2018, 11, 191–200. [Google Scholar] [CrossRef]
- Meyer, J.Y.; Malet, J.P. Study and Management of the Alien Invasive Tree Miconia Calvescens DC. (Melastomataceae) in the Islands of Raiatea and Tahaa (Society Islands, French Polynesia) 1992–1996; Cooperative National Park Resources Studies Unit, University of Hawaii at Manoa, Department of Botany: Honolulu, HI, USA, 1997. [Google Scholar]
- Cacho, O.J.; Hester, S.; Spring, D. Applying Search Theory to Determine the Feasibility of Eradicating an Invasive Population in Natural Environments. Aust. J. Agric. Resour. Econ. 2007, 51, 425–443. [Google Scholar] [CrossRef]
- Frost, J.R.; Stone, L.D. Review of Search Theory: Advances and Applications to Search and Rescue Decision Support; National Technical Information Service: Springfield, VA, USA, 2001. [Google Scholar]
- Koopman, B.O. The Theory of Search. II. Target Detection. Oper. Res. 1956, 4, 503–531. [Google Scholar] [CrossRef]
- Verghese, P. Visual Search and Attention: A Signal Detection Theory Approach. Neuron 2001, 31, 523–535. [Google Scholar] [CrossRef]
- Verghese, P.; McKee, S.P. Visual Search in Clutter. Vis. Res. 2004, 44, 1217–1225. [Google Scholar] [CrossRef][Green Version]
- Michelangeli, F.A.; Almeda, F.; Goldenberg, R.; Judd, W.S.; Bécquer, E.R.; Tulig, T.M. A Complete Web-Based Monograph of the Tribe Miconieae (Melastomataceae); New York Botanical Garden: Bronx, NY, USA, 2009. [Google Scholar]
- Weber, E. Invasive Plant Species of the World: A Reference Guide to Environmental Weeds; CAB International: Wallingford, UK, 2003; ISBN 978-0-85199-695-0. [Google Scholar]
- Koopman, B.O. Search and Screening: General Principles with Historical Applications; Pergamon Press: New York, NY, USA, 1980. [Google Scholar]
- Bassi, E. From Here to 2023: Civil Drones Operations and the Setting of New Legal Rules for the European Single Sky. J. Intell. Robot. Syst. 2020, 100, 493–503. [Google Scholar] [CrossRef]
- Pagallo, U.; Bassi, E. The Governance of Unmanned Aircraft Systems (UAS): Aviation Law, Human Rights, and the Free Movement of Data in the EU. Minds Mach. 2020, 30, 439–455. [Google Scholar] [CrossRef]
- Srivastava, S.; Gupta, S.; Dikshit, O.; Nair, S. A Review of UAV Regulations and Policies in India. In Proceedings of the UASG 2019, Roorkee, India, 6–7 April 2019; Jain, K., Khoshelham, K., Zhu, X., Tiwari, A., Eds.; Springer: Cham, Switzerland, 2020; pp. 315–325. [Google Scholar]
- Cummings, A.R.; McKee, A.; Kulkarni, K.; Markandey, N. The Rise of UAVs. Photogramm. Eng. Remote Sens. 2017, 83, 317–325. [Google Scholar] [CrossRef]
- Scott, B.I. The Law of Unmanned Aircraft Systems: An Introduction to the Current and Future Regulation under National, Regional and International Law; Kluwer Law International B.V.: Philadelphia, PA, USA, 2016; ISBN 978-90-411-6132-1. [Google Scholar]
- Rango, A.; Laliberte, A.S. Impact of Flight Regulations on Effective Use of Unmanned Aircraft Systems for Natural Resources Applications. J. Appl. Remote Sens. 2010, 4, 043539. [Google Scholar] [CrossRef]
- Stöcker, C.; Bennett, R.; Nex, F.; Gerke, M.; Zevenbergen, J. Review of the Current State of UAV Regulations. Remote Sens. 2017, 9, 459. [Google Scholar] [CrossRef]
- De Michele, C.; Avanzi, F.; Passoni, D.; Barzaghi, R.; Pinto, L.; Dosso, P.; Ghezzi, A.; Gianatti, R.; Della Vedova, G. Using a Fixed-Wing UAS to Map Snow Depth Distribution: An Evaluation at Peak Accumulation. Cryosphere 2016, 10, 511–522. [Google Scholar] [CrossRef]
- Jeziorska, J. UAS for Wetland Mapping and Hydrological Modeling. Remote Sens. 2019, 11, 1997. [Google Scholar] [CrossRef]
- Kuželka, K.; Surový, P. Mapping Forest Structure Using UAS inside Flight Capabilities. Sensors 2018, 18, 2245. [Google Scholar] [CrossRef] [PubMed]
- Papakonstantinou, A.; Topouzelis, K.; Doukari, M. UAS Close Range Remote Sensing for Mapping Coastal Environments. In Proceedings of the Fifth International Conference on Remote Sensing and Geoinformation of the Environment (RSCy2017), Paphos, Cyprus, 20–23 March 2017; International Society for Optics and Photonics: Bellingham, WA, USA, 2017; Volume 10444, p. 1044418. [Google Scholar]
- Baron, J.; Hill, D.J.; Elmiligi, H. Combining Image Processing and Machine Learning to Identify Invasive Plants in High-Resolution Images. Int. J. Remote Sens. 2018, 39, 5099–5118. [Google Scholar] [CrossRef]
- Jiménez López, J.; Mulero-Pázmány, M. Drones for Conservation in Protected Areas: Present and Future. Drones 2019, 3, 10. [Google Scholar] [CrossRef]
- Lehmann, J.R.K.; Prinz, T.; Ziller, S.R.; Thiele, J.; Heringer, G.; Meira-Neto, J.A.A.; Buttschardt, T.K. Open-Source Processing and Analysis of Aerial Imagery Acquired with a Low-Cost Unmanned Aerial System to Support Invasive Plant Management. Front. Environ. Sci. 2017, 5, 44. [Google Scholar] [CrossRef]
- Müllerová, J. UAS for Nature Conservation—Monitoring Invasive Species. In Applications of Small Unmanned Aircraft Systems: Best Practices and Case Studies; CRC Press: Boca Raton, FL, USA, 2019; ISBN 978-0-429-52085-3. [Google Scholar]
- Zhao, Z.-Q.; Zheng, P.; Xu, S.-T.; Wu, X. Object Detection with Deep Learning: A Review. IEEE Trans. Neural Netw. Learn. Syst. 2019, 30, 3212–3232. [Google Scholar] [CrossRef] [PubMed]
- Ajmal, H.; Rehman, S.; Farooq, U.; Ain, Q.U.; Riaz, F.; Hassan, A. Convolutional Neural Network Based Image Segmentation: A Review. In Proceedings of the Pattern Recognition and Tracking XXIX, Orlando, FL, USA, 18–19 April 2018; International Society for Optics and Photonics: Bellingham, WA, USA, 2018; Volume 10649, p. 106490N. [Google Scholar]
- Kaya, A.; Keceli, A.S.; Catal, C.; Yalic, H.Y.; Temucin, H.; Tekinerdogan, B. Analysis of Transfer Learning for Deep Neural Network Based Plant Classification Models. Comput. Electron. Agric. 2019, 158, 20–29. [Google Scholar] [CrossRef]
- Chandra, A.L.; Desai, S.V.; Guo, W.; Balasubramanian, V.N. Computer Vision with Deep Learning for Plant Phenotyping in Agriculture: A Survey. arXiv 2020, arXiv:2006.11391. [Google Scholar] [CrossRef]
- Chiu, M.T.; Xu, X.; Wei, Y.; Huang, Z.; Schwing, A.; Brunner, R.; Khachatrian, H.; Karapetyan, H.; Dozier, I.; Rose, G.; et al. Agriculture-Vision: A Large Aerial Image Database for Agricultural Pattern Analysis. arXiv 2020, arXiv:2001.01306. [Google Scholar]
- Espejo-Garcia, B.; Mylonas, N.; Athanasakos, L.; Fountas, S. Improving Weeds Identification with a Repository of Agricultural Pre-Trained Deep Neural Networks. Comput. Electron. Agric. 2020, 175, 105593. [Google Scholar] [CrossRef]
- Pearse, G.D.; Tan, A.Y.S.; Watt, M.S.; Franz, M.O.; Dash, J.P. Detecting and Mapping Tree Seedlings in UAV Imagery Using Convolutional Neural Networks and Field-Verified Data. ISPRS J. Photogramm. Remote Sens. 2020, 168, 156–169. [Google Scholar] [CrossRef]
- Fricker, G.A.; Ventura, J.D.; Wolf, J.A.; North, M.P.; Davis, F.W.; Franklin, J. A Convolutional Neural Network Classifier Identifies Tree Species in Mixed-Conifer Forest from Hyperspectral Imagery. Remote Sens. 2019, 11, 2326. [Google Scholar] [CrossRef]
- Kattenborn, T.; Eichel, J.; Fassnacht, F.E. Convolutional Neural Networks Enable Efficient, Accurate and Fine-Grained Segmentation of Plant Species and Communities from High-Resolution UAV Imagery. Sci. Rep. 2019, 9, 17656. [Google Scholar] [CrossRef] [PubMed]
- Rawat, W.; Wang, Z. Deep Convolutional Neural Networks for Image Classification: A Comprehensive Review. Neural Comput. 2017, 29, 2352–2449. [Google Scholar] [CrossRef] [PubMed]
- Kattenborn, T.; Leitloff, J.; Schiefer, F.; Hinz, S. Review on Convolutional Neural Networks (CNN) in Vegetation Remote Sensing. ISPRS J. Photogramm. Remote Sens. 2021, 173, 24–49. [Google Scholar] [CrossRef]
- Sultana, F.; Sufian, A.; Dutta, P. A Review of Object Detection Models Based on Convolutional Neural Network. In Intelligent Computing: Image Processing Based Applications; Mandal, J.K., Banerjee, S., Eds.; Advances in Intelligent Systems and Computing; Springer: Singapore, 2020; pp. 1–16. ISBN 9789811542886. [Google Scholar]
- Liu, Y.; Sun, P.; Wergeles, N.; Shang, Y. A Survey and Performance Evaluation of Deep Learning Methods for Small Object Detection. Expert Syst. Appl. 2021, 172, 114602. [Google Scholar] [CrossRef]
- Girshick, R. Fast R-CNN. In Proceedings of the 2015 IEEE International Conference on Computer Vision (ICCV), Santiago, Chile, 11–18 December 2015; pp. 1440–1448. [Google Scholar]
- Ren, S.; He, K.; Girshick, R.; Sun, J. Faster R-CNN: Towards Real-Time Object Detection with Region Proposal Networks. IEEE Trans. Pattern Anal. Mach. Intell. 2017, 39, 1137–1149. [Google Scholar] [CrossRef] [PubMed]
- He, K.; Gkioxari, G.; Dollár, P.; Girshick, R. Mask R-CNN. IEEE Trans. Pattern Anal. Mach. Intell. 2018, 42, 386–397. [Google Scholar] [CrossRef]
- Lin, T.-Y.; Dollár, P.; Girshick, R.; He, K.; Hariharan, B.; Belongie, S. Feature Pyramid Networks for Object Detection. In Proceedings of the 2017 IEEE Conference on Computer Vision and Pattern Recognition (CVPR), Honolulu, HI, USA, 21–26 July 2017; pp. 936–944. [Google Scholar]
- Redmon, J.; Divvala, S.; Girshick, R.; Farhadi, A. You Only Look Once: Unified, Real-Time Object Detection. In Proceedings of the 2016 IEEE Conference on Computer Vision and Pattern Recognition (CVPR), Las Vegas, NV, USA, 26 June–1 July 2016; pp. 779–788. [Google Scholar]
- Liu, W.; Anguelov, D.; Erhan, D.; Szegedy, C.; Reed, S.; Fu, C.-Y.; Berg, A.C. SSD: Single Shot MultiBox Detector. In Proceedings of the Computer Vision—ECCV 2016, Amsterdam, The Netherlands, 11–14 October 2016; Leibe, B., Matas, J., Sebe, N., Welling, M., Eds.; Springer: Cham, Switzerland, 2016; pp. 21–37. [Google Scholar]
- Lin, T.-Y.; Goyal, P.; Girshick, R.; He, K.; Dollar, P. Focal Loss for Dense Object Detection. In Proceedings of the 2017 IEEE International Conference on Computer Vision, Venice, Italy, 22–29 October 2017; pp. 2980–2988. [Google Scholar]
- Lin, T.-Y.; Goyal, P.; Girshick, R.; He, K.; Dollar, P. Focal Loss for Dense Object Detection. IEEE Trans. Pattern Anal. Mach. Intell. 2020, 42, 318–327. [Google Scholar] [CrossRef] [PubMed]
- Culman, M.; Delalieux, S.; Tricht, K.V. Palm Tree Inventory From Aerial Images Using Retinanet. In Proceedings of the 2020 Mediterranean and Middle-East Geoscience and Remote Sensing Symposium (M2GARSS), Tunis, Tunisia, 9–11 March 2020; pp. 314–317. [Google Scholar]
- dos Santos, A.A.; Marcato Junior, J.; Araújo, M.S.; Di Martini, D.R.; Tetila, E.C.; Siqueira, H.L.; Aoki, C.; Eltner, A.; Matsubara, E.T.; Pistori, H.; et al. Assessment of CNN-Based Methods for Individual Tree Detection on Images Captured by RGB Cameras Attached to UAVs. Sensors 2019, 19, 3595. [Google Scholar] [CrossRef]
- Lister, A.; Lister, T.; Weber, T. Semi-Automated Sample-Based Forest Degradation Monitoring with Photointerpretation of High-Resolution Imagery. Forests 2019, 10, 896. [Google Scholar] [CrossRef]
- Schepaschenko, D.; See, L.; Lesiv, M.; Bastin, J.-F.; Mollicone, D.; Tsendbazar, N.-E.; Bastin, L.; McCallum, I.; Laso Bayas, J.C.; Baklanov, A.; et al. Recent Advances in Forest Observation with Visual Interpretation of Very High-Resolution Imagery. Surv. Geophys. 2019, 40, 839–862. [Google Scholar] [CrossRef]
- Tompalski, P.; White, J.C.; Coops, N.C.; Wulder, M.A.; Leboeuf, A.; Sinclair, I.; Butson, C.R.; Lemonde, M.-O. Quantifying the Precision of Forest Stand Height and Canopy Cover Estimates Derived from Air Photo Interpretation. For. Int. J. For. Res. 2021. [Google Scholar] [CrossRef]
- White, A.R. Human Expertise in the Interpretation of Remote Sensing Data: A Cognitive Task Analysis of Forest Disturbance Attribution. Int. J. Appl. Earth Obs. Geoinf. 2019, 74, 37–44. [Google Scholar] [CrossRef]
- García Rodríguez, C.; Vitrià, J.; Mora, O. Uncertainty-Based Human-in-the-Loop Deep Learning for Land Cover Segmentation. Remote Sens. 2020, 12, 3836. [Google Scholar] [CrossRef]
- Colwell, R.N. Manual of Photographic Interpretation; American Society of Photogrammetry: Washington, DC, USA, 1960; Volume 10. [Google Scholar]
- Colwell, R.N. Four Decades of Progress in Photographic Interpretation since the Founding of Commission VII (IP). Int. Arch. Photogramm. Remote Sens. 1993, 29, 683. [Google Scholar]
- Bailey, I.L.; Lovie, J.E. New Design Principles for Visual Acuity Letter Charts. Optom. Vis. Sci. 1976, 53, 740–745. [Google Scholar] [CrossRef]
- Ishihara, S. Tests for Color Blindness. Am. J. Ophthalmol. 1918, 1, 376. [Google Scholar] [CrossRef]
- International Council of Opthamology. Visual Acuity Measurement Standard. Ital. J. Ophthamol. 1988, II, 15. [Google Scholar]
- Qian, W.; Huang, Y.; Liu, Q.; Fan, W.; Sun, Z.; Dong, H.; Wan, F.; Qiao, X. UAV and a Deep Convolutional Neural Network for Monitoring Invasive Alien Plants in the Wild. Comput. Electron. Agric. 2020, 174, 105519. [Google Scholar] [CrossRef]
- He, K.; Zhang, X.; Ren, S.; Sun, J. Deep Residual Learning for Image Recognition. In Proceedings of the 2016 IEEE Conference on Computer Vision and Pattern Recognition (CVPR), Las Vegas, NV, USA, 27–30 June 2016; pp. 770–778. [Google Scholar] [CrossRef]
- Deng, J.; Dong, W.; Socher, R.; Li, L.; Li, K.; Li, F.-F. ImageNet: A Large-Scale Hierarchical Image Database. In Proceedings of the 2009 IEEE Conference on Computer Vision and Pattern Recognition, Miami, FL, USA, 20–25 June 2009; pp. 248–255. [Google Scholar]
- Olson, D.L.; Delen, D. Advanced Data Mining Techniques; Springer: New York City, NY, USA, 2008; ISBN 978-3-540-76917-0. [Google Scholar]
- Davis, J.; Goadrich, M. The Relationship between Precision-Recall and ROC Curves. In Proceedings of the 23rd International Conference on Machine Learning, Pittsburgh, PA, USA, 25–29 June 2006; Association for Computing Machinery: New York, NY, USA, 2006; pp. 233–240. [Google Scholar]
- Chen, C.L.P.; Li, H.; Wei, Y.; Xia, T.; Tang, Y.Y. A Local Contrast Method for Small Infrared Target Detection. IEEE Trans. Geosci. Remote Sens. 2014, 52, 574–581. [Google Scholar] [CrossRef]
- Kim, S.; Lee, J. Scale Invariant Small Target Detection by Optimizing Signal-to-Clutter Ratio in Heterogeneous Background for Infrared Search and Track. Pattern Recognit. 2012, 45, 393–406. [Google Scholar] [CrossRef]
- R Core Team. R: A Language and Environment for Statistical Computing; R Foundation for Statistical Computing: Vienna, Austria, 2019. [Google Scholar]
- Cohen, J. Eta-Squared and Partial Eta-Squared in Fixed Factor Anova Designs. Educ. Psychol. Meas. 1973, 33, 107–112. [Google Scholar] [CrossRef]
- Guirado, E.; Alcaraz-Segura, D.; Cabello, J.; Puertas-Ruíz, S.; Herrera, F.; Tabik, S. Tree Cover Estimation in Global Drylands from Space Using Deep Learning. Remote Sens. 2020, 12, 343. [Google Scholar] [CrossRef]
- Tidhar, G.; Reiter, G.; Avital, Z.; Hadar, Y.; Rotman, S.R.; George, V.; Kowalczyk, M.L. Modeling Human Search and Target Acquisition Performance: IV. Detection Probability in the Cluttered Environment. OE 1994, 33, 801–808. [Google Scholar] [CrossRef]
- Dodge, S.; Karam, L. A Study and Comparison of Human and Deep Learning Recognition Performance under Visual Distortions. In Proceedings of the 2017 26th International Conference on Computer Communication and Networks (ICCCN), Vancouver, BC, Canada, 31 July–3 August 2017; pp. 1–7. [Google Scholar]
- Geirhos, R.; Janssen, D.H.J.; Schütt, H.H.; Rauber, J.; Bethge, M.; Wichmann, F.A. Comparing Deep Neural Networks against Humans: Object Recognition When the Signal Gets Weaker. arXiv 2018, arXiv:1706.06969. [Google Scholar]
- Tan, M.; Pang, R.; Le, Q.V. EfficientDet: Scalable and Efficient Object Detection. In Proceedings of the 2020 IEEE/CVF Conference on Computer Vision and Pattern Recognition (CVPR), Seattle, WA, USA, 14–19 June 2020; pp. 10778–10787. [Google Scholar]
- Ammar, A.; Koubaa, A.; Benjdira, B. Deep-Learning-Based Automated Palm Tree Counting and Geolocation in Large Farms from Aerial Geotagged Images. Agronomy 2021, 11, 1458. [Google Scholar] [CrossRef]
- Jocher, G.; Stoken, A.; Borovec, J.; Chaurasia, A.; Changyu, L.; Laughing, V.A.; Hogan, A.; Hajek, J.; Diaconu, L.; Kwon, Y.; et al. Ultralytics/Yolov5: V5.0—YOLOv5-P6 1280 Models, AWS, Supervise.Ly and YouTube Integrations; Zenodo: Geneve, Switzerland, 2021. [Google Scholar]
- Iqbal, M.S.; Ali, H.; Tran, S.N.; Iqbal, T. Coconut Trees Detection and Segmentation in Aerial Imagery Using Mask Region-Based Convolution Neural Network. IET Comput. Vis. 2021, 15, 428–439. [Google Scholar] [CrossRef]
- Hao, Z.; Lin, L.; Post, C.J.; Mikhailova, E.A.; Li, M.; Chen, Y.; Yu, K.; Liu, J. Automated Tree-Crown and Height Detection in a Young Forest Plantation Using Mask Region-Based Convolutional Neural Network (Mask R-CNN). ISPRS J. Photogramm. Remote Sens. 2021, 178, 112–123. [Google Scholar] [CrossRef]
- Cook, A.; Marion, G.; Butler, A.; Gibson, G. Bayesian Inference for the Spatio-Temporal Invasion of Alien Species. Bull. Math. Biol. 2007, 69, 2005–2025. [Google Scholar] [CrossRef] [PubMed]


| Locations | |||
|---|---|---|---|
| A | B | C | |
| Coordinates (DMS) | 19°49′27.9″N 155°7′58.2″W | 19°39′32.7″N 155°4′13.5″W | 19°39′9.6″N 155°3′8.3″W |
| Date (YYYY/MM/DD) | 2018/04/17 | 2017/12/27 | 2018/03/23 |
| Time (HH:MM HST) | 2:55 p.m. | 10:34 a.m. | 10:54 a.m. |
| Sky condition | Overcast | Sunny | Overcast |
| Mapped Area (ha) | 3.16 | 1.17 | 1.48 |
| Overlap (Front/Side) | 80/80 | 85/85 | 60/60 |
| Item | Value |
|---|---|
| Optimization Method | Adam |
| Initial Learning Rate | 0.0001 |
| Learning Rate Schedule | Validation loss does not decline for 3 epochs, the learning rate was cut in half |
| Batch Size | 3 |
| Training Epochs | 600 epochs at 500 steps per epoch |
| Variable | Value | Variable | Value |
|---|---|---|---|
| CF (UAS) | $6000 | IH | 5280 px |
| CF (DNN) | $18,000 | IW | 3956 px |
| CL | $25/h | OS | 80% |
| FOVH | 500 px | t | 5 s |
| GSD | 1.1 cm/px | v | 5 m/s |
| Predictor | Sum of Squares | Degrees of Freedom | Mean Square | F | p | η2 |
|---|---|---|---|---|---|---|
| NM | 48,220 | 1 | 48,220 | 45.0847 | <0.001 * | 0.072 |
| S | 45,692 | 2 | 22,846 | 21.3605 | <0.001 * | 0.068 |
| CP,R | 8450 | 1 | 8450 | 7.9005 | 0.005 | 0.013 |
| CP,G | 12,877 | 1 | 12,877 | 12.0395 | <0.001 | 0.019 |
| CP,B | 16 | 1 | 16 | 0.0145 | 0.904 | 0.000 |
| SCRR | 34,414 | 1 | 34,414 | 32.1767 | <0.001 | 0.051 |
| SCRG | 29,784 | 1 | 29,784 | 27.8471 | <0.001 | 0.044 |
| SCRB | 24,689 | 1 | 24,689 | 23.0839 | <0.001 | 0.037 |
| D | 444 | 1 | 444 | 0.4152 | 0.520 | 0.001 |
| Predictor | Sum of Squares | Degrees of Freedom | Mean Square | F | p | η2 |
|---|---|---|---|---|---|---|
| NM | 2153 | 1 | 2153 | 2.0577 | 0.153 | 0.012 |
| CP,R | 10,267 | 1 | 10,267 | 9.8105 | 0.002 * | 0.057 |
| CP,G | 76 | 1 | 76 | 0.0728 | 0.788 | 0.000 |
| CP,B | 2531 | 1 | 2531 | 2.4186 | 0.122 | 0.014 |
| SCRR | 4716 | 1 | 4716 | 4.5065 | 0.036 * | 0.026 |
| SCRG | 9146 | 1 | 9146 | 8.7396 | 0.004 * | 0.051 |
| SCRB | 1083 | 1 | 1083 | 1.0350 | 0.311 | 0.006 |
| D | 2241 | 1 | 2241 | 2.1414 | 0.146 | 0.013 |
Publisher’s Note: MDPI stays neutral with regard to jurisdictional claims in published maps and institutional affiliations. |
© 2021 by the authors. Licensee MDPI, Basel, Switzerland. This article is an open access article distributed under the terms and conditions of the Creative Commons Attribution (CC BY) license (https://creativecommons.org/licenses/by/4.0/).
Share and Cite
Rodriguez, R., III; Perroy, R.L.; Leary, J.; Jenkins, D.; Panoff, M.; Mandel, T.; Perez, P. Comparing Interpretation of High-Resolution Aerial Imagery by Humans and Artificial Intelligence to Detect an Invasive Tree Species. Remote Sens. 2021, 13, 3503. https://doi.org/10.3390/rs13173503
Rodriguez R III, Perroy RL, Leary J, Jenkins D, Panoff M, Mandel T, Perez P. Comparing Interpretation of High-Resolution Aerial Imagery by Humans and Artificial Intelligence to Detect an Invasive Tree Species. Remote Sensing. 2021; 13(17):3503. https://doi.org/10.3390/rs13173503
Chicago/Turabian StyleRodriguez, Roberto, III, Ryan L. Perroy, James Leary, Daniel Jenkins, Max Panoff, Travis Mandel, and Patricia Perez. 2021. "Comparing Interpretation of High-Resolution Aerial Imagery by Humans and Artificial Intelligence to Detect an Invasive Tree Species" Remote Sensing 13, no. 17: 3503. https://doi.org/10.3390/rs13173503
APA StyleRodriguez, R., III, Perroy, R. L., Leary, J., Jenkins, D., Panoff, M., Mandel, T., & Perez, P. (2021). Comparing Interpretation of High-Resolution Aerial Imagery by Humans and Artificial Intelligence to Detect an Invasive Tree Species. Remote Sensing, 13(17), 3503. https://doi.org/10.3390/rs13173503