Article

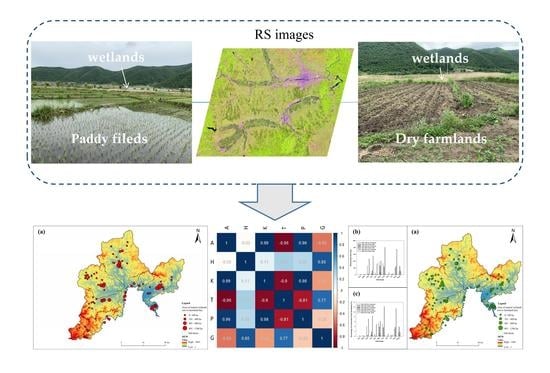
Conversion of Natural Wetland to Farmland in the Tumen River Basin: Human and Environmental Factors

1
College of Geography and Ocean Sciences, Yanbian University, Hunchun 133300, China
2
Jilin Provincial Joint Key Laboratory of Changbai Mountain Wetland & Ecology, Changchun 130102, China
3
Jilin Province Key Laboratory of Changbai Mountain Wetland Ecosystem Function and Ecological Security, Hunchun 133300, China
4
Tumen River Basin Wetland and Ecology International Joint Research Center of Jilin Province, Hunchun 133300, China
5
Wetland Research Center of Yanbian University, Yanbian University, Hunchun 133300, China
*
Author to whom correspondence should be addressed.
Remote Sens. 2021, 13(17), 3498; https://doi.org/10.3390/rs13173498
Submission received: 29 June 2021 / Revised: 23 August 2021 / Accepted: 30 August 2021 / Published: 3 September 2021
(This article belongs to the Special Issue Remote Sensing of Wetlands)

Abstract

:
Wetlands play an important role in the terrestrial ecosystem. However, agricultural activities have resulted in a significant decrease in natural wetlands around the world. In the Tumen River Basin (TRB), a border area between China, the Democratic People’s Republic of Korea (DPRK), and Russia, natural wetlands have been reclaimed and converted into farmland, primarily due to the migration practices of Korean-Chinese. To understand the spatial and temporal patterns of this conversion from wetlands to farmland, Landsat remote sensing images from four time periods were analyzed. Almost 30 years of data were extracted using the object-oriented classification method combined with random forest classification. In addition, statistical analysis was conducted on the conversion from natural wetland to farmland and from farmland to wetland, as well as on the relationship between the driving factors. The results revealed that a loss of 49.2% (12,540.1 ha) of natural wetlands in the Chinese portion of the TRB was due to agricultural encroachment for grain production. At the sub-basin scale, the largest area of natural wetland converted into farmland in the past 30 years was in the Hunchun River Basin (HCH), which accounts for 22.0% (2761.2 ha) of the total. Meanwhile, 6571.4 ha of natural wetlands, mainly in the Gaya River Basin (GYH), have been restored from farmland. These changes are closely related to the migration of the agricultural populations.

Graphical Abstract

1. Introduction

Wetlands are defined as marshlands, peatlands, and water areas, whether natural or artificial, permanent or temporary, containing stationary or flowing fresh, brackish or saline water, and including waters not more than six meters deep at low tide [1]. Wetlands are widely distributed globally and are ecosystems rich in biodiversity and with high productivity [2]. They are a source of water for agricultural production [3] and offer excellent conditions for agricultural development [4]. They also play a role in improving water quality, contributing to drought resistance, creating a humid climate, and promoting the development of biodiversity.
However, growing human populations are increasing the demand for food production, resulting in the continuous loss of wetland areas through the development of large-scale wetland agriculture [5]. Since 1970, about 50% of the global wetland area has disappeared under the influence of human activities [6]. In recent decades, the area of wetlands in China has also sharply reduced and the ecological function of these ecosystems has correspondingly decreased [7]. Previous research has shown that excess reclamation and wetland conversion are the main reasons for the reduction in natural wetland area and function decline in China [8]. Therefore, agriculture development is at odds with the protection of wetland resources and environments [9]. Most traditional agricultural development modes are unscientific [10], destroying the ecosystem function of wetlands [11]. To analyze the contradiction between wetland protection and sustainable development and utilization, an accurate quantification of the spatial and temporal patterns of agricultural encroachment on natural wetlands and their mutual conversion is necessary. Accurate monitoring of the spatial distribution and dynamic change of natural wetlands and farmland is a critical aspect of natural wetland protection and restoration.
Through advances in science and technology, remote sensing technology has become increasingly sophisticated. It can quickly extract surface information over large areas, greatly saving manpower and material resources, and it can detect changes to the land surface through the analysis of long time series of remote sensing data [12]. Landsat data are currently widely used in wetland studies at global, regional, and watershed scales [13,14]. In recent years, visual interpretation [15], supervision classification [16], object-oriented classification [17], and artificial neural network algorithm [18] methods have been applied to wetland information extraction. Of these, the object-based image analysis (OBIA) technique is the most widely used. It has obvious advantages, especially on the ground object recognition of high-resolution images and the detection of change [19]. The object-oriented classification method merges adjacent pixels with the same or similar set of homogeneous characteristics into an homogeneous object. Each homogeneous object has its own attribute description and, during classification, different sizes of homogenous objects are used instead of pixels as the basic unit of classification. Simultaneously, the spectra, shape, texture, shadow, and spatial information of different objects are combined for a comprehensive classification analysis [20]. Although a small amount of spectral information is lost in the process of image segmentation, object-oriented classification effectively avoids the “salt effect” caused by the large variation in similar spectra in high-resolution images, and the false classification caused by the “synonyms spectrum” and “foreign body with spectrum” [21]. In nonparametric machine learning, a random forest (RF) classifier combined with OBIA (OBIA-RF) has received increased attention due to its efficient and reliable high-precision classifications [22]. Applied to land cover classification, OBIA-RF has demonstrated an accuracy rate higher than 90% [23]. Moreover, this method is closer to the image interpretation process of the human brain and can thus effectively improve the classification accuracy of high-resolution images.
The Tumen River is located at the border of China, the Democratic People’s Republic of Korea (DPRK), and Russia, and is one of China’s important international rivers. The Tumen River Basin (TRB) is an area of important ecological function, a pilot area of the national park system, and the core area of Northeast Asia’s ecological network. It is characterized by diverse wetland types, fertile soil, abundant water, and is the habitat of endangered species such as the Amur tiger and red-crowned crane [24]. In recent years, due to the interference of human activities in the TRB, the area and quality of natural wetlands in the basin have gradually declined [25]. The TRB is also the gathering place of the Korean-Chinese nationality. In 1851, the backward agricultural economy of the Joseon Dynasty caused farmers to infiltrate the Chinese side of the Tumen River for farming [26], and a large proportion of natural wetlands were reclaimed and turned into paddy fields. Therefore, to effectively protect and manage the remaining wetlands, it is necessary that the area of degraded natural wetlands in the TRB is quantified and the underlying reasons for degradation identified.
Based on remote sensing (RS) images from 1986, 1996, 2006, and 2016, this study used the OBIA-RF, the classification method to extract information on natural wetlands and farmland in the TRB. Temporal and spatial conversions from natural wetlands to farmland in the TRB and its sub-basins were analyzed. Meteorological data and statistical yearbook and related policy data were used to identify the driving forces for the conversion from natural wetlands to farmland. The findings of the study provide basic data for watershed wetland conservation, restoration and sustainable management in the TRB, and theoretical grounding for the application of this method in other wetland contexts.

2. Materials and Methods
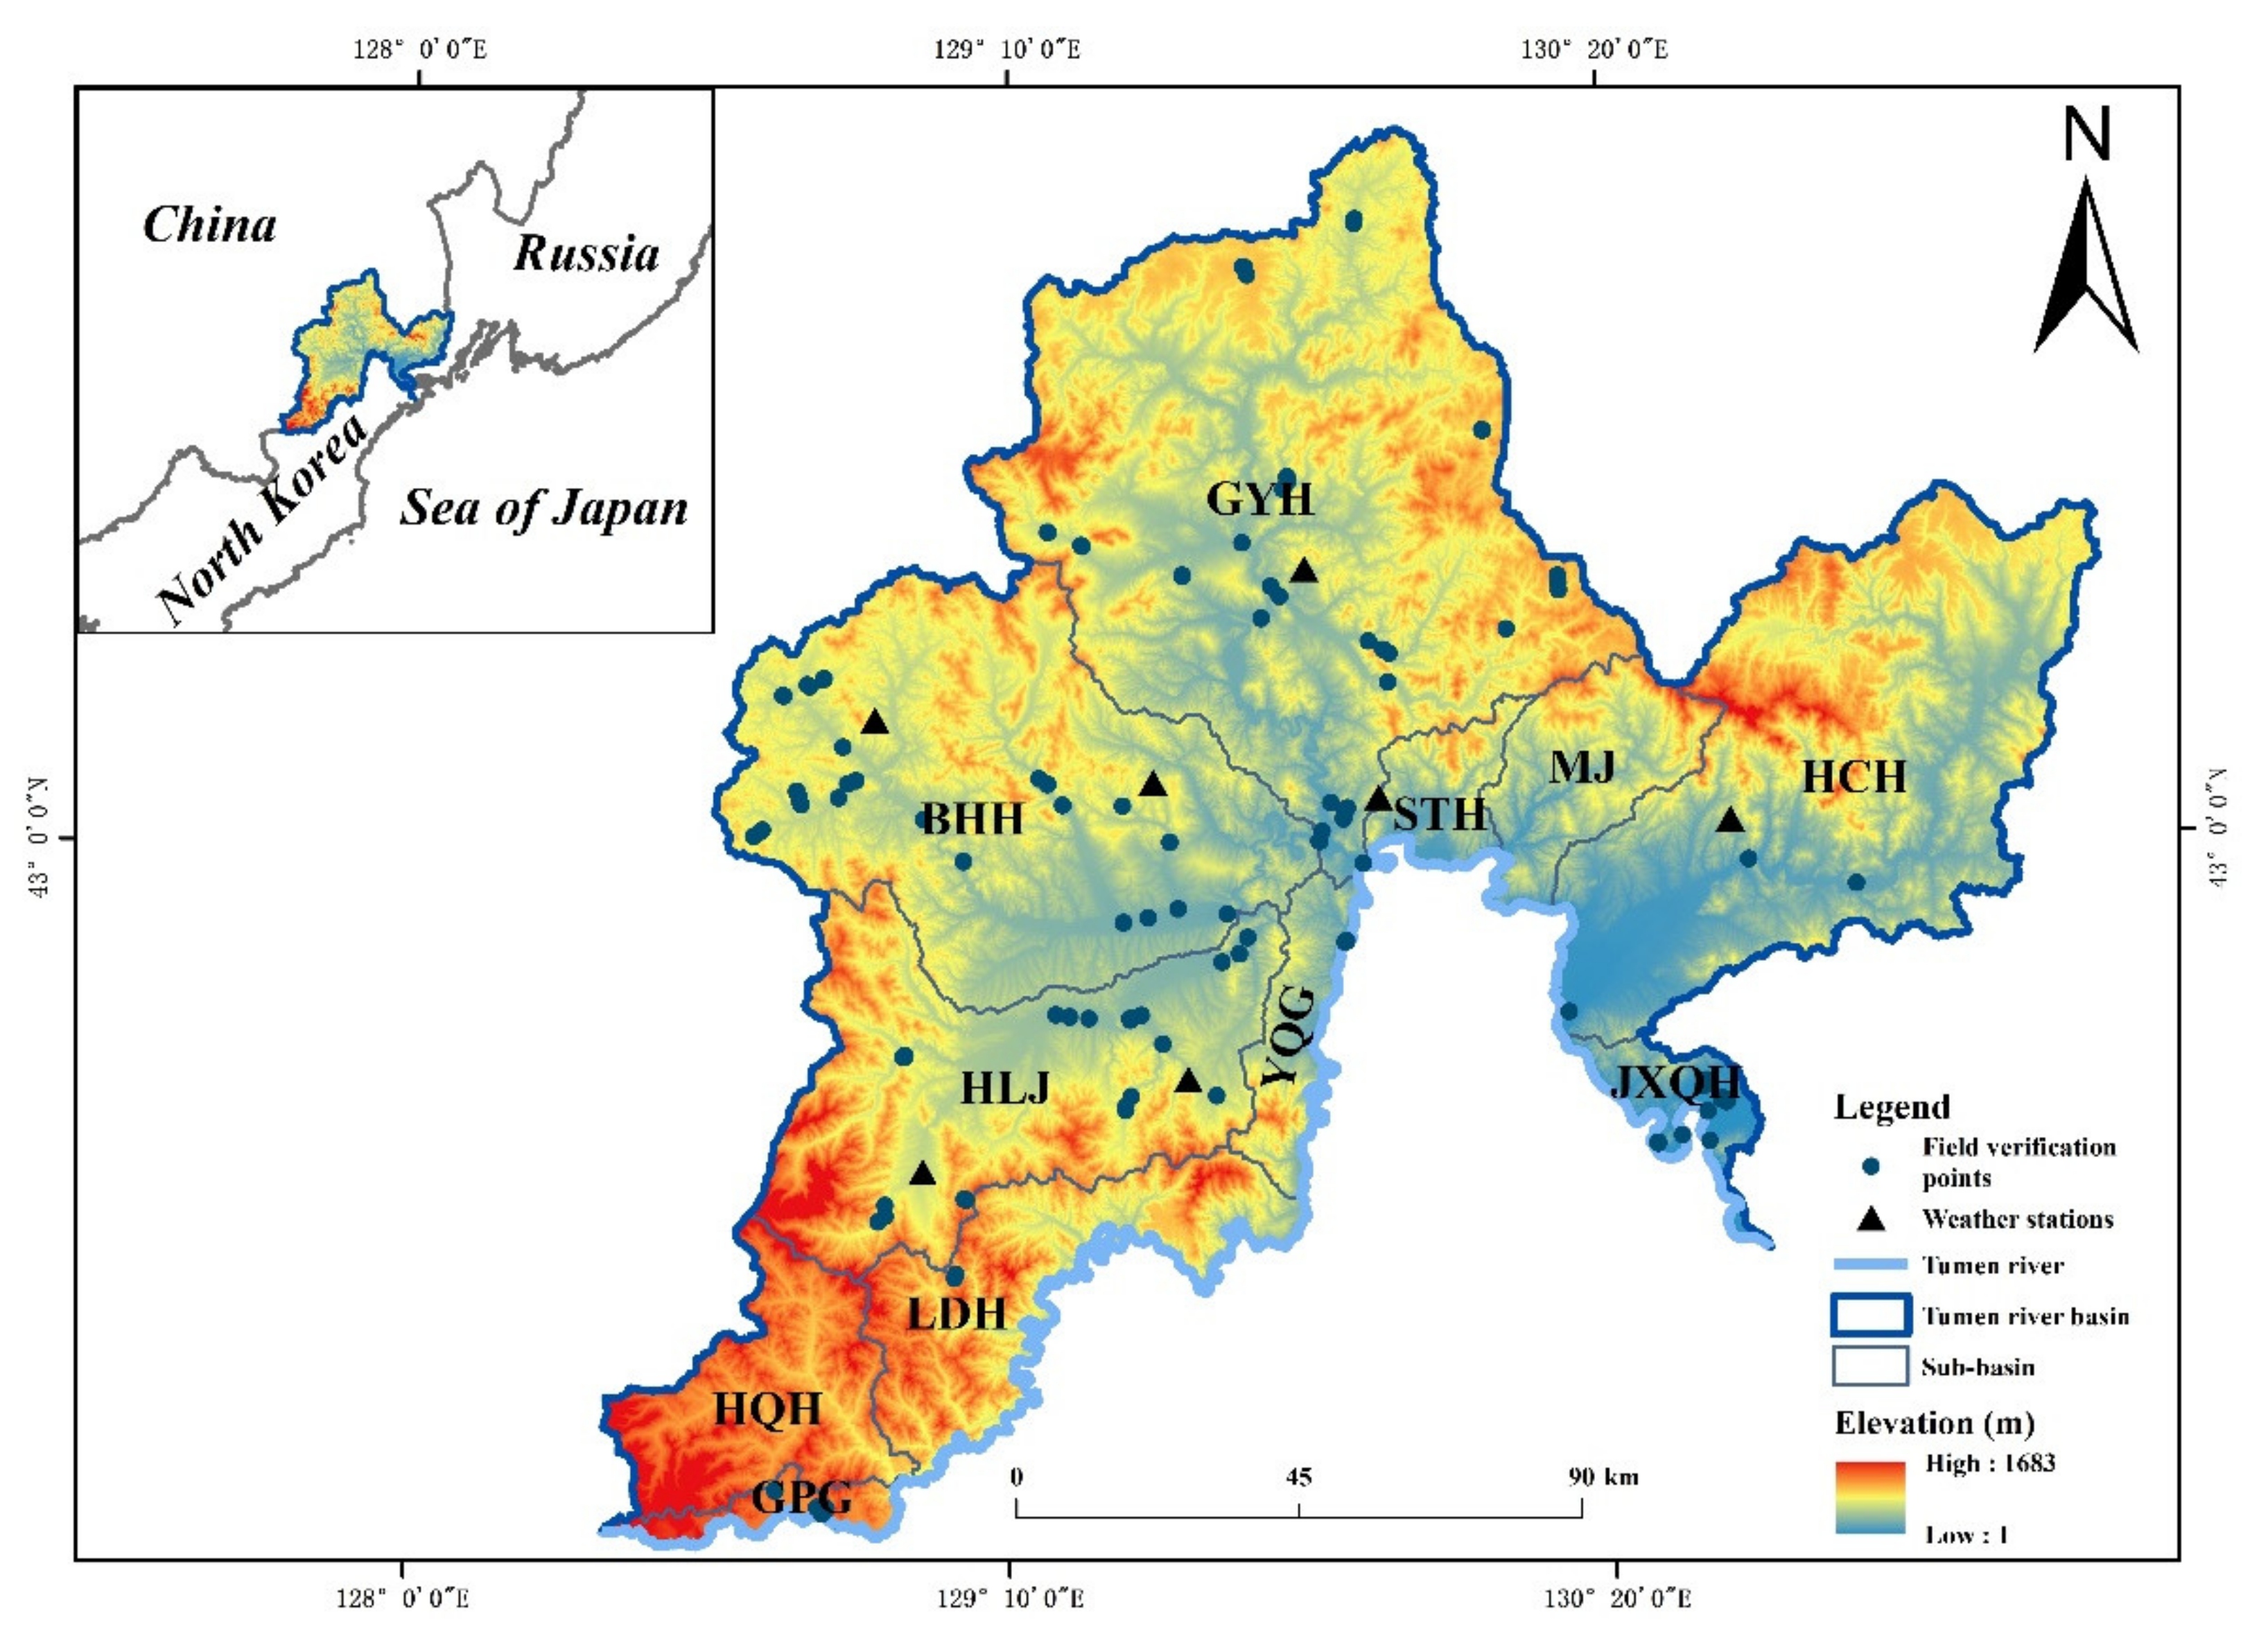
2.1. Study Area

The TRB covers the Yanbian Korean Autonomous Prefecture in Jilin Province in China (3,145,000 ha); Raseon Special City, Ryanggang Province, and North Hamgyong Province in DPRK (1,883,000 ha); and the Hassan Region of Russia (418,000 ha), totaling 5,446,000 ha [27]. The study area in this article is limited to the Chinese portion of the TRB. The study area (Figure 1) is located in the southeast of Jilin Province in northeast China (42°42′55″–42°14′54″N, 130°15′49″–130°52′20″E), which borders DPRK and Russia. It is China’s core Northeast Asian region and is an important point for China in the Northeast Asia “Golden Triangle” economy. The climate of this region is characterized by wet summer and winter seasons and dry spring and autumn seasons. In terms of climate, July and August are the hottest months of the year, with average temperatures between 22 °C and 25 °C.
The TRB water system originates on the eastern side of the highest peaks of the Changbai Mountains. The Chinese portion of the basin can be divided into 11 sub-basins: the upstream basins include Guangpinggou (GPG), Hongqihe (HQH), and Liudonghe (LDH); the midstream basins include Hailanjiang (HLJ), Yueqinggou (YQG), Buerhatonghe (BHH), Gayahe (GYH), Shitouhe (STH), and Mijiang (MJ); and the downstream basins include Hunchunhe (HCH) and Jingxinquanhe (JXQH).

2.2. Data Source

RS images, the Shuttle Radar Topography Mission (SRTM) 30 m digital elevation model (DEM), wetland patch maps, meteorological data, socio-economic data, and other multi-source data were used in this study.
The RS images were important data sources for extracting long-time-series wetland information to analyze wetland pattern changes. To reduce the effects of the data on the result, images with less than 10% cloud cover (some remote sensing images with a cloud cover of more than 10% were used because the covered scope of the study area was free of cloud cover) between June and September were used (USGS, http://glovis.usgs.gov/, accessed on 22 March 2019) (Table 1). The classification accuracy was verified using data from 478 field sampling points that were observed through fieldwork and a wetland patch map provided by the forestry bureau of every county and city in the TRB.
Meteorological data were obtained from the China Meteorological Data Sharing Service Network (http://cdc.cma.gov.cn, accessed on 9 September 2019). To reduce the errors caused by the edge effect of interpolation, daily temperature and precipitation data from 118 major meteorological stations in the TRB and its surrounding areas from 1986 to 2016 were used. In addition, discontinuous, redundant, and incorrect original data were eliminated and supplemented using the gray correlation method to obtain continuous and accurate meteorological data.
Finally, to analyze the driving force of conversion from natural wetlands and farmland, socio-economic statistics from the Yanbian Statistical Yearbook from 1986 to 2016 were used. This data included grain output, Han-Chinese agricultural population, and Korean-Chinese agricultural population. To ensure data uniformity, all data (except RS data) were resampled to a resolution of 150 m.

2.3. Methods

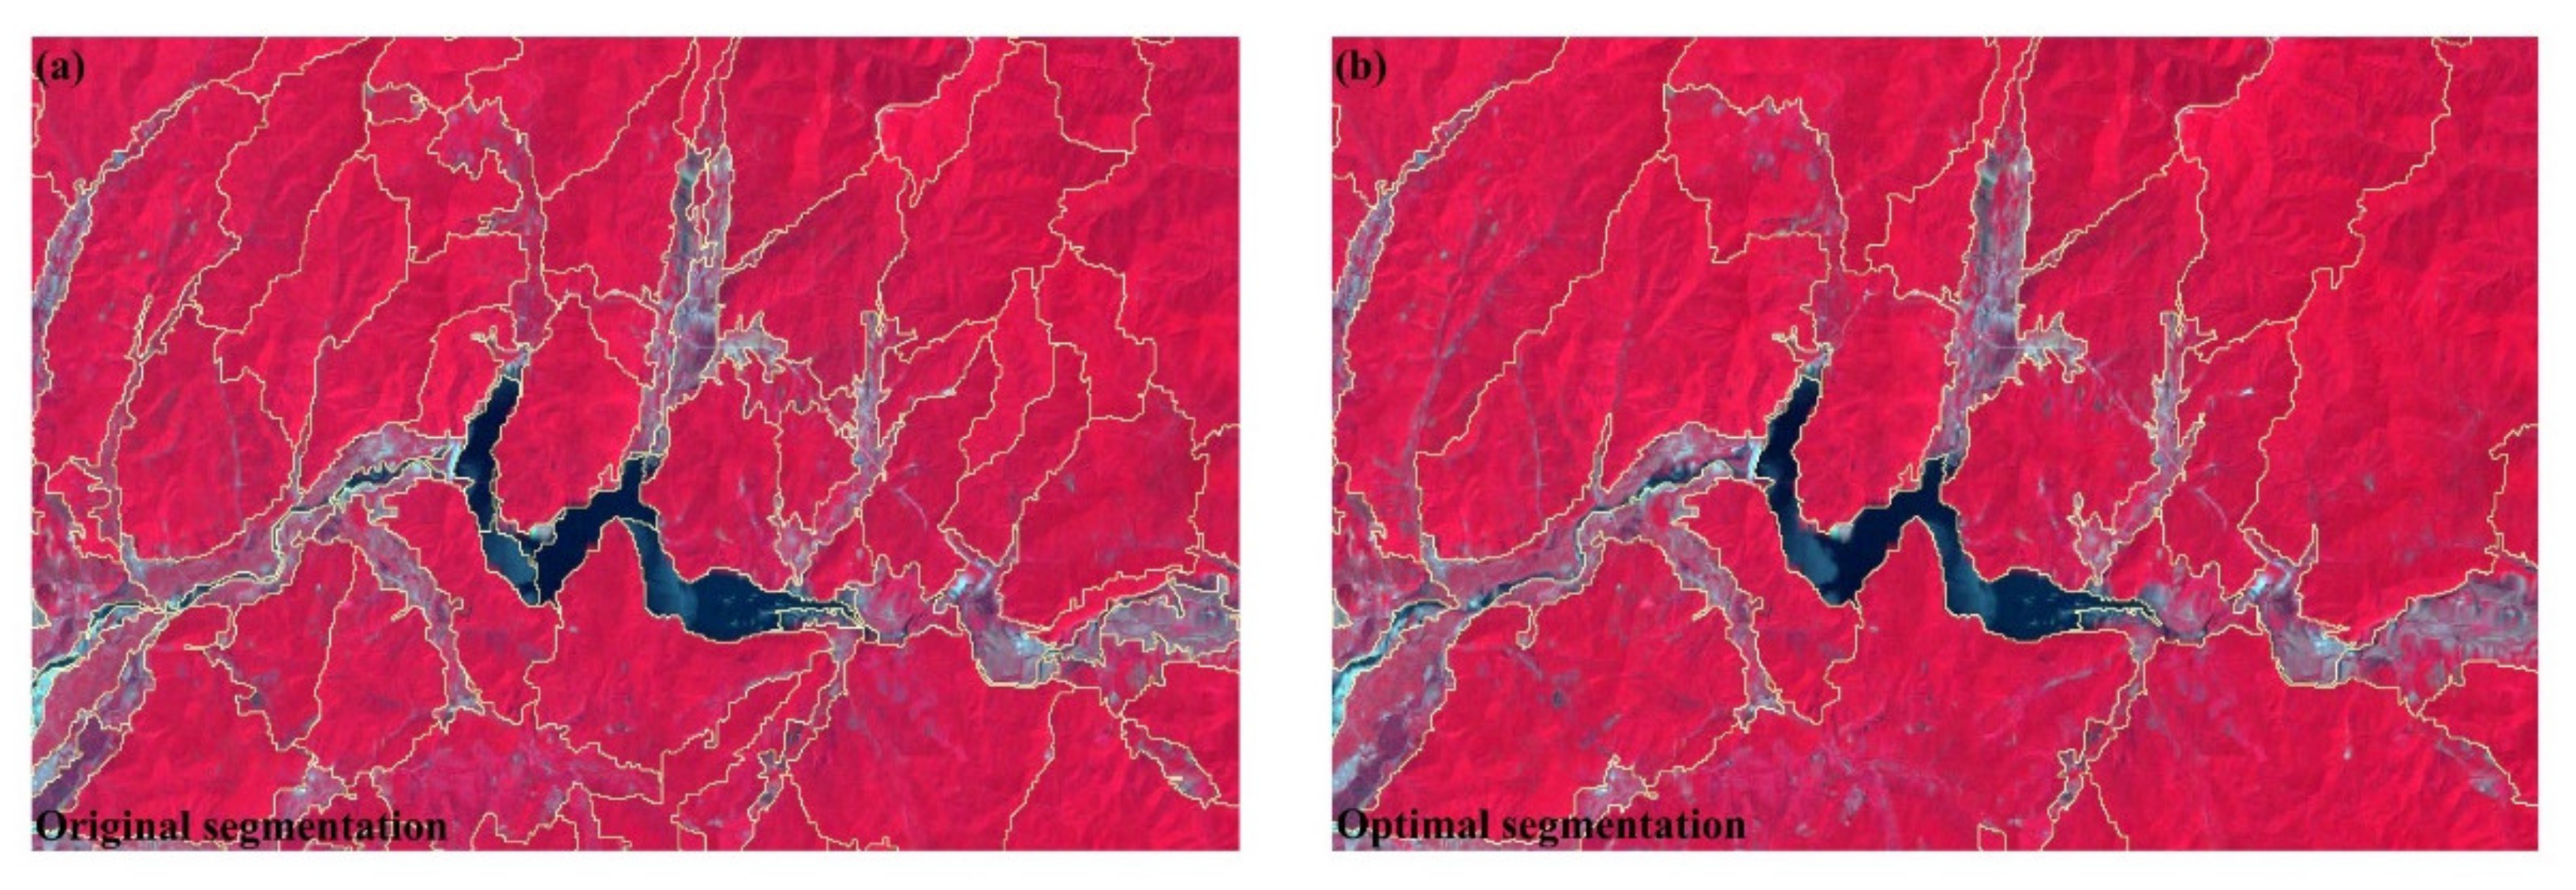
2.3.1. Establish Land Use and Land Cover Classification System and Its Information Extraction

The wetland classification system is the basis of wetland research, and it directly affects the accuracy of classification and mapping. The international Wetland Convention, the Chinese National Wetland Classification standard (GB/T 24708-2009), and the Chinese national standard “Classification of Land Use Status” (GB/T 21010-2017) were combined with sampling points that were obtained using GPS during fieldwork by the authors. The natural wetlands in the Chinese portion of the TRB were divided into four types (herb swamp, shrub swamp, forest swamp, and river), and farmland was divided into two types (paddy field and dry farmland) (Table 2) [25,28].
Before extracting the information, Landsat data were pre-processed using ENVI5.3 software to eliminate possible errors. This included strip removal, radiation correction, geometric correction, and atmospheric correction. The object-oriented method was used to extract information in eCognition9.02, the most critical of which was remote sensing image segmentation. The multi-scale segmentation algorithm is a common image segmentation method in eCognition9.02. Using the fractal net evolution approach (FNEA), it merges neighboring pixels from bottom to top into the smallest heterogeneous object with different sizes and shapes. The landscape of each remote sensing image was analyzed, and the shapes were compared according to different segmentation scales (80 and 50, respectively), before the image was finally segmented. When the segmentation scale was set to 50, the segmentation result met the requirements of this classification, but it was too fragmented and took too long in the segment process. The segmentation scale of 80 was found to be more suitable for the landscape in this region (Figure 2); thus, we used the scale of 80 instead of 50 to segment the image. Next, the RF algorithm was used to extract the wetland information from the segmented images.
The RF algorithm is a nonparametric machine learning algorithm composed of multiple classifications and regression trees (CART). The algorithm can efficiently run large datasets and process thousands of input variables [29]. In the learning phase, multiple samples are extracted from the observation data, and then a large number of classification trees are merged from each sample [30]. For each routine in the tree, first, features were randomly selected, and the test was divided according to the Gini coefficient to find the optimal feature [31]. Following three repeats of this process, a random forest containing Ntree classification trees was built [32].
The sample size was set to 1000, with six different types of land cover (dry farmland, paddy field, river, herb swamp, shrub swamp, and forest swamp) randomly selected and defined over the entire study area. The object features included spectral measures such as the mean value of multispectral bands, brightness and maximum difference, and normalized difference indices such as the normalized difference vegetation index (NDVI) and the normalized difference water index (NDWI):
N D V I = R N I R R r e d R N I R + R r e d ,
N D W I = R G r e e n R N I R R G r e e n + R N I R ,
where RGreen, Rred, and RNIR refer to reflectance values derived from spectral radiances measured using the green, red, and near-infrared (NIR) bands, respectively.
According to different wetland types, and considering the principles of accessibility, selectivity, and scientificity, the wetland patch map provided by each forestry bureau was used to determine the wetland type. Based on 3S technology, wetlands with larger patch areas and better wetland patches were subjectively selected. Based on different wetland types, such as rivers, swamps, and paddy fields, 478 field sampling points were finally selected to obtain GPS fixed-point data. The classification correction matrix was used to calculate classification producer accuracy, user accuracy, and overall accuracy, and the Kappa coefficient was used to evaluate the accuracy of the classification results. Producer accuracy refers to the number of accurately classified pixels of a given type of real data. User accuracy refers to the ratio of accurately classified pixels to the total number of pixels in the user classification result, reflecting a classified image. The overall accuracy of meta-energy is the ratio of the total number of accurately classified pixels to the total number of pixels, reflecting the overall correctness of the classification results. Each element in the Kappa coefficient comprehensive matrix can evaluate the classification results more objectively. The maximum likelihood method was used to verify that the measured accuracy remained optimal. After classifying and processing all the land use information from the remote sensing images for the four time periods, the misclassification of land was modified using the visual interpretation method.

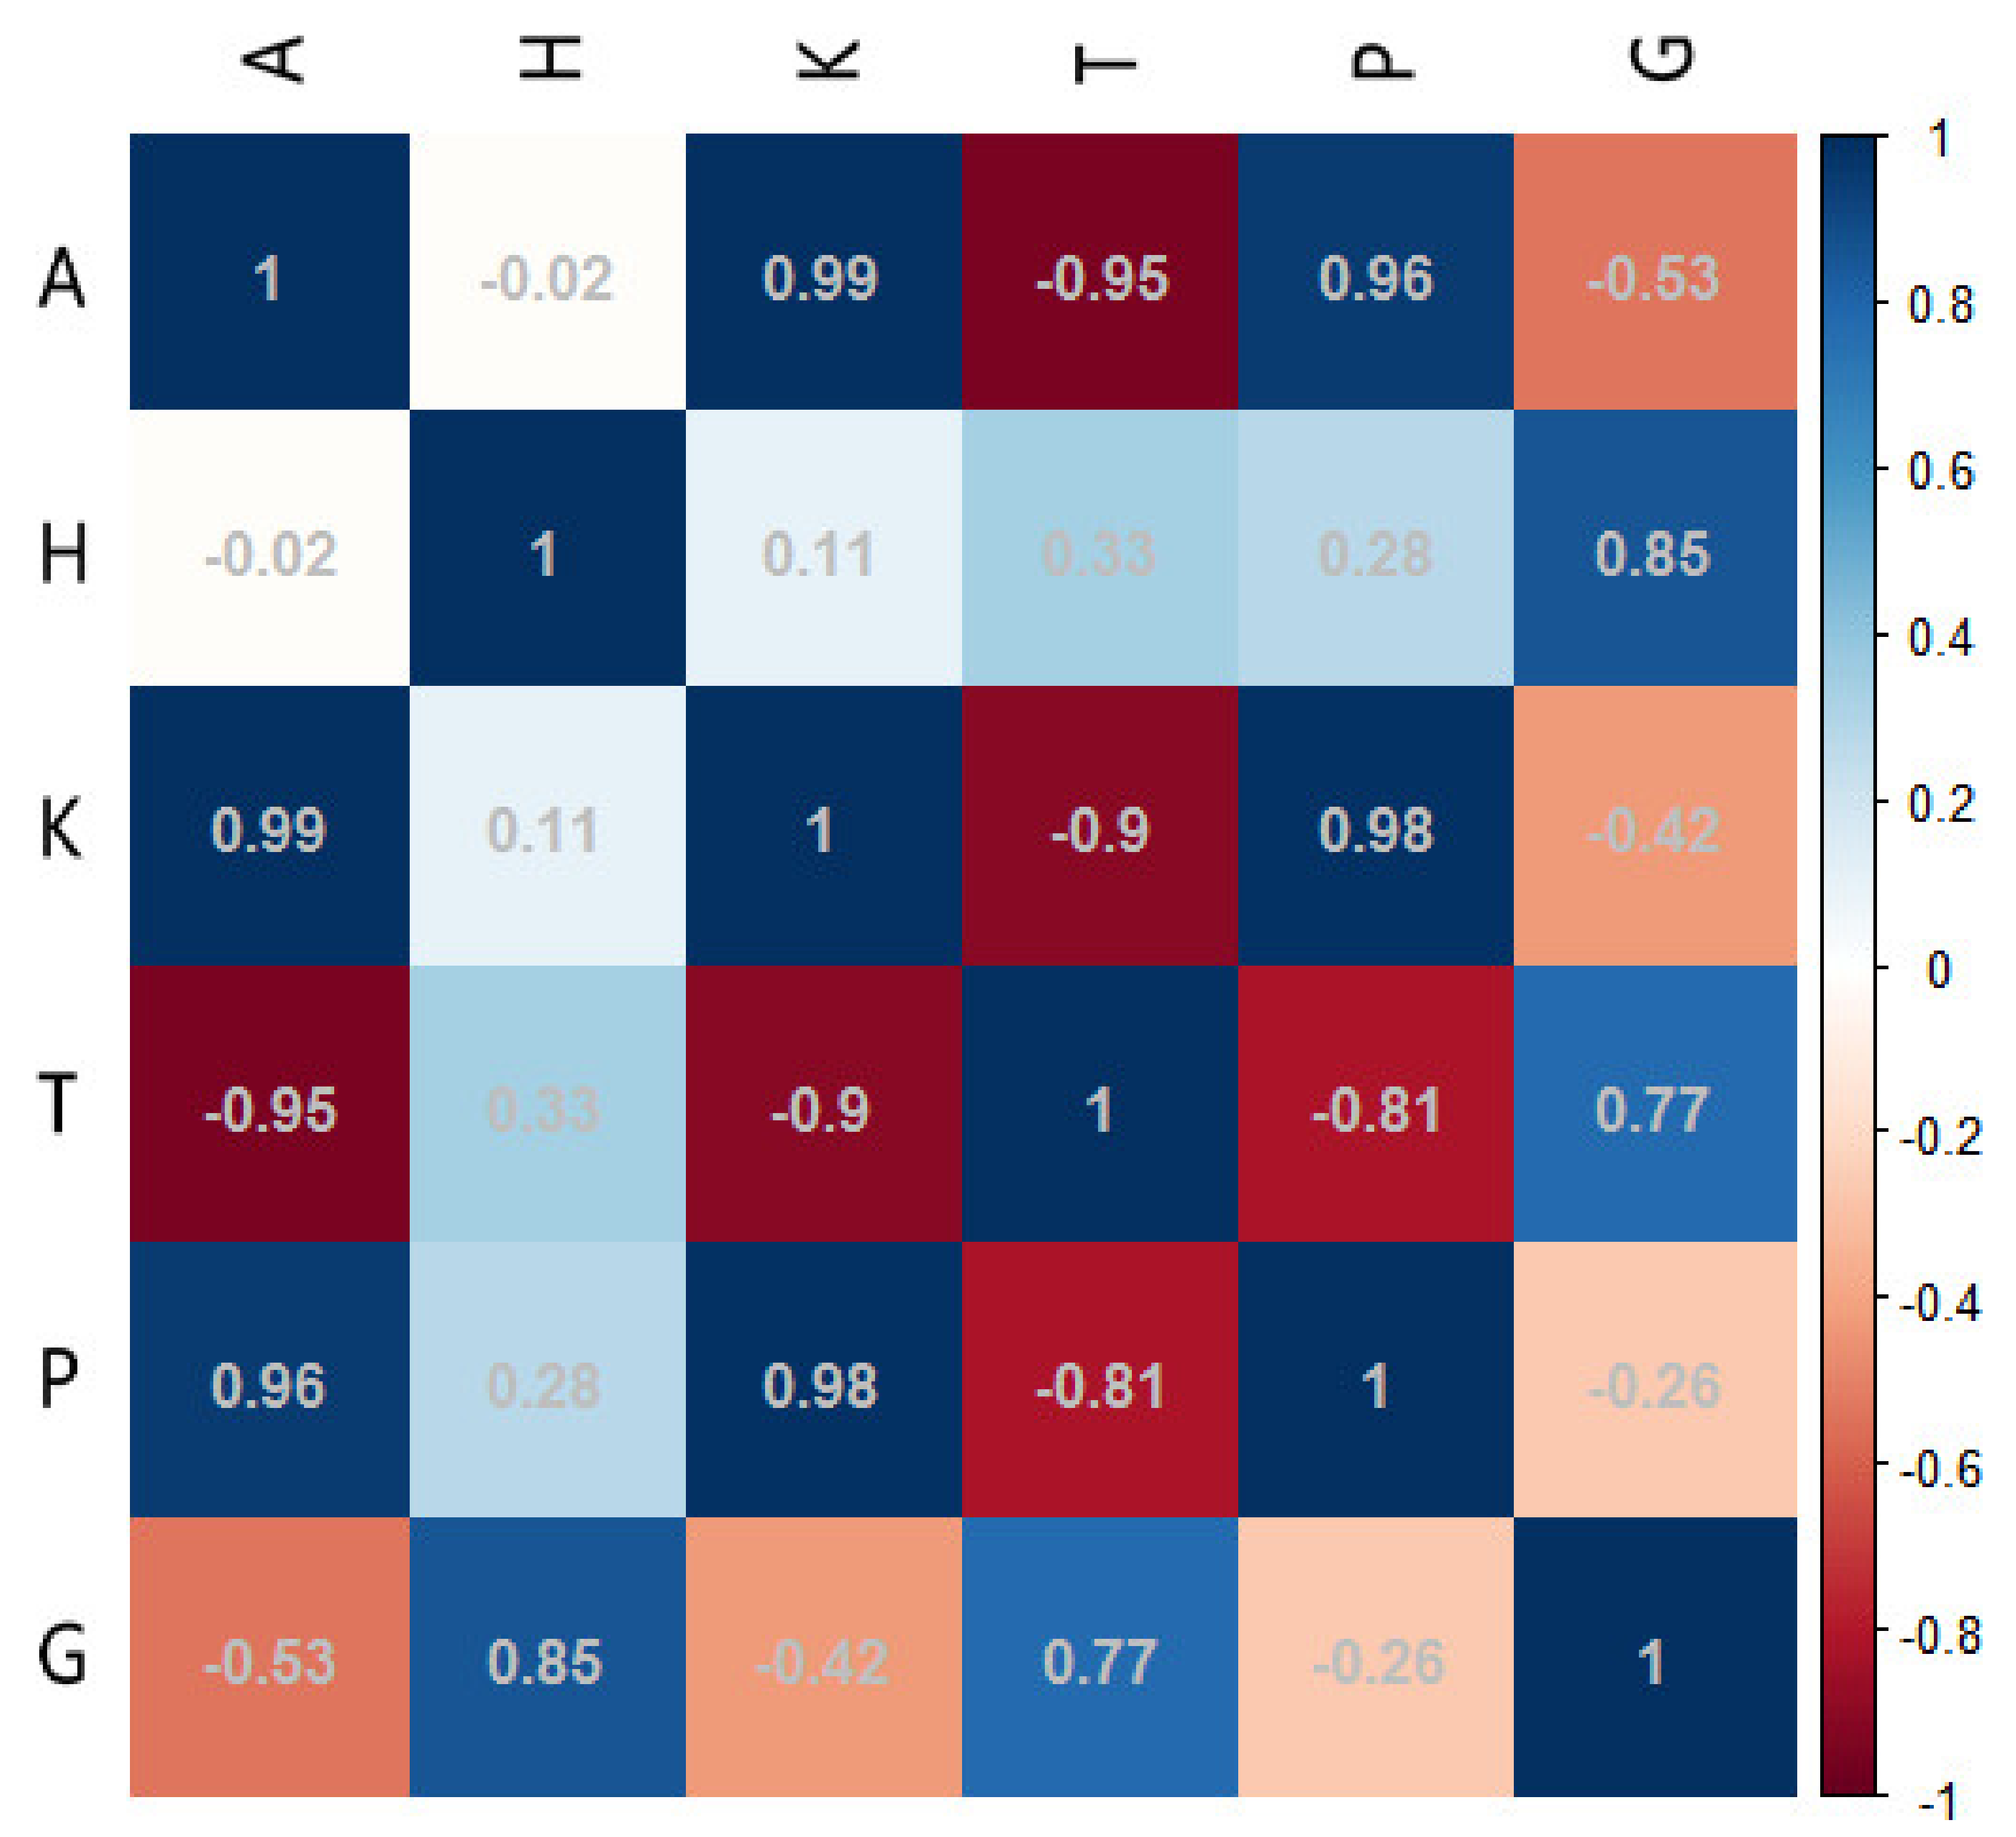
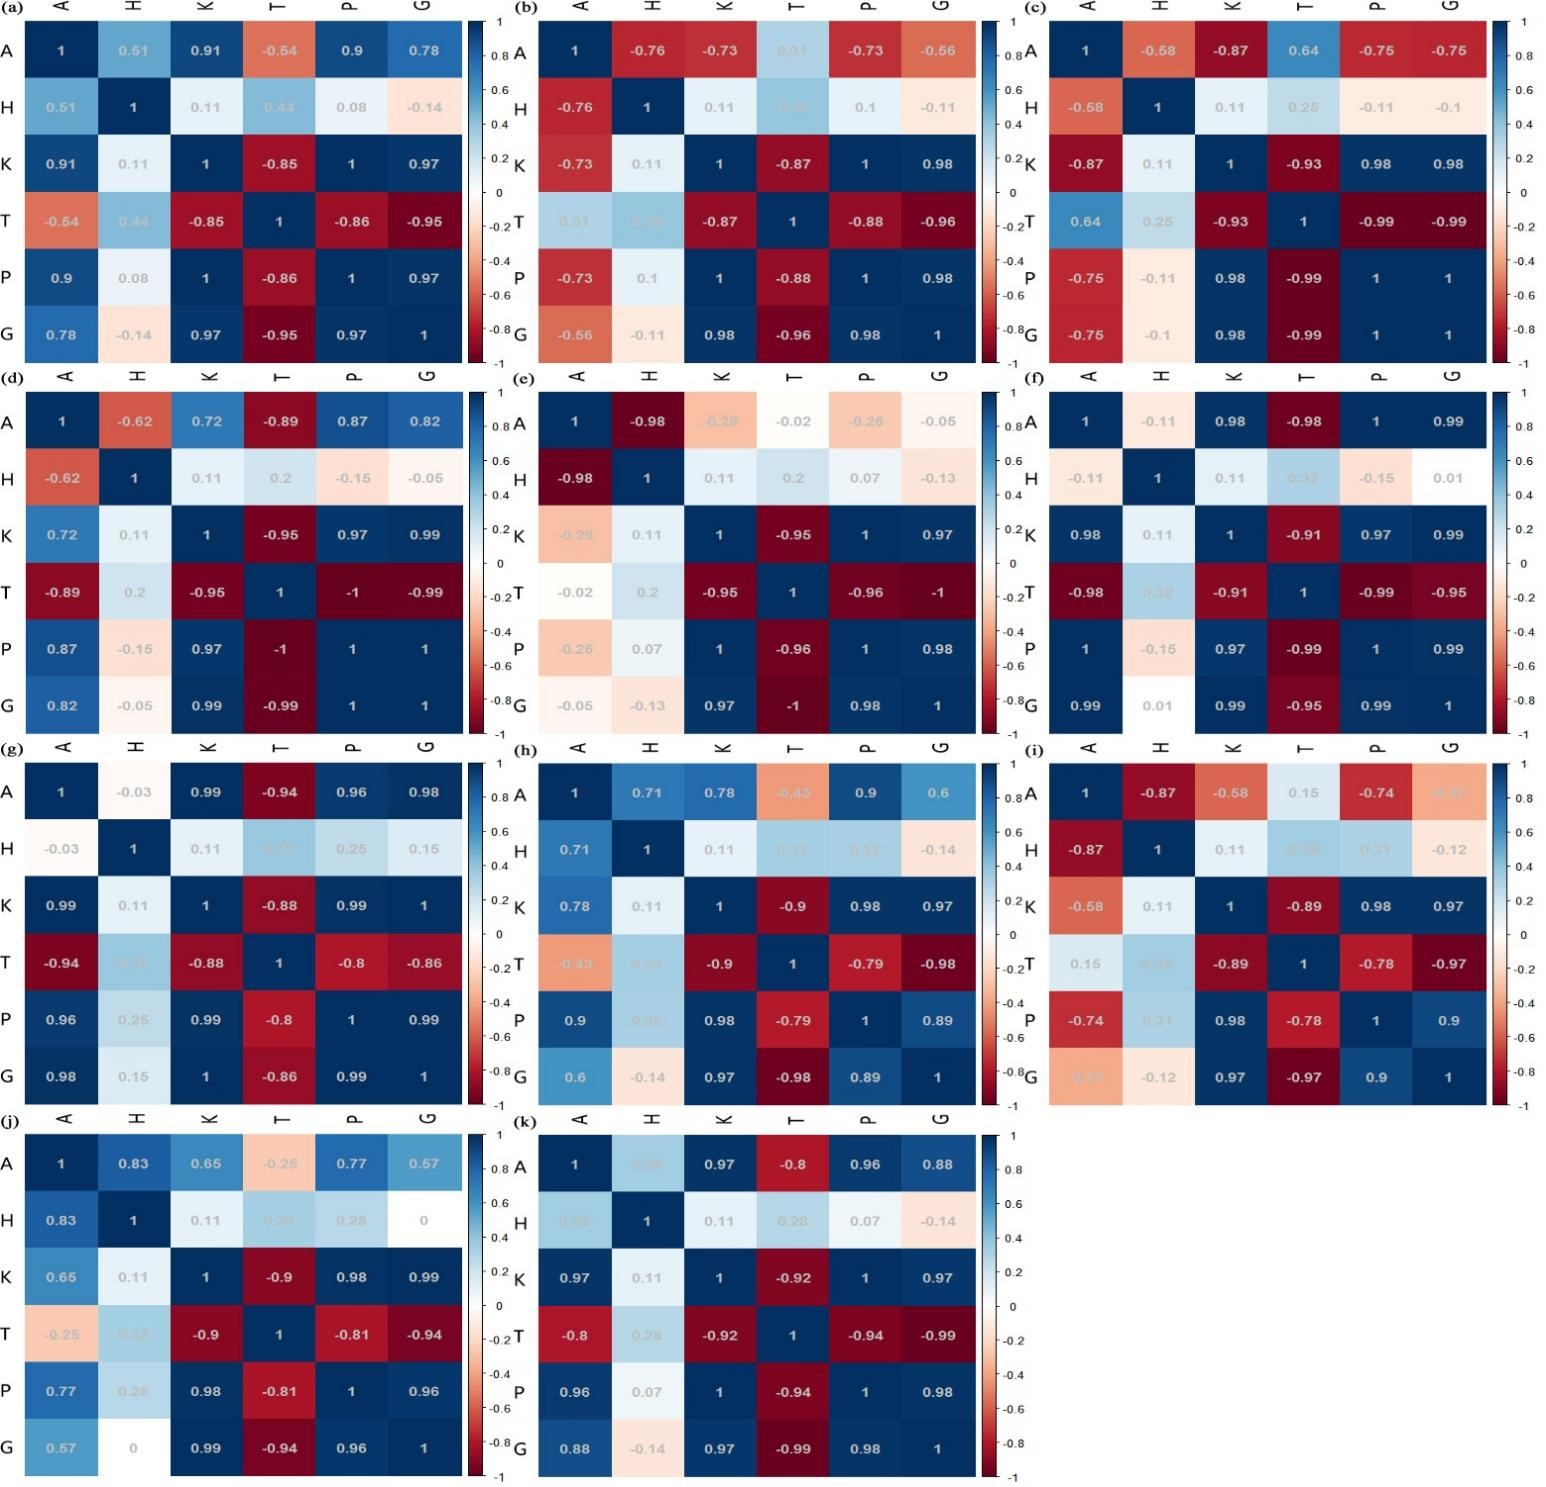
2.3.2. Analysis of Driving Factors

The conversion from natural wetlands to farmland is affected by both natural and human factors, including the unique human environment, as well as natural and socio-economic conditions. The research was affected by the availability of data and the representativeness of indicators in the study area [8,25]. Five index variables, including annual average temperature, annual average precipitation, grain output, the population of Han-Chinese farmers, and the population of Korean-Chinese farmers, were the factors for correlation analysis on the conversion from natural wetland to farmland in the TRB [33]. The Pearson correlation coefficient was used to test the correlation degree of the model. The larger the Pearson correlation coefficient, the higher the correlation degree [34].
The Pearson simple correlation coefficient calculation formula was used:
r = i = 1 n x i x ¯ y i y ¯ i = 1 n x i x ¯ 2 i = 1 n y i y ¯ 2   ( i = 1 N ) ,
where r is the correlation coefficient of observations, which is generally used to infer the overall correlation coefficient. Xi and Yi are the sample value of random variable X and random variable Y, respectively, and the total sample size is n. The value range of the correlation coefficient is between −1 and +1, that is, −1 ≤ r ≤ +1. Of these, if 0 < r < 1, there is a positive correlation between the variables; if −1 > r > 0, there is a negative correlation between the variables; if |r| = 1, the value of one of the variables is completely dependent on another variable; and if r = 0, there is no linear correlation between the two variables.

3. Results

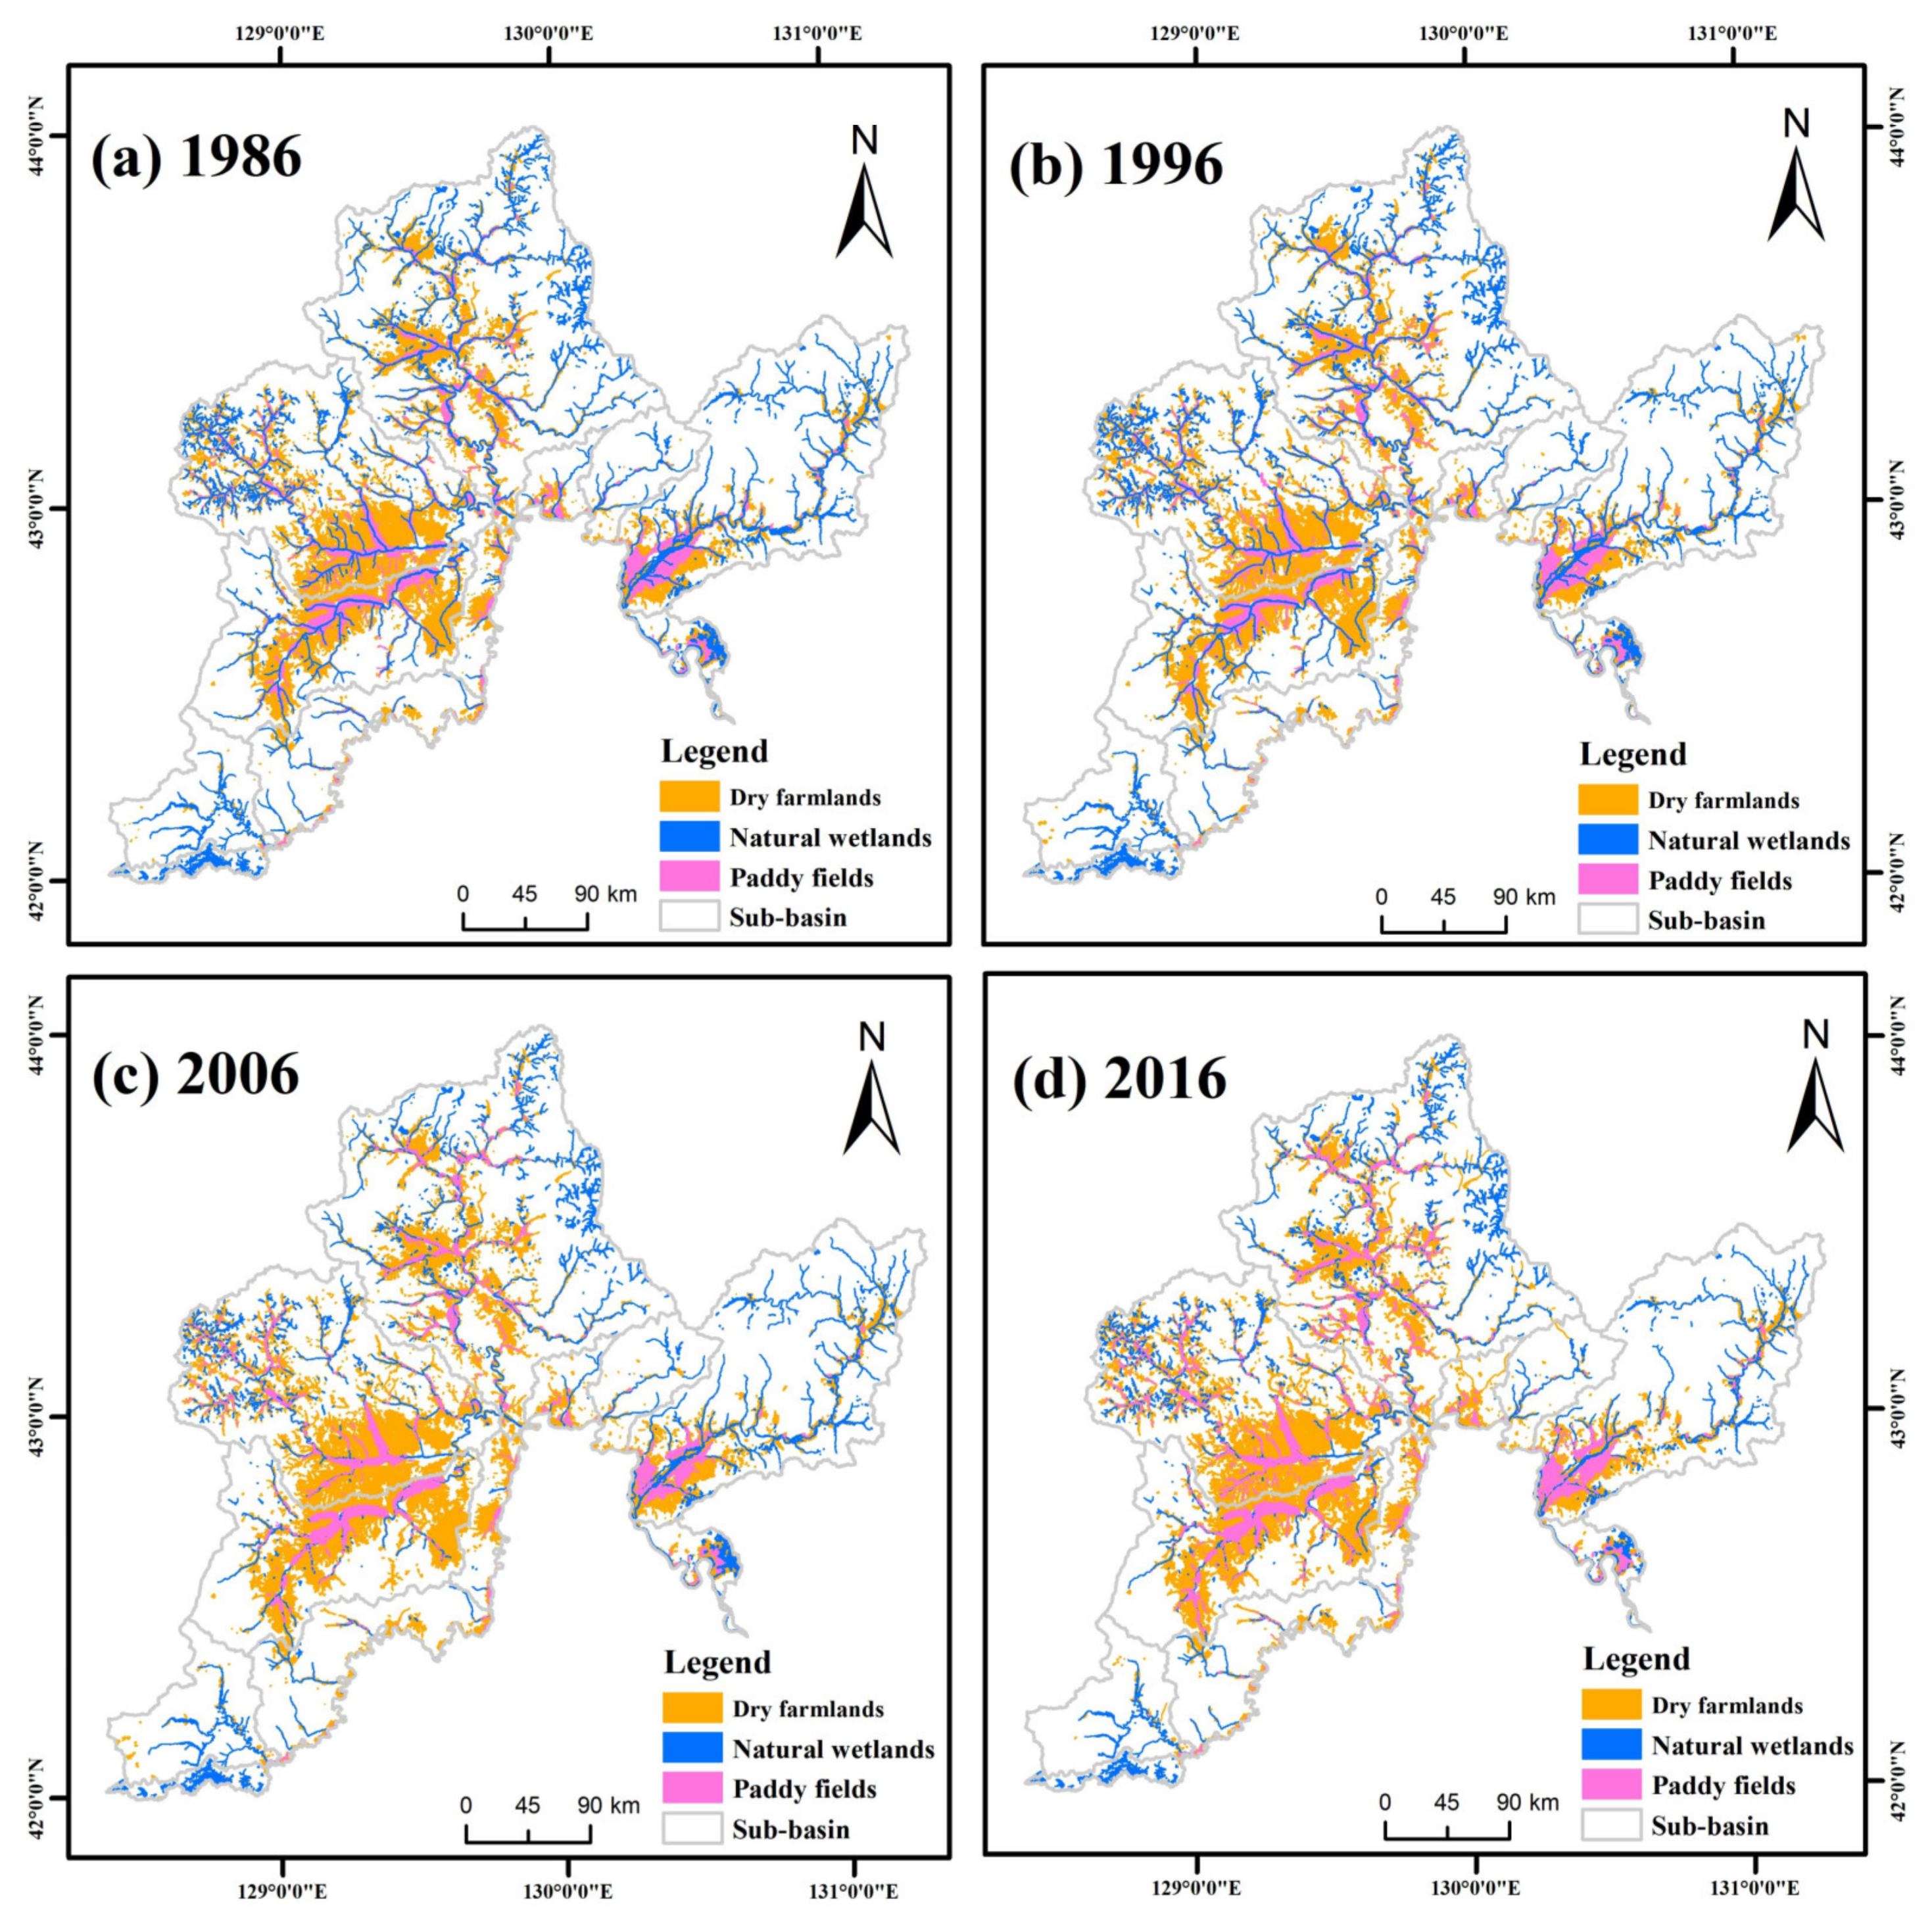
3.1. Distribution of Natural Wetland and Farmland in Tumen River Basin from 1986 to 2016

The overall accuracies of the land use classification for the four periods 1986, 1996, 2006, and 2016 were 89.76, 90.28, 90.57, and 92.40, respectively, while the Kappa coefficients were 0.88, 0.89, 0.91, and 0.91, respectively. The overall classification accuracy was relatively high, meeting the demands of this study. The overall accuracy and Kappa coefficient for 2016 were both the highest, owing to the higher remote sensing image resolution in 2016 and the auxiliary use of the forestry administration’s classification of wetland patches (Table 3).
Natural wetlands and farmland are mainly distributed within the middle reaches of the TRB. Both exhibited a decreasing trend from 1986 to 2016 (Figure 3). At the sub-basin scale, natural wetlands are mainly distributed in GPG, HQH, BHH, GYH, and HCH, while farmland is mainly distributed in the middle and lower reaches of HLJ, the middle reaches of BHH, the middle reaches of GYH, and the upper reaches of HCH (Figure 3). The area of both natural wetlands and farmland in the 11 sub-basins has continued to decrease over the past 30 years with the area of natural wetlands reduction about three times that of farmland reduction (Table 4). Specifically, those sub-basins with large losses of natural wetland area in the past 30 years include HCH (−3305.9 ha), GYH (−2759.6 ha), and BHH (−2460.2 ha). LDH (−269.4 ha) is the only sub-basin in which the area of natural wetlands has increased. During the third decade, the area of natural wetland loss in the 11 sub-basins accounted for 23.1% of the total of the previous two decades, indicating that, over time, the area of natural wetland shrinkage has decreased, and natural wetlands are better protected. In the past 30 years, the area of farmland has both increased and decreased depending on the sub-basin. The farmland area in BHH (−3627.2 ha) and HCH (−2158.7 ha) has decreased most, while the farmland area of LDH (488.8 ha) has increased most (Table 4). Between 1986 and 1996, the area of natural wetlands decreased slightly. Between 1996 to 2006, the area of natural wetlands decreased, primarily due to conversion to paddy fields, and mainly in the middle reaches of BHH, the lower reaches of HLJ, and the middle reaches of GYH (Figure 3). Between 2006 and 2016, the area of natural wetlands in the upper reaches of HCH and JXQH decreased significantly (Figure 3).

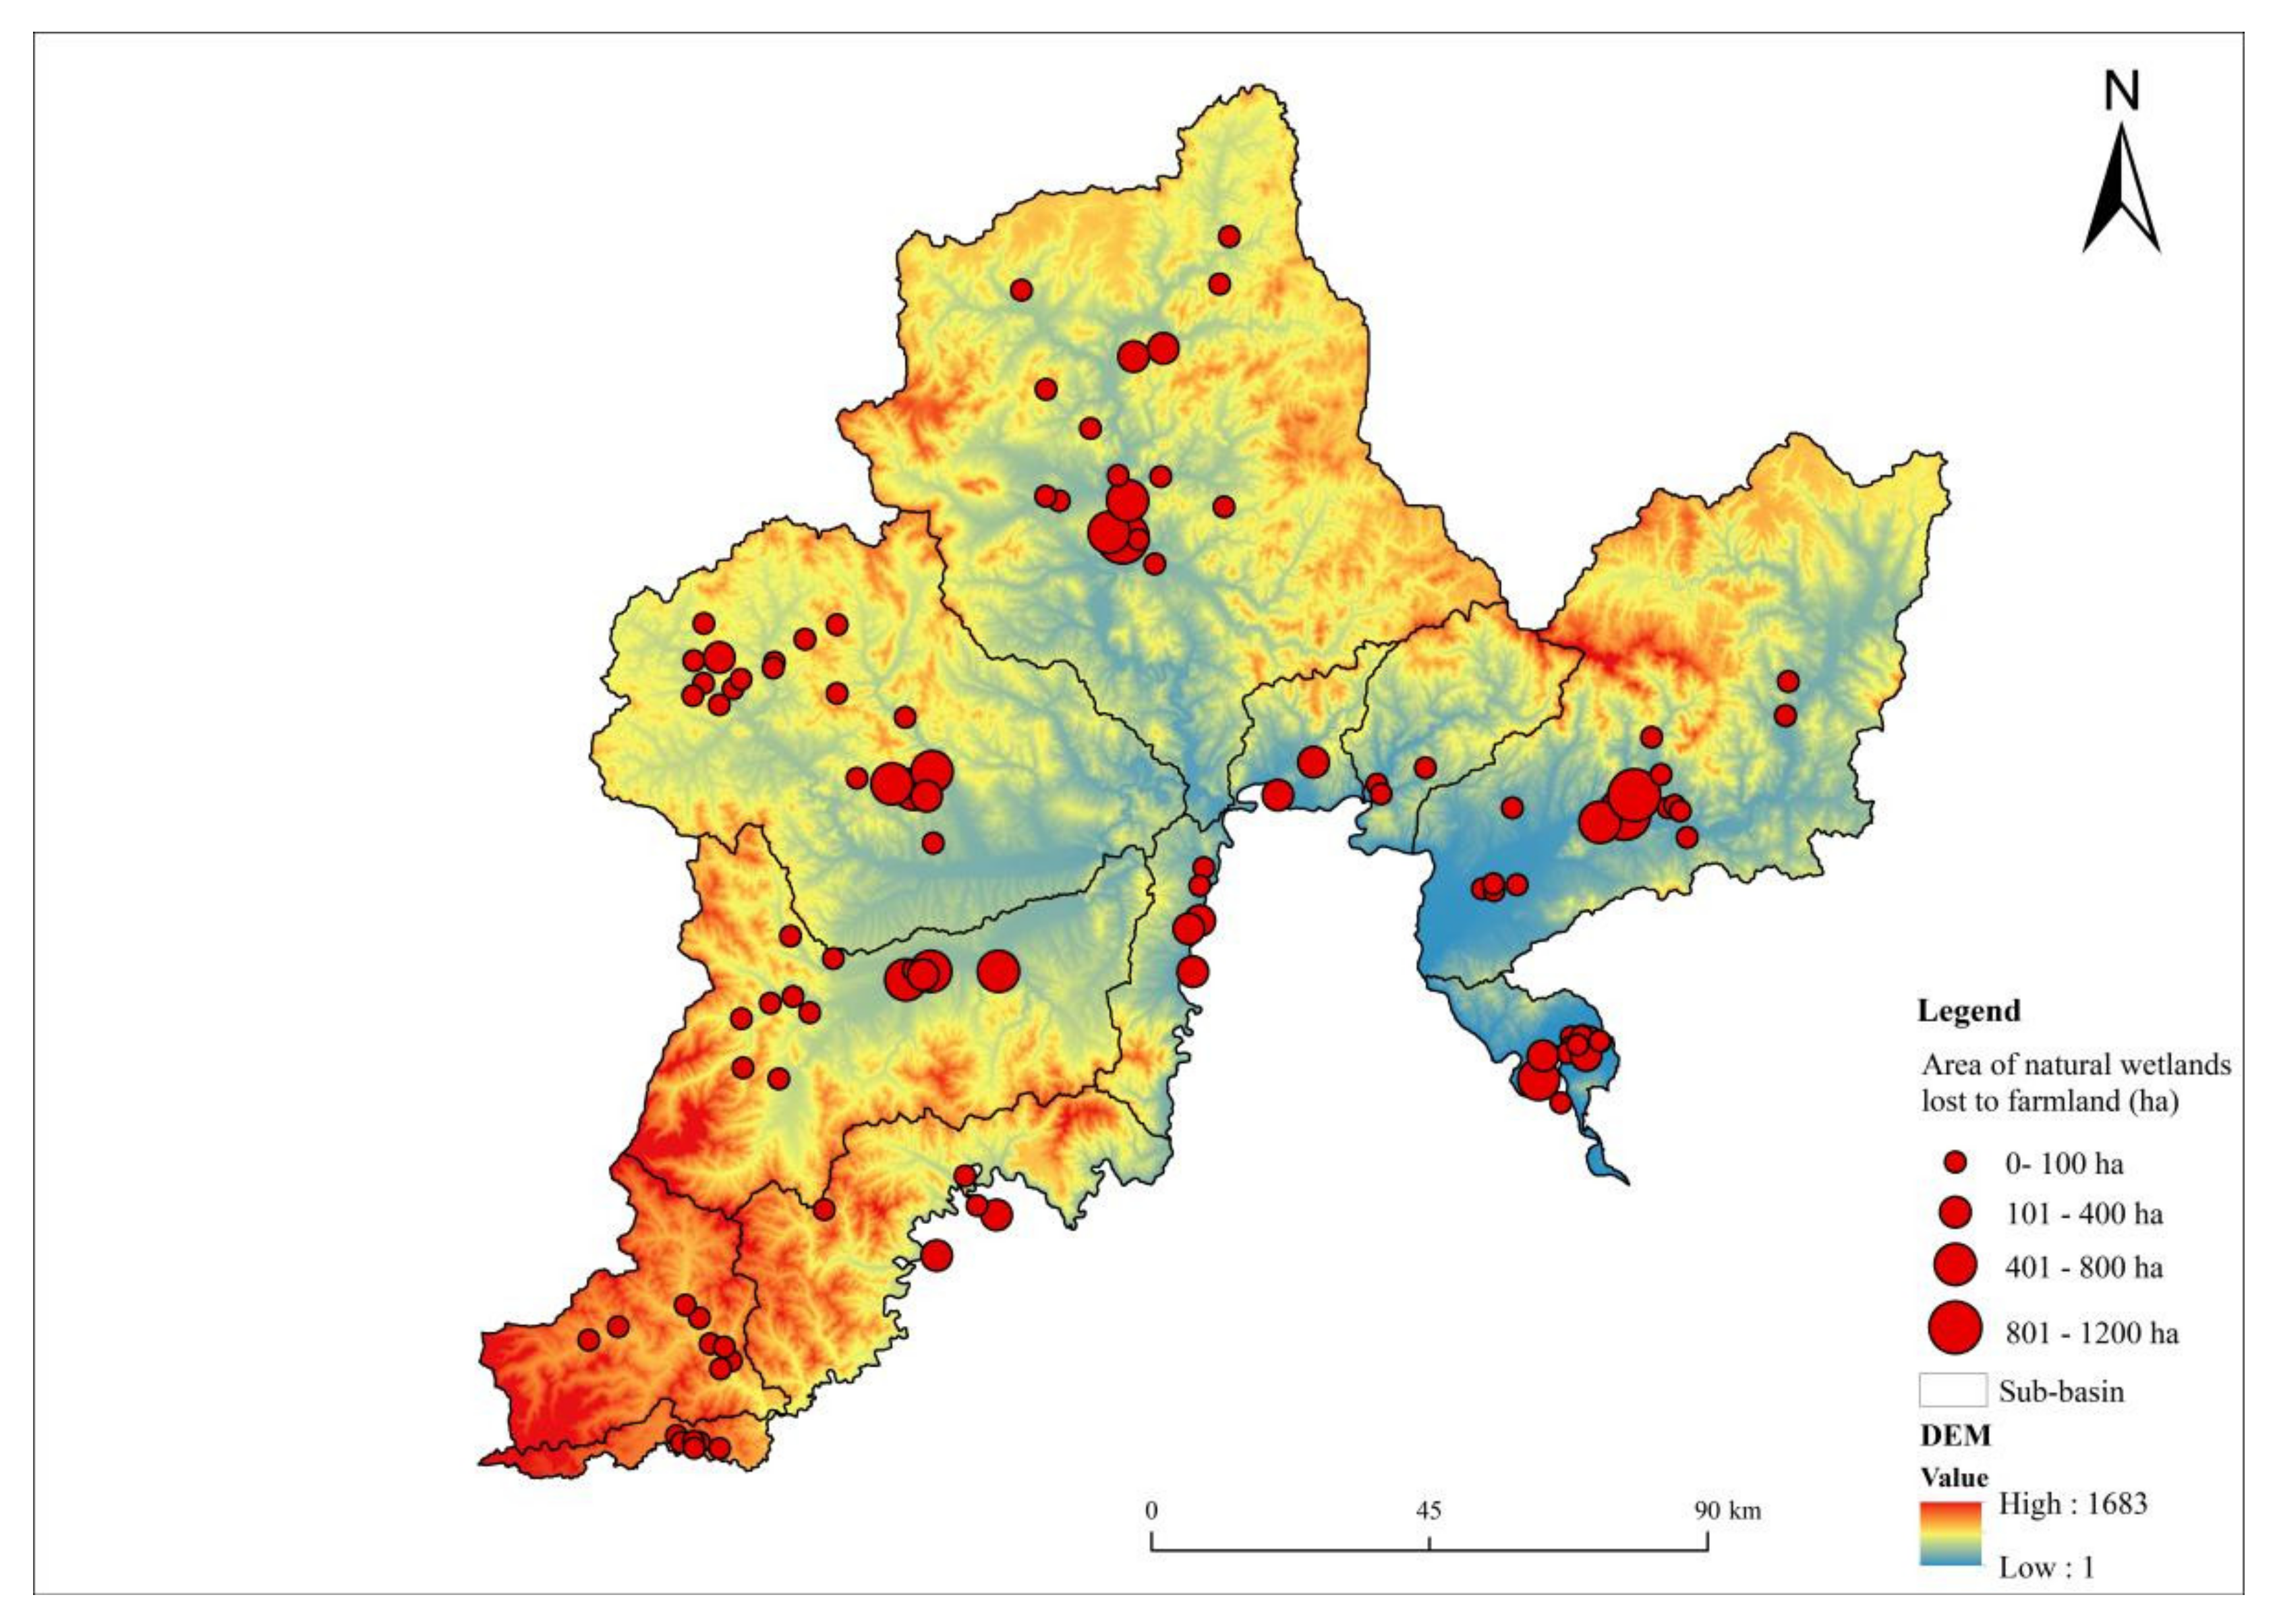
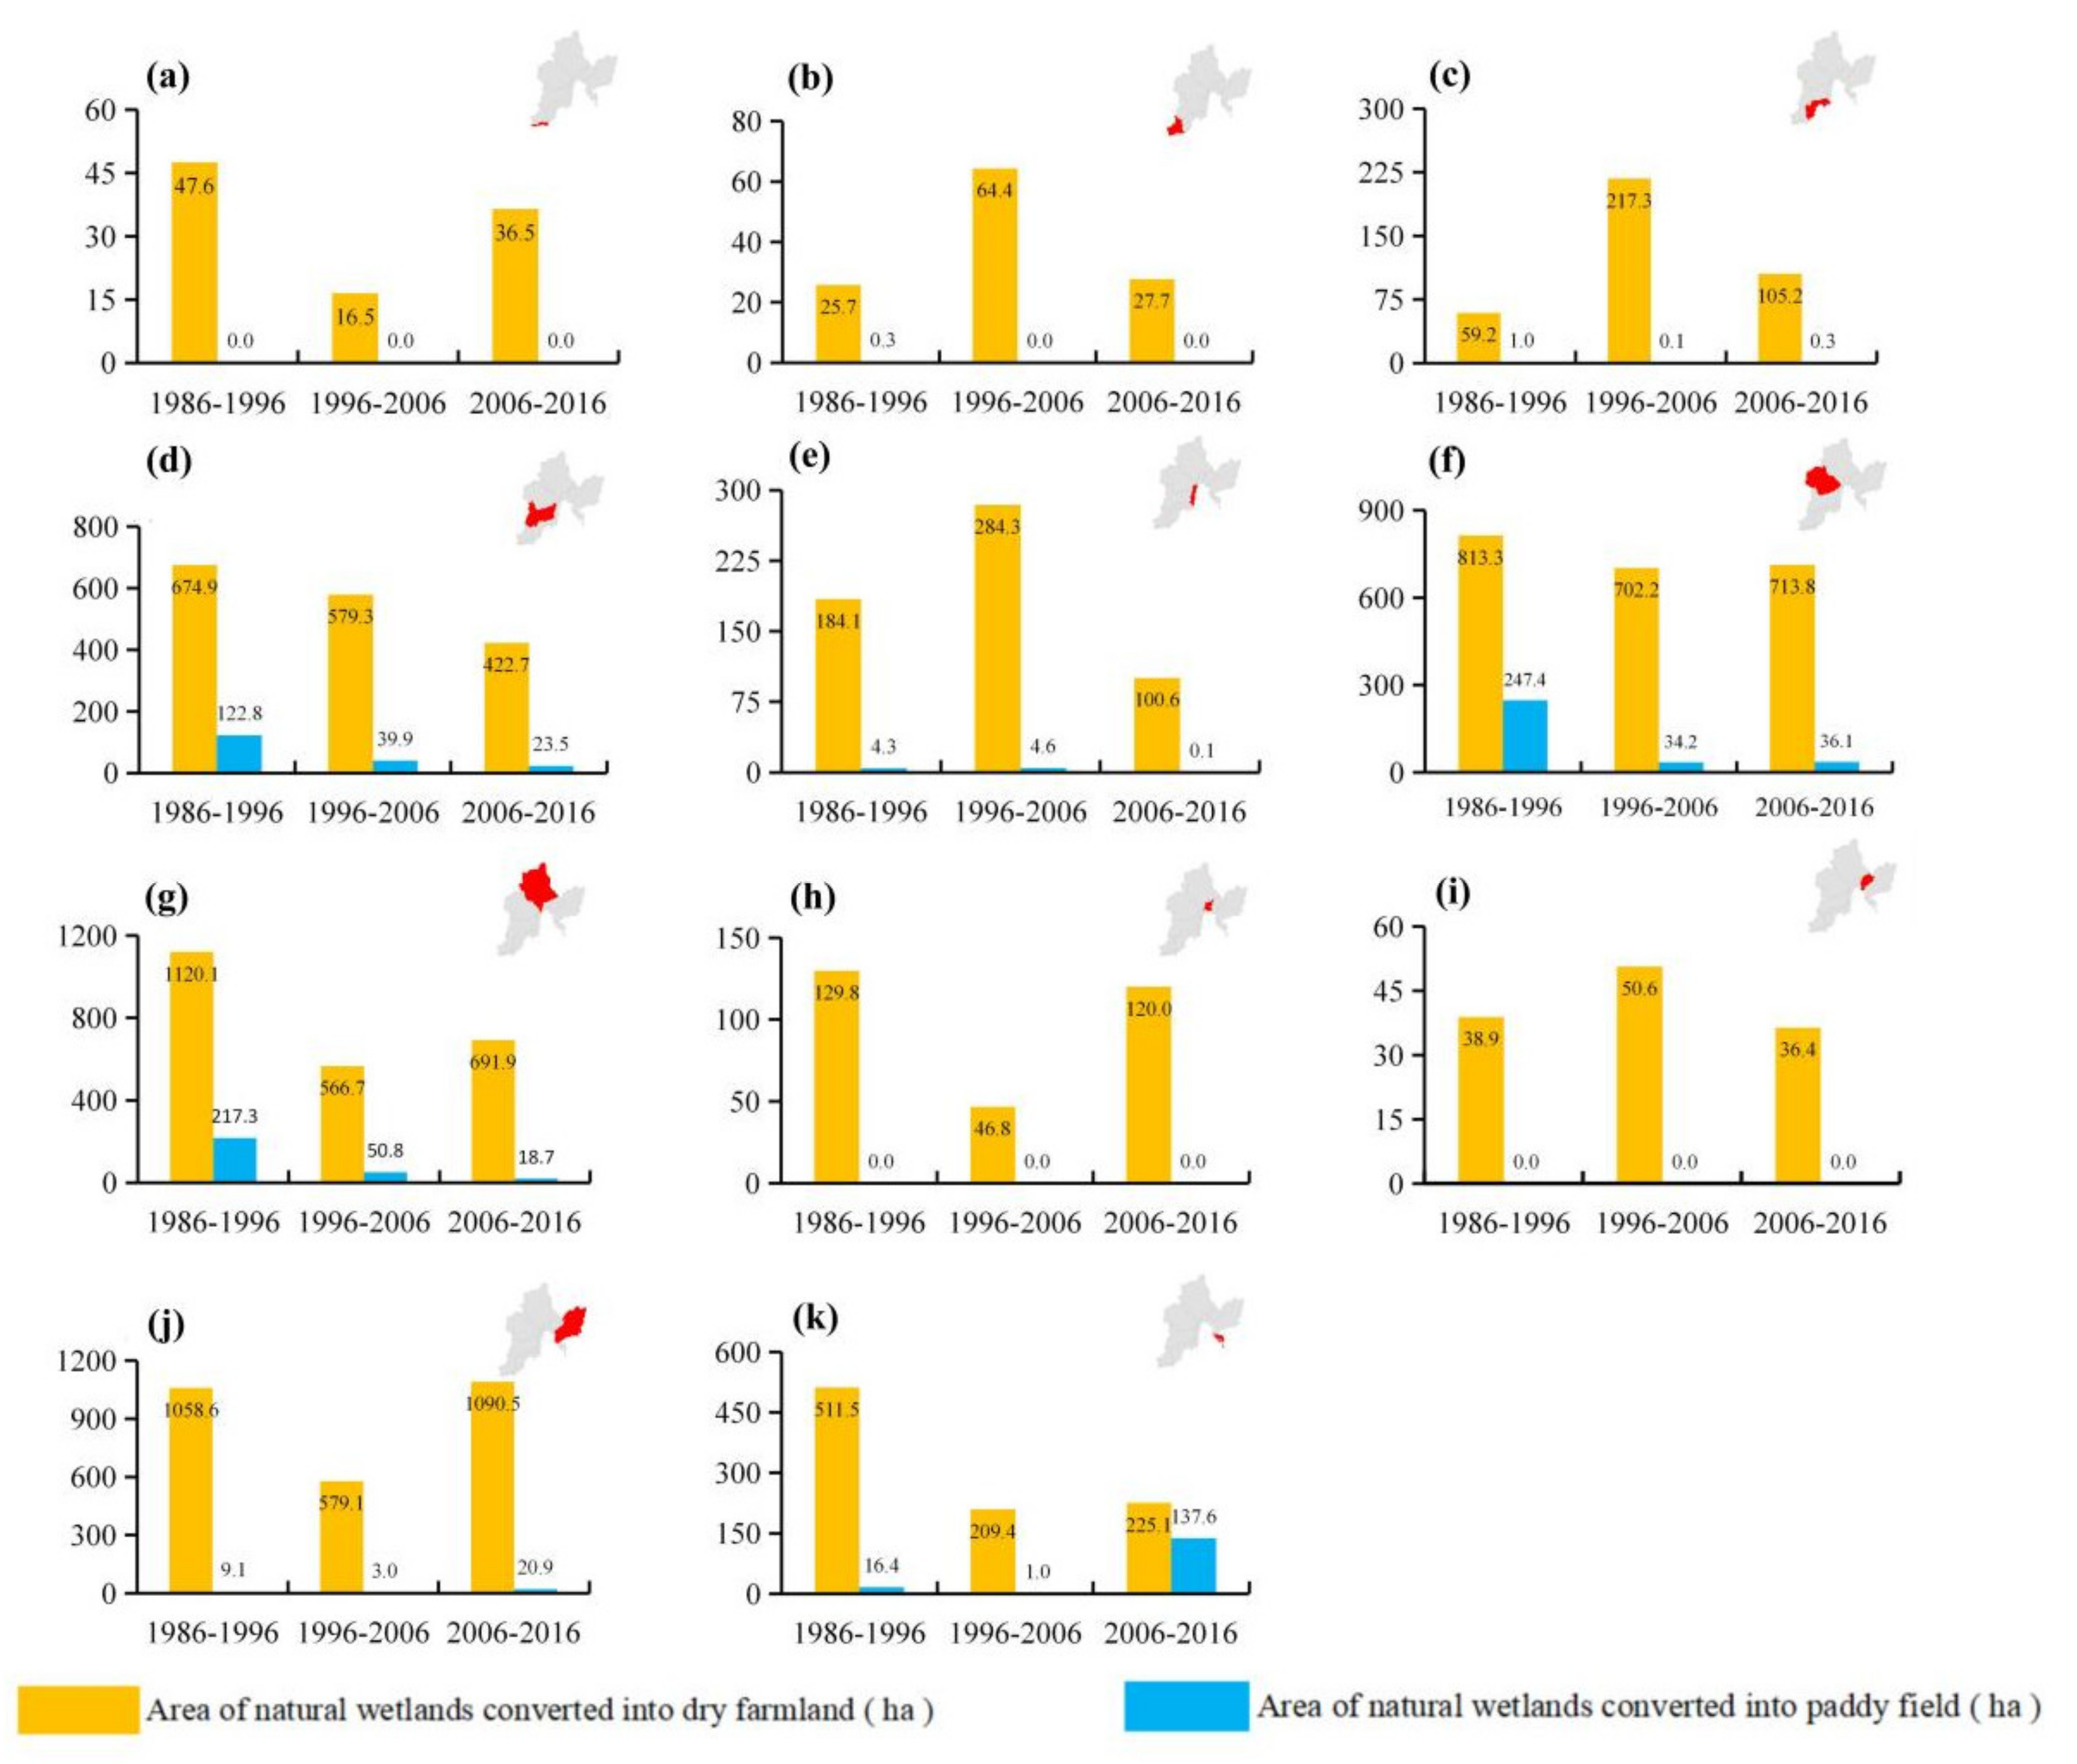
3.2. Spatial and Temporal Changes of Natural Wetlands Converted into Farmland

As shown in Figure 4, the natural wetlands converted into farmland are clustered and distributed in the lower reaches of the TRB and dispersed in the upper and middle reaches of the TRB.
As shown in Figure 5a–k, HCH has the largest area of natural wetland converted into farmland (2761.2 ha, 22.0%), followed by GYH (2665.5 ha, 21.3%), BHH (2546.9 ha, 20.3%), and HLJ (1863.2 ha, 14.9%). The agricultural erosion percent of natural wetlands in MJ (126.0 ha, 1.0%), HQH (118.1 ha, 0.9%), and GPG (100.6 ha, 0.8%) was ≤1%. Specifically, almost all eroded natural wetlands were cultivated as dry farmland (11550.8 ha, 92.1%), of which the largest area was in HCH (2728.2 ha, 23.6%), followed by GYH (2378.7 ha, 20.6%) and BHH (2229.3 ha, 19.3%). The conversion of natural wetlands into paddy fields (989.3 ha) mainly took place in BHH (317.6 ha, 32.1%), GYH (286.9 ha, 29.0%), and HLJ (186.3 ha, 18.8%). In YQG (8.9 ha, 0.9%), LDH (1.4 ha, 0.1%), and HQH (0.3 ha, 0.0%), almost no natural wetlands were reclaimed into paddy fields, while in GPG, STH, and MJ, no natural wetlands were reclaimed into paddy fields.

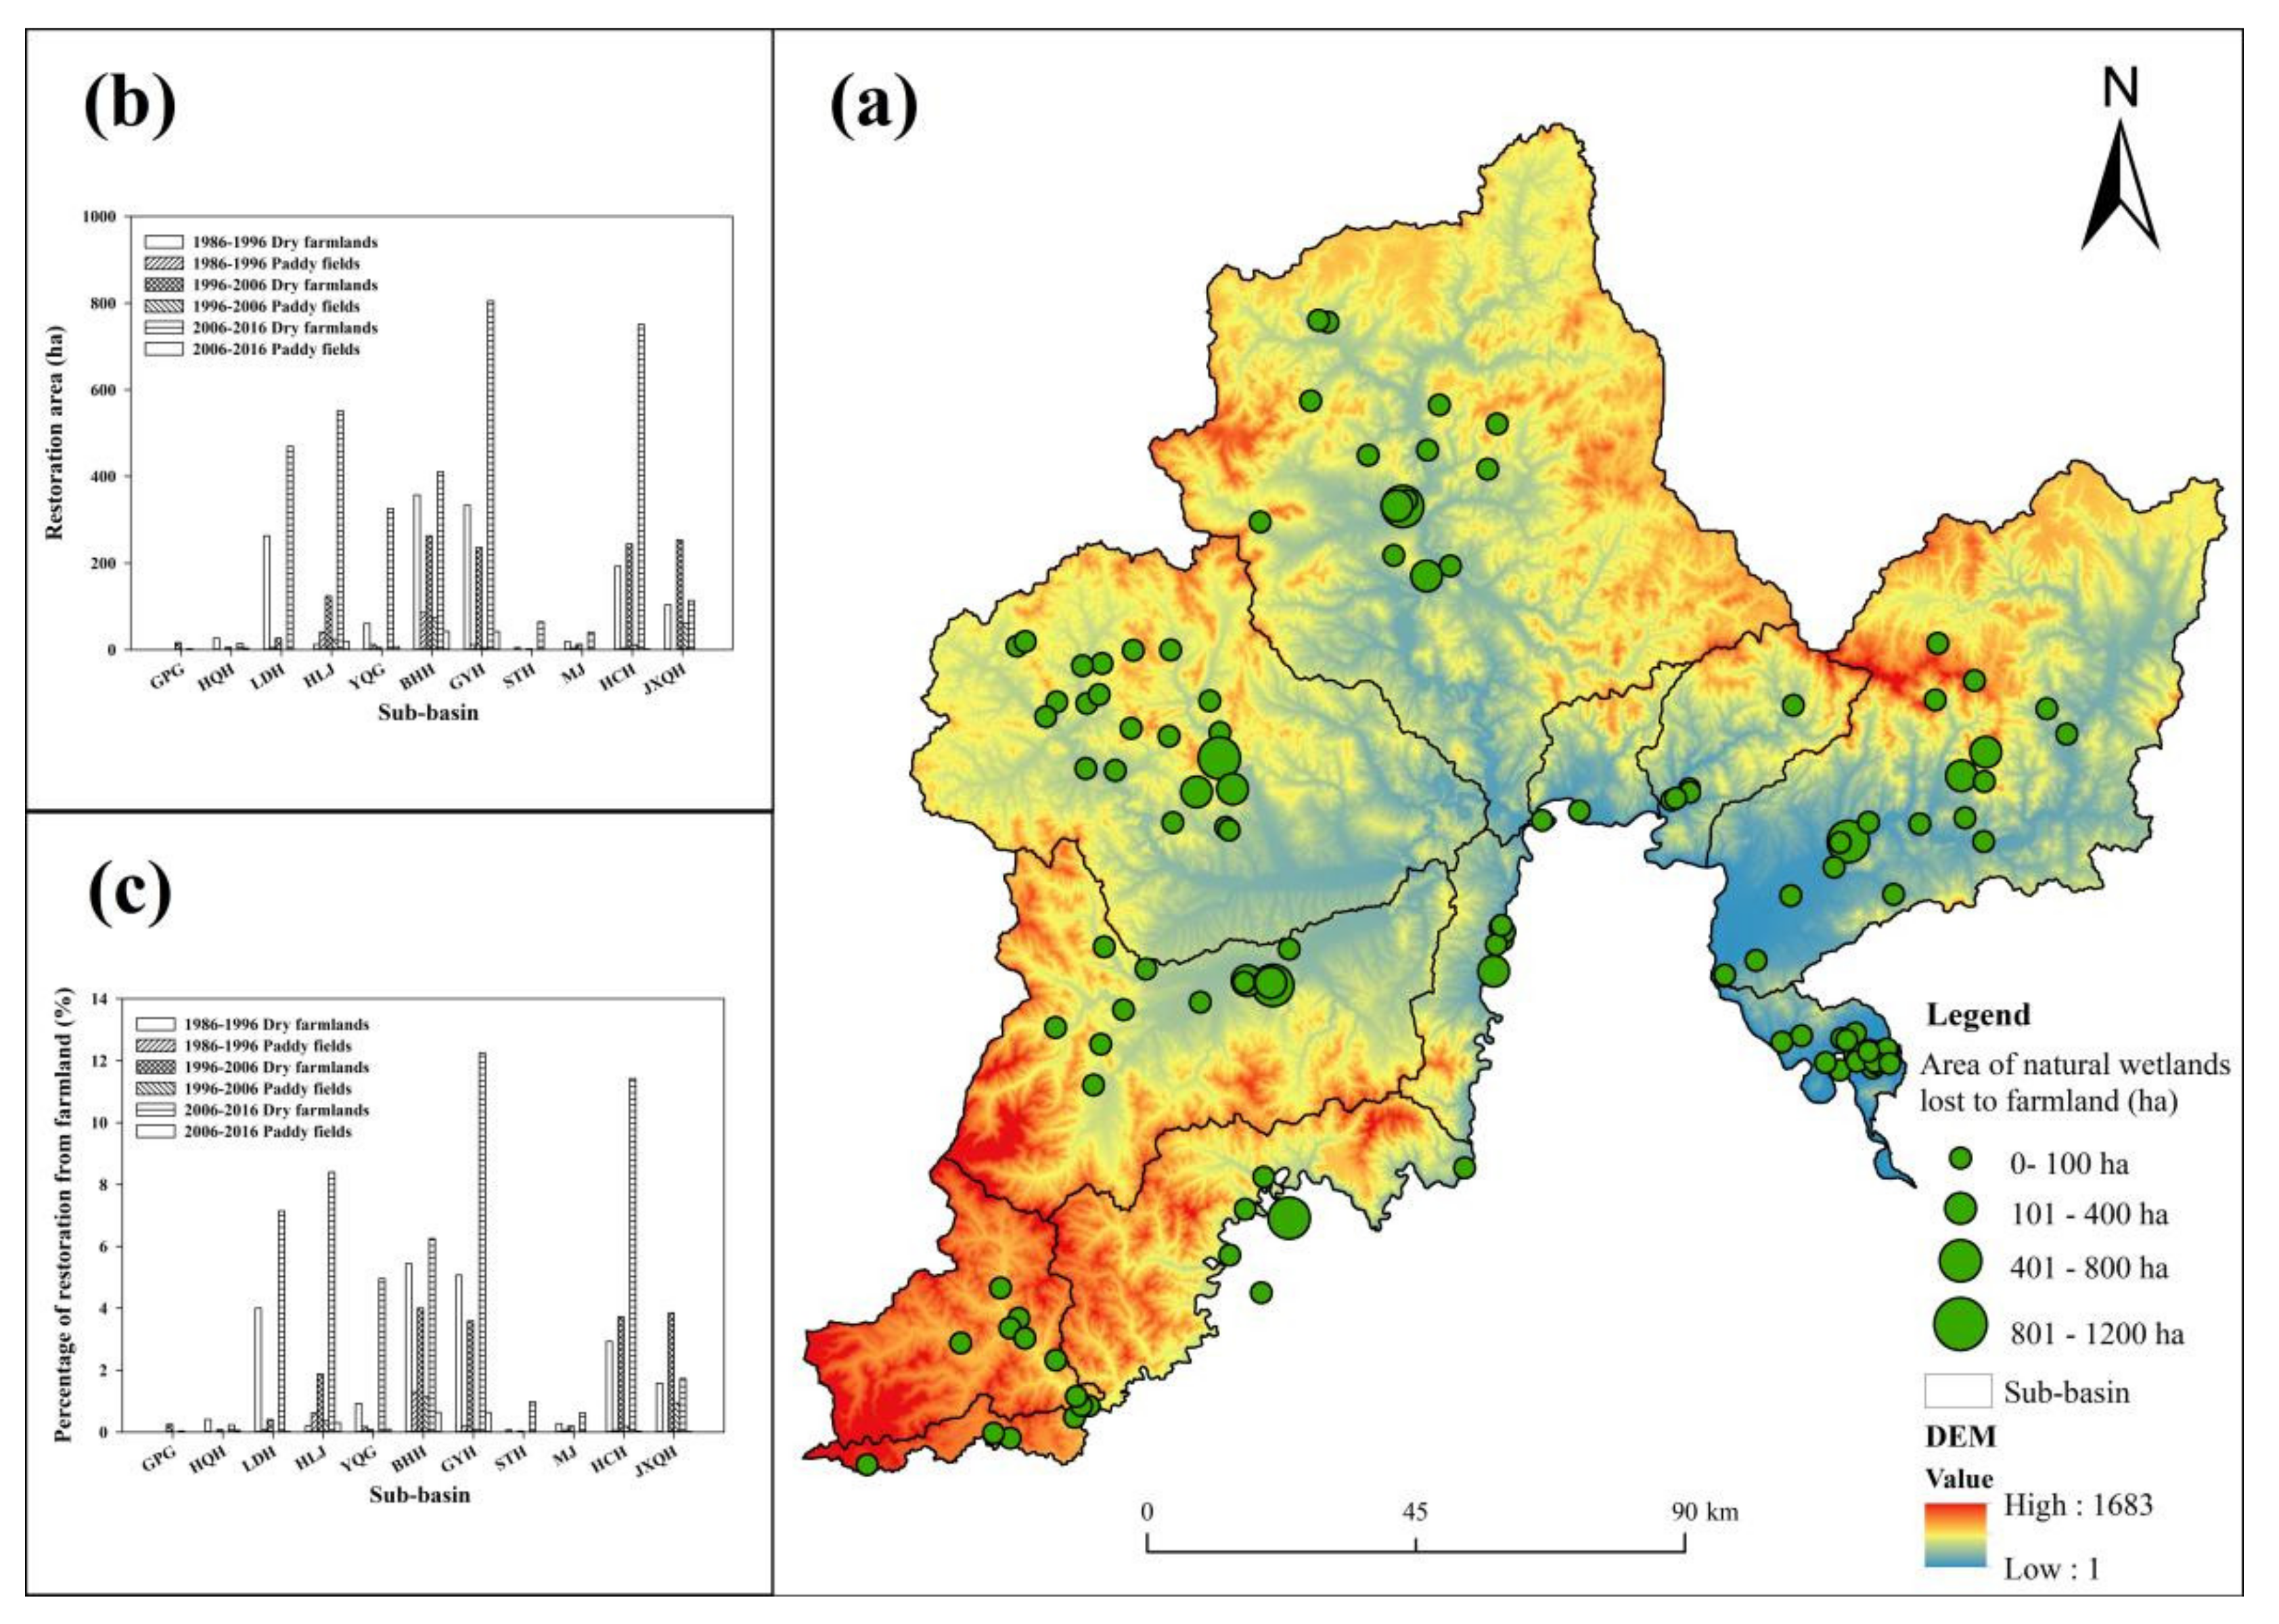
3.3. Spatial and Temporal Changes in Farmland Converted into Natural Wetlands

Natural wetlands restored from farmland were mostly observed in the middle and lower reaches of the TRB (Figure 6a). Between 1986 and 2016, 6571.4 ha of natural wetlands were recovered from farmland. Specifically, 1365.6 ha (23.4%) of natural wetlands were recovered from farmland between 1986 and 1996, and 1536.3 ha (20.8%) between 1996 and 2006. However, between 2006 and 2016, 3669.5 ha of natural wetlands were restored from farmland, accounting for 55.8% of the total restored area in the past three decades.
At the sub-basin scale, 21.8% of the total natural wetlands restored from farmland were observed in GYH (1433.0 ha) (Figure 6b,c). The restored areas of BHH 1233.5 ha (18.8%) and HCH 1204.4 ha (18.3%) were similar. Due to the minimal agricultural encroachment in GPG, HQH, STH, and MJ, almost no restoration of natural wetlands occurred in these four sub-basins. During the three decades observed, significant increases in the area of natural wetlands restored from farmland were documented in five sub-basins, including HCH (556.5 ha), HLJ (518.2 ha), GYH (501.5 ha), YQG (259.7 ha), and LDH (203.4 ha). Most of these natural wetlands (93.0%) were restored from dry farmland.

4. Discussion

4.1. Mapping Natural Wetlands and Farmland Based on Remote Sensing

This study proposed a long-term detection method of land-use/land-cover changes in the wetland landscape of the TRB. The OBIA-RF generated a consistent interannual land-use/land-cover distribution map from 1986 to 2016. Early research on wetland classification in the TRB mostly used supervised classification [25] and OBIA [35]. These not only made full use of an image’s spectral information but integrated spatial information into the classification by fully combining rule-based RF classification. This solves the classification problem of complex landscape types, such as the TRB [36]. In addition, the OBIA greatly reduced errors caused by the spatial mismatch of multi-temporal images and used 478 field verification points to correct misclassification [37]. Compared with the traditional vision correction method, this method greatly improved the classification accuracy and production efficiency.

4.2. The Driving Forces for the Conversion of Natural Wetlands into Farmland in the TRB

The conversion of natural wetlands into farmland is influenced by both natural factors and human factors. Natural factors include changes in average annual temperature and precipitation, and human factors include the Han-Chinese agricultural population, the Korean-Chinese agricultural population, and grain production in the TRB. We used the R project to analyze the five driving factors of the conversion of natural wetlands into farmland at the TRB scale and the scale of the 11 sub-basins. At the TRB scale, grain output by the Korean-Chinese agricultural population has the greatest human impact on the conversion of natural wetlands to farmland (Figure 7). This is due to the distinct Korean cultural characteristics of the TRB, which include paddy field development and rice production. The farmers from the Korean peninsula in Joseon Dynasty brought their traditional rice planting technology with them to the area. Rice is often grown in waterlogged areas and near water sources. The TRB is rich in water resources, providing unique natural conditions for the reclamation of paddy fields, leading to the large number of natural wetlands that have been reclaimed for rice production [38]. The Korean-Chinese also grows xerophytic cereal, such as corn and soybeans. Jilin province is now a major agricultural province, with its agricultural success closely related to the exploration, practice, and accumulated experience of Korean-Chinese rice production. Since China and South Korea formally established diplomatic relations in 1992, Korean-Chinese farmers have increasingly sought nontraditional livelihoods. Diversified development means that many rural Korean-Chinese farmers have gradually abandoned rice cultivation, have gradually moved out of rural villages, and have migrated to South Korea to seek employment [39,40]. This decrease in the agricultural labor force of the TRB has led to a reduction in farmland cultivation. Therefore, economic and lifestyle changes among the Korean-Chinese agricultural population had the greatest impact on the conversion of natural wetland to cultivated land and the restoration of wetlands at the scale of the TRB.
However, the forces driving the transformation from natural wetland to farmland differ slightly in each of the sub-basins. BHH, HLJ, and STH were most affected by natural factors, while GPG, HQH, LDH, YQG, GYH, MJ, HCH, and JXQH were most affected by human factors, specifically the number of Korean-Chinese agricultural population and the number of Han-Chinese agricultural population (Figure 8). In BHH, HLJ, and STH, average annual temperature and average annual precipitation had the greatest impact on the conversion of natural wetlands into farmland. These three sub-basins were traditional granaries in the TRB and were affected by human activities earlier. The area of farmland in the watershed is relatively high and, therefore, not very sensitive to human disturbance. On the other hand, agricultural irrigation, and paddy fields, in particular, require a large number of water resources, thus reducing groundwater and surface runoff. An increase in average annual precipitation meets the demand for water resources and has provided favorable natural conditions for the conversion of natural wetlands into farmland. However, an increase in average annual temperature has led to an increase in potential evapotranspiration, and the demand for water resources has not been met, resulting in a decline in grain output. Farmers no longer clear new land for cultivation, thus limiting the conversion of natural wetlands to farmland. The other eight sub-basins are subject to human-made disturbances at the same scale as the entire TRB, indicating that grain output has the greatest impact on the conversion of natural wetlands into farmland in the TRB.

4.3. Implications of Natural Wetland Management

As shown in Figure 6, from 1986 to 2016, 6571.4 ha of natural wetlands were restored from farmland. The restored area in LDH was nearly double the area lost, while the restored proportion of natural wetlands in YQG, GYH, and MJ reached more than 50%. Wetland rehabilitation was promoted by a series of projects issued at the national and local government levels.
In 2000, 17 departments of the State Council jointly promulgated the Action Plan for Wetland Protection in China [41,42]. The National Wetland Conservation Project Plan (2004–2030), approved by China’s State Council, aims to establish 713 wetland reserves, including 80 of international importance. During this period, the TRB was established with five reserves and wetland parks with a total area of 13815.5 ha, including one national reserve (Jilin Yuan Pool) and two national wetland parks (Jilin Wangqing Gaya River National Wetland Park and Jilin Helong Quanshui River National Wetland Park) [42]. In 2011, the government of China created national key ecological regions, including the Changbai Mountain Forest Ecological Function Zone. The purpose of these regions is to protect and repair the ecological environment, promote forest ecological resource protection, maintain and restore wetlands, and strictly control and protect the water conservation functions of the natural vegetation, the source of the Tumen River, where the upstream region of the small basin governance provides the help [43]. In 2016, China established the 14,600 km2 Northeast Tiger Leopard National Park, effectively promoting an innovative system of environmental protection and natural resource asset management, which achieved a unified, standardized, and efficient management strategy [44]. Thus far, the managed protection of the natural wetland landscape has achieved sound results.
Despite the government’s conservation and restoration efforts, 5968.7 ha, or nearly half of the natural wetlands in the TRB lost to reclamation, have not been restored. Therefore, both the ecological function and biodiversity of wetlands are in decline, thus jeopardizing local lives and livelihoods and threatening sustainable economic development [2]. Priority must be given to the restoration of those sub-basins that have sustained the loss of large areas of natural wetland. For instance, in the past 30 years, HCH has undergone the largest reclamation of natural wetland (2761.2 ha). However, the area of restored wetland is less than half of the area lost to farmland (1204.4 ha). The restoration of natural wetlands should be strengthened in HCH because of the establishment of the Northeast Tiger Leopard National Park and the restoration of 741 ha of ecological area, thus making the restoration of natural wetlands easier [45]. An important step toward the sustainable development of the wetland ecosystem in the TRB is prioritizing the restoration of important wetlands that currently have seriously degraded ecological functions. This would involve increasing ecological investment, providing farmers with ecological compensation, strictly controlling the trend toward increased wetland area shrinkage and landscape fragmentation, building wetland ecological corridors and protection networks, improving the quality and stability of wetland ecosystems, and gradually restoring wetland ecological functions, as well as forming a multi-point ecological protection and governance of nature reserves, wetland parks, and important wetlands [46,47].

4.4. Future Perspectives

This study had several limitations. Remote sensing images are the basic data in the study of landscape patterns, and the quality directly determines the complete effect of the follow-up work. Given the study period, the resolution of remote sensing data was low. This required the use of the OBIA framework due to the lack of data, and such problems as classification accuracy. Future research should employ multi-source remote sensing data, such as Sentinel-2A, to resolve this problem.

5. Conclusions

The spatiotemporal patterns of the conversion from natural wetlands to farmland in the TRB were revealed in this study based on object-oriented classification and the RF approach. The study revealed that, between 1986 and 2016, nearly half of the natural wetlands in the TRB were reclaimed as farmland and for agricultural activities. From the perspective of the entire TRB, the conversion from natural wetlands to farmland was affected by changes in agricultural practices among the local Korean-Chinese population. In contrast, the driving forces for conversion from natural wetlands to farmland varied at the sub-basin scale. Among the eight sub-basins (GPG, HQH, LDH, YQG, GYH, MJ, HCH, and JXQH) that were previously less affected by human activities, the area of natural wetland converted into farmland is mainly affected by the agricultural activities of the Korean-Chinese agricultural population and the Han-Chinese agricultural population. In the three sub-basins (BHH, HLJ, and STH) that were previously heavily influenced by human activities, the area of natural wetland converted into farmland is mainly affected by natural factors such as average annual temperature and average annual precipitation. In addition, sub-basin HCH has undergone a loss of a large area of the natural wetland due to reclamation, and priority should be given to restoring this sub-basin. This study provides important information necessary for wetland conservation and restoration policies in the TRB. At the same time, this study also has reference significance for natural wetland management in other river basins.

Author Contributions

Conceptualization, Y.L.; methodology, Y.L. and R.J.; software, Y.L.; validation, Y.L. and R.J.; formal analysis, Y.L.; investigation, Y.L. and R.J.; resources, R.J.; data curation, Y.L.; writing—original draft preparation, Y.L.; writing—review and editing, Y.L. and R.J.; visualization, Y.L.; supervision, R.J.; project administration, R.J. and W.Z. All authors have read and agreed to the published version of the manuscript.

Funding

This research was funded by National Natural Science Foundation of China (41830643, 41807508, 41771109), the Ministry of Science and Technology of the People’s Republic of China (2019FY101703), and Jilin Provincial Science and Technology Department Project (20200403030SF).

Institutional Review Board Statement

Not applicable.

Informed Consent Statement

Not applicable.

Data Availability Statement

Not applicable.

Acknowledgments

We gratefully thank Da Zhang, Hua Cui, Coombes, and National Forestry and Grassland Administration Key Laboratory for Conservation Ecology in the Northeast Tiger and Leopard National Park, for their help in this study.

Conflicts of Interest

The authors declare no conflict of interest.

References

  1. Mao, D.H.; Wang, Z.M.; Wu, J.G.; Wu, B.F.; Zeng, Y.; Song, K.S.; Yi, K.P.; Luo, L. China’s wetlands loss to urban expansion. Land Degrad. Dev. 2018, 29, 2644–2657. [Google Scholar] [CrossRef]
  2. Xue, Z.S.; Zou, Y.C.; Zhang, Z.S.; Lyu, X.G.; Jiang, M.; Wu, H.T.; Liu, X.H.; Tong, S.Z. Reconstruction and future prediction of the distribution of wetlands in China. Earth’s Future 2018, 6, 1491–1629. [Google Scholar] [CrossRef]
  3. Zou, Y.C.; Duan, X.; Xue, Z.S.; E, M.; Sun, M.Y.; Lv, X.G.; Jiang, M.; Yu, X.F. Water use conflict between wetland and agriculture. J. Environ. Manag. 2018, 224, 140–146. [Google Scholar] [CrossRef]
  4. Yu, X.F.; E, M.Y.; Sun, M.Y.; Xue, Z.S.; Lu, X.G.; Jiang, M.; Zou, Y.C. Wetland recreational agriculture: Balancing wetland conservation and agro-development. Environ. Sci. Policy 2018, 87, 11–17. [Google Scholar] [CrossRef]
  5. Vanessa, R.; Virgilio, H.; Hamilton, S.K.; Douglas, W.; Etienne, F.C.; Bernhard, L.; Simon, L. A Global assessment of inland wetland conservation status. Bioence 2017, 67, 523–533. [Google Scholar]
  6. Davidson, N.C.; Finlayson, C.M. Extent, regional distribution and changes in area of different classes of wetland. Mar. Freshw. Res. 2018, 69, 1525–1533. [Google Scholar] [CrossRef] [Green Version]
  7. Jia, P.; Jin, W. The situation, problems and countermeasures surrounding wetland protection legislation in China. Resour. Sci. 2017, 39, 795–804. [Google Scholar]
  8. Mao, D.H.; Luo, L.; Wang, Z.M.; Wilson, M.C.; Zeng, Y.; Wu, B.F.; Wu, J.G. Conversions between natural wetlands and farmland in China: A multiscale geospatial analysis. Sci. Total Environ. 2018, 634, 550–560. [Google Scholar] [CrossRef]
  9. Meng, B.; Liu, J.-l.; Bao, K.; Sun, B. Water fluxes of Nenjiang River Basin with ecological network analysis: Conflict and coordination between agricultural development and wetland restoration. J. Clean. Prod. 2019, 213, 933–943. [Google Scholar] [CrossRef]
  10. Li, D.; Tian, P.; Luo, Y.; Dong, B.; Cui, Y.; Khan, S. Importance of stopping groundwater irrigation for balancing agriculture and wetland ecosystem. Ecol. Indic. 2021, 127, 107747. [Google Scholar] [CrossRef]
  11. Mirzaei, A.; Zibaei, M. Water conflict management between agriculture and wetland under climate change: Application of economic-hydrological-behavioral modelling. Water Resour. Manag. 2021, 35, 1–21. [Google Scholar] [CrossRef]
  12. Tian, Y.L.; Luo, L.; Mao, D.H.; Wang, Z.M.; Li, L.; Liang, J.P. Using Landsat images to quantify different human threats to the Shuangtai Estuary Ramsar site, China. Ocean Coast. Manag. 2017, 135, 56–64. [Google Scholar] [CrossRef]
  13. Niu, Z.G.; Gong, P.; Cheng, X. Wetland remote sensing mapping and geographical characteristics analysis in China. Sci. China Ser. D Earth Sci. 2009, 39, 188–203. [Google Scholar]
  14. Niu, Z.G.; Zhang, H.Y.; Wang, X.W.; Yao, W.B.; Zhou, D.M.; Zhao, K.Y.; Zhao, H.; Li, N.N.; Huang, H.B.; Li, C.C. Mapping wetland changes in China between 1978 and 2008. China Sci. Bull. 2012, 57, 2813–2823. [Google Scholar] [CrossRef] [Green Version]
  15. Chen, G.; Bu, K. Wetland extraction method combined with Sentinel-2 and AW3D30 data. Bull. Surv. Mapp. 2020, 0, 19–22. [Google Scholar] [CrossRef]
  16. Meisam, A.; Sahel, M.; Olivier, B. Supervised wetland classification using high spatial resolution optical, SAR, and LiDAR imagery. J. Appl. Remote Sens. 2020, 14, 024502. [Google Scholar] [CrossRef]
  17. Zhang, X.; Xu, J.; Chen, Y.; Xu, K.; Wang, D. Coastal wetland classification with GF-3 polarimetric SAR imagery by using object-oriented random forest algorithm. Sensors 2021, 21, 3395. [Google Scholar] [CrossRef] [PubMed]
  18. Maleki, S.; Soffianian, A.R.; Koupaei, S.S.; Baghdadi, N.; El-Hajj, M.; Sheikholeslam, F.; Pourmanafi, S. Wetland restoration prioritization using artificial neural networks. Wetlands 2020, 40, 179–192. [Google Scholar] [CrossRef]
  19. Geng, R.; Jin, S.; Fu, B.; Wang, B. Object-based wetland classification using multi-feature combination of ultra-high spatial resolution multispectral images. Can. J. Remote Sens. 2020, 46, 784–802. [Google Scholar] [CrossRef]
  20. He, Z.; Shi, Q.; Liu, K.; Cao, J.; Zhan, W.; Cao, B. Object-oriented mangrove species classification using hyperspectral data and 3-D Siamese residual network. IEEE Geosci. Remote Sens. Lett. 2020, 17, 2150–2154. [Google Scholar] [CrossRef]
  21. Mao, D.H.; Wang, Z.M.; Du, B.J.; Li, L.; Tian, Y.L.; Jia, M.M.; Zeng, Y.; Song, K.S.; Jiang, M.; Wang, Y.Q. National wetland mapping in China: A new product resulting from object-based and hierarchical classification of Landsat 8 OLI images. ISPRS J. Photogramm. Remote Sens. 2020, 164, 11–25. [Google Scholar] [CrossRef]
  22. Tian, Y.L.; Jia, M.M.; Wang, Z.M.; Mao, D.H.; Du, B.J.; Wang, C. Monitoring invasion process of Spartina alterniflora by seasonal Sentinel-2 imagery and an object-based random forest classification. Remote Sens. 2020, 12, 1383. [Google Scholar] [CrossRef]
  23. Jia, M.M.; Mao, D.H.; Wang, Z.M.; Ren, C.Y.; Zhu, Q.D.; Li, X.C.; Zhang, Y.Z. Tracking long-term floodplain wetland changes: A case study in the China side of the Amur River Basin. Int. J. Appl. Earth Obs. Geoinf. 2020, 92, 102185. [Google Scholar] [CrossRef]
  24. Zhang, Y.; Jin, R.; Zhu, W.; Zhang, D.; Zhang, X. Impacts of land use changes on wetland ecosystem services in the Tumen River Basin. Sustainability 2020, 12, 9821. [Google Scholar] [CrossRef]
  25. Zheng, X.J.; Sun, P.; Zhu, W.H.; Xu, Z.; Fu, J.; Man, W.D.; Li, H.L.; Zhang, J.; Qin, L. Landscape dynamics and driving forces of wetlands in the Tumen River Basin of China over the past 50 years. Landsc. Ecol. Eng. 2017, 13, 237–250. [Google Scholar] [CrossRef]
  26. Jin, J.H. Exploration of the Modern Korean and the Rice Culture in Jilin Area; Jilin University: No.2699 Qianjin Street Changchun City, China, 2012. [Google Scholar]
  27. Nan, Y.; Ji, Z.; Dong, Y.H.; Ni, X.J. Study of land use/cover dynamic change in Tumen River across national border region during the last 30 years. J. Nat. Sci. Hunan Norm. Univ. 2012, 35, 82–89. [Google Scholar]
  28. Zhu, W.H.; Miao, C.Y.; Zheng, X.J.; Cao, G.L.; Wang, F.F. Study on ecological safety evaluation and warning of wetlands in Tumen River watershed based on 3S technology. Acta Ecol. Sin. 2014, 34, 1379–1390. [Google Scholar]
  29. Jin, Y.H.; Liu, X.P.; Chen, Y.M.; Liang, X. Land-cover mapping using random forest classification and incorporating NDVI time-series and texture: A case study of central Shandong. Int. J. Remote Sens. 2018, 39, 1102–1124. [Google Scholar] [CrossRef]
  30. Ma, L.; Schmitt, M.; Zhu, X. Uncertainty analysis of object-based land-cover classification using Sentinel-2 time-series data. Remote Sens. 2020, 12, 3798. [Google Scholar] [CrossRef]
  31. Liu, J.T.; Feng, Q.L.; Gong, J.H.; Zhou, J.P.; Li, Y. Land-cover classification of the Yellow River Delta wetland based on multiple end-member spectral mixture analysis and a random forest classifier. Int. J. Remote Sens. 2016, 37, 783–802. [Google Scholar] [CrossRef]
  32. Jia, K.; Liu, J.C.; Tu, Y.X.; Li, Q.Z.; Sun, Z.W.; Wei, X.Q.; Yao, Y.J.; Zhang, X.T. Land use and land cover classification using Chinese GF-2 multispectral data in a region of the North China Plain. Front. Earth Sci. 2019, 13, 327–335. [Google Scholar] [CrossRef]
  33. Rosalind, K.H.; Marie-Therese, P.; Markus, N.; Graeme, D.R. Underestimation of Pearson’s product moment correlation statistic. Oecologia 2018, 189, 1–7. [Google Scholar] [CrossRef] [Green Version]
  34. Edelmann, D.; Móri, T.F.; Székely, G.J. On relationships between the Pearson and the distance correlation coefficients. Stat. Probab. Lett. 2021, 169, 108960. [Google Scholar] [CrossRef]
  35. Xiang, H.X.; Jia, M.M.; Wang, Z.M.; Li, L.; Mao, D.H.; Zhang, D.; Cui, G.S.; Zhu, W.H. Impacts of land cover changes on ecosystem carbon stocks over the Transboundary Tumen River Basin in Northeast Asia. China Geogr. Sci. 2018, 28, 973–985. [Google Scholar] [CrossRef] [Green Version]
  36. Yu, H.N.; Li, L.; Zhu, W.H.; Piao, D.F.; Cui, G.S.; Kim, M.; Jeon, S.W.; Lee, W.-K. Drought monitoring of the wetland in the Tumen River Basin between 1991 and 2016 using Landsat TM/ETM+. Int. J. Remote Sens. 2018, 40, 1445–1459. [Google Scholar] [CrossRef]
  37. Lu, C.; Ren, C.; Wang, Z.; Zhang, B.; Man, W.; Yu, H.; Gao, Y.; Liu, M. Monitoring and assessment of wetland loss and fragmentation in the cross-boundary protected area: A case study of Wusuli River Basin. Remote Sens. 2019, 11, 2581. [Google Scholar] [CrossRef] [Green Version]
  38. Wang, X. Determinants on population migration of Yanbian Koreans. Popul. J. 2011, 2, 69–74. [Google Scholar]
  39. Zhang, C.; Neubauer, F.; Liu, Z.-H.; Cui, F.-H.; Guan, Q.-B. Final-Stage Magmatic record of paleo-Asian oceanic subduction? Insights from late Permian to early Triassic intrusive rocks in the Yanbian area, Easternmost Central Asian Orogenic Belt. Minerals 2020, 10, 799. [Google Scholar] [CrossRef]
  40. Zhao, J. Research on the migration of surplus labor force of the Korean ethnic group in China. Mod. Commun. 2012, 11, 19. [Google Scholar]
  41. Zheng, Y.M.; Zhang, H.Y.; Niu, Z.G.; Gong, P. Protection efficacy of national wetland reserves in China. Sci. Bull. 2012, 57, 1116–1134. [Google Scholar] [CrossRef] [Green Version]
  42. Guo, B.H.; Li, Y.J. Current situation of wetland conservation and management in Jilin Province of China. China J. Wildl. 2013, 34, 370–373. [Google Scholar]
  43. Liu, Y.G.; Yuan, F.H.; Wang, A.Z.; Wu, J.B.; Zheng, X.B.; Yin, H.; Guan, D.X. Characteristics of climate change in Changbai Mountain ecological functional area, Northeast China. China J. Appl. Ecol. 2019, 30, 1503–1512. [Google Scholar]
  44. Northeast China Tiger and Leopard National Park. Available online: http://hubaogy.cn/index/news/show/id/47.html (accessed on 9 September 2020).
  45. Yang, H.T.; Zhao, X.D.; Han, B.Y.; Wang, T.M.; Mou, P.; Ge, J.P.; Feng, L.M. Spatiotemporal patterns of Amur leopards in northeast China: Influence of tigers, prey, and humans. Mamm. Biol. 2018, 92, 120–128. [Google Scholar] [CrossRef]
  46. Jeelani, N.; Yang, W.; Xia, L.; Zhu, H.L.; An, S. Ecosystem threats and management strategies for wetlands in China. Mar. Freshw. Res. 2020, 71, 1557–1563. [Google Scholar] [CrossRef]
  47. Liu, W.W.; Guo, Z.L.; Jiang, B.; Lu, F.; Wang, H.N.; Wang, D.; Zhang, M.Y.; Cui, L.J. Improving wetland ecosystem health in China. Ecol. Indic. 2020, 113, 106184. [Google Scholar] [CrossRef]
Figure 1. Study area.
Remotesensing 13 03498 g001
Figure 2. Comparison of original segmentation (a) and optimal segmentation (b). (a), the parameters of scale, shapes, and compactness were 50, 0.20, and 0.40, respectively; (b), the parameters of scale, shape, and compactness were 80, 0.20, and 0.40, respectively.
Remotesensing 13 03498 g002
Figure 3. Spatial and temporal distribution maps of natural wetlands and farmlands in Tumen River Basin from 1986 to 2016. (a) 1986, (b) 1996, (c) 2006, (d) 2016.
Remotesensing 13 03498 g003
Figure 4. Hot spot areas of natural wetland converted to farmland. (Hot spot means that the area of natural wetland converted into farmland significantly in this study.).
Remotesensing 13 03498 g004
Figure 5. The area of natural wetlands converted to dry farmlands and paddy fields in eleven sub-basins. (a) GPG, (b) HQH, (c) LDH, (d) HLJ, (e) YQG, (f) BHH, (g) GYH, (h) STH, (i) MJ,(j) HCH, (k) JXQH.
Remotesensing 13 03498 g005
Figure 6. Spatial distribution and area change of farmland into natural wetland: (a) spatial and temporal distribution of farmland restored to natural wetlands; (b) area of the sub-watershed restored from farmland to natural wetlands; (c) percentage of sub-watershed restored from farmland to natural wetlands.
Remotesensing 13 03498 g006
Figure 7. An analysis diagram of the driving forces for the conversion of natural wetlands to farmland in the TRB. A represents the area of natural wetland converted into farmland, H represents the Han-Chinese agricultural population, K represents Korean-Chinese agricultural population, T represents average annual temperature, P represents average annual precipitation, and G represents grain output.
Remotesensing 13 03498 g007
Figure 8. An analysis diagram of the driving forces for the conversion of natural wetlands to farmland in the 11 sub-basins of the Tumen River. A represents the area of natural wetland converted into farmland, H represents the Han-Chinese agricultural population, K represents the Korean-Chinese agricultural population, T represents average annual temperature, P represents average annual precipitation, and G represents grain output: (a) GPG; (b) HQH; (c) LDH; (d) HLJ; (e) YQG; (f) BHH; (g) GYH; (h) STH; (i) MJ; (j) HCH; (k) JXQH.
Remotesensing 13 03498 g008
Table 1. Remote sensing data.
SensorOrbit NumberImaging TimeResolutionBand NumberCloud Cover
Landsat TM114/309 June 198830 m74%
Landsat TM115/2914 August 198630 m77%
Landsat TM115/3011 June 198630 m70%
Landsat TM115/3124 June 198530 m728%
Landsat TM116/2926 August 198830 m74%
Landsat TM114/3016 August 199530 m70%
Landsat TM115/298 July 199630 m71%
Landsat TM115/308 July 199630 m71%
Landsat TM115/318 July 199630 m737%
Landsat TM116/2931 July 199630 m713%
Landsat TM116/3016 August 199630 m70%
Landsat TM116/3116 August 199630 m73%
Landsat ETM+114/3024 July 200730 m80%
Landsat ETM+115/297 June 200530 m84%
Landsat TM115/3023 July 200730 m70%
Landsat TM115/3123 July 200730 m70%
Landsat ETM+116/293 July 200630 m82%
Landsat ETM+116/303 July 200630 m81%
Landsat ETM+116/313 July 200630 m813%
Landsat OLI114/309 August 201615 m112%
Landsat ETM+115/307 July 201630 m80%
Landsat OLI115/3115 July 201615 m1114%
Landsat OLI116/306 July 201615 m114%
Landsat OLI116/311 July201615 m114%
Table 2. Land use and land cover classification system.
Category ICategory IIDescriptionOLI Image
Natural wetlandHerb swampSwamps with vegetation coverage ≥ 30% and mainly herbaceous plants Remotesensing 13 03498 i001
Shrub swampSwamps dominated by shrubs, vegetation coverage ≥ 30% Remotesensing 13 03498 i002
Forest swampWoody plant community swamp with obvious trunks, higher than 6 m, canopy closure ≥ 0.2 Remotesensing 13 03498 i003
RiverLinear body of water with flowing water Remotesensing 13 03498 i004
FarmlandPaddy fieldCultivated land used to grow aquatic crops such as rice Remotesensing 13 03498 i005
Dry farmlandCultivated land without irrigation facilities, mainly relying on natural precipitation to grow xerophytic crops Remotesensing 13 03498 i006
Table 3. Accuracy of land use classification in the TRB.
1986199620062016
Kappa0.880.890.910.91
Overall accuracy89.7690.2890.5792.40
Table 4. Changes in natural wetlands and farmland in the 11 sub-basins of the study area from 1986 to 2016 (ha).
Natural WetlandsFarmlands
1986–19961996–20062006–20161986–19961996–20062006–2016
GPG−225.8−421.7−283.269.0−13.9−178.4
HQH−342.1−470.7−94.8319.0−7.1−270.8
LDH−60.0−223.2552.6159.1476.1−146.5
HLJ−730.6−838.8183.6−240.474.187.0
YQG−173.2−311.8276.4239.4158.5−289.4
BHH−1107.3−887.6−465.4−5779.41631.5520.8
GYH−1507.0−1138.8−113.81228.7−1259.3−140.6
STH−156.7−73.1−82.8144.5−290.840.7
MJ64.6−289.613.7125.3−84.0187.6
HCH−1380.1−509.1−1416.7614.3−2085.1−687.9
JXQH−655.5−44.0−1223.0389.4−479.7−273.1
Total−6273.6−5208.3−2653.2−2731.1−1879.6−1150.7
Publisher’s Note: MDPI stays neutral with regard to jurisdictional claims in published maps and institutional affiliations.

