1. Introduction
Tropical cyclones (typhoons) are among the Earth’s catastrophic processes and phenomena. Due to the colossal economic damage caused during their passage, from the moment of their inception in tropical regions to their complete decay in northern regions, and the frequency of their occurrence, they are among the most catastrophic phenomena of the Earth. Countries, territories, and waters influenced by tropical cyclones require good long-term and short-term forecasts of the origin, development, and decay of typhoons. Due to the interest in reducing the potential impact of typhoons through physical processes, thereby decreasing their energy intensity, there is an urgent need to develop remote methods for monitoring the primary and secondary phenomena and processes, oscillations, and waves in tropical cyclones. This interest is associated with solving a number of problems to identify the processes and phenomena at different scales in various fields of science, ranging from hydrophysical to biological.
The tasks of studying tropical cyclones (typhoons) can be categorized as contact (buoy stations, regional meteorological stations, etc.) and remote methods, associated with satellite monitoring [
1]. Paper [
2] describes the mechanisms of origin and intensification of dangerous vortex phenomena such as tropical cyclones, and the processes of their electromagnetic interaction with the Earth’s ionosphere. New results were obtained from the analysis of various experimental data. For example, in [
3,
4], based on the analysis of experimental data on vertical temperature profiles in the region of Hurricane Katrina and variations in galactic cosmic ray fluxes, the relationship between temperature changes at the tropopause level and changes in the level of ionization of the atmosphere due to cosmic rays was established.
However, these methods are not entirely reliable. Contact methods are prone to large errors due to the limited dynamic range or low sensitivity of the equipment used. Satellite monitoring yields good results when studying the processes taking place in dynamically low-activity media. Typhoons pass mainly through the transition zones of geospheres, which are characterized by abrupt changes in depths, and alternation of islands, seas, and parts of continents, where dynamic processes are extremely violent. In these zones, satellite research methods are subject to large errors and need to be corrected with regard to the results of ground-based observations [
5]. Thus, when studying the dynamic processes occurring in these zones, it is necessary to rely on ground-based remote monitoring methods, which can are based on hydrophysical (propagation of disturbances in the aquatic medium) or seismo-acoustic (propagation of disturbances in the oceanic Earth’s crust with access to the crust transition zone) research approaches.
Hydrophysical disturbances, arising in the zone of a tropical cyclone’s activity and propagating over considerable distances, include sea surface wind waves or swell waves, and nonlinear units in the form of single waves of various amplitudes, the speed of which can be an order of magnitude higher than the speed of the swell wave. The characteristics of sea waves, such as the amplitude, period, and direction of movement, depend on the wind speed, the duration of its influence on the water area, and the characteristics of the water territory, such as its area and depth. Based on the dispersion characteristics of wind waves emerging from the area of typhoon action, the main energy characteristics of typhoons can be calculated and the bearing taken of the area of the surface wind waves’ generation. Although progressive sea wind waves can be used in the remote hydrophysical method of typhoon monitoring, standing wind waves provide little informative value for hydrophysical monitoring.
During their motion, progressive sea wind waves interact with the seabed at shallow depths, starting from depths equal to about half the length of the wind wave, and form primary microseisms, the periods of which correspond to the periods of progressive sea waves [
6]. Standing sea waves generate secondary microseisms in the Earth’s crust; their period corresponds to half the period of progressive sea waves [
7]. Standing sea wind waves can form in the rear of the cyclone (typhoon), in the shelf areas during reflection of progressive sea waves, and in the rear of islands due to the refractive processes of progressive sea waves. Hasselman [
8] made a generalized description of microseism generation. The corresponding disturbances in the atmosphere are called microbaroms [
9]; the physical mechanism of their generation is the nonlinear interaction of the fields of sea wind waves, which precisely manifest themselves during the period, when the direction of the impact of air masses on the sea surface changes, and the vortex moves over the water area. Paper [
10] showed that microbaroms and secondary microseisms have one source, which originally was considered to be the place with the highest wind speed in the cyclonic vortex, i.e., the central part of the vortex. However, as a result of further studies [
11,
12,
13], it was found that the place of secondary microseisms and microbaroms origination usually coincides with the rear area of cyclonic formations and is not related to their central area.
Paper [
14] demonstrated that the speed and direction of typhoon movement at a particular point can be determined, with subsequent derivation of its trajectories. Determination of the parameters is carried out based on the information obtained about variations in the primary microseism parameters. Simultaneously, the inverse problem can be solved using generalized dispersion equations [
15], and nonlinear components and the Doppler effect can be analyzed. Monitoring based on this analysis can be undertaken using seismo-acoustic monitoring methods. However, because the microseisms’ propagation speed is at least an order of magnitude higher than the speed of the surface wind waves, the preferred approach is seismo-acoustic monitoring. In addition, attenuation of microseisms is insignificant; therefore, this form of monitoring is possible at almost any planetary distance using modern highly sensitive instruments, for example, laser strainmeters [
16].
Development of seismo-acoustic monitoring methods is partially based on information obtained from the zones of formation of the “surf infrasound” in the frequency range from 1 to 5 Hz, which is formed near sea coasts and associated with interaction of sea wind waves [
17,
18]. Papers [
19,
20] show that the appearance of infrasound is associated with the destruction (collapse) of waves in the coastal zone, and its parameters are dependent on the topographic and bathymetric characteristics of this zone. Amplitudes of these oscillations are directly proportional to the amplitudes of ocean wind waves. In the work [
21], the authors referred to the infrasound within the range from 1 to 5 Hz as “surf infrasound”, which is generated along a sufficiently long coastline and can propagate to considerable distances from the coast.
Interesting infrasonic disturbances in the frequency range of 5–10 Hz, originating from the interaction of sea waves with the vortex component of a tropical cyclone, and subsequently called the “voice of the sea”, were first discovered by V.V. Shuleikin [
22]. The increased interest in these infrasonic disturbances is associated with their possible influence on the psychophysical state of a person. Subsequently, several variants of the mechanisms of generating the atmospheric infrasonic “voice of the sea” signal were presented. Among the mechanisms of its generation, one is based on the wind flow around large waves, and another is based on the process of generating acoustic noise from sea waves’ destruction against rocky shores [
19]. The variant of the joint influence of the mechanism of infrasound generation by standing surface waves and stratification of the atmosphere on the observed parameters of infrasonic waves is considered in [
23]. In [
24], a mechanism of the formation of the “voice of the sea” signals was proposed as a result of the interaction of multidirectional surface waves generated at the turn of the wind direction in an atmospheric vortex over the sea. This causes a nonlinear interaction of surface waves propagating in opposite directions to each other, with formation of the second harmonic in the form of a standing surface wave. By itself, the atmospheric “voice of the sea” signal has no prospects for use in remote monitoring, but the discovered microseismic “voice of the sea” signal [
25,
26] has tremendous potential for use in remote microseismic monitoring. As shown in the above works, during the movement of typhoons in the coastal zone, the “voice of the sea” microseisms are generated in the frequency range of 5–10 Hz and recorded by a laser strainmeter. It was established that the time of the “voice of the sea” microseisms’ appearance coincides with the time of arrival of primary microseisms generated by progressive sea waves. Disappearance of the “voice of the sea” microseisms correlates with the disappearance of primary microseisms and weakly correlates with the disappearance of secondary microseisms. The maximum wind does not always coincide with the maximum “voice of the sea” microseisms.
Taking into account that the “voice of the sea” microseisms relate to surface waves, it is possible to locate the zones of their formation using the data of several laser strainmeters, i.e., to take the bearing of a typhoon.
In this study, we analyzed the characteristics of the development and attenuation of the infrasonic waves of the “voice of the sea”, recorded by laser strainmeters during the impact of several typhoons on the Sea of Japan in different years. The aim was to determine the main areas of generation of the “voice of the sea” signal during the typhoons passing near the Russian Far East coast. During the analysis of the obtained processing results, we compared the trajectories of the central part of the typhoons with the publicly available archives of meteorological and satellite data [
27,
28], and with the model data of wind generation in the near-surface part of the sea [
29].
2. Measuring Complex
The main instrument for measuring the “voice of the sea” microseisms is a two-coordinate laser strainmeter, consisting of two unequal-arm laser strainmeters, which are installed at the depth of 3–5 m below the surface of the Earth, almost perpendicular to each other [
30]. The laser strainmeters are located at about 70 m above the sea level. These devices are installed at the Marine Experimental Station of the V.I.Il’ichev Pacific Oceanological Institute “Schulz Cape”, located at Schulz Cape, the Sea of Japan, in the Primorsky Territory of the Russian Federation, at the coordinates N42.58° and E131.157°;
Figure 1.
Both laser strainmeters are installed in underground hydro- and thermally insulated rooms. The optical part of each laser strainmeter is based on a modified Michelson interferometer of an unequal-arm type, using frequency-stabilized helium-neon lasers with long-term stability from 10−9 to 10−12 as a light source. The main interference unit of the Michelson interferometer of each laser strainmeter, in addition to the digital recording system, is located in a separate hydro- and thermally insulated room. The auxiliary interference unit of the Michelson interferometer, consisting of a corner reflector with an alignment system, is located in another hydro- and thermally insulated room. Between the main and the auxiliary interference units, a laser beam propagates through the sealed pipeline, consisting of stainless-steel pipes that are hermetically sealed at the ends by optical windows. The measuring arms of the laser strainmeters are approximately perpendicular to each other and relatively positioned at the angle of 92º. The laser strainmeter with a measuring arm length of 52.5 m (North–South) is oriented at the angle of 18° (198°) to the meridian line, and the strainmeter with a measuring arm length of 17.5 m (West–East) is oriented at the angle of 110° (290°) to the same line. The main interference unit of the 52.5 m laser strainmeter is installed on a massive concrete monolith with a height of about 3 m, which is rigidly connected to the lower part to the hard rocks of Shultz Cape, consisting of compressed loam. The corner reflector of the 52.5 m laser strainmeter is rigidly attached to a 1 m high concrete monolith, which is connected to a granite cliff.
Each component of the two-coordinate laser strainmeter measures the change in the length of the working arm between the main interference unit and the auxiliary unit (corner reflector). The principle of displacement measurement is to measure the phase incursion of the laser beam using interference methods. The applied methods of interferometry enable changes in the lengths of the measuring arms of each laser strainmeter to be recorded with an ultimate accuracy of 1 pm. However, taking into account the noise of photoelectronic equipment, real measurements can be carried out with an accuracy of 0.01 nm in the frequency range from 0 (conditionally) to 1000 Hz. In this case, the sensitivity of the laser strainmeter with the arm length of 52.5 m is equal to that of the laser strainmeter with the arm length of 17.5 m. The amplitude-frequency characteristic of these laser strainmeters is such that, in the frequency range of interest of the signals generated by typhoons (1–15 Hz), it is possible to carry out measurements with the maximum sensitivity [
31].
The meteorological station measures air temperature, atmospheric pressure, air humidity, wind speed, and direction. Data on variations in atmospheric pressure, temperature, air humidity, wind velocity, and direction are read with a sampling frequency of 1 Hz.
Occasionally, at different times of the year, on the shelf of the Sea of Japan near Shultz Cape, we installed a laser meter of hydrosphere pressure variations. This is designed to measure fluctuations of hydrosphere pressure in the frequency range from 0 (conditionally) to 1000 Hz with an accuracy of 1 mPa [
32], caused by hydrospheric processes of differing scales, including surface sea waves.
The data obtained from the laser strainmeters and the meteorological station enters the laboratory room via cable lines After pre-processing, the data is recorded on solid media in the software computing complex, and subject to further processing of the experimental database.
3. Experimental Data and Processing Methods
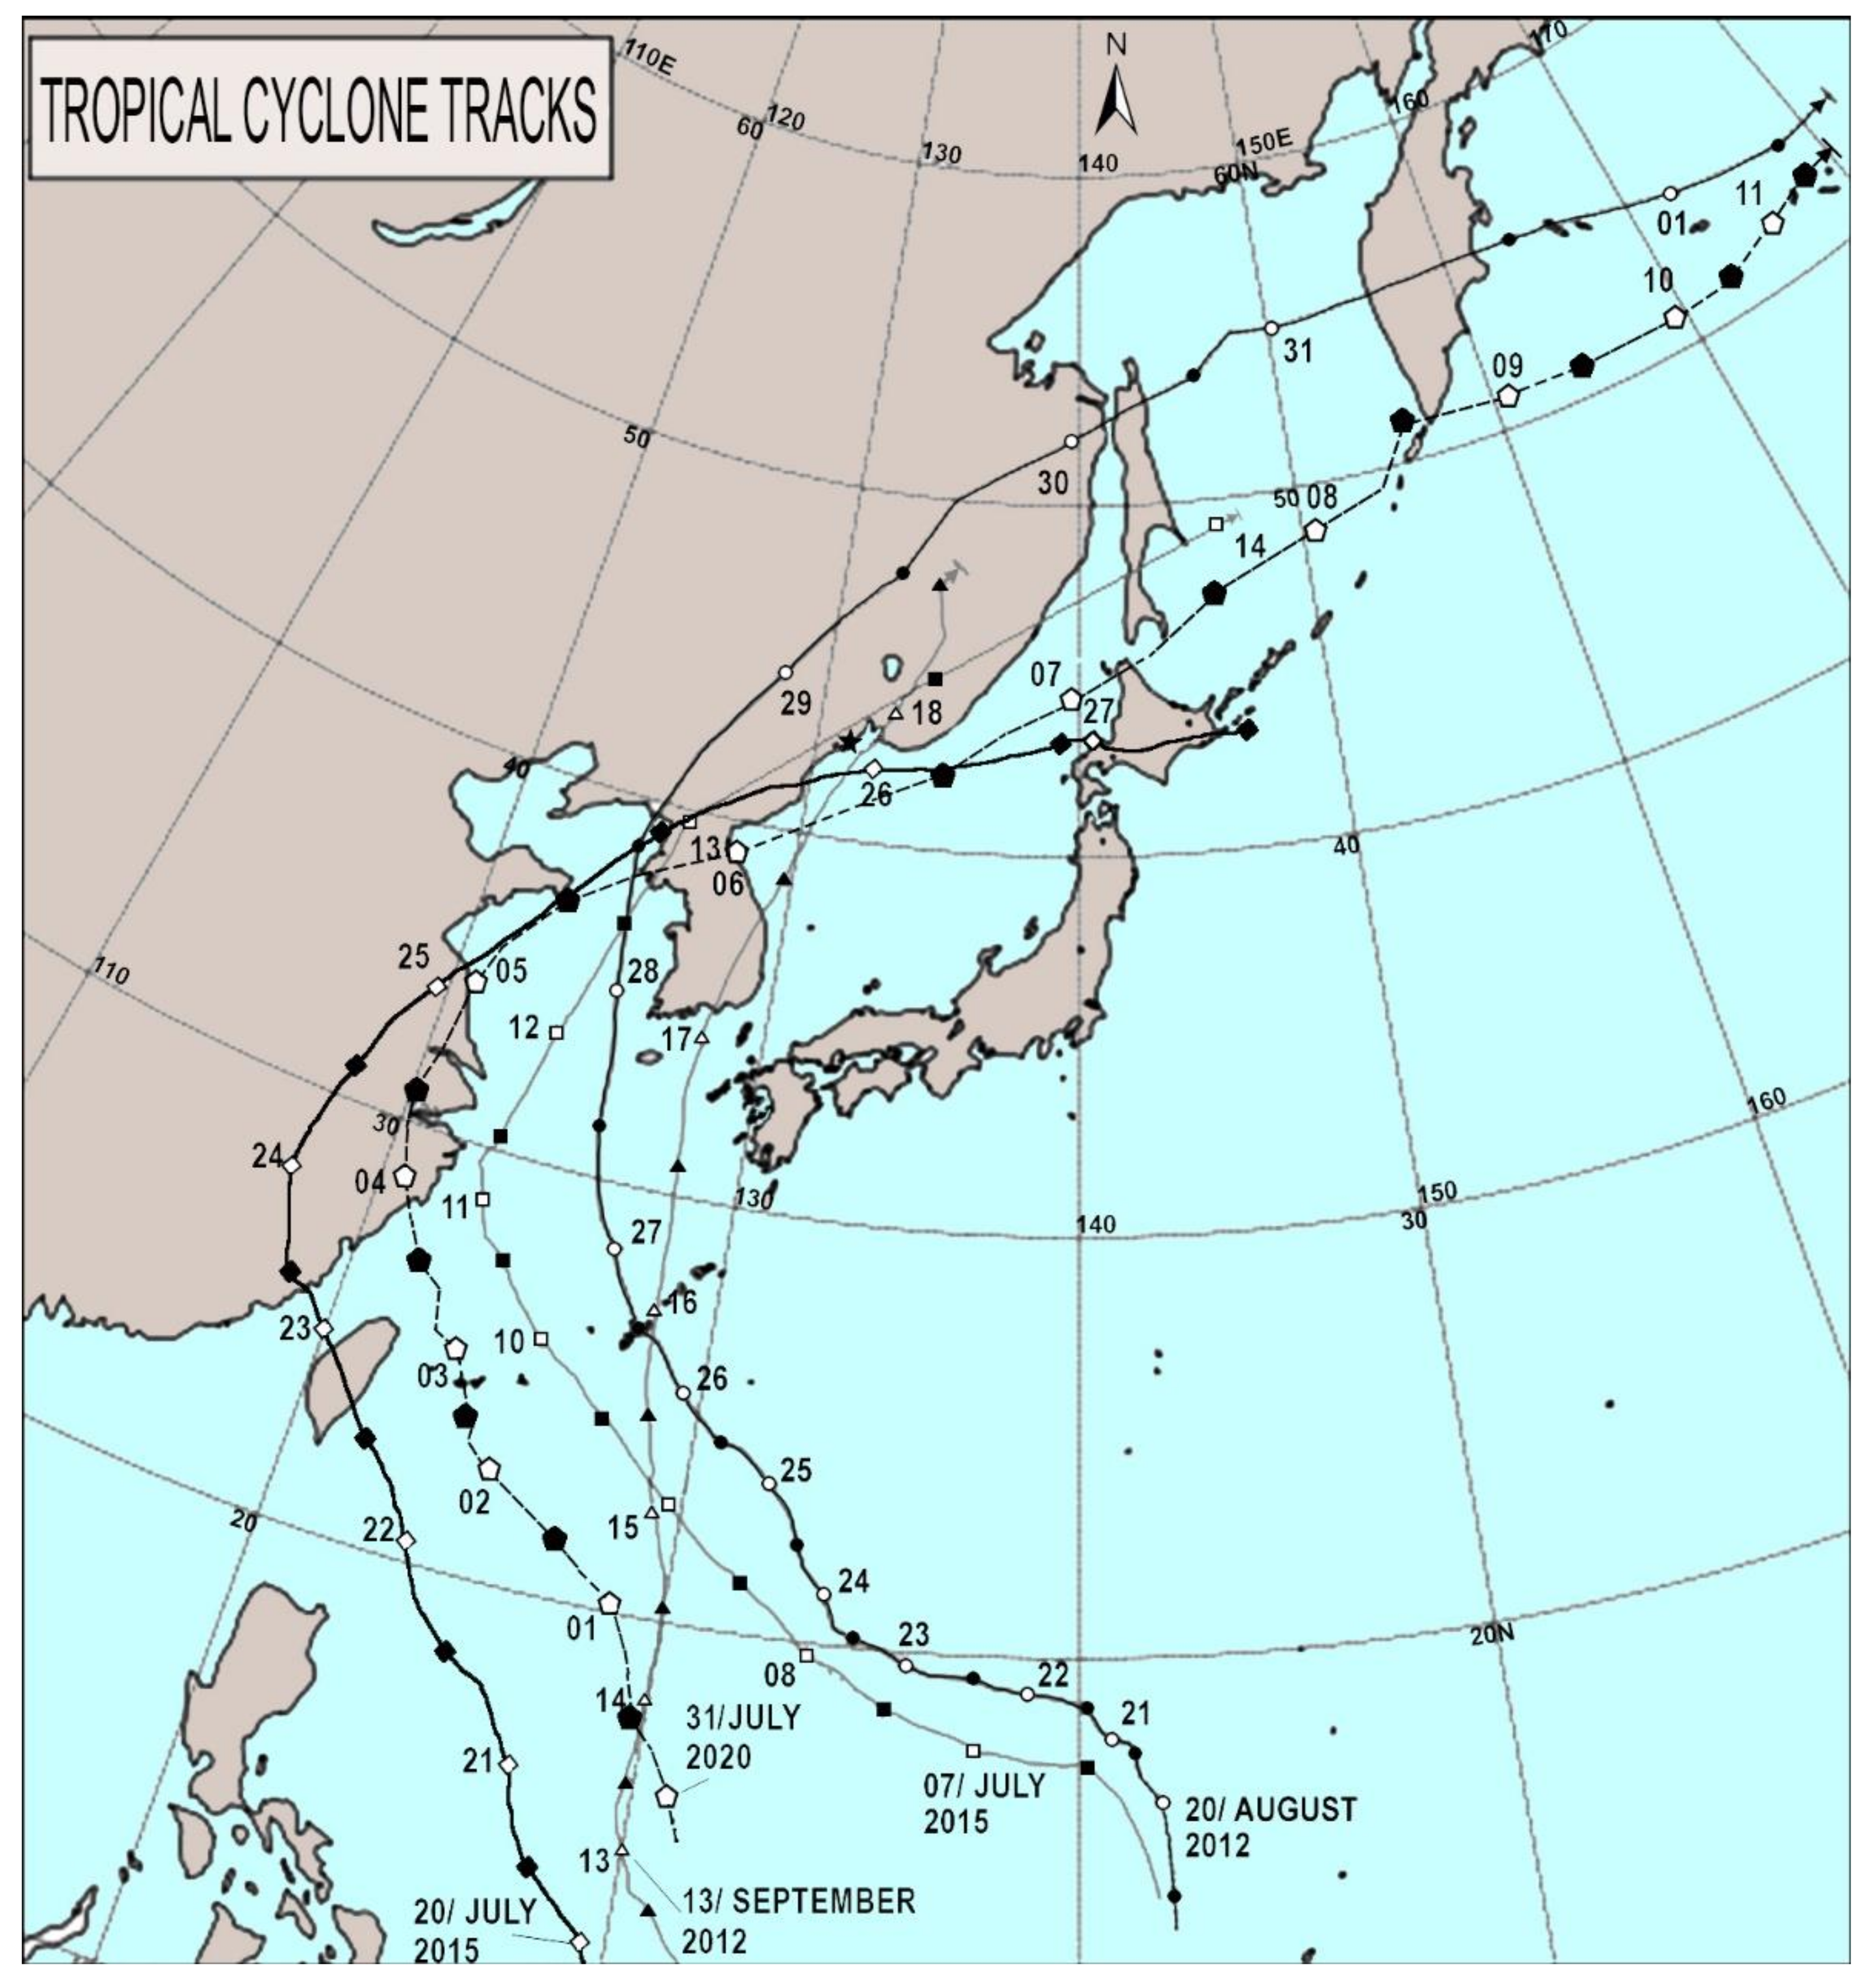
Before processing the experimental data obtained from the laser strainmeters on variations in the deformation of the Earth’s crust, we analyzed the typhoon database. For further analysis, we selected five typhoons that passed through the northwestern part of the Pacific Ocean through the Korean Peninsula, and directly influenced the Russian Far East, the Sea of Japan, and the Sea of Okhotsk. Some of these later passed into the Pacific Ocean. The lifespans and the names of these typhoons are presented in
Table 1. The data on all the studied typhoons, with their main characteristics and trajectories, were obtained from “AEROCOSMOS” and the Japan Meteorological Agency databases.
Figure 2 shows an integrated map of the considered typhoon trajectories, with the specified semidiurnal intervals of their movement according to Coordinated Universal Time, UTC. This scheme enabled the main motion trajectories of a typhoon center to be shown relative to the measuring complex site, and revealed the main temporal parameters of the “voice of the sea” infrasonic signal generation process. Images from the Japanese “Himawari-7” and “Himawari-8” satellites additionally allowed observation of frontal, lateral, and rear vortex components of the typhoons, including after the meteorological agencies ceased monitoring the cyclone as a dangerous natural phenomenon following its transformation into a tropical depression or extratropical cyclone.
To take the bearing of the “voice of the sea” microseism generation area, we analyzed all timeframes in which the signals, excited by the typhoons, were recorded by the two-coordinate laser strainmeter. We were able to draw the most objective conclusions from the results of processing and analyzing the data obtained during the passing of the typhoons Matmo in July 2014, Chan-Hom in July 2015, and Hagupit in August 2020. The data of the two-coordinate laser strainmeter, collected during the period of the passing of these typhoons, was processed using the “Deformograph” complex processing program, which was designed by us. This program is used for experimental data processing, including modeling, filtering, applying various methods of spectral and statistical estimation, and other important procedures.
The duration of each file of the laser strainmeter records was one hour, with a sampling rate of 1000 Hz. At the first step of processing the experimental data from the laser strainmeters, several files were combined into one, of several days’ duration. To reduce the size of the “stitched” file, and prevent the aliasing effect and the possible influence of power-consuming high-frequency spectral harmonics, we processed the combined file by a low-frequency Hamming filter with a length of 1500 and a cutoff frequency of 50 Hz, and then decimated it to a Nyquist frequency of 25 Hz with a sampling rate of 50 Hz. The data obtained with help of the two-coordinate North–South (52.5 m) and West–East (17.5 m) laser strainmeter components were subjected to this processing. Then, for each channel, the spectrum energy in the frequency range from 7 to 9 Hz was singled out, which allowed us to compare temporal and quantitative parameters for each component. Knowing the spectrum energy, which acts simultaneously upon two perpendicularly directed components, we could determine the tangent of the angle that indicates the direction to the radiation source, using the formula: , where is the spectrum energy acting upon the West–East component; is the spectrum energy acting upon the North–South component. This formula is valid for the same length of the measuring arms of the laser strainmeters. The working arm of the North–South laser strainmeter is three times longer than the working arm of the West–East laser strainmeter. Therefore, after the energy characteristics of each of the components were determined, we calculated the angle of direction to the source, with a decreasing coefficient for the North–South component, because the sensitivity of the West–East laser strainmeter component was three-fold lower than that of the North–South strainmeter. We note that this ratio is correct for the case when the North–South and West–East laser strainmeters are located on the same rock; this requirement is practically fulfilled, with a few exceptions. Based on the calculated tangent of the angle, we can easily derive the angle indicating the area of the “voice of the sea” microseism generation at a specific time of measurement. In our calculations, we assumed that the “voice of the sea” microseisms have a polarization similar to the polarization of primary microseisms, i.e., they correspond to a Rayleigh surface wave with longitudinal polarization, the main axis of which is directed at a vertical angle to the microseism’s propagation speed direction.
We compared the obtained directions for the area of the “voice of the sea” infrasonic signal generation and the database of the global weather forecast systems, based on GFS and WAVEWATCH III weather data [
29]. As a result, we found an interrelation between the vector of the direction to the source, formed by latitude and longitude coordinates, and the area of the highest wind pressure of the typhoon vortexes.
4. Description of Typhoons. Results of Experimental Data Processing
At the first stage of processing, the data of the laser strainmeters were used to detect in dynamic spectrograms the “voice of the sea” microseisms, in addition to primary and secondary microseisms, excited by progressive and standing sea waves. Additionally, data from the meteorological station were used to describe variations in the magnitude and direction of the wind speed at the measuring site location. In the observation intervals, indicated in
Table 1, in the North–South laser strainmeter data, we obtained dynamic spectrograms in the frequency range from 1 to 12 Hz (extended range of the “voice of the sea” microseisms) and in the frequency range from 10 to 300 mHz (extended range of primary and secondary microseisms).
Figure 3a shows the dynamic spectrograms of the “voice of the sea” microseisms obtained from processing the data of the North–South laser strainmeter during the passing of typhoons Bolaven, Sanba, and Chan-Hom.
Figure 3b shows the dynamic spectrograms of the range of the primary and secondary microseisms, obtained from processing the data of the North–South laser strainmeter during the activity of the same typhoons.
For each typhoon, the obtained information, shown in
Figure 3, was analyzed and compared with the information obtained from the images of the Japanese satellites Himawari-7 and Himawari-8. The aim was to understand the nature of the typhoons’ impact as they moved relative to the measuring site location. Below, we mainly analyze the dynamic spectrograms obtained from processing the North–South laser strainmeter data, using data from the meteorological station and the Japanese Himawari satellites. Furthermore, for each selected typhoon, we consider the chronology of the appearance of the signals in various frequency ranges, which, in our opinion, are associated with the passing of the typhoons.
The characteristics of the development and attenuation of the seismic signal of the "voice of the sea", depending on the spatial and temporal position of typhoons, are described in detail in [
26]. In this previous study, based on satellite images in the infrared range, an analysis was undertaken of the movement of the vortex components of the typhoon with a combination with the meteorological data at the Cape Schultz measuring station. Here, we provide a brief description of the manifestation of the microseisms’ "voice of the sea" and its accompanying processes.
4.1. Typhoon Bolaven
Figure 4 shows a diagram of the vortex trajectory of typhoon Bolaven in alignment with satellite images of the cloud formations.
At 03:25 on 28.08.2012 (hereinafter we use UTC), noise appears in the frequency range from 1 to 2.5 Hz, which expanded to 4.5 Hz within ten hours. This phenomenon, in accordance with the works [
17,
18,
19], can be attributed to the surf infrasound associated with the destruction of offshore wind waves excited by a typhoon in the Yellow Sea, in the surf zone. The frequency range of the surf infrasound expanded due to: (1) destruction of more powerful wind waves in the Yellow Sea, and destruction of wind waves in the Sea of Japan, which were generated by the typhoon, when its tails entered the Sea of Japan; and (2) a decrease in the distance between its generation and registration points, resulting in lower attenuation of the higher-frequency components of the surf infrasound, which allowed them to be to recorded with the laser strainmeter.
By 22:00 28.08.2012, infrasound oscillations occurred in the range from 6.5 to 9.3 Hz with a central frequency of 8 Hz when the rear part of the typhoon vortex entered the Sea of Japan. The signal intensity increased within 8 hours, and its attenuation occurred for a longer time, i.e., about a day and a half.
The registration of primary and secondary microseisms resulting from the impact of progressive and standing sea surface waves on the seabed was simultaneously undertaken by laser strainmeters. These microseisms occurred slightly later than the "voice of the sea" signal. The period and intensity of the secondary microseisms changed and disappeared 25 h after their occurrence, and the period of primary microseisms changed during this time from 12 to 8 s, but still had a sufficiently high intensity.
4.2. Typhoon Sanba
Figure 5 shows the trajectory of Typhoon Sanba aligned with the satellite cloud images throughout its lifespan.
At 02:20 on 17.09.2012, before the appearance of the "voice of the sea" signal, the surf infrasound was also recorded in the same frequency range as during Typhoon Bolaven, associated with the approach of Typhoon Sanba. When the front of the typhoon reached the Sea of Japan, noise with a central frequency of 5.3 Hz was recorded, which apparently had the nature of the surf infrasound already in the area of the Sea of Japan and associated with the peculiarities of the local bathymetry.
Primary and secondary microseisms, whose periods gradually decreased due to sea-wave dispersion, were also well registered in the microseismic range during this time period. Secondary microseisms also disappeared much earlier, and whose period changed with time from 6 to 4.2 s. Primary microseisms were registered for considerably longer, and whose period varied during the observation time from 12 to 8.5 s. The total attenuation of the "voice of the sea" microseisms almost coincided with the presence of the primary microseisms in the signal spectrum and disappeared when their period dropped to 7.5 s.
4.3. Typhoon Chan-Hom
Figure 6 shows a diagram of the movement of Typhoon Chan-Hom, with satellite images of cloud formation superimposed on its entire trajectory.
Surf infrasound appeared in the spectrum of the registered signal of the strainmeter at 15:00 on 11.07.2015. The intensity of the noise increased, and the frequency range expanded as the typhoon vortex entered the north of the Korean Peninsula. At 02:50 on 13.07.2015, "voice of the sea" microseisms appeared in the frequency range of 7 to 9 Hz, expanding rapidly in the lower part to 6 Hz and in the upper part to 11 Hz. At this time, there was also an extended vortex tail of the rear part of the typhoon in the waters of the Sea of Japan. Signal attenuation and its subsequent weak background was observed until 23:00 on 14.07.2015.
In the studied time interval, there was a clear increase in the period of primary and secondary microseisms associated with the developing sea wave. Secondary microseisms disappeared earlier with a period change from 3.7 to 5.3 s. The period of primary microseisms changed from 7.2 to 10.5 s. Then, their period decreased to 9.3 s by 04:30 on 14.07.2015. During this period, the time of the appearance of the "voice of the sea" microseisms coincided with the arrival of the primary microseisms with a period of 7.2 s.
As a result of the comparisons of the arrival times of the "voice of the sea" microseisms and the microseisms associated with the breakup of wind waves during the interaction with the seabed, we conclude that the "voice of the sea" microseisms are directly related to primary microseisms. The disappearance of "voice of the sea" microseisms coincides with the disappearance of the primary microseisms but coincides poorly with the disappearance of the secondary microseisms. Furthermore, according to meteorological observations, the wind speed at the observation station is in no way related to the appearance of the "voice of the sea" microseisms.
6. Conclusions
This paper presents the results of new approach to tropical cyclone/typhoon research, associated with the study of their secondary characteristics, which appear in geospheres’ transition zones. We established that the “voice of the sea” microseisms originate under certain conditions. Their generation depends on meteorological and hydrological characteristics, mainly the wind speed and level of sea roughness. We analyzed the trajectories of the typhoons’ movement in the Sea of Japan to investigate their connection with time of appearance, development, and attenuation of the “voice of the sea” microseisms. Moreover, this research was carried out to study the conditions and areas of the “voice of the sea” microseism generation. We found that it is important to consider the nature of the transition of the “voice of the sea” microseism generation areas and the connection of these transitions with the particular areas of tropical cyclones/typhoons.
In the passage of three typhoons in the Sea of Japan in different directions, we found that: 1) the area of the “voice of the sea” microseism generation moved near the northeastern (relative to the measuring complex location) coast of the Primorsky Territory (the Sea of Japan); 2) the area of the “voice of the sea” microseism generation moved near the northeastern coast of the Primorsky Territory (the Sea of Japan) with subsequent exit to the east coast of Hokkaido; and 3) the area of the “voice of the sea” microseism generation moved along the Korean Peninsula to the north, and subsequently disappeared. The “voice of the sea” microseisms appeared and disappeared almost simultaneously with the primary microseisms, which were generated by progressive wind waves during their interaction with the seabed near and in the surf zone. The existence of powerful microseisms of the “voice of the sea” is closely connected to the existence of powerful wind waves.
The analysis of the results of the processed laser strainmeter data shows that when the typhoons approach the measuring complex location, the surf infrasound apparently generated in the Yellow Sea in the range of 1–2.5 Hz, is gradually transformed into surf infrasound in the range of 1–4.5 Hz. This transformation of the infrasonic seismo-acoustic signals generated by surf infrasound is associated with the approaching typhoon and lower attenuation of the high-frequency components of the surf infrasound. It is hoped that further work on taking the bearings of the areas of infrasonic seismo-acoustic surf infrasound formation using the two-coordinate laser strainmeter will allow the development of new methods of ground-based remote monitoring.
The prospects of remote seismo-acoustic monitoring methods are associated with the fact that the speed of signals generated due to typhoons and propagating in the Earth’s crust is significantly higher than the speed of oscillations and waves propagating in air and water, and also considerably higher than the speed of tropical cyclones. In addition, with regard to the frequency range of the “voice of the sea” microseisms, of interest are studies of the influence of the “voice of the sea” microseisms on biological objects and their physical state.
The presented results, which involve the processing of numerous years of two-coordinate laser strainmeter data, provide new opportunities for remote monitoring of tropical cyclones, and enable determination of the bearings of their tails based on the bearings of the “voice of the sea” microseism generation areas.


