Article

Inconsistency of Global Vegetation Dynamics Driven by Climate Change: Evidences from Spatial Regression

1
Department of Environmental Science and Engineering, Fudan University, Shanghai 200438, China
2
Department of Geography, School of Geography and Information Engineering, China University of Geosciences, Wuhan 430074, China
3
Hubei Key Laboratory of Critical Zone Evolution, School of Geography and Information Engineering, China University of Geosciences, Wuhan 430074, China
4
School of Public Administration, China University of Geosciences, Wuhan 430074, China
*
Author to whom correspondence should be addressed.
Remote Sens. 2021, 13(17), 3442; https://doi.org/10.3390/rs13173442
Submission received: 26 July 2021 / Revised: 25 August 2021 / Accepted: 26 August 2021 / Published: 30 August 2021
(This article belongs to the Topic Climate Change and Environmental Sustainability)

Abstract

:
Global greening over the past 30 years since 1980s has been confirmed by numerous studies. However, a single-dimensional indicator and non-spatial modelling approaches might exacerbate uncertainties in our understanding of global change. Thus, comprehensive monitoring for vegetation’s various properties and spatially explicit models are required. In this study, we used the newest enhanced vegetation index (EVI) products of Moderate Resolution Imaging Spectroradiometer (MODIS) Collection 6 to detect the inconsistency trend of annual peak and average global vegetation growth using the Mann–Kendall test method. We explored the climatic factors that affect vegetation growth change from 2001 to 2018 using the spatial lag model (SLM), spatial error model (SEM) and geographically weighted regression model (GWR). The results showed that EVImax and EVImean in global vegetated areas consistently showed linear increasing trends during 2001–2018, with the global averaged trend of 0.0022 yr−1 (p < 0.05) and 0.0030 yr−1 (p < 0.05). Greening mainly occurred in the croplands and forests of China, India, North America and Europe, while browning was almost in the grasslands of Brazil and Africa (18.16% vs. 3.08% and 40.73% vs. 2.45%). In addition, 32.47% of the global vegetated area experienced inconsistent trends in EVImax and EVImean. Overall, precipitation and mean temperature had positive impacts on vegetation variation, while potential evapotranspiration and vapour pressure had negative impacts. The GWR revealed that the responses of EVI to climate change were inconsistent in an arid or humid area, in cropland or grassland. Climate change could affect vegetation characteristics by changing plant phenology, consequently rendering the inconsistency between peak and mean greening. In addition, anthropogenic activities, including land cover change and land use management, also could lead to the differences between annual peak and mean vegetation variations.

1. Introduction

Terrestrial vegetation controls the cycle of carbon, water and energy between land soil and atmosphere through biochemical processes such as photosynthesis and evapotranspiration and is strongly influenced by hydrothermal conditions and climate change and can affect the climate system in return [1,2,3]. In addition to directly providing ecosystem services such as food, raw materials, and landscape aesthetics, vegetation also has the potential of climate regulation, carbon sequestration and air purification, which are of great importance to maintaining the stability of a terrestrial ecosystem under global change [4,5]. Thus, systematic monitoring, detecting and quantifying vegetation dynamics and their response and feedback to global change have elicited a wide range of attention in multiple subjects.
It is currently unlikely to obtain vegetation properties and variations at the global scale using ground-based observations [5]. Vegetation indices (VIs) products, such as normalized difference vegetation index (NDVI) and enhanced vegetation index (EVI) derived from satellite observations, provide a possibility for long-term vegetation monitoring on a large scale [6,7]. VIs products from the Advanced Very-High-Resolution Radiometer (AVHRR) sensor, Système Pour l’Observation de la Terre VEGETATION (SPOT-VGT) and Moderate Resolution Imaging Spectroradiometer (MODIS) sensors on board different satellites have been widely used in vegetation growth monitoring and crop mapping [8,9,10]. Although providing the longest record of NDVI data (1981–present), AVHRR has the problems of orbit drifts and data inconsistency between various sensors. SPOT-VGT data discontinuity was also found in some areas due to sensor differences in spectral response functions [11]. MODIS data is considered to have a higher temporal consistency than AVHRR and SPOT-VGT data due to no orbit drift and sensor shifts problems and are usually used as reference data [12,13,14]. However, the negative influences of sensor degradation have been captured in MODIS-Terra Collection 5 VIs products [15]. Consequently, MODIS Collection 6 VIs products with the improved algorithm were released to address the sensor degradation problem, and the effects have been supported by some studies [16,17]. Compared to NDVI, EVI minimizes canopy-soil and atmospheric influences and improves sensitivity over dense vegetation conditions, and its reliability has been recognized by comparison analysis of multiple VIs products [10].
The overall greening trend of global vegetation has been widely reported and discussed since the early 1980s, supported by comparisons of multiple satellite observations [18], forest inventories [19] and process-based model simulations [20,21]. Pan et al. [22] explored the increasing global browning trend hidden in overall greening during 1982–2013 by using the ensemble empirical mode decomposition method and piecewise linear regression models; Gao et al. [23] verified the significant trend of global cultivated land greening during 1982–2015 by using two long-term satellite LAI datasets; Zhang et al. [24] found that the previous browning trend monitored by MODIS Terra-C5 needed to be reconsidered due to sensor degradation, while the trend from MODIS Terra-C6 was confirmed by AVHRR and enhanced land carbon sink data [25]. Although a lot of studies have re-examined global greening trend, whether there is a consistent trend between annual peak and average growth of vegetation remains unknown. The annual peak vegetation growth closely related to environmental change is critical in characterizing the capacity of terrestrial ecosystem productivity [20]. Vegetation growth is an ever-changing dynamic process. The annual average vegetation growth, which was selected in the most previous studies, can only reflect the overall state of a certain year but obscure details of vegetation growth. To comprehensively understand the changing ecosystems, it is necessary to track vegetation growth change from multi-dimensions.
Climate change characterized by global warming has been a dominant driver of greening over 28% of the global vegetation regions [21]. However, the global vegetation–climate relationship is complex and has firm spatial heterogeneity [26]. Warming has noticeable positive effects on vegetation growth in the temperate and arctic regions [27], while rising temperatures could limit vegetation growth in tropical regions [28] where the ambient temperature is the proximity of the physiological optimum [29]. In arid and semi-arid regions, vegetation is more sensitive to precipitation change than temperature due to water limitation. In contrast, in humid regions, the impacts of precipitation on vegetation variation are weaker than temperature [30]. In sum, the climate–vegetation relationship geographically varies with the climatic environment [5,23]. In addition, although temperature and precipitation have been the hot spots for a long time, the impacts of climate change on vegetation are more complex than that. For example, the impact of other climatic factors, such as vapour pressure deficit on vegetation growth, have been highlighted, which could offset the effect of rising CO2 concentration, suggested to be considered in evaluating vegetation responses to climate change [31].
At present, most studies used the non-spatial regression methods to depict the relationship between vegetation variation and climate change, such as multiple linear regression [32] and partial correlation analysis [33]. However, the theoretical assumption of these methods is that the spatial data is statistically independent and uniformly distributed [34,35], which ignores influences of spatial autocorrelation. According to the first law of geography, spatial autocorrelation is ubiquitous, and the correlation between adjacent locations is usually stronger than that between distant locations [36,37]. Influenced by the spatial interaction and spatial diffusion of endogenous or exogenous factors, geographic data may no longer be independent of each other, but related to each other [38]. For example, the flow characteristics of the atmosphere and water supporting vegetation growth can suggest that vegetation growth are absolutely not spatially independent [37,39,40]. Previous empirical research within ecology have revealed that regression coefficients may radically shift between non-spatial and spatial (taking autocorrelation into account) regression modelling, resulting in erroneous conclusions [39,41,42,43,44]. Given that spatial autocorrelation exists extensively in spatial data, it is important to use spatially explicit models to explore the climate-driving mechanism of vegetation growth. Therefore, the aims of this study are: (1) to examine inconsistency trends of global vegetation in peak and average growth during 2001–2018; (2) to reveal the overall relationship between climate change and vegetation growth using spatial regression models (at the global level); (3) to find out the spatial heterogeneity characteristic of climate driving using the geographically weighted regression model (at the local level).

2. Materials and Methods

2.1. Global Datasets and Pre-Processing

EVI, land cover and climatic datasets used in this study are displayed in Table 1. The raw MODIS data were mosaicked, re-projected and converted to Geo TIFF from HDF format using the MODIS Reprojection Tool. We averaged monthly EVI as the annual EVImean and extracted the maximum monthly EVI as the annual EVImax. In the spatial regression analysis, we resampled EVI data into 0.5° × 0.5° spatial resolution by using the bilinear algorithm to match the climatic gridded data as well as the basic analytical unit. Global terrestrial land cover data are from the International Geosphere-Biosphere Programme (IGBP) classification layer of MCD12Q1 (Figure 1). To eliminate the direct effects of transformation between vegetated and non-vegetated land during 2001–2018, we masked out non-vegetated areas including permanent wetlands, urban and built-up lands, permanent snow and ice, barren and water bodies by overlaying the IGBP land cover data during the period of 2001–2018. Global annual climatic gridded data were generated by extracting the maximum, minimum, mean or sum value from the monthly climatic gridded data. For example, annual precipitation data were generated by summating monthly precipitation, while annual maximum temperature data were obtained by calculating the maximum value of the monthly maximum temperature. All data pre-processing was accomplished in R x64 4.0.2 and RStudio (http://www.r-project.org/, accessed on 18 September 2020).

2.2. Methods

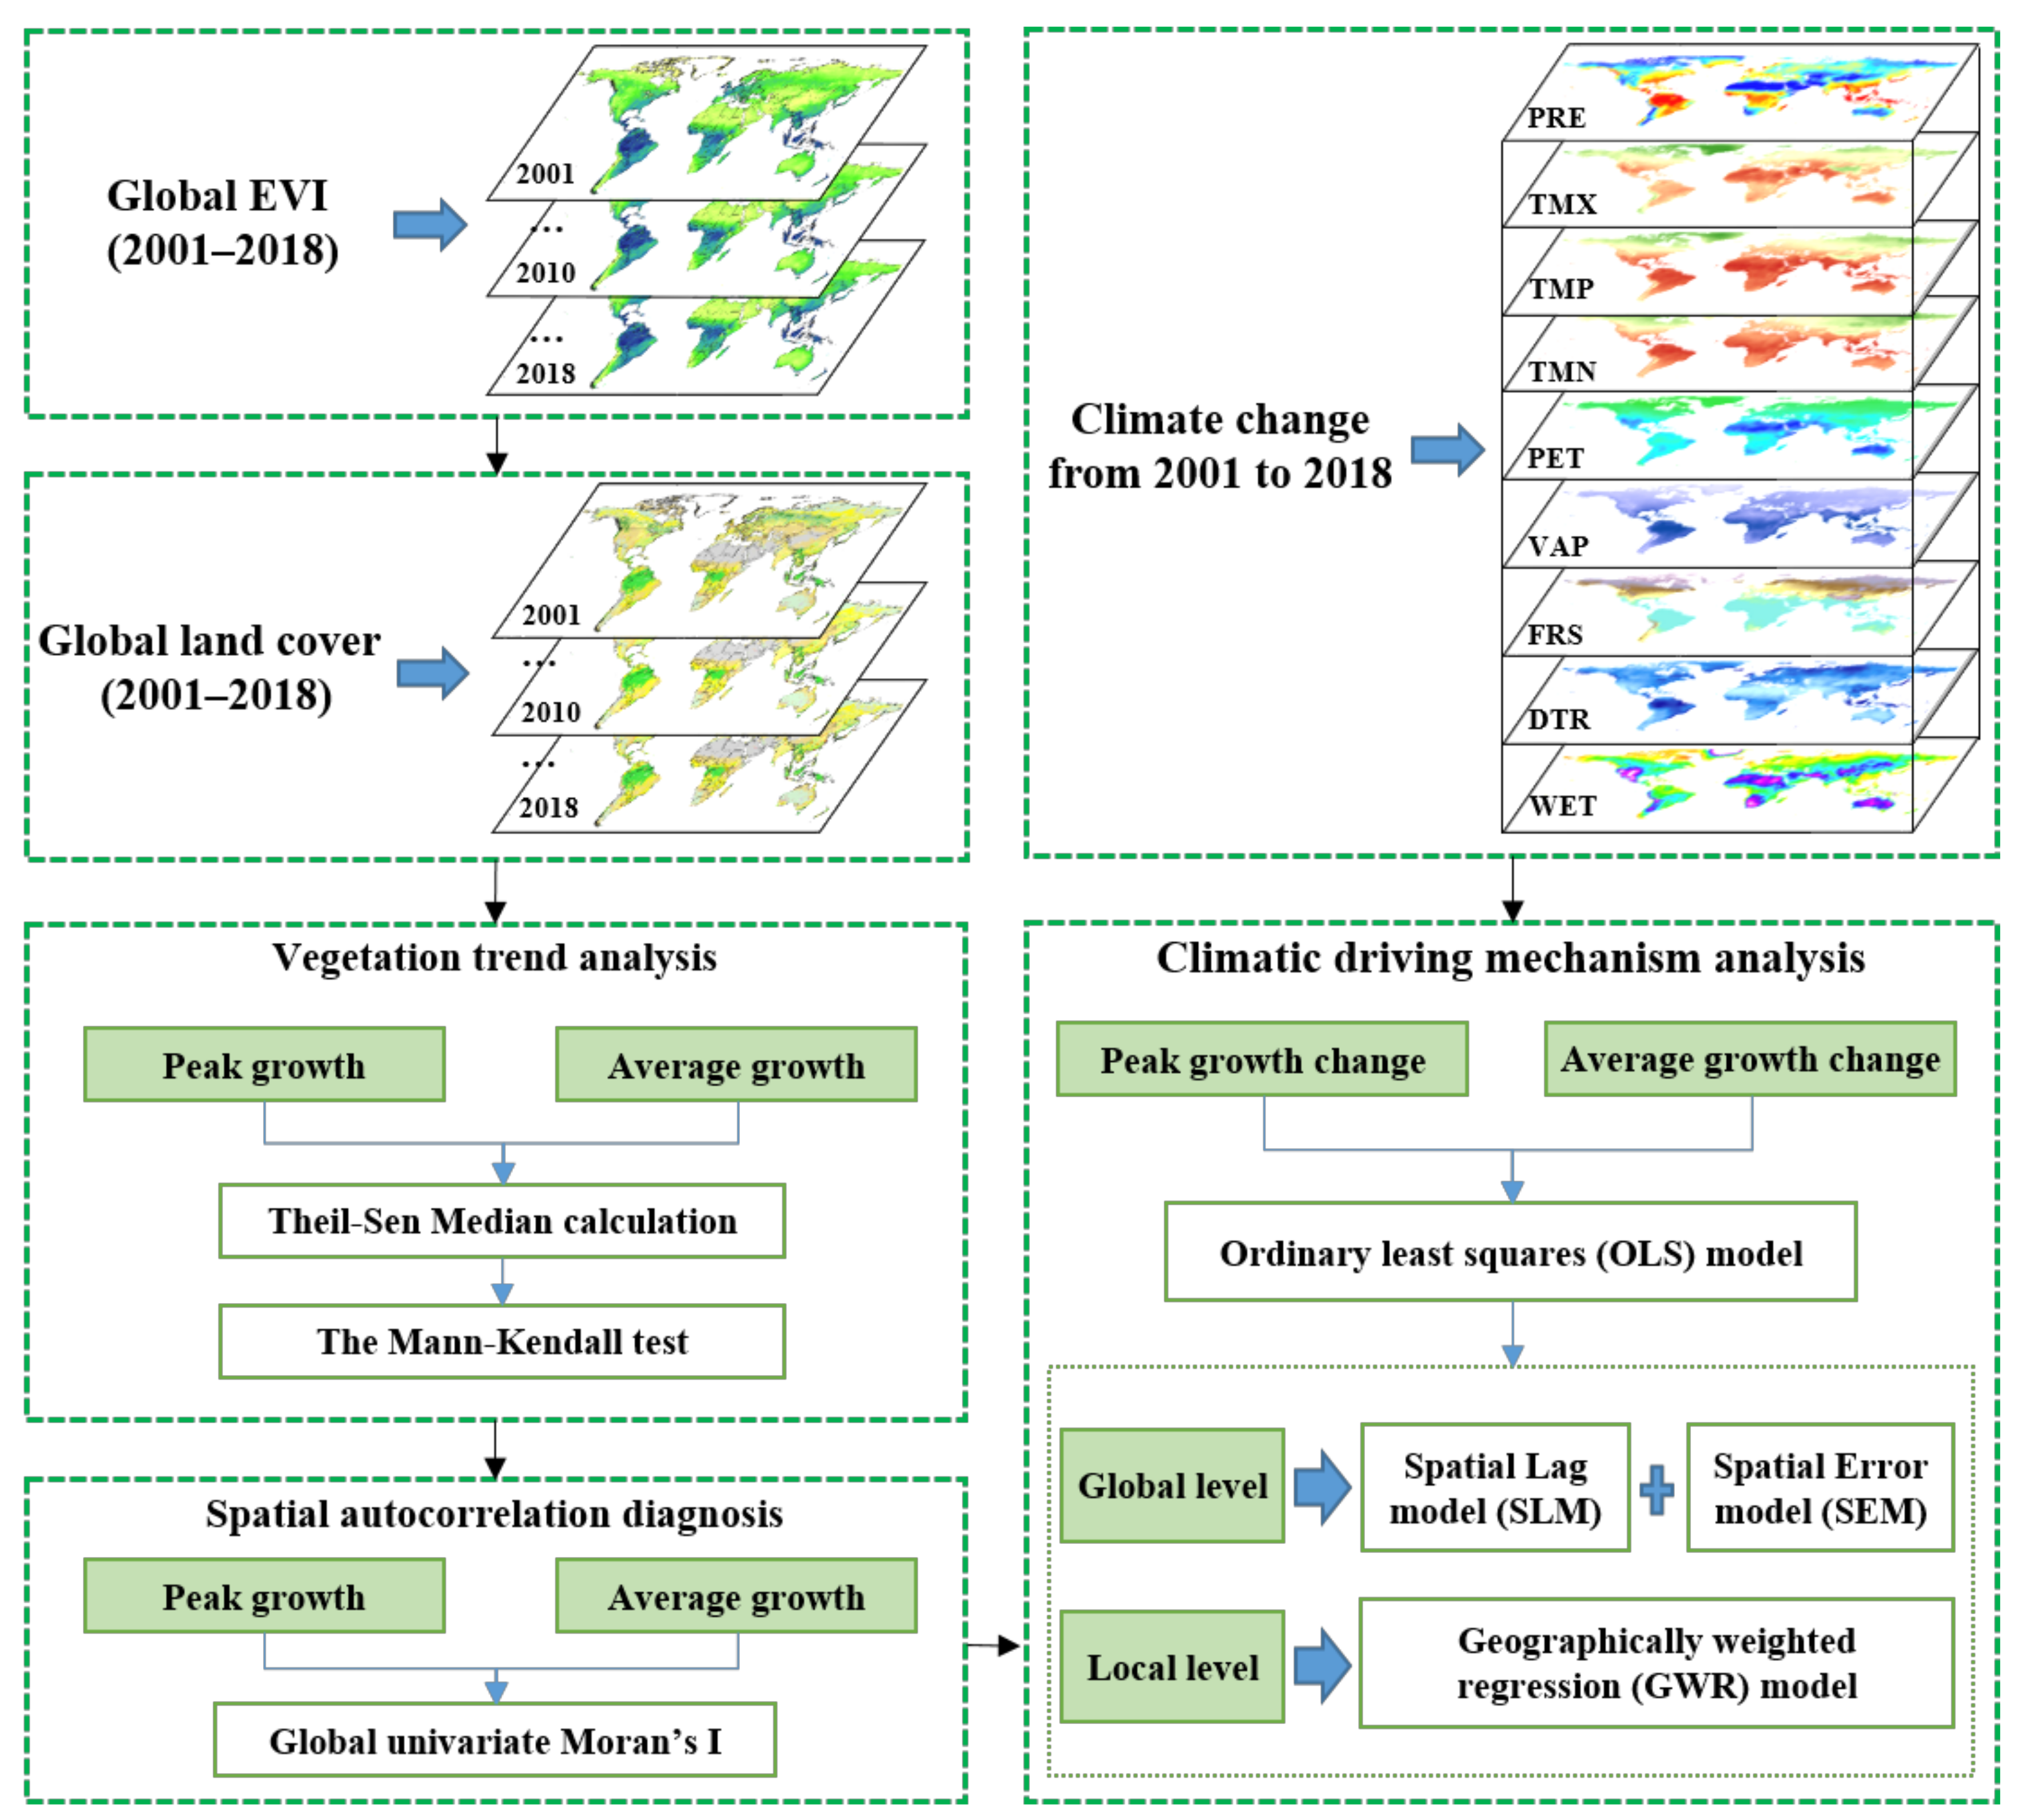
A methodological flowchart of this study is shown in Figure 2. Firstly, to find out the greening and browning areas and the area with inconsistent changes, we detected the trend of global vegetation growth variation during 2001–2018 from two dimensions of annual peak and mean using the Mann–Kendall test method recommended by the World Meteorological Organization in Section 2.2.1. Secondly, to prove our theoretical hypothesis that spatial autocorrelation exists in vegetation growth change, the global univariate Moran’s I was first used to diagnose the spatial autocorrelation in the response variable in Section 2.2.2. The response variables were the changes of EVImax and EVImean from 2001 to 2018, and the explanatory variables are the changes of climatic variables from 2001 to 2018.
Thirdly, to incorporate spatial autocorrelation in the response of vegetation growth to climate change, we used multiple spatial regression models to analyse the spatial relationship between climate change and vegetation variation at the global level. The first step is to perform the ordinary least squares (OLS) model, which is under the assumption that there is no autocorrelation [45] because the spatial lag model (SLM) and the spatial error model (SEM) are developed from the OLS by incorporating spatial autocorrelation into the regression by means of a spatial weight matrix [34]. SLM was used when spatial autocorrelation exists in dependent variables. SEM was used when spatial autocorrelation exists in the residual. The second step is to select SLM or SEM based on the statistical significance of the Lagrange multiplier (LM)-lag and LM-error, or robust LM-lag and robust LM-error. The third step is to determine the better performance model, with a larger maximum likelihood logarithm (LIK) and a smaller Akaike information criterion (AIC) and Schwarz criterion (SC).
Finally, the relationship between variables varies with the change of geographical location due to the differences in the natural environment and human disturbance in different regions. This changing relationship also needs to be considered in the spatial analysis [46]. To reveal the differentiated local characteristics hidden in the overall correlation, we used the geographically weighted regression (GWR) model to measure the spatial heterogeneity of the relationship between vegetation growth and climate change by obtaining local regression results at each spatial unit in Section 2.2.4. The spatial autocorrelation analysis and the OLS, SLM and SEM were conducted in GeoDa software (http://geodacenter.github.io/, accessed on 8 February 2021). The GWR model was conducted in GWR4 software (https://gwr4.software.informer.com/, accessed on 11 March 2021).

2.2.1. Trend Detection of Vegetation Growth

The linear trend of global vegetation growth during 2001–2018 at each grid cell were estimated using Sen’s slope method, also known as the Theil–Sen median method [47]. The method is a robust non-parametric statistical trend calculation method that has high computational efficiency and is insensitive to measurement error and outlier data [48]. Sen’ slope was calculated by Equation (1):
S l o p e = Median x j x i j i ,   j > i
where the median refers to the mean value of all the slopes, and xi and xj represent the EVI values of years i and j.
Then the Mann–Kendall test method was used to test the significance of the Sen’ slope [49,50]. The significant confidence level with p < 0.05 corresponds to the absolute value of the Z statistic >1.96. The Sen’ slope and Mann–Kendall test for EVI data at each grid cell were accomplished in R x64 4.0.2.

2.2.2. Spatial Autocorrelation Analysis

Moran’s I statistic is arguably the most commonly used indicator of global spatial autocorrelation. It was initially suggested by Moran [51], and popularized through the classic work on spatial autocorrelation by Cliff and Ord [35]. For an observation at location i, this is expressed as z i = x i x ¯ , where x ¯ is the mean of variable x. Moran’s I statistic is then:
I = i j w i j z i z j / i j w i j i z i 2 / n
where n is the number of observations, wij is the elements of the spatial weights matrix, xi and xj are the observed value of the location i and its surrounding location j, x ¯ is the mean of variable x.
At a given significance level, when Moran’s I > 0, it indicates a positive correlation between the observed values, and similar attributes cluster together. That is, the high value is adjacent to the high value, and the low value is adjacent to the low value; when I < 0, it indicates a negative correlation between the observed values, and the observations are dispersed; when I = 0, the observed value is randomly distributed.

2.2.3. Spatial Regression at the Global Level

Anselin [34] put forward the general form of spatial regression. When ρ = 0, β ≠ 0, α = 0, the model is the ordinary least squares (OLS) model; When ρ ≠ 0, β ≠ 0, α = 0, the model is a spatial lag model (SLM), that is, the dependent variable of a location is not only related to the independent variable of the location, but also related to the dependent variable of the neighbourhood. When ρ = 0, β ≠ 0, α ≠ 0, the model is a spatial error model (SEM), that is, the dependent variable of a location is not only related to the independent variable of the location, but also related to other variables not considered at adjacent regions.
y = ρ W 1 y + β x + ε ε = α W 2 ε + μ μ ~ N 0 , σ 2 I n
where y is the dependent variable, x is the independent variable, W1 is the spatial weight matrix of the dependent variable, ρ is the coefficient of the spatial lag variable W1y, β is the coefficient of x, ε is the residual, W2 is the spatial weight matrix of ε , α is the coefficient of ε , μ is the random error of normal distribution, σ is the variance of μ .

2.2.4. Spatial Regression at the Local Level

The GWR model is essentially the locally weighted least squares regression model, which is an extension of the OLS model [52]. In GWR, the weight of the observations is no longer constant during the regression process but is weighted by the degree of adjacency to location i [53]. The model structure is as follows:
y i = β 0 μ i , v i + j = 1 k β j μ i , v i x i j + ε i
where, μ i , v i is the co-ordinate of i, β j μ i , v i is the jth regression parameter of i.

3. Results

3.1. Temporal Trend of Global Vegetation Growth

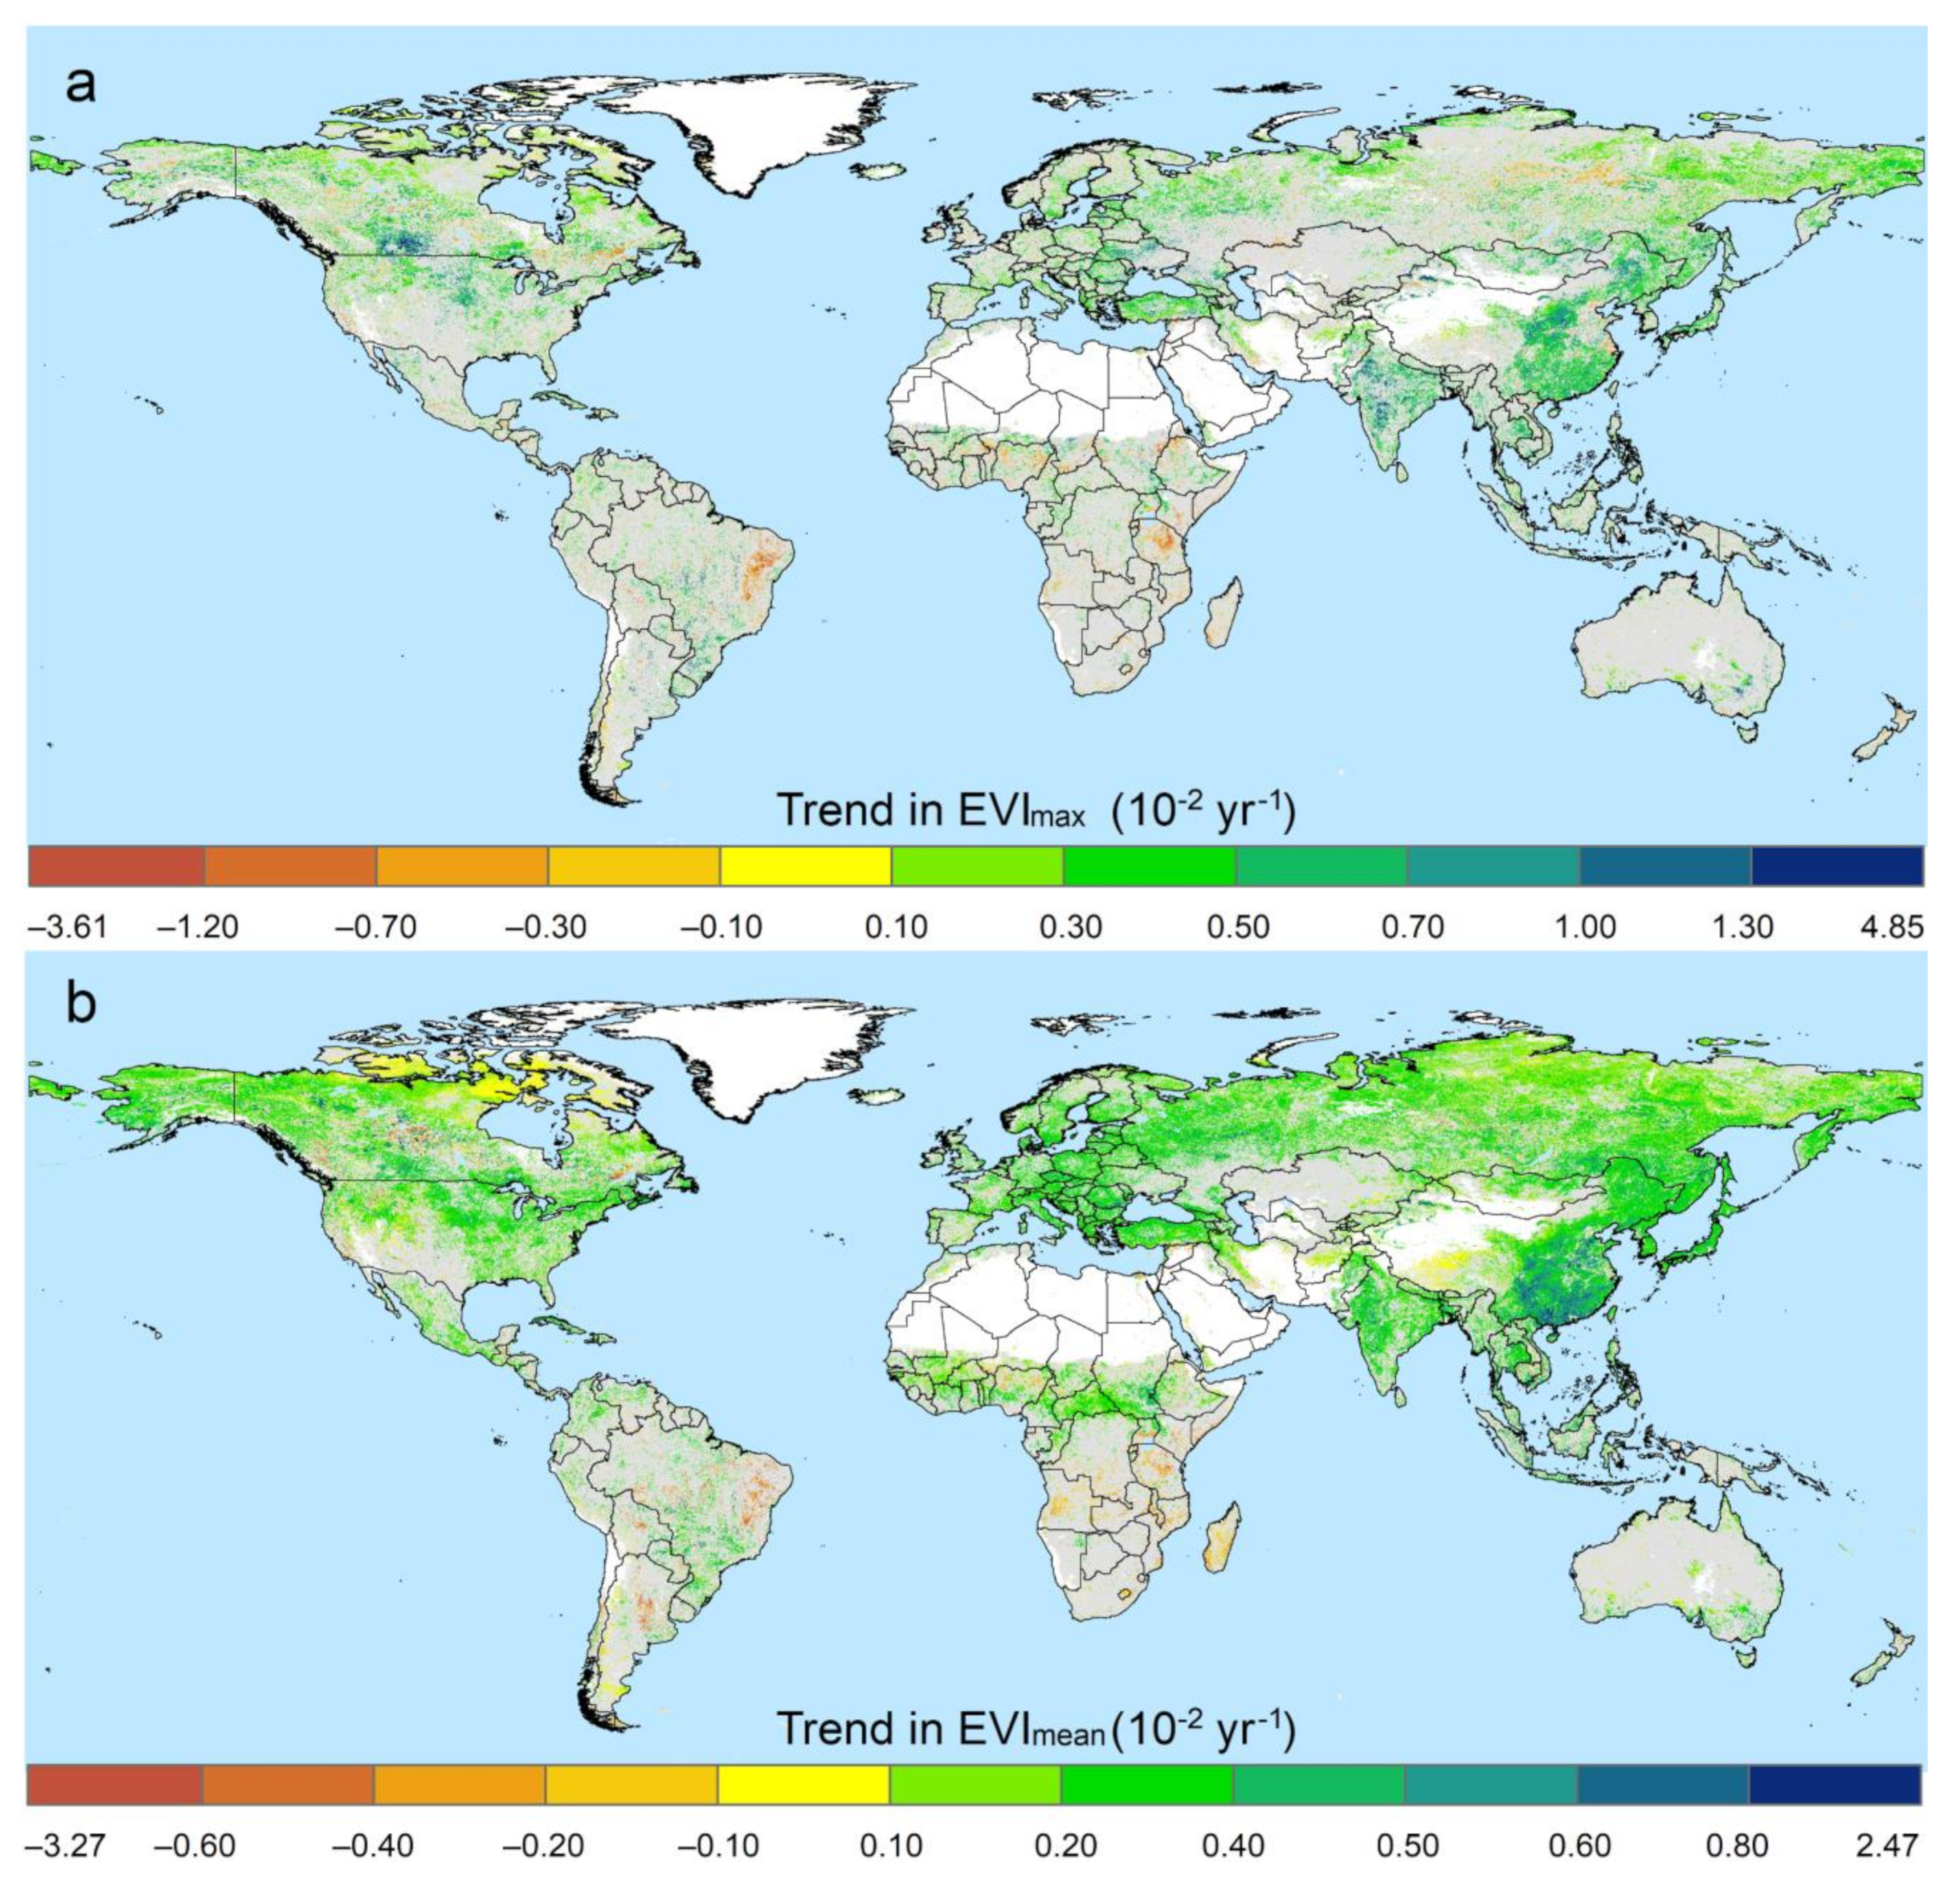
EVImax can reflect the potential productivity of terrestrial vegetation, and EVImean represents the average vegetation growth state in a year, which depicts two aspects of vegetation change. Globally, peak (EVImax) and average (EVImean) growth in global vegetation consistently showed linear increasing trends during 2001–2018, with the global averaged trend of 0.0030 yr−1 (p < 0.05) and 0.0022 yr−1 (p < 0.05). In terms of EVImax, 18.16% of the global vegetated areas showed a statistically significant (Mann–Kendall test, p < 0.05) greening during 2001–2018, and 3.08% of the global vegetated areas showed a statistically significant (Mann–Kendall test, p < 0.05) browning during 2001–2018 (Figure 3a). By overlaying land cover, we found that the most dramatic greening occurred mainly in those areas with cropland agricultural activities, such as Northern China, India, Central-North America and Southeast Europe. The fastest degradation areas were mainly the grassland of Africa and South America, such as Tanzania, Nigeria and Brazil.
In terms of the EVImean, 40.73% of the global vegetated areas showed a statistically significant (Mann–Kendall test, p < 0.05) greening during 2001–2018, and 2.45% of the global vegetated areas showed a statistically significant (Mann–Kendall test, p < 0.05) degradation trend (Figure 3b). The most obvious greening areas mainly occurred in China, India, Canada and Europe, covering a variety of land types including cropland, shrubland, forests and savannas. Vegetation degradation areas were mainly grassland and savannas in areas of South America and southern Africa.

3.2. Inconsistent Global Vegetation Growth in Terms of EVImax and EVImean

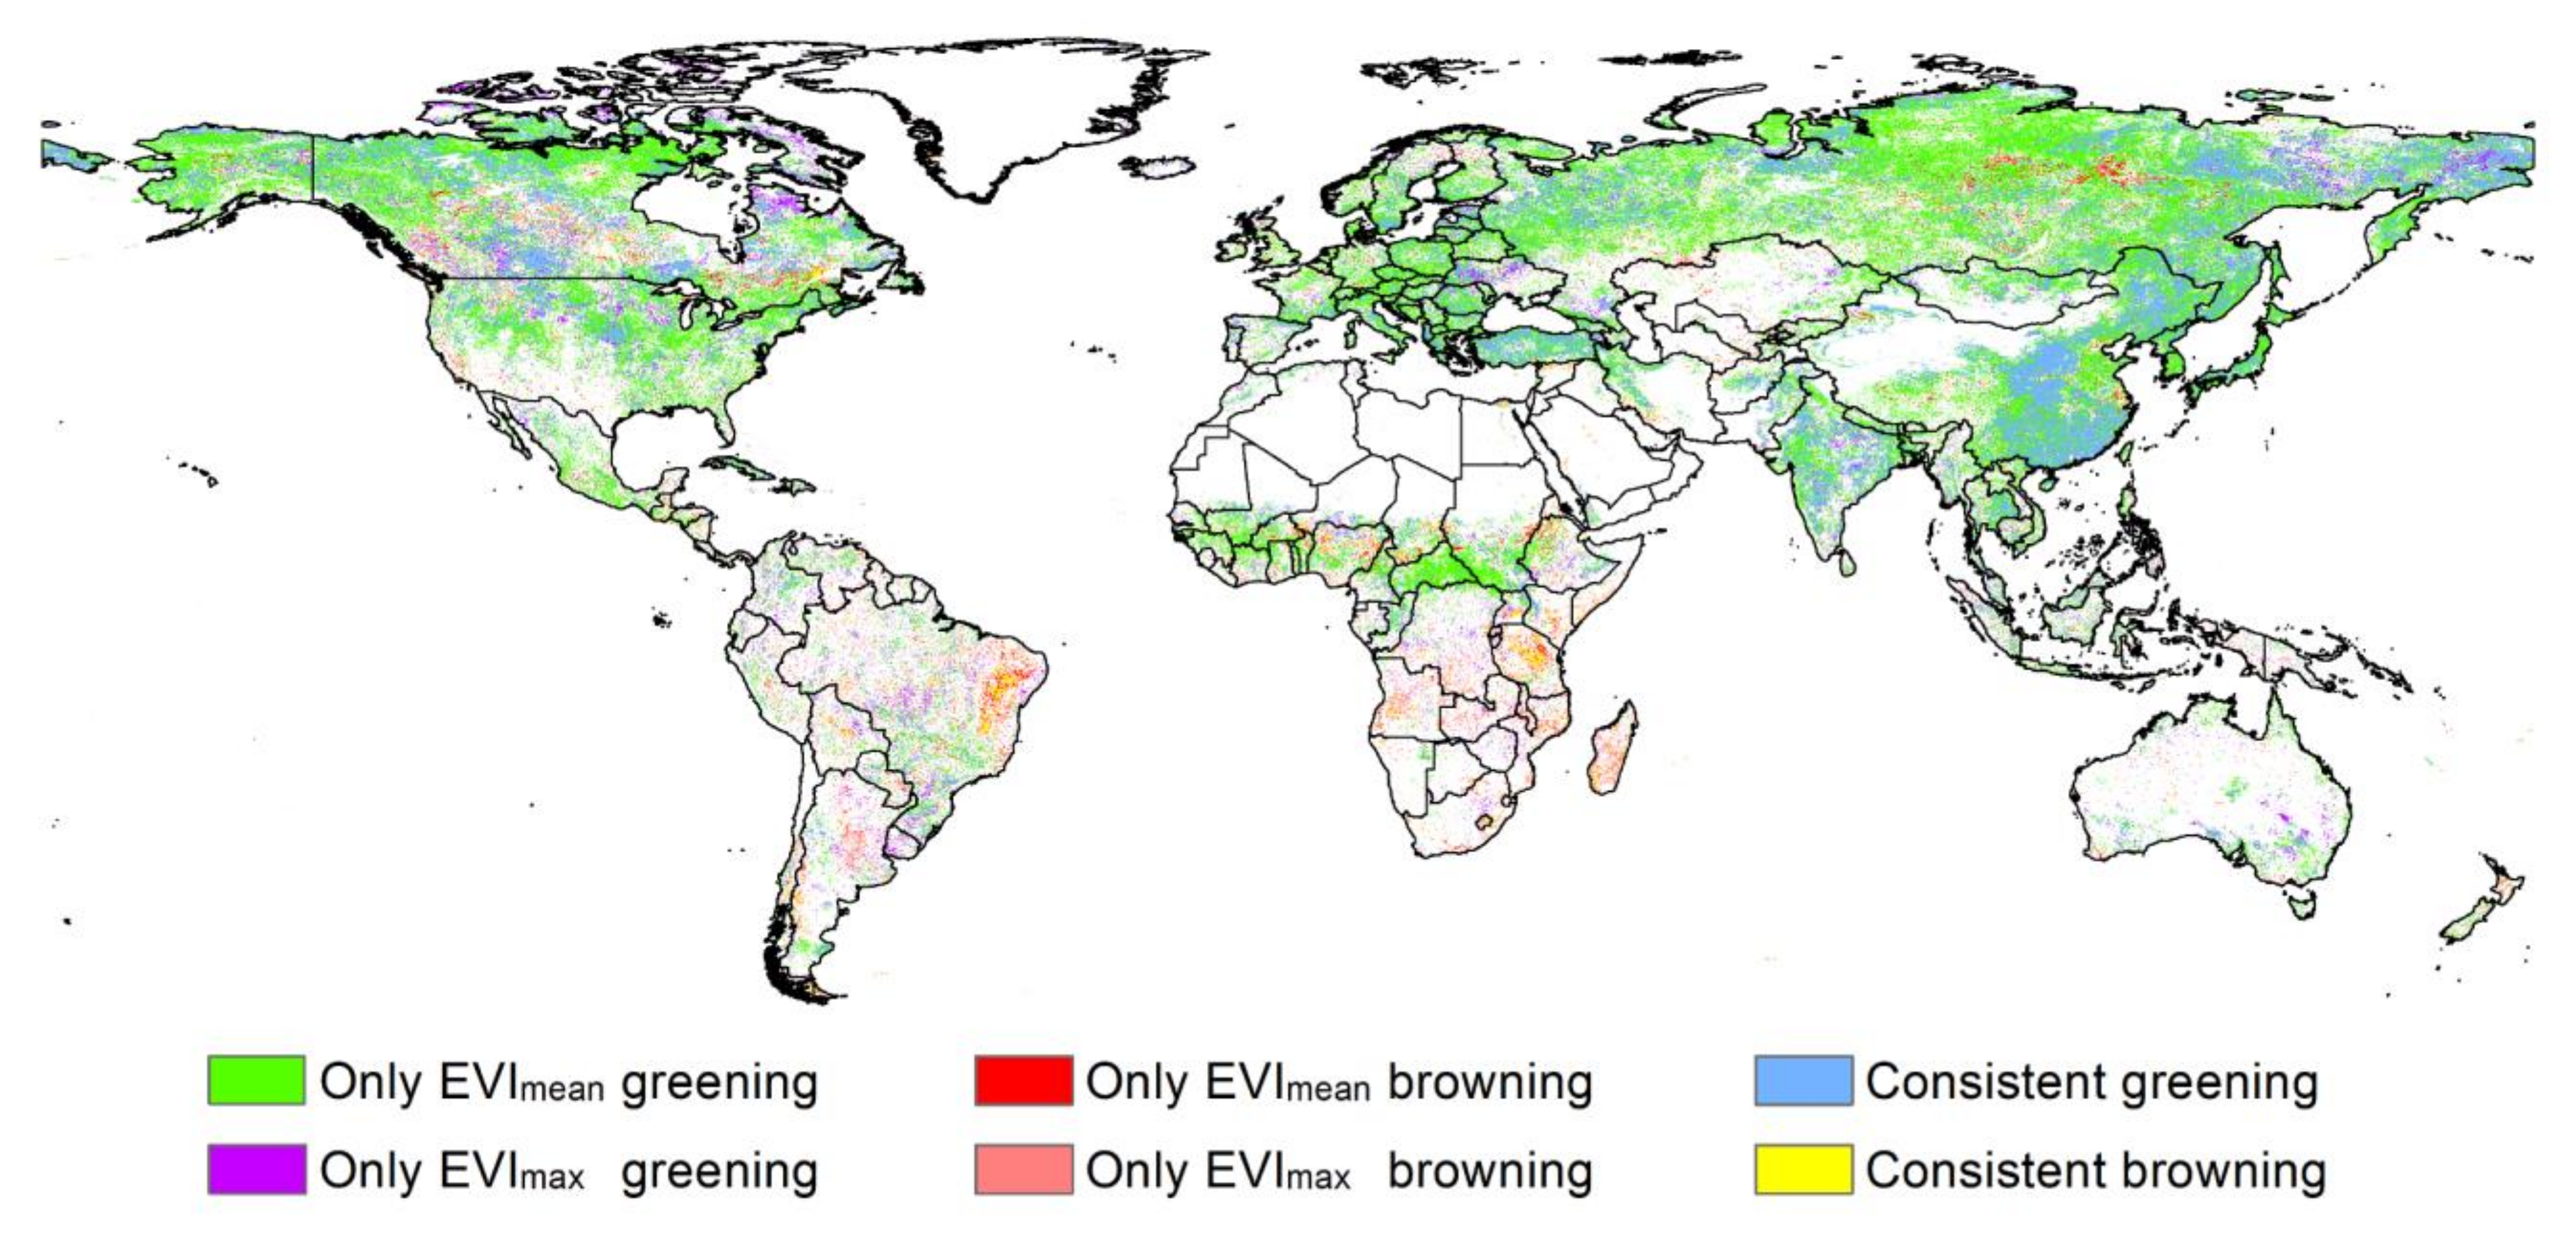
It is worth noting that EVImax and EVImean experienced consistent changes in 15.97% of the global vegetated areas (14.99% for greening and 0.98% for browning) (Figure 4). However, 32.47% of the global vegetated areas experienced inconsistent changes for EVImax and EVImean. Specifically, 25.74% of the global vegetated areas that experienced significant greening in EVImean, with no increase in EVImax simultaneously, occurred mainly in of Europe, Russia, Central Africa, North America and China. On the contrary, 3.17% of the global vegetated areas that experienced significant browning in EVImax, with no increase in EVImean simultaneously, were mainly distributed in Northern Canada, Eastern Russia, Southern Australia, and were scattered in South America and Africa. There was also 2.10% of the global vegetated area showing a significant browning in EVImax, with no decrease in EVImean simultaneously, scattered in Africa, South America and Canada, especially in Argentina and Madagascar. While 1.46% of the global vegetated area showed a decreased trend for EVImean, with no decrease in EVImax simultaneously, such as Central Africa, Central Russia, Eastern Canada and Eastern Brazil. In addition, we found that EVImax and EVImean had opposite trends in some areas; however, these areas together accounted for only 0.56% of the inconsistent area. EVImean increased but EVImax decreased in 0.52% of the inconsistent area, while EVImax increased but EVImean decreased in 0.04% of the inconsistent area.

3.3. Relationship between Climate Change and Vegetation Growth

In this study, the Moran’s I values for the EVImax and EVImean changes during 2001–2018 were 0.273 and 0.549 (p < 0.05), showing that a significant positive spatial autocorrelation existed in EVI changes in the past 18 years. The multicollinearity condition number was 4.74 (<30) from the OLS model estimation results, indicating no multicollinearity problems in the explanatory variables. The test statistics of LM-lag, LM-error, robust LM-lag and robust LM-error that form the OLS model were all significant (p < 0.0001); thus, SLM and SEM were both built to analyse spatial global correlation between vegetation and climate factors. By comparing the index of LIK, AIC and SC, SLM has the largest LIK value and the smallest AIC and SC value, showing that SLM is superior to SEM and OLS in this study (Table 2). R-squared represents the degree to which nine climatic factors explained the global vegetation change in the past 18 years. R2 in SLM were 0.5370 and 0.2499 for EVImean and EVImax, respectively, indicating climatic drivers and the spatial lags of EVI could explain more than half and the 24.99% changes of EVImean and EVImax, respectively.
The regression results of the best fit model (SLM) in this study for EVImax and EVImean were shown in Table 3. The spatial lag of EVImax in SLM passed the statistical significance test (p < 0.05) during 2001–2018, proving that changes in EVI were correlated not only to these climatic factors but also to EVI variation in its adjacent areas. The coefficient indicates that the vegetation in a certain location might change by 0.7472 units for every 1-unit change of vegetation in its adjacent areas. Precipitation and mean temperature had a statistically significant (p < 0.05) positive correlation with EVImax during 2001–2018, while potential evapotranspiration and vapour pressure had a statistically significant negative correlation with EVImax. Compared to EVImax, EVImean had a higher R-squared than EVImax, 0.5370 vs 0.2499 (Table 2), indicating a higher climatic driving explanation of EVImean. Except for precipitation and mean temperature, minimum temperature also had a statistically significant (p < 0.05) positive correlation with EVImean change. The coefficient of spatial lag for EVImean was 0.8721, suggesting EVImean had a higher correlation with its adjacent EVImean and, therefore, a stronger spatial dependence than EVImax.

3.4. Spatial Heterogeneity of the Climatic Driving

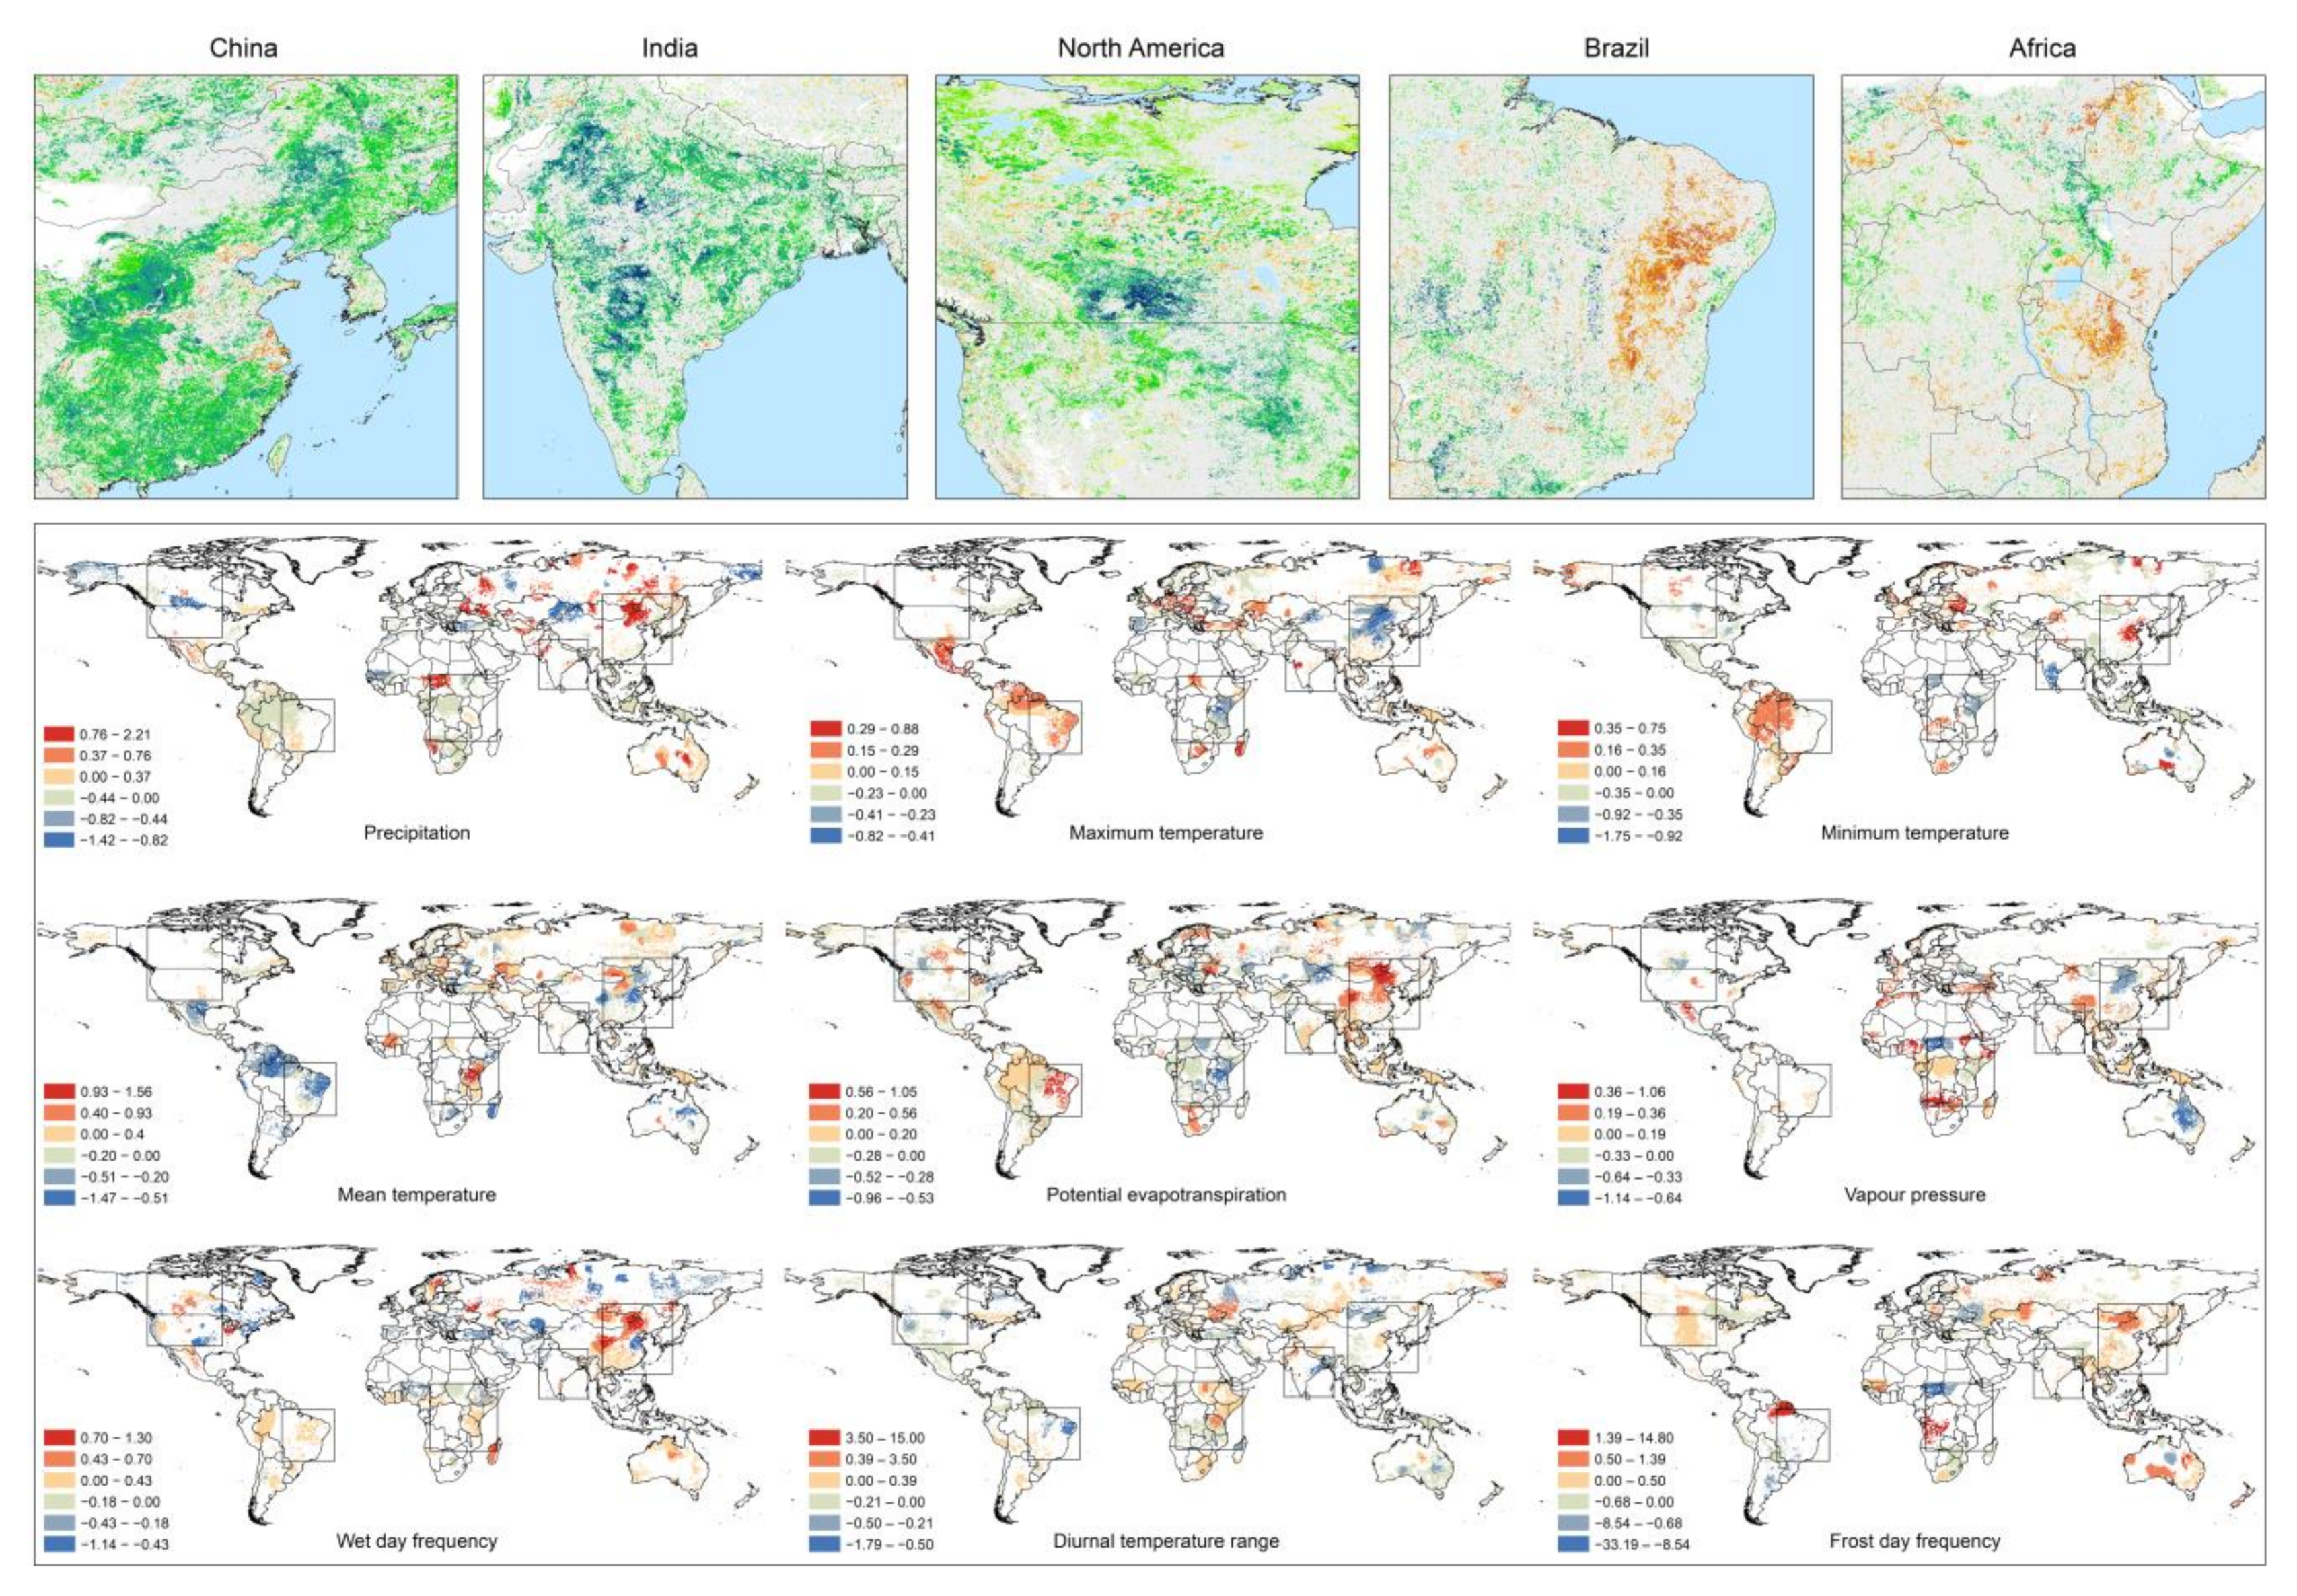
After examining the relationship at the global level by SLM, we then focused on the representative areas with significant greening or browning identified in the previous trend analysis. We further explored how climate change affects vegetation in these areas with the GWR model results. Five highly representative regions were selected for further analysis, located in China, India, North America, Brazil and Africa. The areas in China, India and North America were characterized by vegetation greening, while the areas in Africa and Brazil were characterized by vegetation browning. Local coefficients of climatic drivers for EVImax and EVImean were mapped in Figure 5 and Figure 6, respectively.
As shown in Figure 5, in Northern China, EVImax was positively affected by precipitation, potential evapotranspiration, minimum temperature and humid days, and was limited by maximum temperature and vapour pressure. However, in Southern China, maximum temperature and vapour pressure had positive effects, as well as potential evapotranspiration and humid days. The reason was that there are semi-arid areas in the north where precipitation is low and potential evapotranspiration is far greater than precipitation and the high temperature would lead to insufficient rainwater irrigation for crops and grass. It indicated that, due to the difference in climatic conditions (an arid or humid area) and vegetation types (cropland or grassland), the responses of EVImax to climate change in South and North China are inconsistent. In India, except minimum temperature, all other factors had positive impacts on the EVImax. In North America, EVImax was positively influenced by potential evapotranspiration and humid day but negative by precipitation and vapour pressure. In Brazil, the degradation of the EVImax might be due to the decrease in maximum temperature, potential evapotranspiration and humid days and the increase in mean temperature and diurnal temperature range. In Africa, the degradation of EVImax might be due to the joint decrease in mean temperature, humid days and diurnal temperature range and the increase in evapotranspiration and maximum temperature.
As shown in Figure 6, we found that maximum temperature, minimum temperature and humid days also had opposite effects on EVImean in Northern and Southern China. In addition, precipitation and vapour pressure had consistently positive effects on both the south and north. In India, potential evapotranspiration, maximum temperature and humid days had positive effects on EVImean. In North America, temperature mainly had a positive effect in these greening areas, but potential evapotranspiration and diurnal temperature range had negative effects. However, precipitation and vapour pressure had opposite impacts on Canada and the United States, with negative and positive, respectively. In Brazil, all browning areas of EVImean occurred in grassland, which might be affected by the decrease in precipitation, mean temperature, potential evapotranspiration and wet days. In Africa, degradation of vegetation also occurred in grassland and was caused by the decrease in precipitation, mean temperature, vapour pressure and wet days.
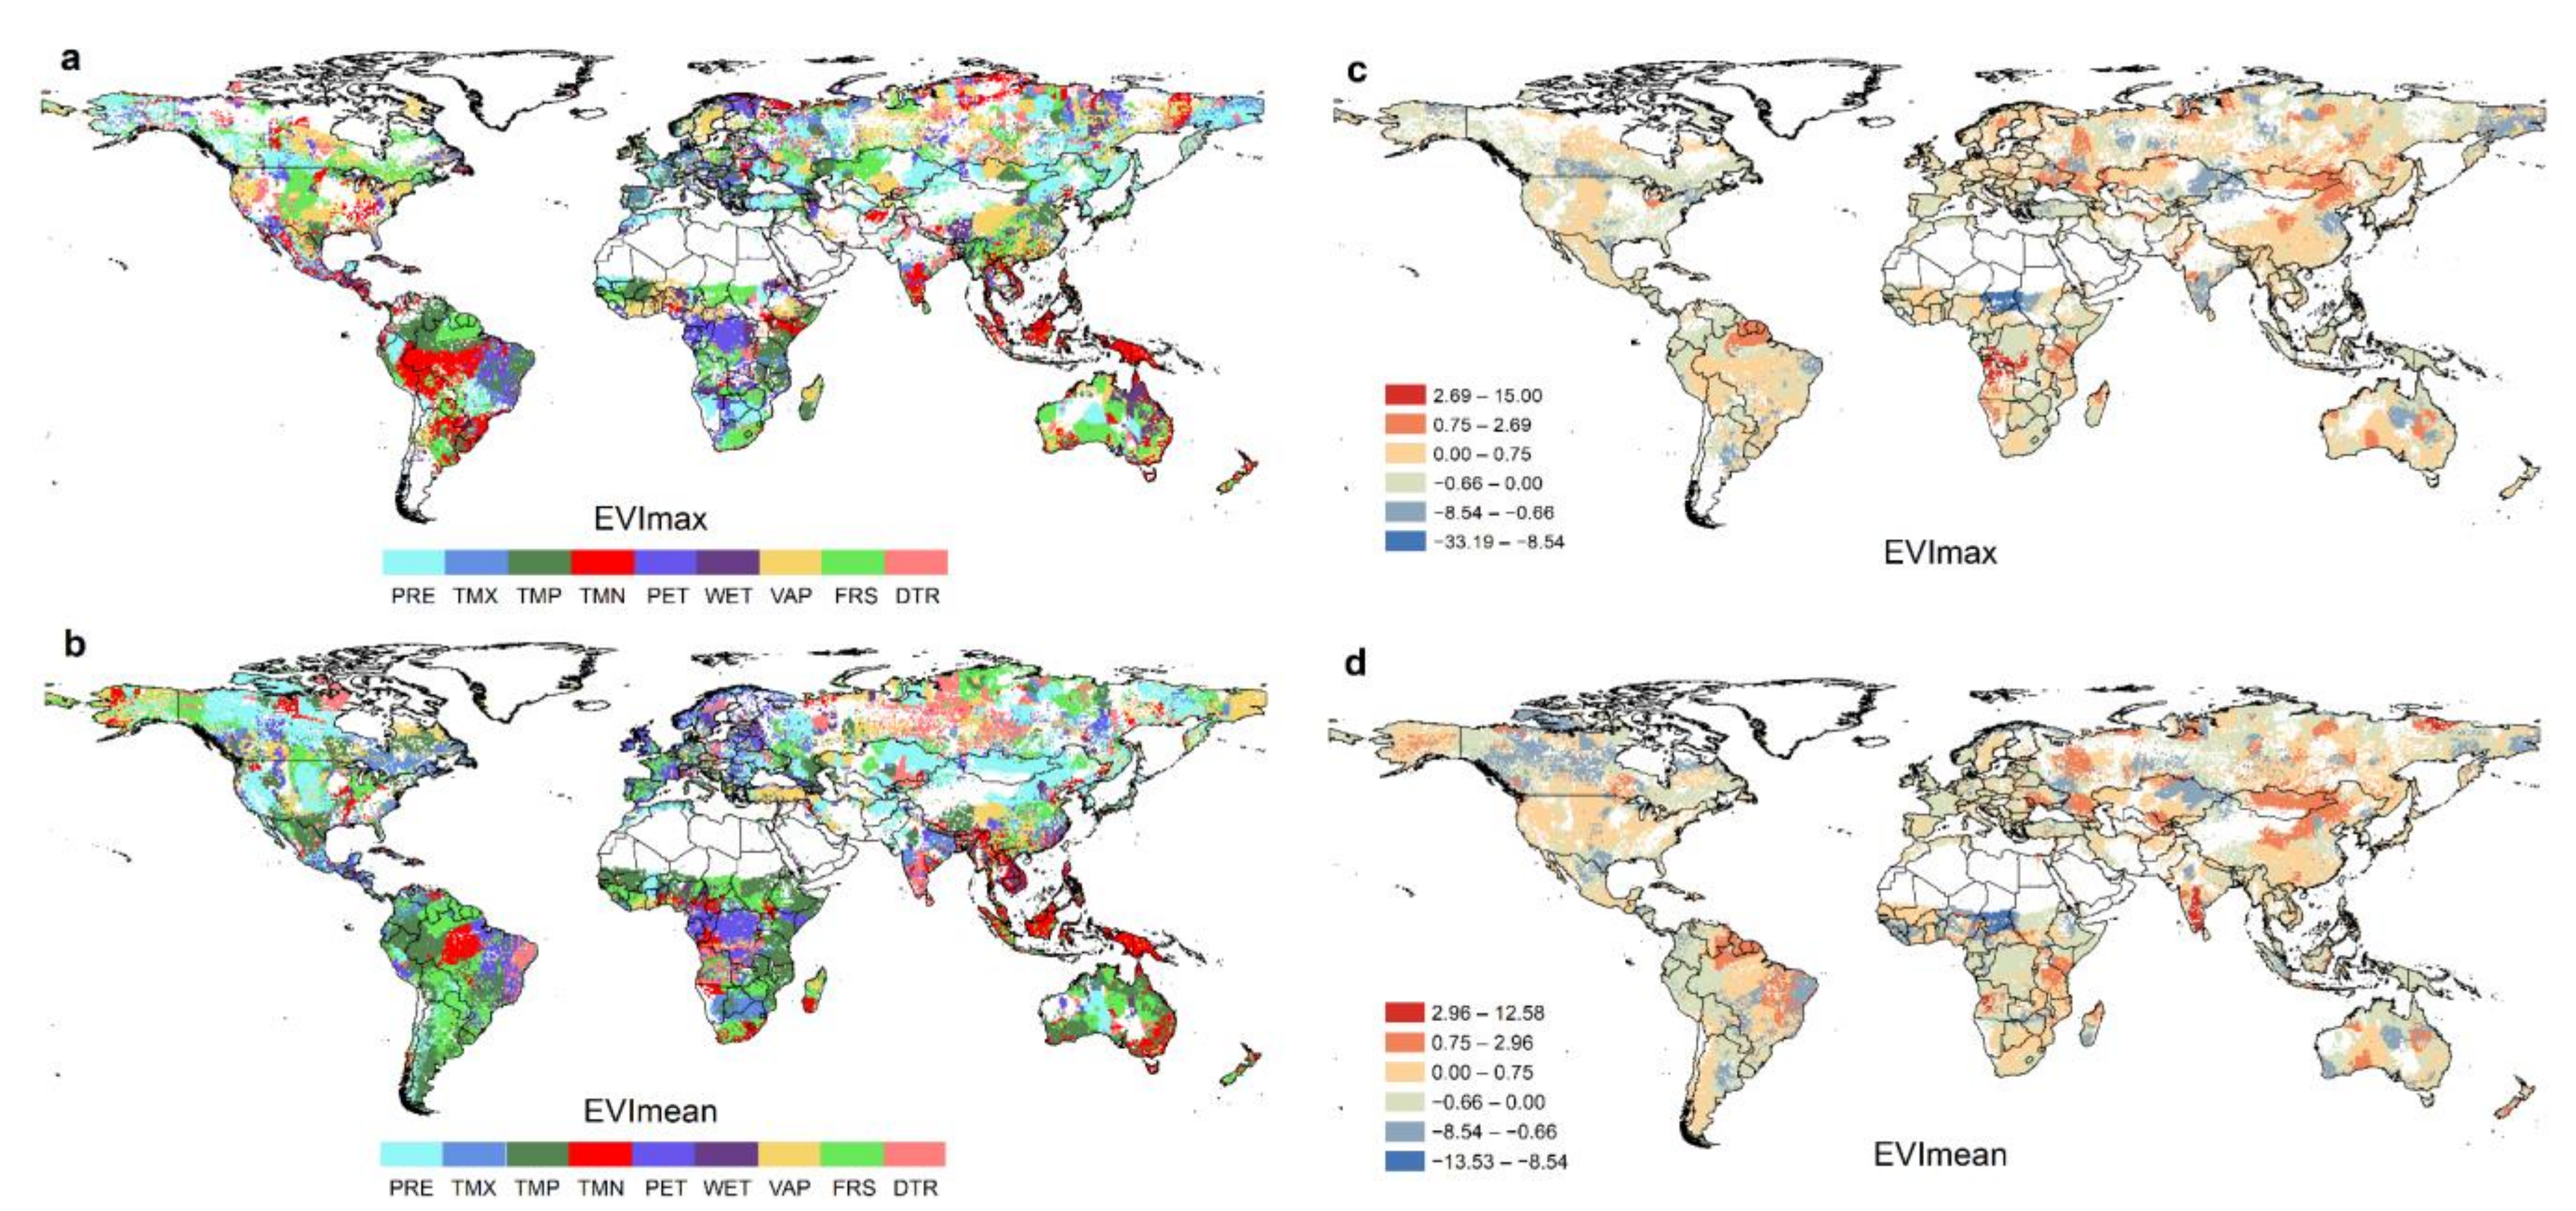
We defined the climate factor having the largest absolute value of the local coefficient with a statistical significance (p < 0.05) as the dominant climatic factor influencing vegetation change (Figure 7a,b). In the meantime, the local coefficients of the dominant climatic factors of EVImax and EVImean were mapped in Figure 7c,d. We found that the EVImax change was strongly influenced by precipitation in 14.02% of the global vegetated areas during 2001–2018, followed by vapour pressure (12.56%), minimum temperature (9.87%), mean temperature (9.10%) and potential evapotranspiration (6.96%) (Figure 7a). 21.06% of the global vegetated areas where peak vegetation growth had no significant correlation (p > 0.05) with any climatic factor. In terms of the EVImean, the global vegetated areas were strongly affected by mean temperature (17.36%) and precipitation (16.97%) (Figure 7b). There were 11.86% of the global vegetated areas where EVImean change had no significant correlation (p > 0.05) with any climatic factor.

4. Discussion

4.1. Comparison of Global Vegetation Trend Results and Uncertainties

The trends of EVImean and EVImax during 2001–2018 were detected in this study and were compared with previous studies (Table 4). Zhang et al. [24] found that the global vegetation has an increasing trend of 0.0028 yr−1 and 0.0023 yr−1 at a significant level (p < 0.0001) in EVImean and EVImax during 2001–2015, respectively. The results were consistent with our results of 0.0022 yr−1 and 0.0030 yr−1 in EVImean and EVImax, respectively. Moreover, the results from NDVI also showed the greening trend, with 0.0022 yr−1 and 0.0015 yr−1 in NDVImean and NDVImax during 2001–2015, respectively [24], 0.0013 yr−1 in NDVImax during 1982–2011 [20], and 0.0012 yr−1 in the growing season NDVI during 1982–2013 [54]. Overall, the global greening trends were found in both our and previous studies.
However, there were some differences in global vegetation greening or browning areas due to different satellite products, vegetation greenness indicators and time range. For example, Ding [57] found that 18.9% of the global vegetated area had a greening trend for EVImean during 2000–2015, while ~3% of browning (vs. 40.73% and 2.45% in this study); Chen [56] found that 34.1% of the global vegetated area showed a greening and 4.85% of browning for LAI from MODIS during 2000–2017, while 22.42% of greening and 13.54% of browning for LAI from AVHRR during 2000–2016. Furthermore, although the same satellite-derived data (MODIS Terra-C6 EVI) were used, there were still differences in area ratios of greening and browning between our study and the relevant studies, which might be due to the following reasons: (1) different vegetation monitoring time range; (2) different spatial resolution of EVI data; (3) different land cover data and starting reference year; (4) different trend analysis methods.

4.2. Potential Causes Inducing Inconsistencies in Vegetation Change

Our study found that only 15.97% of the global vegetated area experienced a consistent change (enhancement or degradation) in peak and mean growth of vegetation, and 32.47% of the global vegetated area experienced inconsistent changes in peak and mean vegetation growth. The first potential cause could be changes in plant phenology or growing season induced by climate change in these areas. In some areas, the annual EVImean showed an increasing trend while the annual EVImax remained unchanged and even decreased, indicating that with time going on, the monthly EVI, which are larger than the original annual EVImean, increased during 2001–2018, and in this case the growth circle of vegetation might be prolonged. In contrast, for the areas with increased EVImax but no significant change or decrease in EVImean, the growth circle of vegetation might be shortened. This speculation can be supported by the consistent evidence for plant phenological changes from in situ and satellite observations [59]. The earlier beginning of the growing season and autumn postponement has been widely reported in Europe, North America and China since the 1980s [60,61,62,63]. Moreover, with the stagnation of warming, spring green-up advancement’s trend might have slowed down or even reversed since the 2000s [64,65]. However, this speculation still is of great uncertainty due to the unclear vegetation phenological information and its variations in recent 20 years, which needs to be investigated in detail in further studies.
Plant phenology changes are determined by various biological and environmental factors such as nutrient and water availability, temperature and photoperiod. Temperature is generally regarded as one of the most critical controls of plant phenology through multiple processes, such as inducing the plant endodormancy by cold temperature [66] and breaking the ecodormancy by the accumulated warming [59]. For vegetation in pasture regions, precipitation variation had a significant limiting effect on its productivity [67]; this might result in the inconsistency of peak and mean greenness due to variations of annual maximum and minimum rainfall. What is more, the impact of climatic conditions on vegetation growth is more complex due to the interactions with other environmental and climatic factors [68].
In addition, anthropogenic activities, including land cover change and land use management, also could lead to the differences between annual peak and mean vegetation variations. On the one hand, the conversion between different vegetation types might directly result in the observed inconsistency between the peak and mean greenness, due to the different responses to environmental changes determined by different vegetation properties, such as thermal adaptability and photosynthetic efficiency [69]. For example, crops have higher photosynthetic efficiency than other non-crops [20]. On the other hand, land-use intensity and management could also explain the inconsistency largely. For example, anthropic seasonal irrigation and fertilization could improve the peak greenness and productivity of croplands [20,56,70], but the annual mean greenness might not enhance simultaneously.

4.3. Spatial Heterogeneity of Vegetation Growth Driven by Climate Change

Consistent with previous findings, we found that rainfall and temperature significantly impact vegetation both in peak and mean growth [20,21]. However, except for precipitation and temperature, vegetation growth was also found to be significantly correlated with other climatic factors such as potential evapotranspiration and vapour pressure in our study (Table 2). Furthermore, previous studies had neglected the spatial heterogeneity of this response. Using the GWR model, we revealed the spatial pattern of each climatic factor influencing vegetation variation. We found that not all regions had the strongest correlation between vegetation change and precipitation and temperature, which were generally considered to be the main climatic factors. For example, potential evapotranspiration contributed dominantly to the trend of EVImax and EVImean over 6.96% and 7.54% of the global vegetated area, respectively. Significant positive effects of potential evapotranspiration occurred mainly in Brazil, Northern Europe and Northeast China, while adverse effects were mainly found in Africa (Figure 7). Vapour pressure had dominant contribution to the trend of EVImax and EVImean in 12.56% and 8.95% of the global vegetation. The greening induced by climate change in the Tibetan Plateau was mainly attributed to increasing vapour pressure and temperature in this study (Figure 7), whereas that was rising in a previous study [21].

4.4. Limitations and Further Directions

Data continuity and accuracy of the VIs products are critical to accurately detect subtle changes in vegetation, which is important to the assessment of vegetation dynamics [12]. VIs are a kind of spectral vegetation index derived from satellite remote sensing, which is calculated by spectral band reflectance [14]. Thus, unlike LAI, VIs cannot be directly validated and calibrated continuously in time series by in situ measurements. A number of comparisons have been made between different satellite-based VIs datasets [12,14,16,71,72] and MODIS VIs data with improved technology, and no shifts of sensor is considered to be superior to other products in terms of data temporal consistency and has been widely used for reference data [10]. The latest MODIS Collection 6 (C6) VIs data providing several algorithmic improvements and calibration adjustments were released for correcting the negative influence of sensor degradation found in MODIS Collection 5 (C5) VIs data [17]. After release of MODIS C6 products, some studies began to evaluate differences between C5 and C6 VIs both on a local and global scale to verify that C6 products had eliminated effects of sensor degradation, and highlighted the need of re-analysing some previous results based on MODIS C5 VIs products [17,24,73]. Therefore, we selected MODIS C6 data to examine global vegetation growth trend in this study. However, the differences between MODIS EVI and NDVI were not sufficiently considered to reduce the uncertainty in detecting trend analysis in this study. Although EVI can improve reflectance sensitivity in dense vegetation areas, NDVI and EVI are generally regarded as two complementary datasets for providing more effective assessment of global vegetation dynamics [24]. Thus, it is necessary to evaluate the differences between the two datasets for monitoring vegetation dynamics using both EVI and NDVI data in the future. Moreover, research on the climatic driving mechanism of vegetation dynamic should be combined with VIs and other vegetation indicators, such as LAI and net primary productivity, which can be simulated in the process-based models, because either non-spatial or spatial regression analysis cannot explain the climate-driving mechanism from the ecological processes of vegetation growth but can only provide a hint of correlation.

5. Conclusions

This study detected the trend of global peak and average vegetation growth during 2001–2018 and mapped the inconsistency in vegetation growth, and the climatic factors that affected the inconsistency of vegetation growth were explored. The results showed that in terms of EVImax, 18.16% of the global vegetated areas are greening and 3.08% are browning, and in terms of EVImean, there are 40.73% and 2.45%, respectively. The most dramatic greening of EVImax occurred mainly in those areas with cropland agricultural activities, and the fastest degradation areas of EVImax were mainly grassland and savannas of Africa and South America. Through mapping the consistency of global vegetation growth, it was found that from 2001 to 2018, 32.47% of the global vegetated area experienced inconsistent trends in EVImax and EVImean.
The SLM was proved to be more suitable than SEM and OLS in this study for spatial regression at the global level. We found that precipitation and mean temperature had a statistically significant (p < 0.05) positive correlation with EVImax and EVImean during 2001–2018, while potential evapotranspiration and vapour pressure had a statistically significant negative correlation. The results of SLM indicated that there was spatial autocorrelation in both EVImax and EVImean change, which means the changes in EVI were correlated not only to these climatic factors but also to EVI variation in its adjacent areas. The SLM results only indicated a correlation between EVI changes and climatic drivers on the whole but failed to reveal the spatial heterogeneity of climatic drivers.
The GWR model was used to explore the spatial heterogeneity of climatic drivers influencing vegetation change by obtaining regression results for each spatial unit. The results showed that the EVImax change was strongly influenced by precipitation in 14.02% of the global vegetated areas during 2001–2018, followed by vapour pressure (12.56%), minimum temperature (9.87%), mean temperature (9.10%) and potential evapotranspiration (6.96%). In terms of the EVImean, the global vegetated areas were strongly affected by mean temperature (17.36%) and precipitation (16.97%). In China, maximum temperature and vapour pressure had opposite effects on EVImax in the north and south, and maximum temperature and humid days also had opposite effects on EVImean.Due to the difference in climatic conditions (arid or humid area) and vegetation types (cropland or grassland), the responses of EVI to climate change were inconsistent. Climate change could affect vegetation characteristics by changing plant phenology, consequently rendering the inconsistency between peak and mean greening. In addition, anthropogenic activities, including land cover change and land use management, also could lead to the differences between annual peak and mean vegetation variations.

Author Contributions

Conceptualization, D.Z. and X.W.; data curation, W.C.; formal analysis, D.Z.; funding acquisition, X.W.; investigation, D.Z., X.G., W.C., L.F. and X.W.; methodology, D.Z. and W.C.; project administration, X.W.; resources, R.Y.; software, X.G.; supervision, X.W.; validation, D.Z., X.G. and X.W.; visualization, L.F.; writing—original draft, D.Z.; writing—review and editing, X.G., W.C., R.Y. and X.Z. All authors have read and agreed to the published version of the manuscript.

Funding

This research was funded by the National Key Research and Development Program of China, grant number 2016YFC0502700.

Institutional Review Board Statement

Not applicable.

Informed Consent Statement

Not applicable.

Data Availability Statement

The data that support the findings of this study are available from the corresponding author upon reasonable request.

Acknowledgments

The authors are grateful to the Level-1 and Atmosphere Archive and Distribution System Distributed Active Archive Center (LAADS DAAC) (https://ladsweb.modaps.eosdis.nasa.gov/search) and the Climatic Research Unit Time-Series version 4.03 (CRU TS4.03) datasets (https://data.ceda.ac.uk/badc/cru/data/cru_ts) for the data access.

Conflicts of Interest

The authors declare no conflict of interest.

References

  1. Law, B.E.; Falge, E.; Gu, L.; Baldocchi, D.D.; Bakwin, P.; Berbigier, P.; Davis, K.; Dolman, A.J.; Falk, M.; Fuentes, J.D.; et al. Environmental controls over carbon dioxide and water vapor exchange of terrestrial vegetation. Agric. For. Meteorol. 2002, 113, 97–120. [Google Scholar] [CrossRef] [Green Version]
  2. Nemani, R.R.; Keeling, C.D.; Hashimoto, H.; Jolly, W.M.; Piper, S.C.; Tucker, C.J.; Myneni, R.B.; Running, S.W. Climate-driven increases in global terrestrial net primary production from 1982 to 1999. Science 2003, 300, 1560–1563. [Google Scholar] [CrossRef] [Green Version]
  3. Friedlingstein, P.; Cox, P.; Betts, R.; Bopp, L.; Von Bloh, W.; Brovkin, V.; Cadule, P.; Doney, S.; Eby, M.; Fung, I.; et al. Climate-carbon cycle feedback analysis: Results from the (CMIP)-M-4 model intercomparison. J. Clim. 2006, 19, 3337–3353. [Google Scholar] [CrossRef]
  4. Lee, X.; Goulden, M.L.; Hollinger, D.Y.; Barr, A.; Black, T.A.; Bohrer, G.; Bracho, R.; Drake, B.; Goldstein, A.; Gu, L.; et al. Observed increase in local cooling effect of deforestation at higher latitudes. Nature 2011, 479, 384–387. [Google Scholar] [CrossRef] [PubMed]
  5. Piao, S.; Wang, X.; Park, T.; Chen, C.; Lian, X.; He, Y.; Myneni, R.B. Characteristics, drivers and feedbacks of global greening. Nat. Rev. Earth Environ. 2019, 1, 14–27. [Google Scholar] [CrossRef]
  6. Li, Y.; Zhao, M.; Motesharrei, S.; Mu, Q.; Kalnay, E.; Li, S. Local cooling and warming effects of forests based on satellite observations. Nat. Commun. 2015, 6, 6603. [Google Scholar] [CrossRef] [PubMed] [Green Version]
  7. Forzieri, G.; Alkama, R.; Miralles, D.G.; Cescatti, A. Satellites reveal contrasting responses of regional climate to the widespread greening of Earth. Science 2017, 356, 1180–1184. [Google Scholar] [CrossRef] [Green Version]
  8. Tucker, C.J.; Pinzon, J.E.; Brown, M.E.; Slayback, D.A.; Pak, E.W.; Mahoney, R.; Vermote, E.F.; El Saleous, N. An extended AVHRR 8-km NDVI dataset compatible with MODIS and SPOT vegetation NDVI data. Int. J. Remote Sens. 2005, 26, 4485–4498. [Google Scholar] [CrossRef]
  9. Maisongrande, P.; Duchemin, B.; Dedieu, G. VEGETATION/SPOT: An operational mission for the Earth monitoring; presentation of new standard products. Int. J. Remote Sens. 2004, 25, 9–14. [Google Scholar] [CrossRef]
  10. Huete, A.; Didan, K.; Miura, T.; Rodriguez, E.P.; Gao, X.; Ferreira, L.G. Overview of the radiometric and biophysical performance of the MODIS vegetation indices. Remote Sens. Environ. 2002, 83, 195–213. [Google Scholar] [CrossRef]
  11. Fensholt, R.; Rasmussen, K.; Nielsen, T.T.; Mbow, C. Evaluation of earth observation based long term vegetation trends—Intercomparing NDVI time series trend analysis consistency of Sahel from AVHRR GIMMS, Terra MODIS and SPOT VGT data. Remote Sens. Environ. 2009, 113, 1886–1898. [Google Scholar] [CrossRef]
  12. Tian, F.; Fensholt, R.; Verbesselt, J.; Grogan, K.; Horion, S.; Wang, Y. Evaluating temporal consistency of long-term global NDVI datasets for trend analysis. Remote Sens. Environ. 2015, 163, 326–340. [Google Scholar] [CrossRef]
  13. Beck, H.E.; McVicar, T.R.; van Dijk, A.I.J.M.; Schellekens, J.; de Jeu, R.A.M.; Bruijnzeel, L.A. Global evaluation of four AVHRR–NDVI data sets: Intercomparison and assessment against Landsat imagery. Remote Sens. Environ. 2011, 115, 2547–2563. [Google Scholar] [CrossRef]
  14. Tarnavsky, E.; Garrigues, S.; Brown, M.E. Multiscale geostatistical analysis of AVHRR, SPOT-VGT, and MODIS global NDVI products. Remote Sens. Environ. 2008, 112, 535–549. [Google Scholar] [CrossRef]
  15. Wang, D.; Morton, D.; Masek, J.; Wu, A.; Nagol, J.; Xiong, X.; Levy, R.; Vermote, E.; Wolfe, R. Impact of sensor degradation on the MODIS NDVI time series. Remote Sens. Environ. 2012, 119, 55–61. [Google Scholar] [CrossRef] [Green Version]
  16. Kern, A.; Marjanović, H.; Barcza, Z. Evaluation of the Quality of NDVI3g Dataset against Collection 6 MODIS NDVI in Central Europe between 2000 and 2013. Remote Sens. 2016, 8, 955. [Google Scholar] [CrossRef] [Green Version]
  17. Lyapustin, A.; Wang, Y.; Xiong, X.; Meister, G.; Platnick, S.; Levy, R.; Franz, B.; Korkin, S.; Hilker, T.; Tucker, J.; et al. Scientific impact of MODIS C5 calibration degradation and C6+ improvements. Atmos. Meas. Tech. 2014, 7, 4353–4365. [Google Scholar] [CrossRef] [Green Version]
  18. Zhu, Z.; Bi, J.; Pan, Y.; Ganguly, S.; Anav, A.; Xu, L.; Samanta, A.; Piao, S.; Nemani, R.R.; Myneni, R.B. Global Data Sets of Vegetation Leaf Area Index (LAI)3g and Fraction of Photosynthetically Active Radiation (FPAR)3g Derived from Global Inventory Modeling and Mapping Studies (GIMMS) Normalized Difference Vegetation Index (NDVI3g) for the Period 1981 to 2011. Remote Sens. 2013, 5, 927–948. [Google Scholar]
  19. Pan, Y.; Birdsey, R.A.; Fang, J.; Houghton, R.; Kauppi, P.E.; Kurz, W.A.; Phillips, O.L.; Shvidenko, A.; Lewis, S.L.; Canadell, J.G.; et al. A Large and Persistent Carbon Sink in the World’s Forests. Science 2011, 333, 988–993. [Google Scholar] [CrossRef] [Green Version]
  20. Huang, K.; Xia, J.; Wang, Y.; Ahlstrom, A.; Chen, J.; Cook, R.B.; Cui, E.; Fang, Y.; Fisher, J.B.; Huntzinger, D.N.; et al. Enhanced peak growth of global vegetation and its key mechanisms. Nat. Ecol. Evol. 2018, 2, 1897–1905. [Google Scholar] [CrossRef] [PubMed]
  21. Zhu, Z.; Piao, S.; Myneni, R.B.; Huang, M.; Zeng, Z.; Canadell, J.G.; Ciais, P.; Sitch, S.; Friedlingstein, P.; Arneth, A.; et al. Greening of the Earth and its drivers. Nat. Clim. Chang. 2016, 6, 791–795. [Google Scholar] [CrossRef]
  22. Pan, N.; Feng, X.; Fu, B.; Wang, S.; Ji, F.; Pan, S. Increasing global vegetation browning hidden in overall vegetation greening: Insights from time-varying trends. Remote Sens. Environ. 2018, 214, 59–72. [Google Scholar] [CrossRef]
  23. Gao, M.D.; Piao, S.L.; Chen, A.P.; Yang, H.; Liu, Q.; Fu, Y.S.H.; Janssens, I.A. Divergent changes in the elevational gradient of vegetation activities over the last 30 years. Nat. Commun. 2019, 10, 2970. [Google Scholar] [CrossRef]
  24. Zhang, Y.; Song, C.; Band, L.E.; Sun, G.; Li, J. Reanalysis of global terrestrial vegetation trends from MODIS products: Browning or greening? Remote Sens. Environ. 2017, 191, 145–155. [Google Scholar] [CrossRef] [Green Version]
  25. Le Quere, C.; Moriarty, R.; Andrew, R.M.; Canadell, J.G.; Sitch, S.; Korsbakken, J.I.; Friedlingstein, P.; Peters, G.P.; Andres, R.J.; Boden, T.A.; et al. Global Carbon Budget 2015. Earth Syst. Sci. Data 2015, 7, 349–396. [Google Scholar] [CrossRef] [Green Version]
  26. Myers-Smith, I.H.; Kerby, J.T.; Phoenix, G.K.; Bjerke, J.W.; Epstein, H.E.; Assmann, J.J.; John, C.; Andreu-Hayles, L.; Angers-Blondin, S.; Beck, P.S.A.; et al. Complexity revealed in the greening of the Arctic. Nat. Clim. Chang. 2020, 10, 106–117. [Google Scholar] [CrossRef] [Green Version]
  27. Keenan, T.F.; Riley, W.J. Greening of the land surface in the world’s cold regions consistent with recent warming. Nat. Clim. Chang. 2018, 8, 825–828. [Google Scholar] [CrossRef] [PubMed]
  28. Corlett, R.T. Impacts of warming on tropical lowland rainforests. Trends Ecol. Evol. 2011, 26, 606–613. [Google Scholar] [CrossRef]
  29. Huang, M.; Piao, S.; Ciais, P.; Penuelas, J.; Wang, X.; Keenan, T.F.; Peng, S.; Berry, J.A.; Wang, K.; Mao, J.; et al. Air temperature optima of vegetation productivity across global biomes. Nat. Ecol. Evol. 2019, 3, 772–779. [Google Scholar] [CrossRef] [PubMed]
  30. Shen, M.; Piao, S.; Cong, N.; Zhang, G.; Jassens, I.A. Precipitation impacts on vegetation spring phenology on the Tibetan Plateau. Glob. Chang. Biol. 2015, 21, 3647–3656. [Google Scholar] [CrossRef] [Green Version]
  31. Yuan, W.; Zheng, Y.; Piao, S.; Ciais, P.; Lombardozzi, D.; Wang, Y.; Ryu, Y.; Chen, G.; Dong, W.; Hu, Z.; et al. Increased atmospheric vapor pressure deficit reduces global vegetation growth. Sci. Adv. 2019, 5, eaax1396. [Google Scholar] [CrossRef] [Green Version]
  32. Hua, W.; Chen, H.; Zhou, L.; Xie, Z.; Qin, M.; Li, X.; Ma, H.; Huang, Q.; Sun, S. Observational Quantification of Climatic and Human Influences on Vegetation Greening in China. Remote Sens. 2017, 9, 425. [Google Scholar] [CrossRef] [Green Version]
  33. Wei, H.; Zhao, X.; Liang, S.L.; Zhou, T.; Wu, D.H.; Tang, B.J. Effects of Warming Hiatuses on Vegetation Growth in the Northern Hemisphere. Remote Sens. 2018, 10, 683. [Google Scholar] [CrossRef] [Green Version]
  34. Anselin, L. Spatial Econometrics: Methods and Models; Kluwer Academic Publishers: Dordrecht, The Netherlands, 1988. [Google Scholar]
  35. Cliff, A.D.; Ord, J.K. Spatial Processes: Models and Applications; Pion: London, UK, 1981. [Google Scholar]
  36. Kissling, W.D.; Carl, G. Spatial autocorrelation and the selection of simultaneous autoregressive models. Glob. Ecol. Biogeogr. 2007, 17, 59–71. [Google Scholar] [CrossRef]
  37. Tobler, W. On the First Law of Geography: A Reply. Ann. Assoc. Am. Geogr. 2004, 94, 304–310. [Google Scholar] [CrossRef]
  38. Anselin, L.; Li, X. Tobler’s Law in a Multivariate World. Geogr. Anal. 2020, 52, 494–510. [Google Scholar] [CrossRef]
  39. Beale, C.M.; Lennon, J.J.; Yearsley, J.M.; Brewer, M.J.; Elston, D.A. Regression analysis of spatial data. Ecol. Lett. 2010, 13, 246–264. [Google Scholar] [CrossRef]
  40. Zeng, Z.; Piao, S.; Li, L.Z.X.; Zhou, L.; Ciais, P.; Wang, T.; Li, Y.; Lian, X.; Wood, E.F.; Friedlingstein, P.; et al. Climate mitigation from vegetation biophysical feedbacks during the past three decades. Nat. Clim. Chang. 2017, 7, 432–436. [Google Scholar] [CrossRef]
  41. Begueria, S.; Pueyo, Y. A comparison of simultaneous autoregressive and generalized least squares models for dealing with spatial autocorrelation. Glob. Ecol. Biogeogr. 2009, 18, 273–279. [Google Scholar] [CrossRef] [Green Version]
  42. Dormann, C.F. Effects of incorporating spatial autocorrelation into the analysis of species distribution data. Glob. Ecol. Biogeogr. 2007, 16, 129–138. [Google Scholar] [CrossRef]
  43. Mauricio Bini, L.; Diniz-Filho, J.A.F.; Rangel, T.F.L.V.B.; Akre, T.S.B.; Albaladejo, R.G.; Albuquerque, F.S.; Aparicio, A.; Araújo, M.B.; Baselga, A.; Beck, J.; et al. Coefficient shifts in geographical ecology: An empirical evaluation of spatial and non-spatial regression. Ecography 2009, 32, 193–204. [Google Scholar] [CrossRef]
  44. Ver Hoef, J.M.; Peterson, E.E.; Hooten, M.B.; Hanks, E.M.; Fortin, M.J. Spatial autoregressive models for statistical inference from ecological data. Ecol. Monogr. 2018, 88, 36–59. [Google Scholar] [CrossRef] [Green Version]
  45. Chen, W.; Chi, G.; Li, J. The spatial association of ecosystem services with land use and land cover change at the county level in China, 1995–2015. Sci. Total Environ. 2019, 669, 459–470. [Google Scholar] [CrossRef]
  46. Griffith, D.A. Spatial-Filtering-Based Contributions to a Critique of Geographically Weighted Regression (GWR). Environ. Plan. A Econ. Space 2008, 40, 2751–2769. [Google Scholar] [CrossRef]
  47. Sen, P.K. Estimates of the Regression Coefficient Based on Kendall’s Tau. J. Am. Stat. Assoc. 1968, 63, 1379–1389. [Google Scholar] [CrossRef]
  48. Jiang, W.; Yuan, L.; Wang, W.; Cao, R.; Zhang, Y.; Shen, W. Spatio-temporal analysis of vegetation variation in the Yellow River Basin. Ecol. Indic. 2015, 51, 117–126. [Google Scholar] [CrossRef]
  49. Mann, H.B. Nonparametric Tests against Trend. Econometrica 1945, 13, 245–259. [Google Scholar] [CrossRef]
  50. Kendall, M.G. Rank Correlation Methods; Charles Griffin: London, UK, 1975. [Google Scholar]
  51. Moran, P.A.P. The Interpretation of Statistical Maps. J. R. Stat. Soc. Ser. B-Stat. Methodol. 1948, 10, 243–251. [Google Scholar] [CrossRef]
  52. Brunsdon, C.; Fotheringham, S.; Charlton, M. Geographically weighted regression-modelling spatial non-stationarity. J. R. Stat. Soc. Ser. Statistician. 1998, 47, 431–443. [Google Scholar] [CrossRef]
  53. Foody, G.M. Geographical weighting as a further refinement to regression modelling: An example focused on the NDVI–rainfall relationship. Remote. Sens. Environment. 2003, 88, 283–293. [Google Scholar] [CrossRef]
  54. Zhao, L.; Dai, A.; Dong, B. Changes in global vegetation activity and its driving factors during 1982–2013. Agric. For. Meteorol. 2018, 249, 198–209. [Google Scholar] [CrossRef]
  55. Yuan, X.L.; Hamdi, R.; Ochege, F.U.; Kurban, A.; De Maeyer, P. The sensitivity of global surface air temperature to vegetation greenness. Int. J. Climatol. 2021, 41, 483–496. [Google Scholar] [CrossRef]
  56. Chen, C.; Park, T.; Wang, X.; Piao, S.; Xu, B.; Chaturvedi, R.K.; Fuchs, R.; Brovkin, V.; Ciais, P.; Fensholt, R.; et al. China and India lead in greening of the world through land-use management. Nat. Sustain. 2019, 2, 122–129. [Google Scholar] [CrossRef]
  57. Ding, Z.; Peng, J.; Qiu, S.; Zhao, Y. Nearly Half of Global Vegetated Area Experienced Inconsistent Vegetation Growth in Terms of Greenness, Cover, and Productivity. Earths Future 2020, 8, e2020EF001618. [Google Scholar] [CrossRef]
  58. Zhang, Y.; Song, C.; Band, L.E.; Sun, G. No Proportional Increase of Terrestrial Gross Carbon Sequestration from the Greening Earth. J. Geophys. Res. Biogeosci. 2019, 124, 2540–2553. [Google Scholar] [CrossRef]
  59. Piao, S.; Liu, Q.; Chen, A.; Janssens, I.A.; Fu, Y.; Dai, J.; Liu, L.; Lian, X.; Shen, M.; Zhu, X. Plant phenology and global climate change: Current progresses and challenges. Glob. Chang. Biol. 2019, 25, 1922–1940. [Google Scholar] [CrossRef]
  60. Fu, Y.H.; Piao, S.; Op de Beeck, M.; Cong, N.; Zhao, H.; Zhang, Y.; Menzel, A.; Janssens, I.A. Recent spring phenology shifts in western Central Europe based on multiscale observations. Glob. Ecol. Biogeogr. 2014, 23, 1255–1263. [Google Scholar] [CrossRef]
  61. Gallinat, A.S.; Primack, R.B.; Wagner, D.L. Autumn, the neglected season in climate change research. Trends Ecol. Evol. 2015, 30, 169–176. [Google Scholar] [CrossRef]
  62. Ge, Q.; Wang, H.; Rutishauser, T.; Dai, J. Phenological response to climate change in China: A meta-analysis. Glob. Chang. Biol. 2015, 21, 265–274. [Google Scholar] [CrossRef]
  63. Gill, A.L.; Gallinat, A.S.; Sanders-DeMott, R.; Rigden, A.J.; Short Gianotti, D.J.; Mantooth, J.A.; Templer, P.H. Changes in autumn senescence in northern hemisphere deciduous trees: A meta-analysis of autumn phenology studies. Ann. Bot. 2015, 116, 875–888. [Google Scholar] [CrossRef] [Green Version]
  64. Wang, X.; Piao, S.; Xu, X.; Ciais, P.; MacBean, N.; Myneni, R.B.; Li, L. Has the advancing onset of spring vegetation green-up slowed down or changed abruptly over the last three decades? Glob. Ecol. Biogeogr. 2015, 24, 621–631. [Google Scholar] [CrossRef]
  65. Park, H.; Jeong, S.-J.; Ho, C.-H.; Park, C.-E.; Kim, J. Slowdown of spring green-up advancements in boreal forests. Remote Sens. Environ. 2018, 217, 191–202. [Google Scholar] [CrossRef]
  66. Delpierre, N.; Vitasse, Y.; Chuine, I.; Guillemot, J.; Bazot, S.; Rutishauser, T.; Rathgeber, C.B.K. Temperate and boreal forest tree phenology: From organ-scale processes to terrestrial ecosystem models. Ann. For. Sci. 2016, 73, 5–25. [Google Scholar] [CrossRef] [Green Version]
  67. Sloat, L.L.; Gerber, J.S.; Samberg, L.H.; Smith, W.K.; Herrero, M.; Ferreira, L.G.; Godde, C.M.; West, P.C. Increasing importance of precipitation variability on global livestock grazing lands. Nat. Clim. Chang. 2018, 8, 214–218. [Google Scholar] [CrossRef]
  68. Flynn, D.F.B.; Wolkovich, E.M. Temperature and photoperiod drive spring phenology across all species in a temperate forest community. New Phytol. 2018, 219, 1353–1362. [Google Scholar] [CrossRef] [PubMed] [Green Version]
  69. Walther, S.; Guanter, L.; Heim, B.; Jung, M.; Duveiller, G.; Wolanin, A.; Sachs, T. Assessing the dynamics of vegetation productivity in circumpolar regions with different satellite indicators of greenness and photosynthesis. Biogeosciences 2018, 15, 6221–6256. [Google Scholar] [CrossRef] [Green Version]
  70. Gao, X.; Liang, S.; He, B. Detected global agricultural greening from satellite data. Agric. For. Meteorol. 2019, 276–277, 107652. [Google Scholar] [CrossRef]
  71. Bai, Y.; Yang, Y.; Jiang, H. Intercomparison of AVHRR GIMMS3g, Terra MODIS, and SPOT-VGT NDVI Products over the Mongolian Plateau. Remote Sens. 2019, 11, 2030. [Google Scholar] [CrossRef] [Green Version]
  72. Fensholt, R.; Proud, S.R. Evaluation of Earth Observation based global long term vegetation trends—Comparing GIMMS and MODIS global NDVI time series. Remote Sens. Environ. 2012, 119, 131–147. [Google Scholar] [CrossRef]
  73. Heck, E.; de Beurs, K.M.; Owsley, B.C.; Henebry, G.M. Evaluation of the MODIS collections 5 and 6 for change analysis of vegetation and land surface temperature dynamics in North and South America. ISPRS J. Photogramm. Remote Sens. 2019, 156, 121–134. [Google Scholar] [CrossRef]
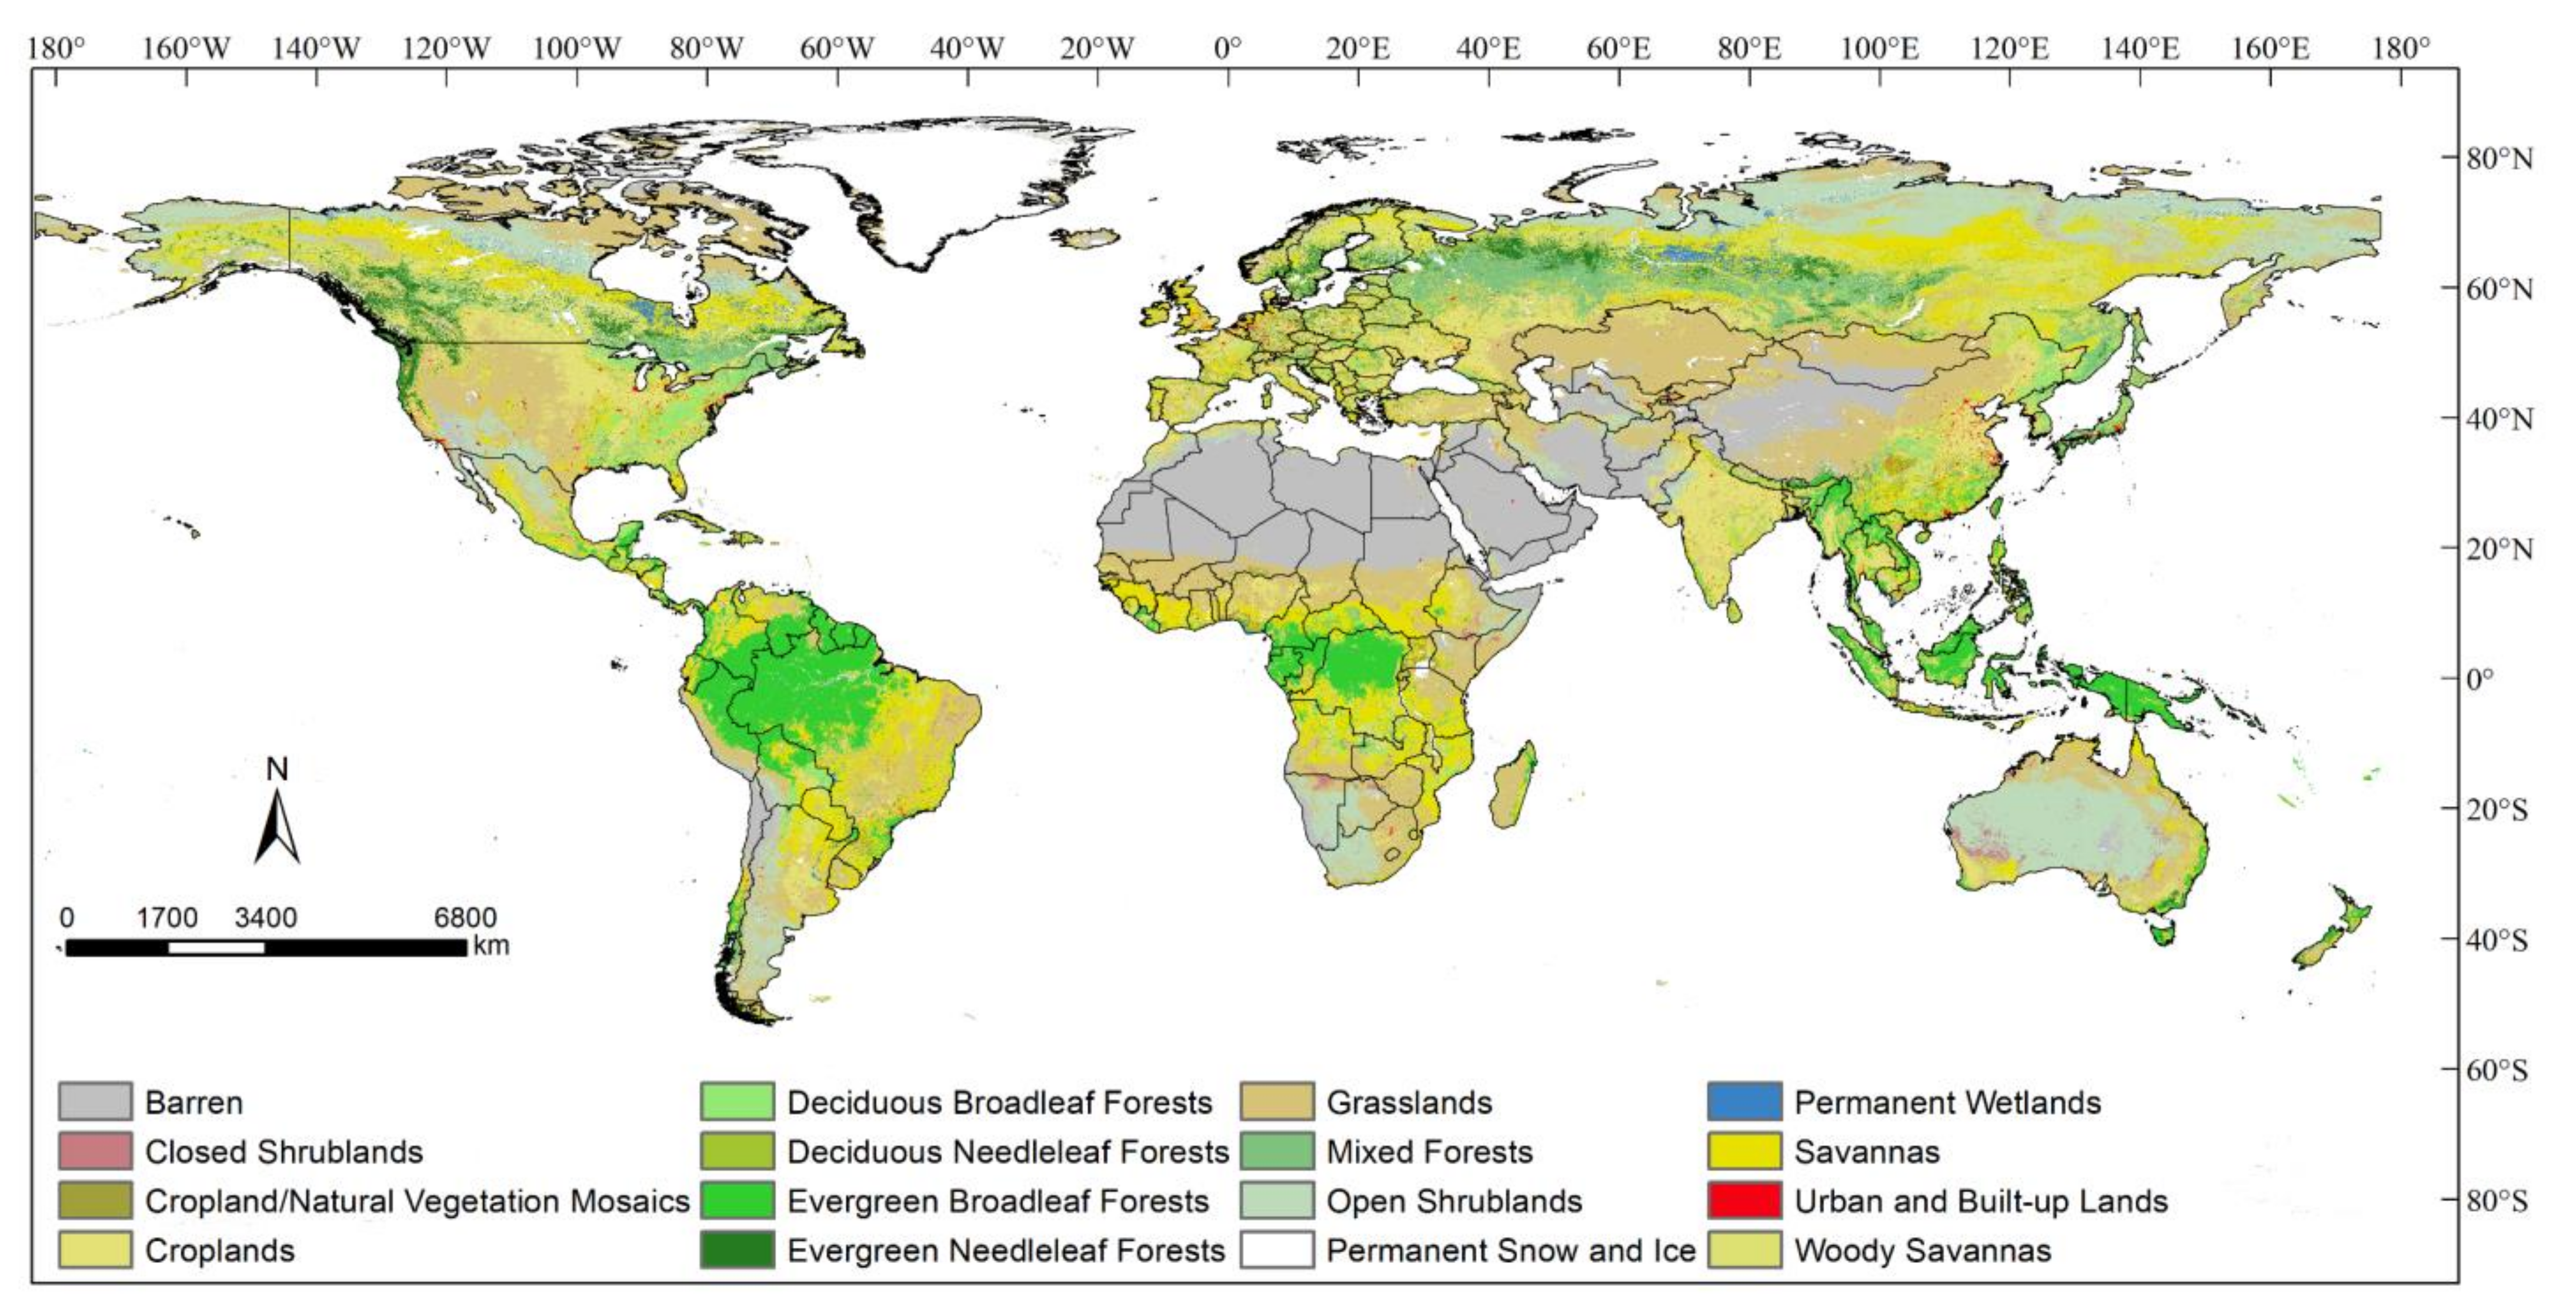
Figure 1. Global land cover of IGBP for 2018.
Remotesensing 13 03442 g001
Figure 2. A methodological flowchart of this research.
Remotesensing 13 03442 g002
Figure 3. Trends of global vegetation growth during 2001–2018. (a) Trend in EVImax at each grid. (b) Trend in EVImean at each grid. White indicates non-vegetated areas including barren, permanent snow and ice, permanent wetlands, and urban and built-up lands. Vegetated areas with statistically insignificant (Mann-Kendall test, p < 0.05) are colored grey.
Remotesensing 13 03442 g003
Figure 4. Inconsistency between EVImax and EVImean variations during 2001–2018.
Remotesensing 13 03442 g004
Figure 5. Local coefficients of climatic factors influencing EVImax from the GWR model. Five highly representative areas of the EVImax trend were given in the figure.
Remotesensing 13 03442 g005
Figure 6. Local coefficients of all climatic factors influencing EVImean from the GWR model. Five highly representative areas of the EVImean trend were given in the figure.
Remotesensing 13 03442 g006
Figure 7. Dominant climatic drivers influencing (a) EVImax and (b) EVImean; local coefficients of the dominant climatic factors for (c) EVImax and (d) EVImean at each grid.
Remotesensing 13 03442 g007
Table 1. Global datasets and sources.
DatasetSpatial ResolutionTemporal ResolutionTime SpanSource
MODIS-Terra Collection 6 EVI (MOD13A3)1 kmMonthly2001–2018The Level-1 and Atmosphere Archive and Distribution System Distributed Active Archive Center (LAADS DAAC) (https://ladsweb.modaps.eosdis.nasa.gov/search, accessed on 6 August 2020).
Land Cover (MCD12Q1)500 mYearly2001–2018
Precipitation0.5°Monthly2001–2018The Climatic Research Unit Time-Series version 4.03 (CRU TS4.03) datasets (https://data.ceda.ac.uk/badc/cru/data/cru_ts, accessed on 11 February 2021)
Maximum temperature0.5°Monthly2001–2018
Mean temperature0.5°Monthly2001–2018
Minimum temperature0.5°Monthly2001–2018
Potential evapotranspiration0.5°Monthly2001–2018
Vapour pressure0.5°Monthly2001–2018
Wet day frequency0.5°Monthly2001–2018
Diurnal temperature range0.5°Monthly2001–2018
Frost day frequency0.5°Monthly2001–2018
Table 2. Comparison of spatial regression models.
Dependent VariablesModelR2LIKAICSC
EVImaxOLS0.022996,424.5−192,829−192,739
SLM0.2499103,235.0−206,448−206,349
SEM0.2498103,225.8−206,432−206,342
EVImeanOLS0.081784,046.7−168,073−167,983
SLM0.5370102,864.0−205,706−205,606
SEM0.5372102,851.1−205,682−205,592
Notes: R-squared (R2), maximum likelihood logarithm (LIK), Akaike information criterion (AIC), Schwarz criterion (SC), Ordinary least square (OLS), Spatial lag model (SLM), Spatial error model (SEM).
Table 3. Regression results of spatial lag model (SLM).
Dependent VariablesIndependent VariablesCoefficientStandard ErrorZ StatisticProbability
EVImaxLag term0.74720.0059126.96900.00000
Constant--->0.05
PRE0.01050.00382.73550.00623
TMX--->0.05
TMP0.00600.00292.03980.04137
TMN--->0.05
PET−0.01420.0027−5.26880.00000
WET--->0.05
VAP −0.01100.0027−4.10290.00004
FRS--->0.05
DTR--->0.05
EVI max = 0.0105 PRE + 0.0060 TMP 0.0142 PET 0.0110 VAP + 0.7472 Lag   term + ε
EVImeanLag term0.87210.0038227.83300.00000
Constant--->0.05
PRE0.0165 0.00384.32190.00002
TMX--->0.05
TMP0.01110.00293.76690.00017
TMN0.00790.00155.08600.00000
PET−0.01370.0027−5.07940.00000
WET--->0.05
VAP −0.0138 0.0027−5.13190.00000
FRS--->0.05
DTR--->0.05
EVI mean = 0.0165   PRE + 0.0111 TMP + 0.0079 TMN 0.0137 PET 0.0138 VAP + 0.8721 Lag   term + ε
Notes: Lag term here is the spatial lag variable of the dependent variable obtained by the spatial weight matrix in 2.2.3; PRE = precipitation, TMX = maximum temperature, TMP = mean temperature, TMN = minimum temperature, PET = potential evapotranspiration, WET = wet day frequency, VAP = vapour pressure, FRS = frost day frequency, DTR = diurnal temperature range.
Table 4. Comparison of global vegetation change trend results.
Time RangeIndexDatasetsSpatial ResolutionAveraged TrendGreening Area RatioBrowning Area RatioReferences
1982–2011NDVImaxGIMMS3g1/12°0.0013 yr−1 **--[20]
1982–2013NDVIgsGIMMS3g1/12°0.0012 yr−1 ***48% *8% *[54]
1982–2014LAIgsGIMMS3g1/12°0.032 m2m−2yr−1 **35% **4% **[21]
1982–2015NDVIGIMMS3g1/12°-50% **8% **[55]
LAIGIMMS3g1/12°-23% **15% **
1982–2016LAIAVHRR1/12°-40.91% *10.59% *[56]
2000–2017LAIMODIS C6500 m-34.1% *4.85% *
2000–2016LAIAVHRR1/12°-22.42% *13.54% *
2001–2015NDVIMODIS Terra-C60.05°0.0022 yr−1 ****23.1% **10.5% **[24]
NDVImaxMODIS Terra-C60.05°0.0015 yr−1 ****--
EVIMODIS Terra-C60.05°0.0028 yr−1 ****22.8% **3.3% **
EVImaxMODIS Terra-C60.05°0.0023 yr−1 ****--
2001–2013NDVIMODIS Aqua-C60.05°-12.1% **-
EVIMODIS Aqua-C60.05°-14.3% **-
NDVIGIMMS3g1/12°-13.8% **-
2000–2015NDVIMODIS Terra-C60.05°-~16% **~5% **[57]
EVIMODIS Terra-C60.05°-18.9% **~3% **
LAIMODIS Terra-C60.05°-~17% **~3% **
2000–2015NDVIMODIS Terra-C60.05°0.0023 yr−1 ****28.6% **5.4% **[58]
2001–2018EVIMODIS Terra-C61 km0.0022 yr−1 **40.73% **2.45% **This study
EVImaxMODIS Terra-C61 km0.0030 yr−1 **18.16% **3.08% **
Notes: NDVImax and EVImax refer to the annual maximum NDVI and EVI, respectively, and unsubscripted ones represent the annual mean values; NDVIgs and LAIgs refer to NDVI and LAI for growing season, respectively; **** p < 0.0001, *** p < 0.01, ** p < 0.05, * p < 0.1.
Publisher’s Note: MDPI stays neutral with regard to jurisdictional claims in published maps and institutional affiliations.