Abstract
The seasonal surface changes of glaciers in Tien Shan have seen little prior investigation despite the increase in geodetic studies of multi-year changes. In this study, we analyzed the potential of an Unmanned Aerial Vehicle (UAV) to analyze seasonal surface change processes of the Urumqi Glacier No. 1 in eastern Tien Shan. We carried out UAV surveys at the beginning and the end of the ablation period in 2018. The high-precision evolution of surface elevation, geodetic mass changes, surface velocity, and terminus change in the surveyed ablation area were correspondingly derived in combination with ground measurements, including stake/snow-pit observation and GPS measurement. The derived mean elevation change in the surveyed ablation area was −1.64 m, corresponding to the geodetic mass balance of approximately −1.39 m w.e. during the ablation period in 2018. The mean surface velocity was 3.3 m/yr and characterized by the spatial change of the velocity, which was less in the East Branch than in the West Branch. The UAV survey results were a little less than those from the ground measurements, and the correlation coefficient was 0.88 for the surface elevation change and 0.87 for surface displacement. The relative error of the glacier terminus change was 4.5% for the East Branch and 6.2% for the West Branch. These results show that UAV photogrammetry is ideal for assessing seasonal glacier surface changes and has a potential application in the monitoring of detailed glacier changes.
1. Introduction
The glacier, one of the core elements of the cryosphere, is a natural indicator of climate change [1,2]. Against the background of global warming, glaciers around the world have been retreating [3,4,5], which will have significant effects on the water resources, the water cycle, the ecological environment, agricultural and social systems, etc. [6,7,8]. Therefore, it is important to investigate glacier change processes on different scales with various methods.
In situ observation is the basis for understanding the response of glaciers to climate and for predicting the future changes in glaciers [9,10]. As the direct linkage between glacier and climate change, the change in mass balance is the primary observational item. The traditional method of glacier mass balance measurement is based on the stake/pit observation, which is not only labor and time consuming but topographically limited. The comparison of glacier surface elevations between two or more surveys can provide the mass balance change during the survey period and is regarded as the geodetic method. Since surface elevation surveying is the core of this method, several techniques have been used in different periods, including ground stereophotogrammetric survey, GPS surface elevation survey, remote sensing DEM data, etc. Stereophotogrammetry and GPS surveying have a relatively high accuracy but are limited to individual glaciers. Remote sensing can be carried out on regional scale and has thus been widely applied [4,11]. For small and complex topographic glaciers, however, remote sensing resolution is still relatively low to date. In recent years, the UAV technology has been developed rapidly due to its strong maneuverability, convenience, and low cost. By using UAV, besides surface elevation, ice velocity and topographic characteristics can also be monitored. For example, [12] deployed a UAV to study the distribution and characteristics of glacier surface features (e.g., evolution of ice cliffs, supraglacial pond systems) over a debris-covered glacier. The seasonal glacier surface velocity change was further derived from high-resolution UAV photogrammetry by [13] and [14]. In China, a UAV was initially used in monitoring the glacier hazard emergency [15] and in the survey of a temperate glacier with a complex terrain [16,17]. The influence of the distribution of ground control points on the precision of UAV photogrammetric measurements was also discussed [18]. However, UAV application in glacier monitoring is still basically at the preliminary stage.
Taking this into account, we chose Urumqi Glacier No. 1 (UG1) in eastern Tien Shan as the experimental sample, which is classified by WGMS as a reference glacier in the arid and semi-arid regions of central Asia (https://wgms.ch/products_ref_glaciers/ (accessed on 1 May 2021) and has been surveyed since 1959. In 2018, repeated UAV surveys were carried out on UG1 in late April and late August. Therefore, this study firstly presents the seasonal change in glacier surface elevation, surface velocity, and surface characteristics derived from the repeated UAV surveys, and then performs an error analysis through the comparison of in situ measurement results, and finally discusses the existing problems and prospects in the application of UAV in the monitoring of glacier change.
2. Study Area
The eastern Tien Shan extends for 1700 km, from China’s borders with Kyrgyzstan and Kazakhstan in the west, to Xingxingxia Gobi of Xinjiang in the east. UG1 (43°06′30′′N, 86°48′30′′E) is located at the headwaters of the Urumqi River in eastern Tien Shan (Figure 1). It is a typical cirque valley glacier facing the northeast and is composed of east and west branches. The glacier covered a total area of 1.555 km2 in 2015 [19], and the average annual glaciological mass balance was −0.35 m w.e. a−1 during the period of 1960–2018 [20]. From 1981 to 2009, the cumulative geodetic mass balance was −12.2 m w.e. (−0.44 m w.e. a−1) based on the comparison of various topographic surveys [21]. During the period of 2015–2017, the annual geodetic mass balance of this glacier was −0.72 m w.e. and −0.68 m w.e. in 2015–2016 and 2016–2017, respectively, and −0.75 m w.e. and −1.11 m w.e. in the summers of 2015 and 2016, respectively, calculated using long-range terrestrial laser scanning [19].
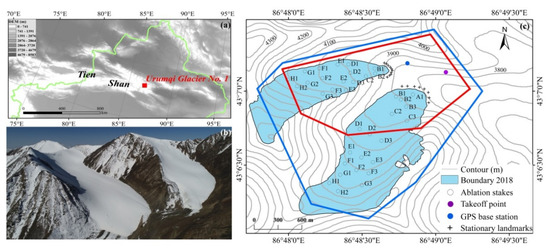
Figure 1.
Location of Urumqi Glacier No. 1 in Xinjiang, eastern Tien Shan (a). A photograph of the glacier taken by a UAV in April 2018 (b), and the extent of the UAV surveys on 24 April and 26 August 2018 are marked on the topographic map with the red and blue polygons, respectively (c).
UG1 belongs to the summer accumulation type, mainly influenced by both the westerly circulation and the Indian Monsoon [22,23]. The climatic records of the Daxigou Meteorological Station (3539 m a.s.l.), ~3 km southeast of UG1, shows that the annual mean temperature and precipitation are −4.9 °C and 469 mm, respectively, and the increase rates of annual temperature and precipitation are 0.24 °C (10a)−1 and 18.6 mm (10a)−1, respectively, from 1959 to 2018.
3. Data and Method
3.1. UAV Surveys
UG1 was repeatedly surveyed by UAV on 24 April and 26 August 2018. MATRICE 200 UVA made by DJI Technology Co, Ltd equipped with a CMOS image sensor was used, with a size of 1 inch and effective pixels of 20 megapixels (Figure 2a). Both surveys were implemented between 11 a.m. and 1 p.m., Beijing time, to avoid or minimize UAV destabilization by katabatic winds. Detailed information of the UAV campaigns is shown in Table 1. The chosen time was approximately at the beginning and at the end of the ablation season, which is consistent with the in situ mass balance measurements and GPS surveys. The flight ranges of the two UAV surveys and the launch point are marked in Figure 1. The survey in April was only focused on the glacier tongue because of the lack of operational experience and the accelerated consumption of battery power due to the lower temperature at high altitudes. The later survey in August covered nearly the whole glacier. Two flights were performed for each survey, and each flight lasted from 15 to 20 minutes. A total of 186 and 243 optical images were acquired after removing some redundant, distorted, and blurred images.
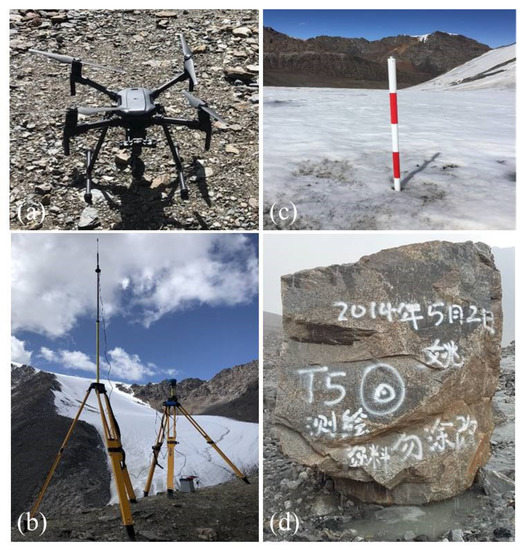
Figure 2.
The (a) UAV platform, (b) GNSS survey, (c) ablation stakes, and (d) stationary landmarks to the terminus of Urumqi Glacier No. 1 used in this study.

Table 1.
Overview of the UAV campaigns performed in the UG1.
The UAV flew automatically along the flight course predefined by Pix4D capture (https://www.pix4d.com/product/pix4dcapture, accessed on 1 May 2021) and took photographs at a certain time interval (Figure 3). The position and altitude of the UAV at the exposure stations, which were obtained by the built-in integrated Position and Orientation System (POS, composed of a global positioning system and inertial measurement units), were recorded in JPEG images. The Ground Control Points (GCPs) were marked by 2 m×2 m red waterproof cloths distributed evenly in the surrounding non-glaciated area to improve the accuracy in the UAV surveys. In order to avoid measurement errors in the GCPs caused by glacier movement and glacial surface terrain change, the measurement of GCPs and the UAV survey were conducted simultaneously. The positions of the GCPs were concurrently surveyed by the Real Time Kinematic-Global Navigation Satellite System (RTK-GNSS), and the equipment of Trimble R10 was used (Figure 2b). The GNSS receiver was placed at a fixed base point near the glacier terminus, and the rest receiver was used to survey the GCPs simultaneously. The vertical and horizontal errors of the GNSS survey points were 15 mm + 0.5 ppm and 8 mm + 0.5 ppm, respectively. In other words, the data we obtained from the UAV surveys mainly included photos, GCP coordinates, and POS data.
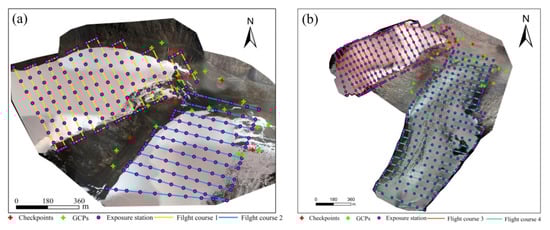
Figure 3.
UAV flight coverage areas on orthomosaic images of Urumqi Glacier No. 1 on 24 April 2018 (a) and 26 August 2018 (b). The red crosses and green crosses indicate the checkpoints and Ground Control points (GCPs), respectively.
3.2. UAV Data Processing
3.2.1. Orthomosaic and Glacier Surface DEMs
The UAV survey data processing and output for the orthomosaic and DEMs were handled with the Pix4Dmapper software, following the steps described on the official homepage (https://www.pix4d.com/product/pix4dmapper-photogrammetry-software (accessed on 10 January 2020)). Three steps were mainly included. Firstly, the feature-matching algorithm was used to match the key points on the images with those that exist in the overlapping area of the taken images, including the non-glaciated region. Then, the focal length, the coordinates of the points on the image, and the POS data were used to reconstruct the locations and orientations of the camera at each exposure point. Finally, the sparse point cloud was obtained. Multi-view stereo pairing was also used to densify the point cloud to improve the spatial resolution of the products. At last, Apr.-DEM and Aug.-DEM were generated with the respective resolution of 0.09 m and 0.11 m based on the irregular network and were used to project every image pixel in order to calculate the georeferenced orthomosaic images. The UAV data processing mentioned above is consistent with previous studies, including those of [12,13,16,17,24].
3.2.2. Surface Elevation Change and Geodetic Mass Balance Conversion
Glacier surface elevation change in the ablation season can be obtained by the comparison of Apr.-DEM and Aug.-DEM. The DEMs differencing was carried out in ArcMap v.10.2. The two DEMs were resampled to the same spatial resolution in order to ensure the accuracy of calculation, and coordinate normalization was carried out using a unified UTM projection and WGS84 ellipsoid. The DEMs were probably misaligned in space. Thus, a co-registration of the two DEMs was necessary before extracting glacier surface elevation changes [25]. The DEM biases depended on the elevation differences, slope, and aspect over the non-glaciated area; Apr.-DEM was used as master DEM. All iterations of the co-registration adjustment were stopped when the improvement in standard deviation of elevation difference on the non-glaciated area was < 2%. The error caused by different spatial resolutions between the two DEMs was refined using the relationship between elevation differences and maximum curvatures for both on- and non-glaciated areas [26]. Figure 4 illustrates the co-registration of the Aug.-DEM and the Apr.-DEM.
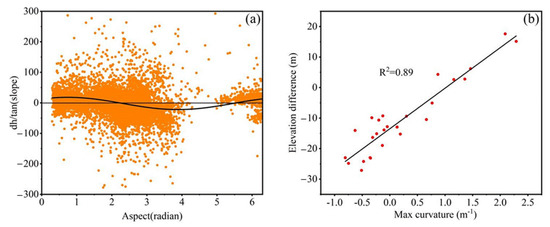
Figure 4.
Scatterplots of the (a) aspect vs. slope standardized elevation differences, and the (b) maximum curvature vs. elevation difference for the period from Aug.-DEM to Apr.-DEM.
To estimate the errors of the derived surface elevation changes, the residual elevation differences in the non-glaciated area were estimated assuming that heights in these areas had remained unchanged. The overall errors of the derived surface elevation changes could then be estimated using the mean elevation changes and the standard deviation of elevation difference from the non-glaciated area. After co-registration, the elevation differences in the non-glaciated area were concentrated on the mean elevation difference at 0.68 m. It was concluded that elevation difference in the non-glaciated area had stabilized, making the processed DEMs suitable for estimating glacier surface elevation change.
The calculated glacier surface elevation change was then converted to geodetic mass balance in water equivalent (w.e.) between the two surveys. For the mass balance conversion, it is important to determine the snow and ice density. [27] recommended a constant density of 850 kg m−3 with an uncertainty of ±60 kg m−3, based on an empirical firn densification model with idealized surface mass balance forcing. But it is appropriate for long-term observations of more than five years. Some other studies classified a glacier into firn and bare-ice areas and then used different density conversions [28,29]. However, since surface change is complicated due to the frequent alternation of ablation and accumulation on UG1 in the summer [23,30], this surface classification is not applicable in density conversion. Therefore, in our study, the density distribution was derived by extrapolating the single-point values from in situ measurements to the surveyed area. In addition, the glacier terminus change during the same ablation season could be obtained by comparing the successive orthomosaic images of the UG1 at the beginning and the end of the ablation season.
3.2.3. Ice Velocity
The ice velocity was obtained using the COSI-Corr (Co-registration of Optically Sensed Images and Correlation) tool in the ENVI software. It has been widely used to co-register pairs of optical remotely sensed images and determine glacier displacement by comparing multi-source images, including UAV, Landsat, MODIS, etc. [12,13,16,31]. The orthomosaic images obtained at the beginning and the end of the ablation season were firstly put in the software and an SNR (Signal-to-Noise Ratio) threshold was then set to eliminate some abnormal values. The NLM (Non-Local Means Filter) algorithm was used to filter the repetitive and redundant information of the images, and the standard deviation was estimated to finally determine the ice velocity of the UG1 in the ablation season.
3.3. In Situ Measurements
3.3.1. Mass Balance Measurement
The mass balance during the ablation season could be obtained directly from the stake/snow pit observation made on 27 April and 28 August in 2018. The specific mass balance was achieved from every single ablation stake (Figure 2c). In 2018, there were forty-two ablation stakes arranged in eight rows in the East Branch and seven rows in the West Branch, as shown in Figure 1. The former UAV survey extent covered 7 ablation stakes in the East Branch and 17 ablation stakes in the West Branch. The latter UAV survey covered all the ablation stakes in the glacier. The observation items included the stake vertical height above the glacier surface, the thickness and density of each snow/firn layer, and superimposed ice thickness at individual ablation stakes. The density of superimposed ice was assumed to be 900 kg/m3 due to the difficulty of in situ measurement. The mass balance between the two observations could be calculated from these observation data. According to [32], the mass balance measurement uncertainty should be ±0.43 m w.e. a−1, without considering the systematic uncertainties.
3.3.2. Surface Velocity Measurement
The glacier surface velocity was measured during the ablation period in 2018 by the repeated GPS surveys on 25 April and 29 August 2018. The Trimble R10 GNSS was used with the mode of the real-time kinematic-global position system. The forty-two ablation stakes were positioned two times from these measurements. The base station was placed at the fixed base point near the glacier terminus, as shown in Figure 2b. The roving antennas were carried out simultaneously to survey the stake coordinates. The surface velocity in the ablation period of 2018 could be obtained by calculating the stake displacements between the two measurements. The positioning error was 10 mm + 1 ppm in horizontal and 20 mm + 1 ppm in vertical. The estimated error of the surface velocity should be less than 10%, according to [33,34].
3.3.3. Glacier Terminus Location
The glacier terminus position has been measured during every field survey since 1959 by the Tianshan Glaciological Station. Eight and ten stationary landmarks are evenly selected at the front of the east and west branches of this glacier (Figure 1c; Figure 2d). The distance of each stationary landmark perpendicular to the glacier edge was measured by tape measure on 25 April and 28 August 2018. The terminus change of the glacier branches during the ablation period could be obtained then from the comparison of the measured distances.
4. Results
4.1. Glacier Surface Elevation Change and Geodetic Mass Balance
The geodetic mass balance was calculated by multiplying the changes in the spatially distributed glacier surface elevation with the corresponding distributed density conversion. The measured changes of glacier surface elevation over the survey area varied from −2.8 to −0.4 m during the period from 24 April to 26 August 2018 based on the two UAV surveys (Figure 5a). The mean elevation change was −1.64 m, with the standard deviation of 0.2 m. The interpolated density conversion indicated that the density was between 841 kg m−3 and 900 kg m−3 (Figure 5b). The derived geodetic mass balance was between −0.31 and 2.58 m in water equivalent (Figure 5c), with the mean value of 1.39 m w.e. It can be seen from Figure 4 that obvious differences exist between the West and East branches. The reason for this is that the repeat UAV survey area covered a smaller area of the East Branch tongue, but a larger part of the West Branch (see Figure 1); thus, elevation decrease is larger and surface density is apparently higher in the East Branch than in the West Branch.
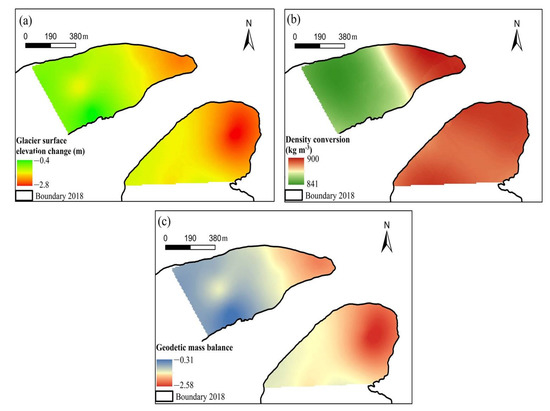
Figure 5.
Surface elevation changes (a), distributed density conversion (b), and the corresponding glacier geodetic mass balance (c) of the surveyed area for the UG1 during the ablation period in 2018.
4.2. Glacier Surface Velocity and Terminus Change
Figure 6 shows the distribution of the glacier surface displacement derived from the comparison of the two orthomosaic images from the UAV surveys during the ablation season in 2018. According to this figure, the mean, maximum, and minimum displacements are 1.1 m, 1.28 m, and 0.97 m, respectively. Then, the surface velocity distribution could be obtained by dividing the time interval by the displacement. The calculated mean surface velocity is 3.3 m/yr and the maximum and minimum values are 5.7 m/yr and 2.9 m/yr, respectively. Figure 6 also indicates that the spatial change of the velocity is less in the East Branch than in the West Branch.
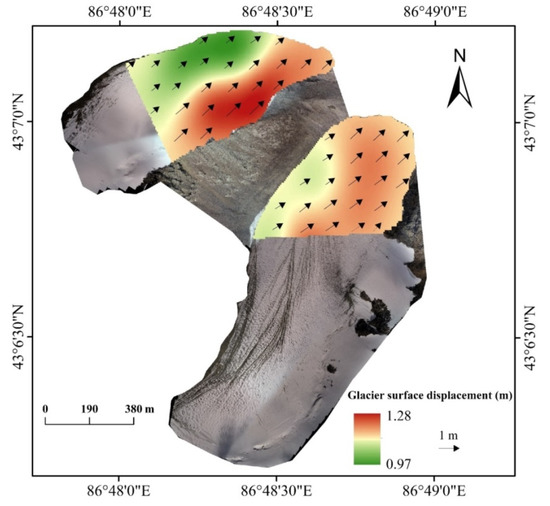
Figure 6.
Glacier surface displacement during the ablation season in 2018.
In addition, comparison of the two orthomosaic images demonstrate the change of glacier terminus during the period between the surveys. The result shows that the terminus of the East Branch and the West Branch retreated by 10.5 m and 6.1 m, respectively, during the ablation season. This is consistent with the larger mass loss at the East Branch terminus (Figure 5).
4.3. Glacier Surface Characteristics
There are many signs that indicate the rapid melting of the glacier, such as the dirty surface, the supraglacial river, ice avalanches, a river at the glacier terminus, and a lake. An extensive supraglacial river exists due to strong ablation (Figure 7a). This process may have increased the transportation of incoming shortwave radiation onto the glacier surface because of the low albedo of the supraglacial river. It also increases ablation area and forms unique erosional features. Figure 7b shows the river streams running to the non-glaciated area and a lake that was formed at the glacier terminus. The river discharge is larger in July and August due to stronger glacier melting and thus the lake area on 26 August was ~ 0.02 km2; in contrast, at the end of April, the river and lake did not appear because the glacier had begun to enter the ablation period. Figure 7c shows ice avalanches at the glacier snout of the West Branch, which may have been caused by steep terrain with the accelerated retreat in the ablation period. The upper-right edge of the East Branch is precipitous and the glacier has obviously thinned, as shown in Figure 7d, indicating drastic ablation.
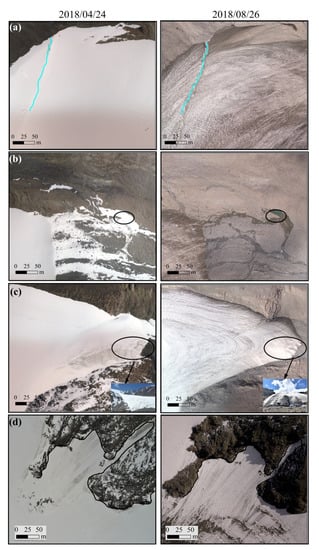
Figure 7.
Details of changes in the selected area of the Urumqi Glacier No.1. The left column shows orthomosaic images from 24 April 2018. The right column shows orthomosaic images from 26 August 2018. The blue line represents the supraglacial river on East Branch, and the black circle and line show the same places captured in April and August 2018.
5. Discussion
5.1. The Quality of Point Cloud Data and DEM Differencing
The point density and completeness of UAV survey is especially important in relation to DEM derivation. In our study, point densities related to UAV photogrammetry are more regular and constant. In the case of UAV photogrammetry, the homogeneity of point density might be due to the regular structure of the airborne photogrammetric block. UAV photogrammetry could be well-depicted in vertical photos, as shown in Figure 7. Additionally, the horizontal surfaces on the surveyed ablation area could also be described by point clouds obtained from UAV photogrammetry.
The distribution of the GCPs for the UAV survey and their measurement are crucial in the acquisition of high-precision data products [13,14,18]. GCPs in off-glacier regions were surveyed using the RTK-GPS to provide accurate direct georeferencing and registration in our study, as also recommended by [35]. As shown in Figure 3, seven check points for each survey were used, which were distributed in the non-glaciated area. The total RMSE of the check points were smaller than 0.7 m (Figure 8), slightly higher than those previously reported in high mountain glacial environments [36,37,38]. The error sources might include the suboptimal distribution and density of the GCPs [37], the delay between the UAV surveys, and the lack of coincidence between GCP placement and the UAV flights. However, although the GCPs were distributed as evenly as possible within the UAV survey area, it was difficult for humans to reach the tall and steep slopes on both sides of the glacier, thus limiting the establishment of the GCPs in the higher altitudes (Figure 3), which may have caused errors after the co-registration between the DEMs. To further reduce the uncertainty of UAV photogrammetric blocks, a better distribution of GCPs should be considered. In addition, the intrinsic precision of GPS measurements and image resolution could also be an error source.
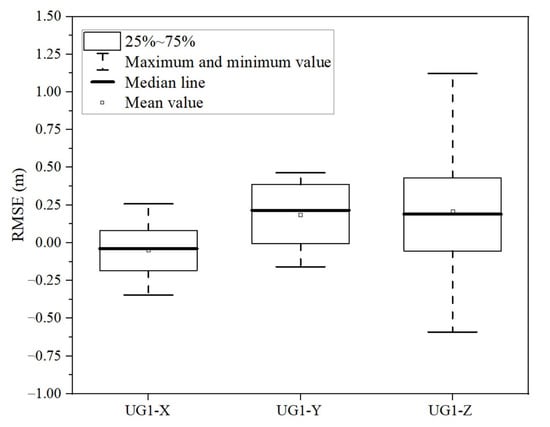
Figure 8.
Box plots of the error of check points in the x, y, z directions. The horizontal lines represent the median value, boxes show the upper and lower quartiles, and whiskers indicate minimum and maximum values.
The vertical accuracy of the difference between the Apr.-DEM and Aug.-DEM was assessed by comparing the elevation difference in the non-glaciated area, assuming that the topography was unchanged. As shown in Figure 9, the accuracy was with decimeter accuracy, with a mean value of 0.2 m for the ablation season. Such decimeter-scale uncertainty supports the acquisition of the glacier elevation changes and surface velocity according to [17]. Another important factor here is that the same co-registration area still changes due to the inflow of the glacier meltwater and the modification of the sediment.
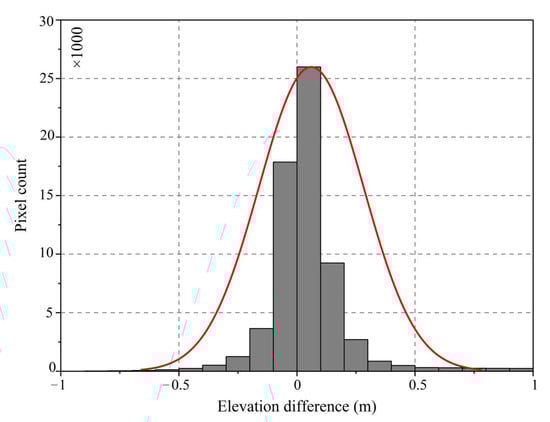
Figure 9.
Histogram of surface elevation difference in the non-glaciated area during the ablation season.
5.2. Accuracy of the Seasonal Surface Change from UAV Surveys
The stake observation results were used to objectively assess the accuracy of the surface elevation change from the UAV survey. Figure 10a shows a scatter plot of the observed change in stake height against the elevation change from the UAV survey at the corresponding site. The points in the figure scatter with a little upward deviation to the 1:1 line, with an R2 value of 0.88, which means that the elevation change is a little underestimated from the UAV survey in general. A comparison of the results of the stake measurement and the UAV survey produces a mean difference of 0.26 m and a relative error of 15.7%. The result also shows that relative error is lower on the West Branch (14.3%) than on the East Branch (18.2%), suggesting that error decreases with an increase in the measured point since there are 17 stakes on the West Branch and only 7 stakes on the East Branch in the survey area.
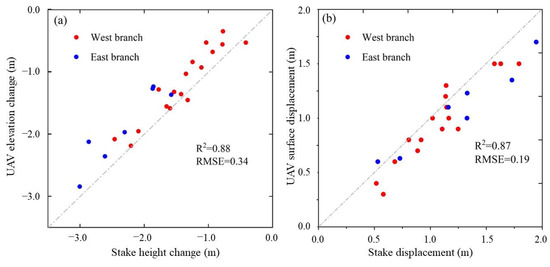
Figure 10.
Comparison of surface elevation change (a) and displacement (b) from the UAV survey and in situ measurement at individual stakes in the surveyed area.
The stake displacements from the GPS measurement were compared with the corresponding UAV survey results, as shown in Figure 10b. This indicates that the R2 between them is 0.87, and similar to the elevation results, UAV displacement is generally lower than the GPS measured value. The mean relative error is 11.4% for total stakes, 10.6% on the East Branch, and 13% on the West branch.
The glacier terminus change derived from the UAV survey was 10.5 m and 6.1 m for the East and West branches, respectively; these were less than the ground measurement with the relative errors of 4.5% and 6.2%, respectively.
The comparisons mentioned above indicate that the uncertainty of the UAV survey is lower in the horizontal measurement than in the vertical, and decreases with survey area extension. The UAV survey results, on the whole, are acceptable on a seasonal time scale.
5.3. Prospect of UAV Surveys in Glacier Change Monitoring
In our surveys, the advantage of using UAV in glacier monitoring is obvious. A few people were required for the UAV surveys, which were also considerably faster, flexible, and allowed for high-resolution investigations of seasonal changes in glaciers in complex mountain regions. In terms of costs, UAV surveys are also more advantageous compared with other instruments such as the long-range terrestrial laser scanner (TLS) surveys, since UAV instruments are much less expensive at approximately EUR 4,500 as compared to TLS (approximately EUR 200,000). UAV surveys can simultaneously provide information on multiple parameters of glacier change such as surface elevation, ice velocity, glacier edge changes, and surface characteristics. For example, the existence of the clean and dirty area on the glacier surface is captured by the UAV, as shown in Figure 7a, b, c. The dirty area has a larger mass loss than the clean area. Such a phenomenon can be explained by the enrichment of light-absorbing impurities, including black carbon, organic carbon, dust, and living organisms, which directly reduce the glacier surface albedo and further lead to accelerated glacier melting. Light-absorbing impurities on the surface of the UG1 have been confirmed [39,40,41], although the contribution of light-absorbing impurities to albedo reduction varies in different regions [42,43]. If more sensors were used, e.g., with a multispectral camera, its application would be more powerful. Hence, the UAV is a beneficial complement to direct glaciological mass balance and satellite remote sensing since it has application potential in the acquisition of orthographic images, the construction of DSM, and the production of large-scale topographic maps, which have been largely discussed by [44]. Meanwhile, UAVs offer an on-demand alternative to existing imaging technologies. At this stage, it is indisputable that UAV survey has some limitations in glacier monitoring. Firstly, meteorological conditions are most important in UAV flight stability and data acquisition, especially wind conditions. Lower air density at higher elevations also significantly reduces propeller-generated lift and negatively impacts maximum flight time. These factors directly determine the total flight time and consequently the maximum possible survey (covered) area of the UAV. Secondly, the difference of flight heights and lines of each UAV survey will influence the glacier change monitoring. Since the UAV moves quickly (∼ 8 m/s), the flight heights and lines of each UAV survey can produce significant errors; although these may not be an issue for single surveys of the surface, they could critically limit accuracy when repeat DEMs are to be used for the assessment of surface change. A way to reduce DEM error is through survey design by increasing overlap and sidelap, although the latter increases flight line density and total survey time. Additionally, the uneven distribution of GCPs across the glacier surface could lead to generated DEMs distortion, and installing GCPs across a glacier is extremely labor intensive and in many cases, highly dangerous or impossible without considerable climbing experience.
6. Conclusions
In our study, we employed orthophotos and point clouds from the UAV survey in the 2018 ablation period. From two UAV flights, the high-precision evolution of surface elevation was obtained; the geodetic mass was subsequently converted according to snow density conversion. The surface velocity and terminus change were derived from the UAV survey data. The main results show that the glacier surface elevation change was −2.8 ~ 0.4 m, with a mean value of −1.64 m, a surface velocity of 2.9 ~5.7 m/yr, with a mean value of 3.3 m/yr, and a terminus retreat of 6.1 m for the West Branch and 10.5 m for the East Branch during the survey period. The error and elevation difference of the GCPs in the non-glaciated area were with decimeter accuracy, which supports an accurate monitoring of the seasonal surface change process. A comparison of the UAV survey with in situ stake measurements shows that the elevation changes derived from these two methods are in good agreement (R2=0.88). The mean surface displacement derived by the UAV survey is approximately 1.1 m and is also consistent with the GPS ground measurement (R2=0.87). Although the UAV survey results are a little less than those from the ground measurements, the UAV survey results are basically reliable. In view of the advantages of the flexibility, centimeter-level resolution, and cost, the UAV survey should be widely applied together with high-resolution satellite imagery and the necessary ground truth in order to extend the spatial and temporal monitoring coverage in the future.
Author Contributions
Conceptualization, P.W. and Z.L.; methodology, H.L.; software, Y.L.; validation, C.X.; formal analysis, H.L.; investigation, J.M. and H.Z.; resources, P.W.; data curation, H.L.; writing—original draft preparation, P.W.; writing—review and editing, P.W.; visualization, Y.L.; supervision, Z.L.; project administration, P.W.; funding acquisition, P.W. All authors have read and agreed to the published version of the manuscript.
Funding
This research was jointly funded by the National Natural Science Foundation of China (41771077), the Youth Innovation Promotion Association of CAS, the Strategic Priority Research Program of Chinese Academy of Sciences (XDA20020102), the National Natural Science Foundation of China (42001067), and the State Key Laboratory of Cryospheric Science (SKLCS-ZZ-2021).
Institutional Review Board Statement
Not applicable.
Informed Consent Statement
Not applicable.
Data Availability Statement
Data are available upon request by email to the corresponding author.
Conflicts of Interest
The authors declare no conflict of interest.
References
- Qin, D.; Ding, Y.; Xiao, C.; Kang, S.; Ren, J.; Yang, J.; Zhang, S. Cryospheric science: Research framework and disciplinary system. Natl. Sci. Rev. 2018, 5, 255–268. [Google Scholar] [CrossRef] [Green Version]
- Yang, M.; Wang, X.; Pang, G.; Wan, G.; Liu, Z. The Tibetan Plateau cryosphere: Observations and model simulations for current status and recent changes. Earth-Sci. Rev. 2019, 190, 353–369. [Google Scholar] [CrossRef]
- IPCC. Climate Change 2013: The Physical Science Basis. Contribution of Working Group I to the Fifth Assessment Report of the Intergovernmental Panel on Climate Change; Stocker, T.F., Qin, D., Plattner, G.-K., Tignor, M., Allen, S.K., Boschung, J., Nauels, A., Xia, Y., Bex, V., Midgley, P.M., Eds.; Cambridge University Press: Cambridge, UK; New York, NY, USA, 2013; p. 1535. [Google Scholar]
- Farinotti, D.; Longuevergne, L.; Moholdt, G.; Duethmann, D.; Mölg, T.; Bolch, T.; Vorogushyn, S.; Güntner, A. Substantial glacier mass loss in the Tien Shan over the past 50 years. Nat. Geosci. 2015, 8, 716–722. [Google Scholar] [CrossRef]
- Zemp, M.; Huss, M.; Thibert, E.; Eckert, N.; McNabb, R.W.; Huber, J.; Barandun, M.; Machguth, H.; Nussbaumer, S.U.; Gärtner-Roer, I.; et al. Global glacier mass changes and their contributions to sea-level rise from 1961 to 2016. Nature 2019, 568, 382–386. [Google Scholar] [CrossRef]
- Sorg, A.; Bolch, T.; Stoffel, M.; Solomina, O.; Beniston, M. Climate change impacts on glaciers and runoff in Tien Shan (central Asia). Nat. Clim. Chang. 2012, 2, 725–731. [Google Scholar] [CrossRef]
- IPCC. Special Report on the Ocean and Cryosphere in a Changing Climate; IPCC: Geneva, Switzerland, 2019; in press. [Google Scholar]
- Shen, Y.-J.; Guo, Y.; Zhang, Y.; Pei, H.; Brenning, A. Review of historical and projected future climatic and hydrological changes in mountainous semiarid Xinjiang (northwestern China), central Asia. Catena 2020, 187, 104343. [Google Scholar] [CrossRef]
- Zemp, M.; Hoelzle, M.; Haeberli, W. Six decades of glacier mass-balance observations: A review of the worldwide monitoring network. Ann. Glaciol. 2009, 50, 101–111. [Google Scholar] [CrossRef] [Green Version]
- Li, Z.Q.; Li, K.M.; Wang, L. Study on recent glacier changes and their impact on water resources in Xinjiang, north western Chi-na. Quat. Sci. 2010, 30, 96–106. [Google Scholar]
- Brun, F.; Berthier, E.; Wagnon, P.; Kääb, A.; Treichler, D. A spatially resolved estimate of High Mountain Asia glacier mass balances from 2000 to 2016. Nat. Geosci. 2017, 10, 668–673. [Google Scholar] [CrossRef]
- Kraaijenbrink, P.D.A.; Shea, J.M.; Pellicciotti, F.; De Jong, S.M.; Immerzeel, W.W. Object-based analysis of unmanned aerial vehicle imagery to map and char-acterise surface features on a debris-covered glacier. Remote Sens. Environ. 2016, 186, 581–595. [Google Scholar] [CrossRef]
- Kraaijenbrink, P.; Meijer, S.W.; Shea, J.M.; Pellicciotti, F.; De Jong, S.M.; Immerzeel, W.W. Seasonal surface velocities of a Himalayan glacier derived by automated correla-tion of unmanned aerial vehicle imagery. Ann. Glaciol. 2016, 57, 103–113. [Google Scholar] [CrossRef] [Green Version]
- Wigmore, O.; Mark, B. Monitoring tropical debris-covered glacier dynamics from high-resolution unmanned aerial vehicle photogrammetry, Cordillera Blanca, Peru. Cryosphere 2017, 11, 2463–2480. [Google Scholar] [CrossRef] [Green Version]
- Li, J.L.; Chen, X.; Bao, A.M. Glacier hazard emergency monitoring of the Jiubie Peak in Kongur Mountains using unmanned aerial vehicle photogrammetry. Arid Land Geogr. 2016, 39, 378–386. [Google Scholar]
- Che, Y.; Wang, S.; Yi, S.; Wei, Y.; Cai, Y. Summer mass balance and surface velocity derived by unmanned aerial vehicle on debris-covered region of Baishui River glacier No. 1, Yulong Snow Mountain. Remote Sens. 2020, 12, 3280. [Google Scholar] [CrossRef]
- Yang, W.; Zhao, C.; Westoby, M.; Yao, T.; Wang, Y.; Pellicciotti, F.; Zhou, J.; He, Z.; Miles, E. Seasonal dynamics of a temperate Tibetan Glacier revealed by high-resolution UAV photogrammetry and in situ measurements. Remote Sens. 2020, 12, 2389. [Google Scholar] [CrossRef]
- Liu, Y.S.; Qin, X.; Guo, W.Q.; Gao, S.; Chen, J.; Wang, L.; Li, Y.; Jin, Z. Influence of the use of photogrammetric measurement precision on low-altitude micro-UAVs in the glacier region. J. Remote Sens. 2020, 24, 161–172. [Google Scholar]
- Xu, C.; Li, Z.; Li, H.; Wang, F.; Zhou, P. Long-range terrestrial laser scanning measurements of annual and intra-annual mass balances for Urumqi Glacier No. 1, eastern Tien Shan, China. Cryosphere 2019, 13, 2361–2383. [Google Scholar] [CrossRef] [Green Version]
- Climate Change Center of China Meteorological Administration. Blue Book on Climate Change in China; China Meteorological Administration: Beijing, China, 2019. [Google Scholar]
- Wang, P.Y.; Li, Z.Q.; Li, H.L.; Wang, W.B.; Yao, H.B. Comparison of glaciological and geodetic mass balance at Urumqi Glacier No. 1, Tian Shan, Central Asia. Global Planet. Chang. 2014, 114, 14–22. [Google Scholar] [CrossRef]
- Han, T.; Ding, Y.; Ye, B.; Liu, S.; Jiao, K. Mass-balance characteristics of Urumqi Glacier No. 1, Tien Shan, China. Ann. Glaciol. 2006, 43, 323–328. [Google Scholar] [CrossRef] [Green Version]
- Li, Z.Q.; Shen, Y.P.; Wang, F.T.; Li, H.L.; Dong, Z.W.; Wang, W.B.; Wang, L. Response of glacier melting to climate change-take Urumqi Glacier No. 1 as an example. J. Glaciol. Geocryol. 2007, 29, 333–342. [Google Scholar]
- Rossini, M.; Di Mauro, B.; Garzonio, R.; Baccolo, G.; Cavallini, G.; Mattavelli, M.; De Amicis, M.; Colombo, R. rapid melting dynam-ics of an alpine glacier with repeated uav photogrammetry. Geomorphology 2018, 304, 159–172. [Google Scholar] [CrossRef]
- Nuth, C.; Kaab, A. Co-registration and bias corrections of satelliteelevation data sets for quantifying glacier thickness change. Cryosphere 2011, 5, 271–290. [Google Scholar] [CrossRef] [Green Version]
- Gardelle, J.; Berthier, E.; Arnaud, Y. Impact of resolution and radarpenetration on glacier elevation changes computed from DEM differencing. J. Glaciol. 2012, 58, 419–422. [Google Scholar] [CrossRef] [Green Version]
- Huss, M. Density assumptions for converting geodetic glacier volume change to mass change. Cryosphere 2013, 7, 877–887. [Google Scholar] [CrossRef] [Green Version]
- Fischer, A.; Helfricht, K.; Stocker-Waldhuber, M. Local reduction of decadal glacier thickness loss through mass balance man-agement in ski resorts. Cryosphere 2016, 10, 2941–2952. [Google Scholar] [CrossRef] [Green Version]
- Klug, C.; Bollmann, E.; Galos, S.P.; Nicholson, L.; Prinz, R.; Rieg, L.; Sailer, R.; Stötter, J.; Kaser, G. Geodetic reanalysis of annual glacio-logical mass balances (2001–2011) of Hintereisferner, Austria. Cryosphere 2018, 12, 833–849. [Google Scholar] [CrossRef] [Green Version]
- Wang, P.; Li, Z.; Li, H.; Yao, H.; Xu, C.; Zhou, P.; Jin, S.; Wang, W. Analyses of recent observations of Urumqi Glacier No. 1, Chinese Tianshan Mountains. Environ. Earth Sci. 2016, 75, 1–11. [Google Scholar] [CrossRef]
- Fahnestock, M.; Scambos, T.; Moon, T.; Gardner, A.; Haran, T.; Klinger, M. Rapid large-area mapping of ice flow using Landsat 8. Remote. Sens. Environ. 2016, 185, 84–94. [Google Scholar] [CrossRef] [Green Version]
- Thibert, E.; Vincent, C.; Blanc, R.; Eckert, N. Glaciological and volumetric mass balance measurements: An error analysis 30 over 51 years, Sarennes Glacier, French Alps. J. Glaciol. 2008, 54, 522–532. [Google Scholar] [CrossRef] [Green Version]
- Zhou, Z.M.; Li, Z.Q.; Li, H.L.; Jing, Z.F. The flow velocity features and dynamic simulation of the Glacier No. 1 at the headwaters of Urumqi River, Tianshan Mountains. J. Glaciol. Geocryol. 2009, 31, 55–61. [Google Scholar]
- Wang, P.; Li, Z.; Zhou, P.; Li, H.; Yu, G.; Xu, C.; Wang, L. Long-term change in ice velocity of Urumqi Glacier No. 1, Tian Shan, China. Cold Reg. Sci. Technol. 2018, 145, 177–184. [Google Scholar] [CrossRef]
- Fugazza, D.; Scaioni, M.; Corti, M.; D’Agata, C.; Azzoni, R.S.; Cernuschi, M.; Smiraglia, C.; Diolaiuti, G.A. Combination of UAV and terrestrial photogrammetry to assess rapid glacier evolution and map glacier hazards. Nat. Hazards Earth Syst. Sci. 2018, 18, 1055–1071. [Google Scholar] [CrossRef] [Green Version]
- Immerzeel, W.W.; Kraaijenbrink, P.D.A.; Shea, J.M.; Shrestha, A.B.; Pellicciotti, F.; Bierkens, M.F.P.; de Jong, S.M. High-resolution moni-toring of Himalayan glacier dynamics using unmanned aerial vehicles. Remote Sens. Environ. 2014, 150, 93–103. [Google Scholar] [CrossRef]
- Gindraux, S.; Boesch, R.; Farinotti, D. Accuracy assessment of digital surface models from unmanned aerial vehicles’ imagery on glaciers. Remote Sens. 2017, 9, 186. [Google Scholar] [CrossRef] [Green Version]
- Seier, G.; Kellerer-Pirklbauer, A.; Wecht, M.; Hirschmann, S.; Kaufmann, V.; Lieb, G.K.; Sulzer, W. UAS-based change detection of the glacial and proglacial transition zone at pasterze glacier, Austria. Remote. Sens. 2017, 9, 549. [Google Scholar] [CrossRef] [Green Version]
- Takeuchi, N.; Li, Z. Characteristics of surface dust on ürümqi glacier No. 1 in the Tien Shan Mountains, China. Arctic Antarct. Alp. Res. 2008, 40, 744–750. [Google Scholar] [CrossRef]
- Dong, Z.; Li, Z.; Wang, F.; Zhang, M. Characteristics of atmospheric dust deposition in snow on the glaciers of the eastern Tien Shan, China. J. Glaciol. 2009, 55, 797–804. [Google Scholar] [CrossRef] [Green Version]
- Ming, J.; Xiao, C.; Wang, F.; Li, Z.; Li, Y. Grey tienshan urumqi glacier No.1 and light-absorbing impurities. Environ. Sci. Pollut. Res. 2016, 23, 9549–9558. [Google Scholar] [CrossRef] [Green Version]
- Li, X.; Kang, S.; He, X.; Qu, B.; Tripathee, L.; Jing, Z.; Paudyal, R.; Li, Y.; Zhang, Y.; Yan, F.; et al. Light-absorbing impurities accelerate glacier melt in the Central Tibetan Plateau. Sci. Total Environ. 2017, 587–588, 482–490. [Google Scholar] [CrossRef]
- Niu, H.; Kang, S.; Shi, X.; Paudyal, R.; He, Y.; Li, G.; Wang, S.; Pu, T.; Shi, X. In-situ measurements of light-absorbing impurities in snow of glacier on Mt. Yulong and implications for radiative forcing estimates. Sci. Total Environ. 2017, 581–582, 848–856. [Google Scholar] [CrossRef] [PubMed]
- O’Connor, J.; Smith, M.J.; James, M.R. Cameras and settings for aerial surveys in the geosciences. Prog. Phys. Geogr. Earth Environ. 2017, 41, 325–344. [Google Scholar] [CrossRef] [Green Version]
Publisher’s Note: MDPI stays neutral with regard to jurisdictional claims in published maps and institutional affiliations. |
© 2021 by the authors. Licensee MDPI, Basel, Switzerland. This article is an open access article distributed under the terms and conditions of the Creative Commons Attribution (CC BY) license (https://creativecommons.org/licenses/by/4.0/).