Article

On the Utility of Longwave-Infrared Spectral Imaging for Remote Botanical Identification

1
Space Science Applications Laboratory, The Aerospace Corporation, Los Angeles, CA 90009-2957, USA
2
Space Materials Laboratory, The Aerospace Corporation, Los Angeles, CA 90009-2957, USA
3
Imagery Products & Exploitation Department, The Aerospace Corporation, Los Angeles, CA 90009-2957, USA
*
Author to whom correspondence should be addressed.
Remote Sens. 2021, 13(17), 3344; https://doi.org/10.3390/rs13173344
Submission received: 11 August 2021 / Revised: 20 August 2021 / Accepted: 21 August 2021 / Published: 24 August 2021
(This article belongs to the Section Remote Sensing in Agriculture and Vegetation)

Abstract

:
A multi-year airborne field investigation of remote botanical species identification was conducted involving multiple curated botanical collections. The purpose of the study was to better constrain the observational conditions that most favor remote identification by longwave-infrared spectral imaging and assess the degree to which confidence metrics developed for remote chemical composition determination could be adapted to botanical species classification. Identification success was examined as a function of spatial resolution and viewing obliquity. A key aim was to articulate a procedure for validating inferred species identifications and evaluating the retrieval methodology’s performance for alleviating confusion between species exhibiting spectral similarity at the foliar scale. It was found that several confounding factors degrade confidence in the species identifications to levels that render the approach impractical in the general case. A number of taxa, predominantly evergreen, were nevertheless identified that are amenable to the technique and for which utility may be viable.

1. Introduction

The ability to remotely speciate and map plants is a perennial aspiration in forestry and ecosystem conservation and management applications [1,2,3,4,5]. Such applications are reliant on the ability to acquire measurements at sufficiently fine spatial scales over large areas. In contrast, most remote arboreal taxonomy determination studies have been carried out over relatively limited extents [4]. Techniques for extending remote taxonomy methodologies to practical scales have involved visible-shortwave infrared (VSWIR) multispectral [6,7] and hyperspectral [8,9,10,11] imaging, and schemes that fuse spectral imaging with LiDAR canopy structure information [12,13].
Foliar spectral behavior in the longwave-infrared (LWIR) emissive regime has significant interspecies variability [14,15,16,17] that has been shown to correlate with the diagnostic signatures of key plant constituents [15,17,18]. However, the weak characteristic spectral features involved require exceptional LWIR spectroradiometric performance to retrieve [18]. Although the first suggestion that long-range remote determination of plant speciation could be accomplished effectively with LWIR spectral imaging was advanced in the late 1980s [19,20], such a capability was not convincingly demonstrated until the advent of sensors with sufficient spectral resolution and radiometric sensitivity to adequately resolve the subtle LWIR spectral features that distinguish plant species from each other [21]. This lengthy gap attests to the difficulty inherent in making such measurements, as does the paucity of similar reports.
This paper describes a systematic study of airborne LWIR plant identification over multiple years, diverse geographical locations, and different experimental conditions. The study also extends prior work to more species and larger (facility-scale) survey areas while implementing enhanced spectral discrimination to increase confidence in the ensuing taxonomic retrievals. It was found that while the value of LWIR spectral imaging appears to be equivocal in the general case, it nevertheless offers clear utility for specific taxa.

2. Methods

2.1. Data Acquisition

The data contributing to this study were collected with the Mako airborne LWIR spectral imager. This instrument has been fully described in a series of prior publications [22,23,24], but its operating characteristics most germane to this study are given in Table 1. The high radiometric sensitivity of Mako (noise-equivalent spectral radiance, NESR, better than 0.5 µW cm−2 sr−1 μm−1) is a key factor in the remote speciation of botanical specimens. In addition, a DSLR camera records true-color imagery of the scene contemporaneously with the LWIR imager, which proved essential for precise ground truthing in a number of instances.
The imagery was collected during overflights of several professionally curated botanical collections in Greater Los Angeles (Table 2). At each facility individual specimens are furnished with validated taxonomic identifications that aid in ground-truthing the retrievals.

2.2. Data Processing

The essentials of solid target signal phenomenology in the LWIR and the data processing approach used in the current work have been described previously [24] and the latter is summarized in Figure 1. For a target material embedded within a blackbody at the same temperature, the at-sensor radiance, L(λ), can be expressed as:
L(λ) = fρ(λ)[LD(λ) − B(λ,T)]τA(λ) + B(λ,T)τA(λ) + LU(λ)
in which f is the pixel fill fraction occupied by the target, B is the Planck function, T the target temperature, τA(λ) the transmission of the air column, and LU(λ) is the upwelling radiance from the atmospheric column. Equation (1) shows that the target spectral signature within the imagery is essentially the product of the foliar reflectance, ρ(λ), and the wavelength-dependent thermal contrast term enclosed by the square brackets. Spectral variations due to the downwelling radiance, LD(λ), contribute to the thermal contrast term and are thus also imprinted on the data, complicating identification.
Adaptive coherence estimation (ACE) is employed at the detection stage to interrogate the atmospherically compensated, radiometrically calibrated imagery for the presence of target (reference) botanical spectra. The filter formed by the ACE procedure outputs a cosine function representing the spectral angle in whitened space subtended by the observed mean-removed data spectrum and the target foliar reflectance signature. This process eliminates the need to account for any differences in absolute calibration among the target spectra, which is an important consideration given the multi-source nature of the spectral library. The ACE algorithm is particularly adept at discerning target signatures against the spectral clutter in which they are embedded and also exhibits a lower tendency to false-positive generation relative to other techniques [25,26]. These properties assume central importance when considering the more fundamental retrieval problems engendered by the natural variability of many botanical spectra. In contrast to previous studies of this type [16,21,27], the analysis approach used does not require a knowledge of the target spectral emissivity, thus avoiding the perennial difficulties entailed in recovering emissivity and the uncertainties that can result in so doing [28,29].
Each ACE image is automatically inspected for filter output values exceeding a predefined threshold value within a specified region of pixel connectivity to generate a set of image regions-of-interest (ROIs) for the subsequent identification (ID) stage. Each ROI thus defined is encoded with the coordinates of the pixel yielding the maximum filter output magnitude within that ROI, the total number of pixels comprising the ROI, and the mean spectrum of the ROI pixels. The mean spectrum of each ROI is then processed by the identification algorithm and spawns an independent identification. Only ROIs that meet the conditions ACE > 0.3 for connected pixels N > 9 were accepted for identification for the work presented here. These thresholds were established by trading detection strength against false positive rate during initial analyses of the vegetation imagery acquisitions.
A t-statistic describing the spectral fit quality is computed sequentially for each signature in the spectral library and provides a confidence metric for each taxonomic identification:
t = S T C 1 Y [ S T C 1 S ] 1 / 2 [ ( Y     S X ) T C 1 ( Y     S X ) ] 1 / 2
where X is the coefficient of signature S in the least-squares fit, Y represents the mean spectrum of the ROI pixels and C−1 denotes the inverse of the full-scene covariance matrix (whitening transform). The t-statistics retrieved for solid signatures are necessarily negative due to the thermal contrast term mentioned above, with the absolute magnitude of t determining the confidence level of the resulting ID. Examples of the spectral fit and associated t-statistics for a number of identified taxa are shown in greater detail below.
A preliminary model is formed at the identification stage by accepting all target signatures returned by the standard stepwise generalized least-squares algorithm for t < −6 (constrained to negative values by the thermal contrast term). This preliminary model is subsequently transferred to a model decomposition and selection algorithm (MDS-IC) that uses standard model selection techniques based upon the information criterion (IC) to select the “best model” as the identification of the ROI. The optimum regression model constructed by considering all possible combinations of the signatures present in the preliminary model is defined as maximizing the IC. The information criteria are formed as a combination of two terms, one that depends solely on the residual of the least-squares fit and one that imposes a penalty that increases as additional signatures are allowed into the model. This algorithm allows the choice of 5 different (user-selected) information criteria to select the winning model. In order of increasing penalty terms imposed by adding additional signatures to the model, these are the Akaike (AIC), Bayesian (BIC), Empirically Identified (EIC), Gaussian (GIC), and Non-nested (NIC). For the work presented here, the NIC [30] option provided the highest penalty term imposed on additional signatures allowed into the model.
The LWIR foliar reference spectra used in this study were marshaled from several library sources: ECOSTRESS 1.0 [31], USGS-VEG [21], and MODIS-UCSB [32]. A number of spectra were also explicitly measured for this study (Section 2.4). The consolidated library contains 589 spectra for 162 species distributed across 102 genera representing several distinct biomes (primarily boreal, temperate, jungle, and desert). These foliar reference spectra are included within a spectral library containing ~5000 solid material reflectance signatures.

2.3. Viewing Geometries

Questions regarding the effects of viewing geometry have arisen during prior studies. Ribeiro da Luz and Crowley [21] have remarked on the importance of spatial resolution to the success of remotely ID’ing plants in the LWIR, pointing out that voids between leaves tend to weaken the spectral contrast of the canopy emissivity compared with that of the individual leaf. This has been borne out by field studies where it was found that in most cases, the emissivity structure at the leaf level did not comport with that of the canopy [33]. Attempts to reconcile the two by accounting for factors such as leaf area index [34] would be laborious, perhaps intractable, to implement in the ID process, and in any case no guarantor of success [35], so it is desirable to evaluate the extent to which finer spatial resolution can mitigate the issue.
The leaves’ disposition has also been implicated in the failure to identify species through the foliar spectrum alone. Attributes such as whether the plant presents as pendulous, erectophile, or planophile, or whether the leaf angle or disposition results in cavity behavior, have been advanced as factors that could interfere with spectral identification of a given species [18,19,21].
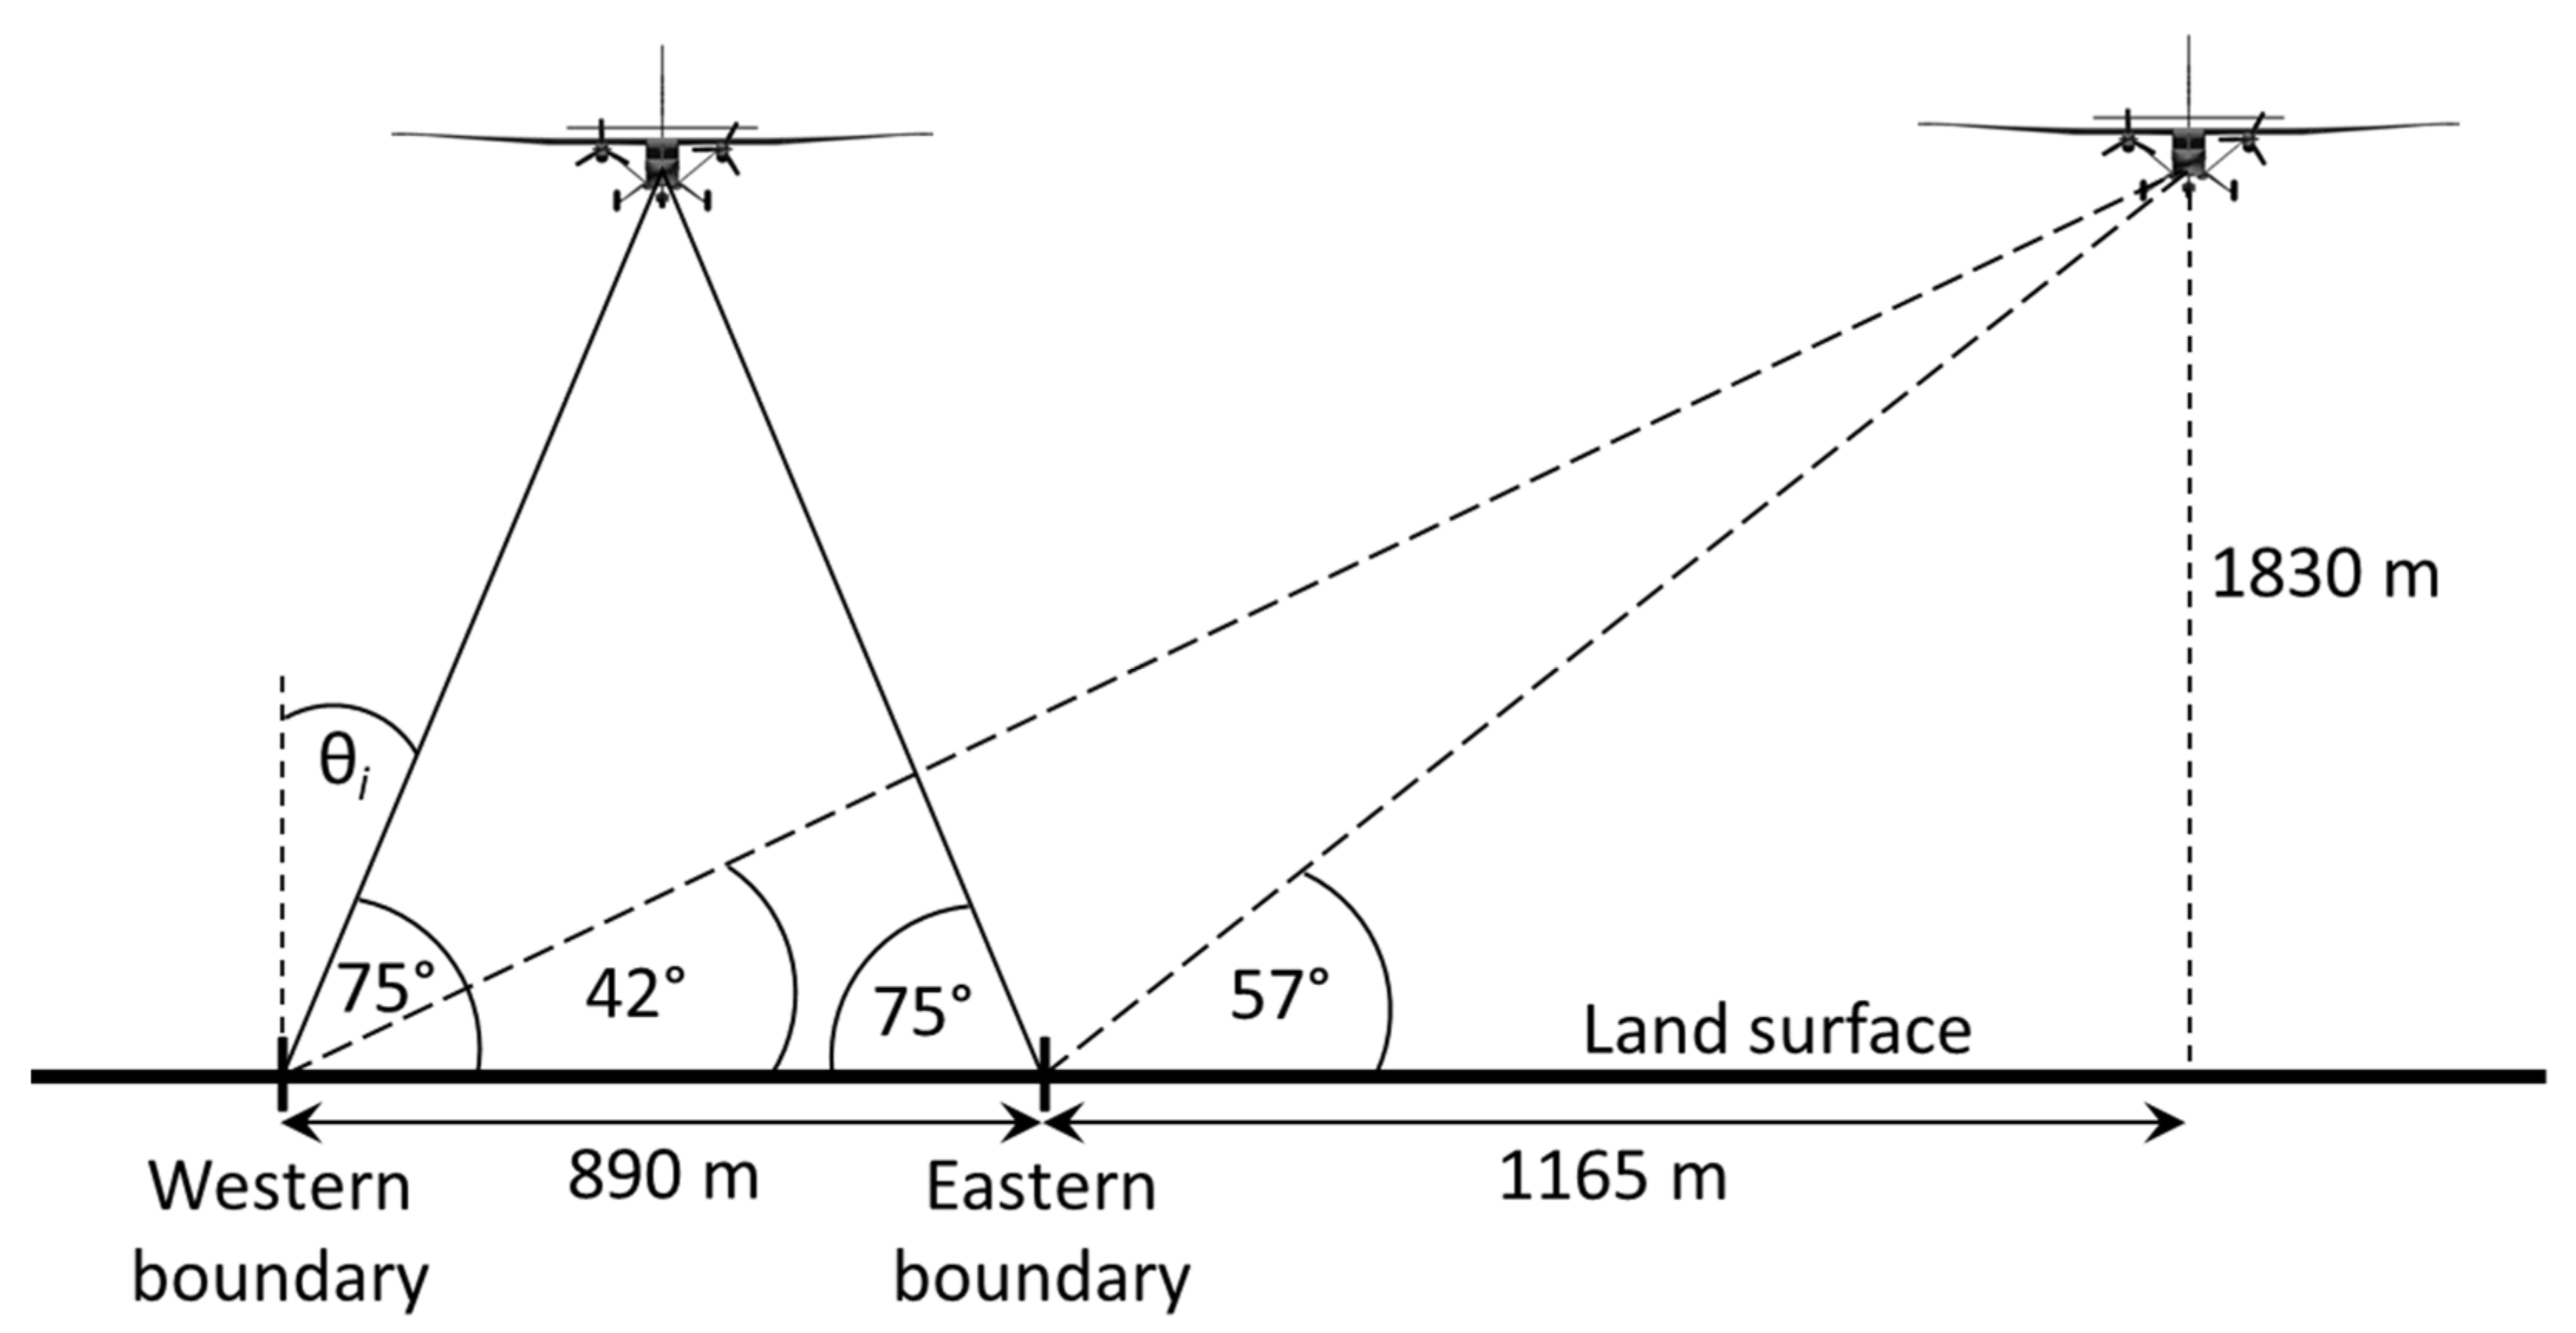
Two experiments were designed to investigate whether observation geometries could be crafted to evaluate the impact of these factors. The first entailed collecting imagery of the target scene at three different altitudes, and thus different ground sample distances (GSD), and was carried out under nominally nadir viewing conditions. The second experiment involved viewing the target scene at an oblique angle from two opposing directions and nadir, from a single altitude, as depicted diagrammatically in Figure 2. The flight altitude of these acquisitions was 1830 m (6000 ft) AGL, corresponding to a nominal 1-m GSD, as this was the lowest of the altitudes flown that permitted acquisition of the entire facility in a single pass. The data were collected at the Huntington Botanical Gardens since it is the source of the most spectral measurements and taxonomic variety supplied to the spectral library [31,33]. Imagery acquisition for both experiments was accomplished within an hour on 20 June 2020 under stable warm, clear-sky conditions.

2.4. Laboratory Spectral Measurements

A small number of new spectra were measured to resolve questions that arose from the preliminary analysis of the imagery. Foliar specimens were collected in vivo at the Huntington Botanical Gardens and packaged adhering to the sample handling protocols specified by Meerdink et al. [33]. The specimens were then conveyed to The Aerospace Corporation’s Spectral Analysis Facility, where their adaxial biconical reflectance spectra were measured with a Thermo Scientific Nicolet iS50 FTIR spectrometer and a Harrick Scientific Praying Mantis diffuse reflectance accessory within 8 h of collection.
The directional hemispherical reflectance spectrum has been explicitly recommended for LWIR remote sensing applications because it more accurately characterizes emissivity [19,36]. The analysis approach used for the present work (Section 2.2) avoids reliance on emissivity and has demonstrated successful identification of surface geological composition using biconical reflectance reference spectra [37]. Biconical measurements also offer significantly higher SNR than their hemispherical counterparts and retain more of the weak spectral structure of the sample. The early winter sample collection date yielded acceptable ID performance for evergreens but not deciduous species, as expected from prior reporting [14].

3. Results

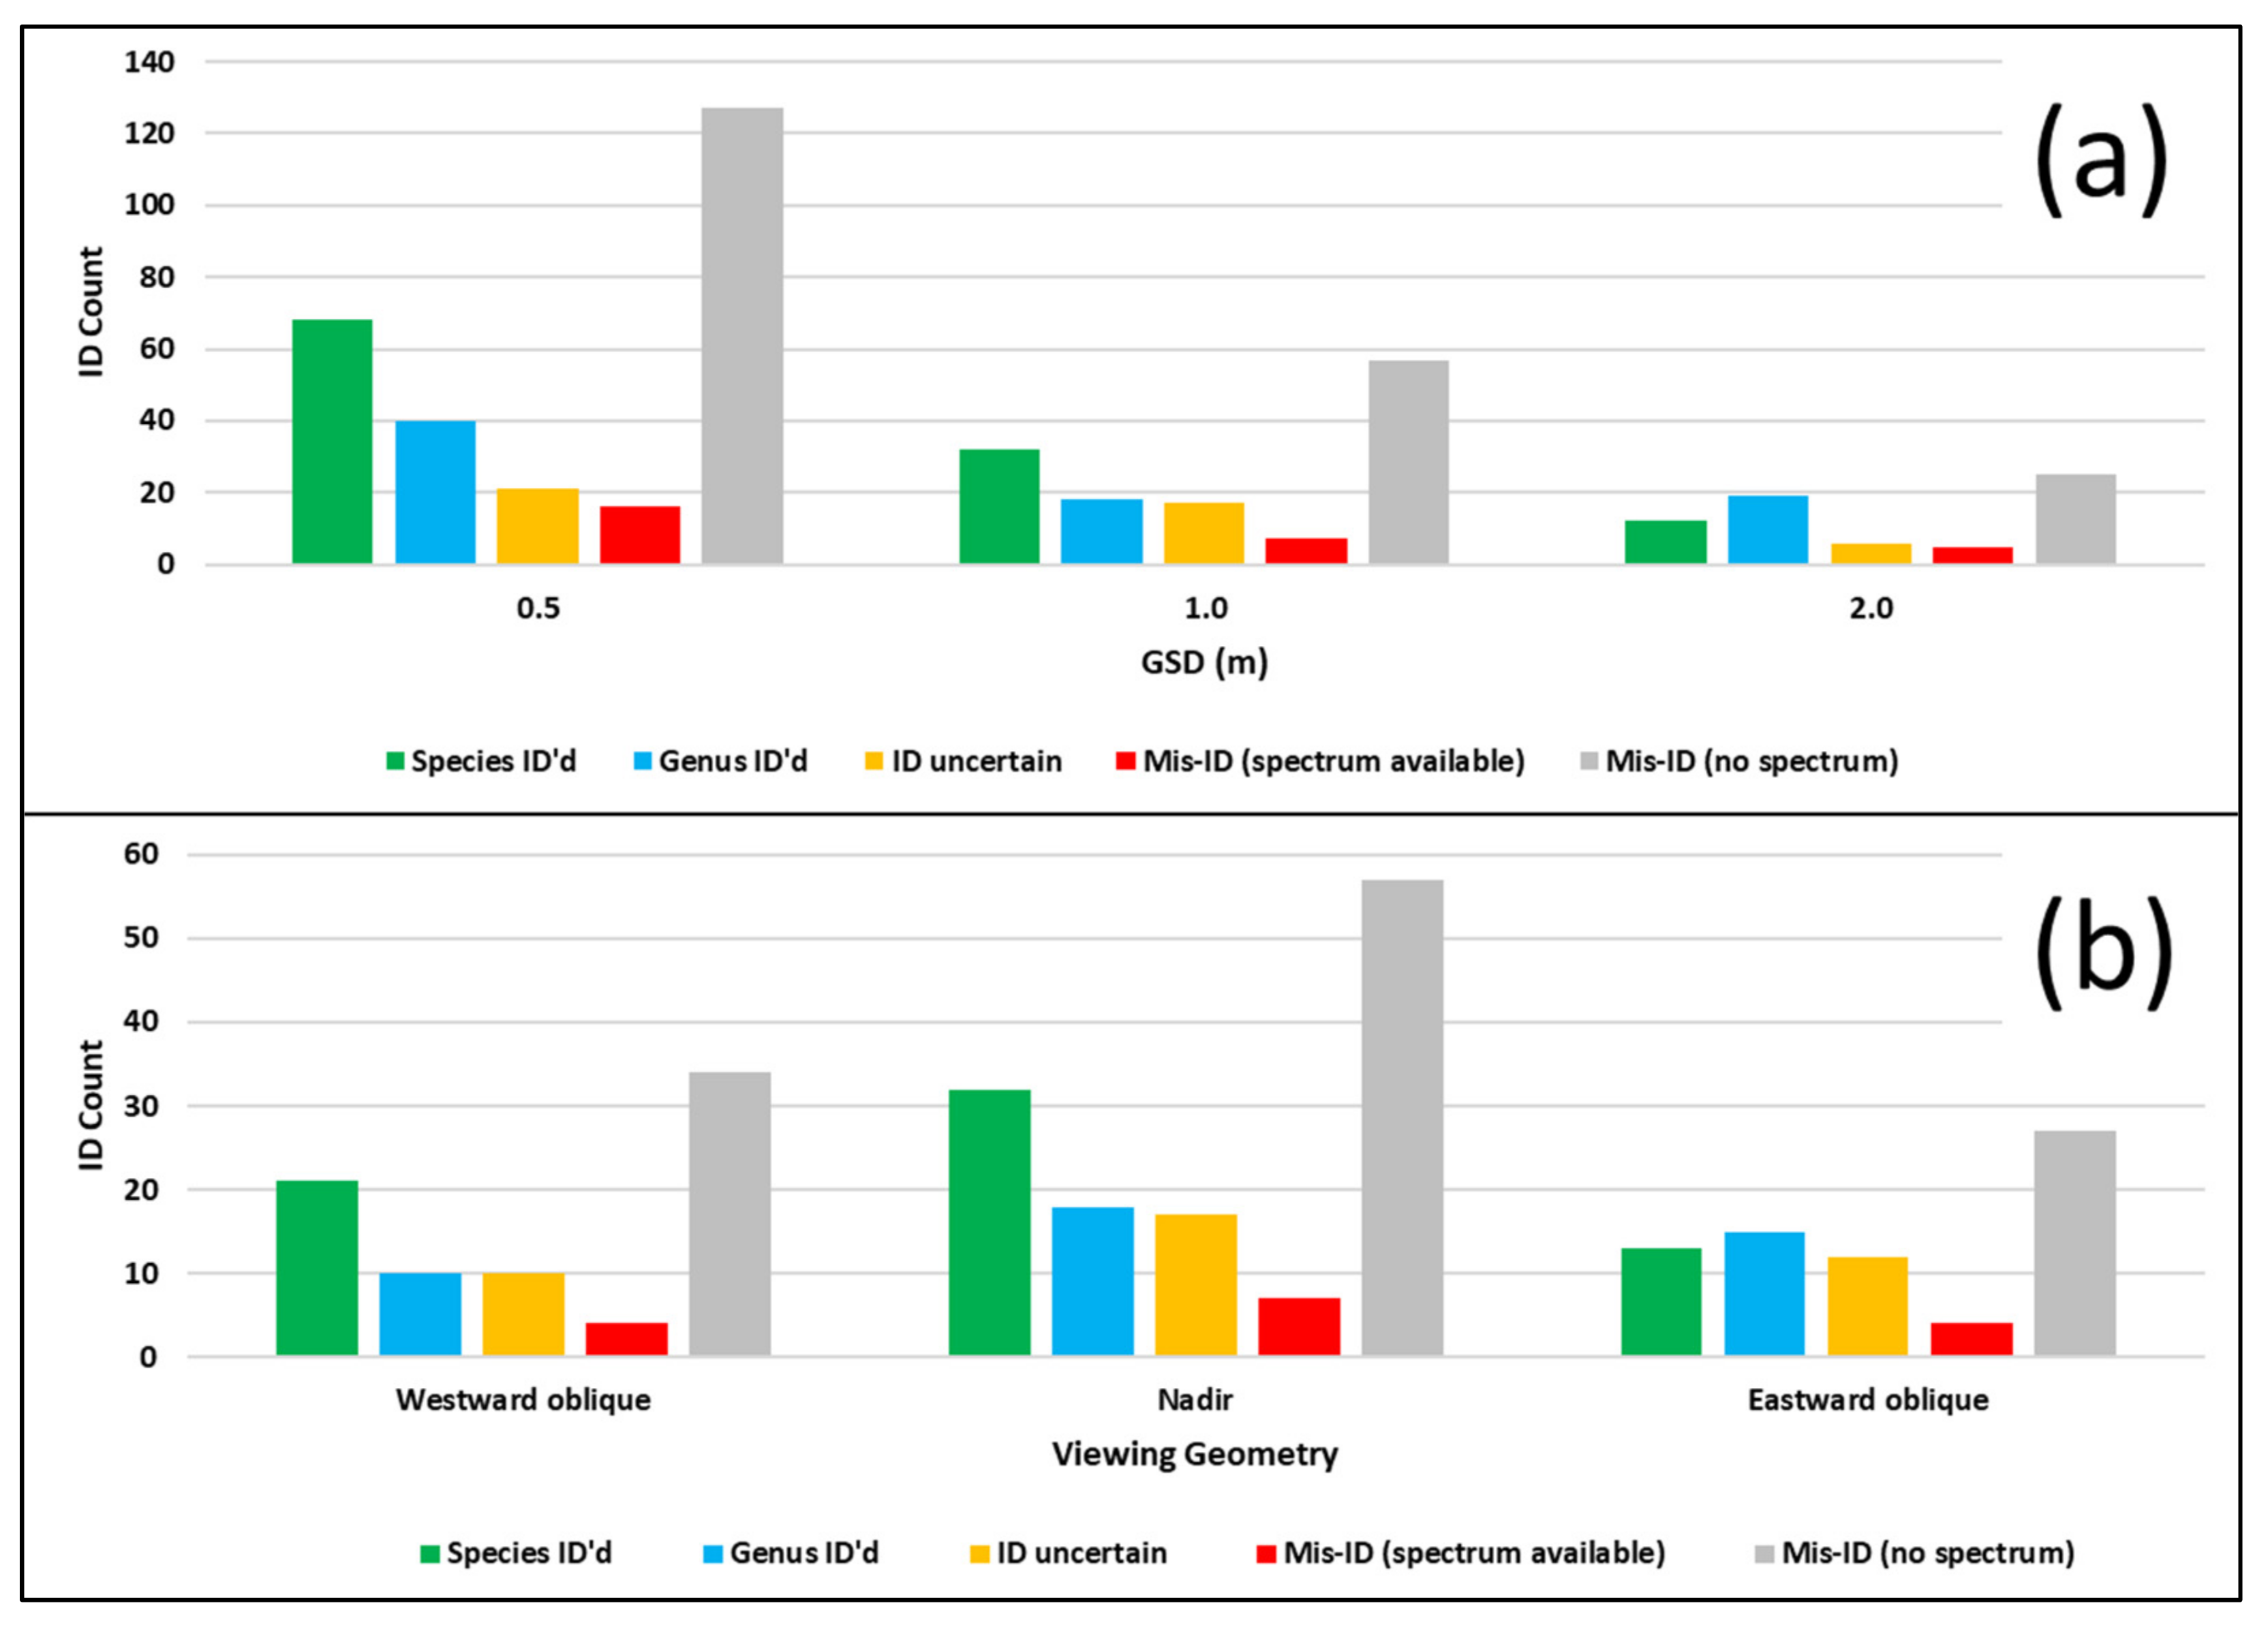
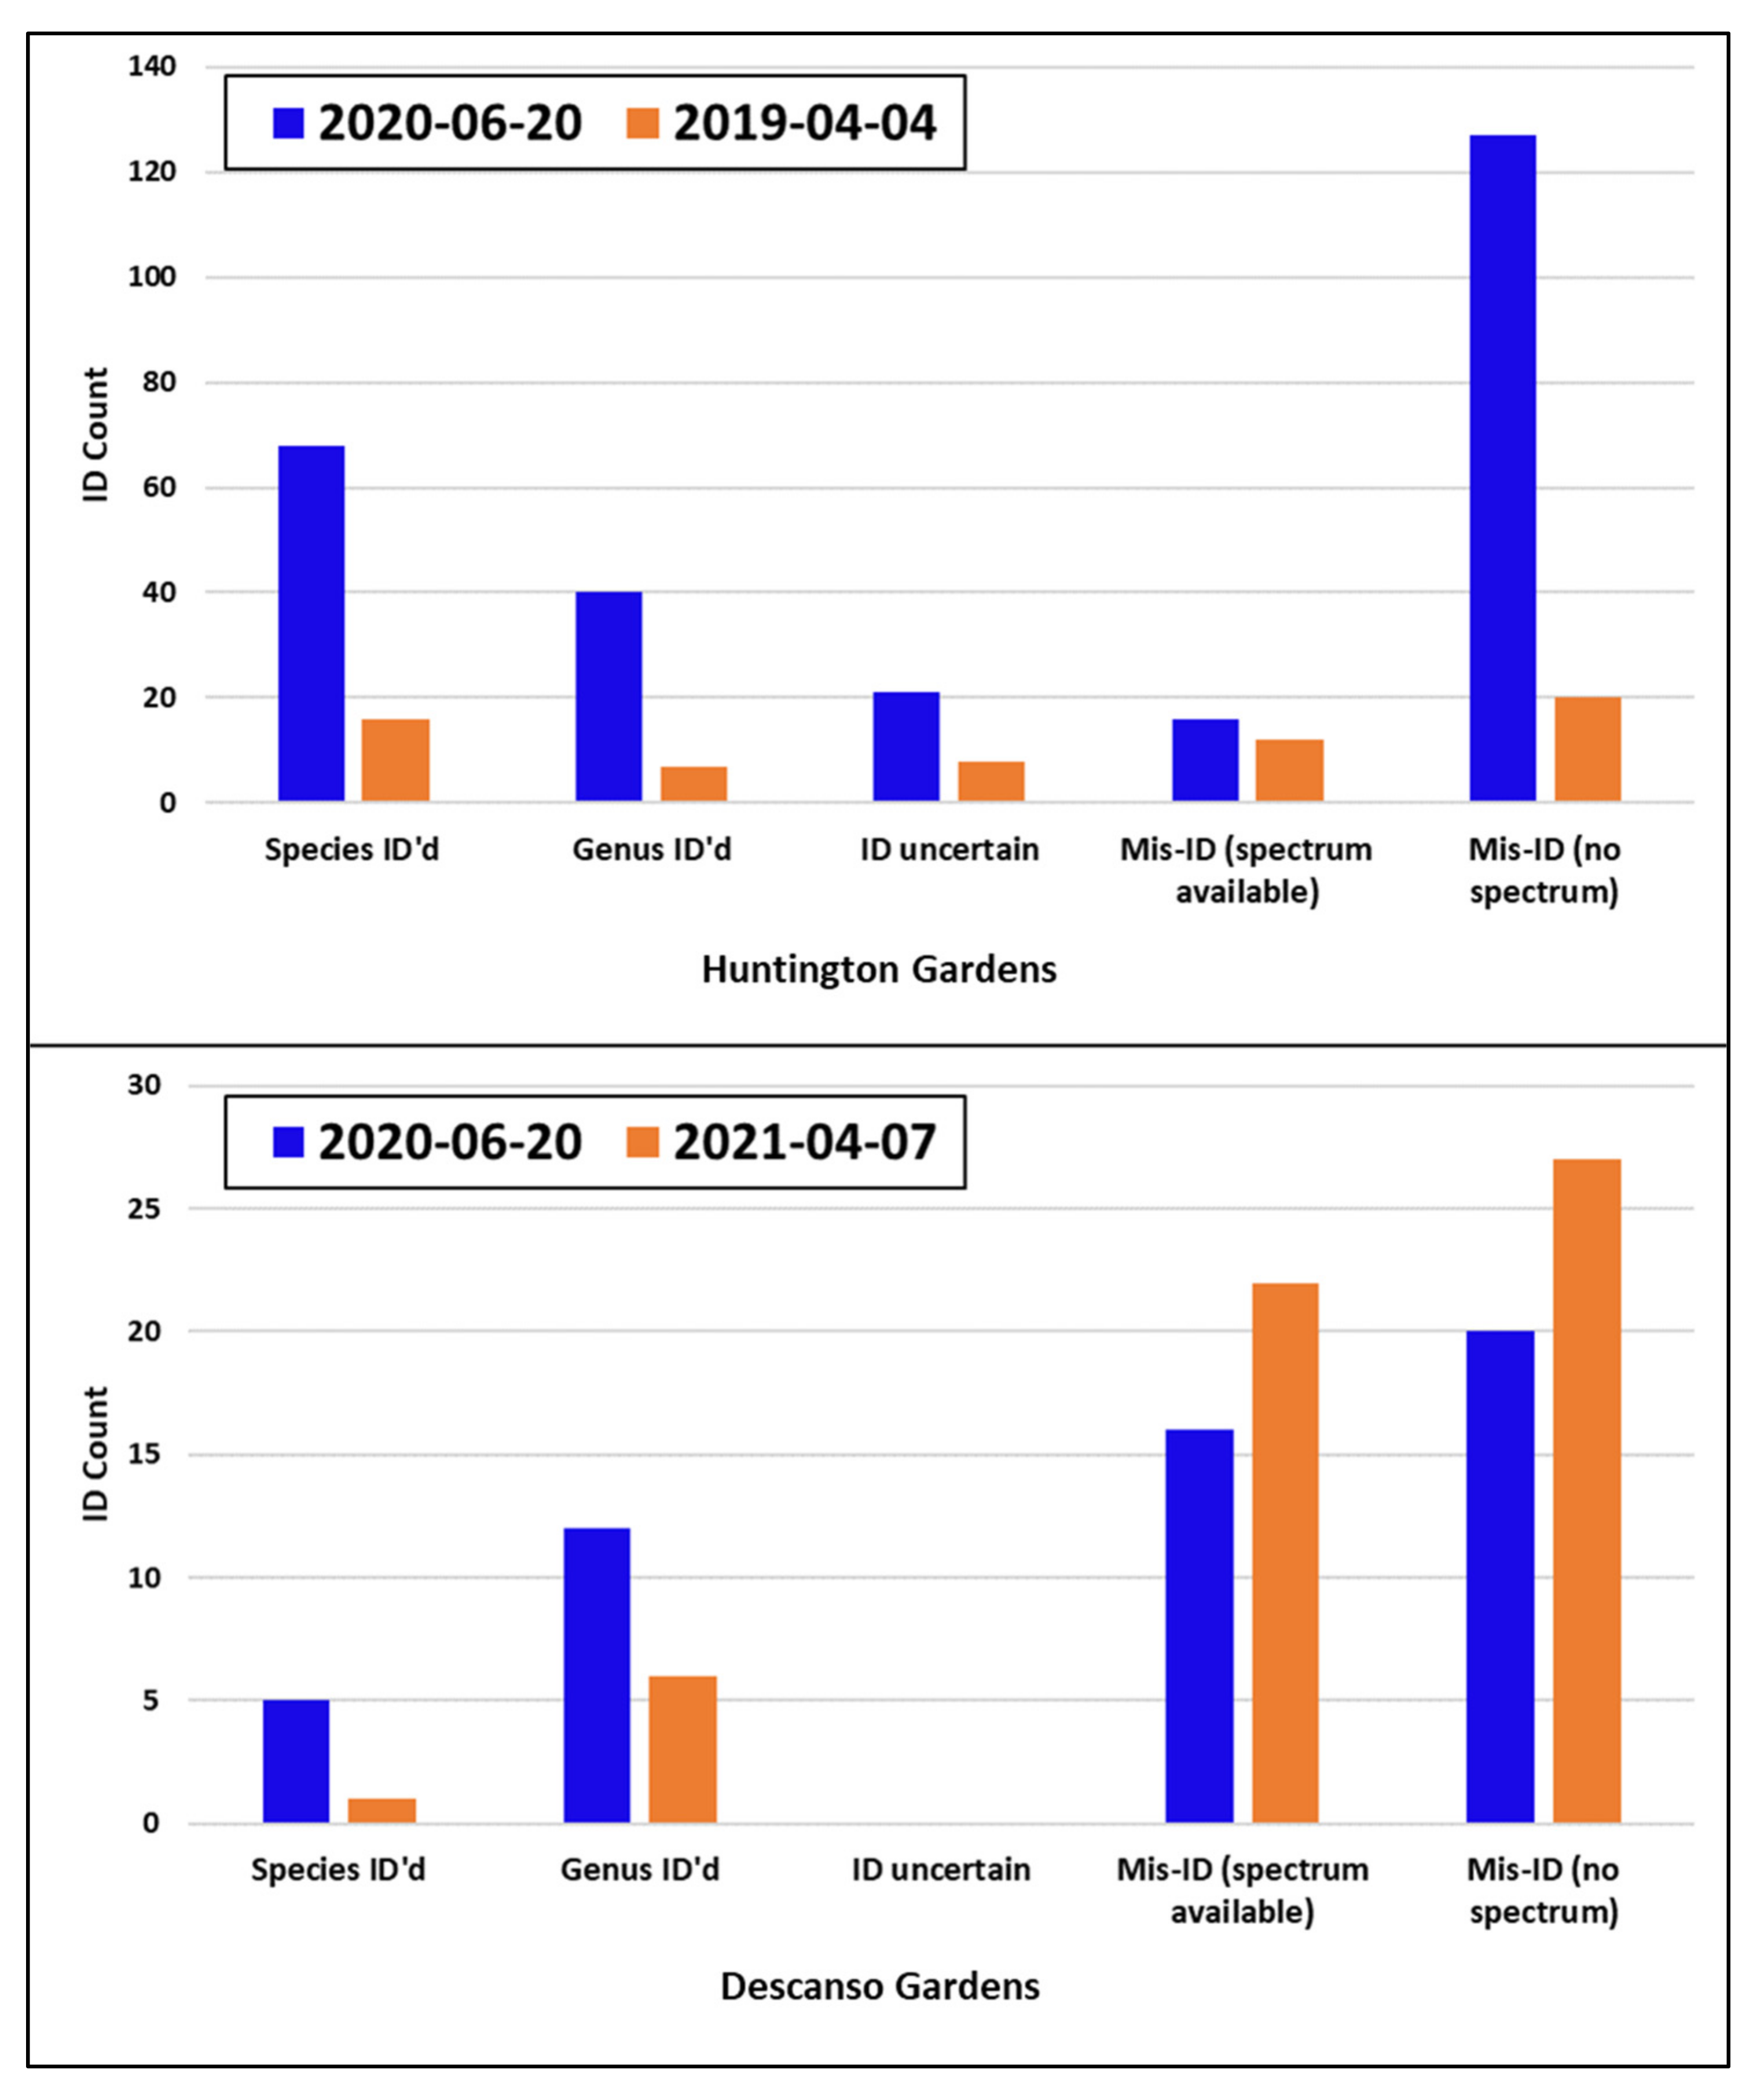
The multi-altitude acquisitions at the Huntington Gardens yielded imagery with nominal GSDs of 0.5, 1.0, and 2.0 m. The analysis summaries for these three data sets are provided in Figure 3a. For each GSD, five classes of ID are indicated: targets correctly ID’d at the species level, targets correctly ID’d at the genus level, ID accuracy uncertain (mostly unlabeled bamboos that are otherwise difficult to distinguish), mis-IDs of targets for which spectra are available, and mis-IDs of targets for which there is no spectrum in the library. In the latter case, the ID algorithm selects a reference spectrum that best fits the data. Where such occurrences were observed to show consistency, this knowledge was used to guide collection of the few new spectra that were measured for the current work. This category’s dominant number of IDs suggests a degree of unrealized potential accessible with a more expansive spectral library. Successful IDs at the species level include cultivars/varietals, subspecies, and hybrids of the base species. Analogous results for the multi-angle investigation are given in Figure 3b.
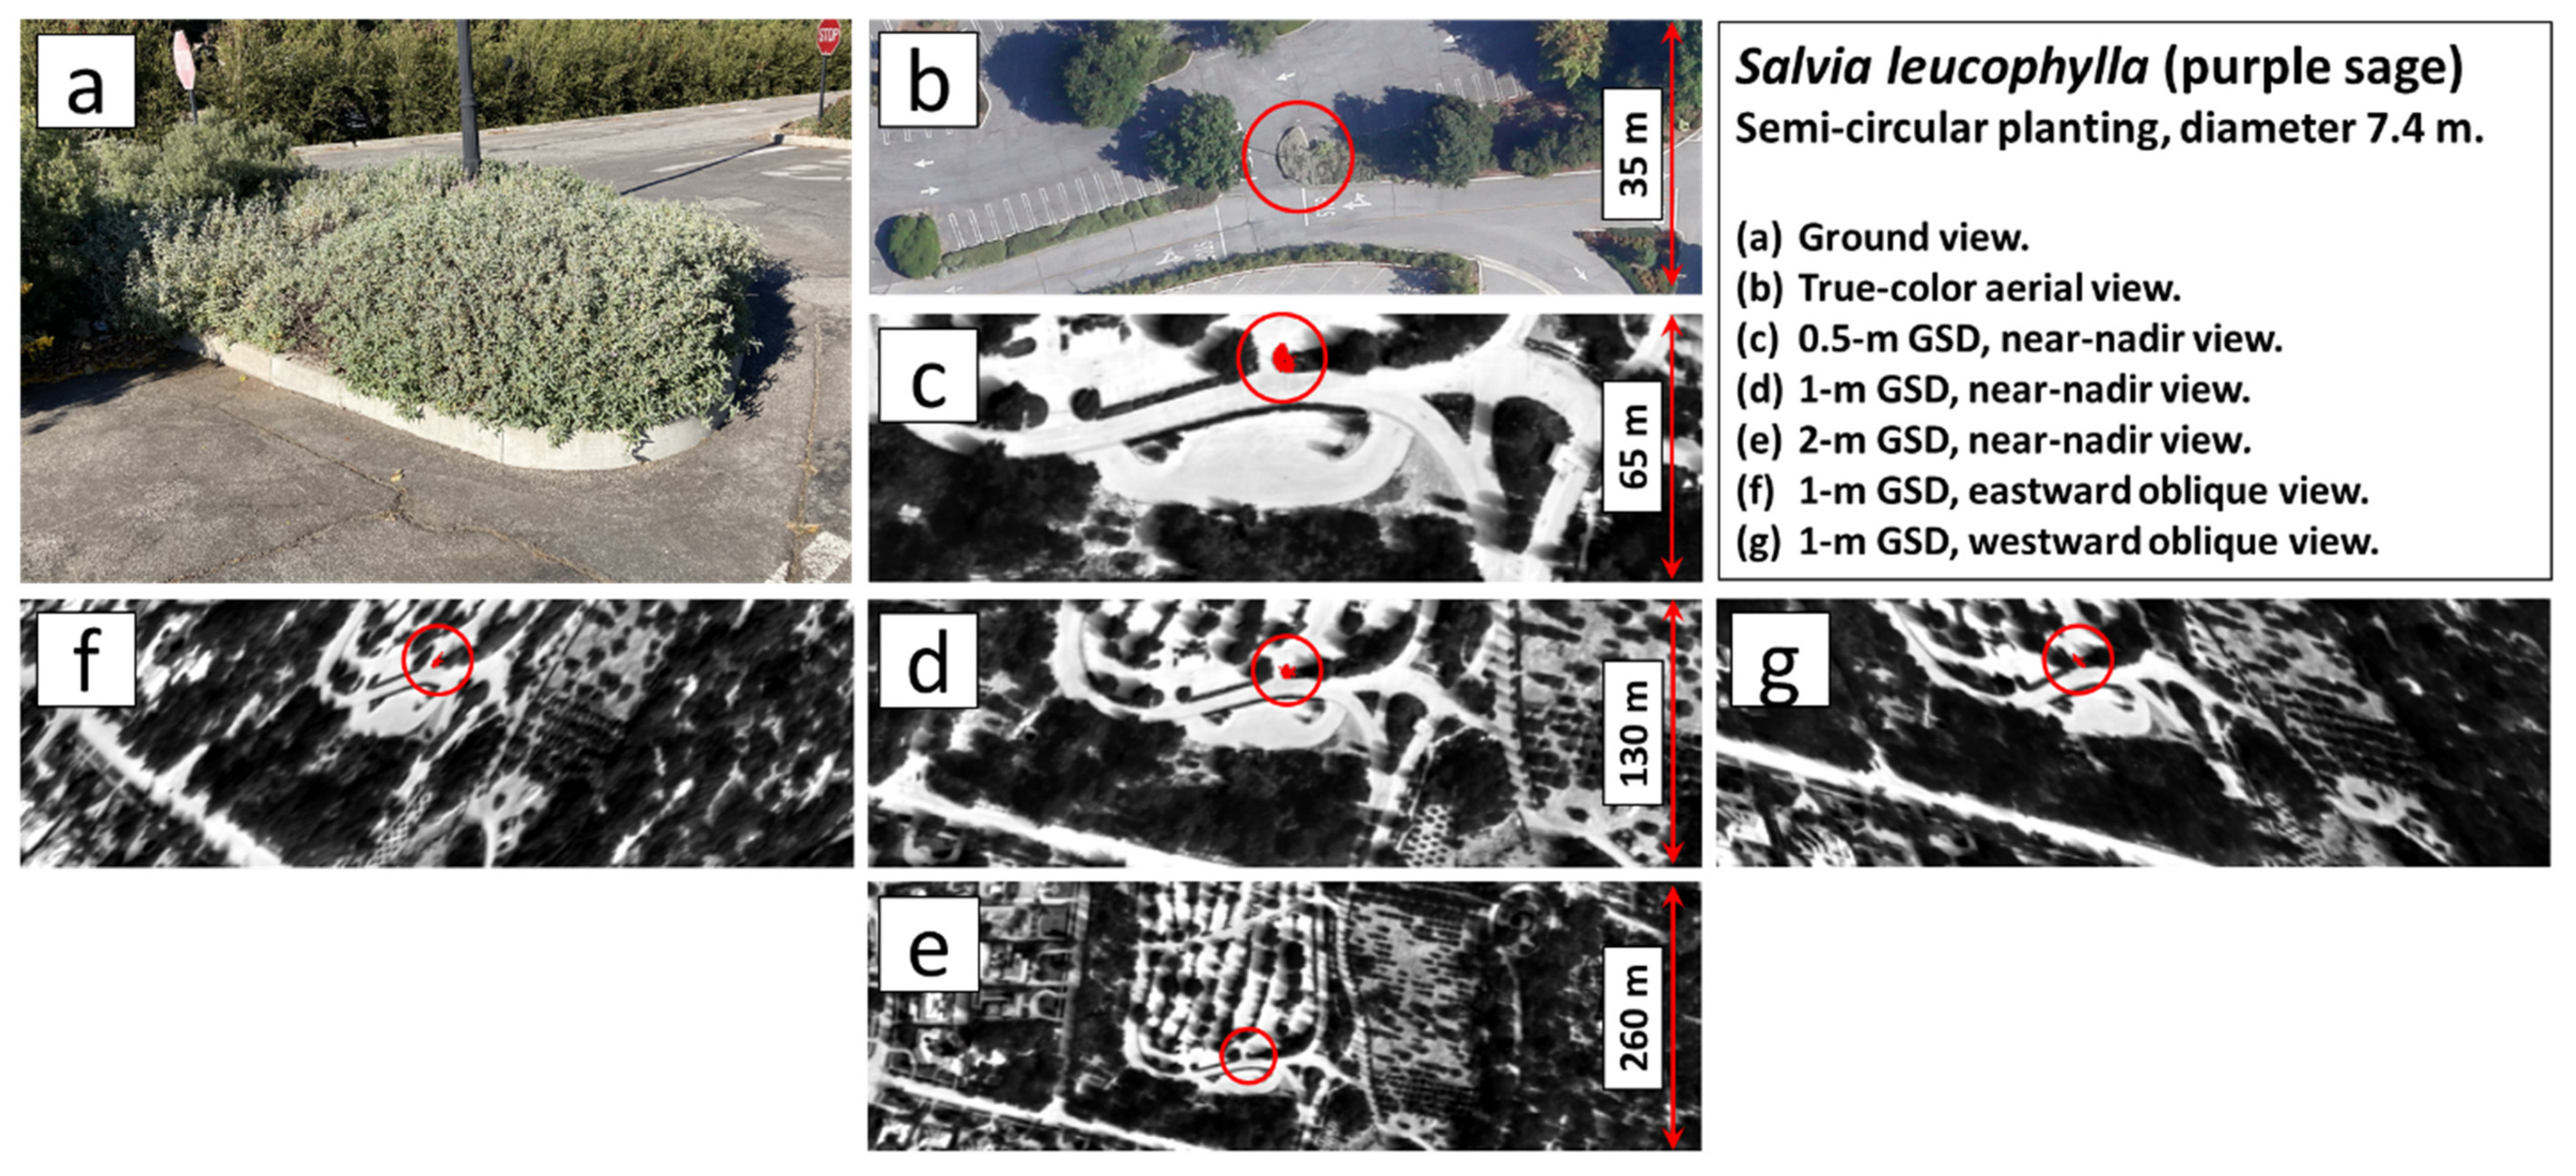
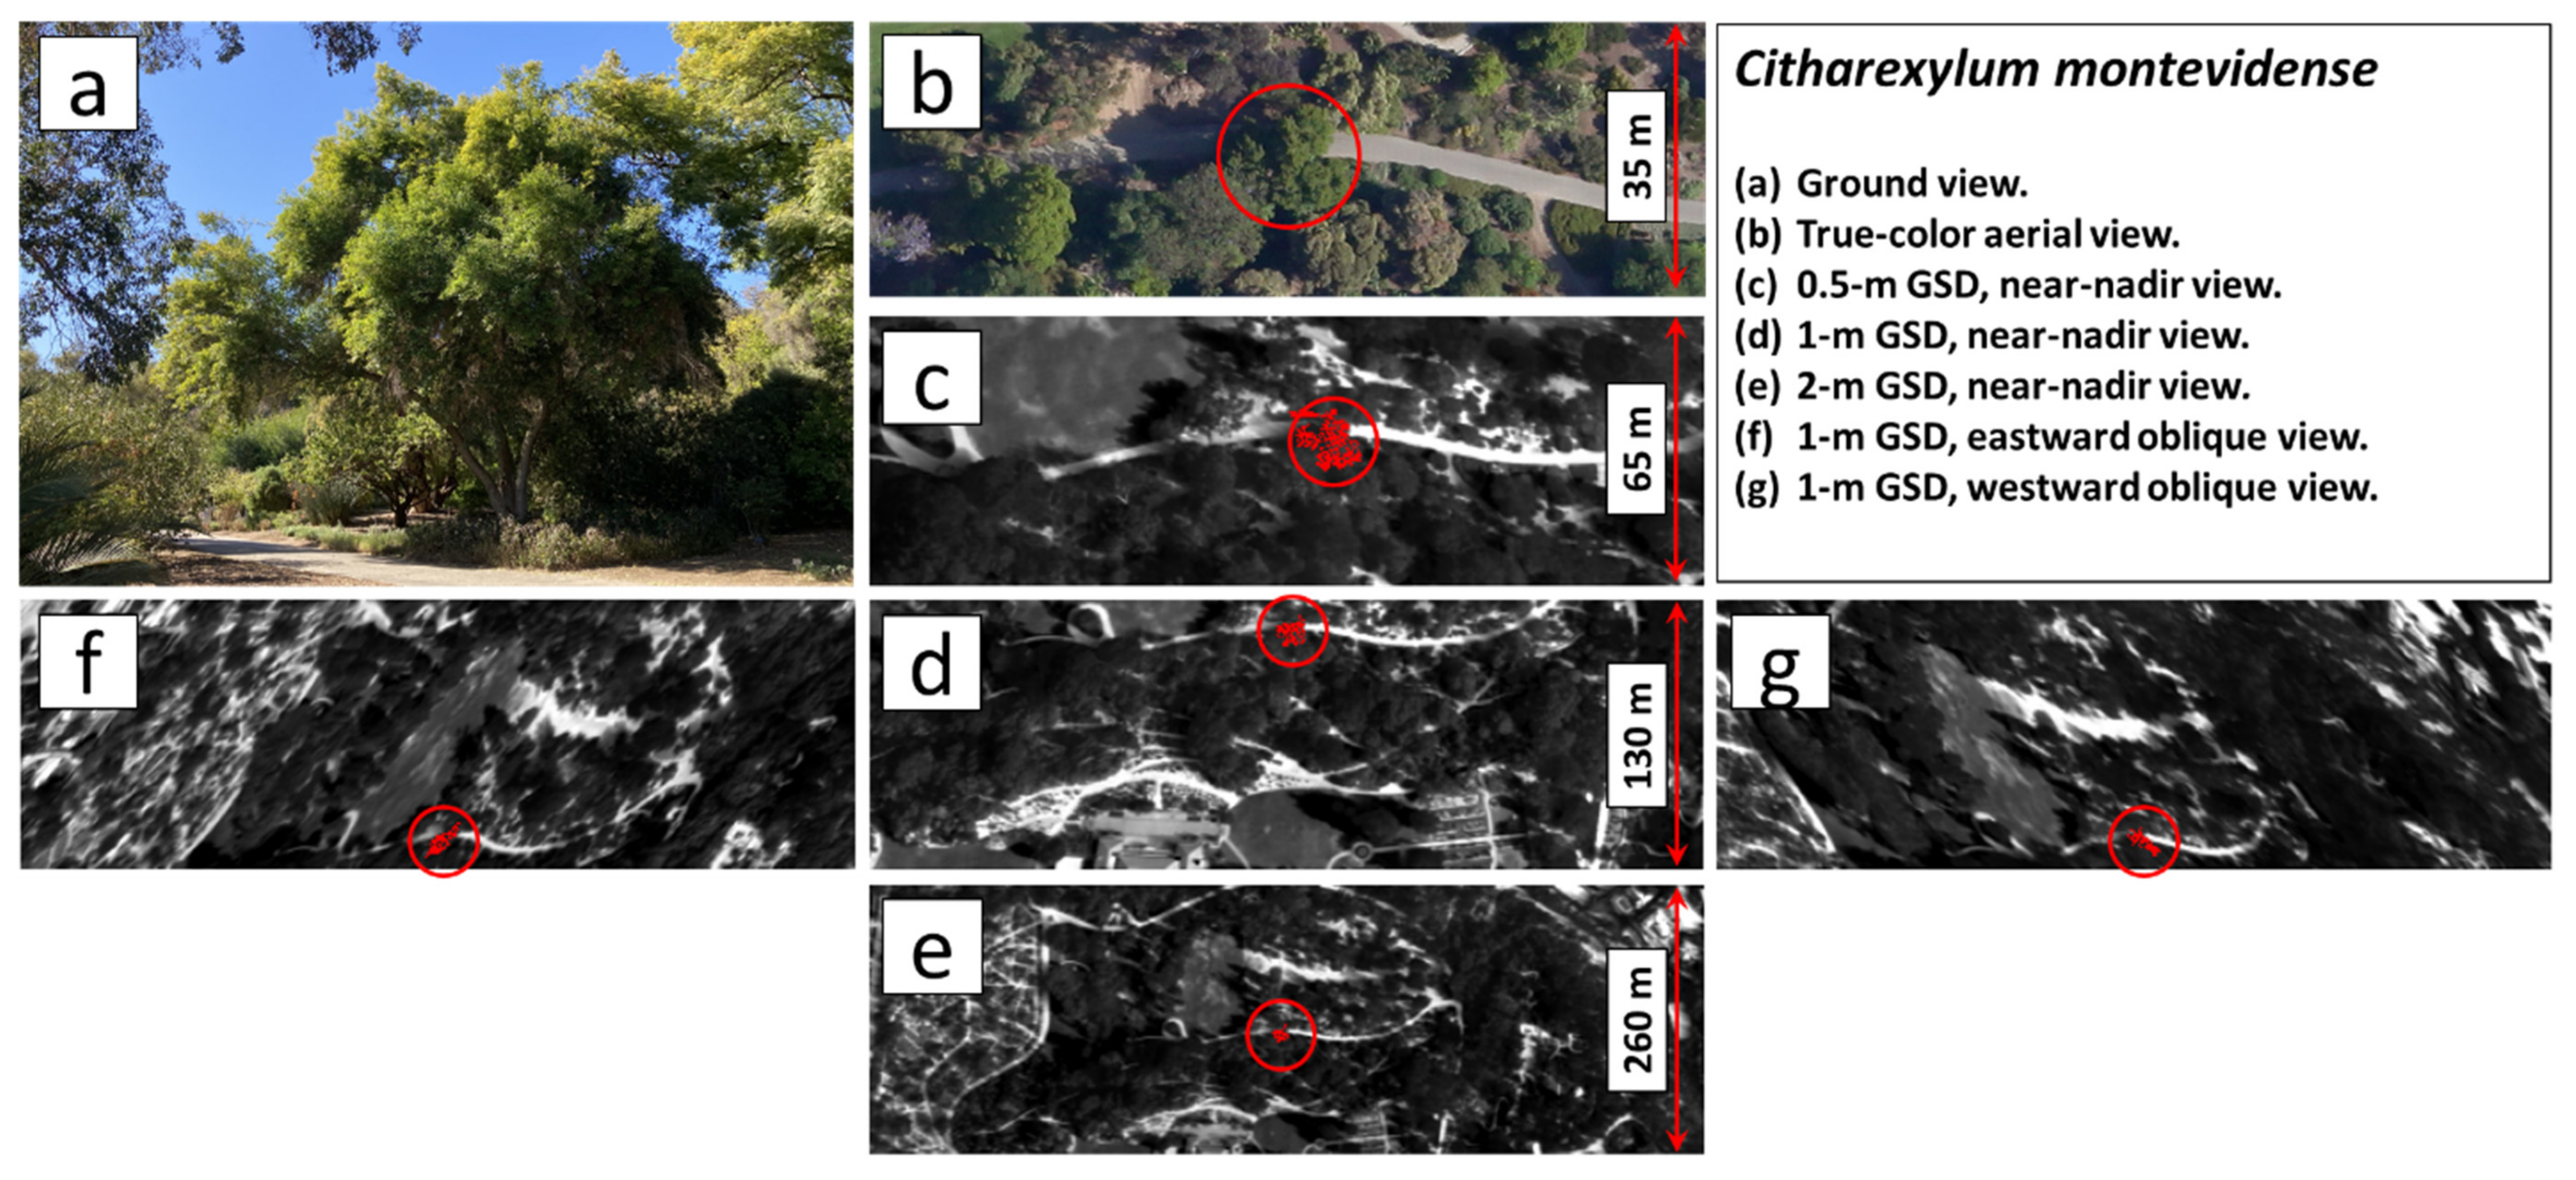
The decline in ID count across all categories as GSD and nadir angle relative to the land surface, θi, increase is unsurprising, given that these distributions are biased by the prevalence of multiple weaker and more marginal IDs that dominate the ensemble statistics. However, viewing these results in aggregate masks behavior at the individual plant level. To gain deeper insight into how different plants respond across the range of viewing conditions represented in Figure 3, we have selected three species that exhibit a strong response and that are of widely diverse habit to examine in detail: the evergreen shrub Salvia leucophylla (Figure 4), the broad-crowned tree Citharexylum montevidense (Figure 5), and the emphatically erectophile Bambusa beecheyana bamboo (Figure 6). Panels c–g in Figure 4, Figure 5 and Figure 6 show the ID’d pixels in red overlain on the gray-scale thermal radiance scene image. The salient observational parameters for each of the three cases are summarized in Table 3.
Table 3 shows that for each of the three nadir-viewing cases, the ID t-statistic is not significantly impacted until 2-m GSD is reached despite steep declines in the number of contributing pixels N as the GSD increases. However, the S. leucophylla ID is lost at 2-m GSD due to its small size depressing N below the criterion threshold set for ID retrieval. Concerning the variable viewing angle results, for the C. montevidense and B. beecheyana examples, there is essentially no impact on t for values of θi up to 45° and only minimal impact in the case of S. leucophylla.
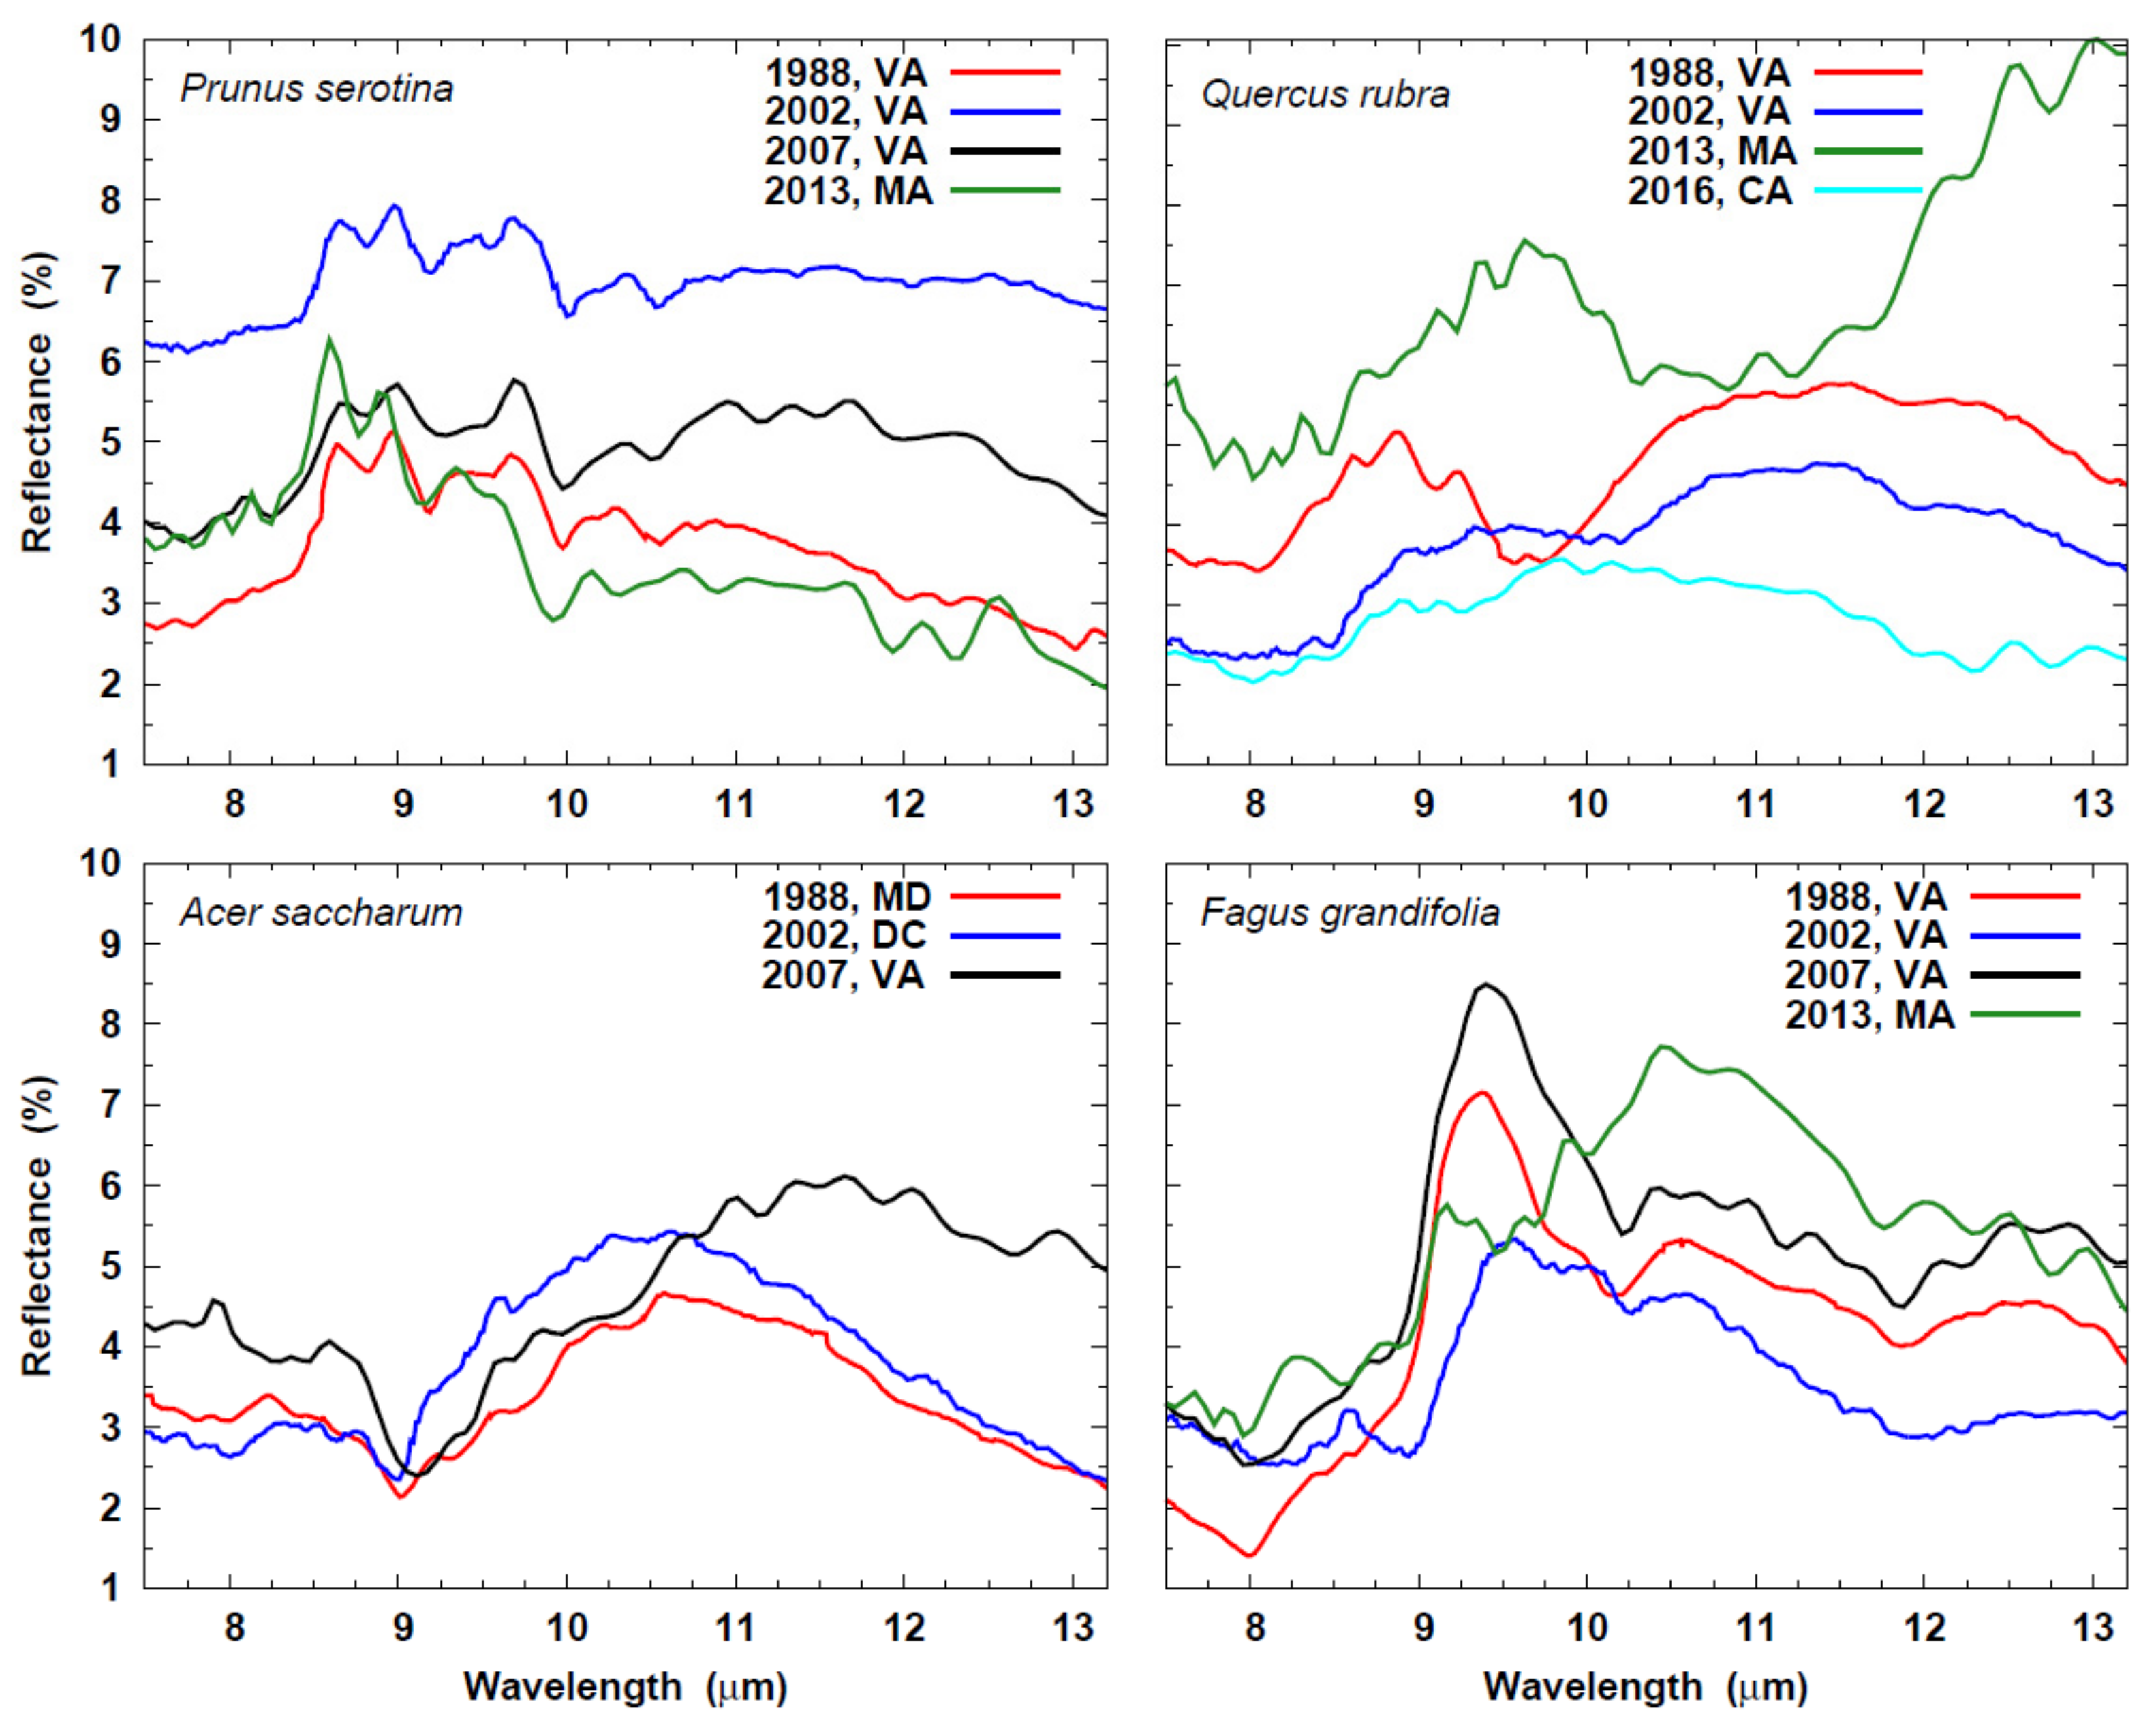
More problematic is the large number of species for which spectra exist in the library, yet not observed during the field studies. In this respect, it is instructive to examine the geographical and environmental variability exhibited by foliar spectra. To this end, multiple spectral collections were surveyed, and four species were selected whose published spectra spanned widely separated epochs and locales. These are shown in Figure 7, where the earliest spectra have been taken from Salisbury and Milton [20], the 2002 spectra from Ribeiro da Luz [38], the 2007 spectra were measured for the Ribeiro da Luz and Crowley 2010 study [21]. The remainder is from the ECOSTRESS 1.0 library [31]. The labeling in the key of this figure provides the year and U.S. region of sample origin.
Figure 7 illustrates the principal impediment to robust taxonomic identification in the LWIR. While some species exhibit a more or less consistent spectral response, e.g., Prunus serotina and Acer saccharum, others show variability that clearly would compromise retrievals of such species, e.g., Quercus rubra, Fagus grandifolia.
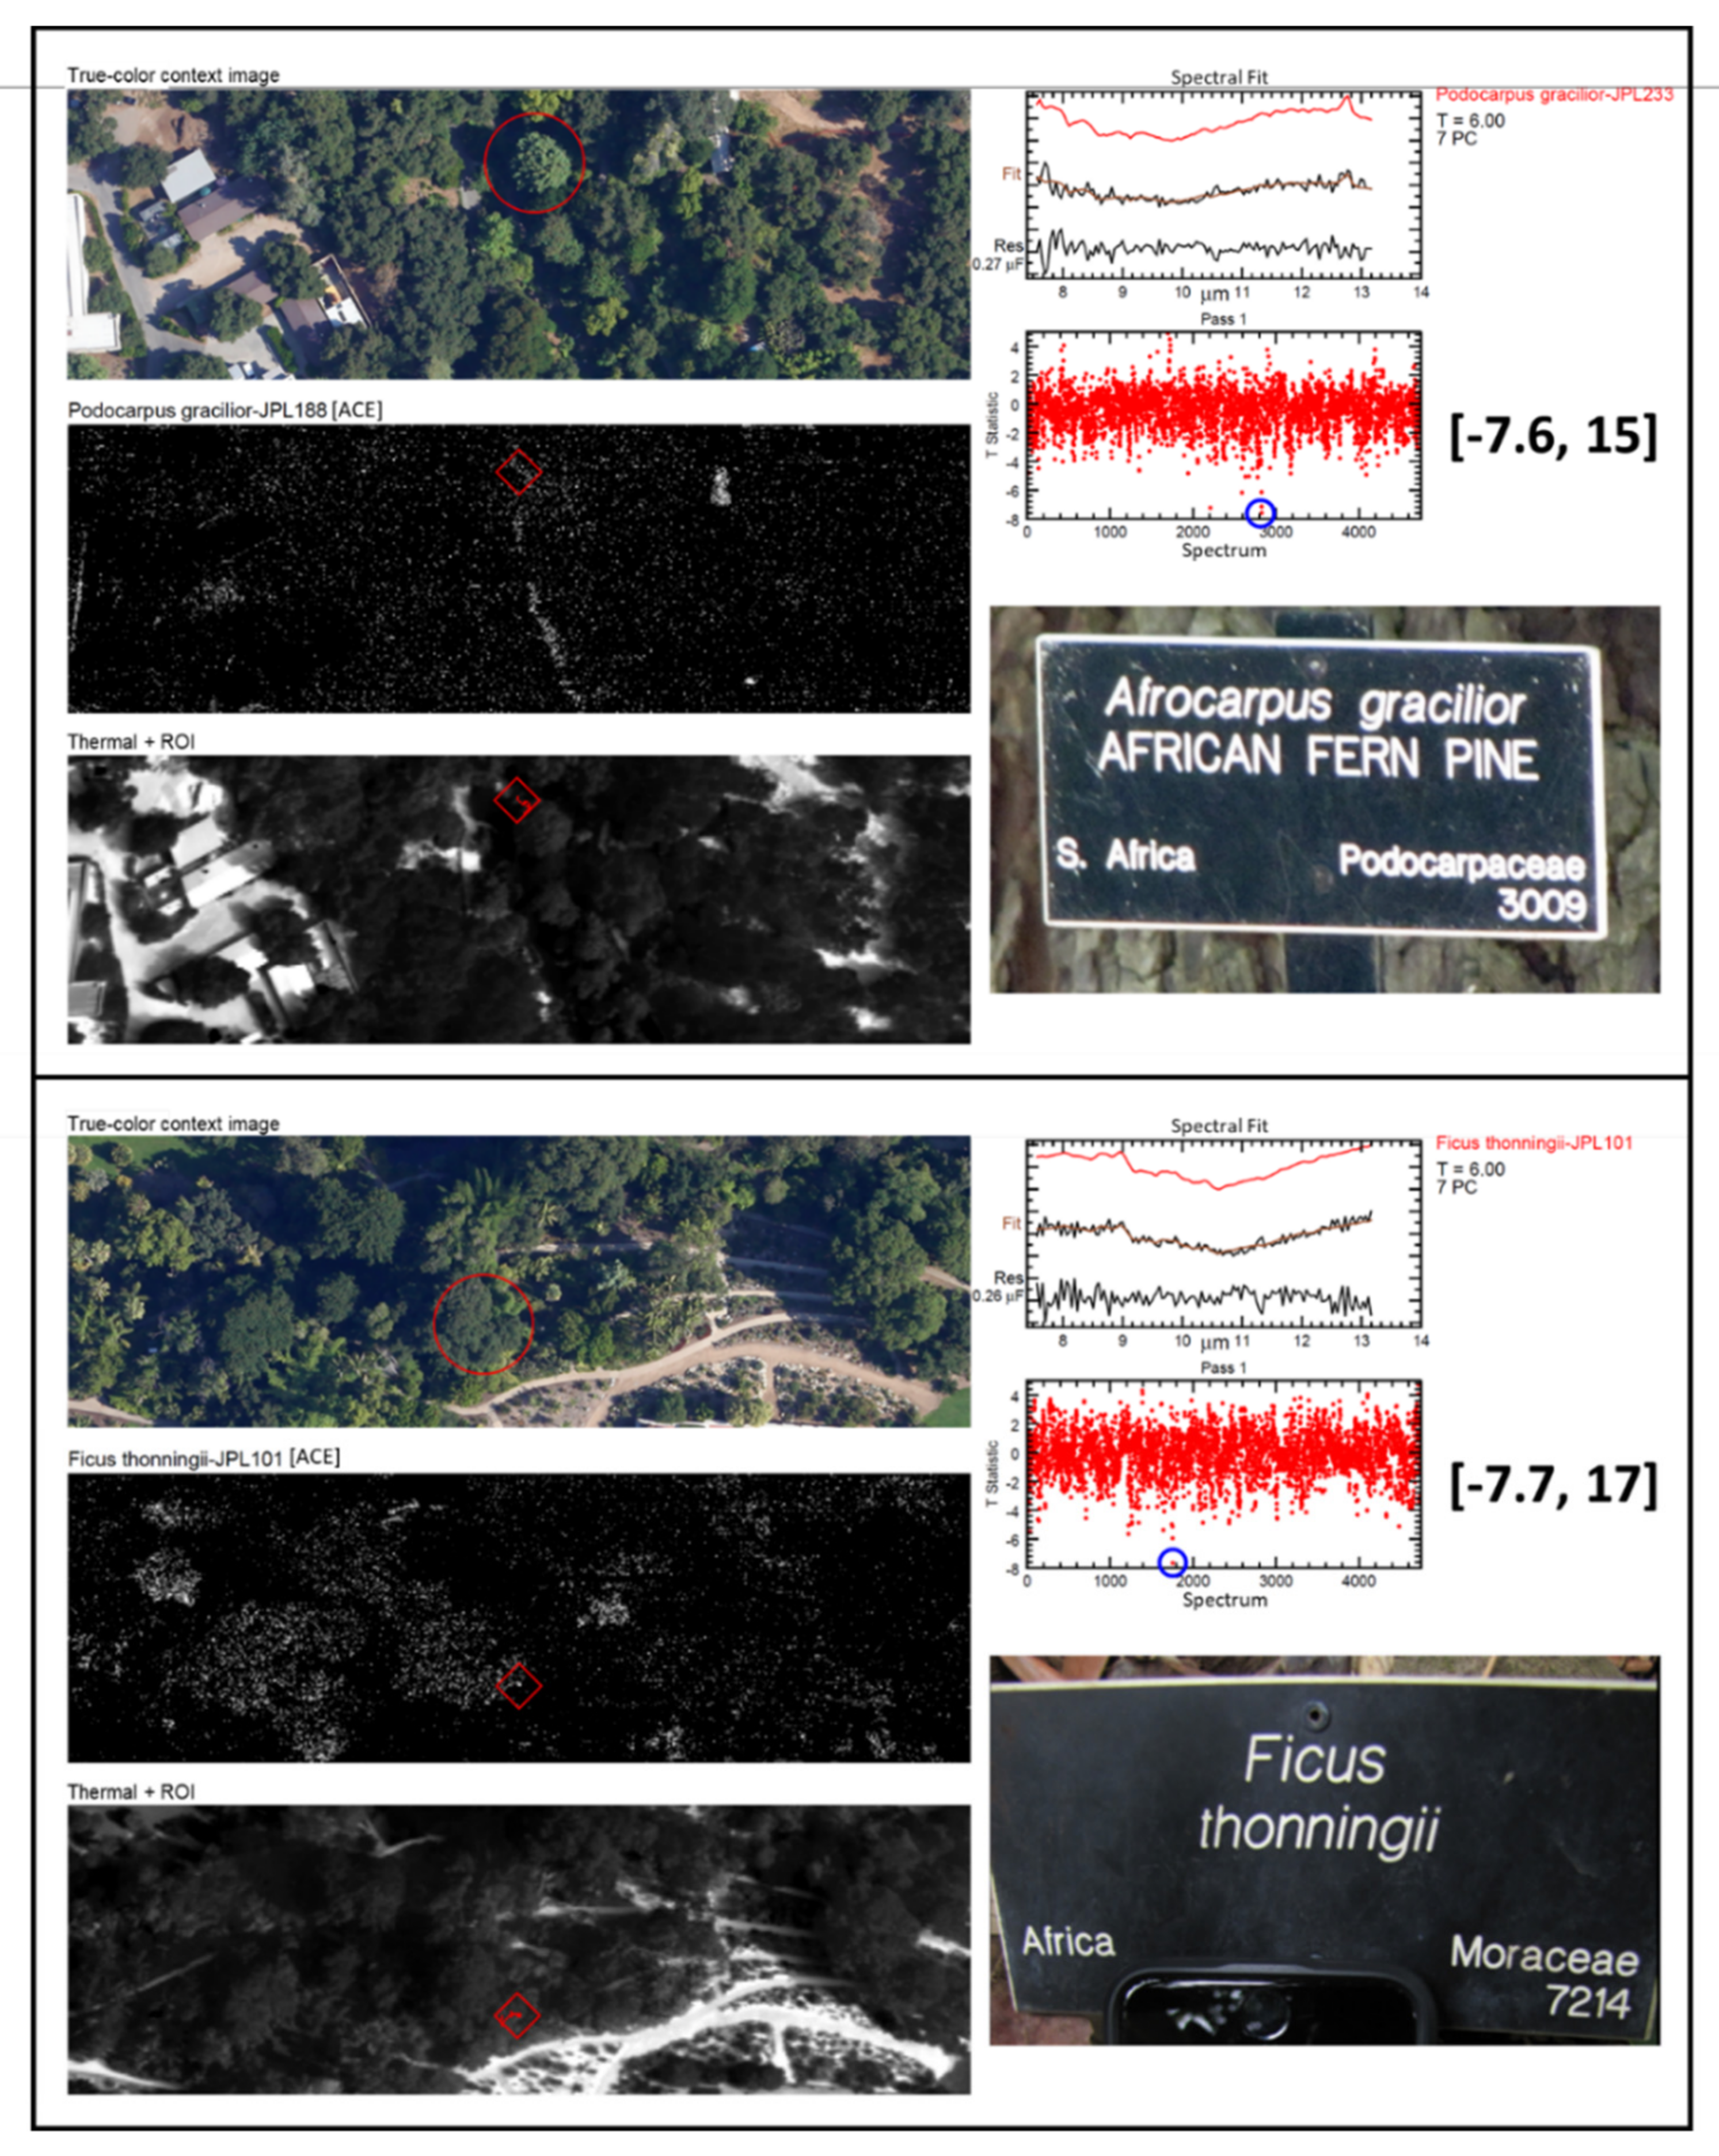
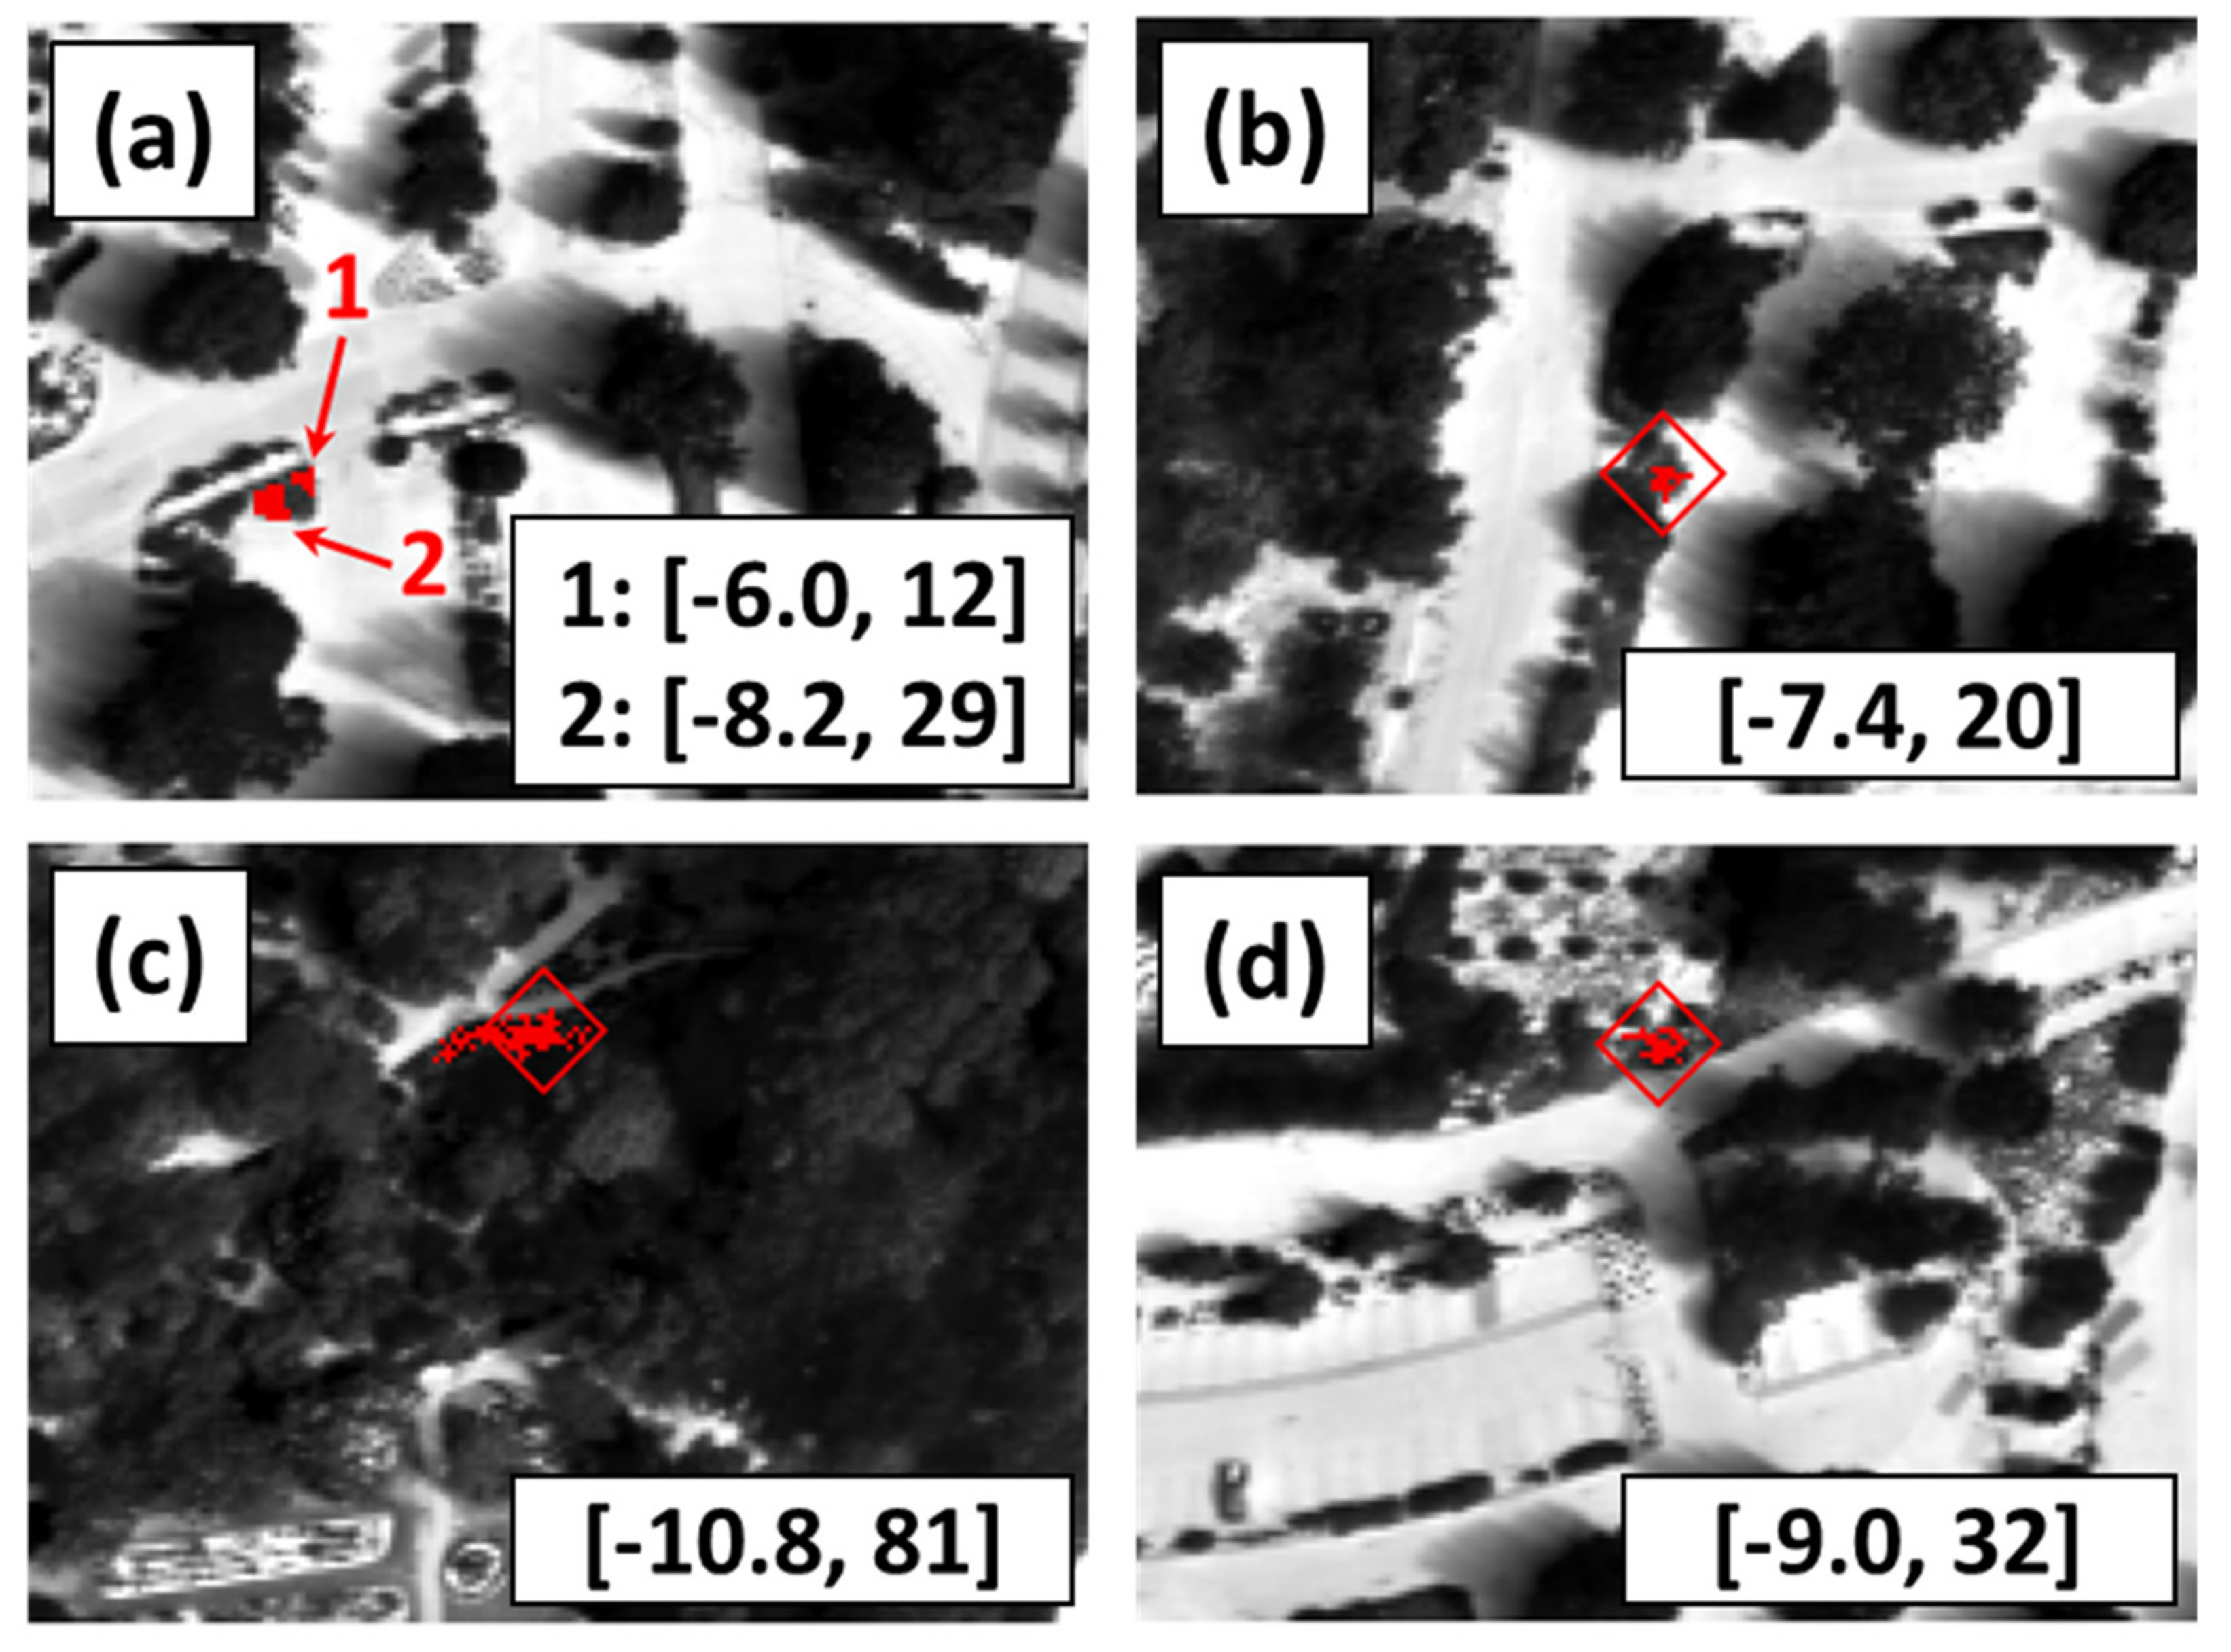
Another significant hindrance is that in the absence of a geocoded inventory, many IDs would only be verifiable with certainty by physically visiting the site in question since they comprised very few pixels representing only a small fraction of the canopy. Two such instances from the Huntington Gardens are depicted in Figure 8. Note that in both of these cases the canopy of the target tree is >10 m in horizontal extent at its widest point. However, the values of N indicate that less than 4 m2, or 3–5%, of the canopy contributes to ID determination. Figure 8 also introduces a notation used throughout this paper, i.e., the paired numbers in square brackets representing [t, N] for the subject ID.
In each of these two examples, the detection imagery (center left image) shows only a weak, diffuse response from the canopy. Cases of this sort would normally be rejected during analyst inspection as too marginal. These may prove resistant to automated decision-making techniques, implying they would be unworkable in large-scale surveying situations.
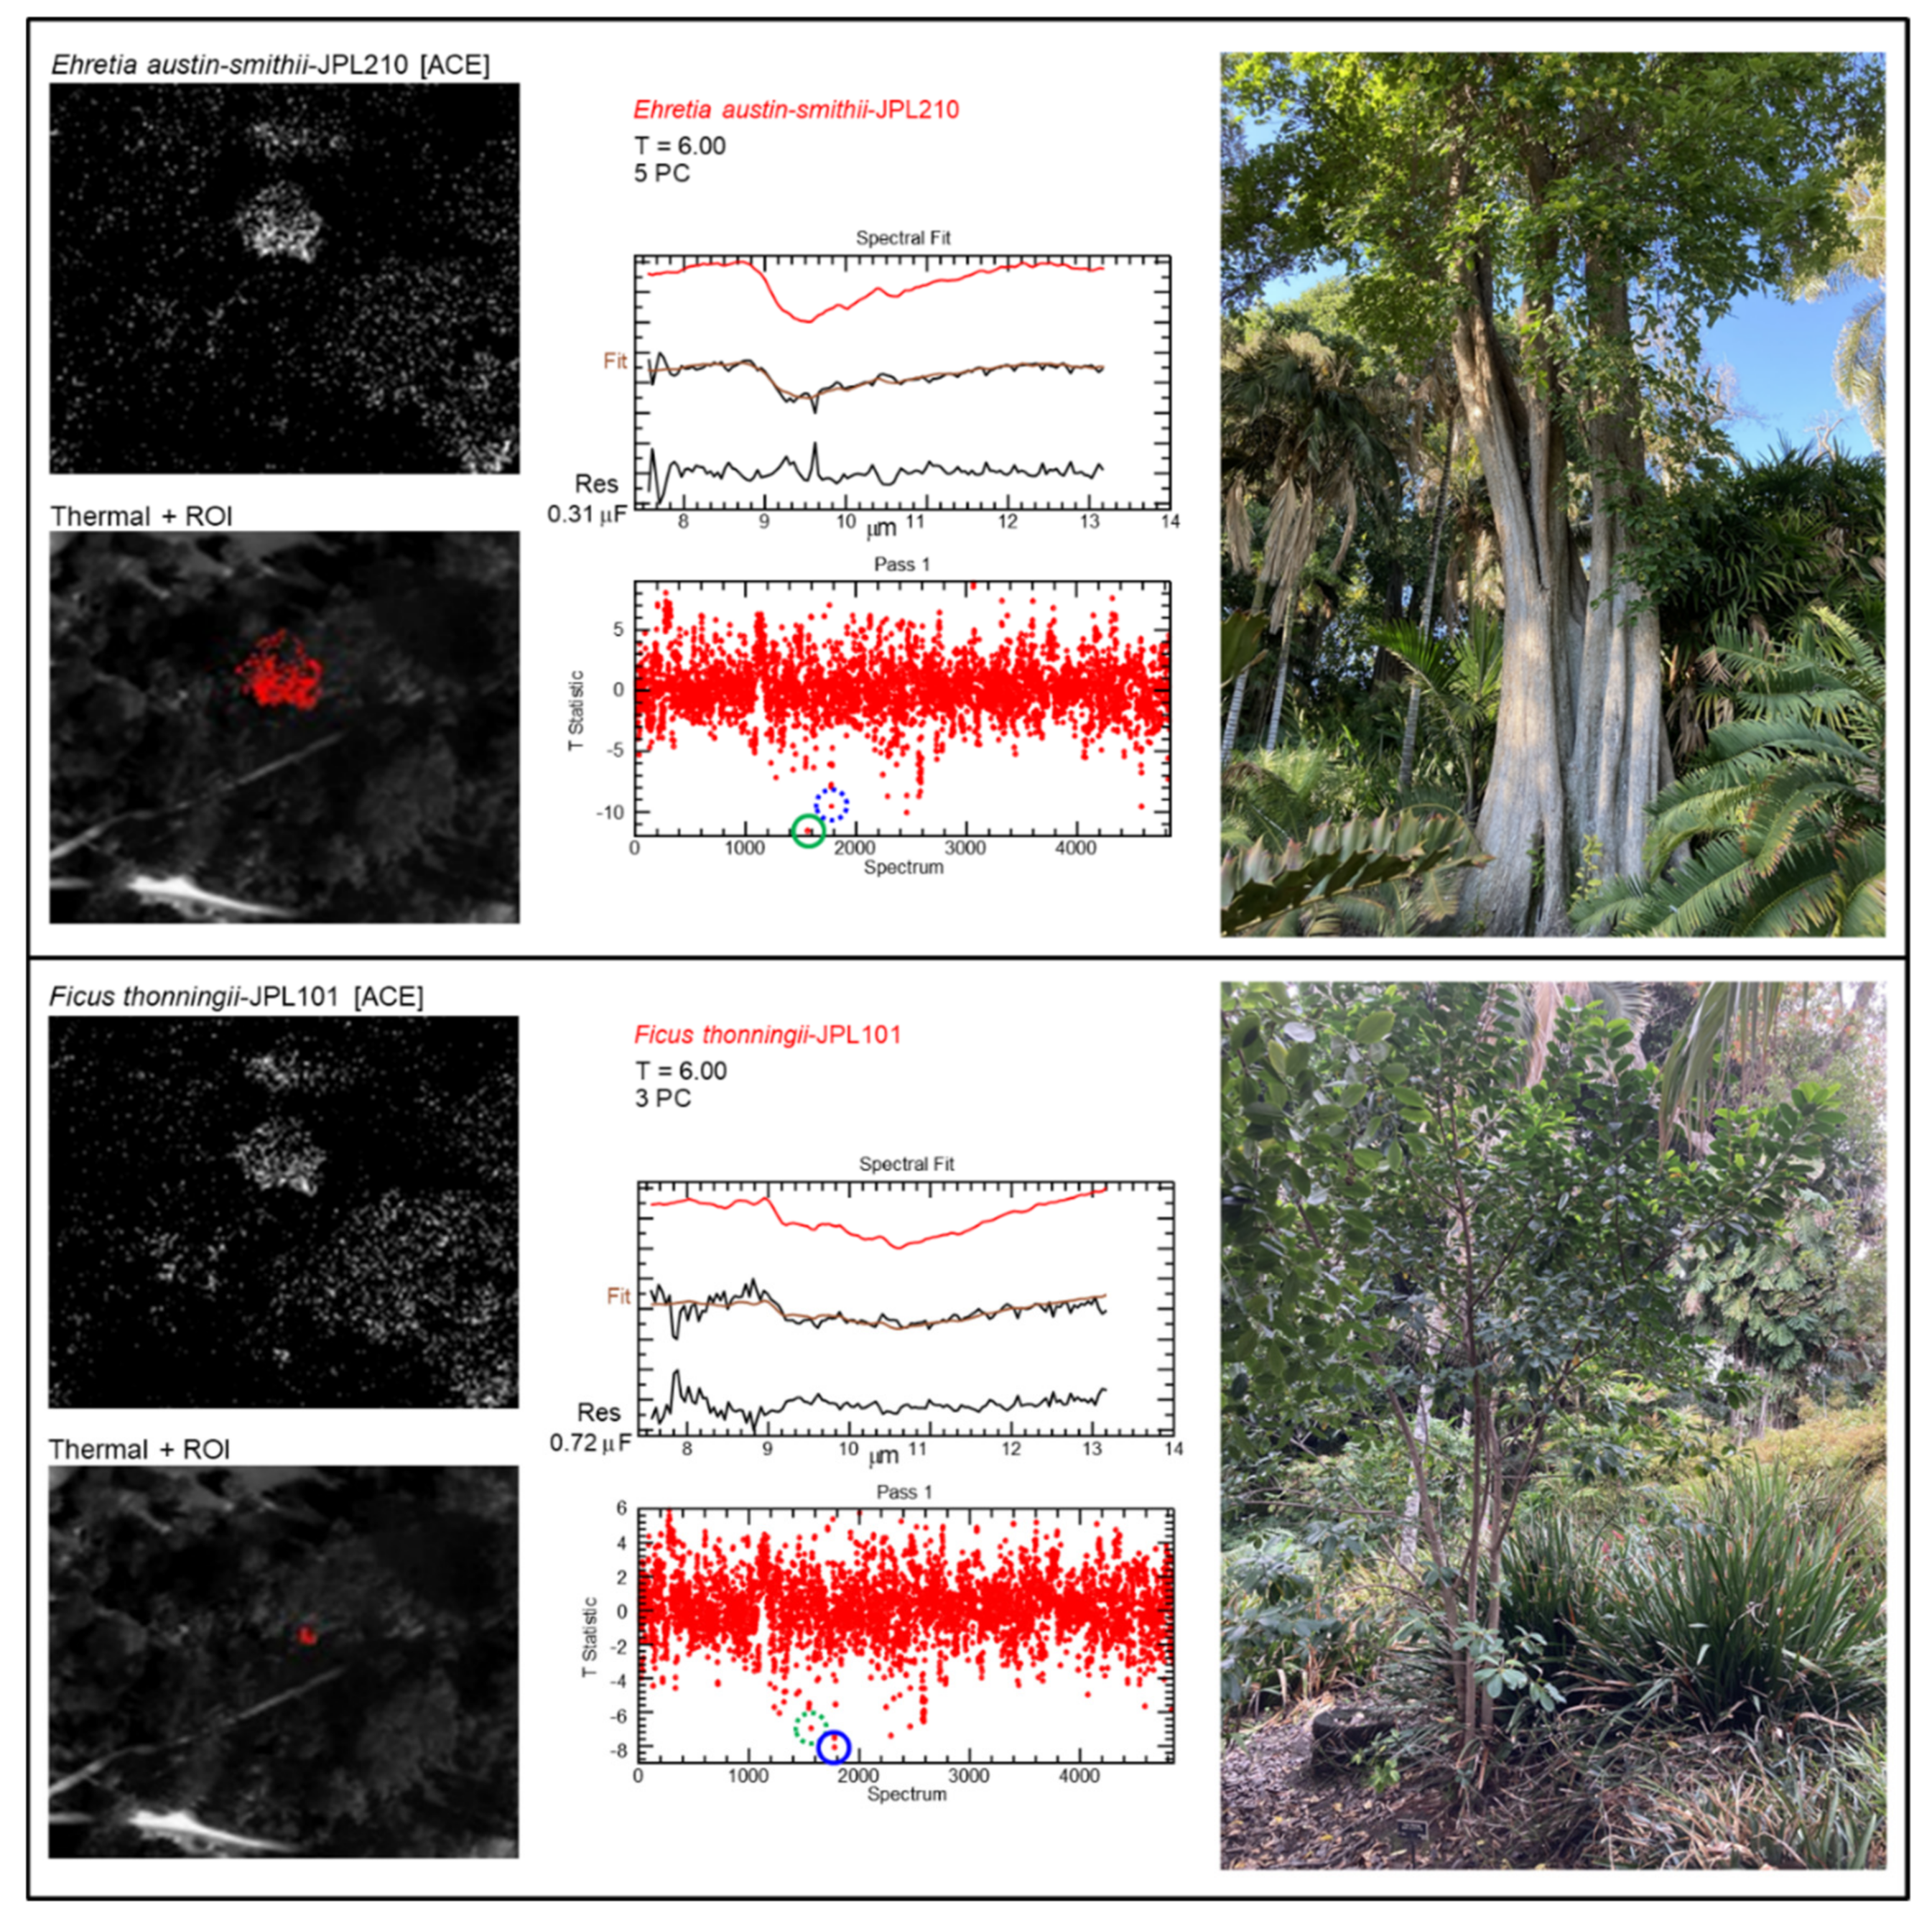
By contrast, Figure 9 shows a particularly illustrative example of a circumstance in which species that are closely juxtaposed spatially are unambiguously separated spectrally. In this case, a Ficus thonningii sapling is planted adjacent to (and almost occluded by) a mature Ehretia latifolia (syn. E. austin-smithii). The F. thonningii spectra in the library were sourced from mature specimens at the Huntington Gardens, yet interestingly, this young tree responds more favorably to those spectra. This case highlights the ability of high spatiospectral resolution to deconflict intersecting signatures.
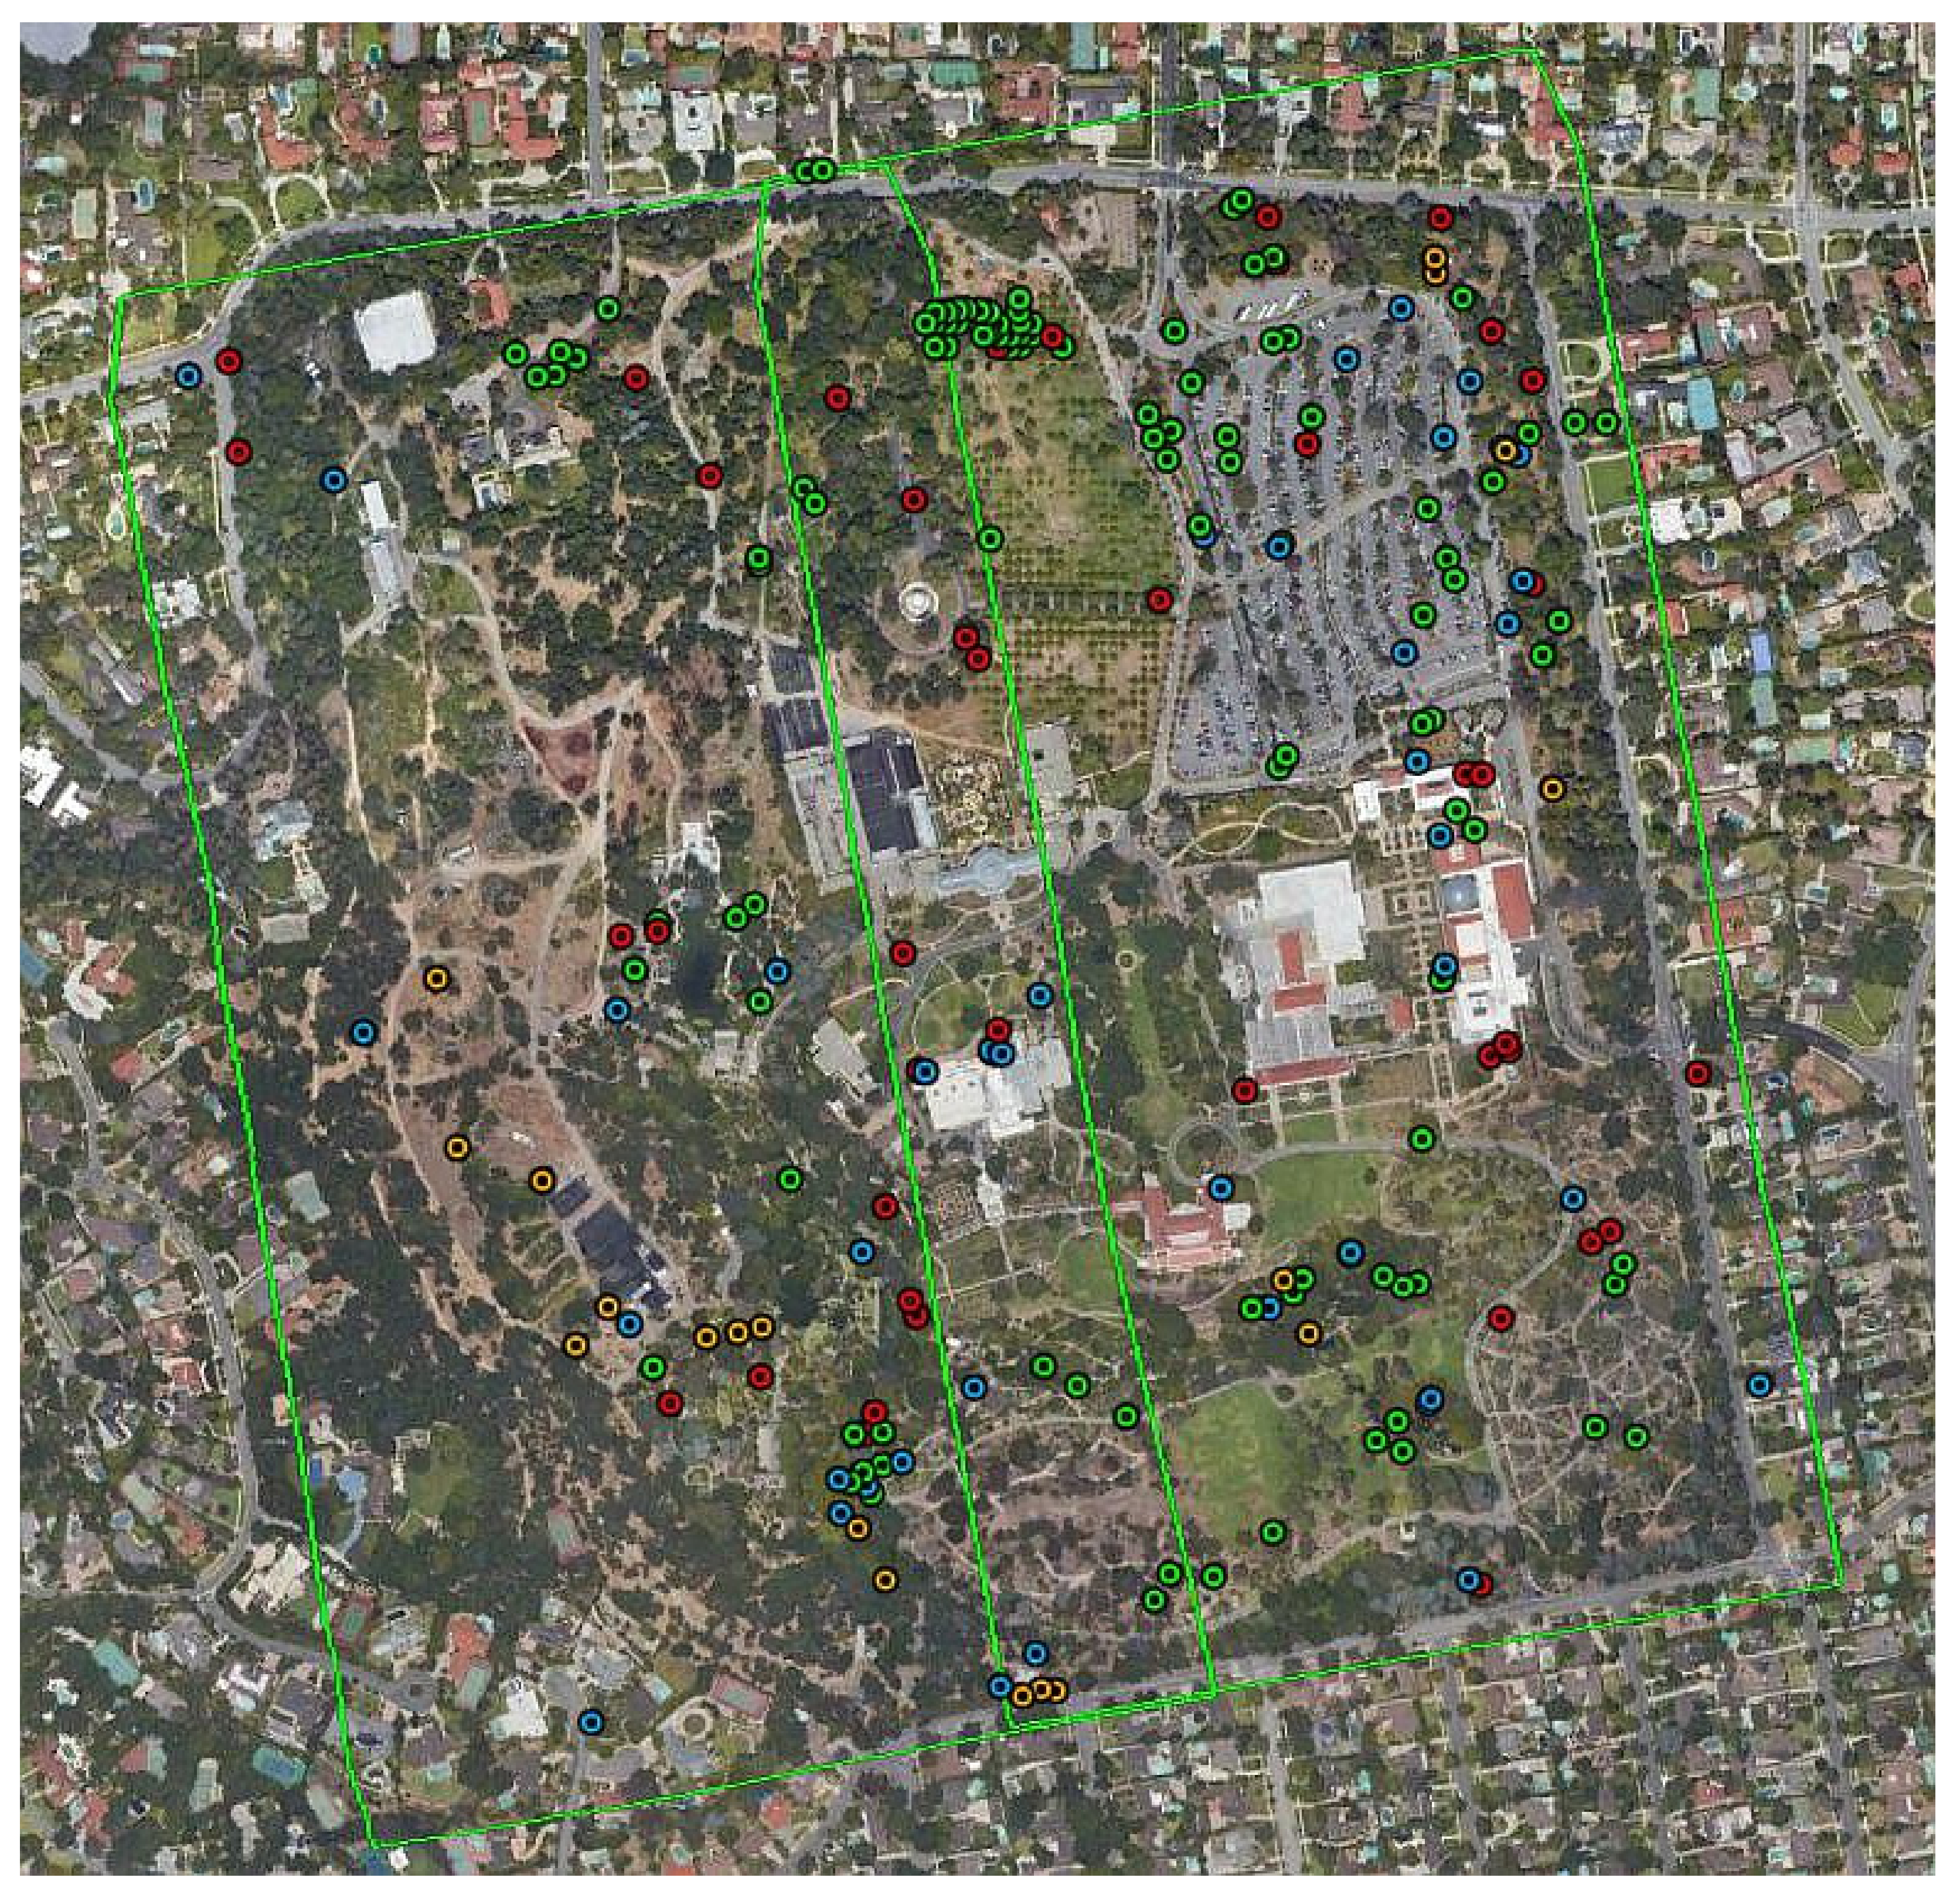
Figure 10 summarizes the entire set of IDs obtained from the highest resolution (0.5-m GSD) imagery of Huntington Gardens. Color coding of the markers corresponds to the classes treated in Figure 3, excluding mis-IDs of specimens not represented in the spectral library. The disposition of ID classes portrayed does not suggest any dependence on θi. However, the weighting of IDs to the eastern side of the facility does explain the asymmetry between the two oblique views represented in Figure 3b, since the westward view would sample those locations at reduced range and obliquity compared to the eastward view so that the associated IDs suffer less degradation resulting from those factors.
The sampling of case vignettes in the following subsections illustrates both the strengths and weaknesses of LWIR spectral imaging for plant identification and are all taken from the 0.5-m GSD data sets. As will be demonstrated, species were often correctly ID’d to at least the genus level. This reflects a degree of spectral similarity between different species of the same genus that may offer additional utility in some scenarios. Where spectra are shown, these have been resampled to be consistent with the instrumental spectral response.

3.1. Salvia spp.

The Salvia genus of shrubs is represented in the ECOSTRESS spectral library by S. leucophylla specimens collected from the holotype region of the species (Santa Barbara, CA, USA). S. leucophylla provides one of the strongest responses of any species present in the spectral library, as indicated in Figure 4. In addition to many successful identifications of S. leucophylla and its cultivars, it was found that these spectra were also influential in identifying several other Salvia species at the genus level. Hence, incidences of S. chamaedryoides, S. clevelandii, S. fruticosa, and the hybrid S. leucophylla x S. clevelandii were all identified with high t-stat. The last-named counts as a positive ID at the species level since it is a hybrid of the target species. Some examples of such detections are shown in Figure 11, along with their respective ID strengths. The two individual IDs featured in Figure 11a are set ~1 m apart and separated by a planting of the unrelated shrub Eriogonum arborescens. In contrast, the ID depicted in Figure 11c is a composite response in which the densest agglomeration of pixels is due to S. fruticosa, and the tail of the ID derives from an adjacent planting of S. heldreichiana. Other Salvia species encountered (e.g., S. mellifera, S. apiana) tended to respond less reliably to the S. leucophylla spectra, mis-ID’ing against unrelated spectra in the library.

3.2. Persea americana

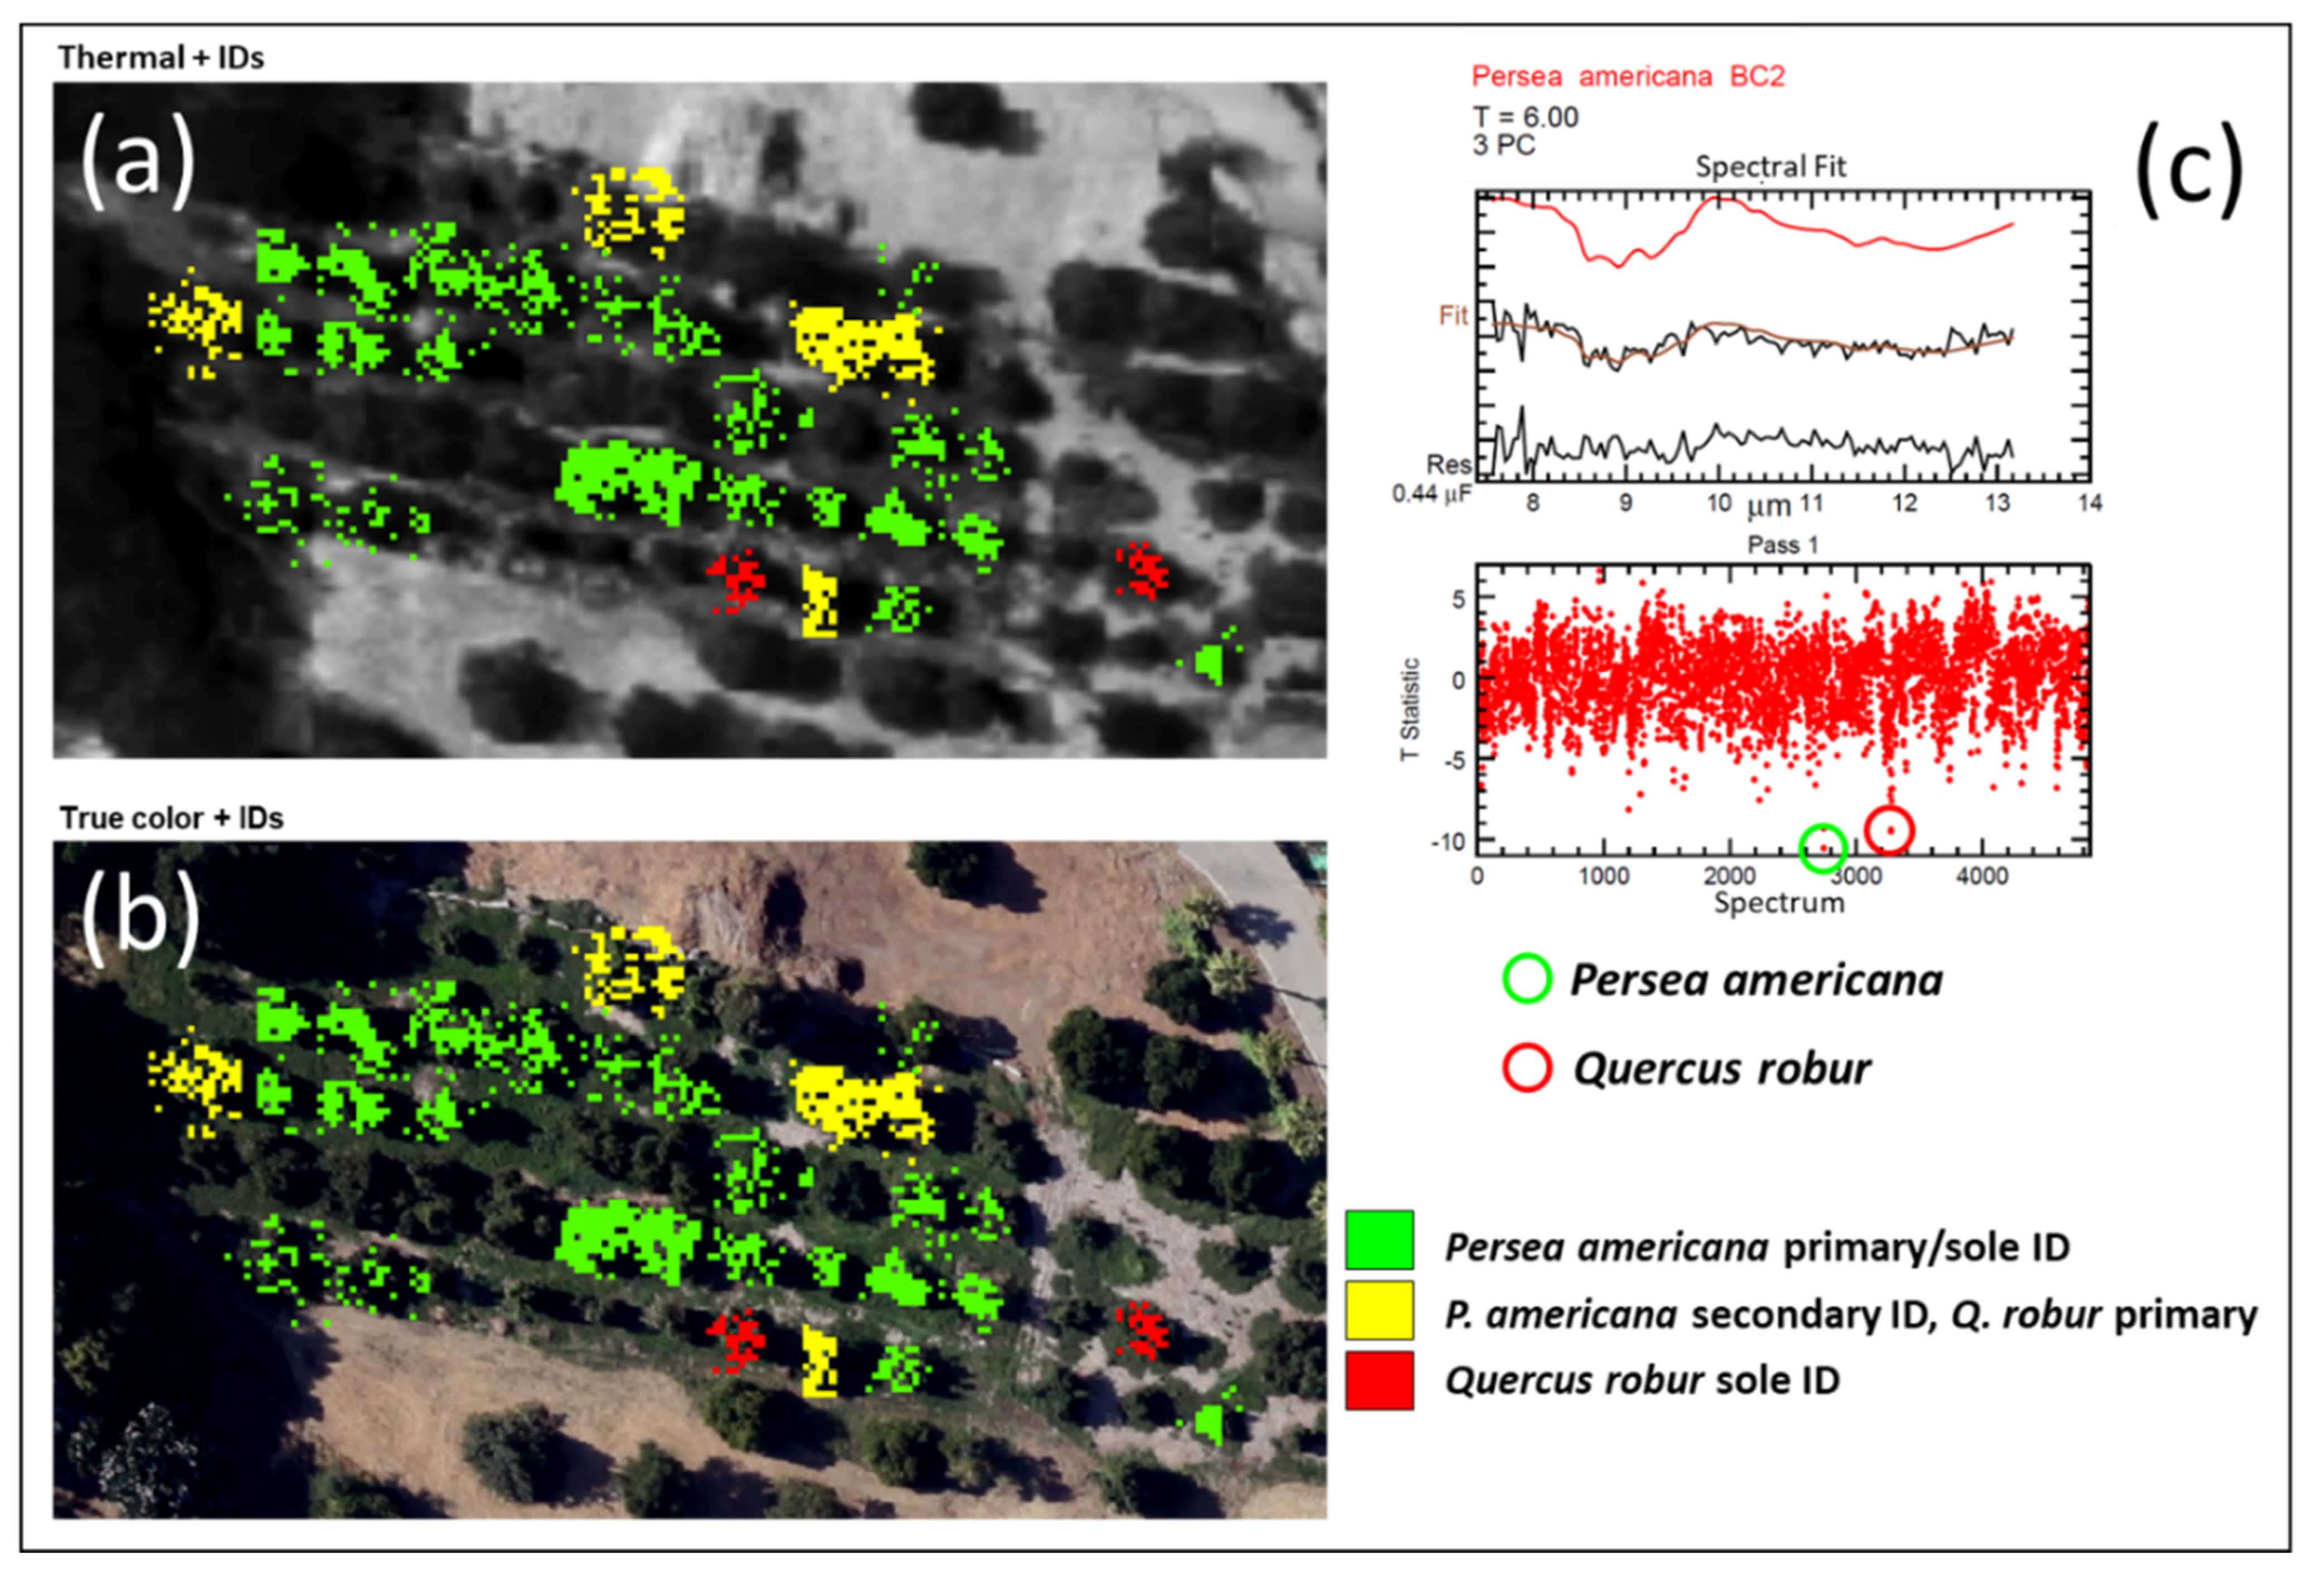
Initial analyses of the Huntington Gardens imagery revealed a regular array of trees near the facility’s northern extremity that uniformly ID’d as Quercus robur. This proved to be an orchard of Persea americana (avocado) trees comprising a collection of numerous P. americana cultivars that supports a cryopreservation research program [39].
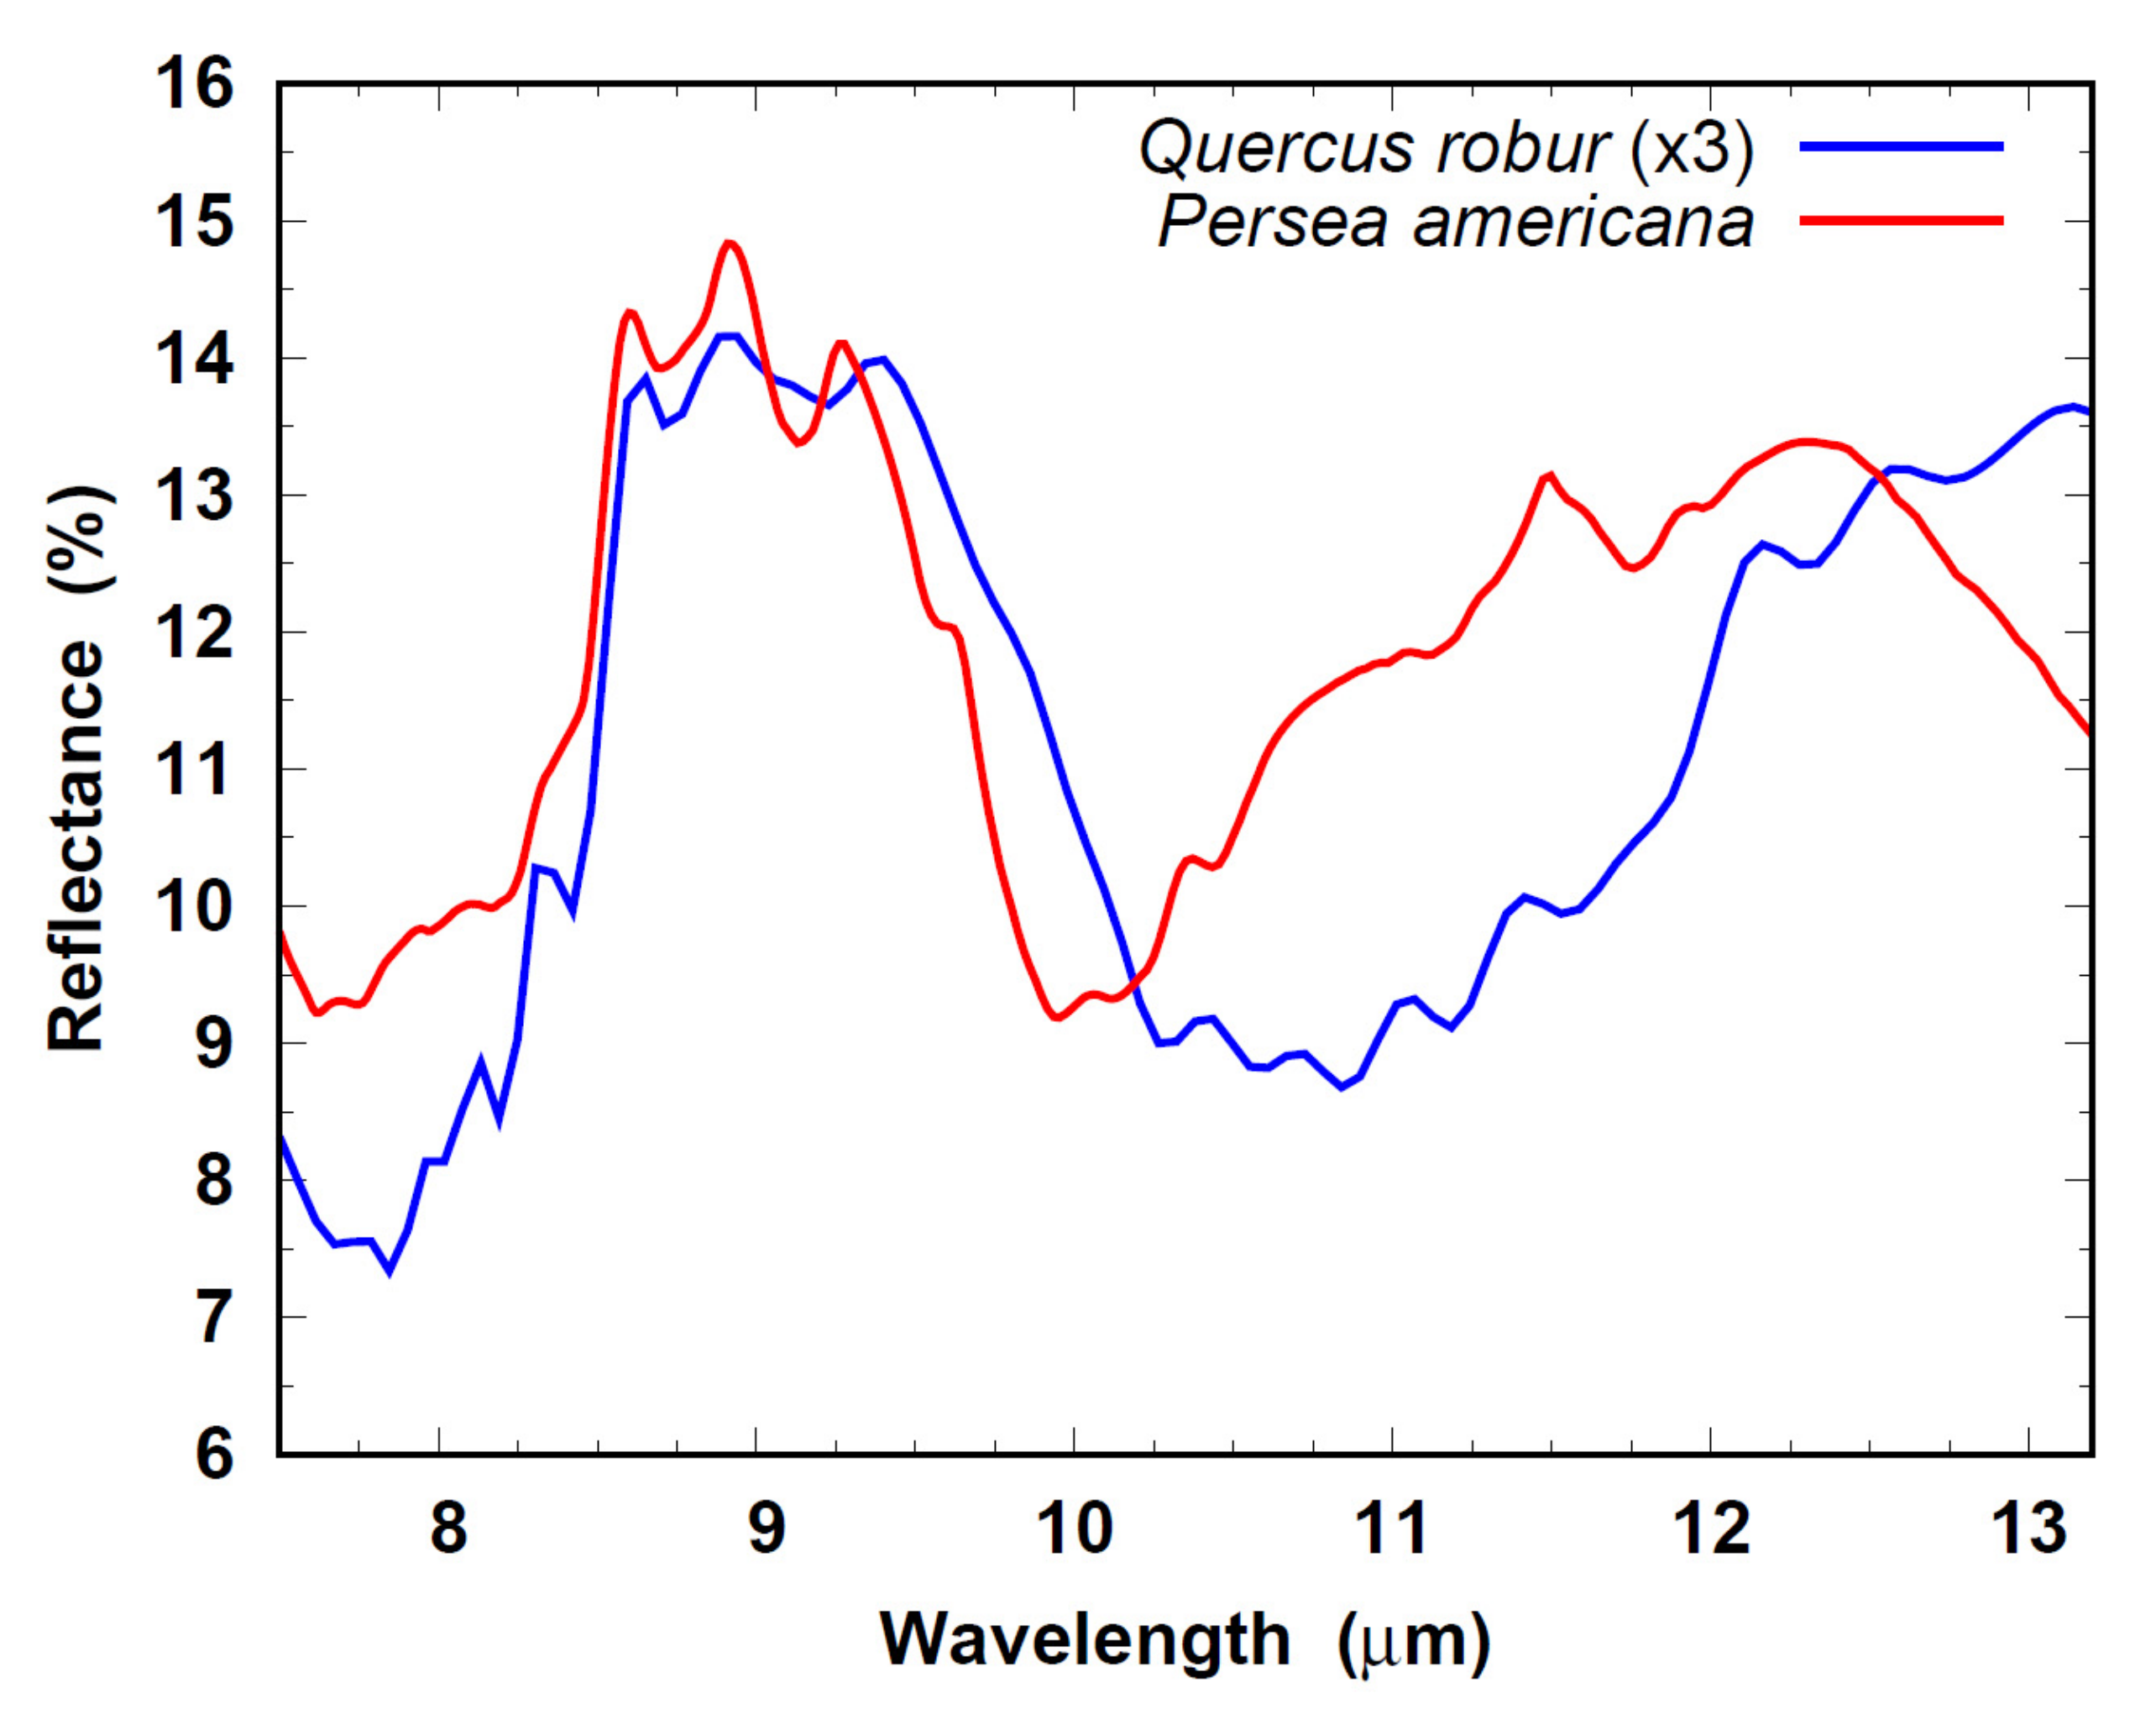
P. americana was initially absent from the spectral library, so it was decided to measure spectra of freshly collected leaf samples (see Section 2.4) and re-process the imagery using those spectra. This resulted in 26 positive IDs of the P. americana specimens in the orchard, and several additional P. americana trees elsewhere within the facility, each with a stronger t-stat than the corresponding Q. robur false ID. Figure 12 shows the orchard and associated P. americana IDs, for which the t-stats ranged from −6.2 to −11.4. In panels (a) and (b) of this figure, the green IDs signify specimens that yielded either a primary or sole P. americana ID, while the yellow IDs gave a primary ID of Q. robur with P. americana appearing as a secondary ID. The red IDs denote two residual specimens that were mis-ID’d as Q. robur with no secondary P. americana ID. Figure 12c shows a typical spectral analysis result depicting the fit quality and the relative t-stats of the P. americana and Q. robur spectra. The t-stat plot shows the positions of these two spectra relative to all other spectra in the Aerospace solids spectral library (>5000 members). The most commonly ID’d of each spectrum are compared in Figure 13. Note that the Q. robur reflectance has been scaled by a factor of 3 to better judge the similarity in spectral shape.
Ironically, the Q. robur library spectrum is more proficient at inferring the presence of P. americana than Q. robur, or any other Quercus species (see also Section 3.7).

3.3. Chionanthus spp. and Citharexylum spp.

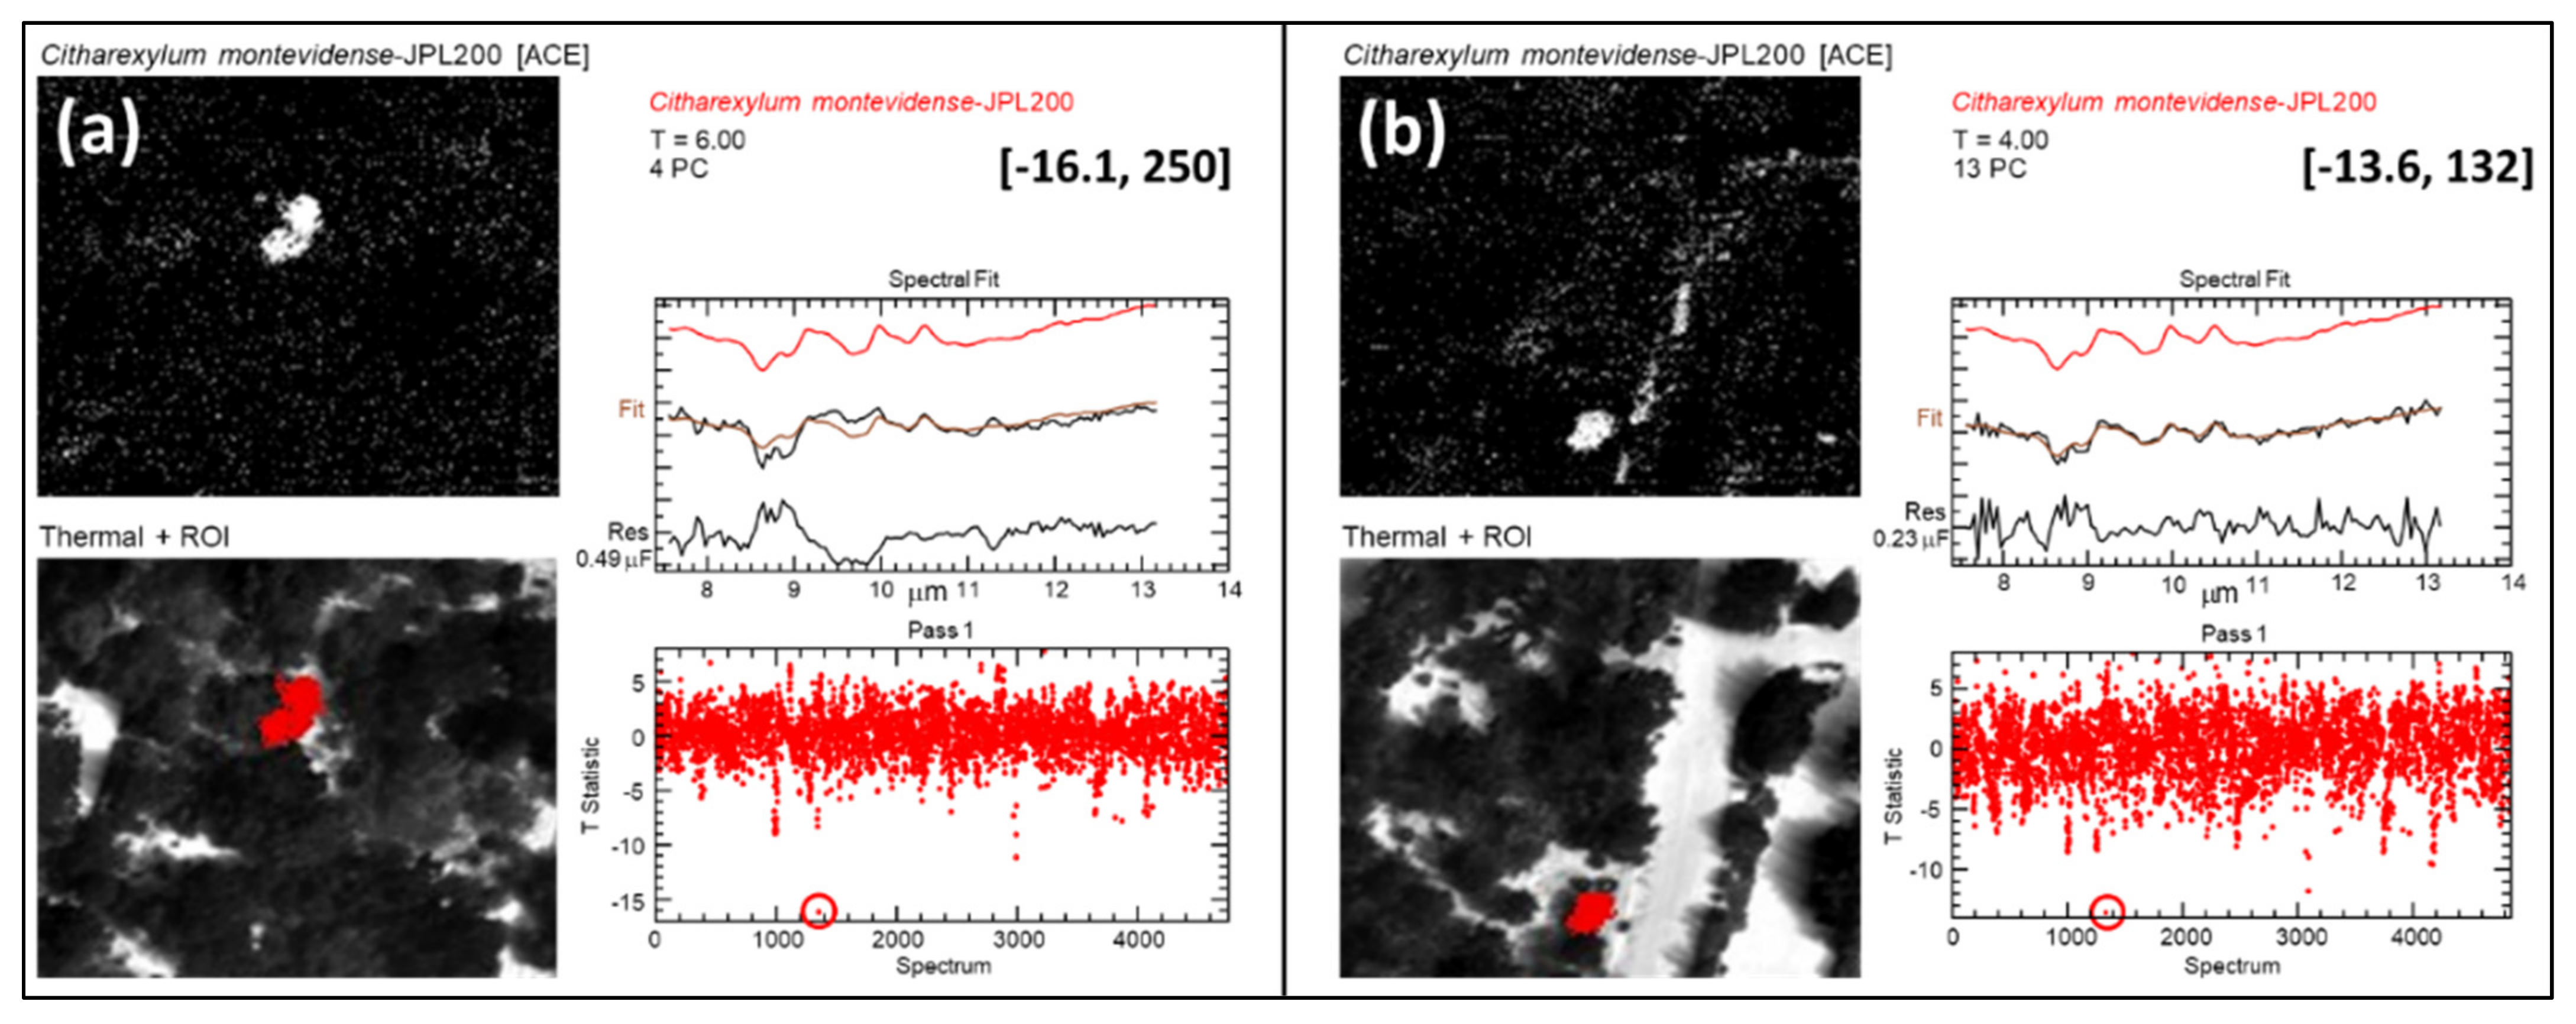
Chionanthus retusus was not originally in the spectral library. However, during preliminary analysis, it was seen to respond strongly to the Citharexylum montevidense spectrum, a behavior that was observed at the Huntington Gardens, Lacy Park, and Descanso Gardens. Therefore, Ch. retusus foliar spectra were collected (see Section 2.4), and the imagery was re-processed using the new measurements. In contrast to the similar procedure described in Section 3.2, the outcome from this process was only partially successful. Approximately 50% of the Ch. retusus specimens at the three facilities listed above ID’d correctly, with the remainder continuing to mis-ID as C. montevidense.
Figure 14a shows an area at the Huntington Gardens where several Ch. retusus specimens were mis-ID’d as C. montevidense. These are designated by the red diamonds in the lower panel of the frame. The upper panel provides the equivalent thermal scene image. The prominent mis-ID to the right of the panel center (labeled 2) marks the specimen with the strongest t-stat, which is also the tree that provided the reference spectra. Figure 14b shows the same scene as processed by adding the new Ch. retusus signatures to the spectral library, where it can be seen that the response from that tree is now too weak to generate an ID. It is noted that one other of the Ch. retusus ID’d by the C. montevidense spectrum (labeled 4) also does not appear in this view. Note that additional detections are indicated in this figure and similar displays in this paper that do not produce IDs. The ID algorithm (Section 2.2) selection criteria eliminate any material IDs unrelated to vegetation or that ID as vegetation from a different genus.
As an aside, we note that the sole C. montevidense specimen at the Huntington Gardens (which is also the tree that provided the reference spectrum) is positively ID’d with one of the strongest t-stats observed in this study (Table 3) and was also correctly ID’d in the 2013 and 2019 imagery of the facility. Although it also triggers the Ch. retusus filter, the response is weaker than that of the C. montevidense filter so that no false ID results. The only other C. montevidense specimen encountered in this study (at the Los Angeles Co. Arboretum) was also correctly ID’d with a strong t-stat (−12). However, the small sample size of C. montevidense in the study (2) is inadequate for generalizing its ease of detectability. Two related species present at the Los Angeles Arboretum (C. berlandieri, immediately adjacent to the C. montevidense, and C. hidalgense) were also ID’d by the C. montevidense filter, illustrating once again the tendency toward spectral similarity within a given genus.
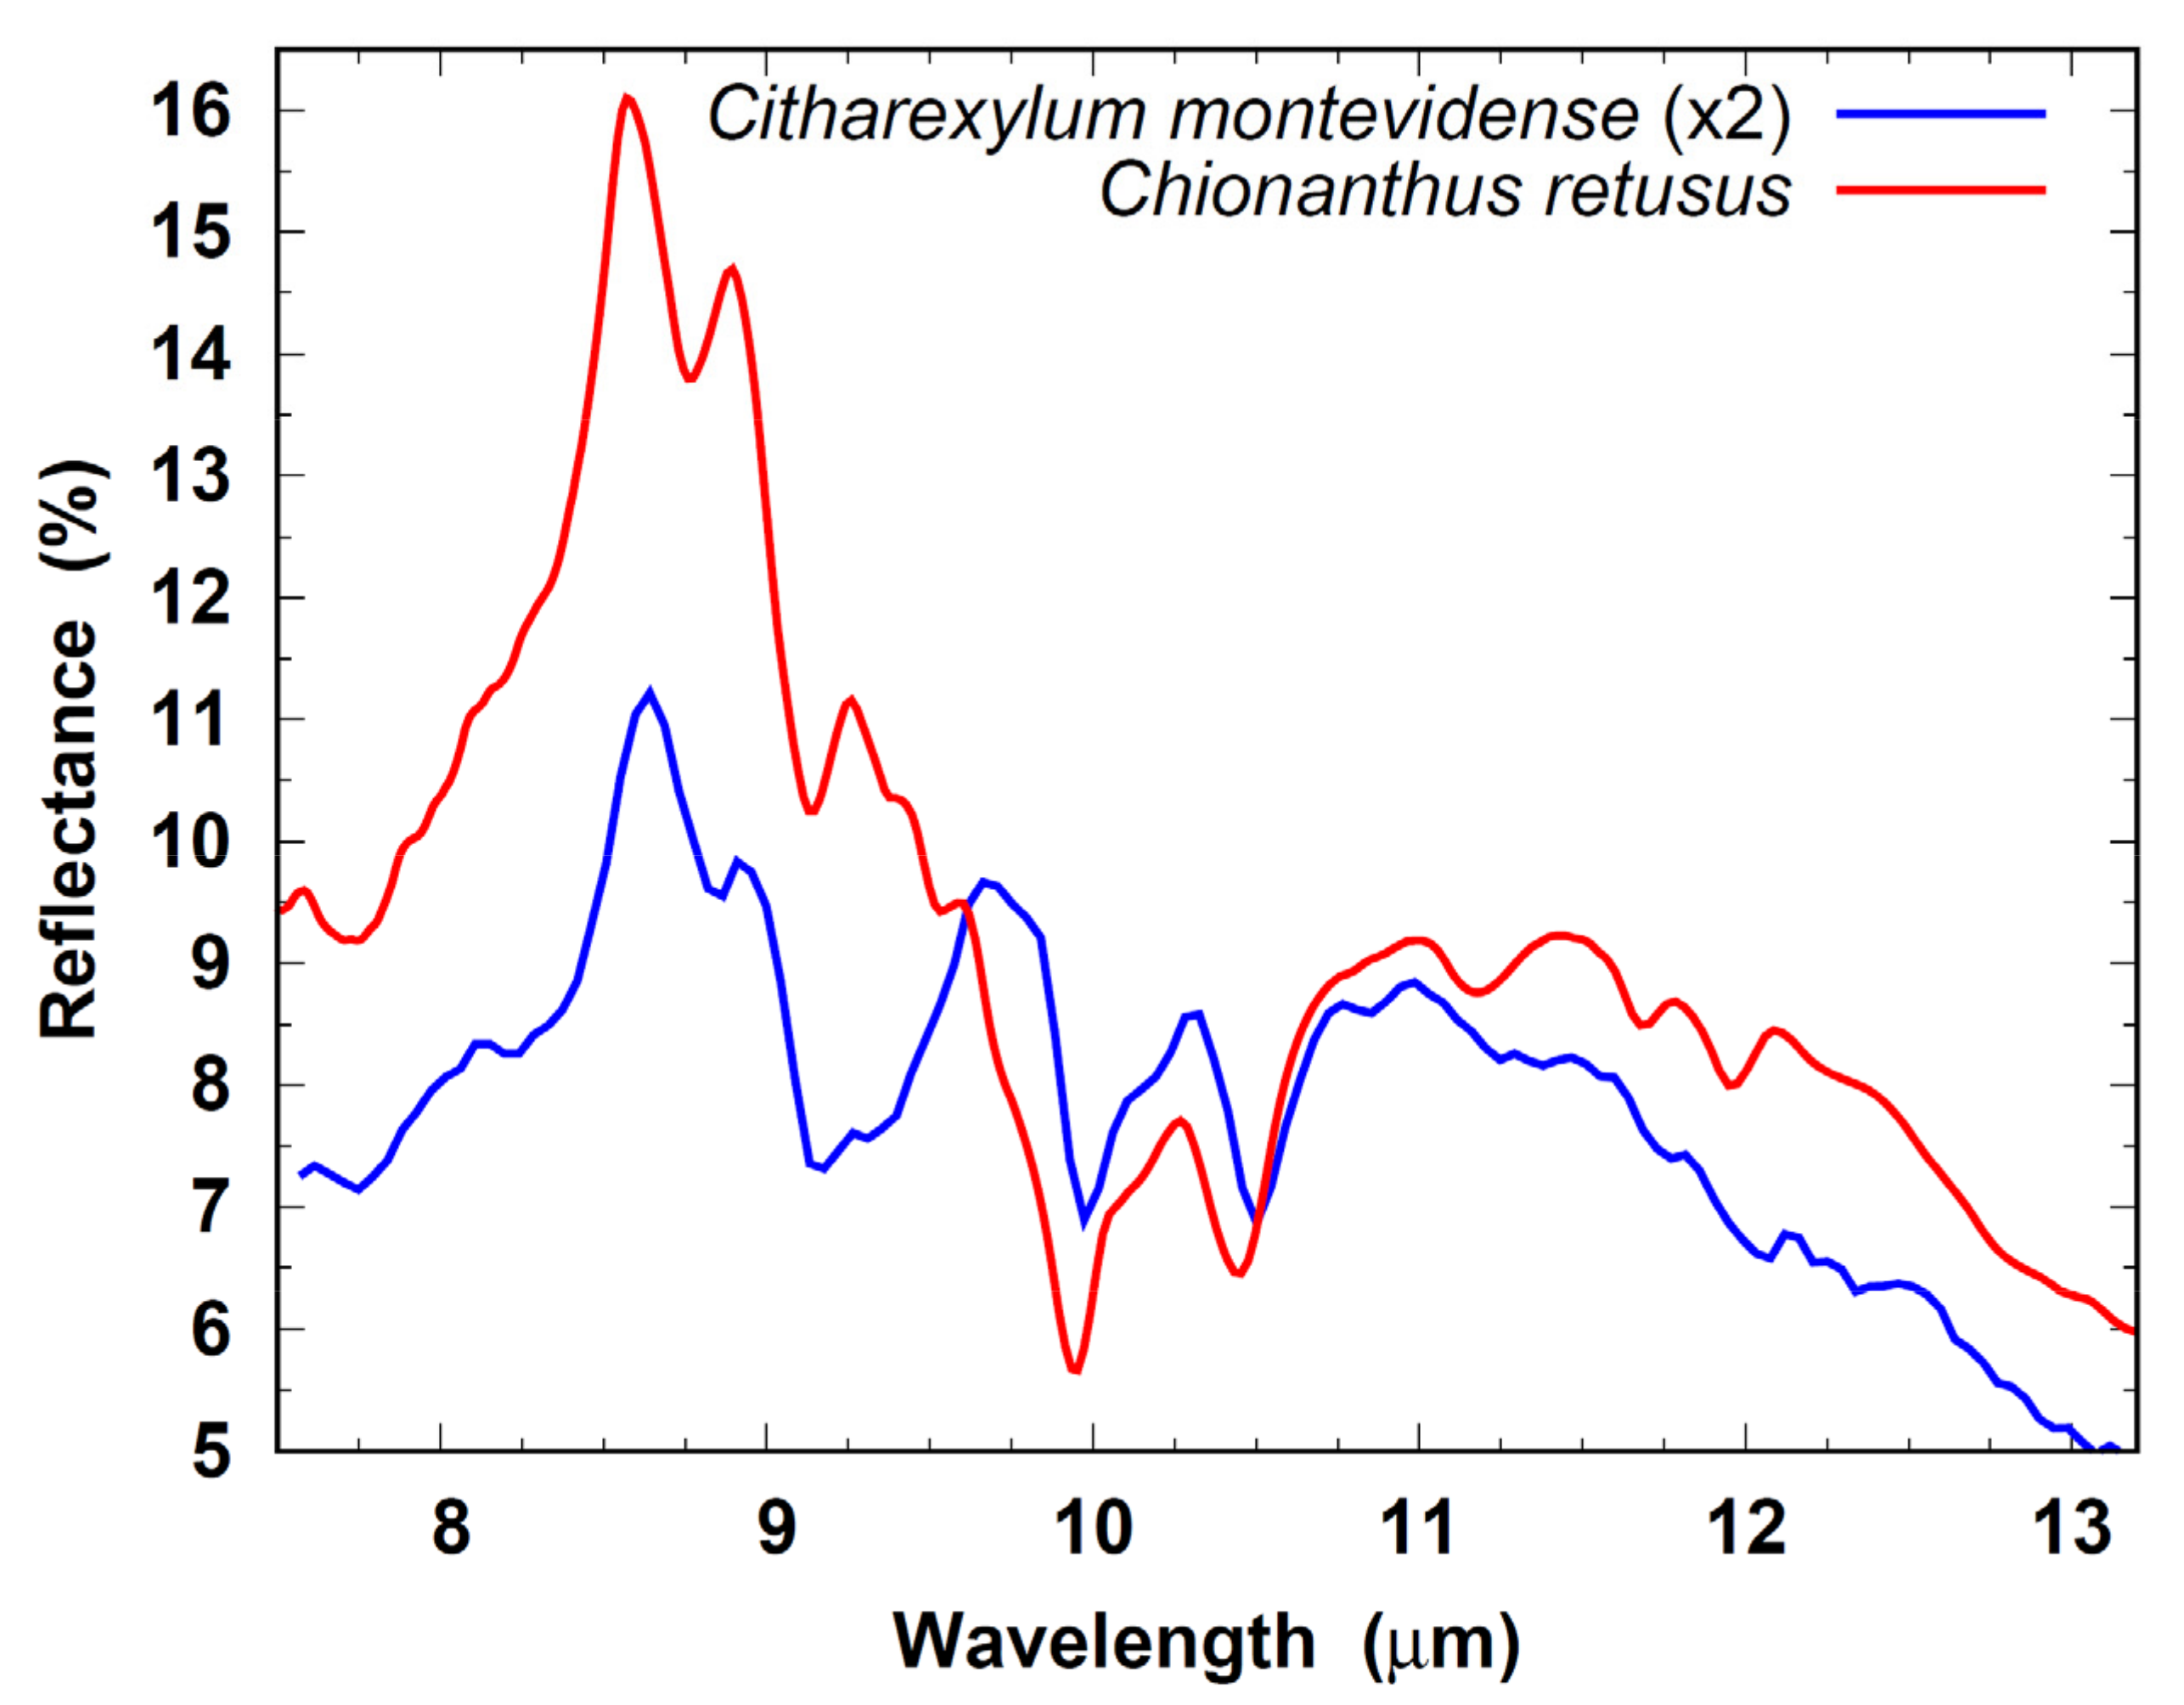
The Ch. retusus and C. montevidense library spectra are compared in Figure 15, in which the reflectance of the latter has been scaled by a factor of 2 for ease of comparison. From this figure, it is evident that there are many qualitative similarities. The significant divergence between the two in the 7.5–9.5 µm region suggests that this portion of the spectrum may govern the determination of the inferred ID.
Specimens of Ch. pygmaeus also responded strongly to the C. montevidense filter (Figure 16), though not to the Ch. retusus. Ch. virginicus did not yield an ID with either filter.

3.4. Chorisia spp.

Although the Chorisia genus has been subsumed into the Ceiba genus in recent years [40,41], all such specimens encountered bore the former designation with a single exception. We have elected to retain the original for the current purposes. The genus is represented in the spectral library by C. speciosa and the aggregate species C. insignis.
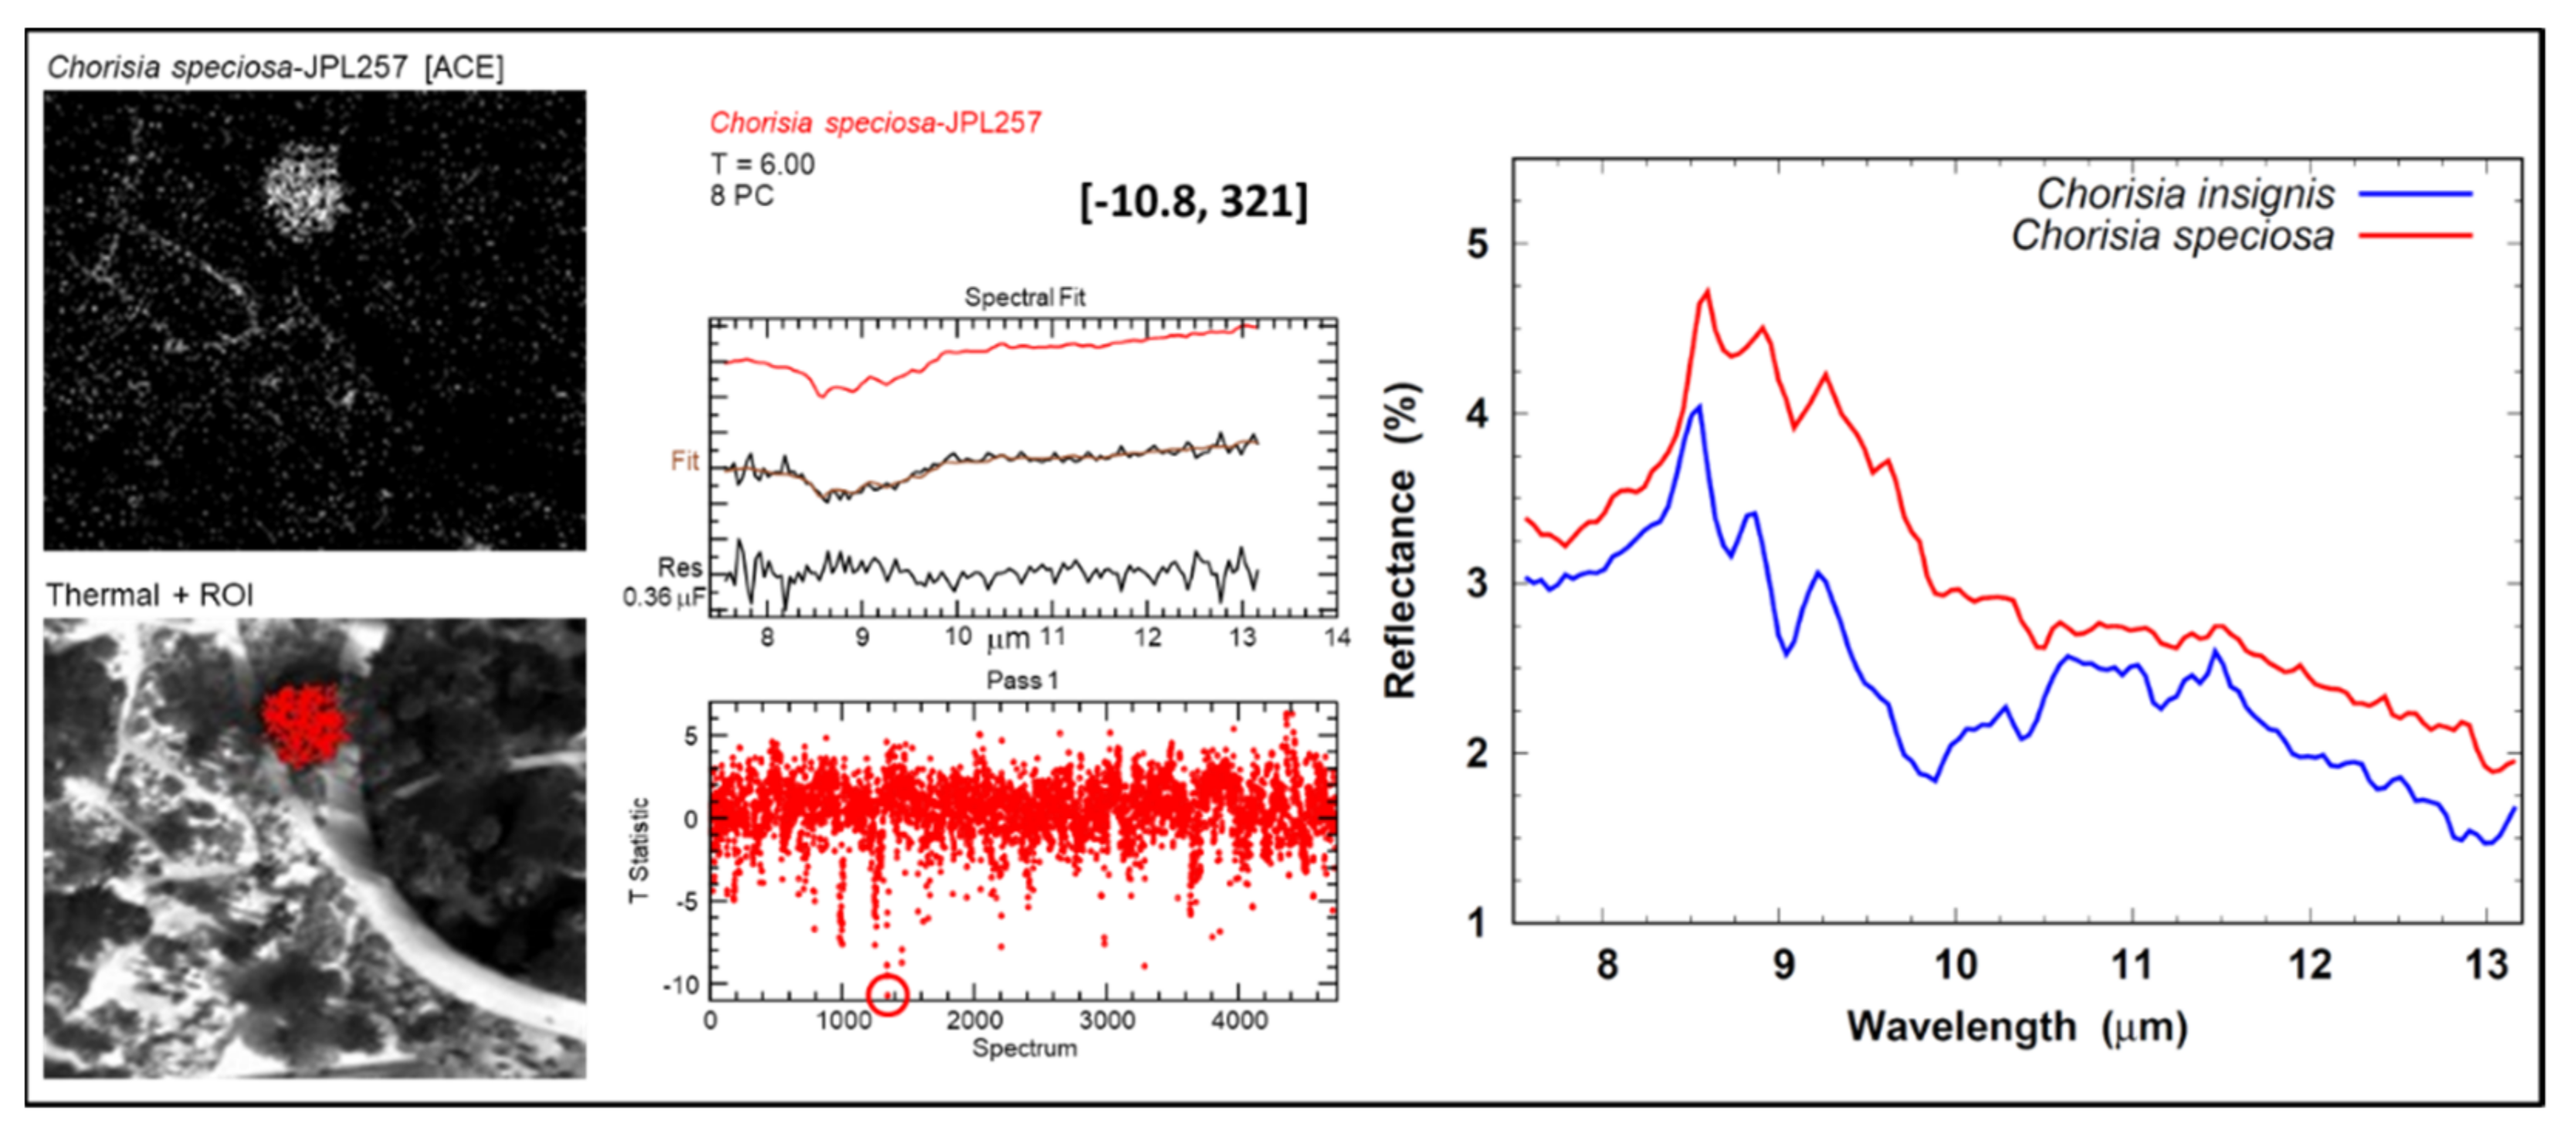
A number of C. speciosa and C. insignis x C. speciosa hybrids were accurately ID’d in the course of this study. However, occurrences of C. insignis were much less responsive and tended to mis-ID instead as C. speciosa. An especially egregious case in point is depicted in Figure 17. This particular C. insignis specimen mis-ID’d strongly as C. speciosa despite providing one of the C. insignis reference spectra in the library. Although a number of unrelated species generated subsidiary false IDs for this tree, the available C. insignis spectra were not selected. Figure 17 includes a comparison of the ID spectrum against that sourced from the tree in question, showing the broad morphological similarity between the two. Had this been a valid ID it would have been a candidate for inclusion in the set featured in Figure 4, Figure 5 and Figure 6, since it is robust across all of the collection scenarios represented in those figures.

3.5. Platanus spp.

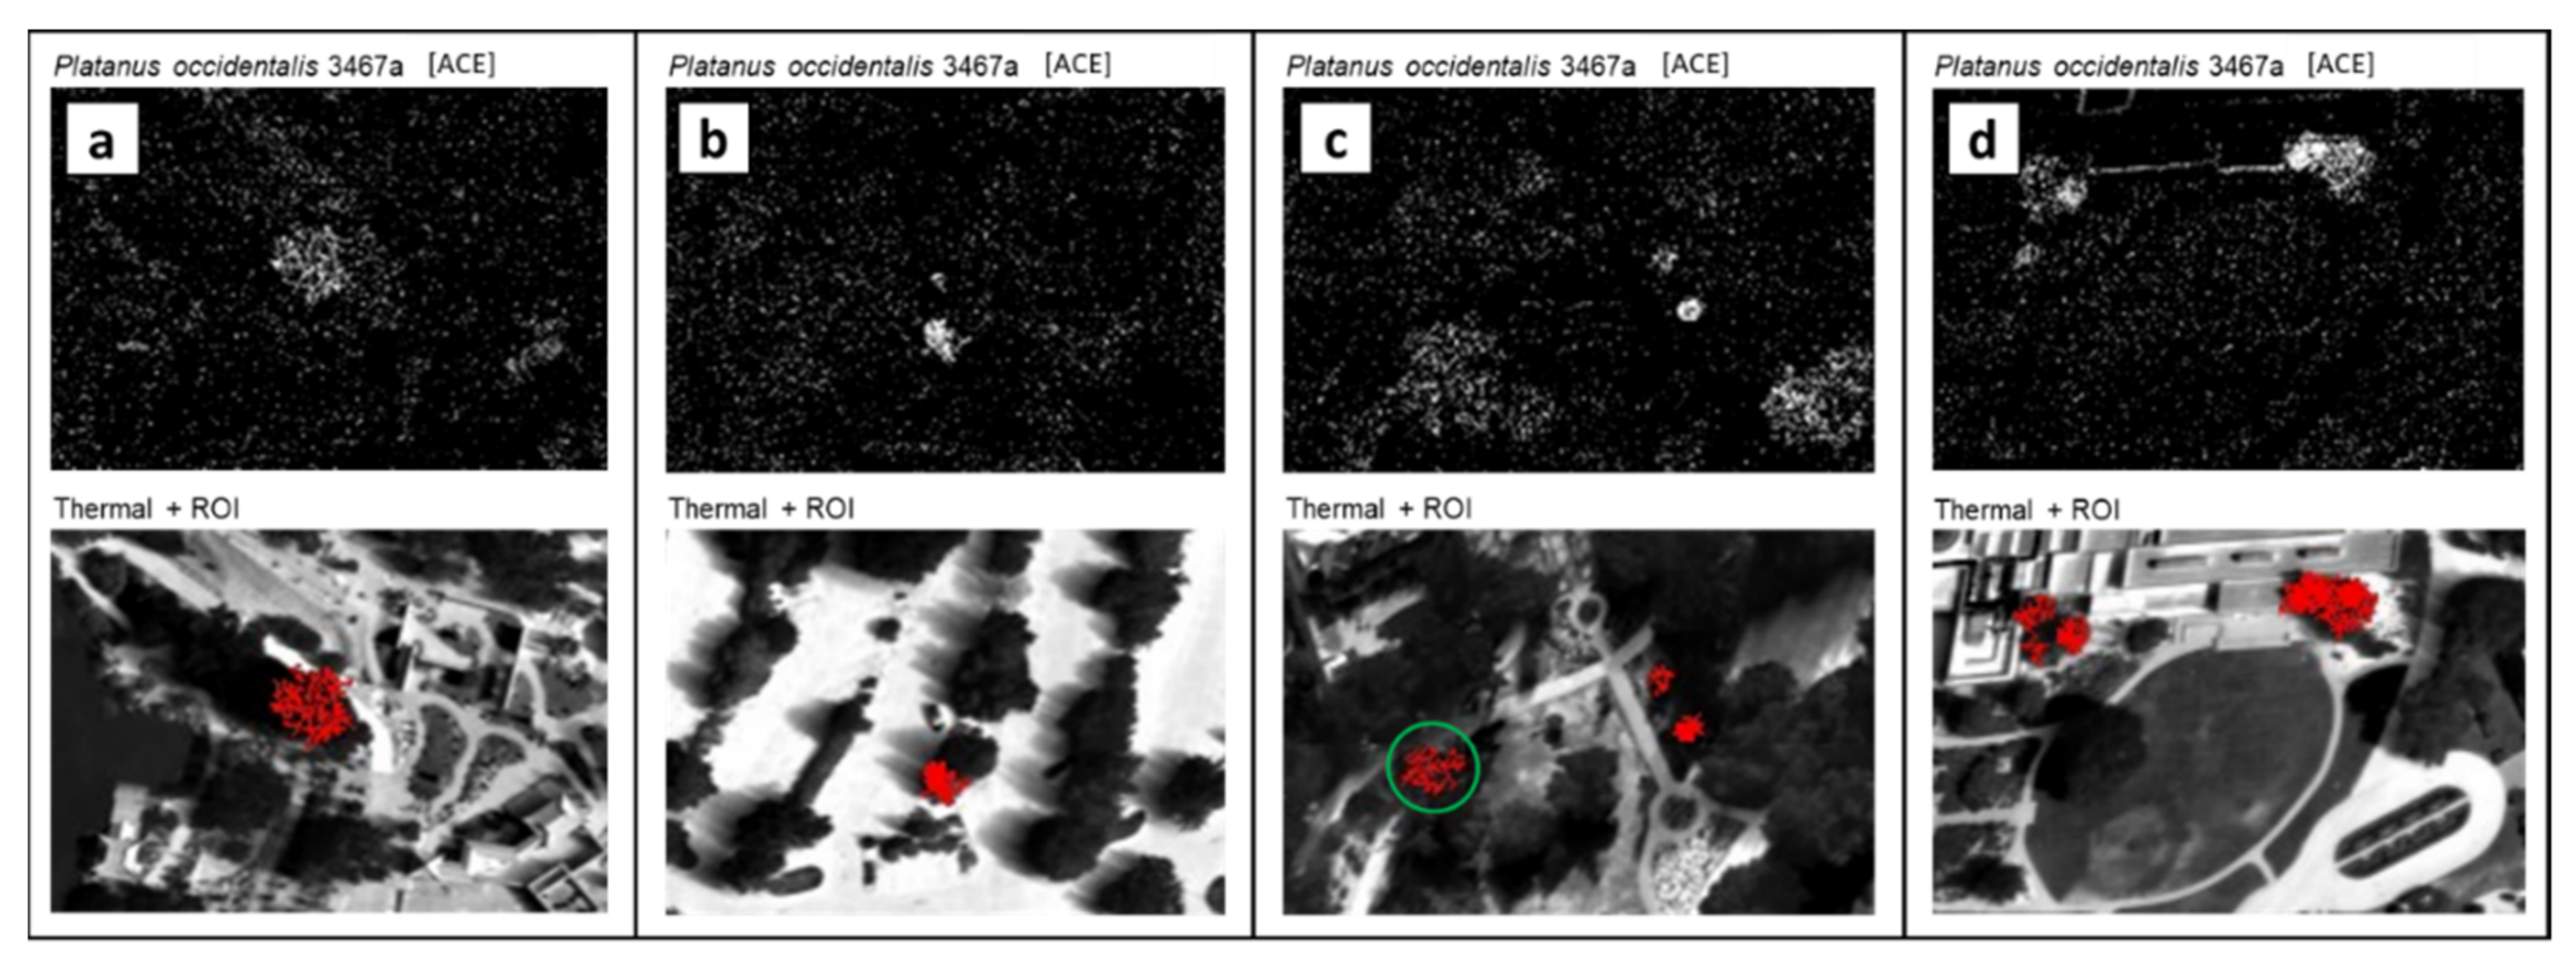
The Platanus occidentalis spectrum in the library yielded genus-level IDs for several Platanus species with t-stats between −7.5 and −10.5. These included P. orientalis, P. racemosa, and P. wrightii specimens at the Huntington Gardens. However, there is debate whether P. wrightii is actually a varietal of P. racemosa [42], endemic to California. Other IDs were P. occidentalis, P. mexicana, and P. x acerifolia at Lacy Park, and P. racemosa at Descanso Gardens. P. x acerifolia is counted as a positive ID at the species level because it has long been recognized as a natural hybrid of P. occidentalis and P. orientalis [43]. Examples of these IDs are given in Figure 18.
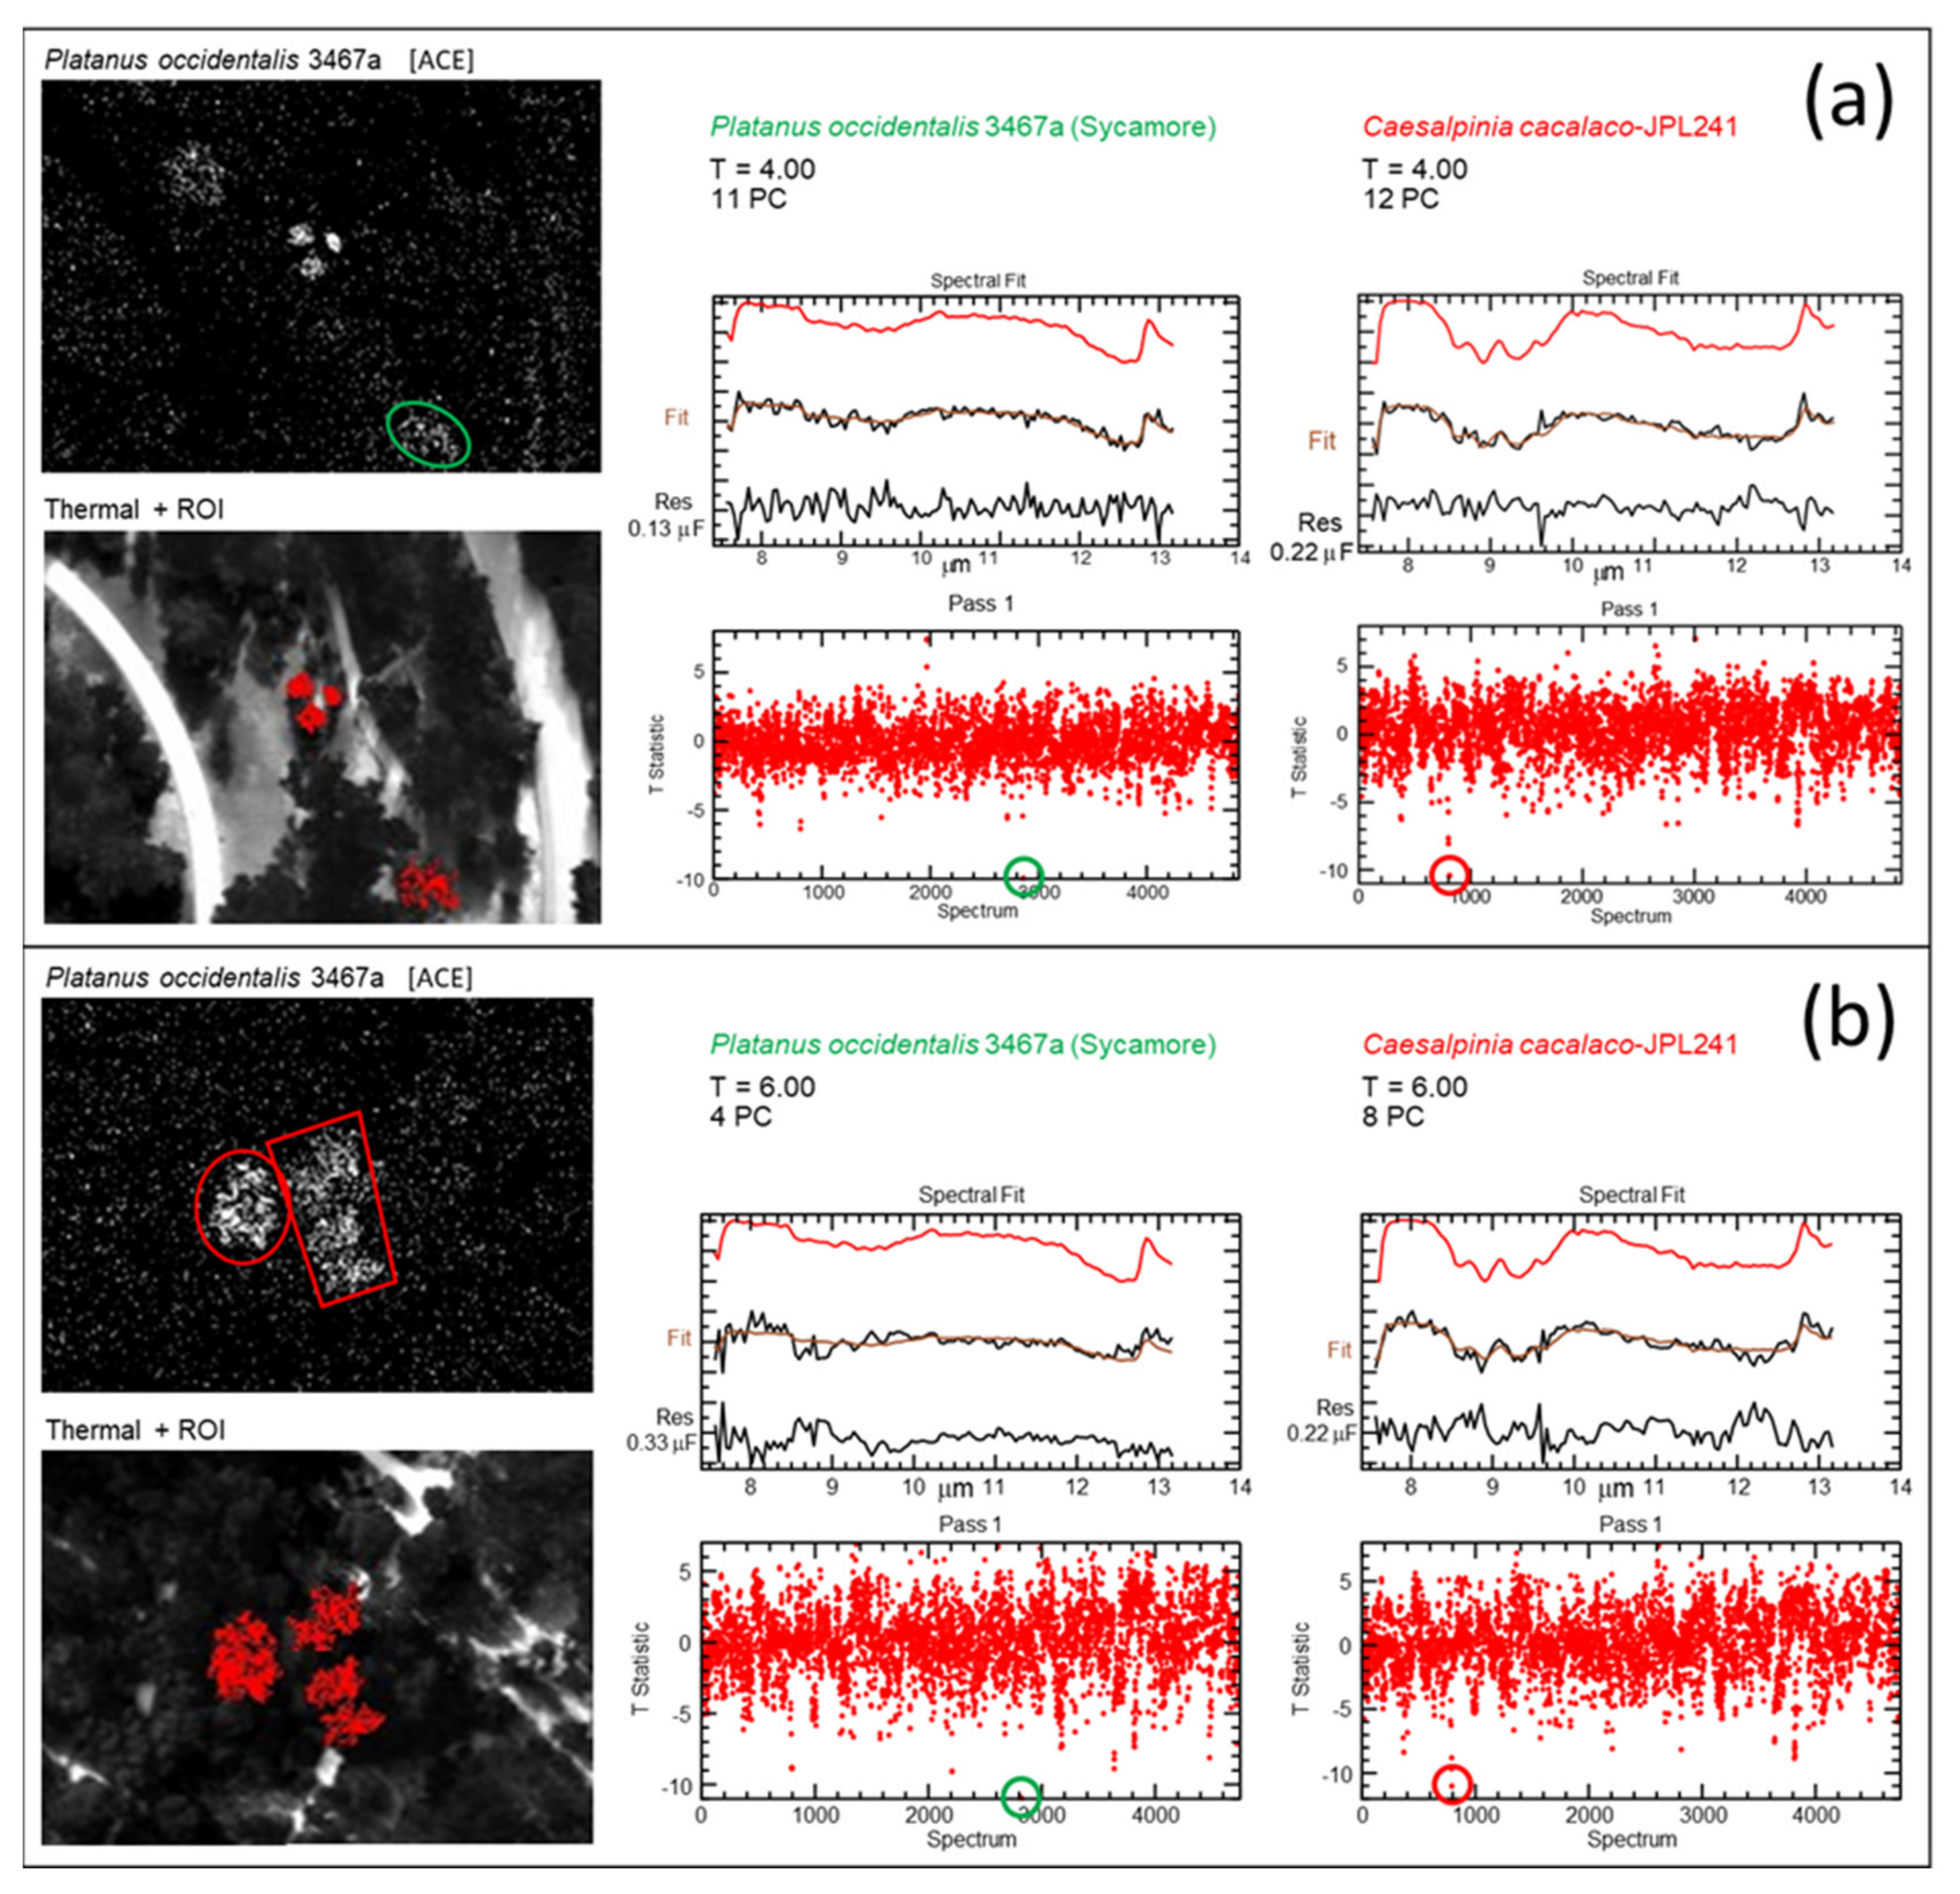
Figure 19 shows two incidences where this trend was broken. In addition to the positive ID of a P. occidentalis indicated at the lower margin of the image frame in Figure 19a, the trio of detections at the frame center also appear in the P. occidentalis filter. These ground truth as young P. racemosa yet ID as Caesalpinia cacalaco. The imagery depicted in Figure 19b is of a grove of P. x acerifolia ‘Dale Griggs’ at the Descanso Gardens facility. The three specimens delimited by the red quadrilateral each returned IDs of both P. occidentalis and C. cacalaco. The two lower individuals produced a composite ID with numerically identical t-stats for both filters while the uppermost tree yielded a C. cacalaco t-stat that only slightly favored that species. The ID contained within the red ellipse is a composite formed by a cluster of three P. x acerifolia that yielded only a C. cacalaco ID.
The spectral similarity between C. cacalaco and P. occidentalis evident in Figure 19 explains this result, given the common occurrence of the prominent spectral feature at 12.83 µm and the plateau at 7.7–8.3 µm. In contrast to the examples in Figure 19a, all other P. racemosa specimens ID’d in the course of this study were at a mature stage of development, reflecting the fact that age plays a governing role in foliar spectral trait determination.

3.6. Bambusoideae

The Bambusoideae subfamily of Poaceae grasses includes the Bambusa and Phyllostachys bamboo genera represented in the spectral library. An early finding of this work was the high detectability of bamboo in the LWIR imagery. The point has been made in prior studies that the silica content in plants promotes strong signatures in the LWIR [18,21], and bamboos are renowned for their particularly high silica content both in finely divided form and as consolidated masses known as phytoliths [44,45].
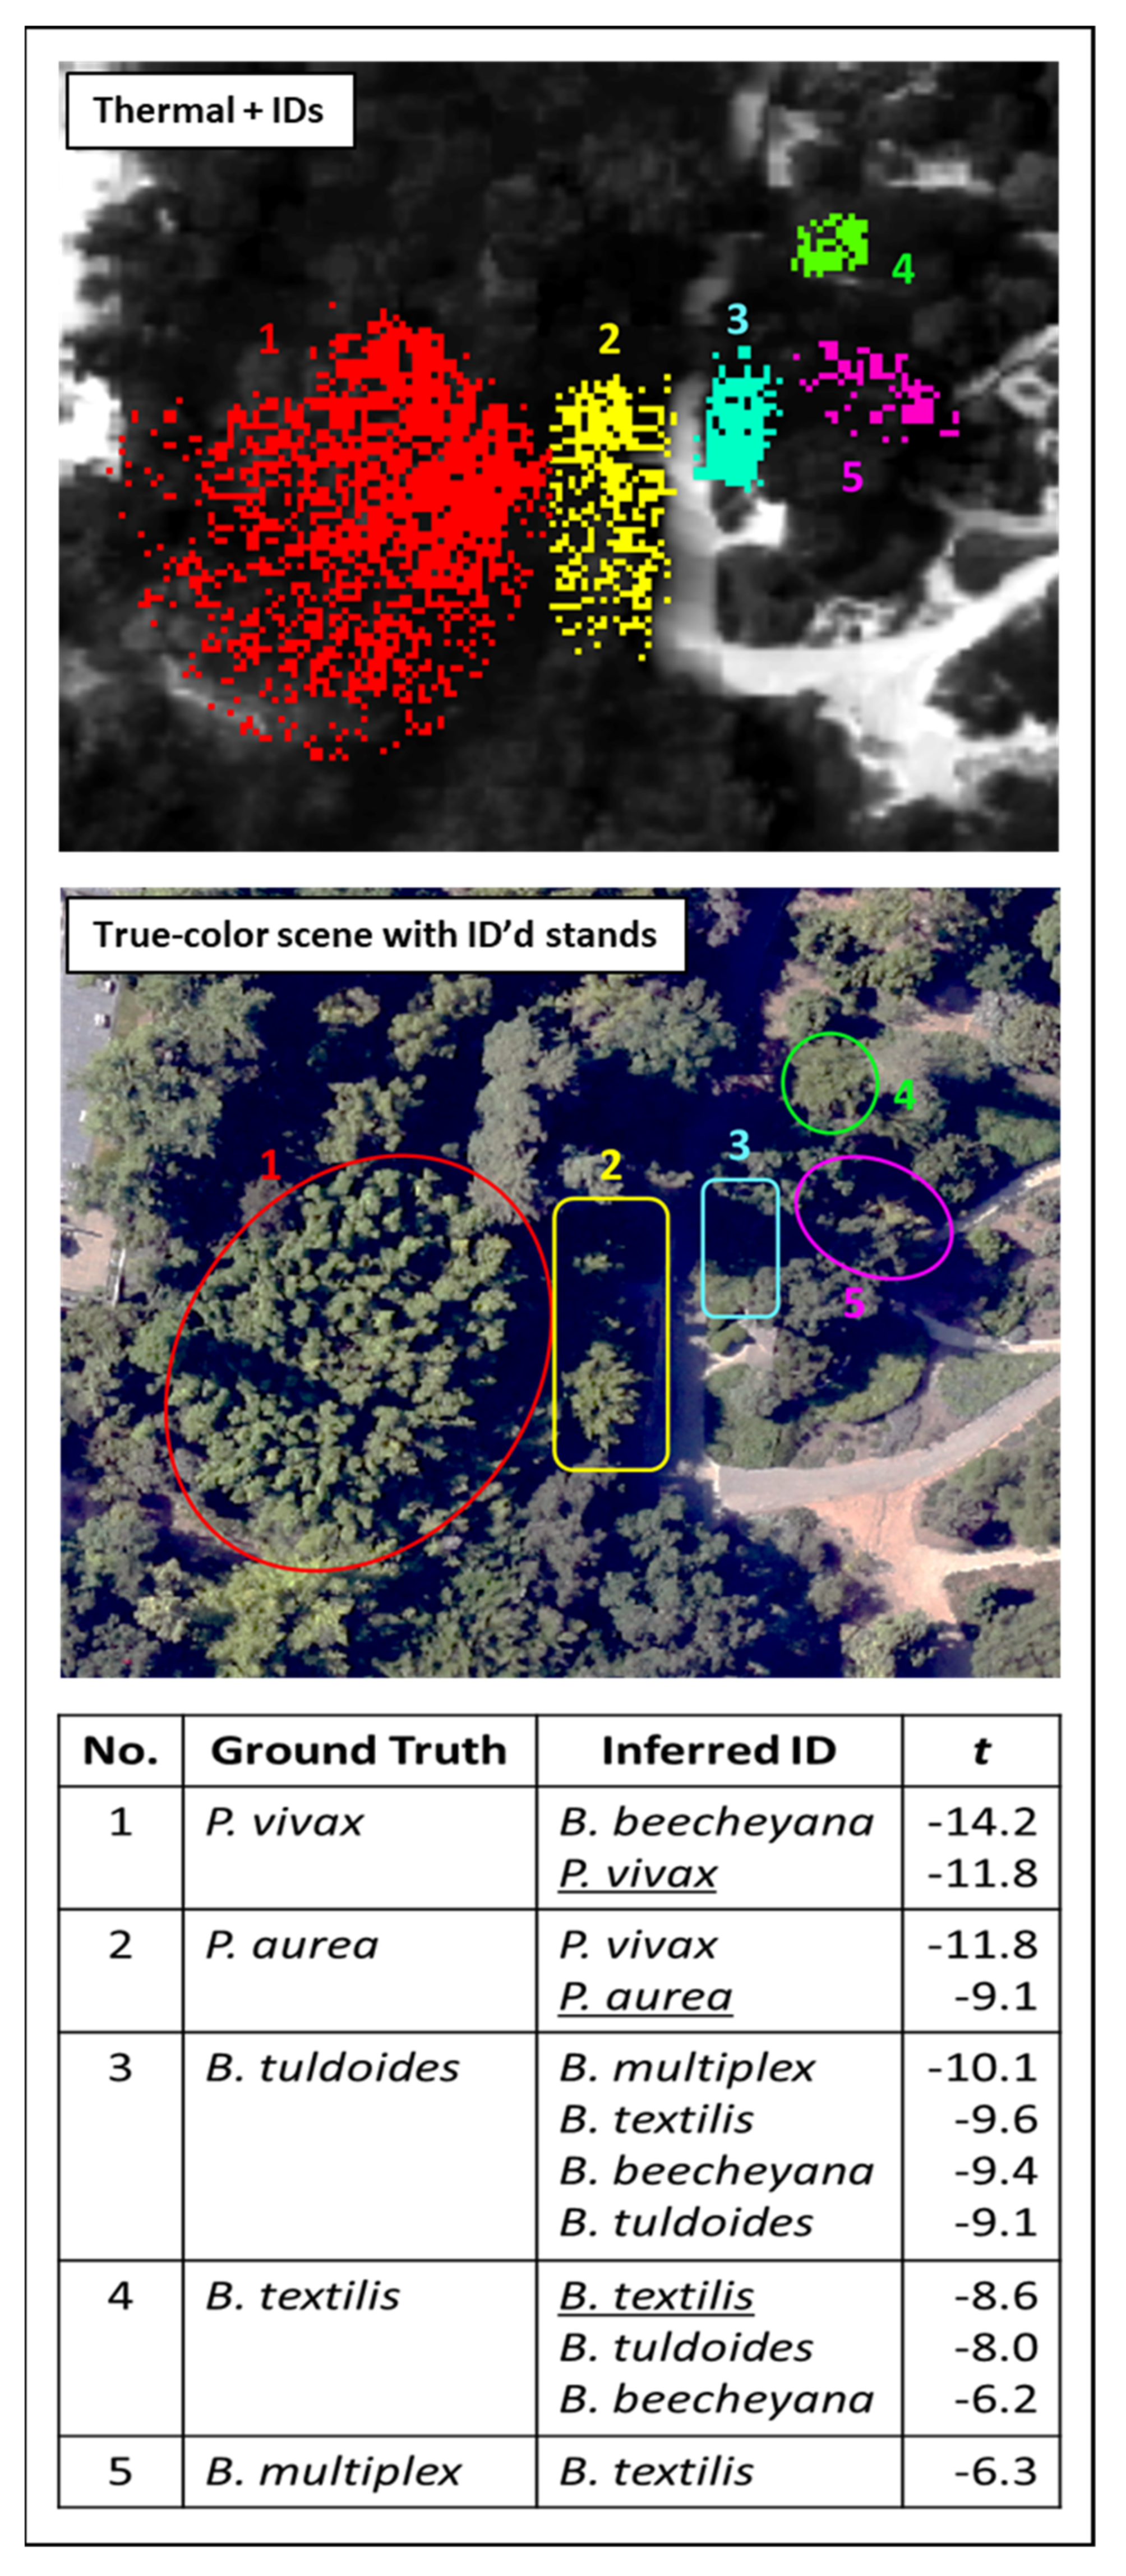
Figure 6 depicts multiple observations of a single Bambusa beecheyana stand and is one of many bamboos ID’d in this work by the B. beecheyana and B. tuldoides ECOSTRESS library spectra. In addition to verified instances of those two taxa, these spectra also delivered IDs from other Bambusa species (B. multiplex, B. oldhamii, B. textilis, B. ventricosa, B. vulgaris), as well as numerous bamboo stands of indeterminate identity (designated “ID uncertain” in Figure 3) in the curated collections studied. Measurements of B. multiplex, B. oldhamii, and B. textilis foliar samples were made in the course of this study in an attempt to disentangle some of the interspecific Bambusa IDs, which met with only sporadic success. Frequently a given bamboo occurrence would return IDs for multiple Bambusa species, attesting to the spectral affinity between members of the genus, as exemplified by the montage of detections shown in Figure 20.
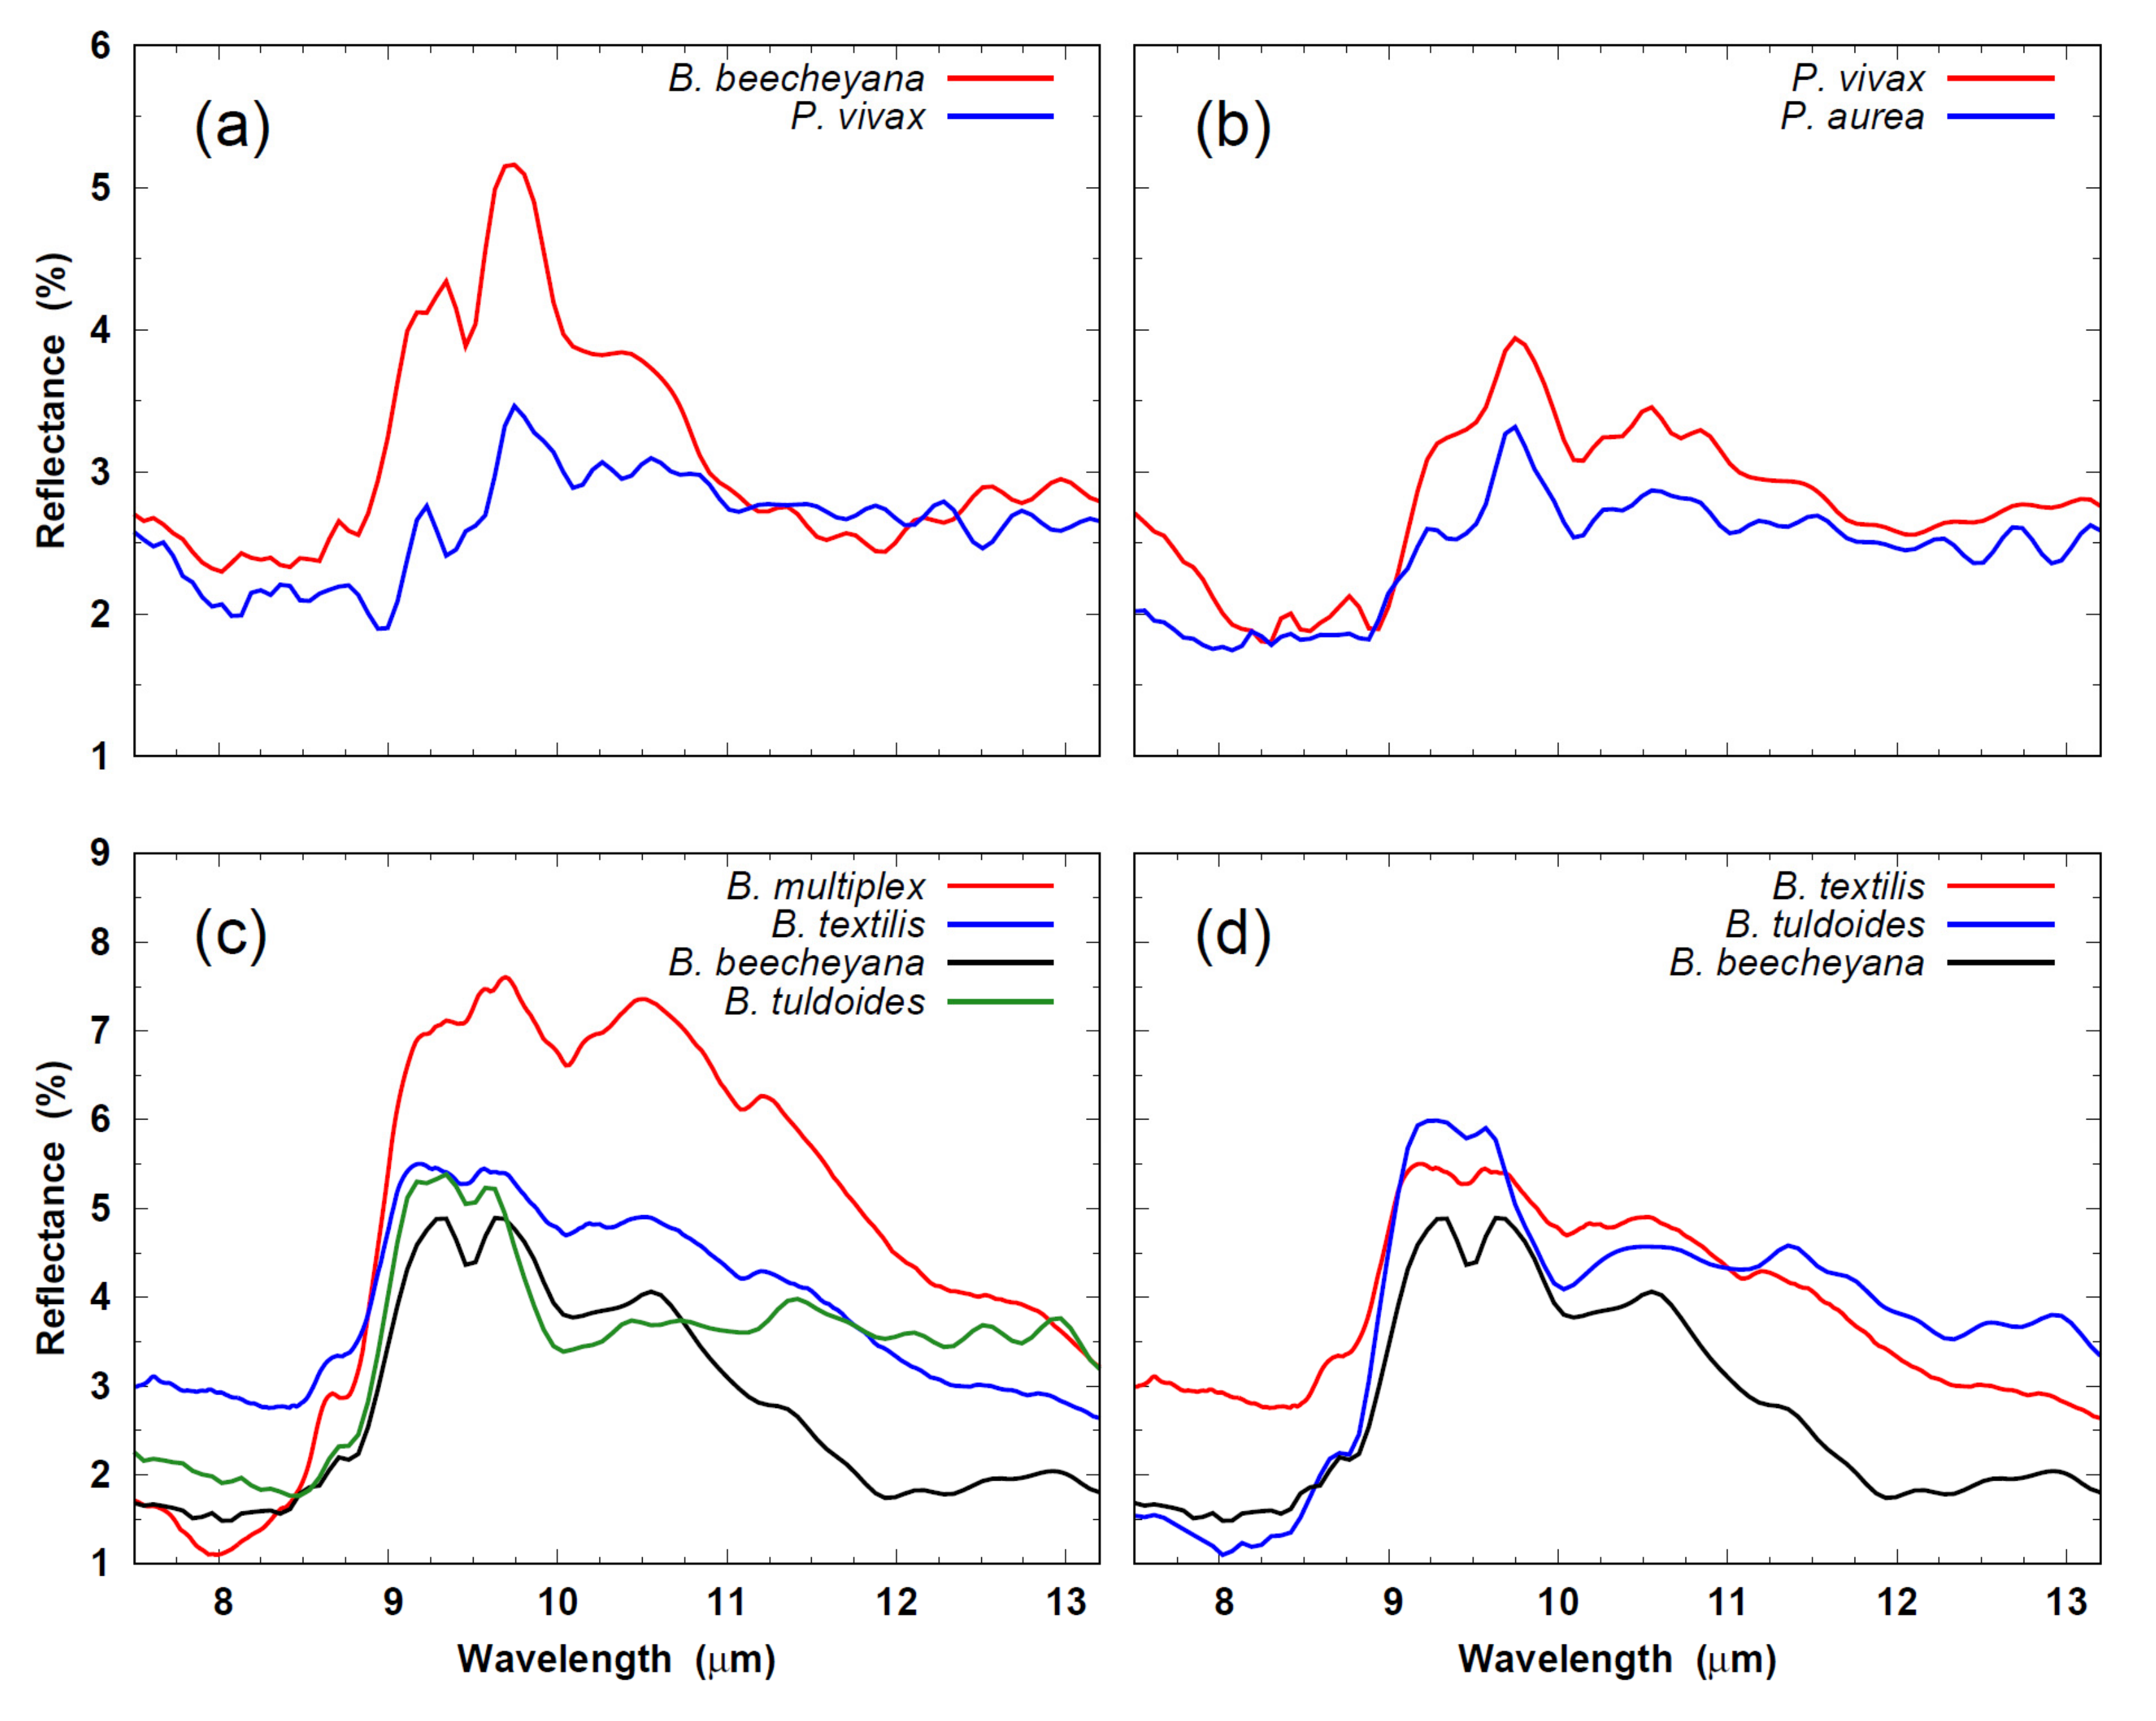
The information tabulated at the bottom of Figure 20 shows the high degree of spectral correlation between members of the same genus, as indicated by the multiple IDs generated by each stand, and which are listed in order of decreasing t-stat. However, even though in most cases reference spectra were measured for the stand in question (underlined IDs), in only one instance is such a spectrum preferred over competing IDs. Figure 21 shows intercomparisons between the ID spectra pertaining to bamboo stands 1–4 from Figure 20, from which the spectral resemblance between different species of the same genus is apparent. Conversely, Figure 20a shows an instance of genus crossover. In this case, the B. beecheyana spectrum shown has a sufficient degree of affinity with that of the ID’d P. vivax stand that it delivers a stronger t-stat than that spectrum (Figure 20).
Although discriminating between different bamboo species often proved challenging, the common morphological features in Figure 21 enabled the determination of bamboo presence with striking accuracy, potentially applying to the mapping of bamboo forests for ecological assessments [46] and economic resource inventories [47].
Occasionally it was found that occurrences of the more conventionally grass-like members of the Poaceae family, such as Muhlenbergia and Miscanthus, would mis-ID as Bambusa sp. By corollary, Bambusa stands would sometimes return a subordinate ID of other grasses represented in the spectral library (i.e., Avena fatua, Bromus diandrus), since these Poaceae genera are also rich in silica [48] and present similar spectral behavior to bamboo.

3.7. Quercus spp.

The Quercus genus is represented in the spectral library by more different species (14) than any other, many of which are in the holdings of the facilities studied in the current work. However, despite the profusion of these species encountered (>1000 at Descanso Gardens alone, and hundreds more at the Huntington Gardens), only 18 were ID’d across all facilities imaged. Of these seven, were mis-ID’d as non-Quercus, a further five ID’d correctly to the genus level, and three ID’d correctly to the species level (a Q. lobata and two Q. robur). An additional six Quercus specimens were ID’d whose species are unrepresented in the spectral library. Three ID’d correctly to the genus level, with the remainder mis-ID’ing as unrelated taxa.

3.8. Magnolia grandiflora

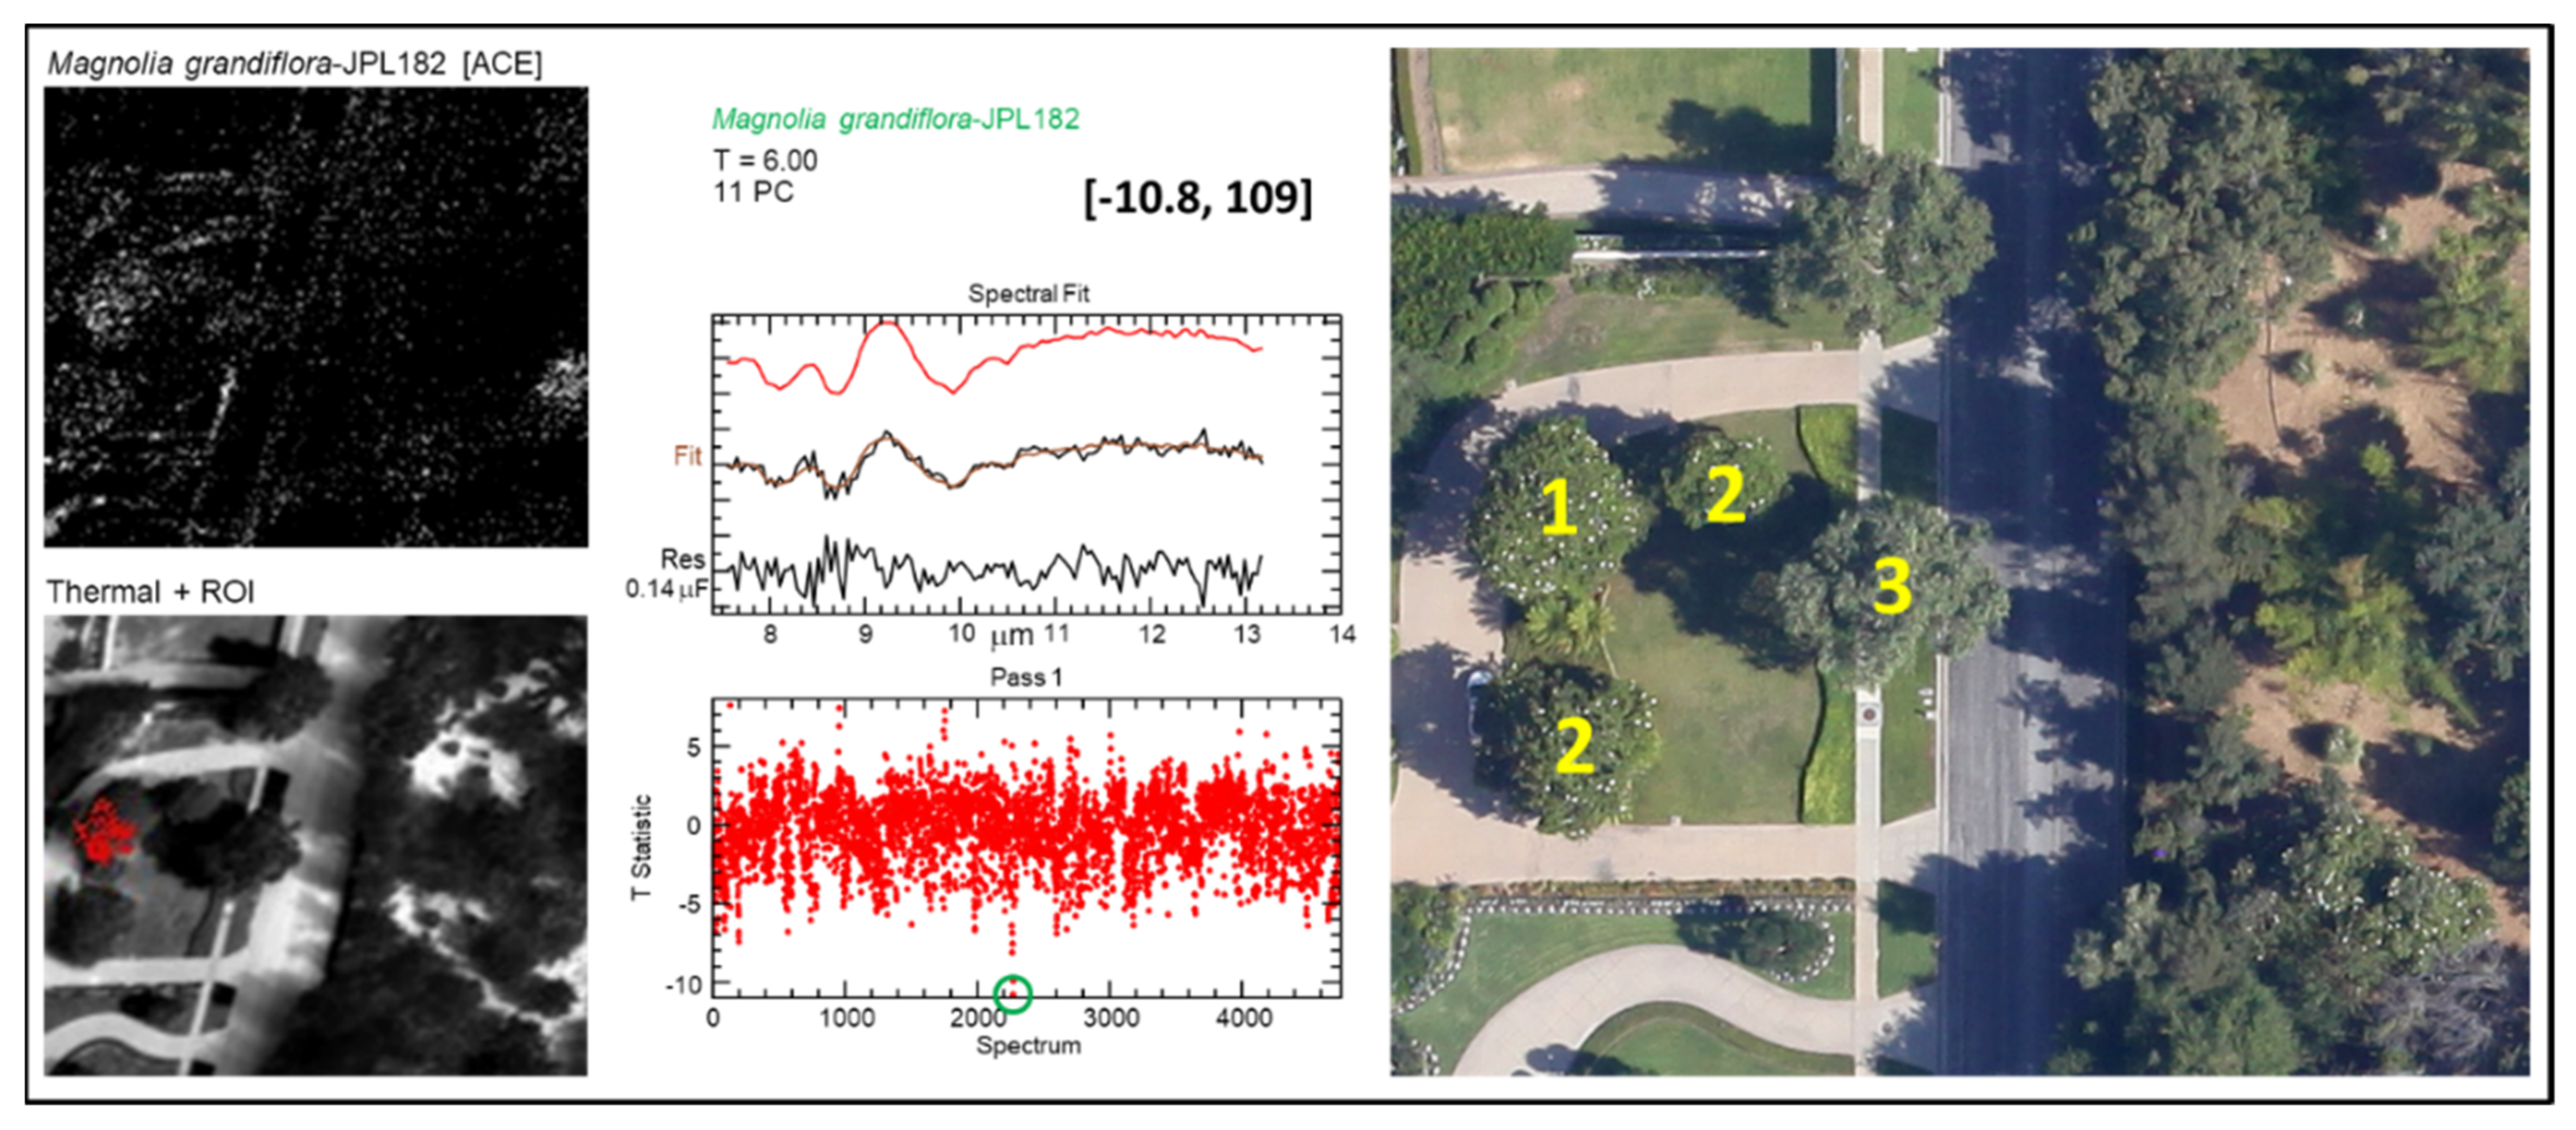
Magnolia grandiflora is commonly found as an ornamental tree in Southern California neighborhoods and many specimens are also in the holdings of area botanical collections, including those participating in this study. Six specimens at the South Coast Botanic Garden and an additional pair at the Los Angeles Co. Arboretum were the only curated examples correctly ID’d in this study, although an additional four were positively ID’d in the residential neighborhoods surrounding Huntington Gardens. Although few, most of the M. grandiflora that were detected ID’d correctly.
Ribeiro da Luz and Crowley [21] reported similar difficulties detecting this species that they ascribed to spectral contrast degradation through intracanopy scattering and re-radiation caused by the specific co-disposition of M. grandiflora leaves. The variation in viewing geometry implemented in this work (Section 2.3) attempted to test this hypothesis inter alia, but the narrow range of viewing angles attaching to the successful M. grandiflora IDs affords insufficient statistics to resolve this question.
Figure 22 encapsulates the problem, and at θi = 17° is the most off-nadir of the positive M. grandiflora IDs obtained in this study. In the contemporaneous true-color aerial view at right, the positively ID’d tree (1) is seen flanked by two additional M. grandiflora (2) that are subject to identical environmental and growing conditions but go undetected. All three of these M. grandiflora appear to be in the same state of health and bloom, so that it is unclear why their responses should differ so markedly. An additional point of interest in this image is a Quercus lobata (3), one of the only three accurately ID’d Quercus specimens stemming from this study (Section 3.7).

3.9. Brachychiton discolor

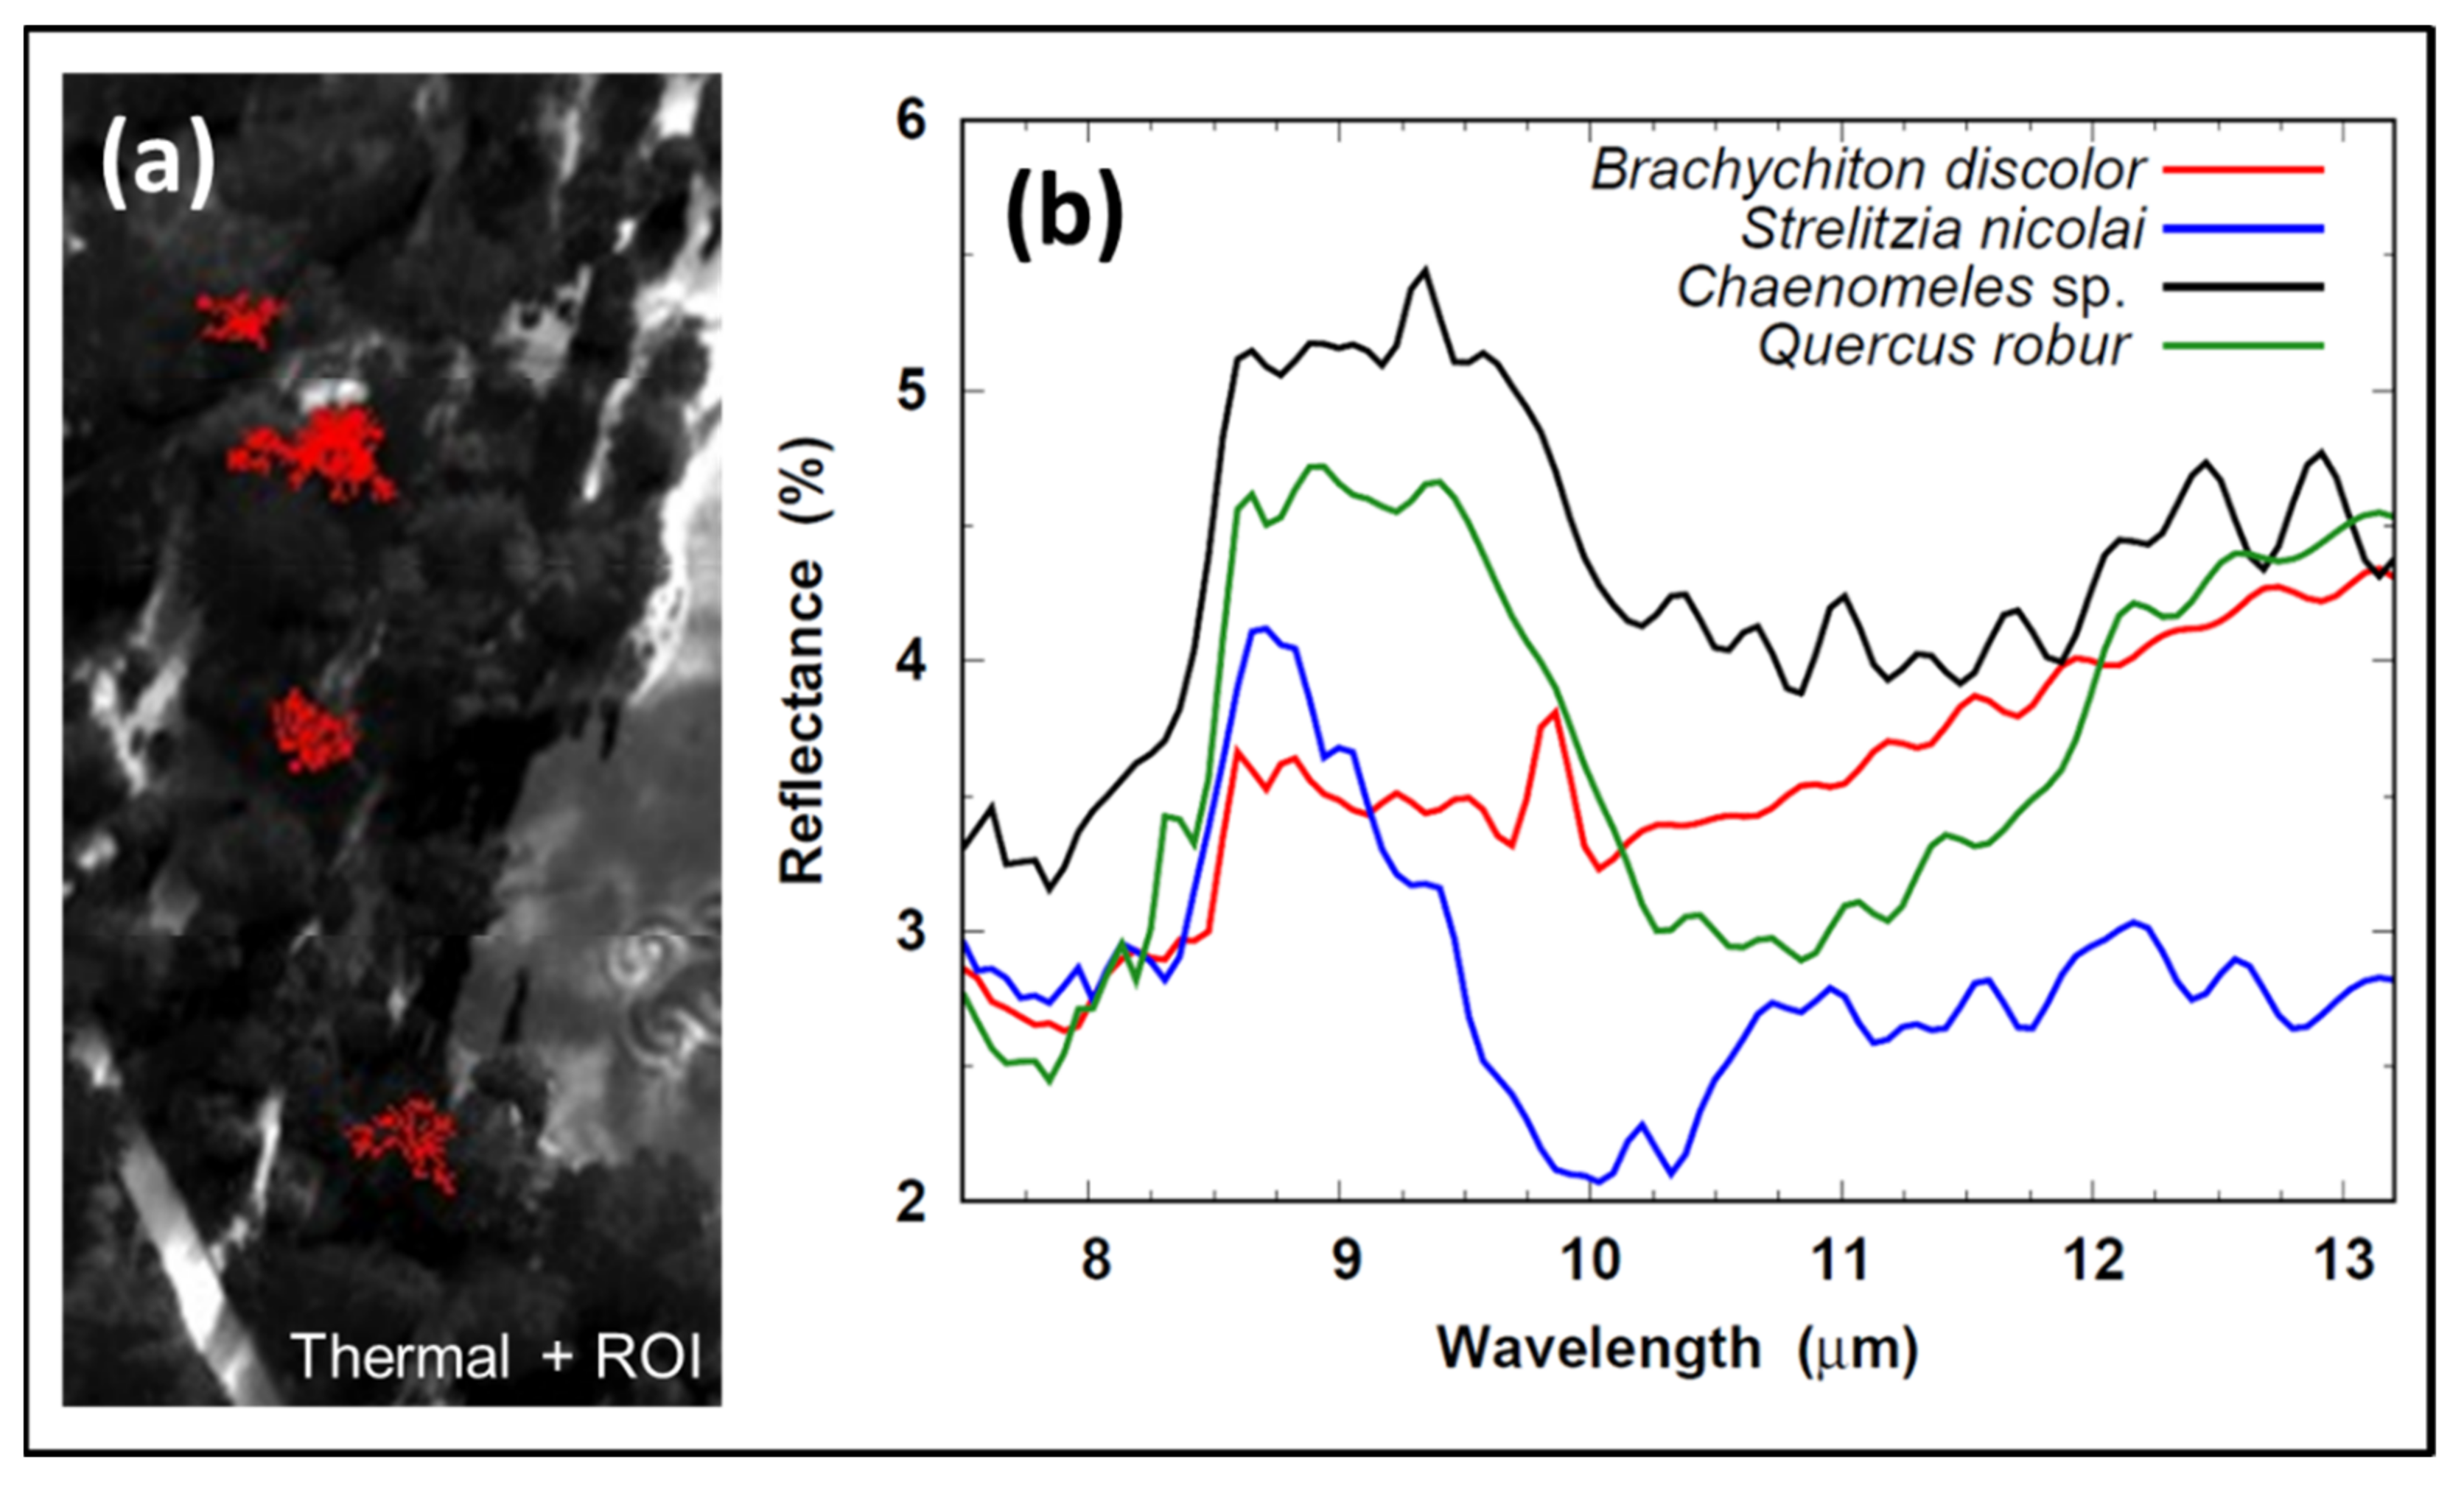
Brachychiton discolor presents an object lesson in the limitations imposed by interspecies spectral similarity. Figure 23a shows four B. discolor ROIs returned by an assemblage of such specimens at the Huntington Gardens. However, this apparent success is deceptive. In all but one of these instances, B. discolor only registers as the third choice based on t-stat strength, behind Strelitzia nicolai and Chaenomeles sp. in each case (also in each case Quercus robur appears as the fourth choice). Only the topmost ID yields B. discolor as the highest-rated ID, but it is the outlier in this series. The consistency in the response of the other three IDs is a testament to the performance of the retrieval algorithm. However, it underscores the difficulty of retrieving an accurate ID when completely unrelated taxa present a high degree of spectral similarity, as illustrated in Figure 23b. The problem is compounded by the difference between the highest and lowest rated t-stats of the competing IDs being ≤1. For each of the mis-ID’d examples, the spectrum with the strongest t-stat was S. nicolai, which appears to diverge the most from that of B. discolor.

4. Discussion

Ribeiro da Luz and Crowley [21] reported moderate success in ID’ing arboreal species using 1-m GSD LWIR spectral imagery and a standard spectral matched filtering approach. They also identified several factors that favored successful species ID, such as distinctive spectral shape, high spectral contrast, and broad-leaf planophile canopy structure. These findings were generally confirmed in the present work. For instance, members of the Platanus genus exhibit all three of these properties and were typically well detected and ID’d (Section 3.5). It was also found that a single strong factor could compensate for a countervailing property. For instance, the prominent silica-induced spectral signature of Bambusa bamboos was found to dominate over the distinctly erectophile form of the species and enable high detectivity (Figure 6 and Section 3.6).
The central objective of this work was to assess whether the detection and ID metrics that have proven successful in remotely diagnosing gaseous [24] and solid [37] chemical composition could be successfully applied to remote botanical species identification. A principal goal was to formulate a process for validating positive IDs and evaluate the extent to which confusion between species exhibiting spectral similarity could be alleviated. To this end, a series of airborne data acquisitions was carried out over several curated botanical collections that together presented taxonomic, geographical, and temporal diversity.
Intuitively, it might be expected that a strong t-stat (spectral fit quality metric) developed from a large number of pixels would yield a robust positive ID, but this is not necessarily the case (e.g., Figure 17). Conversely, it was observed that a positive ID could be returned by a weak t-stat derived from a small number of pixels (e.g., Figure 8), even though such an ID could often only be corroborated with certainty by physically visiting the indicated location to establish the ground truth.
A spectral commonality between species of a given genus frequently enabled correct ID assignment to at least the genus level, as was noted in the prior study [21]. This was found to be particularly the case with members of the genera Salvia (Figure 11), Bambusa (Figure 20), and Platanus (Figure 18).
It might be expected that evergreen species would exhibit the most robust ID behavior concerning the seasonal cycle. However, it is notable that such species tended overall to be the most consistently observed and reliably ID’d, e.g., Salvia leucophylla (Figure 4), Persea americana (Figure 12), Citharexylum montevidense (Figure 5), Bambusa spp. (Figure 6 and Figure 20), Cassia leptophylla. Conversely, the repeated failure to positively ID the common evergreen Magnolia grandiflora and the generally poor detectivity of Ficus thonningii present countervailing examples highlighting the fact that no single factor is a predictor of ID success.
Table 4 provides a listing of the most frequently ID’d taxa aggregated across all of the facilities imaged in this study, with a subjective threshold for inclusion set at four observations. Each species listed is accompanied by the series of ID spectra associated with that species, where again the sample size is ≥4. For each named species the ID spectra are listed in order of decreasing incidence (independent of relative t-stat priority), and the underscoring indicates spectra that occur with equal frequency. Some species (e.g., Liriodendron tulipifera, Quercus agrifolia) were consistently mis-ID’d despite reference spectra being in the library. Conversely, other species (e.g., Ficus sycomorus, Syagrus romanzoffiana) not currently represented in the consolidated library were nevertheless consistently ID’d by spectra with which they share an affinity.
The extent to which environmental and growing conditions affect ID performance is also an open question [49,50], but these influences are challenging to disentangle. However, some information on seasonal dependence can be gleaned from the significantly different phases of growth prevailing during the spring and summer acquisitions of the Huntington and Descanso Gardens. In all material respects, these data were collected and analyzed in the same manner during both seasons. A direct comparison between these data sets is shown in Figure 24.
Immediately noticeable from this figure is the sharp drop in the spring ID count relative to the summer data sets. Spectral differences between deciduous new growth in early spring and mature leaves in the summer are to be expected [14] and since the library spectra were predominantly acquired in the summer they would tend to favor a higher ID count for data acquired in that season, consistent with Figure 24. As particularly illustrative cases in point, we may consider the generally good detectivity of Chionanthus retusus and Platanus spp. described in Section 3.3 and Section 3.5, respectively. These findings pertain only to the summer acquisitions of the Huntington and Descanso Gardens. Both the detection and ID success rate of these two deciduous taxa fell dramatically for the spring acquisitions at those facilities, suggesting that future investigations should include systematic phenological analyses of foliar LWIR spectral traits and the consequent impact on ID accuracy throughout the growth cycle [35]. In this respect, the LWIR spectral region is subject to similar constraints as the VSWIR [51,52,53,54,55].

5. Conclusions

As explained in Section 2.3, prior work by other researchers has demonstrated the importance of high spatial resolution in defeating the spectral contrast degradation suffered in progressing from the leaf scale to the canopy scale, which acts to confound LWIR species ID. This phenomenon is graphically illustrated in Figure 3a and explains the conclusion reached in prior work [35] that LWIR discrimination of plant species appears to be practical for only a limited number of species. That study was conducted at 1.7–1.9–m GSD. Nevertheless, even though the present work tested the approach at 0.5-m GSD with equipment of exceptional radiometric sensitivity, the success achieved remains limited and leads us to concur with that view.
While the ECOSTRESS library [31] has greatly expanded the number of spectra available for work of this type, it is important to note that the number of species represented in the consolidated spectral library is still negligibly small in comparison to the ~400,000 plant species present in nature, so that many taxa amenable to remote identification by LWIR spectral imaging likely remain to be recognized.

Author Contributions

Conceptualization, D.M.T.; methodology, D.M.T. and K.N.B.; software, K.N.B.; validation, D.M.T.; formal analysis, K.N.B. and D.M.T.; investigation, D.M.T., K.N.B., E.R.K., J.L.H., and P.M.A.; data curation, K.N.B.; writing—original draft preparation, D.M.T.; writing—review and editing, all authors; visualization, P.D.J. and D.M.T. All authors have read and agreed to the published version of the manuscript.

Funding

This research received no external funding.

Acknowledgments

This research was supported by The Aerospace Corporation’s Independent Research & Development program. USGS vegetation spectra were kindly made available by Beatriz Ribeiro da Luz. Ground truthing was greatly aided through invaluable consultations with Brian Dorsey (Chief Botanical Researcher, Huntington Botanical Gardens), Frank McDonough (Botanical Information Consultant, Los Angeles County Arboretum), Autumn Ayers (Plant Records Coordinator, Descanso Gardens), Sam Estrada (Urban Forester, City of San Marino), and Tanya Finney (Superintendent, South Coast Botanic Garden). Particular gratitude is extended to Brian Dorsey for facilitating special access to the Huntington Gardens botanical collection. Extensive additional ground-truthing assistance was provided by Renée Hoffman-Tratt.

Conflicts of Interest

The authors declare no conflict of interest.

References

  1. Asner, G.P.; Martin, R.E. Airborne spectranomics: Mapping canopy chemical and taxonomic diversity in tropical forests. Front. Ecol. Environ. 2008, 7, 269–276. [Google Scholar] [CrossRef] [Green Version]
  2. Hestir, E.L.; Khanna, S.; Andrew, M.E.; Santos, M.J.; Viers, J.H.; Greenberg, J.A.; Rajapakse, S.S.; Ustin, S.L. Identification of invasive vegetation using hyperspectral remote sensing in the California Delta ecosystem. Remote Sens. Environ. 2008, 112, 4034–4047. [Google Scholar] [CrossRef]
  3. Tang, L.; Shao, G. Drone remote sensing for forestry research and practices. J. For. Res. 2015, 26, 791–797. [Google Scholar] [CrossRef]
  4. Fassnacht, F.E.; Latifi, H.; Stereńczak, K.; Modzelewska, A.; Lefsky, M.; Waser, L.T.; Straub, C.; Ghosh, A. Review of studies on tree species classification from remotely sensed data. Remote Sens. Environ. 2016, 186, 64–87. [Google Scholar] [CrossRef]
  5. Meerdink, S.K.; Roberts, D.A.; King, J.Y.; Roth, K.L.; Dennison, P.E.; Amaral, C.H.; Hook, S.J. Linking seasonal foliar traits to VSWIR-TIR spectroscopy across California ecosystems. Remote Sens. Environ. 2016, 186, 322–338. [Google Scholar] [CrossRef]
  6. Fang, F.; McNeil, B.E.; Warner, T.A.; Maxwell, A.E.; Dahle, G.A.; Eutsler, E.; Li, J. Discriminating tree species at different taxonomic levels using multi-temporal WorldView-3 imagery in Washington DC, USA. Remote Sens. Environ. 2020, 246, 111811. [Google Scholar] [CrossRef]
  7. Xu, K.; Tian, Q.; Zhang, Z.; Yue, J.; Chang, C.-T. Tree species (genera) identification with GF-1 time-series in a forested landscape, Northeast China. Remote Sens. 2020, 12, 1554. [Google Scholar] [CrossRef]
  8. Roberts, D.A.; Ustin, S.L.; Ogunjemiyo, S.; Greenberg, J.; Dobrowski, S.Z.; Chen, J.; Hinckley, T.M. Spectral and structural measures of northwest forest vegetation at leaf to landscape scales. Ecosystems 2004, 7, 545–562. [Google Scholar] [CrossRef]
  9. Clark, M.L.; Roberts, D.A.; Clark, D.B. Hyperspectral discrimination of tropical rain forest tree species at leaf to crown scales. Remote Sens. Environ. 2005, 96, 375–398. [Google Scholar] [CrossRef]
  10. Lucas, R.; Bunting, P.; Paterson, M.; Chisholm, L. Classification of Australian forest communities using aerial photography, CASI and HyMap data. Remote Sens. Environ. 2008, 112, 2088–2103. [Google Scholar] [CrossRef]
  11. Féret, J.-B.; Asner, G.P. Tree species discrimination in tropical forests using airborne imaging spectroscopy. IEEE Trans. Geosci. Remote Sens. 2013, 51, 73–84. [Google Scholar] [CrossRef]
  12. Alonzo, M.; Bookhagen, B.; Roberts, D.A. Urban tree species mapping using hyperspectral and lidar data fusion. Remote Sens. Environ. 2014, 148, 70–83. [Google Scholar] [CrossRef]
  13. Feng, B.; Zheng, C.; Zhang, W.; Wang, L.; Yue, C. Analyzing the role of spatial features when cooperating hyperspectral and LiDAR data for the tree species classification in a subtropical plantation forest area. J. Appl. Remote Sens. 2020, 14, 022213. [Google Scholar] [CrossRef]
  14. Salisbury, J.W.; Milton, N.M. Preliminary measurements of spectral signatures of tropical and temperate plants in the thermal infrared. In Proceedings of the Fifth Thematic Conference on Remote Sensing for Exploration Geology, Reno, NV, USA, 29 September–2 October 1986; ERIM: Ann Arbor, MI, USA, 1987. Available online: https://ntrs.nasa.gov/citations/19880045682 (accessed on 22 August 2021).
  15. Ribeiro da Luz, B. Attenuated total reflectance spectroscopy of plant leaves: A tool for ecological and botanical studies. New Phytol. 2006, 172, 305–318. [Google Scholar] [CrossRef]
  16. Rock, G.; Gerhards, M.; Schlerf, M.; Hecker, C.; Udelhoven, T. Plant species discrimination using emissive thermal infrared imaging spectroscopy. Int. J. Appl. Earth Obs. Geoinf. 2016, 53, 16–26. [Google Scholar] [CrossRef]
  17. Harrison, D.; Rivard, B.; Sánchez-Azofeifa, A. Classification of tree species based on longwave hyperspectral data from leaves, a case study for a tropical dry forest. Int. J. Appl. Earth Obs. Geoinf. 2018, 66, 93–105. [Google Scholar] [CrossRef]
  18. Ribeiro da Luz, B.; Crowley, J.K. Spectral reflectance and emissivity features of broad leaf plants: Prospects for remote sensing in the thermal infrared (8.0–14.0 μm). Remote Sens. Environ. 2007, 109, 393–405. [Google Scholar] [CrossRef]
  19. Salisbury, J.W. Preliminary measurements of leaf spectral reflectance in the 8–14 µm region. Int. J. Remote Sens. 1986, 7, 1879–1886. [Google Scholar] [CrossRef]
  20. Salisbury, J.W.; Milton, N.M. Thermal infrared (2.5- to 13.5-µm) direction hemispherical reflectance of leaves. Photogramm. Eng. Remote Sens. 1988, 54, 1301–1304. Available online: https://www.asprs.org/wp-content/uploads/pers/1988journal/sep/1988_sep_1301-1304.pdf (accessed on 22 August 2021).
  21. Ribeiro da Luz, B.; Crowley, J.K. Identification of plant species by using high spatial and spectral resolution thermal infrared (8.0–13.5μm) imagery. Remote Sens. Environ. 2010, 114, 404–413. [Google Scholar] [CrossRef]
  22. Warren, D.W.; Boucher, R.H.; Gutierrez, D.J.; Keim, E.R.; Sivjee, M.G. MAKO: A high-performance, airborne imaging spectrometer for the long-wave infrared. Proc. SPIE 2010, 7812, 78120N. [Google Scholar] [CrossRef]
  23. Hall, J.L.; Boucher, R.H.; Buckland, K.N.; Gutierrez, D.J.; Keim, E.R.; Tratt, D.M.; Warren, D.W. Mako airborne thermal infrared imaging spectrometer: Performance update. Proc. SPIE 2016, 9976, 997604. [Google Scholar] [CrossRef]
  24. Buckland, K.N.; Young, S.J.; Keim, E.R.; Johnson, B.R.; Johnson, P.D.; Tratt, D.M. Tracking and quantification of gaseous chemical plumes from anthropogenic emission sources within the Los Angeles Basin. Remote Sens. Environ. 2017, 201, 275–296. [Google Scholar] [CrossRef]
  25. Manolakis, D.; Marden, D.; Shaw, G.A. Hyperspectral image processing for automatic target detection applications. Linc. Lab. J. 2003, 14, 79–116. Available online: https://archive.ll.mit.edu/publications/journal/pdf/vol14_no1/14_1hyperspectralprocessing.pdf (accessed on 22 August 2021).
  26. Manolakis, D.; Pieper, M.; Truslow, E.; Cooley, T.; Brueggeman, M.; Lipson, S. The remarkable success of adaptive cosine estimator in hyperspectral target detection. Proc. SPIE 2013, 8743, 874302. [Google Scholar] [CrossRef]
  27. Ullah, S.; Schlerf, M.; Skidmore, A.K.; Hecker, C. Identifying plant species using mid-wave infrared (2.5–6 μm) and thermal infrared (8–14 μm) emissivity spectra. Remote Sens. Environ. 2012, 118, 95–102. [Google Scholar] [CrossRef]
  28. Langsdale, M.F.; Dowling, T.P.F.; Wooster, W.; Johnson, J.; Grosvenor, M.J.; de Jong, M.C.; Johnson, W.R.; Hook, S.J.; Rivera, G. Inter-comparison of field- and laboratory-derived surface emissivities of natural and manmade materials in support of land surface temperature (LST) remote sensing. Remote Sens. 2020, 12, 4127. [Google Scholar] [CrossRef]
  29. Langsdale, M.F.; Wooster, W.; Harrison, J.J.; Koehl, M.; Hecker, C.; Hook, S.J.; Abbott, E.; Johnson, W.R.; Maturilli, A.; Poutier, L.; et al. Spectral emissivity (SE) measurement uncertainties across 2.5–14 μm derived from a round-robin study made across international laboratories. Remote Sens. 2021, 13, 102. [Google Scholar] [CrossRef]
  30. Hong, H.; Preston, B. Bayesian averaging, prediction and nonnested model selection. J. Econom. 2012, 167, 358–369. [Google Scholar] [CrossRef] [Green Version]
  31. Meerdink, S.K.; Hook, S.J.; Roberts, D.A.; Abbott, E.A. The ECOSTRESS spectral library version 1.0. Remote Sens. Environ. 2019, 230, 111196. [Google Scholar] [CrossRef]
  32. MODIS UCSB Emissivity Library (Vegetation). Available online: https://icess.eri.ucsb.edu/modis/EMIS/html/vegetation.html (accessed on 22 August 2021).
  33. Meerdink, S.; Roberts, D.A.; Hulley, G.; Pisek, J.; Raabe, K.; King, J.; Hook, S.J. Plant species’ spectral emissivity and temperature using the hyperspectral thermal emission spectrometer (HyTES) sensor. Remote Sens. Environ. 2019, 224, 421–435. [Google Scholar] [CrossRef]
  34. Neinavaz, E.; Darvishzadeh, R.; Skidmore, A.K.; Groen, T.A. Measuring the response of canopy emissivity spectra to leaf area index variation using thermal hyperspectral data. Int. J. Appl. Earth Obs. Geoinf. 2016, 53, 40–47. [Google Scholar] [CrossRef]
  35. Meerdink, S.K. Remote Sensing of Plant Species Using Airborne Hyperspectral Visible-Shortwave Infrared and Thermal Infrared Imagery. Ph.D. Thesis, University of California, Santa Barbara, CA, USA, 2018. Available online: https://escholarship.org/uc/item/6rd9w4vc (accessed on 22 August 2021).
  36. Christensen, P.R.; Harrison, S.T. Thermal infrared emission spectroscopy of natural surfaces: Application to desert varnish coatings on rocks. J. Geophys. Res. Solid Earth 1993, 98, 19819–19834. [Google Scholar] [CrossRef]
  37. Adams, P.M.; Lynch, D.K.; Buckland, K.N.; Johnson, P.D.; Tratt, D.M. Sulfate mineralogy of fumaroles in the Salton Sea Geothermal Field, Imperial County, California. J. Volcanol. Geotherm. Res. 2017, 347, 15–43. [Google Scholar] [CrossRef]
  38. Ribeiro da Luz, B. Propriedades Espectrais das Plantas no Infravermelho Termal (2,5–14 μm). Ph.D. Thesis, Instituto de Biociências, Universidade de São Paulo, São Paulo, Brazil, 2005. [Google Scholar] [CrossRef] [Green Version]
  39. O’Brien, C.; Hiti-Bandaralage, J.; Folgado, R.; Hayward, A.; Lahmeyer, S.; Folsom, J.; Mitter, N. Cryopreservation of woody crops: The avocado case. Plants 2021, 10, 934. [Google Scholar] [CrossRef]
  40. Gibbs, P.E.; Semir, J.; Da Cruz, N.D. A proposal to unite the genera Chorisia Kunth and Ceiba Miller (Bombacaceae). Notes R. Bot. Gard. Edinb. 1988, 45, 125–136. [Google Scholar]
  41. Gibbs, P.; Semir, J. A taxonomic revision of the genus Ceiba Mill. (Bombacaceae). An. Jardín Botánico De Madr. 2003, 60, 259–300. [Google Scholar] [CrossRef]
  42. Nixon, K.C.; Poole, J.M. Revision of the Mexican and Guatemalan species of Platanus (Platanaceae). Lundellia 2003, 6, 103–137. [Google Scholar] [CrossRef] [Green Version]
  43. Henry, A.; Flood, M. The history of the London plane, Platanus acerifolia, with notes on the genus Platanus. Proc. R. Ir. Acad. Sect. B Biol. Geol. Chem. Sci. 1919, 35, 9–28. Available online: http://www.jstor.org/stable/20517052 (accessed on 22 August 2021).
  44. Piperno, D.R.; Pearsall, D.M. The Silica Bodies of Tropical American Grasses: Morphology, Taxonomy, and Implications for Grass Systematics and Fossil Phytolith Identification; Smithsonian Contributions to Botany, No. 85; Smithsonian Institution Press: Washington, DC, USA, 1998. [Google Scholar] [CrossRef]
  45. Shakoor, S.A.; Bhat, M.A.; Mir, S.H. Phytoliths in plants: A review. Res. Rev. J. Bot. Sci. 2014, 3, 10–24. Available online: https://www.rroij.com/open-access/phytoliths-in-plantsa-review.php?aid=33907 (accessed on 22 August 2021).
  46. Du, H.; Mao, F.; Li, X.; Zhou, G.; Xu, X.; Han, N.; Sun, S.; Gao, G.; Cui, L.; Li, Y.; et al. Mapping global bamboo forest distribution using multisource remote sensing data. IEEE J. Sel. Topics Appl. Earth Observ. Remote Sens. 2018, 11, 1458–1471. [Google Scholar] [CrossRef]
  47. Lobovikov, M.; Paudel, S.; Piazza, M.; Ren, H.; Wu, J. World Bamboo Resources: A Thematic Study Prepared in the Framework of the Global Forest Resources Assessment 2005; UN Food and Agriculture Organization: Rome, Italy, 2007; Available online: https://www.fao.org/3/a-a1243e.pdf (accessed on 22 August 2021).
  48. Portillo, M.; Ball, T.; Manwaring, J. Morphometric analysis of inflorescence phytoliths produced by Avena sativa L. and Avena strigosa Schreb. Econ. Bot. 2006, 60, 121–129. [Google Scholar] [CrossRef]
  49. Fabre, S.; Lesaignoux, A.; Olioso, A.; Briottet, X. Influence of water content on spectral reflectance of leaves in the 3-15–µm domain. IEEE Geosci. Remote Sens. Lett. 2010, 8, 143–147. [Google Scholar] [CrossRef]
  50. Buitrago, M.F.; Groen, T.A.; Hecker, C.A.; Skidmore, A.K. Changes in thermal infrared spectra of plants caused by temperature and water stress. ISPRS J. Photogramm. Remote Sens. 2016, 111, 22–31. [Google Scholar] [CrossRef]
  51. Burkholder, A.; Warner, T.A.; Culp, M.; Landenburg, R. Seasonal trends in separability of leaf reflectance spectra for Ailanthus altissima and four other tree species. Photogramm. Eng. Remote Sens. 2011, 77, 793–804. [Google Scholar] [CrossRef]
  52. Hesketh, M.; Sánchez-Azofeifa, G.A. The effect of seasonal spectral variation on species classification in the Panamanian tropical forest. Remote Sens. Environ. 2012, 118, 73–82. [Google Scholar] [CrossRef]
  53. Meerdink, S.K.; Roberts, D.A.; Roth, K.L.; King, J.Y.; Gader, P.D.; Koltunov, A. Classifying California plant species temporally using airborne hyperspectral imagery. Remote Sens. Environ. 2019, 232, 111308. [Google Scholar] [CrossRef]
  54. Hennessy, A.; Clarke, K.; Lewis, M. Hyperspectral classification of plants: A review of waveband selection generalisability. Remote Sens. 2020, 12, 113. [Google Scholar] [CrossRef] [Green Version]
  55. Neuwirthová, E.; Kuusk, A.; Lhotáková, Z.; Kuusk, J.; Albrechtová, J.; Hallik, L. Leaf age matters in remote sensing: Taking ground truth for spectroscopic studies in hemiboreal deciduous trees with continuous leaf formation. Remote Sens. 2021, 13, 1353. [Google Scholar] [CrossRef]
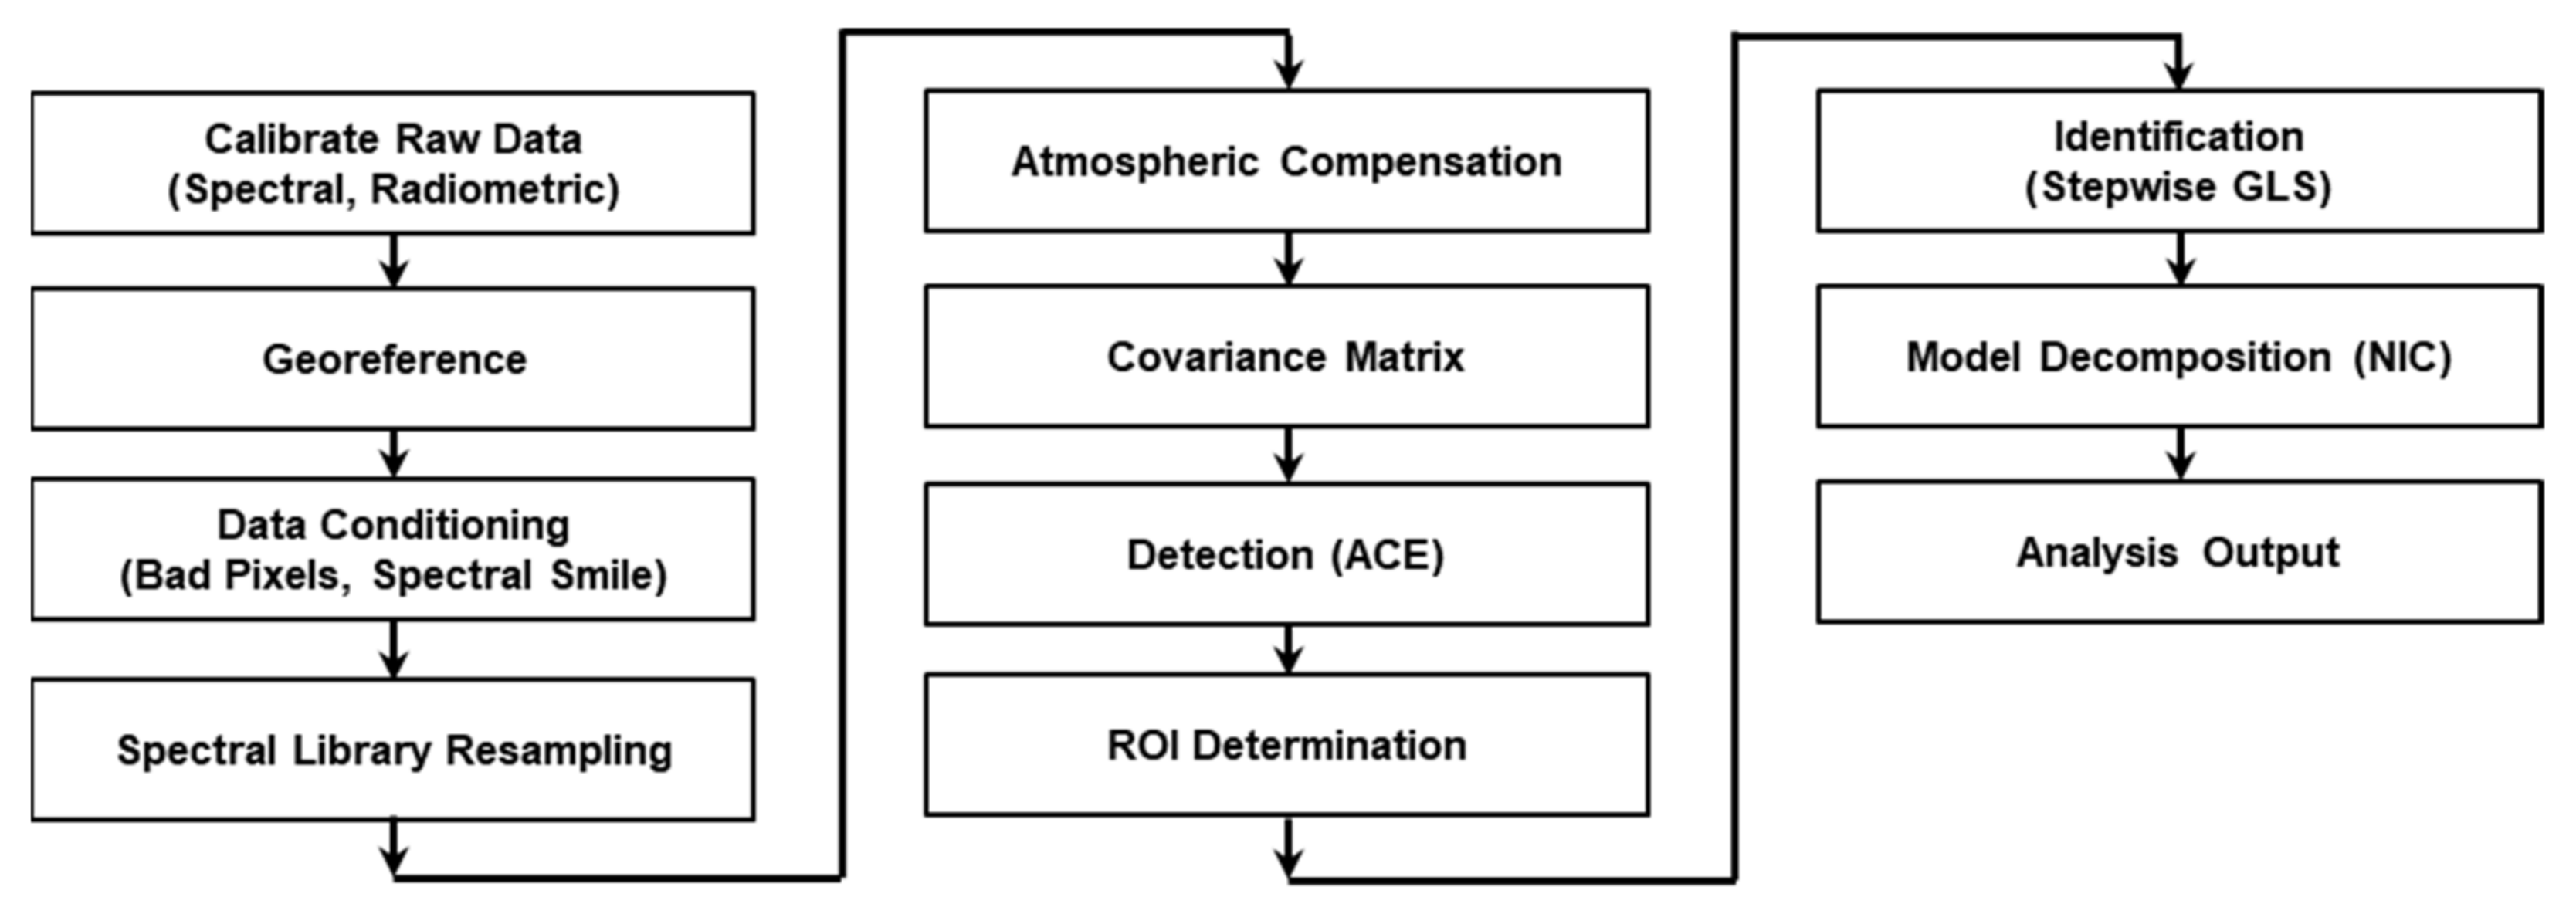
Figure 1. Top-level overview of the data processing flow.
Remotesensing 13 03344 g001
Figure 2. Multi-angle acquisition geometries at the Huntington Botanical Gardens (not to scale). For clarity, only one of the two opposing oblique scans is shown.
Remotesensing 13 03344 g002
Figure 3. (a) Dependence of ID on flight altitude (GSD) for nominally nadir viewing, (b) dependence of ID on viewing geometry at a nominal 1-m GSD.
Remotesensing 13 03344 g003
Figure 4. Salvia leucophylla ID as a function of GSD and observation angle: (a) ground view of target planting, (b) true-color aerial image, (c) thermal scene image at 0.5-m GSD with target ROI overlay (red), (d) thermal scene image at 1-m GSD with target ROI overlay (red), (e) thermal scene image at 2-m GSD with target location circled (no ROI was generated), (f) eastward-looking oblique thermal scene image at 1-m GSD with target ROI overlay (red), (g) westward-looking oblique thermal scene image at 1-m GSD with target ROI overlay (red).
Remotesensing 13 03344 g004
Figure 5. Citharexylum montevidense ID as a function of GSD and observation angle: (a) ground view of target tree, (b) true-color aerial image, (c) thermal scene image at 0.5-m GSD with target ROI overlay (red), (d) thermal scene image at 1-m GSD with target ROI overlay (red), (e) thermal scene image at 2-m GSD with target ROI overlay (red), (f) eastward-looking oblique thermal scene image at 1-m GSD with target ROI overlay (red), (g) westward-looking oblique thermal scene image at 1-m GSD with target ROI overlay (red).
Remotesensing 13 03344 g005
Figure 6. Bambusa beecheyana ID as a function of GSD and observation angle: (a) ground view of target stand, (b) true-color aerial image, (c) thermal scene image at 0.5-m GSD with target ROI overlay (red), (d) thermal scene image at 1-m GSD with target ROI overlay (red), (e) thermal scene image at 2-m GSD with target ROI overlay (red), (f) eastward-looking oblique thermal scene image at 1-m GSD with target ROI overlay (red), (g) westward-looking oblique thermal scene image at 1-m GSD with target ROI overlay (red).
Remotesensing 13 03344 g006
Figure 7. Geographical and temporal variability of LWIR foliar reflectance spectra for four unrelated arboreal species: (top left) Prunus serotina, (top right) Quercus rubra, (lower left) Acer saccharum, (lower right) Fagus grandifolia.
Remotesensing 13 03344 g007
Figure 8. Two examples of weak positive IDs. Upper panel: Afrocarpus gracilior (syn. Podocarpus gracilior), lower panel: Ficus thonningii. GSD: 0.5 m.
Remotesensing 13 03344 g008
Figure 9. Spectral separation of two closely adjacent trees at the Huntington Gardens. Each specimen appears in the filter of the other and its own, but the two are accurately discriminated through their spectral characteristics. GSD: 0.5 m.
Remotesensing 13 03344 g009
Figure 10. Overview of botanical IDs at the Huntington Botanical Gardens. The green boxes demarcate the coverage of the two 0.5-m GSD passes flown. Displayed in the Google Earth environment.
Remotesensing 13 03344 g010
Figure 11. Sampling of Salvia spp. IDs at the Huntington Botanical Gardens: (a) 1: S. chamaedryoides; 2: S. leucophylla ‘Bee’s Bliss’, (b) S. clevelandii, (c) S. fruticosa and S. heldreichiana, (d) S. clevelandii x S. leucophylla ‘Pozo Blue’.
Remotesensing 13 03344 g011
Figure 12. Huntington Gardens avocado orchard: IDs overlaid on (a) thermal scene image, (b) true-color scene image, (c) spectral analysis results showing the proximity of the Quercus robur spectrum to that of Persea americana.
Remotesensing 13 03344 g012
Figure 13. Persea americana and Quercus robur spectra most frequently ID’d at the Huntington Gardens avocado orchard. The Q. robur library spectrum has been scaled by a factor of 3.
Remotesensing 13 03344 g013
Figure 14. Specimens of Chionanthus retusus mis-ID’d by (a) the Citharexylum montevidense spectrum and (b) correctly ID’d by the Ch. retusus spectrum.
Remotesensing 13 03344 g014
Figure 15. Intercomparison of Chionanthus retusus and Citharexylum montevidense spectra. The C. montevidense library spectrum has been scaled by a factor of 2.
Remotesensing 13 03344 g015
Figure 16. Specimens of Chionanthus pygmaeus mis-ID’d by the Citharexylum montevidense filter: (a) closely spaced stand of three trees, (b) single specimen.
Remotesensing 13 03344 g016
Figure 17. Mis-ID of a Chorisia insignis at the Huntington Gardens. The reference spectrum obtained from the subject tree is compared to the ID spectrum at right.
Remotesensing 13 03344 g017
Figure 18. Platanus spp. specimens ID’d with the P. occidentalis spectrum: (a) P. wrightii (Huntington Gardens), (b) P. orientalis (Huntington Gardens), (c) P. x acerifolia (circled) and two P. mexicana (Lacy Park), (d) groups of three (left) and two (right) P. racemosa (Huntington Gardens).
Remotesensing 13 03344 g018
Figure 19. (a) Mis-ID of Platanus racemosa group at Lacy Park. A P. occidentalis specimen (encircled at bottom of frame) is positively ID’d. (b) Mis-ID of P. x acerifolia group at Descanso Gardens.
Remotesensing 13 03344 g019
Figure 20. Detection images of multiple bamboo taxa showing the range of IDs obtained with each stand.
Remotesensing 13 03344 g020
Figure 21. Intercomparison of ID spectra corresponding to the observations in Figure 20: (a) stand 1 (Phyllostachys vivax), (b) stand 2 (P. aurea), (c) stand 3 (Bambusa tuldoides), (d) stand 4 (B. textilis).
Remotesensing 13 03344 g021
Figure 22. Rare positive ID of a Magnolia grandiflora (1). Two additional neighboring M. grandiflora (2) remain undetected. Included in the scene is a correctly ID’d Quercus lobata (3).
Remotesensing 13 03344 g022
Figure 23. (a) Series of Brachychiton discolor ROIs; (b) spectral intercomparison between the four unrelated species that deliver competing IDs.
Remotesensing 13 03344 g023
Figure 24. Comparison of spring and summer ID statistics for the Huntington Gardens and Descanso Gardens.
Remotesensing 13 03344 g024
Table 1. Nominal sensor operating specifications.
ParameterMako
Spectral range7.57–13.16 μm
Spectral resolution (128 channels)44 nm
Instantaneous field-of-view (IFOV)0.55 mrad
Swath width (relative to nadir)±56° (max.)
NESR (10 μm, 4 co-adds)<0.5 μW cm−2 sr−1 μm−1
NEDT (10 μm, 300 K)0.02 K
Table 2. Botanical collections contributing to this investigation.
FacilityDates ImagedWeb Site
Huntington Botanical Gardens (San Marino, CA, USA)2020-06-20
2019-04-04
2013-08-28
www.huntington.org/gardens (accessed on 22 August 2021).
Los Angeles County Arboretum (Arcadia, CA, USA)2019-04-04www.arboretum.org (accessed on 22 August 2021).
South Coast Botanic Garden (Palos Verdes, CA, USA)2019-03-28southcoastbotanicgarden.org (accessed on 22 August 2021).
Lacy Park (San Marino, CA, USA)2020-06-20en.wikipedia.org/wiki/Lacy_Park (accessed on 22 August 2021).
Descanso Gardens
(La Cañada, CA, USA)
2021-04-07
2020-06-20
www.descansogardens.org (accessed on 22 August 2021).
Table 3. Observational parameters corresponding to Figure 4, Figure 5 and Figure 6.
GSD (m)Salvia leucophyllaCitharexylum montevidenseBambusa beecheyana
θi (deg)tNθi (deg)tNθi (deg)tN
0.54−10.710610−12.13751−13.1911
19−9.1362−11.81277−13.5273
24-<101−7.3313−10.566
1 (E)45−7.81942−12.77845−11.7105
1 (W)36−7.92041−12.06638−15.0172
Table 4. Reference spectra commonly associated with the most frequently ID’d taxa.
TaxonID Species ReturnedSpectrum Source
Bambusa beecheyanaBambusa beecheyanaECOSTRESS Library
Bambusa oldhamiiBambusa beecheyana
Bambusa tuldoides
ECOSTRESS Library
ECOSTRESS Library
Bambusa textilisBambusa tuldoidesECOSTRESS Library
Bambusa tuldoidesBambusa tuldoides
Bambusa textilis
ECOSTRESS Library
This work
Brachychiton discolorBrachychiton discolor
Quercus robur
Strelitzia nicolai
ECOSTRESS Library
ECOSTRESS Library
MODIS-UCSB Library
Cassia leptophyllaCassia leptophyllaECOSTRESS Library
Chionanthus pygmaeusCitharexylum montevidenseECOSTRESS Library
Chionanthus retususCitharexylum montevidense
Chionanthus retusus
Cornus florida
Pseudocidonia sinensis
ECOSTRESS Library
This work
USGS-VEG Library
USGS-VEG Library
Chorisia speciosa and
hybrids
Chorisia speciosa
Chionanthus retusus
ECOSTRESS Library
This work
Ficus sycomorusParrotia persicaUSGS-VEG Library
Liriodendron tulipiferaChionanthus retusus
Chorisia speciosa
This work
ECOSTRESS Library
Magnolia grandifloraMagnolia grandifloraECOSTRESS Library
Persea americanaPersea americana
Quercus robur
This work
ECOSTRESS Library
Platanus racemosaPersea americana
Platanus occidentalis
Acer ‘Red Star’
Caesalpinia cacalaco
Quercus lobata
Quercus robur ssp. pedunculiflora *
This work
USGS-VEG Library
MODIS-UCSB Library
ECOSTRESS Library
ECOSTRESS Library
USGS-VEG Library
Platanus x acerifoliaCaesalpinia cacalacoECOSTRESS Library
Quercus agrifoliaBambusa beecheyanaECOSTRESS Library
Salvia clevelandiiSalvia leucophyllaECOSTRESS Library
Salvia leucophylla and
hybrids
Salvia leucophyllaECOSTRESS Library
Syagrus romanzoffianaMorus alba
Parrotia persica
USGS-VEG Library
USGS-VEG Library
Ulmus parvifoliaFicus thonningii
Morus alba
Ulmus carpinifolia
Zelkova serrata
ECOSTRESS Library
USGS-VEG Library
USGS-VEG Library
USGS-VEG Library
* Classified in originating source as Q. longipes but generally accepted as the indicated taxonomy.
Publisher’s Note: MDPI stays neutral with regard to jurisdictional claims in published maps and institutional affiliations.