Article

The Detection of Active Sinkholes by Airborne Differential LiDAR DEMs and InSAR Cloud Computing Tools

1
Departamento de Ciencias de la Tierra, Universidad de Zaragoza, C/Pedro Cerbuna 12, 50009 Zaragoza, Spain
2
Departamento de Geodinámica, Universidad de Granada, Avda. del Hospicio, s/n, 18010 Granada, Spain
*
Author to whom correspondence should be addressed.
Remote Sens. 2021, 13(16), 3261; https://doi.org/10.3390/rs13163261
Submission received: 30 June 2021 / Revised: 6 August 2021 / Accepted: 16 August 2021 / Published: 18 August 2021
(This article belongs to the Special Issue Remote Sensing of Engineering Problems in Karst)

Abstract

:
InSAR (Interferometric Synthetic Aperture Radar) cloud computing and the subtraction of LiDAR (Light Detection and Ranging) DEMs (Digital Elevation Models) are innovative approaches to detect subsidence in karst areas. InSAR cloud computing allows for analyzing C-band Envisat and Sentinel S1 SAR images through web platforms to produce displacement maps of the Earth’s surface in an easy manner. The subtraction of serial LiDAR DEMs results in the same product but with a different level of accuracy and precision than InSAR maps. Here, we analyze the capability of these products to detect active sinkholes in the mantled evaporite karst of the Ebro Valley (NE Spain). We found that the capability of the displacement maps produced with open access, high-resolution airborne LiDAR DEMs was up to four times higher than InSAR displacement maps generated by the Geohazard Exploitation Platform (GEP). Differential LiDAR maps provide accurate information about the location, active sectors, maximum subsidence rate and growing trend of the most rapid and damaging sinkholes. Unfortunately, artifacts and the subsidence detection limit established at −4 cm/yr entailed important limitations in the precise mapping of the sinkhole edges and the detection of slow-moving sinkholes and small collapses. Although InSAR maps provided by GEP show a worse performance when identifying active sinkholes, in some cases they can serve as a complementary technique to overcome LiDAR limitations in urban areas.

1. Introduction

The monitoring of ground deformation processes using remote sensing and image processing techniques has experienced an exponential increase in the last decade. In karst terrains, stereoscopic aerial photograph interpretation and the use of contour lines have traditionally been the main approaches used to map sinkholes [1,2,3,4]. Nowadays, the mapping process as well as the accuracy and completeness of the sinkhole inventories can be substantially improved using airborne LiDAR (Light Detection and Ranging) data [5]. An important advantage of this remote-sensing technique includes the possibility of filtering the vegetation to produce accurate and high-resolution bare-ground digital elevation models (DEMs) [6,7]. These models can be used to: (a) generate 3D representations of the terrain (e.g., hillshades, red relief image maps) that facilitate the delineation of the sinkholes [8], (b) extract automatically morphometric parameters [9], and (c) apply automated routines for the extraction of closed depressions [10]. Recent processing algorithms and filters favor the automated detection and morphometric characterization of sinkholes, significantly improving the speed and the efficiency of the sinkhole mapping process using LiDAR datasets [6,11,12,13,14,15]. Nevertheless, the automatic mapping of sinkholes suffers from significant limitations, including a substantial number of false positives that need to be separated, commonly using morphometric data [16], and the underestimation of the size of the karst depressions [17].
However, sinkhole hazard assessment requires not only spatial data, but also a temporal analysis of the sinkholes for subsidence prediction, including information on their activity and spatial-temporal probability of occurrence [18]. The performance of airborne LiDAR to detect ground deformation associated with sinkholes has barely received attention, and limited work has been done to explore its practicality [19], in contrast with other subsidence monitoring techniques such as GNSS [20,21], high-precision leveling [22,23], DInSAR [16,24,25,26,27,28,29], GB-InSAR [30], terrestrial laser scanning [23,31,32], or close-range photogrammetry [33]. However, models derived from the comparison of multi-temporal LiDAR data have already been satisfactorily used to quantify changes in the coastline and coastal landforms [34,35,36], glaciers [37,38,39], active faults [40,41], volcanoes [42,43], landslides [44,45,46], and land subsidence due to water withdrawal [47,48].
The aim of this paper is to explore the potential of multi-temporal open access airborne LiDAR data to identify active sinkholes, previously mapped in a detailed sinkhole inventory, and estimate subsidence rates. The approach is tested in a thoroughly investigated sinkhole with high-precision leveling data (Zuera sinkholes site) and in a 135 km2 sector of the Ebro Valley (NE Spain) mantled evaporite karst, where the sinkholes are characterized by: (1) relatively large dimensions (up to 300 m in diameter), (2) the prevalence of the sagging subsidence mechanism, (3) high and continuous subsidence rates related to the dissolution of the salt-bearing bedrock, and (4) the sudden occurrence of dangerous nested collapses. Bare-ground DEMs derived from 2010 and 2016 airborne LiDAR data from the Spanish National Geographic Institute (IGN) were subtracted on a pixel-by-pixel basis to obtain models of apparent vertical displacement using simple raster GIS (Geographic Information System) tools. The vertical displacement and subsidence rates obtained from DEM subtraction at specific sinkholes were evaluated using subsidence data previously obtained by high-precision leveling. The displacement models obtained from the Differencing of DEMs (DoD) in the sinkholes were also compared with vertical displacement data generated by multitemporal analysis of Envisat and Sentinel-1 SAR images using the SBAS (Small Baseline Subset) and FASTVEL approaches implemented in the Geohazard Exploitation Platform (GEP) of the European Space Agency (ESA). The results illustrate the applicability of airborne LiDAR to detect some active sinkholes and assess their activity, offering better results than those derived from the aforementioned DInSAR (Differential SAR Interferometry) and PSInSAR (Permanent Scatterer SAR Interferometry) analyses using SAR (Synthetic Aperture Radar) data with a medium spatial resolution. The tested approach, based on the fast and simple processing of open access airborne LiDAR data, has potential practical applications for active sinkhole detection that can be easily explored for multiple purposes (e.g., land-use planning, risk management, insurance appraisal).

2. Geological Setting

The sinkhole inventory covers an area of 135 km2 in the middle reach of the Ebro River valley in Zaragoza city and its surroundings (study area). The work also explores two sinkholes in the lower stretch of the Gállego River valley (Zuera sinkholes site), NE Spain (Figure 1).
From the geological perspective, the studied zones are situated in the central sector of the Ebro Cenozoic basin, with subhorizontally lying salt-bearing evaporites (gypsum, anhydrite, halite and glauberite) of the late Oligocene-Miocene Zaragoza Formation [49,50,51]. The soluble bedrock is mainly covered by gravelly terrace deposits, locally thickened by synsedimentary dissolution-induced subsidence and reaching more than 60 m thick [4]. Multiple lines of evidence, including borehole data [51], paleosubsidence structures affecting both the alluvial cover and the bedrock [4], hydrochemical data [52,53], geomorphic evidence including kilometer-scale enclosed basins [54], and subsidence rates [22] indicate that subsidence in the Ebro and Gállego valleys is largely related to the interstratal dissolution of halite and glauberite beds interbedded within the evaporitic bedrock [4,55]. In the Zuera sinkholes, a 60 m deep borehole penetrated gravel-filled voids at 17 m depth and halite layers starting from a depth of 42 m [56]. In the surroundings of Zaragoza city, the altitudinal correlation between groups of thickened terraces and the distribution of glauberite and halite units indicate that the subsidence phenomenon has been induced by dissolution of those salt layers [4,55].
The analyzed sinkholes are typically hundreds of meters in diameter and are dominated by sagging subsidence (i.e., cover and bedrock sagging sinkholes or cover sagging sinkholes). The active depressions typically display continuous and relatively rapid subsidence related to the high solubility of the evaporite bedrock [22,23,32]. Eventually, these large sinkholes can be locally affected by the occurrence of nested catastrophic collapses with high damaging potential. Most of the subsidence damage in the area is related to old sinkholes recognizable in old aerial photographs and historical topographic maps that were filled by man-made deposits and occupied by human structures [3]. The subsidence rates at some of the most active sinkholes were gathered by low-precision leveling profiles [1], cumulative displacement measured in deformed man-made structures of known age [2,3], retrodeformation analysis of trench logs together with geochronological data and historical information [57,58,59,60,61,62], high-precision leveling profiles [22,23], and multi-temporal terrestrial laser scanner data [23,31,32]. In addition, the irrigation of crop fields provides a substantial extra water input to the alluvial-evaporite aquifer system enhancing karstification and subsidence processes [52,53]. The result of the high risk of sinkhole hazards in combination with poor preventive planning is that numerous buildings have been demolished and many transportation infrastructures need continuous remediation works.

3. Materials and Methods

The study employs a multidisciplinary set of methods and data including conventional time-lapse aerial stereoscopic photography, field mapping, high-precision leveling, airborne LiDAR, and differential SAR interferometry to assess sinkhole activity.
The sinkhole inventory was generated using: (1) old topographic maps from 1960 to 1974, (2) aerial stereoscopic photographs and orthoimages taken in 1946, 1956, 1986, 1996, 2002, 2009, 2012 and 2018, some downloaded from the Spanish National Geographic Institute (IGN), and (3) a 1 m spatial resolution digital elevation model (DEM) derived from the 2010 and 2016 LiDAR data. This inventory was initially published in [3] and has been continuously updated incorporating new sinkhole occurrences and additional information obtained by field mapping and applying hydrochemical, trenching, geophysical and levelling techniques [4,32,56,57,58,59,60,61,62,63,64,65]. The inventory was completed by a sinkhole-specific study in the most sinkhole-prone area of Zaragoza city (labelled as a detailed area in Figure 1). Here, several field campaigns were carried out between 2014 and 2016 in order to identify evidence of sinkhole-related active deformation on the ground and in human structures. This detailed information helped us to identify active sinkholes, assess the accuracy of the LiDAR-derived displacement data for active-sinkhole detection, and compare these results with the SBAS and FASTVEL algorithms. Note that the inventory of active sinkholes is a minimum record since the lack of field evidence of active deformation does not necessarily mean that the sinkhole is inactive.
Based on their geometry and the mechanisms involved in the ground subsidence [66], the sinkholes were classified into three main genetic types: (a) circular-shaped, collapse sinkholes often between 2 and 10 m across and occasionally up to 40 m in diameter with scarped or overhanging edges that usually occur in a catastrophic way, (b) circular-shaped, sagging and collapse sinkholes tens of meters across, and (c) large, irregularly shaped compound depressions up to 350 m in diameter and 94,000 m2 in area that result from the coalescence of several smaller sinkholes. The bottoms of some of these depressions are used to reach the water table, hosting lacustrine or palustrine areas.
Open-source LiDAR data of the Ebro Valley were acquired on 4 January 2010 and 22 February 2016 (2238 days; 6.13 years) by the IGN using Leica ALS-60 and ALS-80 laser scanners operated on an aircraft at an altitude of 3500 m. The data that were freely downloaded from the IGN server were already classified according to the American Society for Photogrammetry and Remote Sensing (ASPRS) standard LiDAR Point Classes [67] using the Axelsson [68,69] and NVDI algorithms. Additional information on LiDAR processing and classification can be found in Lorite-Martínez et al. [70]. Following the recommendations presented by Montealegre et al. [71] and Zhao et al. [72] in their reviews on filtering algorithms from open-source LiDAR point clouds, we applied the progressive TIN (Triangulated Irregular Network) densification algorithm (LAStools), the weighted linear least-squares interpolation-based method (FUSION), and the multiscale curvature classification (MCC) with unsuccessful results. All the filters had difficulties on steep slopes over 30° mislabeling points as nonground, while points returned from small buildings, dense vegetation areas, light posts and shrub cover along irrigation ditches and cropland boundaries are commonly mislabeled as ground surface. Consequently, a buffer of 3 m on irrigation ditches and buildings was removed from the differential raster due to wrong point cloud classification in order to significantly reduce artifacts. An important implication of this filtering process is that the human structures affected by subsidence were undetected by the analysis.
The density of the ground measuring points was at least 0.5 points/m2 with a mean square error in the vertical and horizontal axes of 20 and 10 cm, respectively. DEMs of a 1 m horizontal resolution were produced with the 2010 and 2016 bare-ground LiDAR data using the ArcGIS tool “Las Dataset to Raster” and the triangulation method. These DEMs were then subtracted on a pixel-by-pixel basis for elevation change detection and for active sinkhole mapping. DEM subtraction on confidently known stable areas showed that the vertical accuracy of the vertical displacement model reaches around 25 cm. Consequently, only active sinkholes with subsidence rates over 4 cm/yr (25 cm in ca. 6 years) and associated with a favorable land cover could be detected.
The GEP (Geohazard Themathic Exploitation Platform) is a web-based platform that offers users the possibility to easily request and download analyses of satellite data to monitor geological hazards. In this case, we have run the web-based SBAS and FASTVEL processing approaches that are available with restricted access on the platform. These approaches have been developed by IREA-CNR and TRE-Altamira, respectively, for monitoring the temporal evolution of surface deformations and generating interferogram stacks from a set of Envisat and Sentinel-1 SAR images. The processing chain finally ends with the creation of LOS mean displacement velocity maps (Multitemporal Analyisis Mode) of the ground surface in cm/year by applying advanced DInSAR (SBAS approach) and PSInSAR (FASTVEL approach) techniques. Additional information about the platform, its services, workflow and processing chain is available in Casu et al. [73], De Luca et al. [74], Galve et al. [75], Manunta et al. [76], Piroton et al. [77] and the GEP website (https://geohazards-tep.eu/#! (accessed on 16 June 2021)). With the help of the GEP platform, we have produced 9 velocity maps of different time intervals exploiting the whole archive of Envisat SAR images from 2003 to 2010 and a large number of Sentinel-1 SAR images from 2014 to 2021 in order to cover the maximum time span covered by the two LiDAR datasets. These are (Tables S1–S3, Supplementary Materials):
  • Two surface velocity maps with a spatial resolution of 80 by 80 m (4 looks in the range direction and 20 in the azimuth one) using the SBAS Envisat algorithm by processing 25 archived ASAR images of the Envisat satellite acquired on ascending orbit from 25 June 2004 to 17 September 2010 (track 152, frame 58), and 29 archived ASAR images of the Envisat satellite acquired on descending orbit from 19 June 2003 to 30 September 2010 (track 101, frame 152).
  • Four surface velocity maps with a spatial resolution of 90 by 90 m using the SBAS Sentinel approach by processing 74 archived SLC_IW images of the Sentinel S1 satellite acquired on ascending orbit from 5 November 2014 to 26 January 2021 (track 103), 51 archived SLC_IW images of the Sentinel S1 satellite acquired on descending orbit from 9 June 2016 to 26 January 2021 (track 8), 100 archived SLC_IW images of the Sentinel S1 satellite acquired on ascending orbit from 13 June 2019 to 20 February 2021 (track 30), and 100 archived SLC_IW images of the Sentinel S1 satellite acquired on descending orbit from 12 June 2019 to 19 February 2021 (track 8).
  • Four surface velocity maps to cover the study area with a spatial resolution of 40 by 40 m using the FASTVEL Sentinel algorithm by processing 400 archived SLC_IW images of the Sentinel S1 acquired on descending orbit from 12 July 2017 to 21 March 2021 (track 8).
The unstable points in the surface velocity maps were selected establishing an average line of sight (LOS) displacement rate threshold of ±2 and ±5 mm/yr for Envisat and Sentinel-1 SAR images, respectively [76]. Tables S1–S3 (supplementary Materials) show additional information on SAR datasets involved in every processing analysis and the thresholds used to run data processing. The vertical deformation rate for the Zuera sinkhole site and Ebro Valley was determined following the methodology described by Bejar et al. [78] from the Envisat and Sentinel SAR images on the ascending and descending orbits and assuming that the north component is negligible [79,80]. Note that the movement in sinkholes associated to subsidence is vertical rather than eastward. The displacement rates along the satellite line-of-sight (vLOS) from ascending and descending datasets were interpolated using the inverse distance weighted (IDW) method (with power 2, search radius 200 m, and one point minimum). The interpolated ascending (vLOSa) and descending (vLOSd) velocities were then used to calculate the vertical components of the velocity, using the raster calculator tool of the open-source software Quantum GIS.
Vvertical = ((vLOSdEd) − (vLOSaEa))(HdEd − HaEa)
where Ha, Hd, Ea, and Ed represent the direction cosines of the ascending (a) and descending (d) LOS vector and are estimated from the incidence angles (αa and αd) and the LOS azimuths (γa and γd) in degrees (Tables S1–S3, Supplementary Materials):
Ha = cos(αa)
Hd = cos(αd)
Ea = cos(90 − αa) × cos(270 − γa)
Ed = cos(90 − αd) × cos(270 − γd)

4. Results

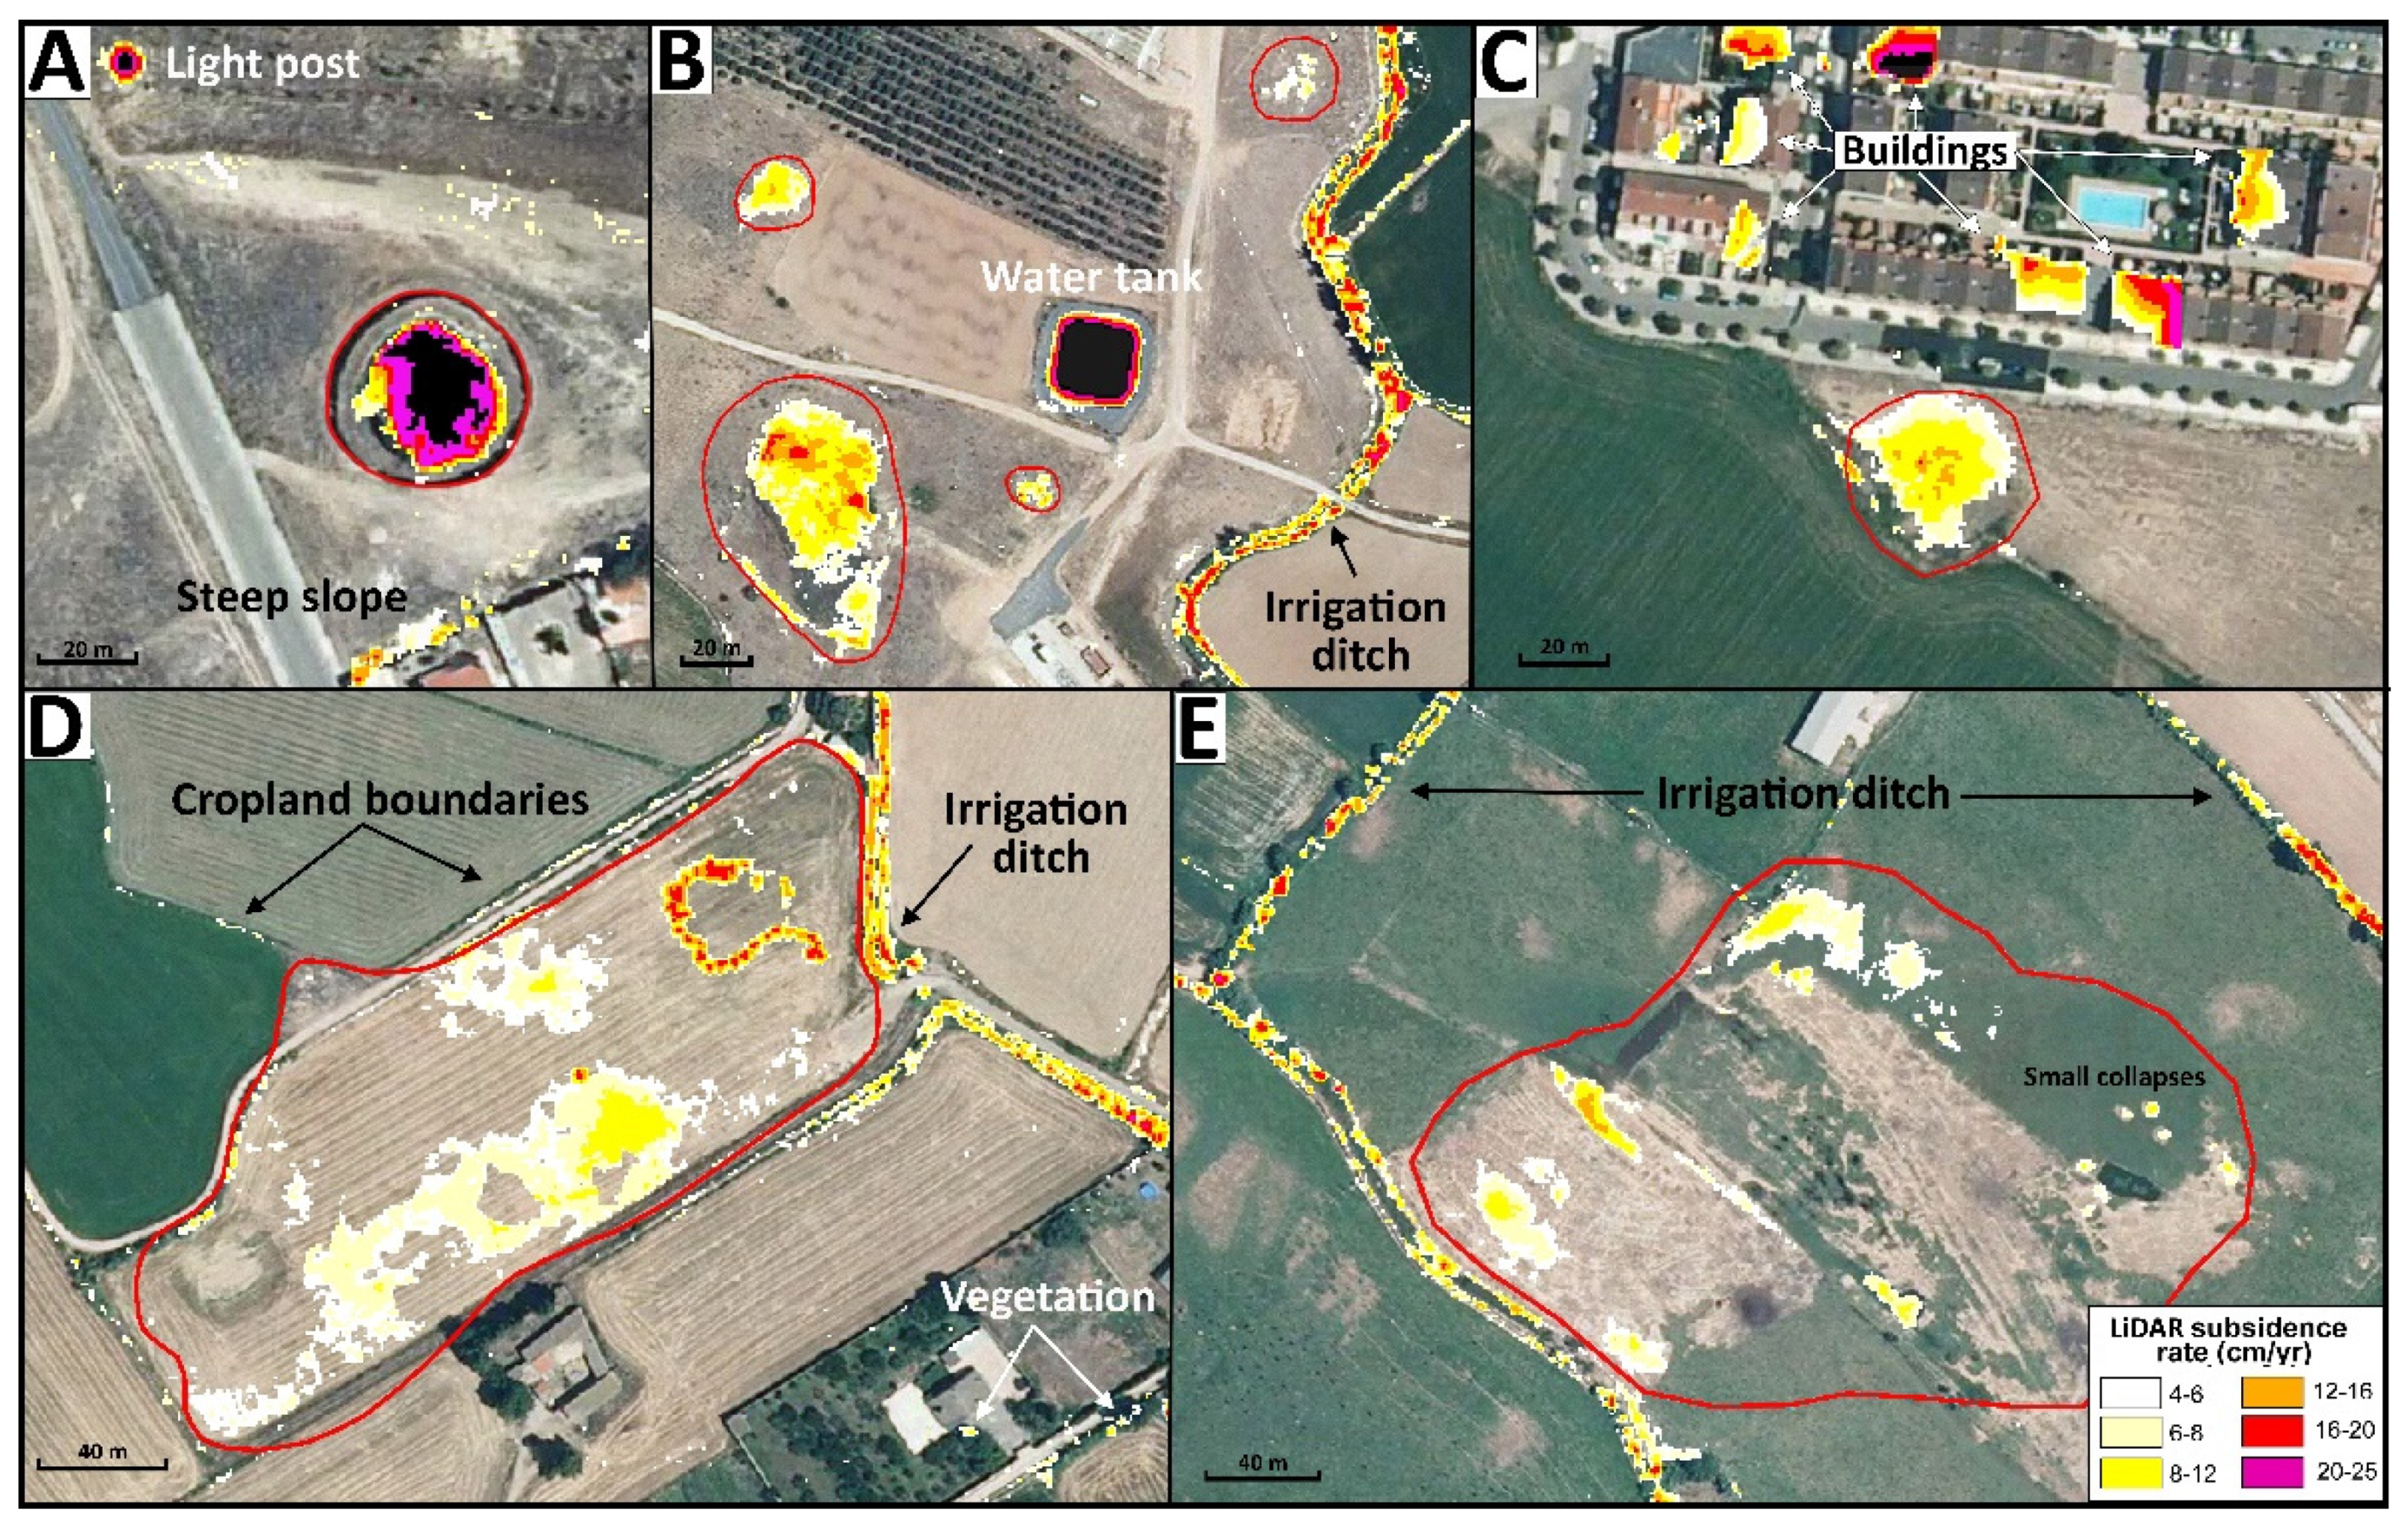
4.1. Active Sinkhole Detection by LiDAR Displacement Maps

The criteria to consider a sinkhole as an active subsidence depression rather than an artifact in the DoD mainly depend on the genetic type of the sinkhole. Collapse sinkholes exhibit a well-defined circular subsidence area that indicates the minimum extent of the sinkholes (Figure 2A). Small collapses may be erroneously interpreted as false positive readings related to wrong point classification and a wide variety of alterations (e.g., anthropogenic ground disturbances, vehicles). Consequently, any small collapse had to be validated as a scarped-edge depression in the 2018 orthoimage (25 cm spatial resolution) or in the field. Unfortunately, most of these small collapse sinkholes are commonly filled immediately after their formation, and therefore they were mostly undetected. Large sagging and collapse sinkholes were easily detected in the LiDAR deformation maps. They showed a concentric pattern of ground deformation with increasing displacement towards their center (Figure 2B,C). Large compound depressions displayed complex spatial deformation patterns since their activity can focus at specific sectors rather than affecting the totality of the depression. They often showed: (1) a cluster of small collapses with a concentric arrangement or along arcuate lines potentially related to precursory evidence of sudden sinkhole formation, (2) linear subsidence troughs that may link two or more small sinkholes, and (3) subcircular and concentric deformation zones coinciding with the most active sectors (Figure 2D,E). Those readings from the subtraction of the LiDAR-derived DEMs that did not match any of these subsidence arrangements were considered artifacts.

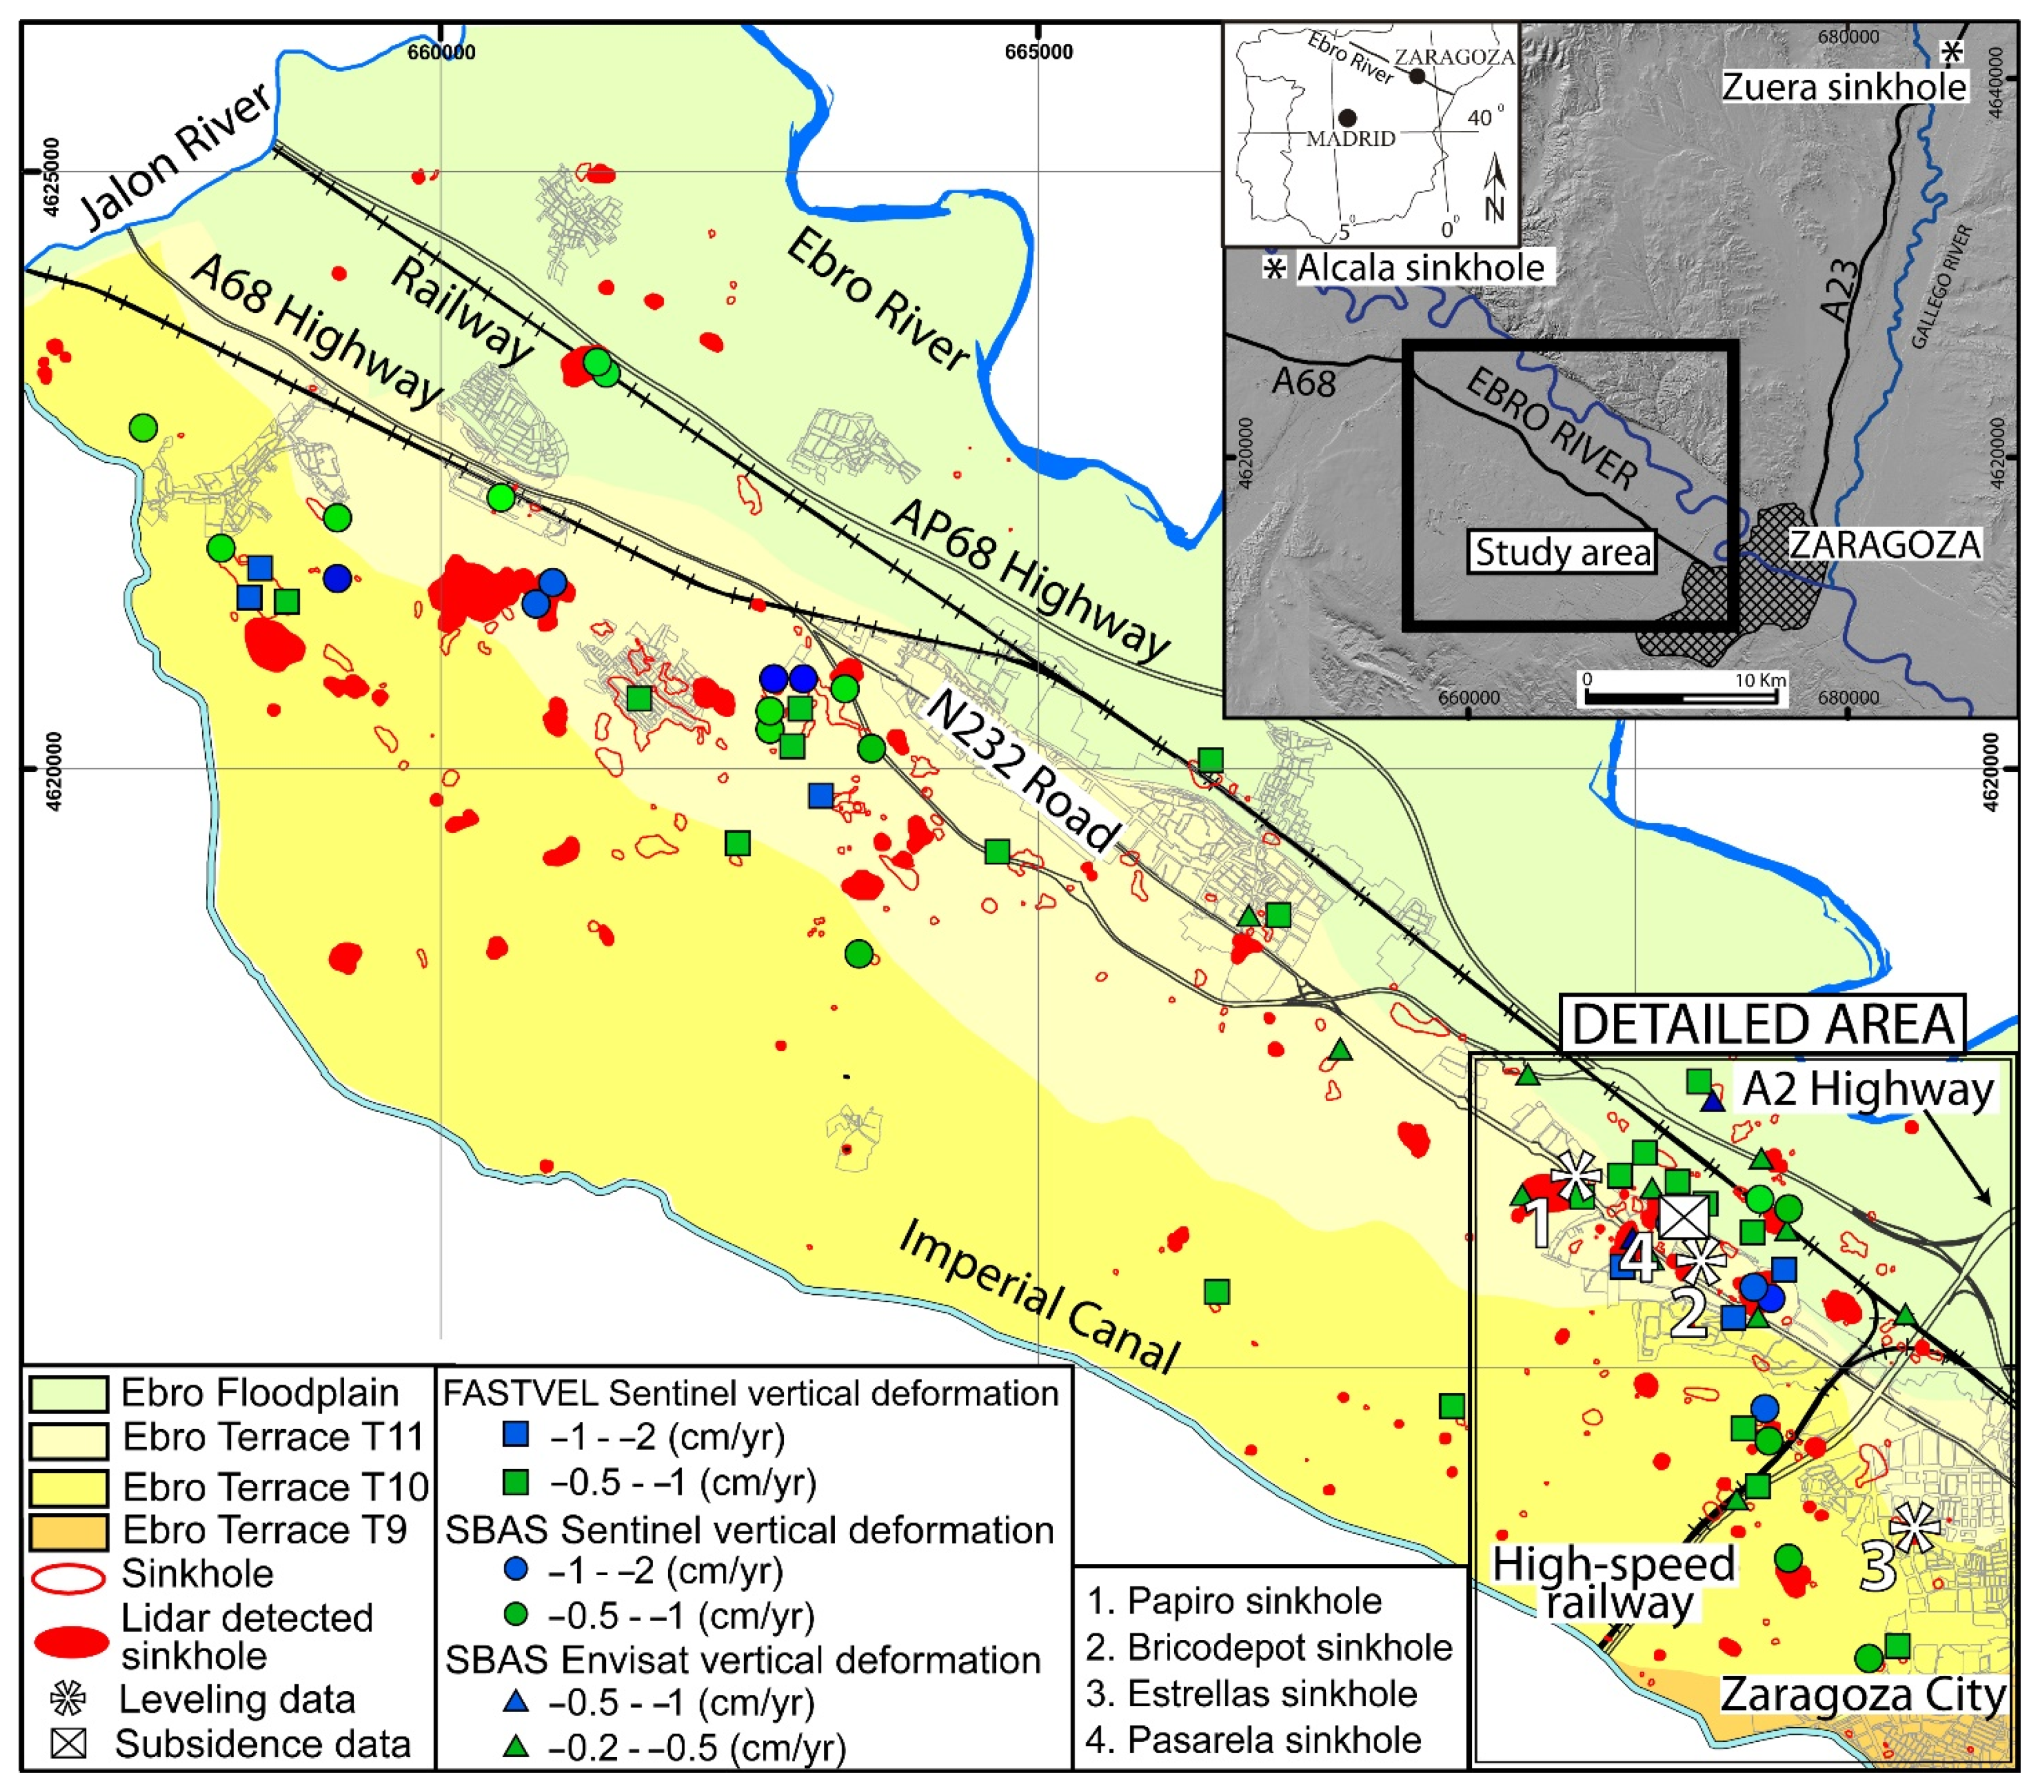
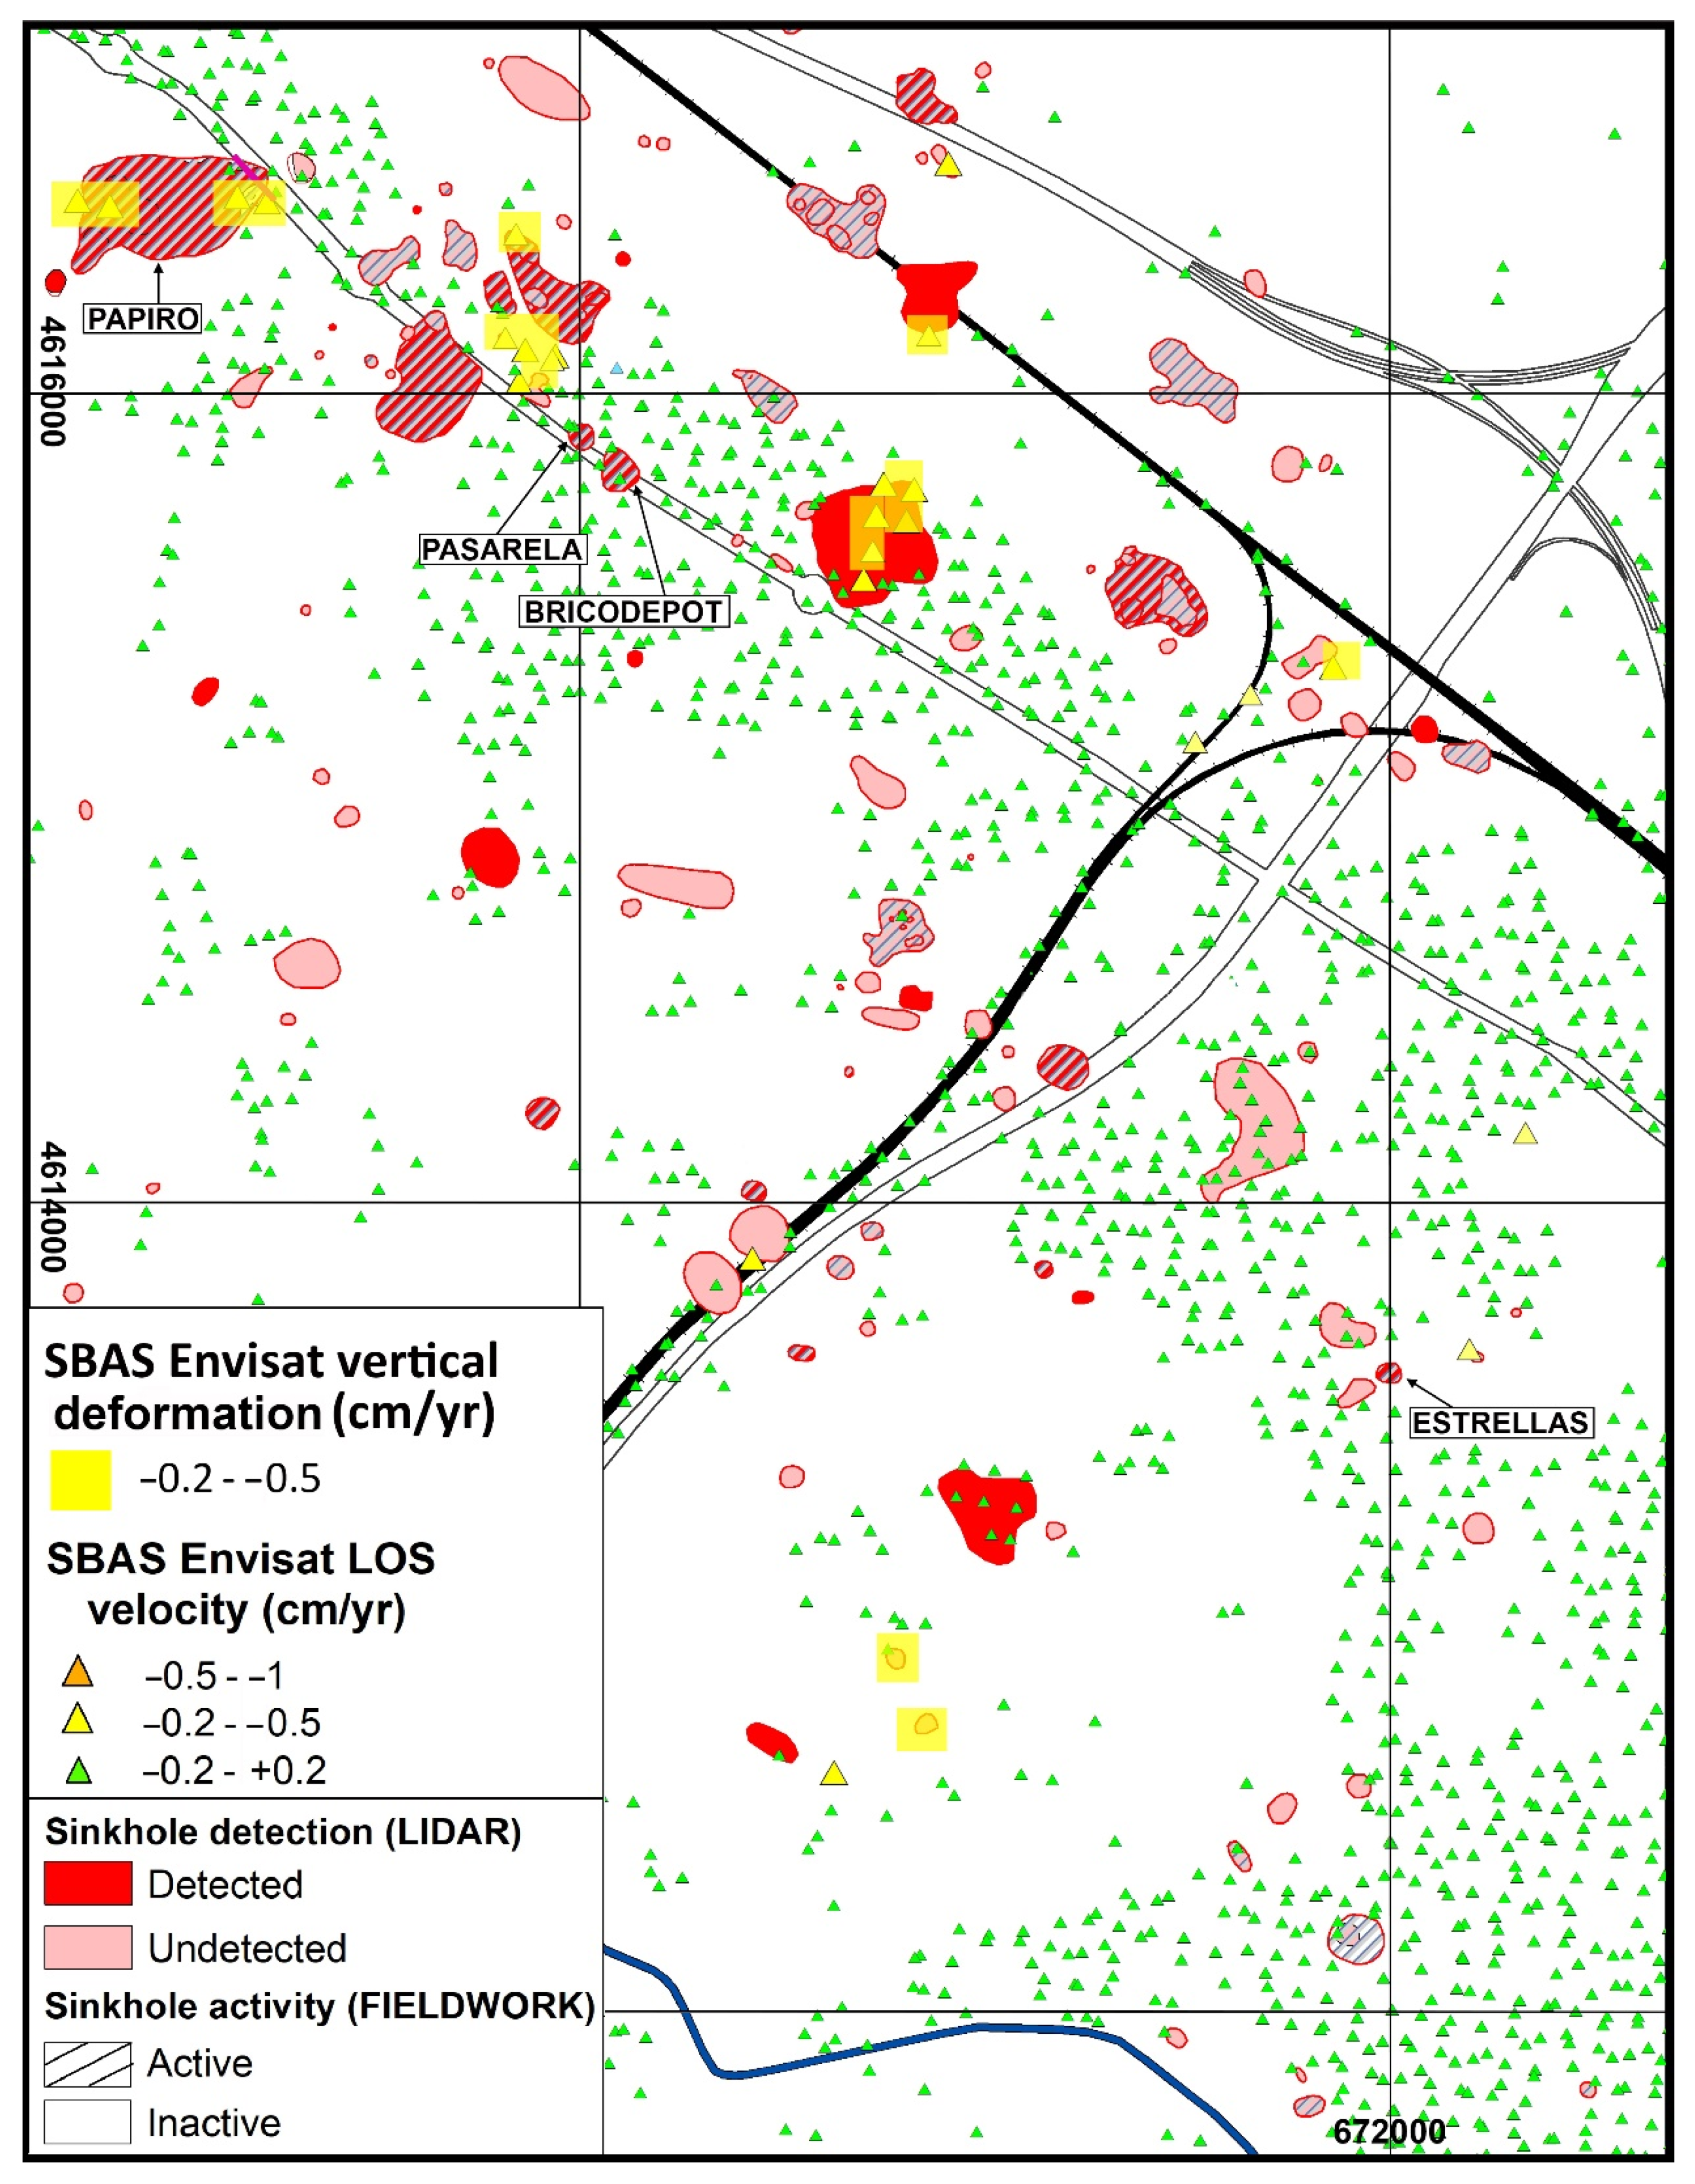
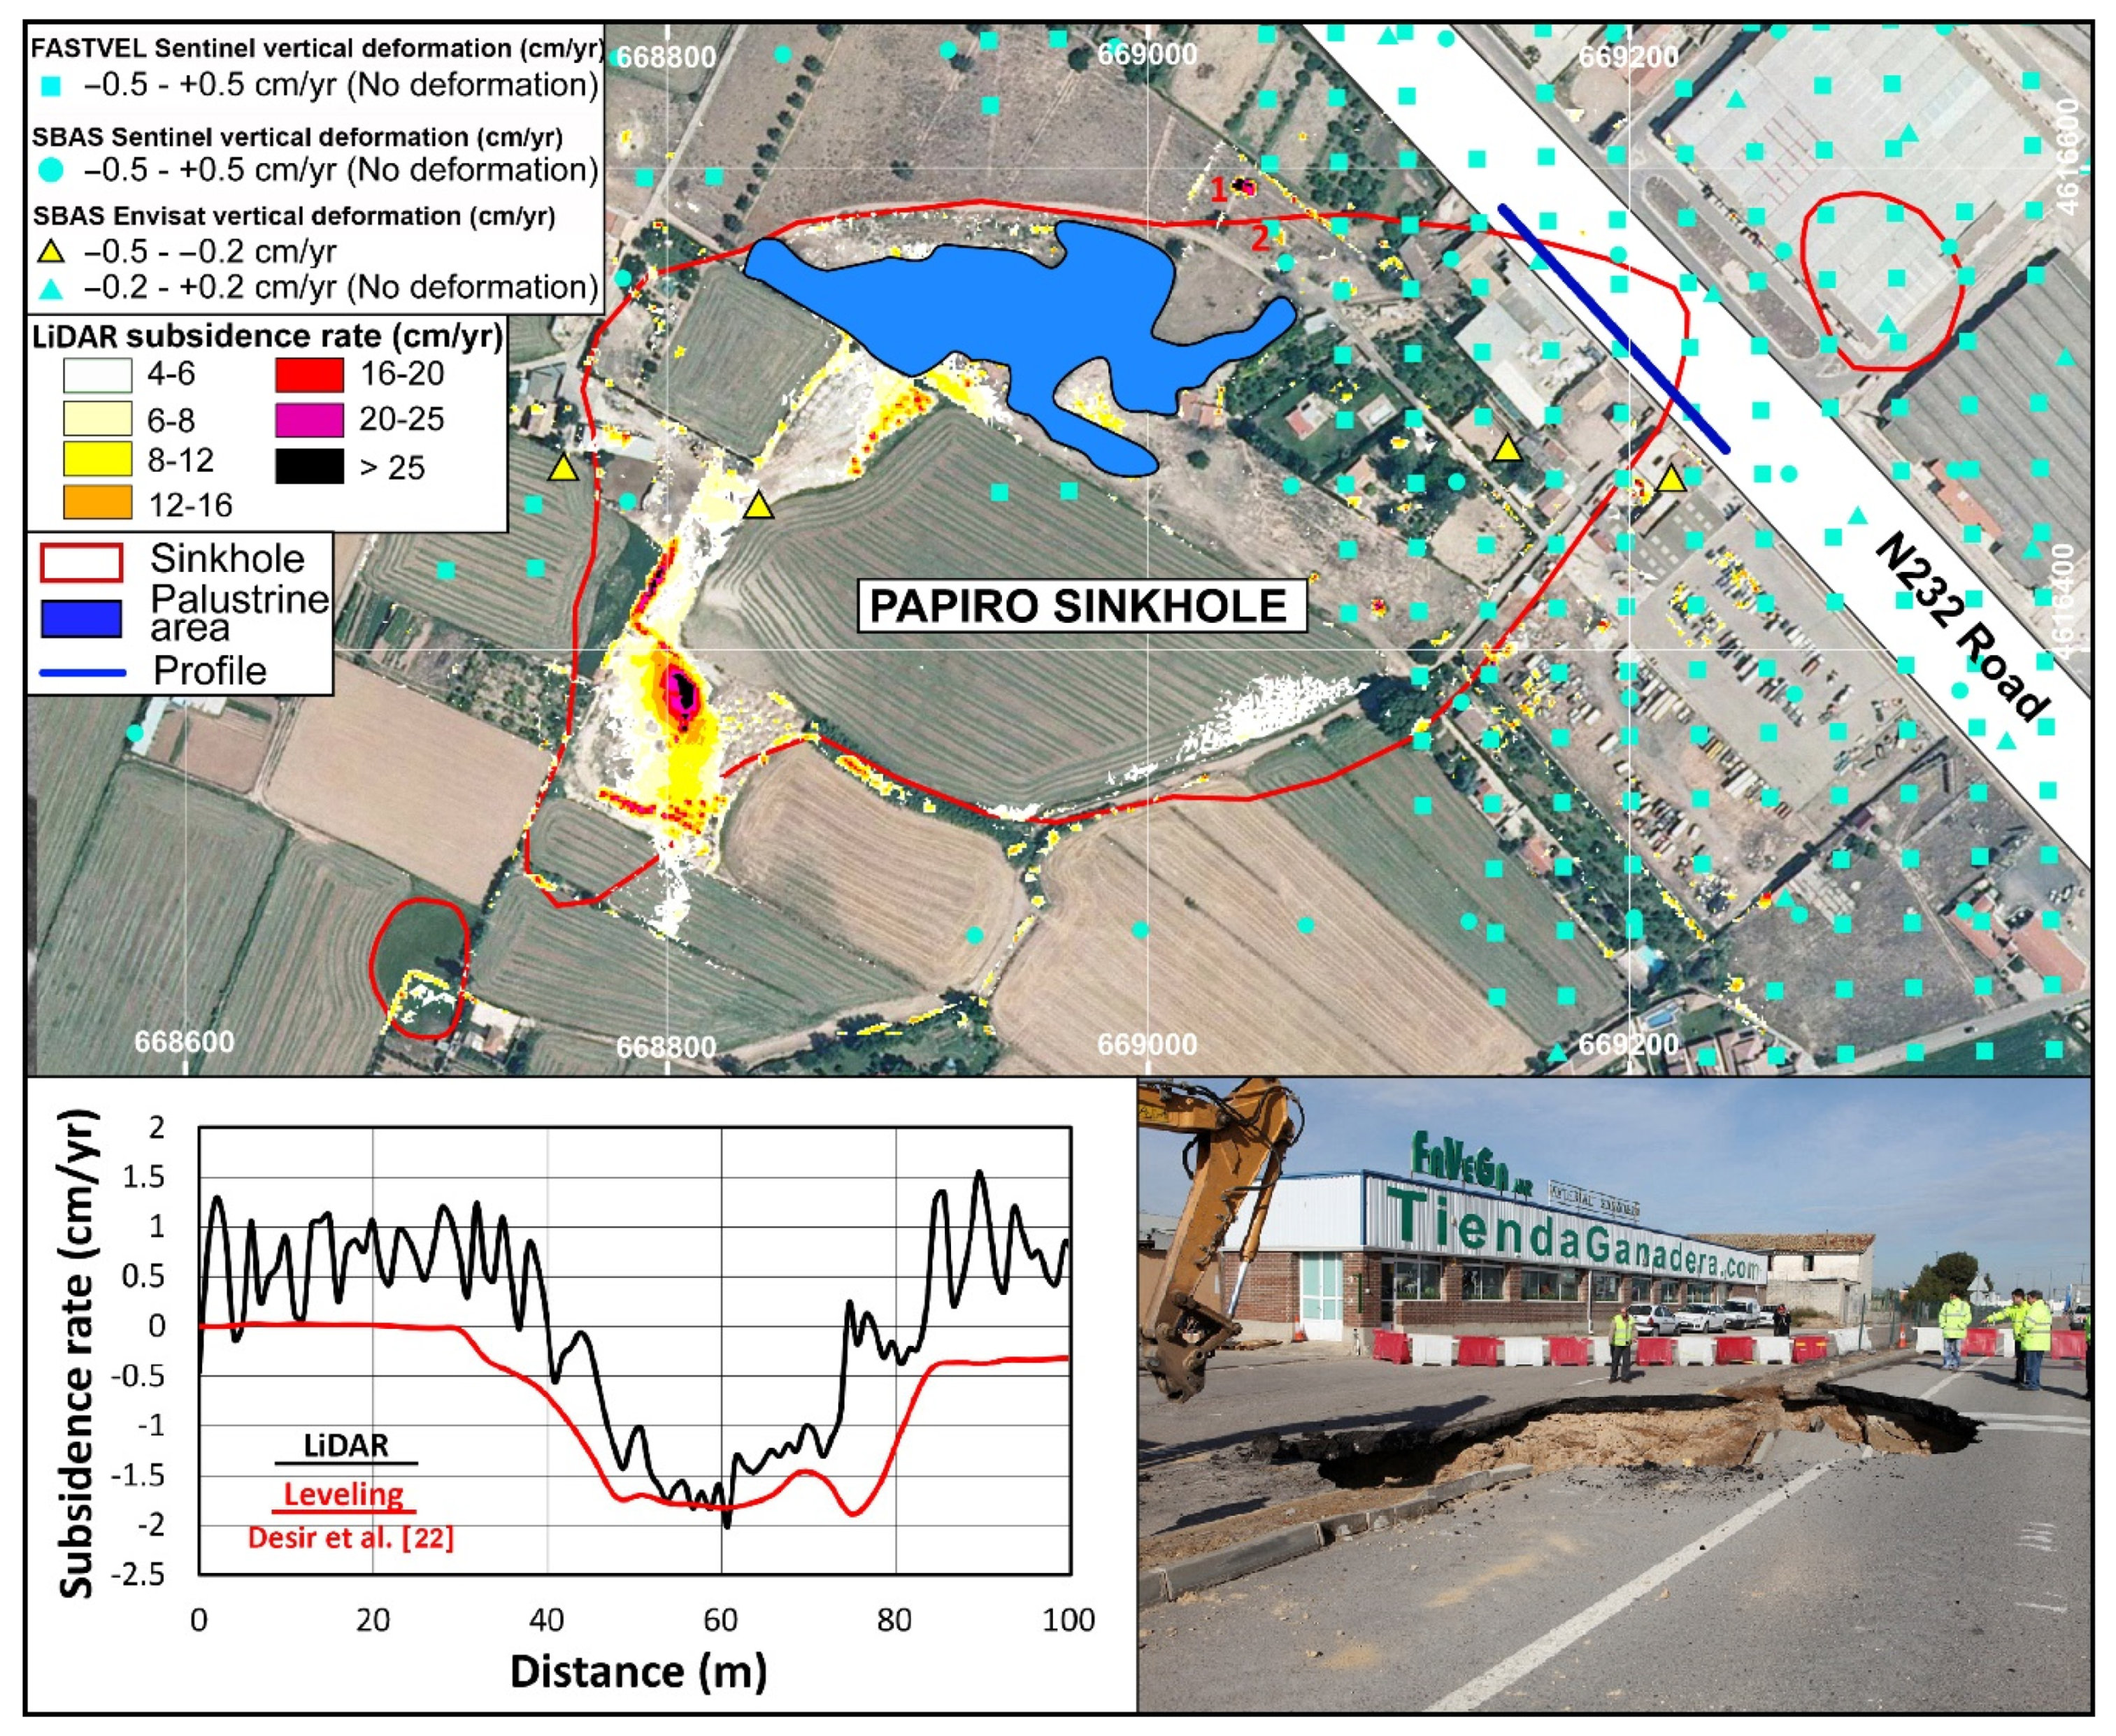
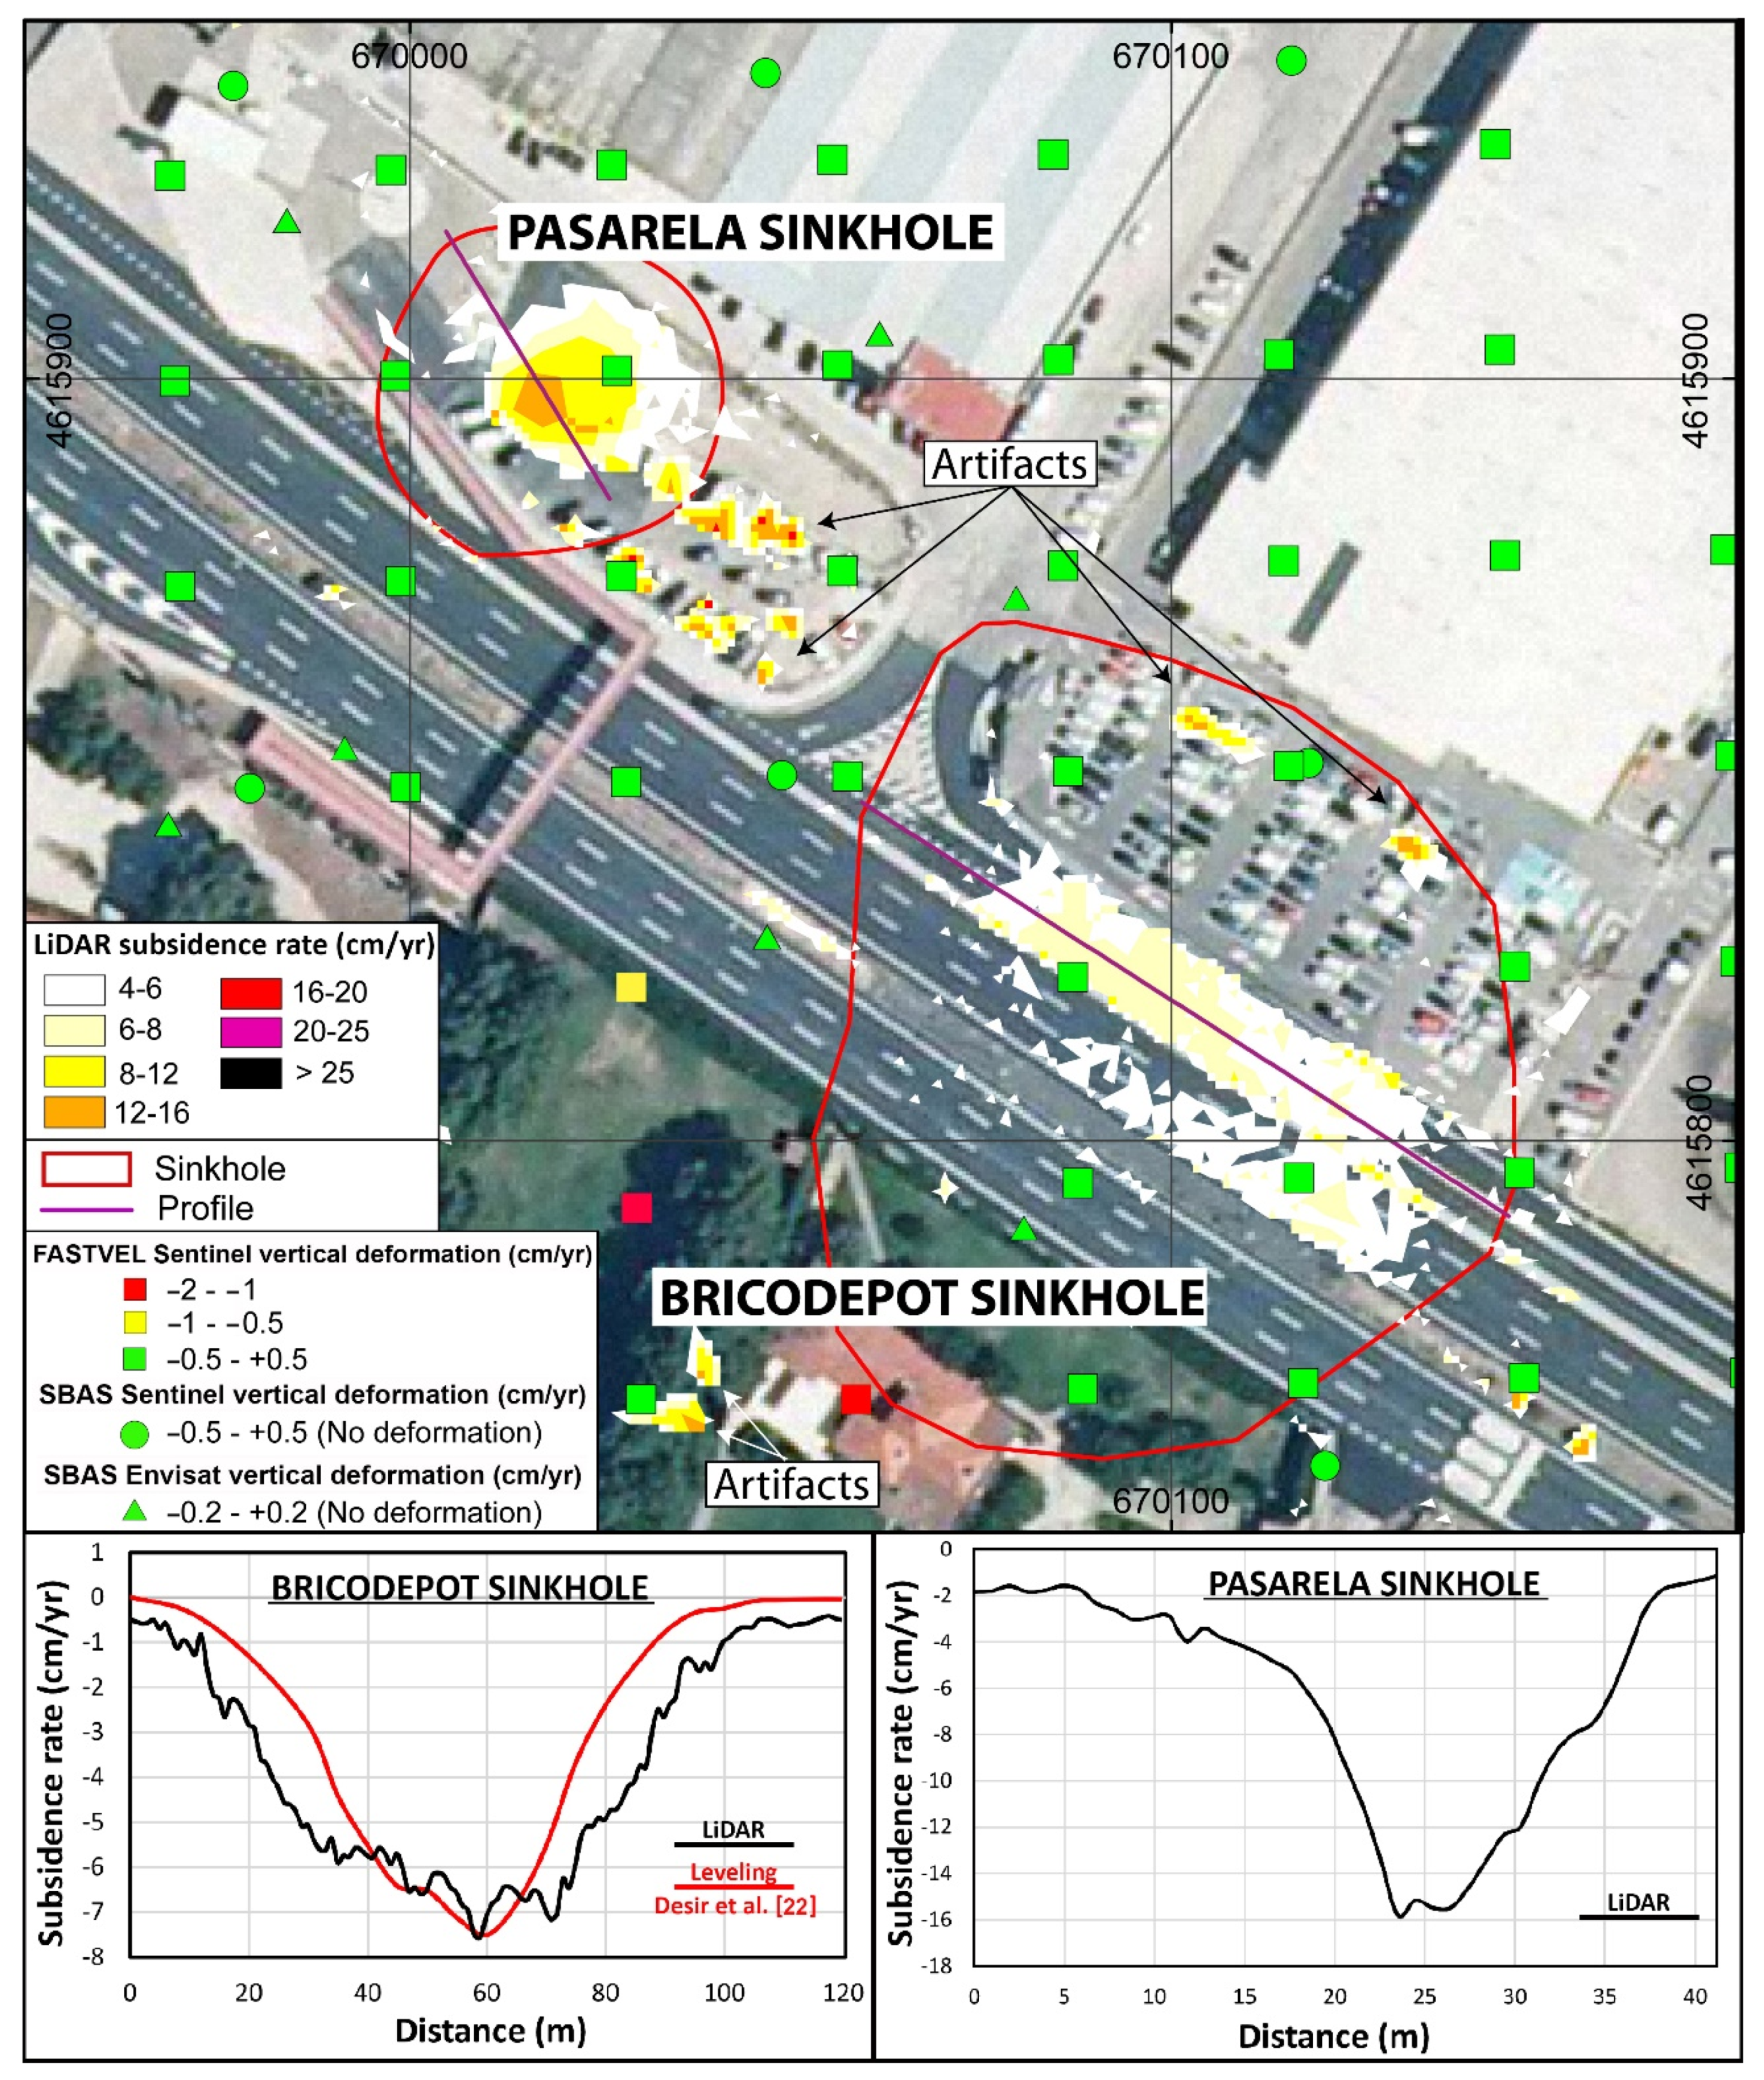
4.2. Zuera Sinkholes Site

The Zuera sinkholes site, located 29 km northeast of Zaragoza city (Figure 1), shows two large subsidence zones to the east of the Gállego River on T12 and T11 terraces [81] with areas of 286,000 and 143,000 m2, respectively (Figure 3).
The western sinkhole hosts an ephemeral saline wetland with salt crusts and rudimentary evaporation ponds used in the past for salt mining. Two water samples collected on 13 November 2016 yielded high concentrations of sodium chloride and calcium sulfate with total dissolved solids of 92 and 95 g/L (Table S4, Supplementary Materials). The water samples were saturated with respect to calcite and dolomite, close to saturation with respect to gypsum and anhydrite and still far from the equilibrium with respect to halite despite their high salinity, as determined by the PHREEQC model and Pitzer database [82]. The sodium-chloride hydrochemical facies of the water, unsaturated with respect to halite (saturation index of −1.5), and within a fluvial environment, clearly indicates that it is related to groundwater discharge from the evaporitic aquifer and that salt dissolution is occurring beneath the sinkhole. The subsidence depression shows a N-S elongated shape with an irregular northern margin due to sinkhole coalescence. It hosts several nested collapse sinkholes that contain permanent ponds. The eastern sinkhole is traversed by the A23 highway and the N230 road, which require frequent remediation works. The colonization village of Puilatos was built in 1956 around 500 m north of this sinkhole, was abandoned in 1975, and subsequently demolished due to severe subsidence damage [56]. The sinkhole can be recognized in aerial photographs taken in 1957 as a dry NW-SE-oriented enclosed basin used for cultivation. However, nowadays, because of the rapid subsidence rate, the topographic surface has intercepted the water table of the alluvial aquifer and hosts a permanent lake around 250 m in diameter. A water sample collected on 13 November 2016 yielded a salinity of almost 2 g/L, indicating some provenance from the halite bearing evaporitic aquifer affected by active dissolution (Table S4, supplementary Materials). The margins of the sinkhole in the crop fields are outlined by a swarm of arcuate fissures and meter-sized cover collapse sinkholes. A detailed map of the surface deformation features and a description of the deformation history of the sinkhole can be found in Desir et al. [22]. These authors installed a 450 m long leveling line across the sinkhole along the eastern edge of the N330 road with a spacing between benchmarks of 10 m. The cumulative subsidence profiles derived from their leveling data yielded a maximum subsidence rate of −16 cm/yr over a measurement period of 566 days, from 26 February 2015 to 14 September 2016 [22] (Figure 3).
The DoD shows a large number of artifacts associated with cropland boundaries and human excavations (Figure 3). Despite this limitation, it captures the areas affected by the dissolution-induced subsidence that are coherent with the surface deformation features recognized in the field and historical aerial photographs. In the western sinkhole, ground subsidence is detected along a NE-SW belt and in an area associated with the SE sector of the depression. Most of the recorded subsidence rates vary from −4 to −12 cm/yr, although local areas around the nested collapse sinkholes reach rates of up to −20 cm/yr. The eastern sinkhole shows increasing inward ground deformation values reaching −25 cm/yr at the most subsiding sector. The deformation extends across the A23 highway and the N230 road that subside at rates of up to −16 cm/yr, according to high-precision leveling data. Figure 3 shows a LiDAR subsidence rate profile drawn along the N230 road coinciding with the high-precision leveling line installed by Desir et al. [22]. Both vertical rate profiles show a similar pattern and comparable values, except for the most subsiding zone with a reverse shape in the two troughs. Considering the highest vertical displacement along the line and a time lapse of 2236 days between both flights, the maximum subsidence rate can be estimated at around −13 cm/yr, which is consistent with the rate of −16 cm/yr obtained by high-precision leveling [22]. This difference can be attributed to factors such as: (1) the much lower vertical accuracy of the LiDAR data, (2) the lower spatial resolution of the leveling data (10 m of spacing), and (3) the different monitoring periods and spans of both techniques (2236 days for Lidar and 566 days for leveling). Unexpectedly, the deformation pattern extends beyond the mapped southeast sinkhole edge, indicating a larger size for the depression. This ground-lowering trend was undetected in aerial photographs and field surveys and shows the potential effectiveness of the LiDAR data to improve the delineation of the edges of some active sinkholes.
The InSAR velocity maps provided different results. The SBAS Envisat map detected subsidence only on the eastern sector of the western sinkhole with negative vertical velocities lower than −1 cm/yr, while the eastern and fast-moving sinkhole was undetected. SBAS Sentinel maps in ascending and descending geometries and FASTVEL Sentinel maps in the descending geometry reveal maximum negative vertical velocities of −1 to −2 cm/yr on the central sector of the western sinkhole and −2 to −4 cm/yr along the A23 highway and N330 road at the eastern sinkhole. All of the InSAR processing approaches show a loss of coherence in agricultural lands and underestimate the rate and spatial distribution of the subsidence phenomenon. A detailed pixel-by-pixel subsidence rate comparison between the SBAS Sentinel vertical deformation map derived from the combination of the ascending and descending orbits (see Section 3) and the DoD map in a surface area of 9000 m2 along the A23 highway in the western sector of the sinkhole evidences that the average settlement of the highway was around 7 and 3.5 cm/yr·m2 for the DoD and InSAR, respectively (Figure 3). This means that the best InSAR cloud computing performance in the ascending and descending geometries underestimated subsidence by half (Table S5 and Figure S1, Supplementary Materials).

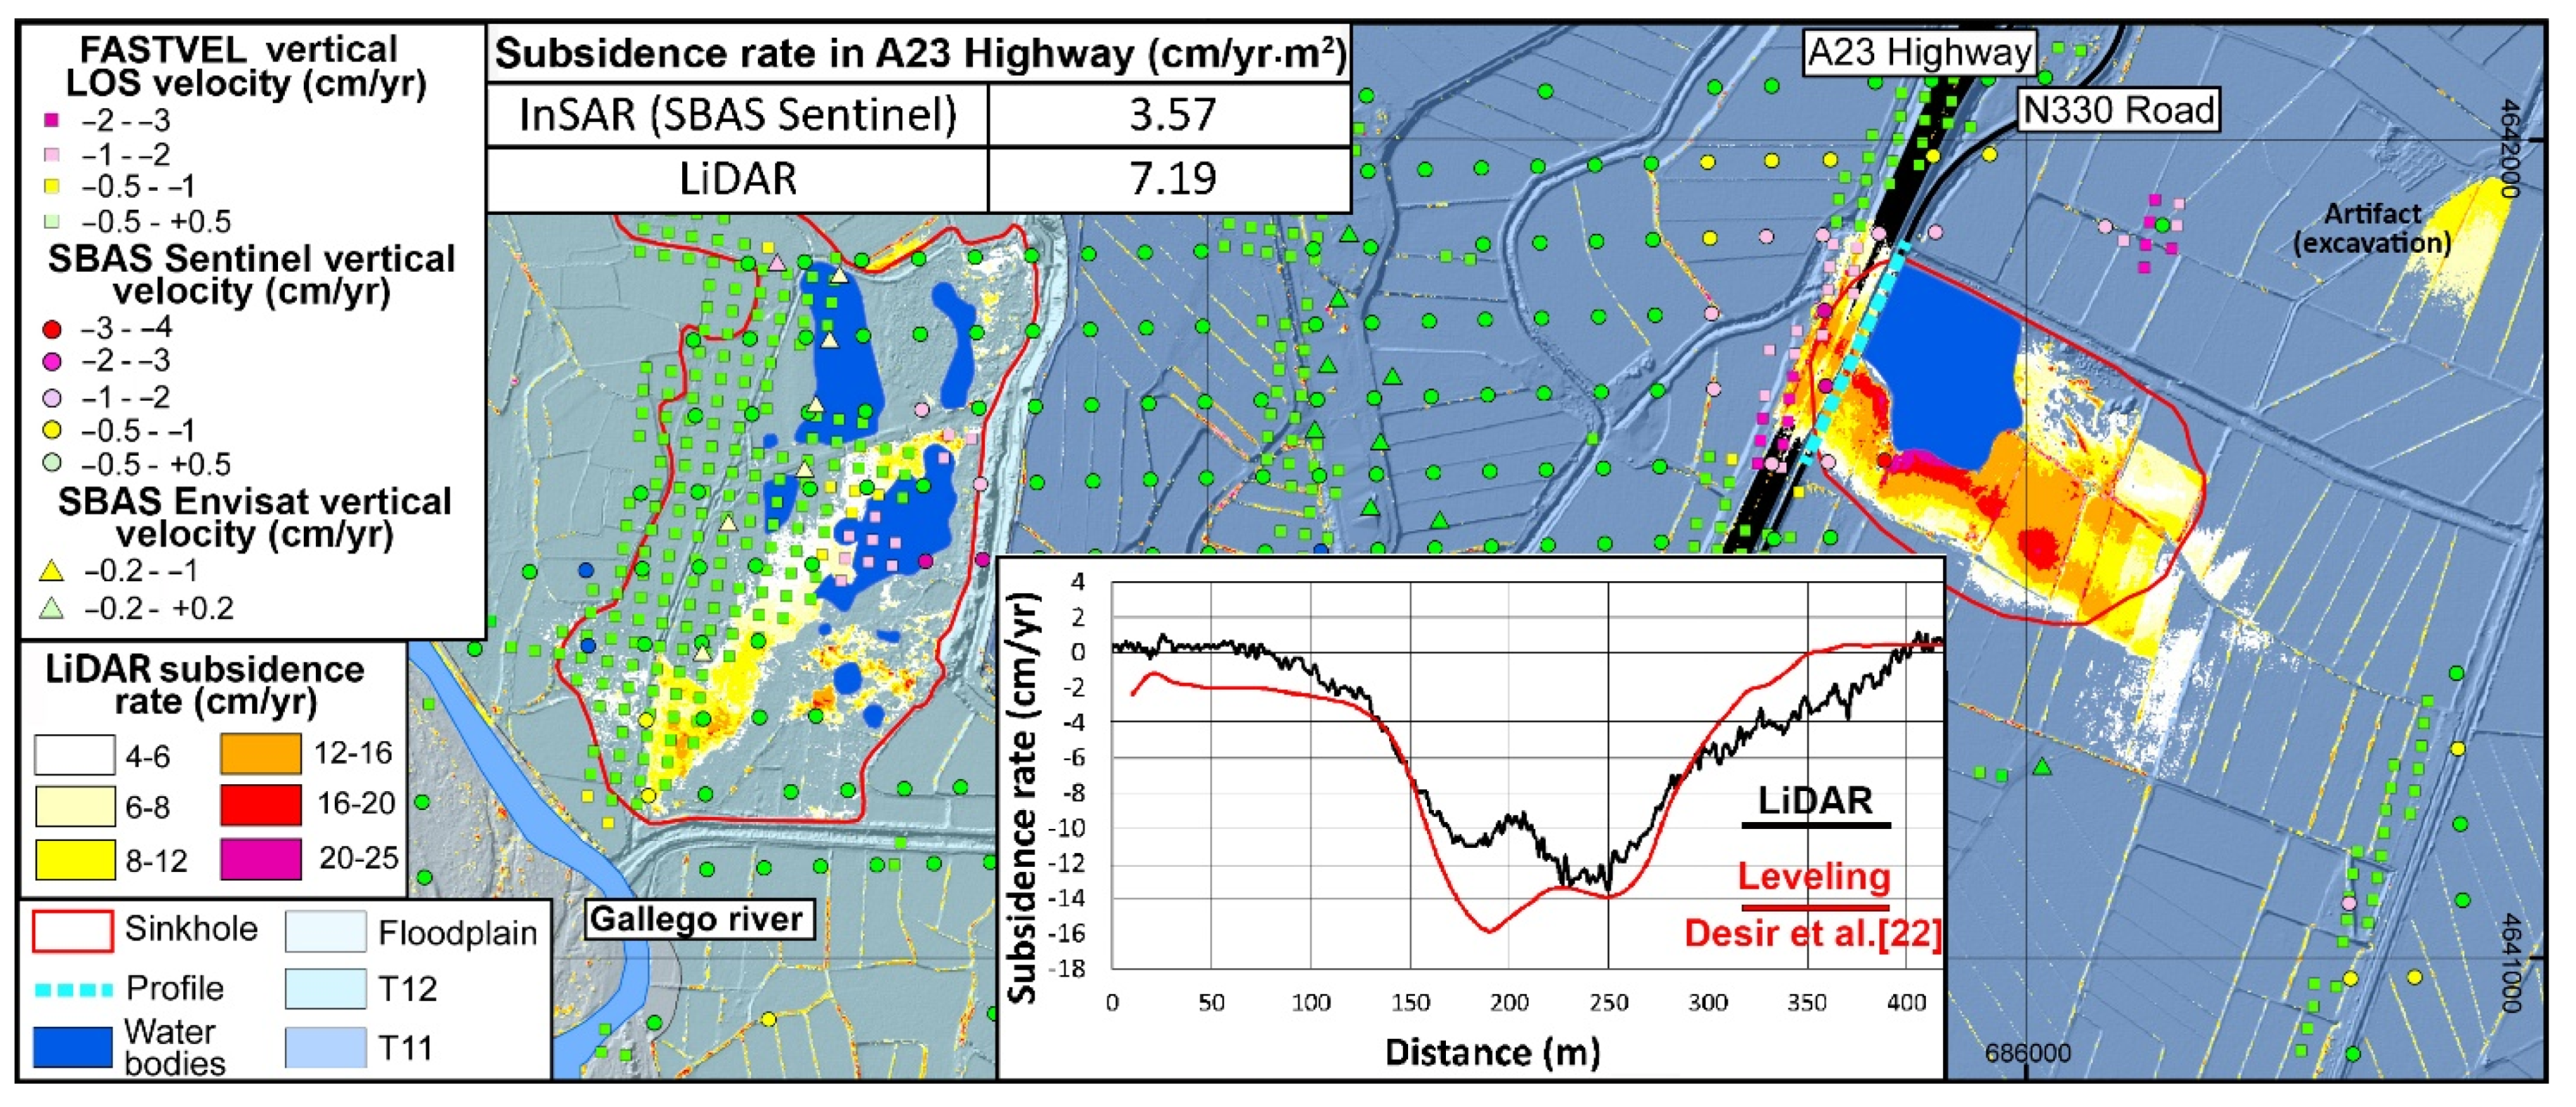
4.3. Active Sinkholes in the Ebro River Valley

The study area covers a stretch of 20 km of the Ebro River valley from Zaragoza city to the Jalón River (Figure 1). In this sector, the Ebro River has excavated a broad alluvial valley in the evaporitic Zaragoza Formation with a markedly asymmetric geometry, characterized by a prominent and linear gypsum escarpment on the northeastern margin and a stepped sequence of terraces and pediments on the opposite side [83]. Sinkhole development mainly occurs on the alluvium-covered areas and especially on the lowermost terraces affected by intensive irrigation [52,53]. The Imperial Canal that provides the majority of the diluted water to the alluvial-karst aquifer system, roughly defines the southern limit of the most sinkhole-prone areas (Figure 1). The sinkhole inventory map includes a total of 349 sinkholes that represent 1.77% (2.41 km2) of study area.
The performance of the LiDAR-derived displacement data and the InSAR velocity maps for the detection of active sinkholes is illustrated in Figure 1 and Table 1. The DoD suggests that 27.5% of the sinkholes (101 out of 349) show deformation rates over the detection limit established at −4 cm/yr. In contrast, the InSAR velocity maps indicate that a limited number of measuring points consistently indicate unstable areas with negative mean vertical displacement rates. SBAS Envisat, SBAS Sentinel and FASTVEL Sentinel maps permit the detection of 2, 6 and 6.5% of the sinkholes, respectively, with an increasing detection rate as both the time lapse between scenes and the pixel size decrease. Consequently, the FASTVEL processing approach has yielded the best performance, although with slight differences with the SBAS Sentinel approach. The effectiveness of open-source LiDAR data for sinkhole detection was up to 4 times higher than the best InSAR approach (Figure 1). The size of the sinkholes is a critical factor for InSAR detection since only those with unstable surface areas over 2300 m2 have been identified. This minimum detectable sinkhole area excludes a large proportion of the collapse or sagging sinkholes in the study area (171 out of 349; 48%).
The analysis of the detailed area framed in Figure 1 and depicted in Figure 4 illustrates the possibilities and limitations of the available LiDAR and InSAR data for identifying active sinkholes and assessing their kinematics in agricultural settings and infrastructures. This representative zone, with an area of 23.5 km2, is characterized by the occurrence of pre-existing sinkholes buried by man-made deposits that are responsible for the most severe subsidence damage on human structures. Based on conventional mapping using stereoscopic aerial images and fieldwork, 38 sinkholes out of 145 show clear signs of activity such as concentric cracking, damage on human structures or small collapses [3,64]. Obviously, the actual number of active sinkholes can be significantly larger since the conditions required for the identification of instability evidence are not always met.
The filtered dense point clouds of the LiDAR data unfortunately show a large number of artifacts that may be misinterpreted as small collapses and require a time-spending validation. However, it successfully identifies most of the active, fast-moving sagging sinkholes and compound depressions. Overall, it allows for the identification of 21 out of the 38 previously mapped active sinkholes of any type (sagging, collapse, or a combination of both) and size (small collapses to very large depressions), which represents a success rate of 57% (Figure 4). The undetected ones may correspond to slow-moving sinkholes with subsidence rates under the threshold limit (−4 cm/yr) and/or sinkholes that have experienced artificial changes between the first and second LiDAR flight.
On the contrary, LiDAR data help us to change the category of 14 sinkholes previously classified as potentially inactive and recognize 5 possible new subsidence areas that were not included in the sinkhole inventory. Subsequent field checking revealed that two out of the five potential sinkholes correspond to true dissolution-induced subsidence depressions, one remains uncertain due to lack of accessibility, and the remaining two are plots of land subject to elevation changes related to human alterations. The addition of detected active sinkholes by conventional mapping plus differential LiDAR equals 54 out of 145 sinkholes (37% of the sinkhole inventory). If we consider the total number of active sinkholes (conventional mapping plus differential LiDAR), the success rate of the DoD reaches 68%. These values reveal that: (1) LiDAR allows for the identification of sinkholes with subsidence rates over −4 cm/yr, (b) the combination of conventional mapping and LiDAR data allows one to expand the number of sinkholes classifiable as active, and (c) almost half of the sinkhole population shows signs of ongoing subsidence.
The InSAR maps generated with the SBAS Envisat, SBAS Sentinel and FASTVEL Sentinel algorithms only provide subsidence data for 6, 11 and 17 active sinkholes that represent 4, 7 and 12% of all the sinkhole inventory, respectively. Considering the totality of active sinkholes (conventional mapping plus LiDAR), the higher spatial resolution of FASTVEL maps showed the better performance, with a success rate of around 30%, although it was less efficient than LiDAR and conventional mapping alone. The lower performance can be attributed to the low InSAR data point coverage in cultivated lands, the small size of many sinkholes and the low spatial resolution of the InSAR maps [64]. In fact, all the sinkholes detected by InSAR correspond to very large compound sinkholes located in urbanized areas or along infrastructures rather than in agricultural terrains, due to the signal decorrelation in vegetated and non-developed environments.

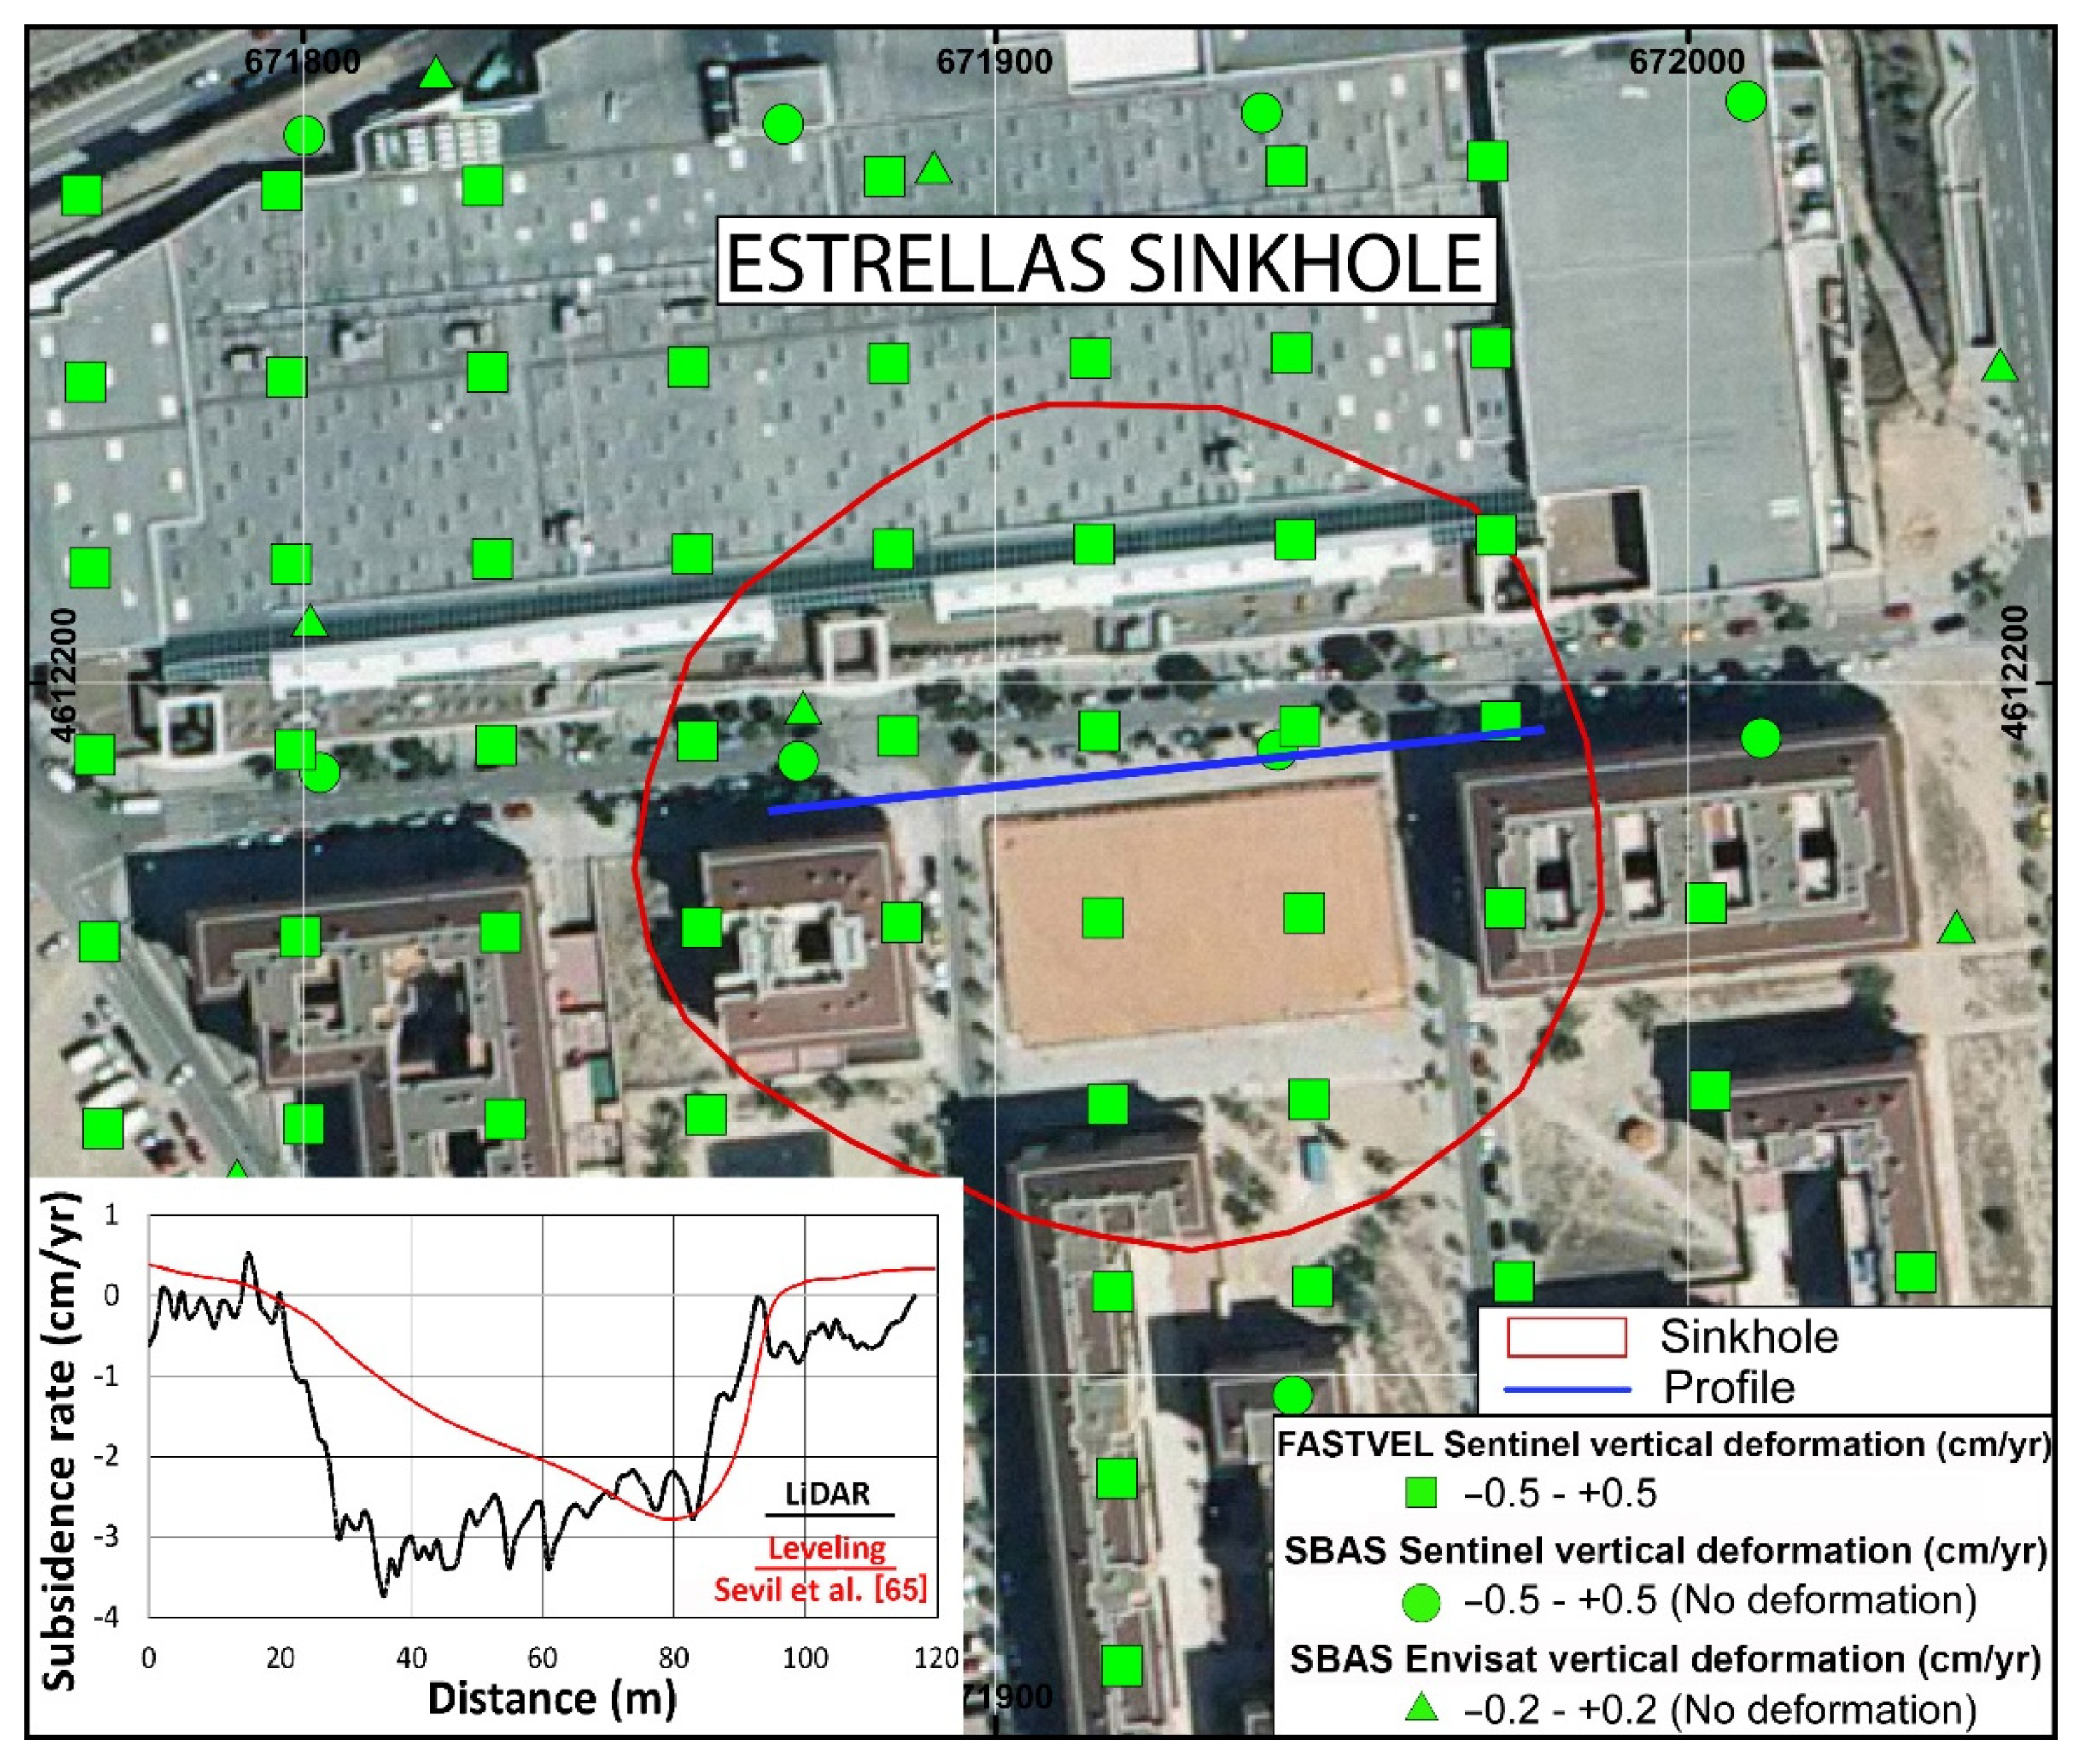
4.4. Measuring Subsidence Rates in Active Sinkholes

Figure 1 and Figure 4 shows the location of very active and damaging sinkholes. These are, from west to east: Papiro, Pasarela, Bricodepot and Estrellas sinkholes.
The Papiro sinkhole (Figure 5) is firstly recognized in the 1956 aerial image as a large, 130,000 m2 compound sinkhole comprising a large central depression and two other sinkholes that hosted several lakes. Since then, this compound sinkhole has been partially filled and several buildings have been built on top. The N232 road that runs across its NE sector has been interrupted several times because of the development of sudden collapses [22]. High-precision leveling data acquired along a 100 m long line with a spacing between benchmarks of 3 m (March 2015 to September 2016) yielded a maximum subsidence rate of −1.9 cm/yr [22]. LiDAR DEM subtraction evidences that the southwestern sinkhole and the large central compound depression are still active with subsidence rates of −6 and more than −25 cm/yr, respectively. The western sector of the larger depression is the most affected by subsidence that shows a distinct linear NW-SE deformation band. Although field evidence, precise leveling data and the development of recurrent collapse sinkholes demonstrate that the N232 road is affected by subsidence, the LiDAR displacement map does not capture deformation. A subsidence-rate profile along the leveling line surveyed by Desir et al. [22] shows a serrated pattern, with apparent uplift in the sinkhole margins and subsidence in the sinkhole with similar rates to those measured by leveling. The deviations can be ascribed to the re-asphalting of the road carried out after the occurrence of a collapse in 2013 (Figure 5). On the other hand, the deformation map also displays many artifacts mainly located in the northeastern sector of the large depression that are related to densely vegetated areas, a parking lot, cropland boundaries and anthropogenic fillings. Among them, only the two spots located at the northern margin of the compound sinkhole and labelled as 1 and 2 in Figure 5 were validated as small collapse sinkholes of 3 and 5 m in diameter in the 2018 orthoimage, revealing the limitations of open-source, low-resolution airborne LiDAR data for the automatic detection of small collapses. Unexpectedly, none of the InSAR velocity maps identify any ground deformation, pointing to the stability of the sinkhole site and the underestimation of the subsidence hazard.
The Pasarela and Bricodepot sinkholes site includes two very active and damaging sinkholes. The Pasarela sinkhole is a 1000 m2, 35 m across, circular depression that is causing severe damage to buildings, a parking lot, and an important water-supply pipe (Figure 6). The Bricodepot sinkhole is a 6500 m2, approximately 90 m across, sub-circular depression that affects a department store and its parking lot and the N232 road that requires continuous re-asphalting works. This sinkhole is already recognizable in the 1946 aerial images and was filled between 1957 and 1969 to build an industrial estate and the N232 road on top. Further details on the distribution of surface deformation features can be found in Desir et al. [22] and Benito-Calvo et al. [31]. Soriano and Simón [1] and Simón et al. [2] estimated a maximum subsidence rate of −12 cm/yr for the Bricodepot sinkhole using a home-made leveling device with a bubble level. Subsequently, high-precision leveling data acquired between March 2015 and September 2016 along the northern edge of the N232 road yielded a reliable maximum subsidence rate of −7.5 cm/yr [22]. Finally, the comparison of 3D point clouds obtained by a terrestrial laser scanner (TLS) every 4 months from October 2014 to April 2017 revealed subsidence with a complex spatial-temporal distribution with maximum subsidence rates of −15 and −8 cm/yr for the Pasarela and Bricodepot sinkholes, respectively, in agreement with the leveling data [31].
The DoD captures surface displacement in both sinkholes. In the Pasarela sinkhole, surface settlement seems to be concentrated in the parking lot and shows a concentric displacement pattern increasing towards the center. In contrast, in the Bricopedot sinkhole, the displacement model indicates subsidence mainly along the NE service road, where re-asphalting is carried out with a much lower frequency than that along the main carriageways. The subsidence-rate profiles generated from the displacement models provide maximum subsidence rates of −15 and −7.5 cm/yr for the Pasarela and Bricodepot sinkholes, which are coherent with the already published precise leveling and TLS data [22,31]. The subsidence-rate profile of the Bricodepot sinkhole shows higher subsidence rates along most of the profile than those obtained by high-precision leveling, suggesting a probable systematic error in the elevation data of the filtered LiDAR data. Unfortunately, the LiDAR data only detects ground deformation around the central sector of the sinkholes affected by higher subsidence. However, field mapping, leveling data, and TLS deformation maps indicate that subsidence extends towards the sinkhole edges, although at progressively lower rates. This important limitation is related to the detection limit of −4 cm/yr established for the LiDAR data due to vertical precision limitations. Artifacts are associated with vehicles and dense vegetation and appear as small patches distinguishable from the consistent deformation patterns of the sinkholes (Figure 6). Once again, the SBAS Envisat, and SBAS and FASTVEL Sentinel processing approaches were not able to identify ground deformation in any of the sinkholes. However, the FASTVEL map depicted three deformation points outside the southwestern boundary of the Bricodepot sinkhole that might be related to incipient subsidence and sinkhole growing direction.
Finally, the Estrellas sinkhole is a 2000 m2, 120 m across, sub-circular depression located in a suburb of Zaragoza city (Figure 7). It has a long history (since the 1960s) of anthropogenic filling, building construction, damage, and demolition [3]. At the present time, a multi-story building at the eastern sector is affected by severe damage [65]. The age of the anthropogenic sinkhole fillings exposed in two trenches excavated in the central sector of the sinkhole across fault scarps results in a minimum average displacement rate between −1.2 and −1.8 cm/yr for a poorly constrained time lapse between 1956 and 1997. Moreover, the vertical displacement of human structures allowed Gutiérrez et al. [57] to estimate rough subsidence rates of −3 cm/year. High-precision leveling data acquired between January 2017 and February 2019 across the sinkhole along an east-west direction yielded a maximum subsidence rate of around −2.5 cm/yr [65]. Neither the DoD nor any of the InSAR velocity maps detected deformation, erroneously suggesting that the area is stable. However, the subsidence-rate profile across this sinkhole yields a maximum lowering rate of around −3.5 cm/yr, which compares well with the leveling data and displacement measurements from human structures, although with a contrasted different geometry and an overestimation of the subsidence in its western sector related to the limitations of the LiDAR-derived displacement models. The Estrellas sinkhole is a good example of the drawbacks of the DoD for the detection of slow-moving active sinkholes in urban areas where the filtering of the point clouds in order to reduce artifacts obliterates relevant subsidence information.

5. Discussion

5.1. Advantages and Limitations of Airborne LiDAR and Web-Based InSAR Processing Tools

The results presented in this paper highlight the potential utility of multi-temporal airborne LiDAR data for the detection of active sinkholes and the assessment of subsidence rates. Nevertheless, there were several limitations derived from the acquisition of the LiDAR data. Firstly, the quality of the LiDAR-derived displacement maps depends on the land cover, offering better results in agricultural terrains and along infrastructures, rather than urbanized areas. Secondly, the low precision, with a vertical displacement threshold of ±25 cm only allows for the detection of fast-moving sinkholes with subsidence rates over −4 cm/yr. In the closest area to Zaragoza city, the proportion of active sinkholes captured by differential LiDAR was 21 out of 38 (success rate of 57%), which represents only half of the previously mapped active sinkholes using conventional methods. On the contrary, it permitted the identification of the most damaging sinkholes, the discovery of 2 new non-inventoried active sinkholes and the re-classification of 14 sinkholes as active. In addition, the effectiveness of multi-temporal LiDAR datasets to roughly estimate subsidence rates is demonstrated by the consistency between the subsidence-rate profiles derived from LiDAR and from high-precision leveling data. It is important to stress that the approach has been applied in a very favorable area in which a significant proportion of the sinkholes are affected by rapid and progressive sagging subsidence related to the dissolution of salt-bearing evaporites. The performance of the method would be much worse in karst areas with slow-moving sinkholes and/or characterized by episodic displacement, which is a more common situation (e.g., carbonate karsts).
The type and size of the sinkholes had a significant impact on the results. Active sagging sinkholes and large compound depressions are identified thanks to their concentric deformation pattern with increasing subsidence rates towards their center and linear troughs. However, the technique displays significant limitations in the identification of small collapses. The large number of artifacts associated to vehicles, densely vegetated areas, steep slopes, road embankments, cropland boundaries and anthropogenic fillings led to numerous false positives and an overestimation of the number of potential collapse sinkholes. Consequently, every small site with apparent subsidence had to be validated with the help of high-precision orthoimages or fieldwork. This is very time-consuming work that requires a specialist with knowledge of the subsidence phenomena and, specifically, the existence of a previous cartographic sinkhole inventory.
The results obtained from the InSAR cloud computing approaches only provide ground motion due to karst subsidence in some specific cases, either in ascending or descending orbits. Among the different algorithms, the FASTVEL maps provided the best detection rate around Zaragoza city (30% of all the active sinkholes) and was the only InSAR approach able to capture displacement within some of the most damaging sinkholes of the analyzed area. These results indicate that the FASTVEL approach yielded the best performance among the GEP web-based InSAR tools, but it was still low compared with conventional sinkhole mapping and differential LiDAR. Considering that subsidence rates in many sinkholes do not vary significantly with time due to their sagging behavior [1,2,22,23,31,65], the success of each InSAR web-algorithm in sinkhole detection is apparently dependent on the processing of the SAR images, rather than on the monitoring period. Based on the characteristics described for every processing approach (Tables S1–S3, supplementary Materials), the processing interferometry technique (DInSAR versus PSInSAR) is not a critical variable. In contrast, as expected, sinkhole detection slightly improves with the finer spatial resolution of the SAR images and mainly with the frequency of acquisitions (shorter time interval between images) that allows for reducing the decorrelation between images [84]. Based on our results, large-temporal SAR interferograms cannot measure those sinkholes with the highest subsidence rates. Previous DInSAR velocity maps of the study area with a pixel size between 20 to 90 m obtained from 27 ERS, 29 Envisat and 13 ALOS SAR images processed by the SBAS and SPN (Stable point Network) approaches captured between 4 and 25% of the active sinkholes [58]. These values, which are similar to the ones obtained in this study, highlight the difficulties of InSAR techniques in easily identifying active sinkholes in the mantled karst of the Ebro Valley. Several constrains inherent to InSAR data may explain this very low detection proportion in the study area: (a) Decorrelation in agricultural terrains due to vegetation and surface changes. In fact, the majority of the identified sinkholes were located in urbanized areas. This is an important factor in the study area since irrigation lands cover more than 80% of the Ebro River valley. (b) The low spatial resolution of the SAR models that precludes the detection of the small sinkholes. A 20 m spatial resolution SAR image is unlikely to confidently detect sinkholes less than 100 m in diameter [85,86], and recent studies demonstrate that only SAR images with a very high resolution (pixel resolution ranging between 25 cm and 3 m of TerraSAR-X and COSMO-SkyMed satellite images) are able to identify sinkholes several meters across [25,87,88]. Unfortunately, the 40 m pixel resolution velocity maps of the FASTVEL approach that shows the better performance were useful only for the detection of unstable surface areas over 2300 m2. This minimum detectable sinkhole area excludes almost half of the small collapse and sagging sinkholes of the study area (171 out of 349; 48%), and so only the largest ones were detected. (c) A significant loss of coherence over time caused by severe ground deformation related to fast-moving sinkholes [89,90]. Thus, although InSAR cloud computing approaches are a great advance in the analysis of Earth surface processes, our results indicate that these tools are not as effective as other methods in the Ebro Valley, where resources such as LiDAR DEMs and historical aerial photographs and topographic maps are available.

5.2. Implications of InSAR Cloud Computing and Differential LiDAR in Sinkhole Risk Management

Subsidence damage in the study area mainly occurs within the boundaries of pre-existing sinkholes that depict continuous long-sustained subsidence activity [3,58,59,61]. Therefore, the exclusion for the construction of the areas affected by subsidence and their vicinity would be the most effective mitigation measure. Unfortunately, this preventive planning strategy was not implemented in the study area, and a large number of sinkholes have been filled and obliterated by human activities to build infrastructures and buildings. In these cases, our results support the fact that differential LiDAR on regional and local scales is more advantageous than InSAR cloud computing products when detecting dissolution-induced subsidence mainly due to the higher spatial resolution of the LiDAR displacement maps. Consequently, differential LiDAR could be a useful tool for sinkhole risk assessment and management. Unlike conventional techniques that require the performance of time-consuming tasks (e.g., mapping, geodetic surveying), multi-temporal LiDAR datasets can remotely provide sinkhole-related displacement data at a relatively low cost over large areas, such as: (1) the location of the most rapid and damaging sinkholes, (2) the highest subsidence rates of particular sinkholes, (3) the spatial variability of subsidence within the large sinkholes and compound depressions differencing the active and inactive sectors, (4) the potential growing trend of sinkholes outside their boundaries that might forecast future damaged areas, and (5) the identification of new and non-inventoried sinkholes.
Unfortunately, the vertical accuracy inherent to the altitude acquisition of the airborne LiDAR data prevents the detection of slow-moving sinkholes and the precise mapping of the sinkhole edges. In most cases, differential LiDAR provides an incomplete picture of the active subsidence areas. Those subsidence areas affected by lower subsidence rates than the LiDAR detection threshold entail a hazard underestimation. The results indicate that LiDAR displacement models overlook around 40% of the inventoried active sinkholes due to their low ground motion rate or the existence of anthropogenic fillings. Consequently, LiDAR should not be considered an alternative to classical mapping methods, but a highly useful complementary approach to improve and upgrade sinkhole inventories and identify the most-damaging subsidence areas. On the other hand, LiDAR deformation maps compared with TLS, leveling or trenching techniques do not define the boundaries of the areas affected by subsidence, but only those sectors with adequate conditions and moving over the vertical detection limit. These maps clearly underestimate the set-back distance for any particular sinkhole that is a critical parameter for land-use planning [59], and they should be complemented by other more precise ground-based techniques. Nevertheless, these differential LiDAR constraints on sinkhole activity assessment could be substantially overcome through: (1) The increase in point densities by reducing the altitude of the flights, at the expense of a higher cost. This would increase the vertical accuracy of the data and would decrease the detection threshold, favoring the identification of slow-moving sinkholes. (2) The acquisition of flights with a shorter re-visiting time in order to recognize ground surface alterations caused by human activities and assess the potential spatio-temporal changes in sinkhole subsidence rates. (3) The improvement of open-source point cloud classification algorithms that might reduce the amount of artifacts to upgrade the automatic identification of small collapses and the detection of sinkholes in urbanized and densely vegetated areas. Unfortunately, although open-source filtering algorithms have a good overall performance with around an 80% success rate [71,72], their application for sinkhole detection still leads to a large number of false positives and negatives.
Given the limitations of differential LiDAR to detect slow-moving sinkholes and measure subsidence in urban areas where InSAR can have a high performance, the application of both techniques can be compatible and InSAR analyses may complete differential LiDAR studies processing high-resolution X-band SAR images. Since the GEP results almost reach the detection capability of previous InSAR analysis using Envisat images at full resolution [58], InSAR cloud computing can be a useful tool to firstly explore karst regions to get a first impression of sinkhole activity where there is not a deep knowledge of karst subsidence. However, based on the InSAR web-tools performance in the Ebro Valley, the detected subsidence in other areas might only represent a small part of the real situation mainly because of the low spatial resolution of the InSAR velocity maps. Thus, InSAR cloud computing results should not be directly used to assess sinkhole hazards on a regional or local scale alone but they can be a good initial reference for further detailed studies using other methodologies.

6. Conclusions

The subtraction of DEMs derived from multi-temporal, open-access, low-resolution airborne LiDAR data has resulted in a very useful and cost-effective methodology for the detection of active sinkholes in the mantled evaporite karst of the Ebro Valley (NE Spain). Active sagging sinkholes and large compound depressions are easily identified by differential LiDAR thanks to their concentric deformation pattern with increasing subsidence rates towards their center and/or the occurrence of linear troughs. In these types of sinkholes, LiDAR vertical displacement maps provided important information about the location of the most active sectors, their growing trend and their highest subsidence rates based on the consistency between leveling and LiDAR subsidence profiles. Unfortunately, the technique displays significant limitations in the identification of small collapses that are normally overlooked and often interpreted as artifacts, the detection of slow-moving sinkholes and the precise mapping of the sinkhole edges. Despite these limitations, the DoD maps show that around 30% of the sinkhole population in a 135 km2 sector of the Ebro Valley (101 out of 349) shows signs of ongoing subsidence with subsidence rates over −4 cm/yr. These results support the implementation of free-source airborne LiDAR in sinkhole hazard mitigation programs in evaporite karst terrains where a significant proportion of the sinkholes are affected by rapid and progressive sagging subsidence.
SBAS Envisat, SBAS Sentinel and FASTVEL Sentinel maps permit the detection of 2, 6 and 6.5% of the sinkhole population, respectively, with an increasing detection rate, as both the time lapse between scenes and the pixel size decrease. Consequently, the FASTVEL processing approach yielded the best performance, although with slight differences compared to the SBAS Sentinel approach. These results evidence that the capability of airborne LiDAR data for sinkhole detection in the study area was up to four times higher than the best performance of the FASTVEL and SBAS Sentinel approaches that underestimated the number of active sinkholes. In addition, a pixel-by-pixel comparison between the DoD and the SBAS Sentinel vertical deformation maps in the Zuera Sinkholes site shows that the best GEP InSAR performance underestimates subsidence rate by a factor of two. The low detection proportion of InSAR cloud computing tools is mainly related to the low spatial resolution of the SAR models that precludes the detection of the small sinkholes. Thus, although InSAR cloud computing approaches are a great advance in the analysis of Earth surface processes and can complement LiDAR data to detect slight subsidence areas (mm/yr) in urban areas, our results indicate that, as of today, Web-InSAR tools are not as effective as differential LiDAR or conventional mapping for the detection of active sinkholes.

Supplementary Materials

The following are available online at https://www.mdpi.com/article/10.3390/rs13163261/s1, Figure S1: Vertical deformation rate of the InSAR data obtained from the 2019–2021 sentinel-1 images and the SBAS Sentinel approach Figure S2: LOS velocity and vertical deformation rates of the detailed area around Zaragoza city from the 2003–2010 Envisat SAR images and the SBAS Envisat approach, Figure S3: LOS velocity and vertical deformation rates of the detailed area around Zaragoza city from the 2019–2021 Sentinel-1 SAR images and the FASTVEL Sentinel approach, Table S1: Main characteristics of the SAR Envisat Dataset processing and surface velocity maps, Table S2: Main characteristics of the SAR SBAS Sentinel Dataset processing and surface velocity maps, Table S3: Main characteristics of the SAR FASTVEL Sentinel Dataset processing and surface velocity maps, Table S4: Chemical composition, total dissolved solids (TDS), alkalinity (Alk) and saturation indexes (si) performed with the PHREEQC software and the Pitzer database for the Zuera sinkholes water samples, Table S5: Average vertical rates derived from the InSAR and DoD maps along the A23 Highway in Zuera Sinkhole site.

Author Contributions

All the authors participated in editing and reviewing the manuscript. J.G. and J.S. were mainly responsible for the processing of the LiDAR data. J.G., J.P.G. and C.R.-C. were in charge of the acquisition and processing of the SBAS and FASTVEL InSAR velocity maps from the GEP web page. G.D., F.G., Á.G.A. participated in the production of maps and contributed significantly to collecting and interpreting the data. All authors have read and agreed to the published version of the manuscript.

Funding

This research has been supported by MINISTERIO DE CIENCIA, INNOVACIóN Y UNIVERSIDADES, GOBIERNO DE ESPAñA, project CGL2017-85045-P. We thank Terradue and the ESA Network of Resources (NoR) sponsorship for providing access to the Geohazards Exploitation Platform (GEP), for InSAR cloud processing. J.S. has a pre-doctoral contract cofinanced by the Spanish Government and the European Social Fund.

Institutional Review Board Statement

Not applicable.

Informed Consent Statement

Not applicable.

Data Availability Statement

All data used in this study can be downloaded for free. Lidar Data can be downloaded from the official website of the Spanish National Geographic Institute (IGN, https://centrodedescargas.cnig.es/CentroDescargas/index.jsp, accessed on 17 August 2021). InSAR Sentinel images can be downloaded from the Geohazard Exploitation Platform (GEP, https://geohazards-tep.eu/#!, accessed on 17 August 2021).

Conflicts of Interest

The authors declare no conflict of interest.

References

  1. Soriano, M.A.; Simón, J.L. Subsidence rates and urban damages in alluvial dolines in the Central Ebro basin (NE Spain). Environ. Geol. 2002, 42, 476–484. [Google Scholar]
  2. Simón, J.L.; Soriano, M.A.; Arlegui, L.E.; Gracia, F.J.; Liesa, C.L.; Pocoví, A. Space–time distribution of ancient and active alluvial karst subsidence: Examples from central Ebro Basin, Spain. Environ. Geol. 2008, 53, 1057–1065. [Google Scholar] [CrossRef]
  3. Galve, J.P.; Gutiérrez, F.; Lucha, P.; Bonachea, J.; Remondo, J.; Cendrero, A.; Gutiérrez, M.; Gimeno, M.; Pardo, G.; Sánchez, J. Sinkholes in the salt-bearing evaporite karst of the Ebro River valley upstream of Zaragoza city (NE Spain). Geomorphological mapping and analysis as a basis for risk management. Geomorphology 2009, 108, 145–158. [Google Scholar] [CrossRef]
  4. Guerrero, J.; Gutiérrez, F.; Galve, J. Large depressions, thickened terraces and gravitational deformation in the Ebro River valley (Zaragoza area, NE Spain). Evidence of glauberite and halite interstratal karstification. Geomorphology 2013, 196, 162–176. [Google Scholar] [CrossRef]
  5. Rahimi, M.; Alexander, E.C. Locating sinkholes in LiDAR coverage of a glacio-fluvial karst, Winona County, MN. In NCKRI Symposium 2, Proceedings of the 13th Multidisciplinary Conference on Sinkholes and the Engineering and Environmental Impacts of Karst, Carlsbad, NM, USA, 22 May 2013; Land, L., Doctor, D.H., Stephenson, J.B., Eds.; National Cave and Karst Research Institute: Carlsbad, NM, USA, 2013; pp. 469–480. [Google Scholar]
  6. Filin, S.; Baruch, A.; Avni, Y.; Marco, S. Sinkhole characterization in the Dead Sea using airborne laser scanning. Nat. Hazards 2011, 58, 1135–1154. [Google Scholar] [CrossRef]
  7. Panno, S.V.; Luman, D.E. Characterization of cover-collapse sinkhole morphology on a groundwater basin-wide scale using lidar elevation data: A new conceptual model for sinkhole evolution. Geomorphology 2018, 318, 1–17. [Google Scholar] [CrossRef]
  8. Gökkaya, E.; Gutiérrez, F.; Ferk, M.; Görüm, T. Sinkhole development in the Sivas gypsum karst. Turkey. Geomorphology 2021, 386, 107746. [Google Scholar] [CrossRef]
  9. Kobal, M.; Bertoncelj, I.; Pirotti, F.; Dakskobler, I.; Kutnar, L. Using Lidar Data to Analyse Sinkhole Characteristics Relevant for Understory Vegetation under Forest Cover—Case Study of a High Karst Area in the Dinaric Mountains. PLoS ONE 2015, 10, e0122070. [Google Scholar] [CrossRef] [PubMed] [Green Version]
  10. González-Díez, A.; Barreda-Argüeso, J.A.; Rodríguez-Rodríguez, L.; Fernández-Lozano, J. The use of filters based on the Fast Fourier Transform applied to DEMs for the objective mapping of karstic features. Geomorphology 2021, 385, 107724. [Google Scholar] [CrossRef]
  11. Filin, S.; Baruch, A. Detection of sinkhole hazards using airborne laser scanning data. Photogramm. Eng. Remote Sens. 2010, 76, 577–587. [Google Scholar] [CrossRef]
  12. Doctor, D.H.; Young, J.A. An evaluation of automated gis tools for delineating karst sinkholes and closed depressions from 1-m lidar-derived digital elevation data. In NCKRI Symposium 2, Proceedings of the 13th Multidisciplinary Conference on Sinkholes and the Engineering and Environmental Impacts of Karst, Carlsbad, NM, USA, 22 May 2013; Land, L., Doctor, D.H., Stephenson, J.B., Eds.; National Cave and Karst Research Institute: Carlsbad, NM, USA, 2013; pp. 449–458. [Google Scholar]
  13. Obu, J.; Podobnikar, T. Algorithm for karst depression recognition using digital terrain models. Geodetski Vestnik 2013, 57, 260–270. [Google Scholar] [CrossRef]
  14. Zhu, J.; Taylor, T.P.; Currens, J.C.; Crawford, M.M. Improved karst sinkhole mapping in Kentucky using LiDAR techniques: A pilot study in Floyds Fork Watershed. J. Cave Karst Stud. 2014, 76, 207–216. [Google Scholar] [CrossRef]
  15. Kim, Y.J.; Nam, B.H.; Youn, H. Sinkhole Detection and Characterization Using LiDAR-Derived DEM with Logistic Regression. Remote Sens. 2019, 11, 1592. [Google Scholar] [CrossRef] [Green Version]
  16. Zhu, J.; Nolte, A.M.; Jacobs, N.; Ye, M. Using machine learning to identify karst sinkholes from LiDAR-derived topographic depressions in the Bluegrass Region of Kentucky. J. Hydrol. 2020, 588, 125049. [Google Scholar] [CrossRef]
  17. Hofierka, J.; Gallay, M.; Bandura, P.; Šašak, J. Identification of karst sinkholes in a forested karst landscape using airborne laser scanning data and water flow analysis. Geomorphology 2018, 308, 265–277. [Google Scholar] [CrossRef]
  18. Gutiérrez, F. Sinkhole hazards. In Oxford Research Encyclopedia of Natural Hazard Science; Oxford University Press: Oxford, UK, 2016; Available online: https://oxfordre.com/naturalhazardscience/view/10.1093/acrefore/9780199389407.001.0001/acrefore-9780199389407-e-40 (accessed on 7 July 2016).
  19. Avni, Y.; Lensky, N.; Dente, E.; Shviro, M.; Arav, R.; Gavrieli, I.; Yechieli, J.; Abelson, M.; Lutzky, H.; Filin, S.; et al. Self-accelerated development of salt karst during flash floods along the Dead Sea Coast, Israel. J. Geophys. Res. Earth Surf. 2016, 121, 17–38. [Google Scholar] [CrossRef] [Green Version]
  20. Kent, J.D.; Dunaway, L. Real-time GPS network monitors Bayou Corne sinkhole event. Eos 2013, 94, 385–386. [Google Scholar] [CrossRef]
  21. Kersten, T.; Kobe, M.; Gabriel, G.; Timmen, L.; Schon, S.; Vogel, D. Geodetic monitoring of suberosion-induced subsidence processes in urban areas. J. Appl. Geod. 2017, 11, 21–29. [Google Scholar]
  22. Desir, G.; Gutiérrez, F.; Merino, J.; Carbonel, D.; Benito-Calvo, A.; Guerrero, J.; Fabregat, I. Rapid subsidence in damaging sinkholes: Measurements by high-precision leveling and the role of salt dissolution. Geomorphology 2018, 303, 393–409. [Google Scholar] [CrossRef]
  23. Gutiérrez, F.; Benito-Calvo, A.; Carbonel, D.; Desir, G.; Sevil, J.; Guerrero, J.; Martinez-Fernandez, A.; Karamplaglidis, T.; Garcia-Arnay, A.; Fabregat, I. Review on sinkhole monitoring and performance of remediation measures by high-precision leveling and terrestrial laser scanner in the salt karst of the Ebro Valley, Spain. Eng. Geol. 2019, 248, 283–308. [Google Scholar] [CrossRef]
  24. Nof, R.N.; Baer, G.; Ziv, A.; Raz, E.; Atzori, S.; Salvi, S. Sinkhole precursors along the Dead Sea, Israel, revealed by SAR interferometry. Geology 2013, 41, 1019–1022. [Google Scholar] [CrossRef]
  25. Baer, G.; Magen, Y.; Nof, R.N.; Raz, E.; Lyakhovsky, V.; Shalev, E. InSAR measurements and viscoelastic modelling of sinkhole precursory subsidence: Implication for sinkhole formation, early warning and sediment properties. J. Geophy. Res. 2018, 123, 678–693. [Google Scholar] [CrossRef]
  26. Shi, Y.; Tang, Y.; Lu, Z.; Kim, J.W.; Peng, J. Subsidence of sinkholes in Wink, Texas from 2007 to 2011 detected by time-series InSAR analysis. Geomat. Nat. Hazards Risk 2019, 10, 1125–1138. [Google Scholar] [CrossRef]
  27. Solari, L.; Montalti, R.; Barra, A.; Monserrat, O.; Bianchini, S.; Crosetto, M. Multi-Temporal Satellite Interferometry for Fast-Motion Detection: An Application to Salt Solution Mining. Remote Sens. 2020, 12, 3919. [Google Scholar] [CrossRef]
  28. Orhan, O.; Oliver-Cabrera, T.; Wdowinski, S.; Yalvac, S.; Yakar, M. Land subsidence and its relations with sinkhole activity in Karapınar region, Turkey: A multi-sensor InSAR time series study. Sensors 2021, 21, 774. [Google Scholar] [CrossRef] [PubMed]
  29. Busetti, A.; Calligaris, C.; Forte, E.; Areggi, G.; Mocnik, A.; Zini, L. Non-Invasive Methodological Approach to Detect and Characterize High-Risk Sinkholes in Urban Cover Evaporite Karst: Integrated Reflection Seismics, PS-InSAR, Leveling, 3D-GPR and Ancillary Data. A NE Italian Case Study. Remote. Sens. 2020, 12, 3814. [Google Scholar] [CrossRef]
  30. Intrieri, E.; Gigli, G.; Nocentini, M.; Lombardi, L.; Mugnai, F.; Fidolini, F.; Casagli, N. Sinkhole monitoring and early warning: An experimental and successful GBInSAR application. Geomorphology 2015, 241, 304–314. [Google Scholar] [CrossRef] [Green Version]
  31. Benito-Calvo, A.; Gutiérrez, F.; Martinez-Fernandez, A.; Carbonel, D.; Karampaglidis, T.; Desir, G.; Sevil, J.; Guerrero, J.; Fabregat, I.; Garcia-Arnay, A. 4D monitoring of active sinkholes with Terrestrial Laser Scanner (TLS). A case study in the evaporate karst of the Ebro Valley, NE Spain. Remote Sens. 2018, 10, 571. [Google Scholar] [CrossRef] [Green Version]
  32. Sevil, J.; Benito-Calvo, A.; Gutiérrez, F. Sinkhole subsidence monitoring combining terrestrial laser scanner and high-precision levelling. Earth Surf. Process. Landf. 2021, 46. [Google Scholar] [CrossRef]
  33. Al-Halbouni, D.; Holohan, E.P.; Saberi, L.; Alrshdan, H.; Sawarieh, A.; Closson, D.; Walter, T.R.; Dahm, T. Sinkholes, subsidence and suberosion on the eastern shore of the Dead Sea as revealed by close-range photogrammetry survey. Geomorphology 2017, 285, 305–324. [Google Scholar] [CrossRef] [Green Version]
  34. Meredith, A.; Eslinger, D.; Aurin, D. An Evaluation of Hurricane-Induced Erosion along the North Carolina Coast Using Airborne LiDAR Surveys; United States Department of Commerce, NOAA Coastal Services Center Technical Report/99031-PUB: Charleston, SC, USA, 1999; pp. 1–30.
  35. Mitasova, H.; Hardin, E.; Overton, M.F.; Kurum, M.O. Geospatial analysis of vulnerable beach-foredune systems from decadal time series of LiDAR data. J. Coast. Conserv. 2010, 14, 161–172. [Google Scholar] [CrossRef] [Green Version]
  36. Obu, J.; Lantuit, H.; Grosse, G.; Günther, F.; Sachs, T.; Helm, V.; Fritz, M. Coastal erosion and mass wasting along the Canadian Beaufort Sea based on annual airborne LiDAR elevation data. Geomorphology 2017, 293, 331–346. [Google Scholar] [CrossRef] [Green Version]
  37. Geist, T.; Lutz, E.; Stoetter, J. Airborne laser scanning technology and its potential for applications in glaciology. In 3D Reconstruction from Airborne Laser Scanner and InSAR Data, Proceedings of the ISPRS Workshop, Dresden, Germany, 10 October 2003; Maas, H.G., Vosselman, G., Streilein, A., Eds.; ISPRS Archives: Dresden, Germany, 2003; pp. 1–5. [Google Scholar]
  38. Irvine-Fynn, T.D.L.; Barrand, N.E.; Porter, P.R.; Hodson, A.J.; Murray, T. Recent high-arctic glacial sediment redistribution: A process perspective using airborne LiDAR. Geomorphology 2011, 125, 27–39. [Google Scholar] [CrossRef]
  39. Telling, J.W.; Glennie, C.; Fountain, A.G.; Finnegan, D.C. Analyzing Glacier Surface Motion Using LiDAR Data. Remote Sens. 2017, 9, 283. [Google Scholar] [CrossRef] [Green Version]
  40. Glennie, C.L.; Hinojosa-Corona, A.; Nissen, E.; Kusari, A.; Oskin, M.E.; Arrowsmith, J.R.; Borsa, A. Optimization of legacy LiDAR data sets for measuring near-field earthquake displacements. Geophys. Res. Lett. 2014, 41, 3494–3501. [Google Scholar] [CrossRef]
  41. Clark, K.J.; Nissen, E.K.; Howarth, J.D.; Hamling, I.J.; Mountjoy, J.J.; Ries, W.F.; Jones, K.; Goldstien, S.; Cochran, U.A.; Villamor, P.; et al. Highly variable coastal deformation in the 2016 MW7.8 Kaikōura earthquake reflects rupture complexity along a transpressional plate boundary. Earth Planet. Sci. Lett. 2017, 474, 334–344. [Google Scholar] [CrossRef]
  42. Favalli, M.; Fornaciai, A.; Mazzarini, F.; Harris, A.J.L.; Neri, M.; Behncke, B.; Pareschi, M.T.; Tarquini, S.; Boschi, E. Evolution of an active lava flow field using a multi-temporal LiDAR acquisition. J. Geophys. Res. Solid Earth 2010, 115, 1–17. [Google Scholar] [CrossRef] [Green Version]
  43. Behncke, B.; Fornaciai, A.; Neri, M.; Favalli, M.; Ganci, G.; Mazzarini, F. LiDAR surveys reveal eruptive volumes and rates at Etna, 2007–2010. Geophys. Res. Lett. 2016, 43, 4270–4278. [Google Scholar] [CrossRef] [Green Version]
  44. Corsini, A.; Borgatti, L.; Cervi, F.; Dahne, A.; Ronchetti, F.; Sterzai, P. Estimating mass-wasting processes in active earth slides —Earth flows with time-series of high resolution DEMs from photogrammetry and airborne LiDAR. Nat. Hazards Earth Syst. Sci. 2009, 9, 433–439. [Google Scholar] [CrossRef]
  45. Ventura, G.; Vilardo, G.; Terranova, C.; Sessa, E.B. Tracking and evolution of complex active landslides by multi-temporal airborne LiDAR data: The Montaguto landslide (Southern Italy). Remote Sens. Environ. 2011, 115, 3237–3248. [Google Scholar] [CrossRef]
  46. Tseng, C.M.; Lin, C.W.; Stark, C.P.; Liu, J.K.; Fei, L.Y.; Hsieh, Y.C. Application of a multi-temporal, LiDAR-derived, digital terrain model in a landslide-volume estimation. Earth Surf. Process. Landf. 2013, 38, 1587–1601. [Google Scholar] [CrossRef]
  47. Khan, S.D.; Huang, Z.; Karacay, A. Study of ground subsidence in northwest Harris county using GPS, LiDAR, and InSAR techniques. Nat. Hazards 2014, 73, 1143–1173. [Google Scholar] [CrossRef]
  48. Densmore, J.N.; Ellett, K.M.; Sneed, M.; Brandt, J.T.; Howle, J.F.; Morita, A.Y.; Borela, R.; Bobet, A.; Thayer, D.C. Evaluation of land subsidence and ground failures at Bicycle Basin, Fort Irwin National Training Center, California, 1992–2017. Sci. Investig. Rep. US Geol. Surv. 2019, 5015, 1–93. [Google Scholar]
  49. Quirantes, J. Sedimentological and Stratigraphic Study of the Continental Tertiary Sequence of Monegros; Institución Fernando El Católico (CSIC), Diputación Provincial de Zaragoza: Zaragoza, Spain, 1978; pp. 1–207. (In Spanish) [Google Scholar]
  50. Torrescusa, S.; Klimowitz, J. Knowledge contribution of the Miocene evaporites (Zaragoza Formation) of the Ebro Basin. In Formaciones Evaporíticas de la Cuenca del Ebro y Cadenas Periféricas y de la Zona de Levante; Ortí, F., Salvany, J.M., Eds.; ENRESA-GPG: Barcelona, Spain, 1990; pp. 120–122. (In Spanish) [Google Scholar]
  51. Salvany, J.M. Geology of glauberite layers of the Montes de Torrero; Universidad de Zaragoza: Zaragoza, Spain, 2009. (In Spanish) [Google Scholar]
  52. Acero, P.; Gutiérrez, F.; Galve, J.P.; Auqué, L.F.; Carbonel, D.; Gimeno, M.J.; Gómez, J.B.; Asta, M.P.; Yechieli, Y. Hydrogeochemical characterization of an evaporite karst area affected by sinkholes (Ebro Valley, NE Spain). Geol. Acta 2013, 11, 337–355. [Google Scholar]
  53. Acero, P.; Auqué, L.; Galve, J.P.; Gutiérrez, F.; Carbonel, D.; Gimeno, M.J.; Yechieli, Y.; Asta, M.P.; Gómez, J.B. Evaluation of geochemical and hydrogeological processes by geochemical modelling in an area affected by evaporite karstification. J. Hydrology 2015, 529, 1874–1889. [Google Scholar] [CrossRef]
  54. Gutierrez, F.; Mozafari, M.; Carbonel, D.; Gomez, R.; Raeisi, E. Leakage problems in dams built on evaporites. The case of La Loteta Dam (NE Spain), a reservoir in a large karstic depression generated by interstratal salt dissolution. Eng. Geol. 2015, 185, 139–154. [Google Scholar] [CrossRef]
  55. Salvany, J.M.; García-Veigas, J.; Ortí, F. Glauberite-halite association of the Zaragoza Gypsum Formation (Lower Miocene, Ebro Basin, NE Spain). Sedimentology 2007, 54, 443–467. [Google Scholar] [CrossRef]
  56. Zarroca, M.; Comas, X.; Gutiérrez, F.; Carbonel, D.; Linares, R.; Roqué, C.; Guerrero, J.; Pellicer, X. The application of GPR and ERI in combination with exposure logging and retrodeformation analysis to characterize sinkholes and reconstruct their impact on fluvial sedimentation. Gállego Valley, NE Spain. Earth Surf. Process. Landf. 2016, 42, 1049–1069. [Google Scholar] [CrossRef]
  57. Gutiérrez, F.; Galve, J.P.; Lucha, P.; Bonachea, J.; Jordá, L.; Jordá, R. Investigation of a large collapse sinkhole affecting a multi-storey building by means of geophysics and the trenching technique (Zaragoza city, NE Spain). Environ. Geol. 2009, 58, 1107–1122. [Google Scholar] [CrossRef]
  58. Gutiérrez, F.; Galve, J.P.; Lucha, P.; Castañeda, C.; Bonachea, J.; Guerrero, J. Integrating geomorphological mapping, trenching, InSAR and GPR for the identification and characterization of sinkholes in the mantled evaporite karst of the Ebro Valley (NE Spain). Geomorphology 2011, 134, 144–156. [Google Scholar] [CrossRef] [Green Version]
  59. Gutiérrez, F.; Zarroca, M.; Linares, R.; Roqué, C.; Carbonel, D.; Guerrero, J.; McCalpin, J.; Comas, X.; Cooper, A. Identifying the boundaries of sinkholes and subsidence areas via trenching and stablishing setback distances. Eng. Geol. 2018, 233, 255–268. [Google Scholar] [CrossRef]
  60. Carbonel, D.; Rodríguez, V.; Gutiérrez, F.; Mccalpin, J.P.; Linares, R.; Roqué, C.; Zarroca, M.; Guerrero, J.; Sasowsky, I. Evaluation of trenching, ground penetrating radar (GPR) and electrical resistivity tomography (ERT) for sinkhole characterization. Earth Surf. Process. Landf. 2013, 39, 3440. [Google Scholar] [CrossRef]
  61. Carbonel, D.; Rodríguez-Tribaldos, V.; Gutiérrez, F.; Galve, J.P.; Guerrero, J.; Zarroca, M.; Roqué, C.; Linares, R.; McCalpin, J.P. Investigating a damaging buried sinkhole cluster in an urban area integrating multiple techniques: Geomorphological surveys, DInSAR, GPR, ERT, and trenching. Geomorphology 2015, 229, 3–16. [Google Scholar] [CrossRef]
  62. Sevil, J.; Gutiérrez, F.; Zarroca, M.; Desir, G.; Carbonel, D.; Guerrero, J.; Linares, R.; Roqué, C.; Fabregat, I. Sinkhole investigation in an urban area by trenching in combination with GPR, ERT and high-precision leveling. Mantled evaporite karst of Zaragoza city, NE Spain. Eng. Geol. 2017, 231, 9–20. [Google Scholar] [CrossRef]
  63. Rodríguez, V.; Gutiérrez, F.; Green, A.G.; Carbonel, D.; Horstmeyer, H.; Schmelzbach, C. Characterizing sagging and collapse sinkholes in a mantled karst by means of ground penetrating radar (GPR). Environ. Eng. Geosc. 2014, 20, 109–132. [Google Scholar] [CrossRef]
  64. Galve, J.P.; Castaneda, C.; Gutierrez, F.; Herrera, G. Assessing sinkhole activity in the Ebro Valley mantled evaporite karst using advanced DInSAR. Geomorphology 2015, 229, 30–44. [Google Scholar] [CrossRef] [Green Version]
  65. Sevil, J.; Gutiérrez, F.; Carnicer, C.; Carbonel, D.; Desir, G.; García-Arnay, A.; Guerrero, J. Characterizing and monitoring a high-risk sinkhole in an urban area underlain by salt through non-invasive methods: Detailed mapping, high precision leveling and GPR. Eng. Geol. 2020, 272, 105641. [Google Scholar] [CrossRef]
  66. Gutiérrez, F.; Guerrero, J.; Lucha, P.; Gutierrez, F. A genetic classification of sinkholes illustrated from evaporite paleokarst exposures in Spain. Environ. Geol. 2008, 53, 993–1006. [Google Scholar] [CrossRef]
  67. ASPRS, Laser File Format Exchange Activities. Available online: https://www.asprs.org/committee%E2%80%90general/laser%E2%80%90las%E2%80%90file%E2%80%90formatexchange%E2%80%90activities.html (accessed on 14 June 2016).
  68. Axelsson, P. Processing of laser scanner data-algorithms and applications. ISPRS P&RS 1999, 54, 138–147. [Google Scholar]
  69. Axelsson, P. DEM generation from laser scanner data using adaptive TIN models. ISPRS Arch. 2000, 33, 110–117. [Google Scholar]
  70. Lorite Martínez, S.; Ojeda, J.C.; Rodríguez-Cuenca, R.; González, E.; Muñoz, P. Point cloud distribution and processing of the PNOA-LiDAR Project. Available online: http://pnoa.ign.es/PNOAtheme/images/imgPNOA/contenidos/pdf/Procesado_distribucion_nubes_puntos_proyecto_PNOA-LiDAR.pdf (accessed on 14 June 2016). (In Spanish).
  71. Montealegre, A.; Lamelas, M.T.; De la Riva, J. A comparison of open-source LiDAR filtering algorithms in a mediterranean forest environment. IEEE J. Sel. Top. Appl. Earth Obs. Remote Sens. 2015, 8, 4072–4085. [Google Scholar] [CrossRef] [Green Version]
  72. Zhao, X.; Su, Y.; Li, W.; Hu, T.; Liu, J.; Guo, Q. A Comparison of LiDAR Filtering Algorithms in Vegetated Mountain Areas. Can. J. Remote Sens. 2018, 44, 287–298. [Google Scholar] [CrossRef]
  73. Casu, F.; Elefante, E.; Imperatore, P.; Zinno, I.; Manunta, M.; De Luca, C.; Lanari, R. SBAS-DInSAR Parallel Processing for Deformation Time Series Computation. IEEE JSTARS 2014, 7. [Google Scholar] [CrossRef]
  74. De Luca, C.; Cuccu, R.; Elefante, S.; Zinno, I.; Manunta, M.; Casola, V.; Rivolta, G.; Lanari, R.; Casu, F. An On-Demand Web Tool for the Unsupervised Retrieval of Earth’s Surface Deformation from SAR Data: The P-SBAS Service within the ESA G-POD Environment. Remote Sens. 2015, 7, 15630–15650. [Google Scholar] [CrossRef] [Green Version]
  75. Galve, J.; Pérez-Peña, J.; Azañón, J.; Closson, D.; Caló, F.; Reyes-Carmona, C.; Jabaloy, A.; Ruano, P.; Mateos, R.; Notti, D.; et al. Evaluation of the SBAS InSAR service of the European space Agency’s Geohazard Exploitation Platform (GEP). Remote Sens. 2017, 9, 1291. [Google Scholar] [CrossRef] [Green Version]
  76. Manunta, M.; De Luca, C.; Zinno, I.; Casu, F.; Manzo, M.; Bonano, M.; Fusco, A.; Giovanni, A.; Berardino, P.; De Maertino, P.; et al. The Parallel SBAS Approach for Sentinel-1 Interferometric Wide Swath Deformation Time-Series Generation: Algorithm Description and Products Quality Assessment. IEEE Trans. Geosci. Remote Sens. 2019, 57, 6259–6281. [Google Scholar] [CrossRef]
  77. Piroton, V.; Schlögel, R.; Barbier, C.; Havenith, H. Monitoring the Recent Activity of Landslides in the Mailuu-Suu Valley (Kyrgyzstan) Using Radar and Optical Remote Sensing Techniques. Geosciences 2020, 10, 164. [Google Scholar] [CrossRef]
  78. Bejar, M.; Notti, D.; Mateos, R.; Ezquerro, P.; Centolanza, G.; Herrera, G.; Bru, G.; Sanabria, M.; Solari, L.; Duro, J.; et al. Mapping Vulnerable Urban Areas Affected by Slow-Moving Landslides Using Sentinel-1 InSAR Data. Remote. Sens. 2017, 9, 876. [Google Scholar] [CrossRef] [Green Version]
  79. Raspini, F.; Cigna, F.; Moretti, S. Multi-Temporal Mapping of Land Subsidence at Basin Scale Exploiting Persistent Scatterer Interferometry: Case Study of Gioia Tauro Plain (Italy). J. Maps 2012, 8, 514–524. [Google Scholar] [CrossRef] [Green Version]
  80. Notti, D.; Herrera, G.; Bianchini, S.; Meisina, C.; García-Davalillo, J.C.; Zucca, F.A. Methodology for improving landslide PSI data analysis. Int. J. Remote Sens. 2014, 35, 2186–2214. [Google Scholar] [CrossRef]
  81. Benito, G.; Pérez-González, A.; Gutiérrez, F.; Machado, M.J. River response to Quaternary subsidence due to evaporite solution (Gállego River, Ebro Basin, Spain). Geomorphology 1998, 22, 243–263. [Google Scholar] [CrossRef]
  82. Parkhurst, D.L.; Appelo, C.A.J. Description of input and examples for PHREEQC version 3-A computer program for speciation, batch-reaction, one-dimensional transport, and inverse geochemical calculations. U.S. Geol. Surv. Tech. Methods 2013, 6, A43. [Google Scholar]
  83. Gutiérrez, M.; Gutiérrez, F. Geomorphology of the Tertiary gypsum formations in the Ebro Depression (Spain). Geoderma 1998, 87, 1–29. [Google Scholar]
  84. Zebker, H.; Villasenor, J. Decorrelation in interferometric radar echoes. IEEE Trans. Geosci. Remote Sens. 1992, 30, 950–959. [Google Scholar] [CrossRef] [Green Version]
  85. Jones, C.E.; Blom, R.G. Bayou Corne, Louisiana, sinkhole: Precursory deformation measured by radar interferometry. Geology 2014, 42, 111–114. [Google Scholar] [CrossRef]
  86. Jones, E.J. Capabilities, limitation and opportunities for studying sinkholes using synthetic aperture radar interferometry. In Proceedings of the 16th Multidisciplinary Conference on Sinkholes and the Engineering and Environmental Impacts of Karst and the 3rd Appalachian Symposium, Puerto Rico, USA, 12–16 April 2021; Sasowsky, M.J., Byle, L.L., Eds.; National Cave and Karst Research Institute: Puerto Rico, PR, USA, 2021; pp. 68–74. [Google Scholar]
  87. Nof, R.N.; Abelson, M.; Raz, E.; Magen, Y.; Atzori, S.; Salvi, S.; Baer, G. SAR Interferometry for Sinkhole Early Warning and Susceptibility Assessment along the Dead Sea, Israel. Remote Sens. 2019, 11, 89. [Google Scholar] [CrossRef] [Green Version]
  88. Oliver-Cabrera, T.; Wdowinski, S.; Kruse, S.; Robinson, T. InSAR Detection of Localized Subsidence Induced by Sinkhole Activity in Suburban West-Central Florida. PIAHS 2020, 382, 155–159. [Google Scholar]
  89. Yang, C.; Zhang, Q.; Zhao, C.; Ji, L.; Zhu, W. Monitoring mine collapse by D-InSAR. Min. Sci. Technol. 2010, 20, 696–700. [Google Scholar] [CrossRef]
  90. Ma, G.; Zhao, Q.; Wang, Q.; Liu, M. On the Effects of InSAR Temporal Decorrelation and Its Implications for Land Cover Classification: The Case of the Ocean-Reclaimed Lands of the Shanghai Megacity. Sensors 2018, 18, 2939. [Google Scholar] [CrossRef] [Green Version]
Figure 1. Geographical location of the study area, situation of the detailed area referenced in Section 4 and spatial distribution of active sinkholes according to the LiDAR deformation maps and the web-based InSAR approaches.
Remotesensing 13 03261 g001
Figure 2. LiDAR deformation maps of collapse (A), sagging (B,C), compound sinkholes (D,E) and artifacts related to human structures, irrigation ditches, steep slopes and cropland boundaries depicted in the 2018 orthoimage.
Remotesensing 13 03261 g002
Figure 3. Subsidence rates measured by the DoD and the SBAS and FASTVEL approaches in the Zuera Sinkholes site depicted in a shaded digital elevation model and leveling and LiDAR subsidence rate profiles along the N330 road.
Remotesensing 13 03261 g003
Figure 4. Spatial distribution of active sinkholes in the detailed area framed in Figure 1 according to LiDAR data and the SBAS Sentinel LOS velocity and vertical deformation maps, and location of the investigated sinkholes with known subsidence rates referenced in Section 4.3.
Remotesensing 13 03261 g004
Figure 5. Subsidence rates measured by the DoD and the SBAS and FASTVEL approaches in the Papiro sinkhole depicted in the 2018 orthoimage, leveling and LiDAR subsidence rate profiles along the N232 road, and a picture of the collapse sinkhole that formed on 20 March 2013 affecting the N232 road.
Remotesensing 13 03261 g005
Figure 6. Subsidence rates measured by the DoD and the SBAS and FASTVEL approaches in the Pasarela and Bricodepot sinkholes site depicted in the 2018 orthoimage and leveling and LiDAR subsidence rate profiles along the N232 road in the Bricodepot sinkhole and the LiDAR subsidence rate profile in the Pasarela sinkhole.
Remotesensing 13 03261 g006
Figure 7. Subsidence rates measured by the DoD and the SBAS and FASTVEL approaches in the Estrellas sinkhole depicted in the 2018 orthoimage and leveling and LiDAR subsidence rate profiles across the sinkhole.
Remotesensing 13 03261 g007
Table 1. Sinkhole detection rate of LiDAR and InSAR web-tools in the Ebro Valley sector depicted in Figure 1.
Remote Sensing MethodAirborne LiDAR
(2010–2016)
SBAS Envisat
(2003–2010)
SBAS Sentinel
(2014–2021)
SBAS Sentinel
(2019–2021)
FASTVEL Sentinel (2019–2021)
Detected101 (27.5%)7 (2%)5 (1.5%)21 (6%)23 (6.5%)
Undetected248 (62.5%)342 (98%)344 (98.5%)328 (94%)326 (93.5%)
Publisher’s Note: MDPI stays neutral with regard to jurisdictional claims in published maps and institutional affiliations.

