Article

Overcoming the Challenges of Thermal Infrared Orthomosaics Using a Swath-Based Approach to Correct for Dynamic Temperature and Wind Effects

by
Yoann Malbéteau
1,2,
Kasper Johansen
1,*,
Bruno Aragon
1,3,
Samir K. Al-Mashhawari
1 and
Matthew F. McCabe
1
1
Hydrology, Agriculture and Land Observation Group, Water Desalination and Reuse Center, Biological and Environmental Science and Engineering Division, King Abdullah University of Science and Technology, Thuwal 23955-6900, Saudi Arabia
2
VanderSat, Wilhelminastraat 43a, 2011 VK Haarlem, The Netherlands
3
Jet Propulsion Laboratory, California Institute of Technology, Pasadena, CA 91109, USA
*
Author to whom correspondence should be addressed.
Remote Sens. 2021, 13(16), 3255; https://doi.org/10.3390/rs13163255
Submission received: 16 June 2021 / Revised: 4 August 2021 / Accepted: 11 August 2021 / Published: 18 August 2021
(This article belongs to the Section Remote Sensing in Agriculture and Vegetation)

Abstract

:
The miniaturization of thermal infrared sensors suitable for integration with unmanned aerial vehicles (UAVs) has provided new opportunities to observe surface temperature at ultra-high spatial and temporal resolutions. In parallel, there has been a rapid development of software capable of streamlining the generation of orthomosaics. However, these approaches were developed to process optical and multi-spectral image data and were not designed to account for the often rapidly changing surface characteristics inherent in the collection and processing of thermal data. Although radiometric calibration and shutter correction of uncooled sensors have improved, the processing of thermal image data remains difficult due to (1) vignetting effects on the uncooled microbolometer focal plane array; (2) inconsistencies between images relative to in-flight effects (wind-speed and direction); (3) unsuitable methods for thermal infrared orthomosaic generation. Here, we use thermal infrared UAV data collected with a FLIR-based TeAx camera over an agricultural field at different times of the day to assess inconsistencies in orthophotos and their impact on UAV-based thermal infrared orthomosaics. Depending on the wind direction and speed, we found a significant difference in UAV-based surface temperature (up to 2 °C) within overlapping areas of neighboring flight lines, with orthophotos collected with tail wind being systematically cooler than those with head wind. To address these issues, we introduce a new swath-based mosaicking approach, which was compared to three standard blending modes for orthomosaic generation. The swath-based mosaicking approach improves the ability to identify rapid changes of surface temperature during data acquisition, corrects for the influence of flight direction relative to the wind orientation, and provides uncertainty (pixel-based standard deviation) maps to accompany the orthomosaic of surface temperature. It also produced more accurate temperature retrievals than the other three standard orthomosaicking methods, with a root mean square error of 1.2 °C when assessed against in situ measurements. As importantly, our findings demonstrate that thermal infrared data require appropriate processing to reduce inconsistencies between observations, and thus, improve the accuracy and utility of orthomosaics.

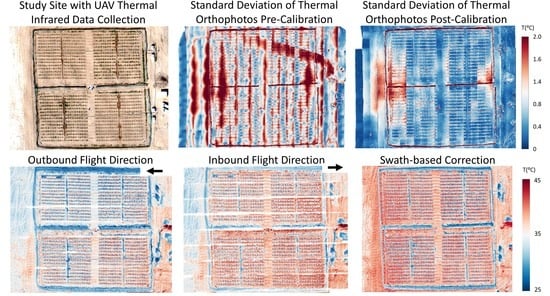
Graphical Abstract

1. Introduction

As the global population continues to grow, food demand is expected to increase by 50% in 2050. As such, there is an immediate need to improve our agricultural systems to become more resource-efficient [1]. Precision agriculture has emerged as a potential solution to this problem and aims to optimize management practices by providing needed farm inputs of the right amount, at the right time, and in the right place [2]. Central to this concept is the dynamic monitoring and response to intra-field variability in both plants and soil. However, an accurate and continuous description of the heterogeneity of agricultural surfaces over large areas remains a challenging task. Remote sensing provides an effective way to overcome the spatial and temporal constraints of ground-based measurements. While satellite systems have become a useful tool for various agricultural applications [3], they are often limited by orbital configuration, leading to a compromise between the achievable spatial and temporal resolution. With recent advances in near-Earth observation [4], unmanned aerial vehicles (UAVs) offer an appealing compromise for obtaining data with ultra-high spatial resolution in real-time and on-demand [5,6].
In parallel with UAV developments, there have been efforts to miniaturize sensors [7], providing new capabilities in thermal [8], hyperspectral [9,10,11], and other sensing methods, e.g., Light Detection and Ranging (LiDAR) [12]. Driven by these developments, the uptake and use of UAVs has increased rapidly, allowing the monitoring of a range of soil and crops characteristics with unprecedented spatial and temporal resolutions [13], including crop height [14], surface temperature [15,16], vegetation chlorophyll [11] and many other variables of interest [17]. As a particular example, UAV-based thermal infrared sensors are being used for a range of agricultural applications, including the monitoring of vegetation water stress [18], irrigation scheduling and crop water status [19,20], crop phenotyping [21,22,23,24], yield prediction [25], and real-time disease and pathogen detection [26,27,28]. While most of these applications require careful data acquisition and specific processing techniques of the thermal imagery, only a limited number of studies have assessed the impact of inconsistencies between raw images and observation errors in the final products (e.g., [29,30,31]).
UAVs generally utilize uncooled thermal sensors due to their size and weight benefits compared to cooled sensors. One of the most common thermal sensors are microbolometers. They have a relatively lower cost, are easy to integrate, and their large temperature coefficients result in a wide range of resistance changes with radiation absorption. However, uncooled microbolometers tend to be less accurate and prone to thermal sensitivities, which can cause inconsistencies and reduced accuracy in thermal retrievals. Some sources of errors are already corrected by firmware integrated into the sensor system, such as the non-uniformity correction, which enhance the internal offset coefficients of the camera [32]. This correction ensures a harmonized signal response across the sensor and subsequently provides a more uniform image [33]. Nonetheless, even with this correction, camera optics, design and enclosure influences can introduce energy dissipation effects from the microbolometers, resulting in distortion (vignetting) in collected imagery [30]. Likewise, low-cost sensors are not radiometrically calibrated by the manufacturer, making it difficult to obtain absolute temperature measurements.
Several studies have developed protocols using available blackbody devices in the laboratory to calibrate or correct uncooled sensors [34]. Ribeiro-Gomes et al. [35] proposed a radiometric calibration procedure in which an artificial neural network was used with the sensor temperature and the digital response of the sensor as input. More recently, Kelly et al. [30] provided a preliminary description of the FLIR VUE Pro 640 camera performance in both laboratory and field conditions, finding that camera stabilization is one of the major causes of uncertainty. They also performed a simple linear radiometric calibration based on blackbody temperature. A variety of approaches have been suggested for correcting vignetting effects [34,35,36]. For instance, Aragon et al. [29] developed a pixel-based ambient temperature dependent radiometric calibration function for three thermal infrared sensors. They identified significant improvement in measured surface temperatures when evaluated against a temperature modulated blackbody target, with measurements of bias and vignetting effects greatly reduced. Kelly et al. [30] recommended using only the central portion of the image to minimize vignetting effects, but in doing so, severely reduced the overlapping image coverage required for accurate image alignment. Another challenge of thermal images is their low contrast, which affects the photogrammetry process and can cause significant errors in the generation of orthophotos [35]. To solve this contrast issue, Turner et al. [37] applied a linear stretch using a minimum and maximum thresholds set based on all pixels in all images to improve identification of features within overlapping images. Despite the number of recent improvements to enhance the accuracy of UAV-based thermal data, relatively few evaluations of thermal mosaicking approaches and the impact of using potentially inaccurate/uncorrected thermal images on the final orthomosaic have been undertaken [31,38].
Snapshot images are processed with photogrammetrically based structure from motion (SfM) approaches by matching the same ground features viewed from overlapping UAV-based images that have been collected from different viewpoints. The SfM technique estimates a dense 3D point cloud that results in a reconstructed and georeferenced surface, generally in the form of a DSM or mesh that can be used to generate orthorectified images [39]. SfM has been extensively used to process RGB and multi-spectral imagery [40,41], leading to several commercial (e.g., Agisoft Metashape, St. Petersburg, Russia and Pix4D, Lausanne, Switzerland) and open-source (e.g., open MVG, Paris, France) software applications. Nevertheless, none of these methods have been specifically designed for thermal imagery. For instance, Agisoft Metashape Professional (previously named Agisoft PhotoScan) proposes different mosaicking modes: also called stitching or blending. While the “mosaic” mode may minimize the appearance of seamlines, this mode was designed to improve RGB or multi-spectral processing by implementing an approach with data division. The “mosaic” method applies a weighted average resulting in higher weights for pixels closer to the image center. Importantly, for thermal data, the underlying physical processes occurring within the imagery are not considered, which hinders the handling of rapid changes in surface temperature and influences of in-flight effects, e.g., wind [38]. Furthermore, commercial software do not compute final error maps associated with inconsistencies of individual thermal images used to produce the final orthomosaic, making uncertainty assessments difficult to complete.
While thermal observations can provide insight into the physiological status of vegetation and land surface temperature dynamics, a variety of errors can still impact the UAV-retrieved temperature, where an accuracy better than 1 °C is often required [42,43,44]. The following investigation aims to address these limitations by improving the understanding and characterization of thermal errors in the mosaicking process, thereby providing an enhanced interpretation of collected temperatures, as well as developing a novel orthomosaicking approach that is suited for the processing of thermal data. To this end, several thermal infrared UAV datasets were collected in coordination with a tomato phenotyping experiment [45] that was conducted over an experimental field site in Saudi Arabia. To assess the collected imagery, individual thermal orthophoto inconsistencies were identified and then investigated in relation to flight direction and wind orientation and speed. An intercomparison of three commonly employed mosaicking methods, which form an integral part of commercial processing software such as Agisoft Metashape, was undertaken on collected imagery. In order to address the shortcomings of such approaches when using thermal infrared data, we implement a new swath-based mosaicking scheme to retrieve calibrated temperature maps based on flight direction normalization to reduce wind effects. Results were evaluated against spatially distributed in situ temperature measurements for each campaign. The work presented herein represents one of the first attempts to quantify uncertainties in thermal UAV-based orthomosaics, while offering an innovative orthomosaicking approach designed specifically for thermal infrared imagery.

2. Materials and Methods

2.1. Description of Study Area

UAV thermal data were collected over the winter period between 9 November 2017 and 7 January 2018 across a leveled 1 ha field of wild tomato plants at the King Abdulaziz University Agricultural Research Station in Hada Al-Sham, Saudi Arabia (Figure 1). Further details on the specifics of the plant trial are provided in Johansen et al. [45]. The region is characterized as a hot desert climate with precipitation of less than 100 mm/year and temperatures that can reach above 40 °C, even in winter. The soil is homogeneous and defined as sandy loam. Multiple UAV flights were conducted between 0800 and 1300 on three dates during the growing season, ensuring that a broad range of meteorological and surface temperature conditions were captured. Meteorological measurements including air temperature, wind speed and direction, air humidity, and net-radiation were collected continuously throughout the experiment (Figure 1), with data publicly available via www.climaps.com, accessed on 16 June 2021. Table 1 shows the air temperature together with the mean, maximum and minimum wind speeds at the site when the 12 flight surveys were performed. The wind speed was relatively stable during each flight, but the wind direction fluctuated, although it came predominantly from either the northeast or southwest.

2.2. Thermal Data Acquisition

Thermal images for each of the 12 UAV flight surveys were acquired with a ThermalCapture 2.0 640 thermal camera (TeAx, Wilnsdorf, Germany) at a nadir viewing angle. The flight surveys were undertaken at different times in the morning and around solar noon on the three dates (Table 1) to explore how times of significant surface heating (in the morning with increasing solar elevation) and more stable surface temperatures (around solar noon) affected the orthomosaicking process. Plant scientists and farmers are often interested in exploring plant responses to heat, specifically of isohydric plants for adjustment of irrigation [46,47]. Hence, it is important to assess the achievable improvement in accuracy of UAV-based temperature data collected at different times during both increasing surface heating and stable surface temperatures, while also evaluating varying shadow effects and their impact on sensed temperatures. The TeAx camera, based upon a modified FLIR Tau 2, has a resolution of 640 × 512 pixels and a 13 mm focal length, and collects thermal infrared images across the 7.5-13.5 µm spectral range. Manufacturer specifications indicate a thermal accuracy of 5 °C and thermal precision of 0.04 °C. The camera has the advantage of performing automatic flat-field corrections (FFC) while it is recording, allowing the system to remove the artifacts from 2D images that are caused by variation in the microbolometer-to-microbolometer precision of the sensor array. For the three campaigns, the FFC was performed every 100 images (approximately 83 seconds). The sensor also measures the internal temperature of the camera, combined with the ambient air temperature set before a flight. The camera continually updates the non-uniformity coefficients used to convert the raw 16-bit digital numbers (DN) to radiometric values.
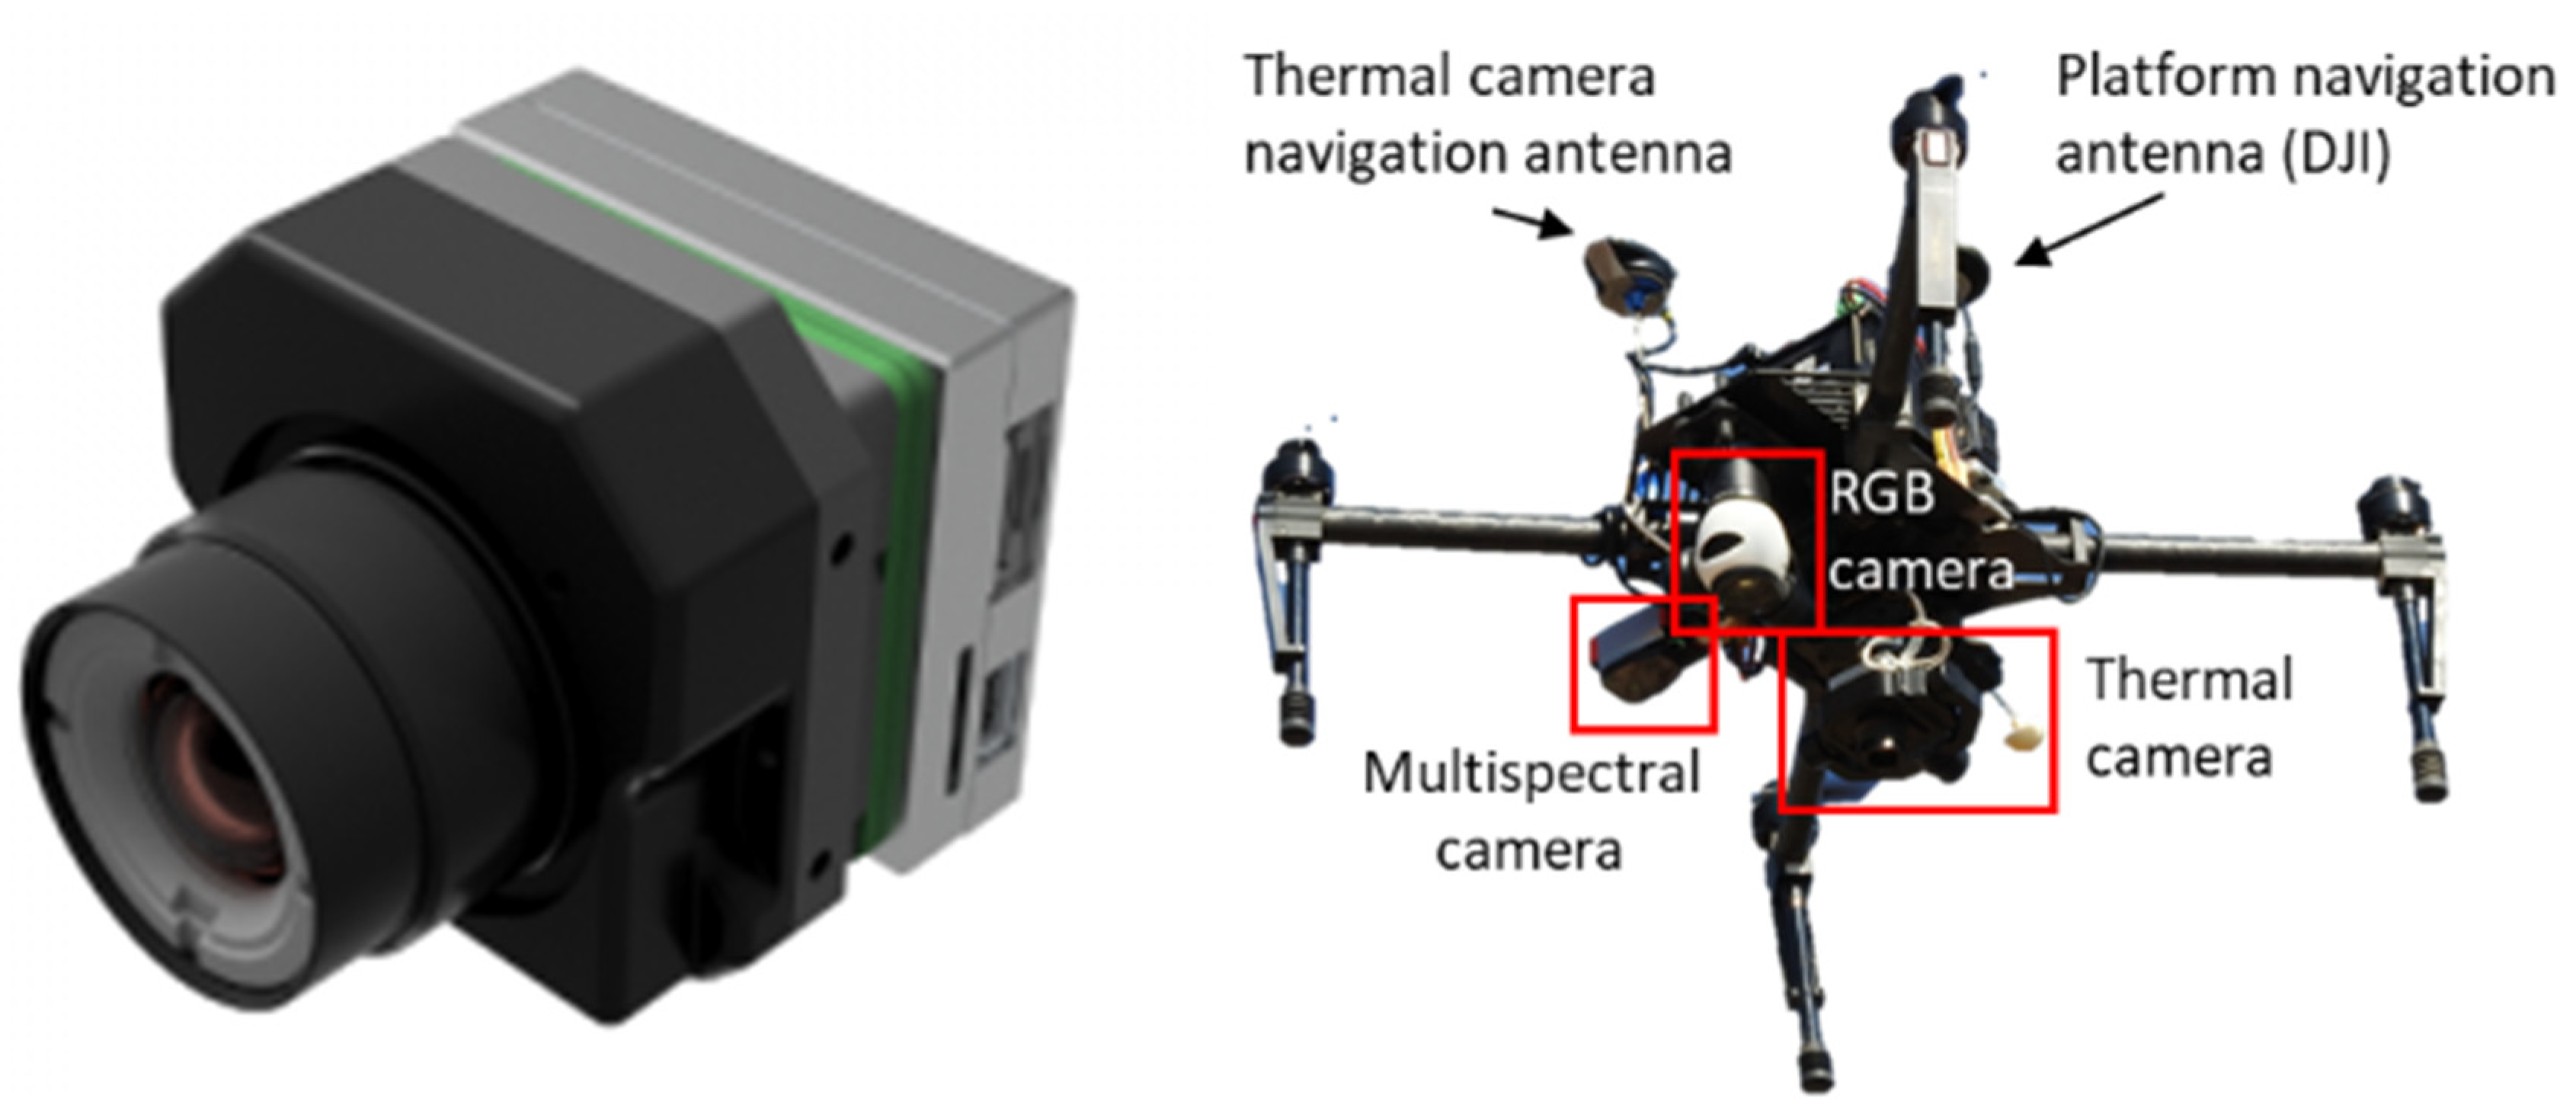
The TeAx thermal camera was mounted onto a DJI Matrice 100 (M100) quadcopter (DJI, Shenzhen, China) using a 3-axis gimbal (Figure 2). The gimbal used for the TeAx sensor was calibrated and balanced before each flight on a leveled wooden base. In addition, the flight speed (2 m/s) was relatively low during each UAV flight survey, further aiding the collection of nadir image data. An assessment of image orientation and dimensions of selected orthophotos from each UAV flight survey, including photos from both flight directions, confirmed data collection at nadir. The UAV platform consisted of the flight controller, propulsion system (four propellers), GPS, and remote control. The effect of the downwash of the propellers was considered negligible for the thermal infrared data collection, due to the placement of the TeAx sensor underneath the central part of the UAV platform and the distance to the ground (13 m), especially considering the results by Guo et al. [48]. The Universal Ground Control software (UgCS; SPH Engineering, Riga, Latvia) was used to control the UAV and undertake the flight planning with 60% sidelap, thereby providing 18 flight lines of the field trial. The UAV flying height was maintained at an elevation of 13 m above ground, providing a ground sampling distance of approximately 0.015 m and a footprint for each photo of 10.9 × 8.7 m. Flight speed was set to 2 m/s, corresponding to ~50 seconds per flight line, resulting in a flight time of 17 min per survey. While the camera collects thermal images at an image frequency of 8.33Hz, only every second image was used for further processing, yielding a forward overlap of 93%. Reducing the number of images did not affect the reconstructed thermal maps due to the high forward overlap, but it significantly reduced processing time.

2.3. Field Data Collection

To ensure accurate absolute geolocation of the orthophotos, ground control points (GCPs) were manually located within the observed scene. Aluminum trays were placed in the center and at each corner of the field as GCPs, as they were able to infer sky temperatures due to the very low emissivity of shiny aluminum. A black cross was taped across the center of each tray to improve the identifiability and hence accuracy of the GPS measurements, which were collected using a differential GPS (Leica GS10 receiver as a base station and GS15 smart antenna as a rover). The raw data logged by the base and rover were used for post-processing to obtain accurate positions of the GCP measurements in the field (horizontal accuracy of 5 mm) [49].
To evaluate the UAV-based thermal retrievals, in situ surface brightness temperature over bare ground was collected using four Apogee SI-111 infrared radiometers (Apogee Instruments Inc., 2005, Logan, UT, USA) and recorded during each campaign at four locations (Figure 1). At each location, the temperature was measured continuously at 1 min intervals and recorded on DataTaker DT80M loggers (Thermofisher Scientific Inc., Waltham, MA, USA). The broadband spectral range of these sensors spans from 8 to 14 μm, with an optimal temperature range covering −40–80 °C and a manufacturer specified accuracy of ±0.5 °C. All Apogee sensors were mounted at 1 m height above ground with a nadir viewing angle. Therefore, with a field of view (FOV) of 22 degrees, the ground sampling area from each sensor was estimated to be 0.40 m2, corresponding to about 2000 relatively homogeneous thermal pixels. For evaluation purposes (Section 3.4), the temperature within the FOV was extracted and averaged for each orthophoto along with the acquisition time. To ensure accurate temperature evaluation data, a calibration curve for each of the Apogee sensors was established based on the approach of Aragon et al. [29].

2.4. Thermal Data Pre-Processing

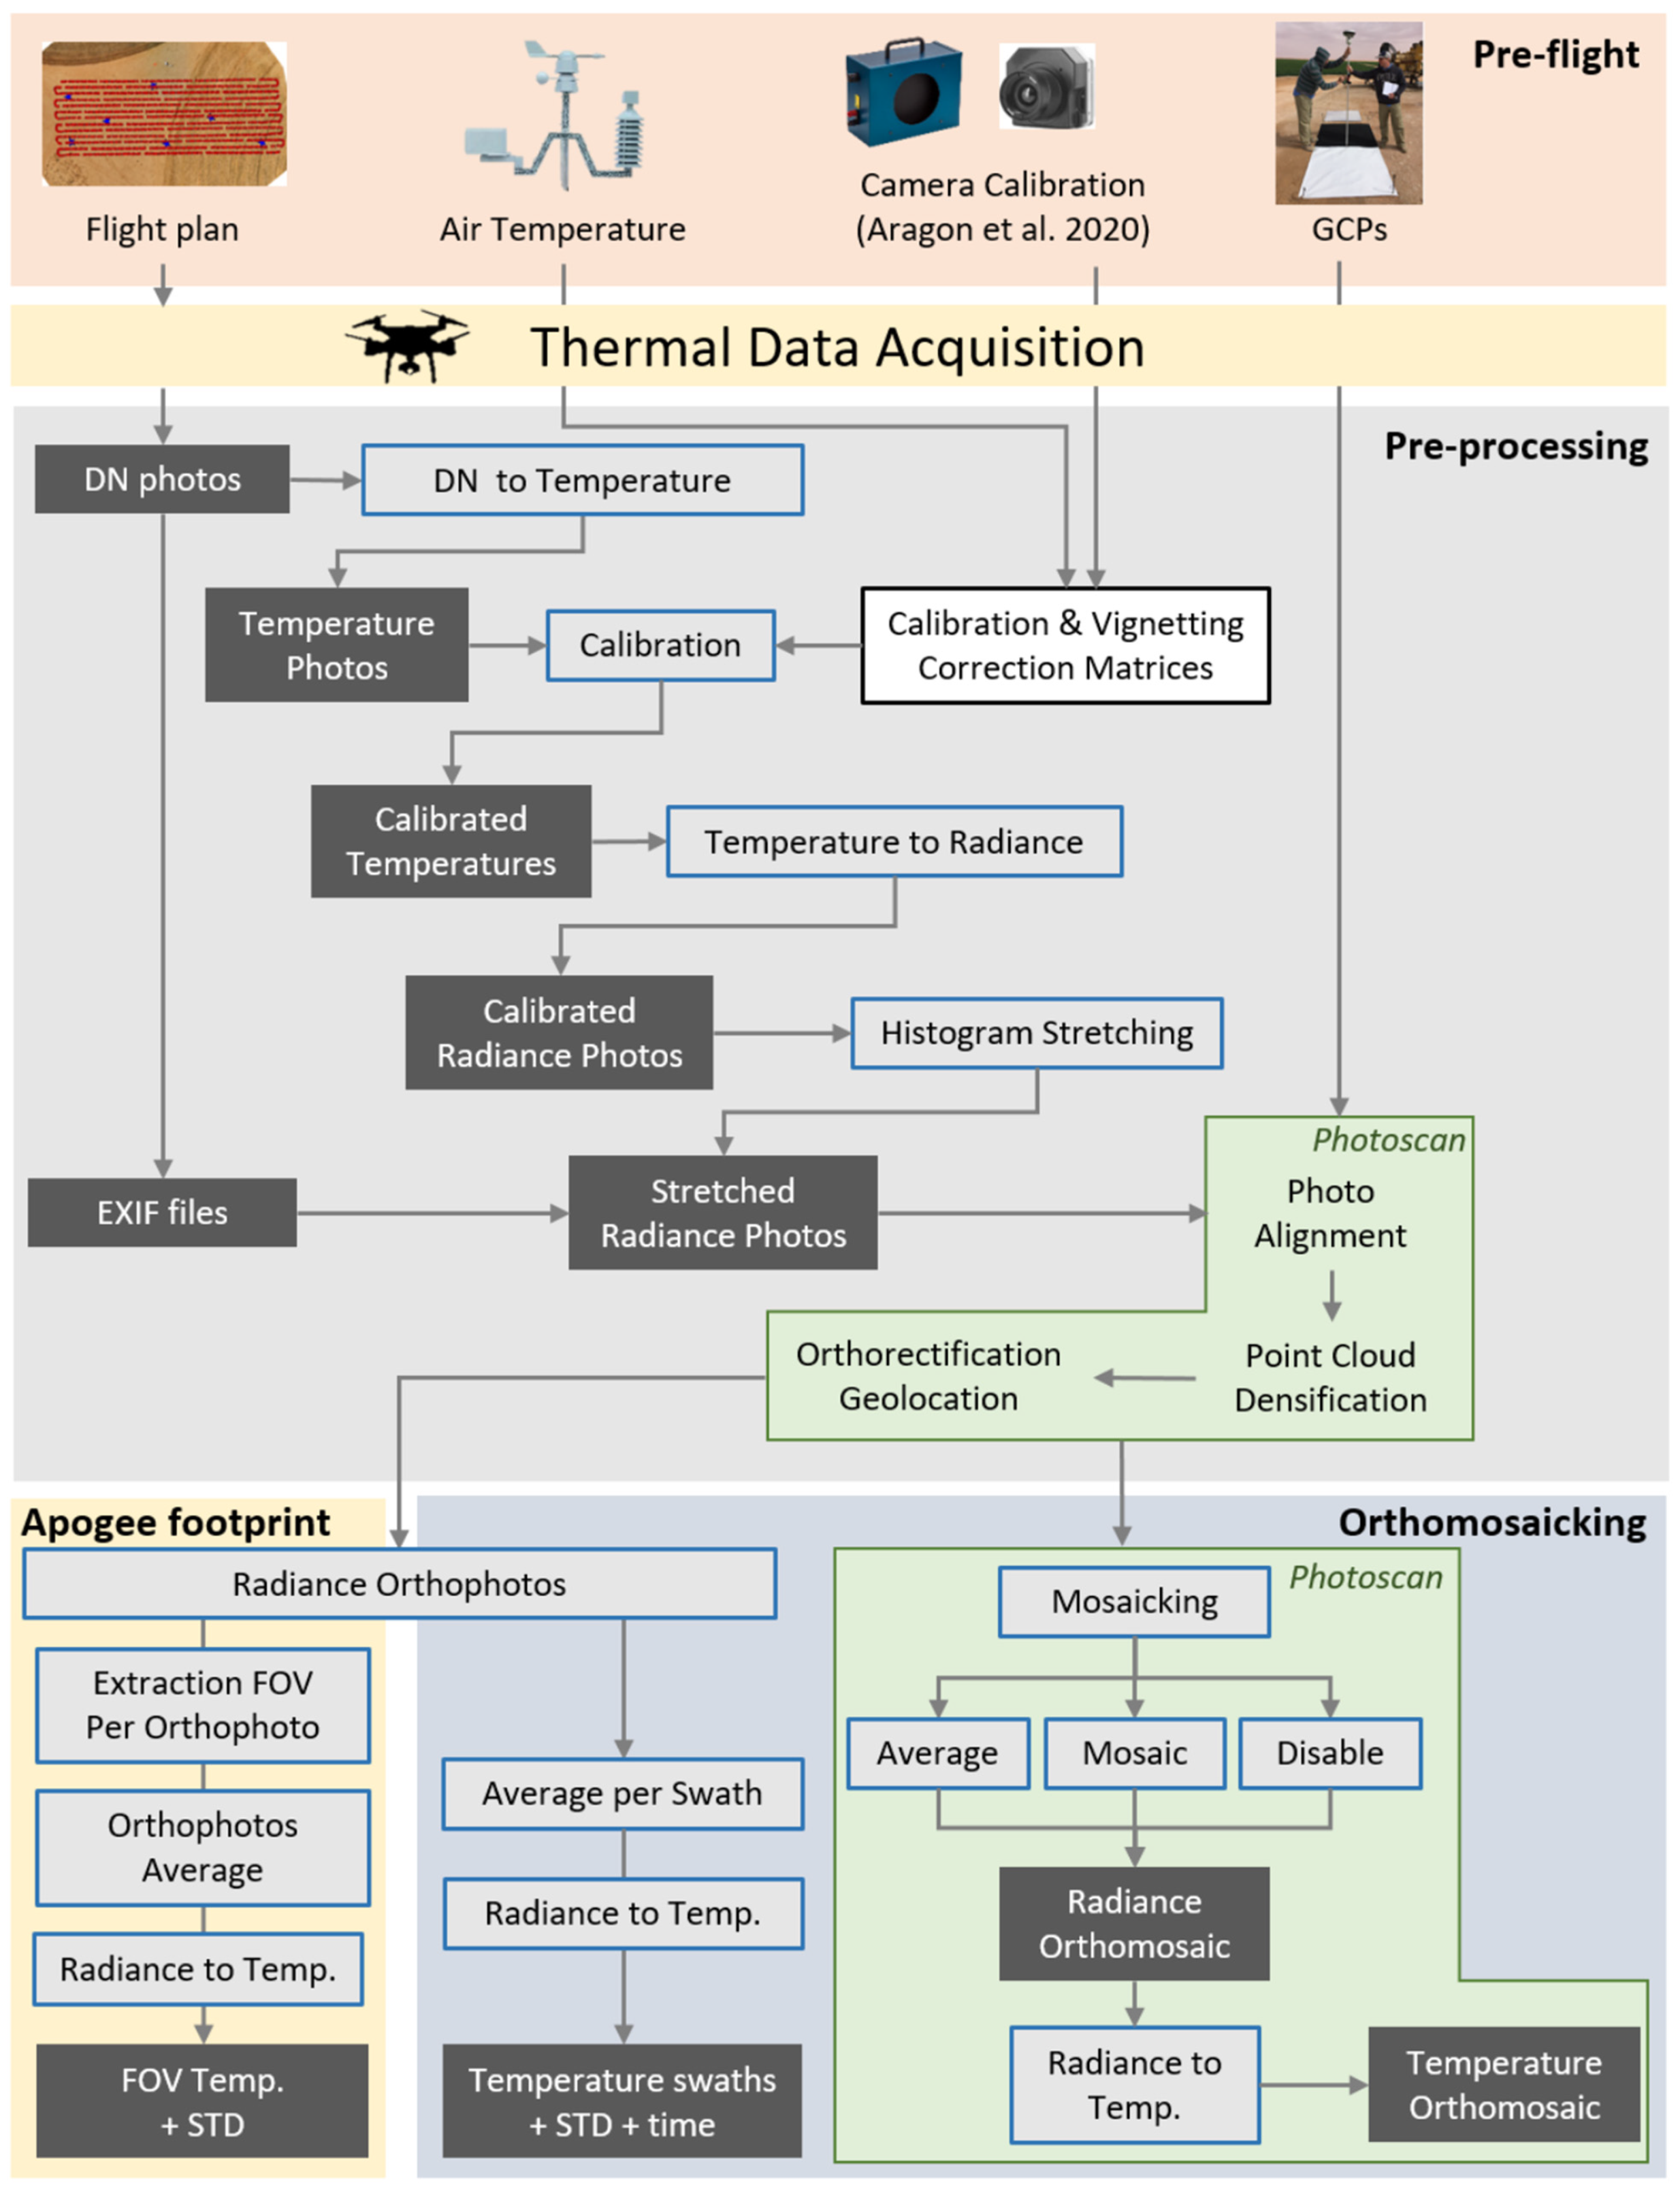
After the UAV thermal data acquisition, the raw images were downloaded with the ThermoViewer software for post-flight processing. The raw DN images were extracted as 16-bit TIFF radiance image files along with the UAV position, the camera non-uniformity corrections and the manufacturer-based radiometric calibration in an EXIF file. In order to obtain accurate orthophotos, the pre-processing was divided into three main parts: image calibration, histogram stretching, and image geo-referencing (Figure 3).
Based on the approach developed by Aragon et al. [29], a calibration function for each pixel, forming a matrix, was developed and applied to the raw thermal images. The calibration function was derived in a laboratory setup, where RTDs were first calibrated to accurately measure the temperature of a FLIR 4 blackbody, coincidently with the collection of Teax 640 images. To eliminate erratic temperature readings during the warmup period of the TeAx 640 camera, it was pre-warmed for up to 80 min based on findings in related studies [15,30]. The laboratory setup was contained within an environmental chamber to determine the relationship between the recorded TeAx 640 temperatures and the corresponding black body temperatures at various ambient temperatures. This produced a multilinear regression matrix that was applied to all the thermal images prior to further processing. To evaluate the performance of the approach developed by Aragon et al. [29], we compared the orthomosaicking results both with and without applying the multilinear regression matrix.
Before image alignment, the calibrated radiances were linearly stretched to occupy a larger portion of the dynamic range of the TIFF files. It is worth noting that only the digital numbers were changed (not the radiance values), as this improved the identification of features within the images, which in turn increased the number of matching points for better orthorectification. The absolute temperature recorded by the TeAx sensor occupied a very small portion (<2%) of the dynamic range of the 16-bit TIFF files. Therefore, the upper and lower thresholds for stretching were determined from the histogram of the radiance for all pixels of all images used in the reconstruction [37]. The GPS data was written for each image to the EXIF headers of these “stretched” 16-bit TIFF files before further processing. Following the orthorectification of the individual photos, the equation used for the linear stretch was reversed to ensure radiance values were not affected by the stretching.
Numerous SfM commercial software packages have become available for automatically processing UAV imagery. Here, we used the Agisoft PhotoScan workflow, which starts with an image alignment step using tie points between overlapping photos of the same features and identifies camera positions to produce a sparse point cloud. Subsequently, the GCPs were manually identified in the images and used for geo-referencing. Based on the identified GCPs, a bundle adjustment was performed to estimate the camera positions, orientations, and lens calibration parameters. Then, a dense point cloud was produced using SfM techniques to reconstruct the scene based on thousands of detected and matched feature points across neighboring images. The point densification process relies on the known camera positions and orientations from multi-view stereopsis.
In order to investigate the inconsistencies between overlapping thermal images and improve the processing for generating an orthomosaic, individual georeferenced and orthorectified radiance images produced in Agisoft PhotoScan were subsequently extracted (Figure 3). As Planck’s Law defines the relationship between temperature and radiance, which is more complex than linear proportionality and is strongly wavelength-dependent [50], all images were kept as surface radiances and converted to brightness temperature after merging.

2.5. Orthomosaic Comparison and Development of the Novel Swath-Based Method

To investigate the influence of blending modes on the orthomosaic generation, the three Agisoft PhotoScan methods were tested and compared by subtracting the vignetting corrected temperature values of one orthomosaic from the other (Figure 3). Agisoft PhotoScan defines the blending methods as [38]:
  • Mosaic: orthophotos are decomposed into high- and low-frequency components. A weighted average is calculated separately for low-frequency and high-frequency components (with different weights), which are subsequently combined into the final orthomosaic, where pixels closer to nadir have higher importance.
  • Average: the weighted average pixel value from all available overlapping orthophotos is assigned to the corresponding pixel in the final orthomosaic.
  • Disable: each pixel value in the resulting orthomosaic is selected from a single orthophoto among all overlapping orthophotos based on the photo having the view closest to nadir. While the pixel value is not modified and each pixel represents the initially observed temperature at nadir, neighboring pixels may come from different photos.
As none of the Agisoft PhotoScan blending methods were specifically designed for thermal imagery, we proposed a novel approach that considers the rapid temperature change during a UAV flight and possible inconsistencies between flight lines, caused by wind and flight direction. Instead of computing the entire image dataset, the 150 orthophotos from each flight line were first combined, i.e., the mean value of overlapping pixels from multiple neighboring orthophotos was calculated separately along each of the 18 flight lines in order to create individual swaths. The forward overlap of 93% and the near-coincident acquisition time of neighboring overlapping orthophotos ensured all averaged pixels, representing radiance values, were acquired within less than 5 s, with minimal expected temperature variation between the averaged pixels. As there were approximately 1–2 min between the pixels of neighboring swaths, rapid changes in surface temperature in response to surface heating and wind effects can cause challenges for standard orthomosaicking approaches. To alleviate the influence of flight direction relative to the wind direction and to preclude abrupt temperature variations between neighboring swaths, a flight direction normalization method was implemented to produce an orthomosaic based on the 18 swaths. The neighboring swaths were normalized by assuming a 0 °C difference within the 60% overlapping areas, i.e., correcting for bias between swaths due to flight direction. The bias correction was calculated for each of the neighboring overlapping swaths and it was applied to the entire swath. As such, the first swath of the flight survey was used for correcting the second swath. Then, the second corrected swath was used for correcting the third swath and so forth. Starting with the first swath of the flight survey for the temperature normalization ensured that all swaths were subsequently adjusted to the first swath to remove temperature variability experienced during the 17 min of each UAV flight, which allowed all corrected swaths to be seamlessly stitched to an orthomosaic. Another advantage of the swath-based approach was the ability to compute the standard deviation when averaging the individual orthophotos to produce standard deviation maps to exhibit errors and uncertainty information to facilitate the interpretation of the final orthomosaic.

3. Results

The UAV-based thermal image data for the 12 flight surveys acquired over three dates (Table 1) were orthorectified and mosaicked using the three blending methods in Agisoft PhotoScan and our novel swath method (Section 2.5). Here, the results of the experiments, their associated sources of errors, their impacts on the temperature orthomosaics, and the evaluation of the blending methods are reported. In Section 3.1, the spatial variability between orthophotos was assessed in order to characterize camera errors (e.g., vignetting effect) and rapid changes in physical surface temperature. In Section 3.2, the effects of flight direction and wind orientation are quantified, while Section 3.3 showcases the results of the novel swath-based correction method including vignetteing correction and flight direction normalization to reduce wind effects in the produced orthomosaic. Finally, Section 3.4 presents a spatial intercomparison of the orthomosaics produced with the three blending modes in Agisoft PhotoScan and the validation of the three orthmosaic as well as the swath-derived results against field-based temperature measurements.

3.1. Calibration of Orthophotos to Remove Inconsistencies

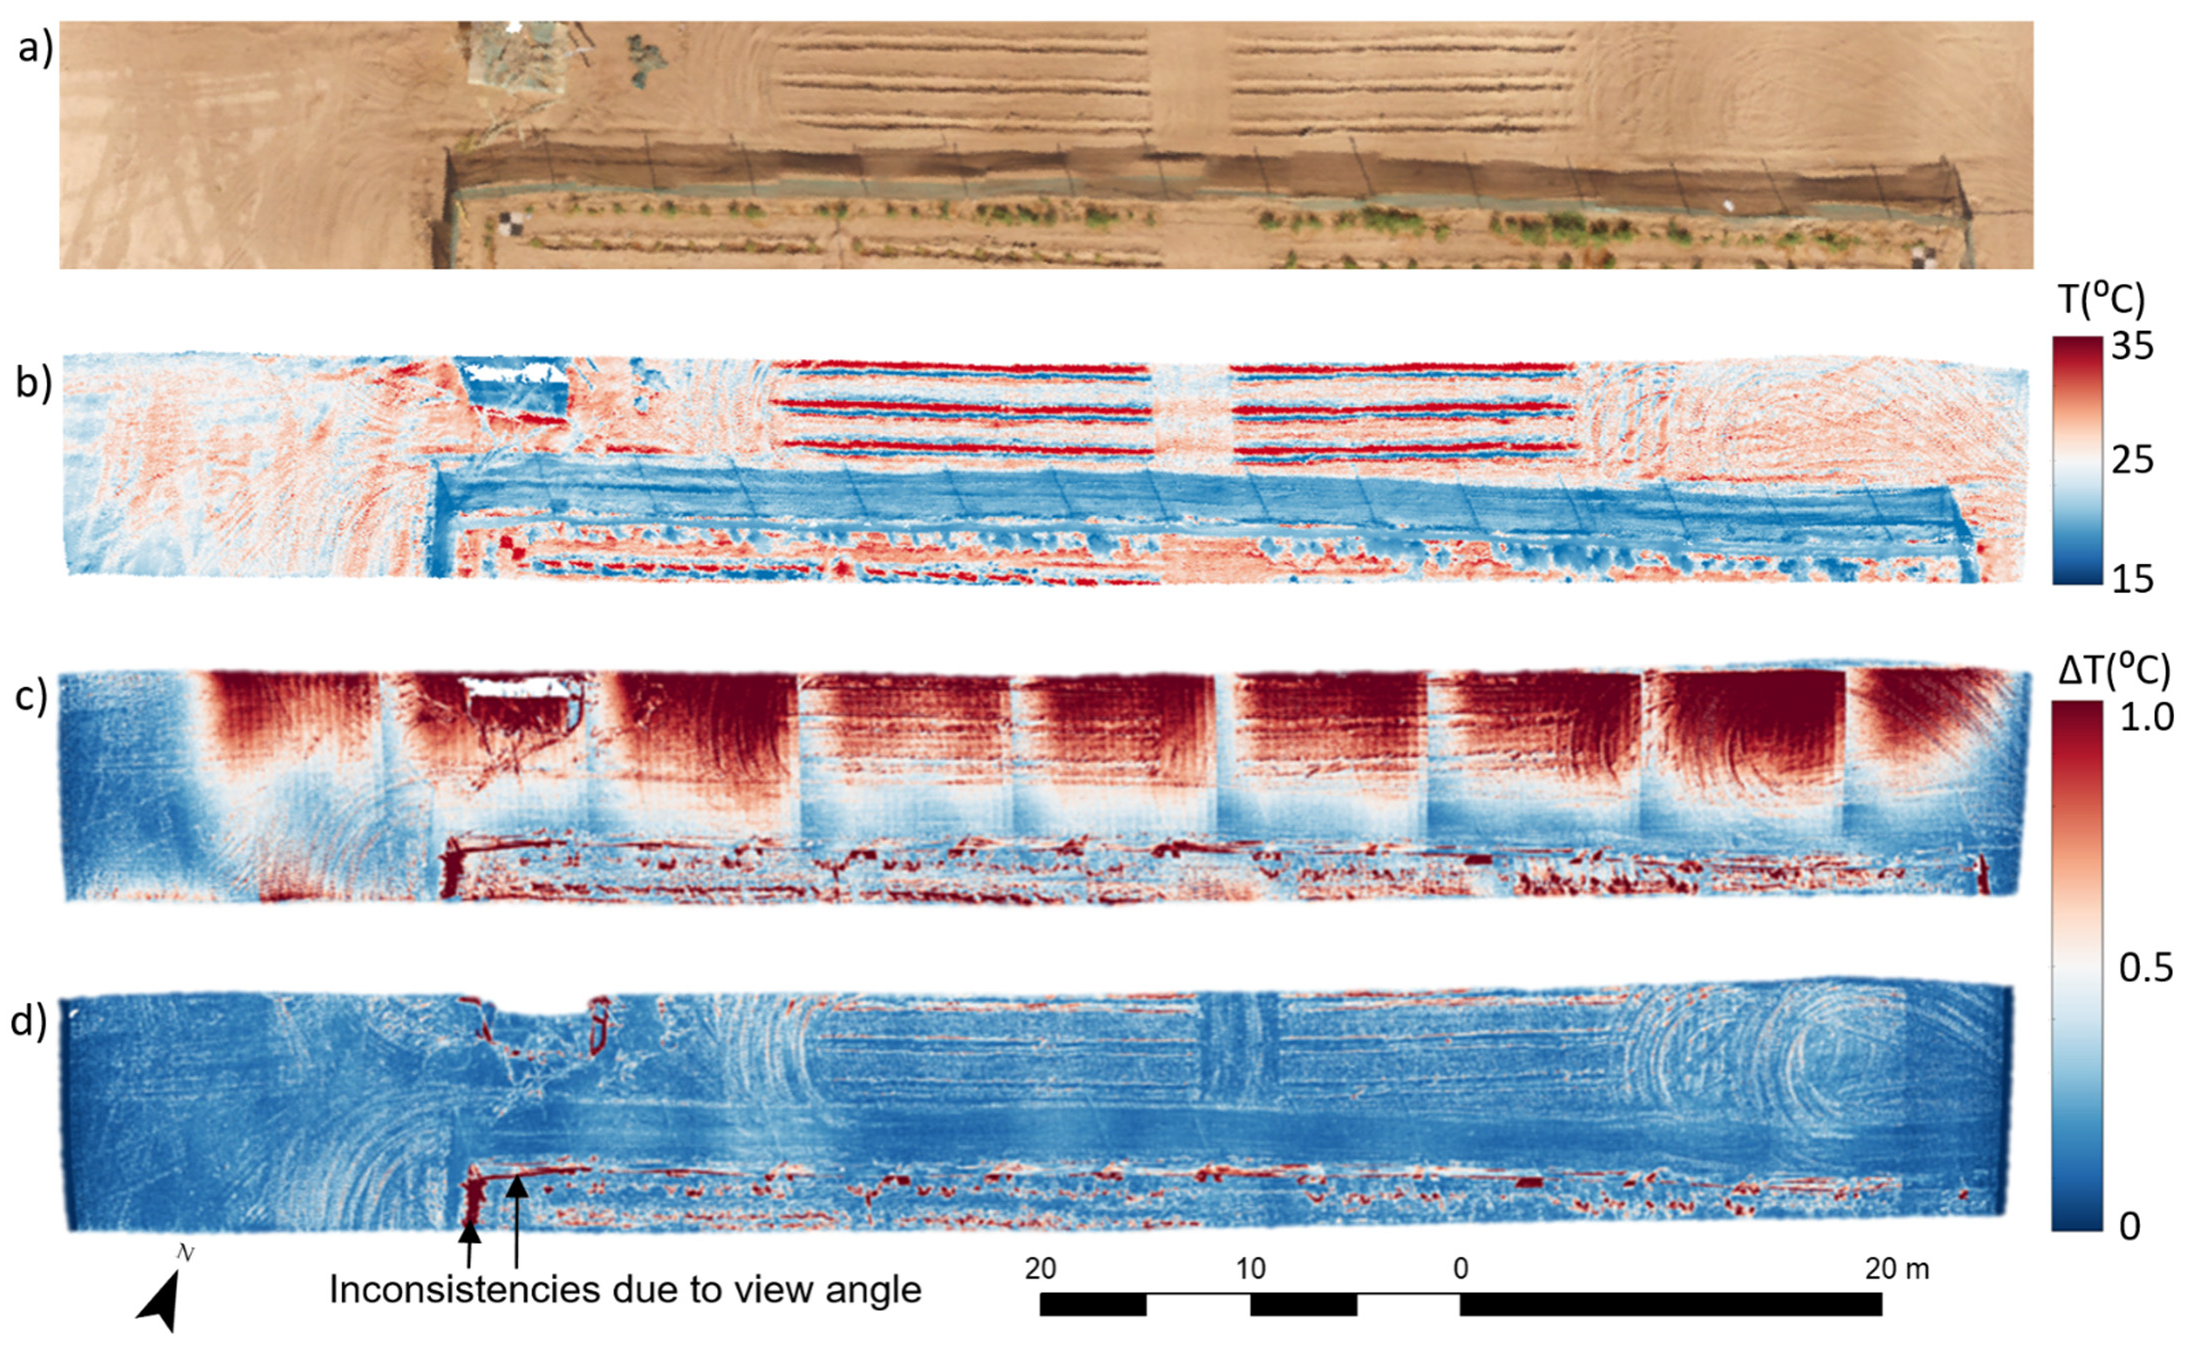
Individual orthophotos collected over the survey area were blended by averaging overlapping pixels to obtain a surface temperature map. However, inconsistencies between overlapping orthophotos can lead to inaccurate temperature retrievals in the final map. We computed the pixel-based standard deviation (STD) of orthophotos to evaluate and quantify the impact of combining uncalibrated imagery. One well-known source of error is the vignetting effect on the uncooled microbolometer focal plane array. We selected the STD for one flight line before and after vignetting correction [29], to demonstrate the effect of vignetting when averaging uncalibrated orthophotos (Figure 4). While the STD can reach up to 2.0 °C before vignetting correction, it decreased to less than 0.5 °C after correction (Figure 4). Over the entire flight line, the vignetting correction decreased the STD from 0.7 to 0.2 °C, illustrating the importance and the need to correct the imagery before mosaicking (Figure 4). Similar results (STD decreases between 50% and 70% in all cases) were found for other swaths in the same flight as well as for the other flights. Kelly et al. [30] recommended using only the central portion of the image, but our result demonstrates that it is not systematically a robust approach and that the central part of an image can also be impacted by vignetting effects. As a result, if not corrected for, vignetting can introduce significant errors when thermal imagery is combined during the orthomosaic generation.
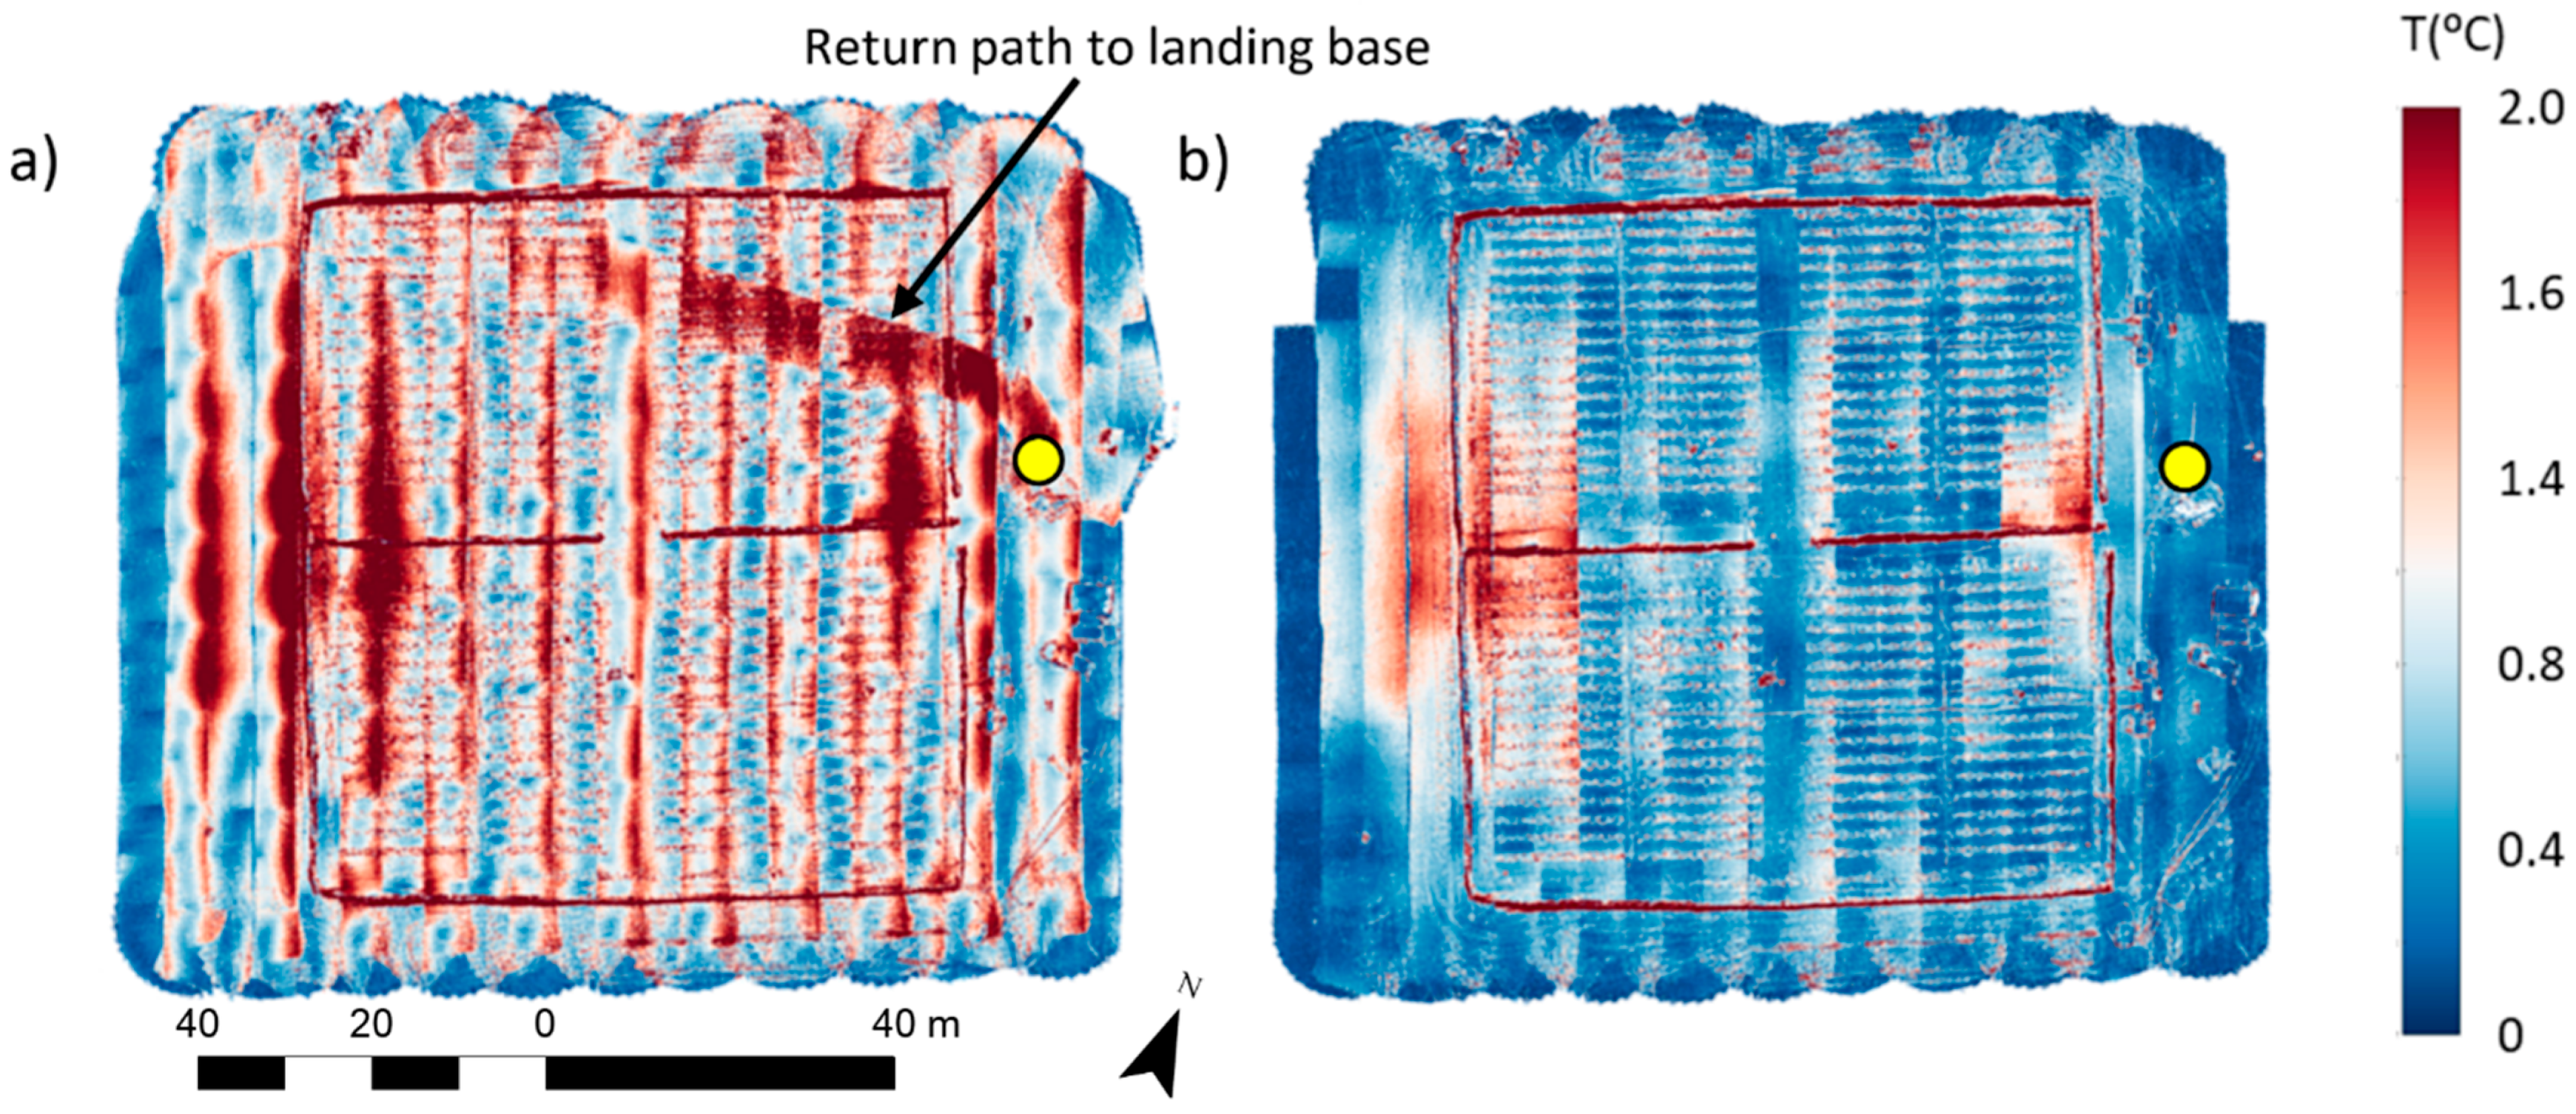
Similarly, we computed the pixel-based STD for all orthophotos collected over the surveyed area before and after calibration and vignetting correction (Figure 5). As observed previously, the vignetting correction reduced the temperature STD from 1.2 to 0.7 °C for the surveyed area. Importantly, the temperature STD was reduced to <0.5 °C for most for the area, demonstrating the efficiency of the applied correction. We also observed high STD values along the 2-m high fences (squared shape around the field and one line in the middle of the plant trial, Figure 5a,b), demonstrating large image inconsistencies when tall objects are imaged with varying off nadir view angles. For instance, photos collected with the fence within the field of view but along the edge of the photo, i.e., large off nadir view angle, caused the side of the fence to be imaged and thus, generated inconsistencies between orthophotos (this feature is also observed in Figure 4). In addition to the vignetting, high STD values were observed across Figure 5a from photos collected at the completion of the flight survey with the return of the UAV to the take-off/landing base. The high STD along this path clearly demonstrates the impact of rapid change in the physical surface temperature, with the returning UAV crossing areas previously recorded some 15 min earlier. This artifact was eliminated in the final map by removing the unnecessary orthophotos at the beginning and the end of the survey. However, two areas persisted with relatively high STD in Figure 5b, illustrating other inconsistencies between the orthophotos e.g., due to flight direction, short camera warmup period prior to data acquisition, or actual temperature changes occurring within the short timespan, within which the same location was observed from multiple overlapping photos (further details provided in Section 3.2).
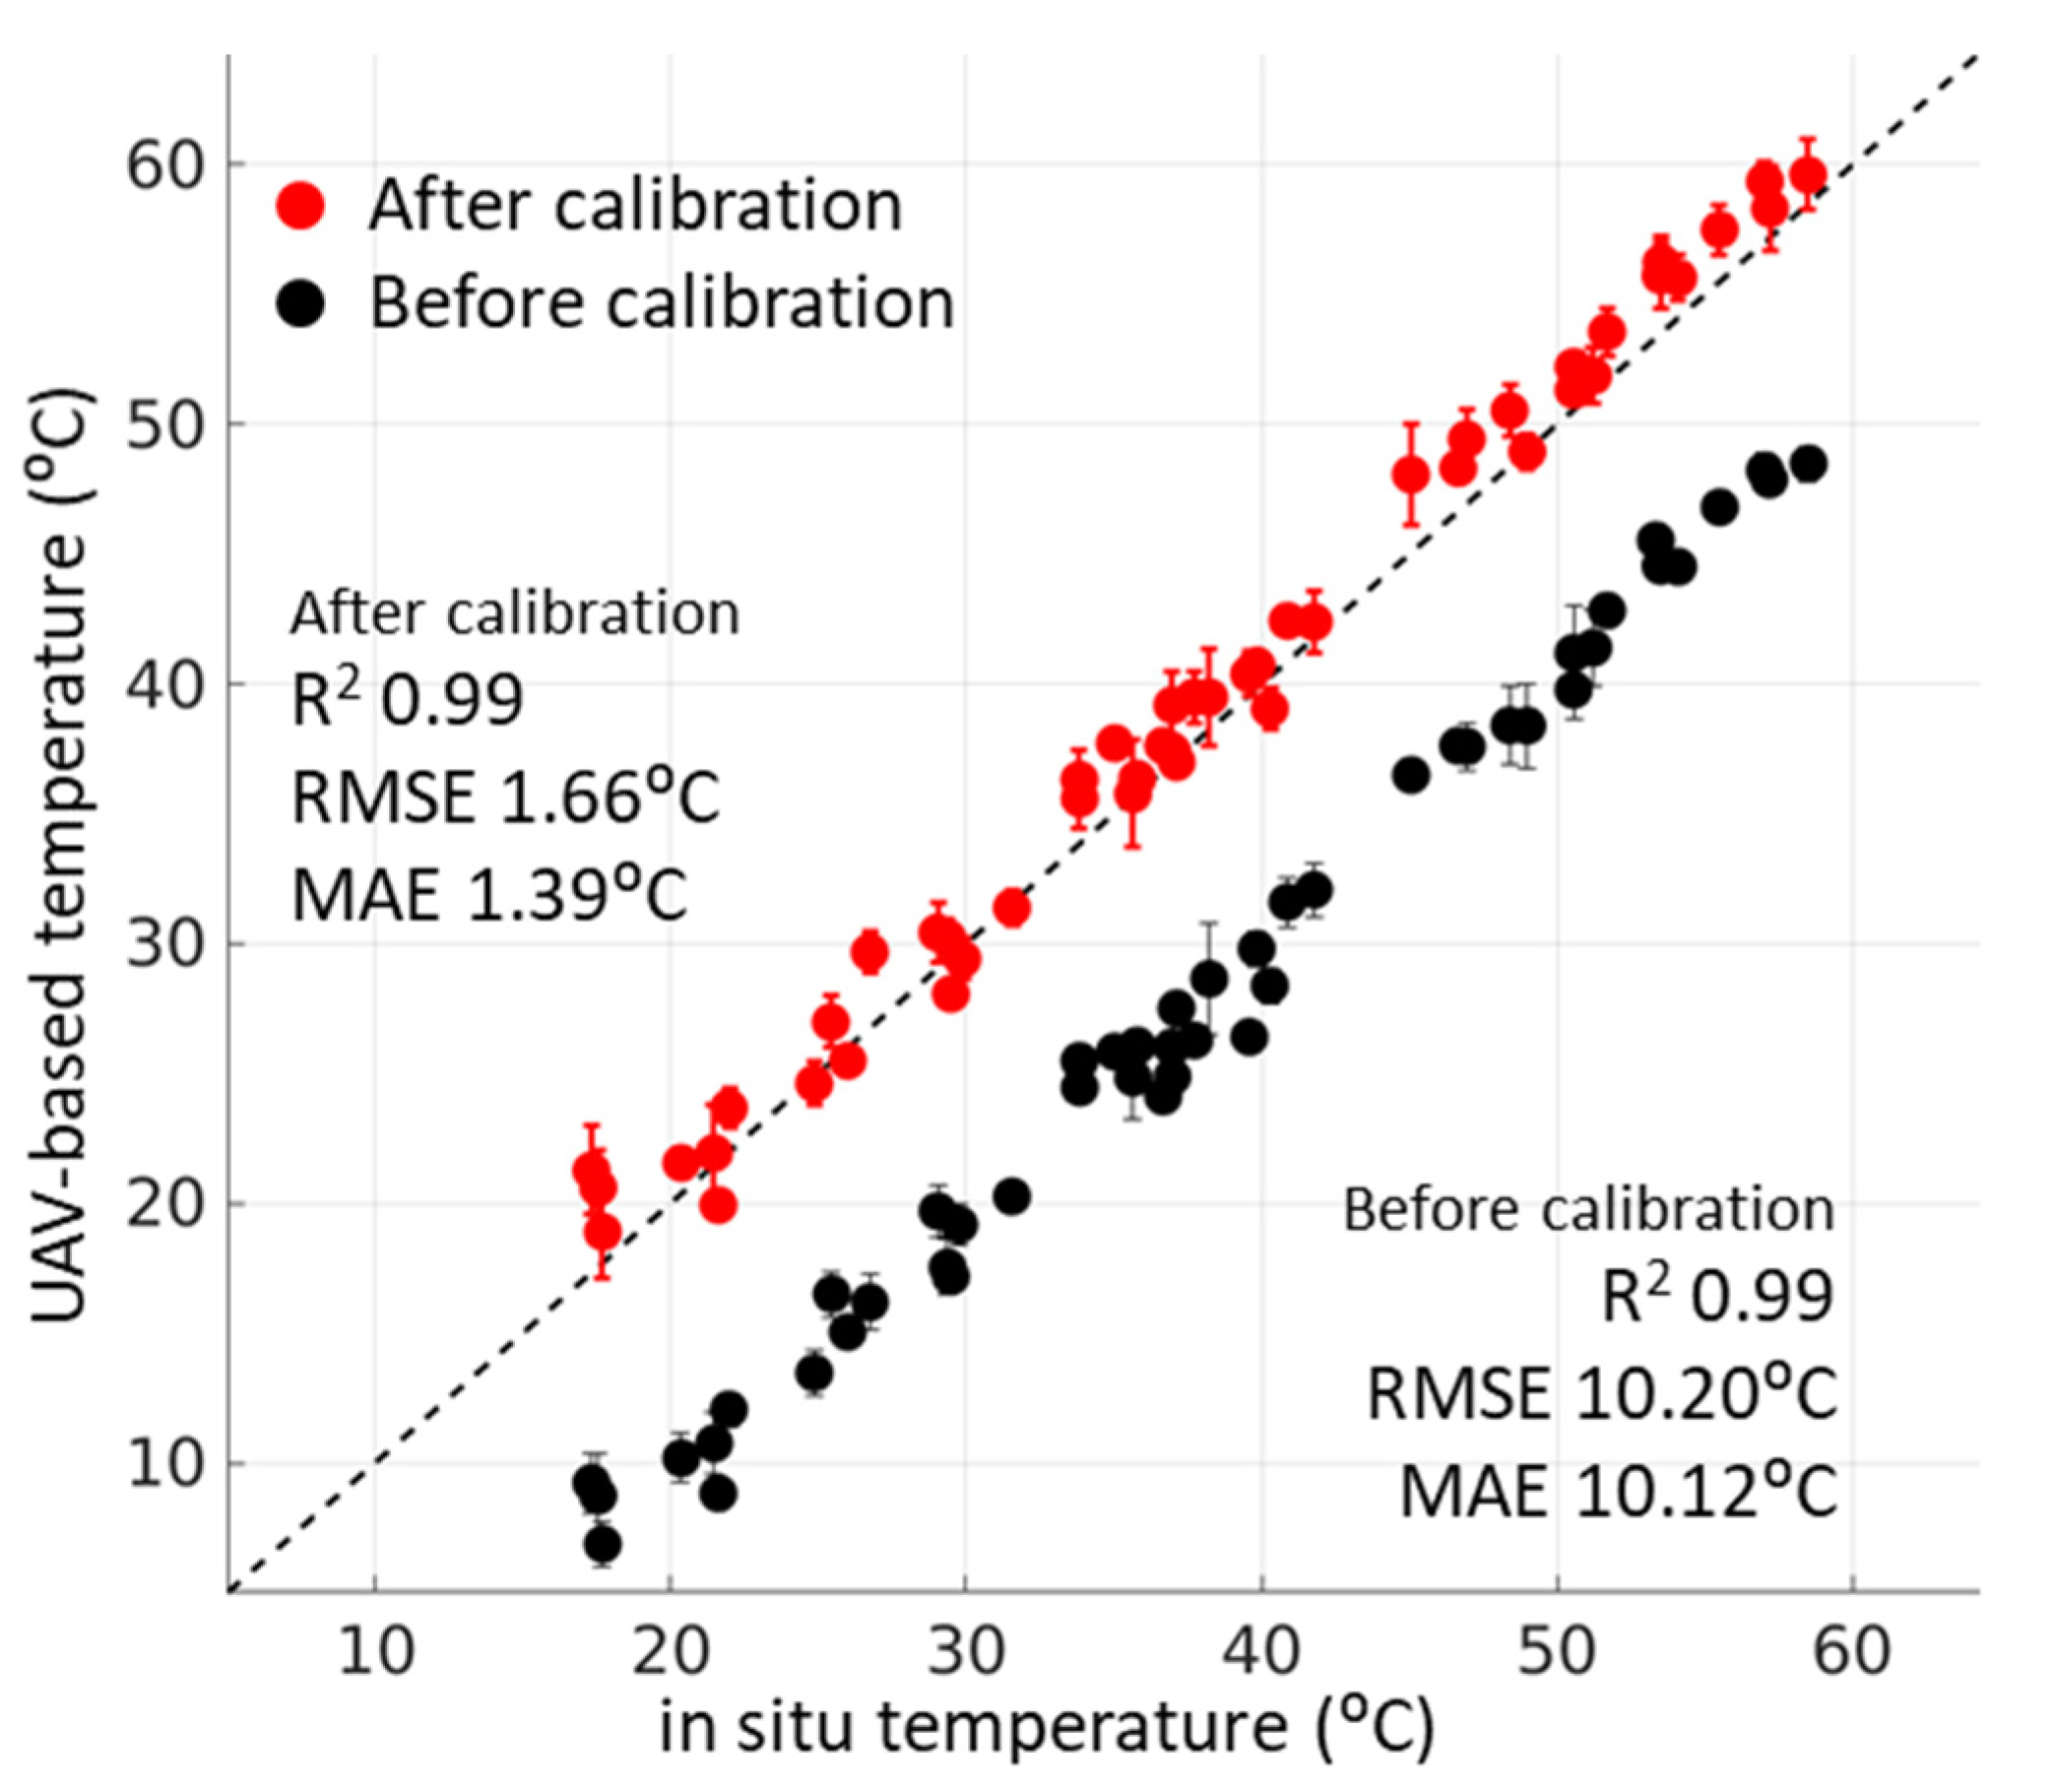
The high STD of the uncalibrated UAV data was also clearly reflected when assessed against field-based Apogee measurements. Using the spatially averaged UAV-based radiance (before brightness temperature retrieval) within the approximately 0.4 m2 field of view of each Apogee sensor, a significant improvement was achieved in the UAV-derived temperature measurements of individual orthophotos after vignetting correction [29]. In this case, the mean absolute error was reduced from 10.12 to 1.39 °C, while the root mean square error decreased from 10.20 to 1.66 °C (Figure 6).

3.2. Flight Direction Analysis

In this section, outbound and inbound orthophotos were computed separately to investigate the impact of the flight direction on the imaged temperature. Figure 7 presents the orthomosaic computed with the Average blending approach using only outbound (flight orientation of 66° north) orthophotos and only inbound (flight orientation of 246° north) orthophotos from 7 January 2018 at 09:16. When examining the bare ground temperatures, the inbound orthophotos exhibited significantly higher temperatures than the outbound orthophotos. We also detected a temperature increase throughout the flight duration (from top to bottom), following the rapid change of solar elevation and radiation in the morning. The difference map, produced by subtracting the inbound from the outbound orthophotos (Figure 7), presents a change of more than 2 °C in the measured temperature for most of the surveyed area. Although the difference is negative over the core part of the surveyed area, the edges of each flight line yielded a positive difference of about 1 °C, possibly as the result of the UAV slowing down before turning.
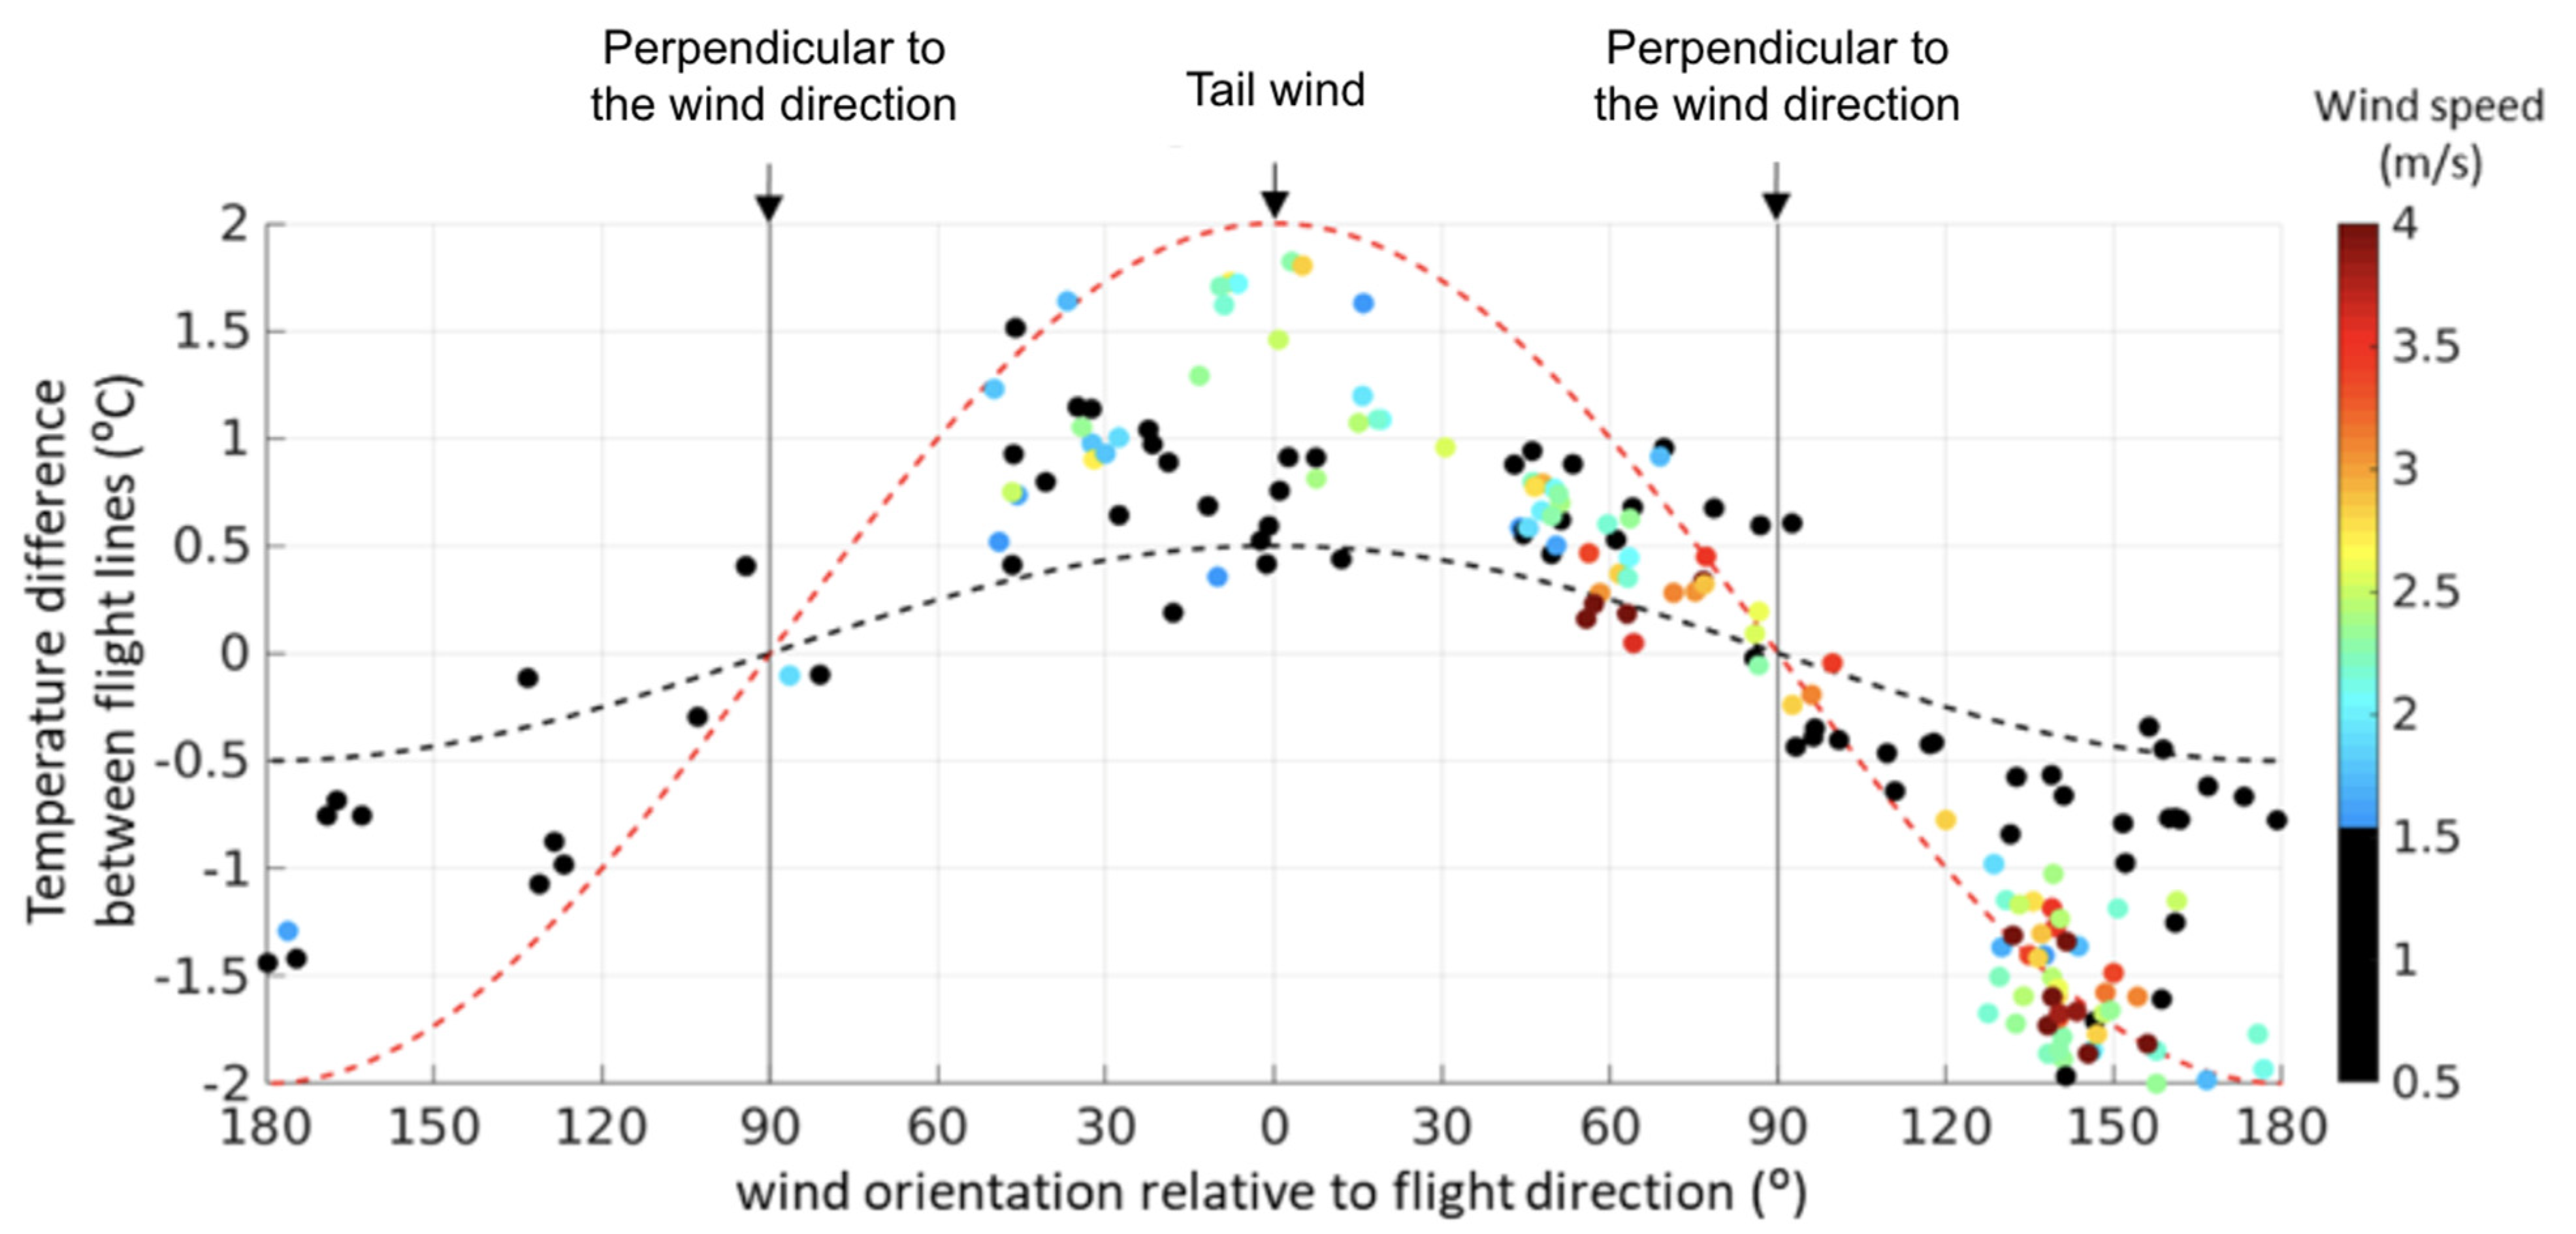
Recently, Kelly et al. [30] found that wind treatments performed in a laboratory caused changes in camera-recorded DN values. To explore the wind impact on the recorded temperatures during field conditions, we extracted wind speed and direction every minute during the flight duration from the weather station located near the center of the surveyed area (Figure 1). Then, the averaged temperature difference between overlapping inbound and outbound orthophotos acquired within a minute (to match the interval of in situ wind measurements) for the 12 flight surveys (totaling 183 min) were compared in relation to the wind and UAV flight direction, along with the wind speed ranging from 0 to 4 m/s during the data acquisition (Figure 8). The wind speed was not normalized to the UAV’s speed; hence, a tail wind of 3 m/s while flying at a speed of 2 m/s resulted in a wind speed effect on the camera of 1 m/s, while a head wind of 3 m/s produced a wind speed effect of 5 m/s. We found that the orthophotos collected with tail wind were systematically cooler (positive values in Figure 8) than the orthophotos with head wind, i.e., wind against the flight direction (negative values). On the other hand, the difference between inbound and outbound orthophotos is close to zero when the wind is perpendicular to the UAV flight direction, both at high and low wind speeds (Figure 7), indicating a strong influence of the wind direction on the UAV-derived temperatures. Regarding the impact of wind speed, low speeds (<1.5 m/s) present relatively lower temperature differences (generally <1 °C) between inbound and outbound orthophotos than higher wind speeds (generally 1–2 °C), when the wind orientation is more than 30° off perpendicular to the flight direction. Temperature differences between neighboring inbound and outbound orthophotos were generally highest at wind speeds >2 m/s when the wind direction was within 50° of tail or head wind relative to the flight direction. In fact, wind speeds >3 m/s, but within 30° of the perpendicular angle to the flight direction caused lower temperature differences (<0.5 °C) between inbound and outbound orthophotos than low wind speeds (<1.5 m/s) with an orientation closely aligned with the flight direction, indicating that flight direction relative to wind direction is of more importance than wind speeds during thermal UAV data acquisition. The findings also highlight the need for wind corrections when collecting thermal data.

3.3. Novel Swath-Based Correction for Orthomosaicking

Based on the results presented in Section 3.1 and Section 3.2, which demonstrated the benefits of calibration and vignetting corrections to reduce inconsistencies in individual orthophotos and the effects of flight and wind direction, our proposed swath-based correction method was applied to produce orthomosaics with a vignetting correction of individual orthophotos and a subsequent flight direction normalization based on individual swaths. While the flight direction normalization and wind correction did not remove all differences between overlapping areas of neighboring flight lines, it did reduce the temperature differences (Figure 9a,b). In addition, the swath-based correction also normalized temperatures throughout each UAV flight survey despite temperature increases occurring between the start and finish of the UAV flights, especially for the early morning flights. Figure 9c demonstrates an example of a calibrated and flight direction normalized orthomosaic produced with our novel swath-based correction method.
On average for the 12 UAV flights, the swath-based correction reduced the mean absolute difference (MAD) between inbound and outbound orthophotos by 0.38 °C, with a maximum improvement in MAD of 0.96 °C for the first morning flight on 20 December 2017 (Table 2). There was a tendency that higher mean wind speeds produced higher MAD values between inbound and outbound orthophotos. The MAD before flight direction normalization and the MAD difference between before and after flight direction normalization showed a positive relationship (R2 = 0.73), indicating that the higher the MAD is between inbound and outbound orthophotos before flight direction normalization, the larger an improvement can be achieved by the flight direction normalization step. Generally, the 156/336° flight direction resulted in a lower MAD between inbound and outbound orthophotos before and after flight direction normalization than the 66/246° flight direction. With predominant wind directions from either northeast or southwest over the study area, the 156/336° flight direction occurred perpendicular to the wind direction, which explains the lower MAD between inbound and outbound orthophotos and aligns with the results presented in Section 3.2.

3.4. Spatial Intercomparison of Orthomosaics Produced with Different Methods

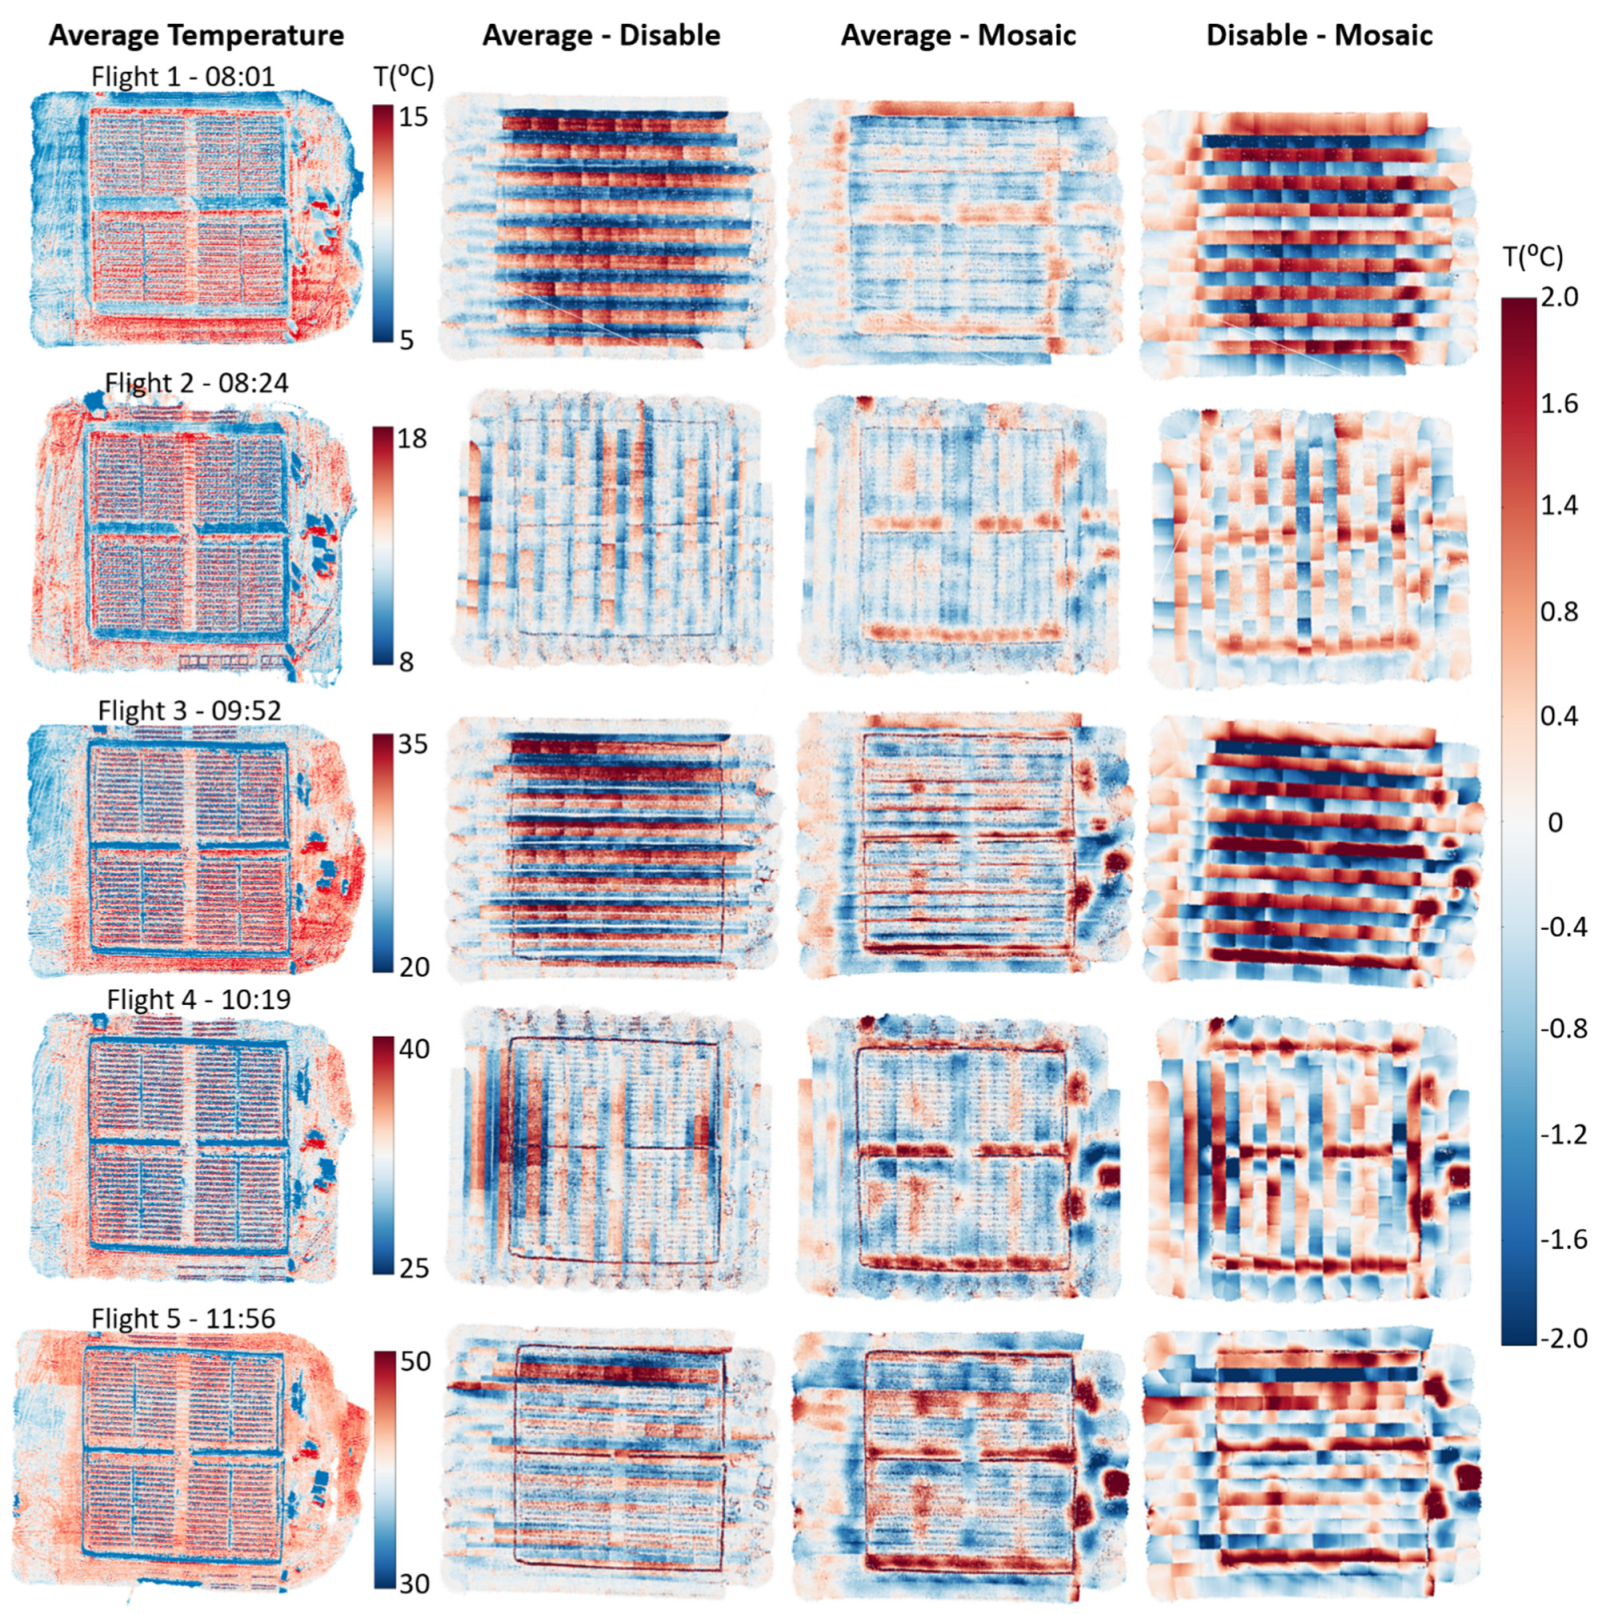
Agisoft PhotoScan provides three blending modes for orthomosaic generation. To investigate the suitability of the blending modes for thermal data processing of agricultural fields, orthomosaics were produced for each blending mode (see Section 2.5) and compared for the five flights on 20 December 2017 (Figure 10), illustrating thermal data acquisitions over a range of surface temperatures, wind speeds, and two different flight directions. Differences between the Average and Disable blending modes (Figure 10) were most noticeable for flight surveys 1 and 3 collected along flight directions of 66/246°. The temperature differences highlight the variability between images relative to the flight direction, as the Average blending mode computes the full extent of all images available, whereas the Disable blending mode only utilizes the center part of the images closest to nadir (no images overlapping). While the temperature differences were smaller between the orthomosaics processed with the Average and Disable blending modes for the three other flight surveys, the comparison of flight surveys 2, 4, and 5 indicates that flight direction is not the only factor influencing the temperatures recorded by the sensor. Even though flight survey 5 data were collected in the same flight direction as flight surveys 1 and 3, the wind speed was lower during flight survey 5, which may have contributed to the smaller temperature differences between the orthomosaics produced with the Average and Disable blending modes.
The comparison of the orthomosaics produced with the Average and Mosaic blending modes (Figure 10) highlights a gradual increase in temperature differences throughout the morning. The main difference in temperature occurs in shaded areas along the fence through the middle of and surrounding the plant trial. The shaded areas were relatively warmer (from +0.5 to +2 °C) in the orthomosaic produced with the Average blending mode than those processed with the Mosaic blending mode. This temperature anomaly was attributed to the influence of cooler objects on the surrounding warm area. Similarly, the three hot spots on the right side of the maps correspond to two white water tanks and a white pergola. The white surfaces (becoming increasingly cooler than the darker surroundings when radiation increased during the morning) influenced the temperature measurements of the neighboring area of the hot soil surface during the orthomosaic processing using the Mosaic blending mode. This effect becomes more noticeable with increasing temperatures closer to noon, causing the temperature gradient between white features and surrounding bare ground to increase. As the Mosaic mode blends the highest frequency of values along the seamline only (also called stitching line), increasing distance from the seamline results in a smaller number of pixels being subject to blending. Thus, the Mosaic mode creates processing artifacts by smoothing the observed temperatures adjacent to highly temperature-contrasted surfaces. Consequently, the temperature of the final orthomosaic does not represent the physical temperature observed.
The temperature differences between the orthomosaics processed with the Disable and Mosaic blending modes (Figure 10) appeared somewhat similar to those between the Average and Disable blending modes, i.e., the striping effect (based on flight direction) from the Disable mode and the artifacts of contrasting surface temperatures from the Mosaic mode had the highest temperature differences. However, the fence lines were not as noticeable in the Disable and Mosaic-blended orthomosaics due to their predominant nadir viewing, indicating that tall objects in the field of view are mainly influenced by the Average blending mode, which incorporates all viewing angles in the final orthomosaic. Overall, the temperature of each produced orthomosaic was significantly different for each blending mode, with the temperatures observed from the Disable mode being strongly influenced by the flight direction.
UAV-based orthomosaic temperatures were evaluated against ground-based temperature measurements of bare ground from Apogee sensors. To ensure a robust comparison, ground-based measurements were extracted at the acquisition times for each UAV flight survey. To independently evaluate the performance of each blending mode and our novel swath-based correction method, the radiance of each orthomosaic was extracted and then spatially averaged before brightness temperature retrieval within the field of view of the four installed field-based Apogee sensors. While the swath-based correction method and the three blending modes used for the orthomosaic generation in Agisoft PhotoScan yielded similar R2 results, the swath-based correction, including the flight direction normalization step to reduce wind effects, produced significantly lower MAE, MD and RMSE (Table 3). This result confirms that the approach used for orthomosaic generation can significantly affect the derived temperatures. Moreover, in-flight effects (e.g., wind speed and direction) can be reduced when the thermal UAV data is processed swath by swath using our proposed swath-based correction. The swath-based correction also normalizes temperatures to the time of the first swath to reduce the effects of rising temperatures occurring during a UAV flight survey, which could have major effects when comparing temperature of plants between the first and last flight lines.

4. Discussion

To retrieve UAV-based temperature measurements suitable for precision agriculture, an accuracy better than 1 °C is often desired, but uncooled microbolometers are typically subject to sensor drift and erratic measurements during the warmup period [44], vignetting effects [29] and other in-flight factors causing measurement errors, e.g., wind speed and direction [30]. These error factors, together with the lack of understanding of image inconsistencies introduced during the mosaicking process, motivated this investigation, and the design of a new mosaicking scheme better suited for thermal UAV data. Our research results clearly demonstrated that the existing blending modes (e.g., Disable, Average and Mosaic in Agisoft PhotoScan) for orthomosaic generation were not suited for the thermal data acquired with the flight planning configurations used herein, especially during windy conditions and with the wind direction aligned within 50° of the flight direction.
Previous research studies have focused almost exclusively on radiometric sensor calibration and georectification [29,31,37]. However, only a few studies have discussed the influence of thermal variability between orthophotos and its impact on the mosaicking [31,38]. The Average blending mode has proven effective for producing thermal infrared orthomosaics in some studies, especially for UAV data collected with consistent and adequate forward overlaps and sidelaps [31,38]. To enable full coverage of the plant experiment within the duration of a single UAV flight, the collection of the thermal infrared data in our study was carried out with a large (93%) forward overlap but a relative low (60%) sidelap, which is suboptimal for the Average, Mosaic and Disabled blending modes. Hence, better orthomosaicking results, specifically with the Average blending mode, might have been achievable with a larger sidelap than used herein. While the collection requirements in terms of forward overlap and sidelap of thermal infrared data affect existing blending approaches for orthomosaicking, our novel swath-based approach is more effective at handling inconsistencies in forward overlap and sidelap, as each swath is normalized to the first swath. Hence, the swath-based approach presented herein provides greater flexibility for flight planning of thermal infrared data collections, which can greatly improve flight efficiency and optimize data collection, especially by reducing the required sidelap, within the duration of a single UAV flight. The initial step of our novel swath-based orthomosaic approach also applied an averaging step of individual pixels from individual overlapping orthophotos to produce a swath. Characterizing inconsistencies (e.g., by using the STD, Figure 4 and Figure 5) between overlapping orthophotos represents an important step for identifying errors and verifying the efficiency of initial calibrations and corrections steps. Moreover, quantifying uncertainties is a critical step for both data producers and end-users, as it guides further improvements in data production and/or rational use of the data into models. The results of this study indicate that calibration and vignetting correction are essential in the preprocessing stages and significantly reduce the STD and associated radiance and brightness temperature measurements before mosaicking. Nonetheless, the calibration is often different between sensors and needs to be performed regularly [28]. Still, inconsistencies can remain in the dataset (e.g., Figure 5), reducing the accuracy of the final thermal infrared orthomosaics.
The orientation of the tomato plant leaves may vary between overlapping photos along a flight line or between neighboring flight lines, especially due to wind gusts. However, the fence surrounding the plant sections was in place for the full duration of the plant experiment to minimize wind effects on the tomato plants. As the swath-based approach adopted an averaging step for neighboring photos along each flight line and a normalization step between neighboring flight lines, the average recorded temperature of the plants in the resulting orthomosaics were based on multiple view angles of the leaf surfaces of the plants. Abrupt changes in leaf orientation and surface temperatures between neighboring orthophotos will appear with high standard deviations after calibration and vignetting correction, as exemplified in Figure 5b. While these wind-induced effects on plant leaf orientation and surface temperature influence the recorded temperature measurements, the swath-based correction method for orthomosaicking focused directly on the wind effects on the sensor and how they impacted the resulting orthomosaic. Hence, the impact of the wind on the sensor is consistent across all pixels within a single photo and independent of surface properties. Changes to leaf orientation and position due to wind effects may, however, complicate the identification of matching points during the dense point cloud generation and hence decrease the quality of the orthorectification. Such effects were considered negligible in our study due to the wind protection of the fence and as the plant leaf size was similar to the ground sampling distance of the thermal data.
Commercial software packages used to generate orthomosaics were explicitly developed for optical-based systems. Thus, the blending modes proposed are generally not suited to thermal data [31]. Moreover, none of the software packages can retrieve the temperature variability between orthophotos, limiting our understanding of errors in order to correct them or integrate them when used in models. In this study, we intercompared the three blending modes for orthomosaic generation available in the Agisoft PhotoScan software (Average, Disable and Mosaic) and assessed their accuracies against field-derived temperature measurements. The temperature differences between the three blending modes revealed that the selected orthomosaic approach will significantly affect the retrieved temperatures. The Disable and Mosaic methods were found to be sensitive to flight conditions: for instance, both methods generated striping effects parallel to the flight direction (Figure 10). Additionally, the Mosaic method smoothed the retrieved temperature in areas with high temperature gradients, particularly for the white irrigation tanks and shaded areas (Figure 10), causing erroneous temperatures to be retrieved. The Average method uses all the pixels that were captured within the field of view of the sensor. Thus, the proportion of off-nadir information, and consequently the surface signature, increased in comparison to the other methods. The measurement geometry within individual images affects the observed temperatures, and so the spatial pattern of the temperature data appears smoother too. Hence, the side of relatively tall objects is observed at off-nadir viewing angles within the field of view, which creates inconsistencies in the final orthomosaic. Future work may explore the integration of a 3D model of the surface generated from geo-referenced RGB surveys in the orthomosaic generation to improve temperature estimation of tall objects (e.g., trees) viewed off-nadir within the field of view of a camera. Overall, the intercomparison highlighted the significant temperature differences between the three orthomosaic methods, and the need for improved approaches better suited for thermal image data.
Given that most of the thermal cameras onboard UAVs use miniaturized uncooled thermal sensors, these systems have no temperature control and, consequently, are sensitive to external parameters. Kelly et al. [30] assessed the wind effects on sensor temperature in laboratory conditions and found digital numbers to be significantly altered by wind. We explored how in-field wind impacts the temperature recorded by the sensor and its effect on generated orthomosaics. With a difference of up to 2 °C between inbound and outbound swaths (Figure 7), we demonstrated the effect of the wind speed and direction and its impacts on the ability to retrieve accurate surface temperature from orthomosaics. The wind effect was particularly apparent when the wind direction aligned within 50° of the flight direction, whereas wind perpendicular to the flight direction had limited or no effect, even at wind speeds up to 4 m/s. With a perpendicular wind orientation in relation to the flight direction, the thermal sensor is exposed to wind in a similar manner along neighboring flight lines, albeit from opposites sides of the sensor. When the wind direction aligns with the flight direction, the sensor will be exposed to tail wind along one flight line while the sensor will experience head wind along the next flight line, which causes distinct differences in sensor exposure to wind and hence produces large differences in temperature retrievals. However, despite the observed trends for wind direction, Figure 8 still showed some outliers for low wind speeds. The difference in temperature retrievals caused by wind speed and direction were independent of “real” physical change of the surface temperature. To consolidate our findings, we introduced a flight direction normalization step to reduce wind effects of the swaths, representing merged orthophotos with overlapping pixels being averaged, prior to stitching the swaths together to form an orthomosaic. Our results demonstrated that when assessed against coincident field-based Apogee temperature measurements, the novel swath-based correction approach, including the flight direction normalization between neighboring flight lines, significantly improved the temperature retrievals in the final orthomosaic compared to the three blending modes in Agisoft PhotoScan. While the information on wind speed and direction collected from the weather station and the in situ surface temperature measurements acquired by the Apogee infrared radiometers provided useful information for analysis and validation, it is important to note that the application of the novel swath-based correction method for orthomosaicking does not require any in situ inputs.
Our newly developed swath-based correction method represents an approach specifically designed to increase the accuracy of thermal infrared orthomosaics. With an available orthomosaic approach that is effective at reducing inconsistencies currently experienced with standard blending modes, improved farm management can be realized through reduction of wind effects and enabling quantification of errors using our proposed STD approach between neighboring orthophotos. While the literature provides examples of many precision agricultural applications for UAV-based thermal infrared data, including surface flux retrievals for evapotranspiration studies [51], phenotyping [28], plant water stress assessment [52], and irrigation scheduling [53], they suffer from inconsistencies that would inevitably be introduced by wind effects, especially wind direction, and the existing orthomosaic approaches. Even when applying best-practice field data collections of temperature-controlled ground references [54], inconsistencies from wind effects and the generation of an orthomosaic still exist within the dataset. Hence, our proposed method may have significant implications for thermal data use in precision agriculture, through provision of more consistent and reliable data, as long as other calibration steps, such as those presented by Aragon et al. [29] are also followed.

5. Conclusions

Rapid developments in UAV capabilities, particularly their ability to integrate uncooled miniaturized thermal sensors, provide a unique opportunity to observe surface temperature at unprecedented spatial and temporal resolutions. However, uncooled sensors are less accurate and more error-prone to wind effects than cooled sensors. Such errors are often further exacerbated by the applied orthomosaic methods, which are generally designed for optimal data stitching. Thus, our research focused on developing a new approach suited for orthomosaicking of thermal data. Our proposed approach incorporated a flight direction normalization step to reduce wind effects between neighboring swaths obtained from opposing flight directions prior to swath stitching. In addition, our swath-based correction also enables an assessment of temperature inconsistencies between adjacent overlapping orthophotos within a swath, based on a simple standard deviation calculation for the thermal data to facilitate interpretation of thermal data consistency. Wind effects on the uncooled thermal camera were identified as a significant source of error, impacting the accurate measurement of surface temperatures from UAV platforms for precision agriculture. Based on our new swath-based correction method, our results showed significant improvement in temperature retrievals in comparison to other existing blending modes, when validated against in situ temperature measurements.
To date, there is still a lack of specific UAV-based thermal processing protocols and quality assurance steps for quantifying data uncertainties. While individual processing and calibration steps have been suggested, including those presented herein, they are often affected by both the time and day of year and environmental considerations, such as wind, temperature and humidity, which may change within the duration of individual UAV flight surveys. Further research should examine interactions between sensor configurations, processing routines and environmental factors to provide guidelines feasible for application specific purposes. The integration of coincident optical and thermal UAV data may also lead to potential improvements. For example, an RGB-derived digital elevation model may assist the orthorectification process of thermal data to take into consideration off-nadir information to remove directional viewing effects. Extended research should also examine the use of externally temperature-controlled shutters for thermal cameras (e.g., ThermalCapture Calibrator from TeAx) for more stable temperature retrievals and reduction of wind effects. Despite further capacity to improve thermal UAV-based data processing workflows and output temperature maps, our research provides a significant contribution to future studies seeking to reduce wind effects and achieve more consistent and higher accuracy thermal infrared orthomosaics.

Author Contributions

Conceptualization, Y.M., B.A. and M.F.M.; methodology, Y.M., B.A. and S.K.A.-M.; software, Y.M.; validation, Y.M., B.A. and S.K.A.-M.; formal analysis, Y.M. and K.J.; investigation, Y.M.; resources, Y.M. and K.J.; data curation, Y.M.; writing—original draft preparation, Y.M., K.J. and M.F.M.; writing—review and editing, Y.M., K.J. and M.F.M.; visualization, Y.M., K.J. and M.F.M.; supervision, M.F.M.; project administration, M.F.M.; funding acquisition, M.F.M. All authors have read and agreed to the published version of the manuscript.

Funding

This research was funded by King Abdullah University of Science and Technology (KAUST) and supported by Competitive Research Grant Nos. URF/1/2550-1 and URF/1/3413-01.

Data Availability Statement

The datasets for this manuscript are not publicly available because they are still under embargo, but a database including all field and UAV data will become available in the future. Requests to access the datasets should be directed to K.J., [email protected].

Acknowledgments

We would like to thank Mark Tester, Mitchell J.L. Morton and Gabriele M. Fiene from the Center for Desert Agriculture, The Salt Lab, King Abdullah University of Science and Technology for designing and running the plant experiment. We would also like to acknowledge Magdi A.A. Mousa and his team at the King Abdulaziz University Agricultural Research Station in Hada Al-Sham for undertaking day-to-day duties of the plant experiment such as irrigation, fertilization, removal of weeds and plot maintenance. B.A. acknowledges additional research support by an appointment to the NASA Postdoctoral Program at the Jet Propulsion Laboratory, California Institute of Technology, administered by Universities Space Research Association under contract with NASA.

Conflicts of Interest

The authors declare no conflict of interest.

References

  1. Basso, B.; Antle, J. Digital agriculture to design sustainable agricultural systems. Nature 2020, 3, 254–256. [Google Scholar] [CrossRef]
  2. Gebbers, R.; Adamchuk, V.I. Precision Agriculture and Food Security. Science 2010, 327, 828–831. [Google Scholar] [CrossRef]
  3. Whitcraft, A.K.; Becker-Reshef, I.; Justice, C.O.; Gifford, L.; Kavvada, A.; Jarvis, I. No Pixel Left behind: Toward Integrating Earth Observations for Agriculture into the United Nations Sustainable Development Goals Framework. Remote Sens. Environ. 2019, 235, 111470. [Google Scholar] [CrossRef]
  4. McCabe, M.F.; Rodell, M.; Alsdorf, D.E.; Miralles, D.G.; Uijlenhoet, R.; Wagner, W.; Lucieer, A.; Houborg, R.; Verhoest, N.E.C.; Franz, T.E.; et al. The future of Earth observation in hydrology. Hydrol. Earth Syst. Sci. 2017, 21, 3879–3914. [Google Scholar] [CrossRef] [Green Version]
  5. Tmušić, G.; Manfreda, S.; Aasen, H.; James, M.R.; Gonçalves, G.; Ben-Dor, E.; Brook, A.; Polinova, M.; Arranz, J.J.; Mészáros, J.; et al. Current Practices in UAS-based Environmental Monitoring. Remote Sens. 2020, 12, 1001. [Google Scholar] [CrossRef] [Green Version]
  6. Colomina, I.; Molina, P. Unmanned Aerial Systems for Photogrammetry and Remote Sensing: A Review. ISPRS J. Photogramm. Remote Sens. 2014, 92, 79–97. [Google Scholar] [CrossRef] [Green Version]
  7. Anderson, K.; Gaston, K.J. Lightweight Unmanned Aerial Vehicles will Revolutionize Spatial Ecology. Front. Ecol. Environ. 2013, 11, 138–146. [Google Scholar] [CrossRef] [Green Version]
  8. Vasterling, M.; Meyer, U. Challenges and Opportunities for UAV-Borne Thermal Imaging. In Thermal Infrared Remote Sensing: Sensors, Methods, Applications; Springer: Dordrecht, The Netherlands, 2013. [Google Scholar]
  9. Aasen, H.; Honkavaara, E.; Lucieer, A.; Zarco-Tejada, P.J. Quantitative Remote Sensing at Ultra-High Resolution with UAV Spectroscopy: A Review of Sensor Technology, Measurement Procedures, and Data Correctionworkflows. Remote Sens. 2018, 10, 1091. [Google Scholar] [CrossRef] [Green Version]
  10. Adão, T.; Hruška, J.; Pádua, L.; Bessa, J.; Peres, E.; Morais, R.; Sousa, J. Hyperspectral Imaging: A Review on UAV-Based Sensors, Data Processing and Applications for Agriculture and Forestry. Remote Sens. 2017, 9, 1110. [Google Scholar] [CrossRef] [Green Version]
  11. Zarco-Tejada, P.J.; Berni, J.A.J.; Suárez, L.; Sepulcre-Cantó, G.; Morales, F.; Miller, J.R. Imaging Chlorophyll Fluorescence with an Airborne Narrow-Band Multispectral Camera for Vegetation Stress Detection. Remote Sens. Environ. 2009, 113, 1262–1275. [Google Scholar] [CrossRef]
  12. Lin, Y.; Hyyppä, J.; Jaakkola, A. Mini-UAV-Borne LIDAR for Fine-Scale Mapping. IEEE Geosci. Remote Sens. Lett. 2011, 8, 426–430. [Google Scholar] [CrossRef]
  13. Malbéteau, Y.; Parkes, S.; Aragon, B.; Rosas, J.; McCabe, M.F. Capturing the diurnal cycle of land surface temperature using an unmanned aerial vehicle. Remote Sens. 2018, 10, 1407. [Google Scholar] [CrossRef] [Green Version]
  14. Ziliani, M.G.; Parkes, S.D.; Hoteit, I.; McCabe, M.F. Intra-Season Crop Height Variability at Commercial Farm Scales Using a Fixed-Wing UAV. Remote Sens. 2018, 10, 2007. [Google Scholar] [CrossRef] [Green Version]
  15. Berni, J.A.J.; Zarco-Tejada, P.J.; Suárez, L.; Fereres, E.; Suarez, L.; Fereres, E. Thermal and Narrowband Multispectral Remote Sensing for Vegetation Monitoring from an Unmanned Aerial Vehicle. IEEE Trans. Geosci. Remote Sens. 2009, 47, 722–738. [Google Scholar] [CrossRef] [Green Version]
  16. Baluja, J.; Diago, M.P.; Balda, P.; Zorer, R.; Meggio, F.; Morales, F.; Tardaguila, J. Assessment of Vineyard Water Status Variability by Thermal and Multispectral Imagery Using an Unmanned Aerial Vehicle (UAV). Irrig. Sci. 2012, 30, 511–522. [Google Scholar] [CrossRef]
  17. Manfreda, S.; McCabe, M.F.; Miller, P.E.; Lucas, R.; Madrigal, V.P.; Mallinis, G.; Dor, E.B.; Helman, D.; Estes, L.; Ciraolo, G.; et al. On the Use of Unmanned Aerial Systems for Environmental Monitoring. Remote Sens. 2018, 10, 641. [Google Scholar] [CrossRef] [Green Version]
  18. Gago, J.; Douthe, C.; Coopman, R.E.; Gallego, P.P.; Ribas-Carbo, M.; Flexas, J.; Escalona, J.; Medrano, H. UAVs Challenge to Assess Water Stress for Sustainable Agriculture. Agric. Water Manag. 2015, 153, 9–19. [Google Scholar] [CrossRef]
  19. Bellvert, J.; Zarco-Tejada, J.P.J.; Marsal, J.; Girona, J.; González-Dugo, V.; Fereres, E. Vineyard Irrigation Scheduling Based on Airborne Thermal Imagery and Water Potential Thresholds. Aust. J. Grape Wine Res. 2016, 22, 307–315. [Google Scholar] [CrossRef] [Green Version]
  20. Santesteban, L.G.; Gennaro, S.F.D.; Herrero-Langreo, A.; Miranda, C.; Royo, J.B.; Matese, A. High-Resolution UAV-Based Thermal Imaging to Estimate the Instantaneous and Seasonal Variability of Plant Water Status within a Vineyard. Agric. Water Manag. 2017, 183, 49–59. [Google Scholar] [CrossRef]
  21. Tattaris, M.; Reynolds, M.P.; Chapman, S.C. A Direct Comparison of Remote Sensing Approaches for High-Throughput Phenotyping in Plant Breeding. Front. Plant Sci. 2016, 7, 1131. [Google Scholar] [CrossRef]
  22. Yang, G.; Liu, J.; Zhao, C.; Li, Z.; Huang, Y.; Yu, H.; Xu, B.; Yang, X.; Zhu, D.; Zhang, X.; et al. Unmanned Aerial Vehicle Remote Sensing for Field-Based Crop Phenotyping: Current Status and Perspectives. Front. Plant Sci. 2017, 8, 1111. [Google Scholar] [CrossRef]
  23. Ludovisi, R.; Tauro, F.; Salvati, R.; Khoury, S.; Mugnozza, G.S.; Harfouche, A. UAV-Based Thermal Imaging for High-Throughput Field Phenotyping of Black Poplar Response to Drought. Front. Plant Sci. 2017, 8, 1681. [Google Scholar] [CrossRef]
  24. Gómez-Candón, D.; Virlet, N.; Labbé, S.; Jolivot, A.; Regnard, J.L. Field Phenotyping of Water Stress at Tree Scale by UAV-Sensed Imagery: New Insights for Thermal Acquisition and Calibration. Precis. Agric. 2016, 17, 786–800. [Google Scholar] [CrossRef]
  25. Maimaitijiang, M.; Sagan, V.; Sidike, P.; Hartling, S.; Esposito, F.; Fritschi, F.B. Soybean Yield Prediction from UAV Using Multimodal Data Fusion and Deep Learning. Remote Sens. Environ. 2020, 237, 111599. [Google Scholar] [CrossRef]
  26. Zarco-Tejada, P.J.; Camino, C.; Beck, P.S.A.; Calderon, R.; Hornero, A.; Hernández-Clemente, R.; Kattenborn, T.; Montes-Borrego, M.; Susca, L.; Morelli, M.; et al. Previsual symptoms of Xylella fastidiosa infection revealed in spectral plant-trait alterations. Nat. Plants 2018, 4, 432–439. [Google Scholar] [CrossRef]
  27. Calderón, R.; Navas-Cortés, J.A.; Lucena, C.; Zarco-Tejada, P.J. High-Resolution Airborne Hyperspectral and Thermal Imagery for Early Detection of Verticillium Wilt of Olive Using Fluorescence, Temperature and Narrow-Band Spectral Indices. Remote Sens. Environ. 2013, 139, 231–245. [Google Scholar] [CrossRef]
  28. Sagan, V.; Maimaitijiang, M.; Sidike, P.; Eblimit, K.; Peterson, K.T.; Hartling, S.; Esposito, F.; Khanal, K.; Newcomb, M.; Pauli, D.; et al. UAV-Based High Resolution Thermal Imaging for Vegetation Monitoring, and Plant Phenotyping Using ICI 8640 P, FLIR Vue Pro R 640, and Thermomap Cameras. Remote Sens. 2019, 11, 330. [Google Scholar] [CrossRef] [Green Version]
  29. Aragon, B.; Johansen, K.; Parkes, S.; Malbeteau, Y.; Al-Mashharawi, S.; Al-Amoudi, T.; Andrade, C.F.; Turner, D.; Lucieer, A.; McCabe, M.F. A Calibration Procedure for Field and UAV-Based Uncooled Thermal Infrared Instruments. Sensors 2020, 20, 3316. [Google Scholar] [CrossRef]
  30. Kelly, J.; Kljun, N.; Olsson, P.O.; Mihai, L.; Liljeblad, B.; Weslien, P.; Klemedtsson, L.; Eklundh, L. Challenges and Best Practices for Deriving Temperature Data from an Uncalibrated UAV Thermal Infrared Camera. Remote Sens. 2019, 11, 567. [Google Scholar] [CrossRef] [Green Version]
  31. Perich, G.; Hund, A.; Anderegg, J.; Roth, L.; Boer, M.P.; Walter, A.; Liebisch, F.; Aasen, H. Assessment of Multi-Image Unmanned Aerial Vehicle Based High-Throughput Field Phenotyping of Canopy Temperature. Front. Plant Sci. 2020, 11, 150. [Google Scholar] [CrossRef]
  32. Zhang, L.; Yaxiao, N.; Zhang, H.; Han, W.; Li, G.; Tang, J.; Peng, X. Maize canopy temperature extracted from UAV thermal and RGB imagery and its application in water stress monitoring. Front. Plant Sci. 2019, 10, 1270. [Google Scholar] [CrossRef]
  33. Lin, D.; Maas, H.-G.; Westfeld, P.; Budzier, H.; Gerlach, G. An advanced radiometric calibration approach for uncooled thermal cameras. Photogramm. Rec. 2017, 33, 30–48. [Google Scholar] [CrossRef]
  34. Budzier, H.; Gerlach, G. Calibration of Uncooled Thermal Infrared Cameras. J. Sens. Sens. Syst. 2015, 4, 187–197. [Google Scholar] [CrossRef] [Green Version]
  35. Ribeiro-Gomes, K.; Hernández-López, D.; Ortega, J.F.; Ballesteros, R.; Poblete, T.; Moreno, M.A. Uncooled Thermal Camera Calibration and Optimization of the Photogrammetry Process for UAV Applications in Agriculture. Sensors 2017, 17, 2173. [Google Scholar] [CrossRef]
  36. Nugent, P.W.; Shaw, J.A.; Pust, N.J. Correcting for Focal-Plane-Array Temperature Dependence in Microbolometer Infrared Cameras Lacking Thermal Stabilization. Opt. Eng. 2013, 52, 061304. [Google Scholar] [CrossRef] [Green Version]
  37. Turner, D.; Lucieer, A.; Malenovský, Z.; King, D.; Robinson, S. Spatial Co-Registration of Ultra-High Resolution Visible, Multispectral and Thermal Images Acquired with a Micro-UAV over Antarctic Moss Beds. Remote Sens. 2014, 6, 4003–4024. [Google Scholar] [CrossRef] [Green Version]
  38. Acorsi, M.G.; Gimenez, L.M.; Martello, M. Assessing the performance of a low-cost thermal camera in proximal and aerial conditions. Remote Sens. 2020, 12, 3591. [Google Scholar] [CrossRef]
  39. Turner, D.; Lucieer, A.; Wallace, L. Direct Georeferencing of Ultrahigh-Resolution UAV Imagery. IEEE Trans. Geosci. Remote Sens. 2014, 52, 2738–2745. [Google Scholar] [CrossRef]
  40. Snavely, N.; Seitz, S.M.; Szeliski, R. Modeling the World from Internet Photo Collections. Int. J. Comput. Vis. 2008, 80, 189–210. [Google Scholar] [CrossRef] [Green Version]
  41. Turner, D.; Lucieer, A.; Watson, C. An Automated Technique for Generating Georectified Mosaics from Ultra-High Resolution Unmanned Aerial Vehicle (UAV) Imagery, Based on Structure from Motion (SFM) Point Clouds. Remote Sens. 2012, 4, 1392–1410. [Google Scholar] [CrossRef] [Green Version]
  42. Kustas, W.P.; Norman, J.M. Use of Remote Sensing for Evapotranspiration Monitoring over Land Surfaces. Hydrol. Sci. J. 1996, 41, 495–516. [Google Scholar] [CrossRef]
  43. Wan, Z.; Dozier, J. A Generalized Split-Window Algorithm for Retrieving Land-Surface Temperature from Space. IEEE Trans. Geosci. Remote Sens. 1996, 34, 892–905. [Google Scholar] [CrossRef] [Green Version]
  44. Mesas-Carrascosa, F.-J.; Pérez-Porras, F.; Larriva, J.E.M.D.; Frau, C.M.; Agüera-Vega, F.; Carvajal-Ramírez, F.; Martínez-Carricondo, P.; García-Ferrer, A. Drift Correction of Lightweight Microbolometer Thermal Sensors On-Board Unmanned Aerial Vehicles. Remote Sens. 2018, 10, 615. [Google Scholar] [CrossRef] [Green Version]
  45. Johansen, K.; Morton, M.J.L.; Malbeteau, Y.M.; Aragon, B.; Al-Mashharawi, S.K.; Ziliani, M.G.; Angel, Y.; Fiene, G.M.; Negrão, S.S.C.; Mousa, M.A.A.; et al. Unmanned Aerial Vehicle-Based Phenotyping Using Morphometric and Spectral Analysis Can Quantify Responses of Wild Tomato Plants to Salinity Stress. Front. Plant Sci. 2019, 30, 370. [Google Scholar] [CrossRef]
  46. Ihuoma, S.O.; Madramootoo, C.A. Recent advances in crop water stress detection. Comput. Electron. Agric. 2017, 141, 267–275. [Google Scholar] [CrossRef]
  47. De Oliveira, A.F.; Dettori, F.R.I.; Azzena, M.; Nieddu, G. UV Light Acclimation Capacity of Leaf Photosynthetic and Photochemical Behaviour in Near-isohydric and Anisohydric Grapevines in Hot and Dry Environments. S. Afr. J. Enol. Vitic. 2019, 40, 188–204. [Google Scholar] [CrossRef] [Green Version]
  48. Guo, Q.; Zhu, Y.; Tang, Y.; Hou, C.; He, Y.; Zhuang, J.; Zheng, Y.; Luo, S. CFD simulation and experimental verification of the spatial and temporal distributions of the downwash airflow of a quad-rotor agricultural UAV in hover. Comput. Electron. Agric. 2020, 172, 105343. [Google Scholar] [CrossRef]
  49. Johansen, K.; Morton, M.J.L.; Malbeteau, Y.M.; Aragon, B.; Al-Mashharawi, S.K.; Ziliani, M.G.; Angel, Y.; Fiene, G.M.; Negrão, S.S.C.; Mousa, M.A.A.; et al. Predicting Biomass and Yield in a Tomato Phenotyping Experiment Using UAV Imagery and Random Forest. Front. Artif. Intell. 2020, 3, 28. [Google Scholar] [CrossRef]
  50. McCabe, M.F.; Balick, L.K.; Theiler, J.; Gillespie, A.R.; Mushkin, A. Linear Mixing in Thermal Infrared Temperature Retrieval. Int. J. Remote Sens. 2008, 29, 5047–5061. [Google Scholar] [CrossRef]
  51. Niu, H.; Hollenbeck, D.; Zhao, T.; Wang, D.; Chen, Y. Evapotranspiration estimation with small UAVs in precision agriculture. Sensors 2020, 20, 6427. [Google Scholar] [CrossRef]
  52. Awais, M.; Li, W.; Cheema, M.J.M.; Hussain, S.; Algarni, T.S.; Liu, C.; Ali, A. Remotely sensed identification of canopy characteristics using UAV-based imagery under unstable environmental conditions. Environ. Technol. Innov. 2021, 22, 101465. [Google Scholar] [CrossRef]
  53. Ezenne, G.I.; Jupp, L.; Mentel, S.K.; Tanner, J.L. Current and potential capabilities of UAS for crop water productivity in precision agriculture. Agric. Water Manag. 2019, 218, 158–164. [Google Scholar] [CrossRef]
  54. Han, X.; Thomasson, J.A.; Swaminathan, V.; Wang, T.; Siegfried, J.; Raman, R.; Rajan, N.; Neely, H. Field-based calibration of unmanned aerial vehicle thermal infrared imagery with temperature-controlled references. Sensors 2020, 20, 7098. [Google Scholar] [CrossRef] [PubMed]
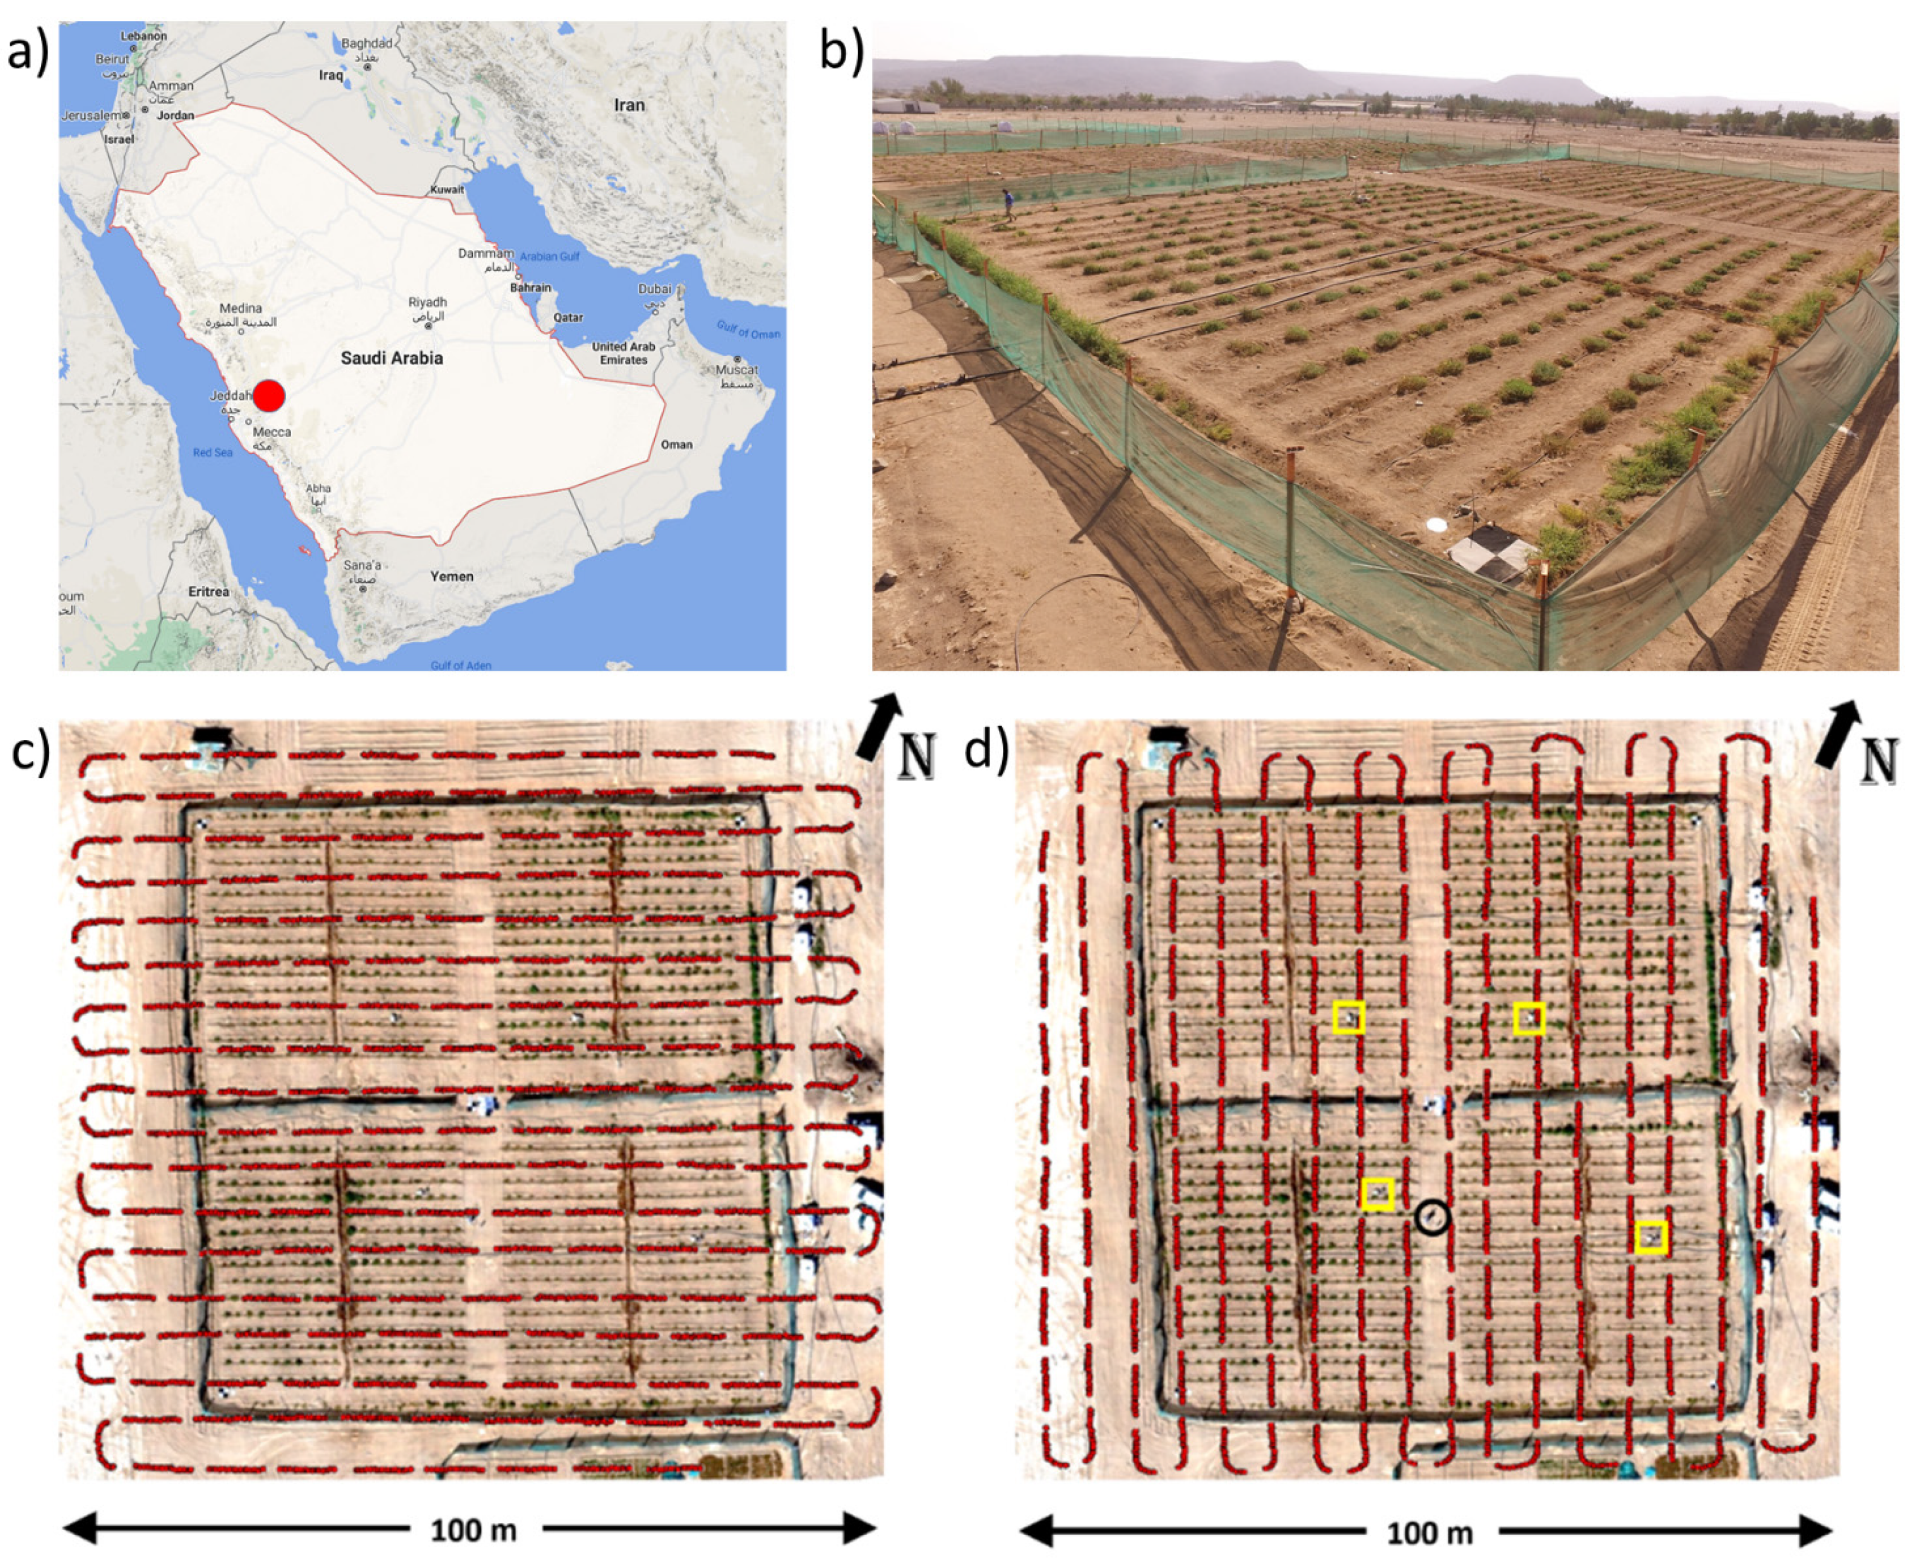
Figure 1. (a) Study site location (red dot) in Saudi Arabia of the tomato experiment (b) at the Hada Al-Sham agricultural research station, approximately 60 km east of Jeddah. Layouts of the experimental tomato plant trial with an overlay of flight directions at 66°/246° (c) and 156°/336° (d) north are also shown. The yellow squares show the location of four installed Apogee sensors and the black circle indicates the location of a weather station (d).
Remotesensing 13 03255 g001
Figure 2. TeAx ThermalCapture 2.0 camera (left) mounted on the DJI Matrice 100 along with red-green-blue (RGB) and multi-spectral cameras (right).
Remotesensing 13 03255 g002
Figure 3. The workflow of the proposed methodology was divided into two main stages, pre-processing and orthomosaic generation. Additionally, the workflow for validation of temperature (temp) within the Apogee field of view (FOV) and standard deviation (STD) assessment is presented in the yellow box.
Remotesensing 13 03255 g003
Figure 4. (a) RGB image data, (b) temperature map derived from the TeAx image data, and the standard deviation of the orthophotos of a swath (i.e., a flight line) before (c) and after (d) calibration and vignetting correction for 20 December 2017 at 10:00.
Remotesensing 13 03255 g004
Figure 5. Standard deviation of orthophotos before (a) and after (b) calibration and vignetting correction for 20 December 2017 at 10:19–10:35. Yellow dot indicates the take-off/landing base.
Remotesensing 13 03255 g005
Figure 6. Scatterplot showing the relationship of the in situ temperature measurements derived with the four Apogee sensors and the UAV-based temperature measurements from orthophotos for the 12 flight surveys (n = 48) before (black) and after (red) calibration.
Remotesensing 13 03255 g006
Figure 7. Orthomosaic using outbound (flight orientation of 66° north) orthophotos (left), orthomosaic using inbound (flight orientation of 246° north) orthophotos (middle) and the difference between inbound and outbound orthophotos (right) on 7 January 2018 at 09:16. The wind orientation was 31° north (±5°), and the average wind speed was 3.6 m/s for this flight survey.
Remotesensing 13 03255 g007
Figure 8. Scatterplot of difference in temperature between inbound and outbound orthophotos caused by the wind direction relative to the UAV flight direction for the four, five and three flight surveys on 9 November, 20 December and 7 January, respectively (n = 183). The wind speed at the acquisition time is represented by the color bar from 0 to 4 m/s. Dashed lines represent upper and lower bounds with a maximum of 2 and 0.5 °C for high and low wind speeds, respectively, and were inserted to facilitate the interpretation of the figure.
Remotesensing 13 03255 g008
Figure 9. Difference in temperature between inbound and outbound orthophotos (a) before and (b) after the flight direction normalization and (c) the final temperature orthomosaic using the swath-based correction method. The presented example represents the thermal UAV data collected on 20 December 2017 at 10:19–10:35.
Remotesensing 13 03255 g009
Figure 10. Maps showing temperature differences between orthomosaics produced using the Average, Disable and Mosaic blending modes from Agisoft PhotoScan based on calibrated orthophotos for five UAV flight surveys on 20 December 2017 at 08:01 (Flight 1), 08:24 (Flight 2), 09:52 (Flight 3), 10:19 (Flight 4) and 11:56 (Flight 5). As a reference, the first column shows the temperature orthomosaic based on the Average blending mode for each flight.
Remotesensing 13 03255 g010
Table 1. Flight times and meteorological conditions, including air temperature and mean, maximum (max) and minimum (min) wind speed, recorded during each UAV flight survey on 9 November 2017, 20 December 2017 and 7 January 2018.
Survey DateStarting TimeFlight Duration (min)Flight Direction
(°)
Air Temperature (°C)Mean Wind Speed (m/s)Max Wind Speed (m/s)Min Wind Speed (m/s)
9 November 201708:271666/24628.30.82.20.1
08:4915156/33628.90.92.30.0
11:061666/24632.42.04.10.2
12:581666/24634.32.04.70.1
20 December 201708:011666/24621.92.24.60.6
08:2415156/33622.92.04.50.5
09:521466/24627.11.83.70.3
10:1915156/33628.01.12.60.1
11:561566/24630.61.24.20.1
7 January 201809:161566/24623.13.68.30.3
09:4015156/33623.83.06.80.4
12:431566/24628.92.85.50.7
Table 2. Mean absolute difference (MAD) between inbound and outbound orthophotos before and after flight direction normalization and associated starting times, flight directions and mean wind speeds of all 12 UAV flights.
Survey DateStarting TimeFlight Direction (°)Mean Wind Speed (m/s)MAD Before Flight
Direction Normalization
MAD After Flight
Direction Normalization
MAD
Difference
9 November 201708:2766/2460.80.800.620.18
08:49156/3360.90.950.670.28
11:0666/2462.01.791.190.6
12:5866/2462.01.361.010.35
20 December 201708:0166/2462.21.860.900.96
08:24156/3362.00.740.570.17
09:5266/2461.81.961.220.74
10:19156/3361.11.040.790.25
11:5666/2461.21.351.150.2
7 January 201809:1666/2463.61.791.350.44
09:40156/3363.00.660.620.04
12:4366/2462.81.531.190.34
Table 3. Evaluation of Agisoft PhotoScan blending modes and the novel swath-based correction method against in situ Apogee measurements. Coefficient of determination (R2), root mean square error (RMSE), mean difference (MD), and mean absolute error (MAE) are reported for the four mosaicking methods based on 12 UAV flight surveys and four Apogee sensors (n = 48).
Mosaicking MethodR2MAE (°C)MD (°C)RMSE (°C)
Average0.991.391.071.66
Disable0.991.340.691.63
Mosaic0.991.380.961.63
Swath0.991.070.471.23
Publisher’s Note: MDPI stays neutral with regard to jurisdictional claims in published maps and institutional affiliations.