1. Introduction
Communication with satellites is required to operate any spacecraft and offer the service planned, no matter what type of service (telecommunication, Internet of Things (IoT), remote sensing, etc.). The choice of communication parameters should be based on the communication channel properties and the actual interference and noise environment [
1]. For Radiofrequency (RF) communication, the radio environment can be measured on-board satellites and provide information to improve the design of the communication system and increase the data throughput. In-orbit spectrum monitoring is paramount for satellite communication systems and has been supported by the European Space Agency (ESA) [
2]. Spectrum monitoring is especially important for IoT-over-Satellite networks and for small satellite communication, where uplink interference levels will rise due to the increasing number of IoT devices deployments [
3] and small satellites launched [
4]. Actual in-orbit interference measurements can complement existing system models for IoT-over-Satellite systems [
3,
5,
6,
7] to improve their real performance and help to design interference mitigation techniques. Spectrum monitoring can help to solve some of the challenges of future satellite systems, such as efficient spectral usage and interference mitigation capabilities [
8].
The UHF amateur radio band (430–440 MHz) is a popular frequency band for Telemetry, Tracking and Command (TT&C) of small satellites [
9]. Several operators of small satellites have experienced poor uplink performance in this band and have performed interference measurements to analyse the problem [
10,
11,
12,
13]. In 2014, the University of Vigo carried out a set of preliminary measurements with the HumSat-D satellite, where pulsed interference was detected [
10]. In the same year, the University of Würzburg registered high interference levels over central Europe in certain frequencies within the UHF amateur radio band (430–440 MHz) with the UWE-3 satellite [
11]. Additional measurements were performed by the University of Vigo using the SERPENS satellite in 2015 and 2016. Strong, consistent uplink interference was detected over North America, Europe, the north of Africa, and the Middle East. Low levels were measured over South America and some regions of Africa [
12].
Moreover, Technische Universität Berlin (TU Berlin) has worked on spectrum monitoring in the same band (in addition to VHF, L-band, and S-band) and detected high power interference over North America and Europe using a Software-Defined Radio (SDR) on the International Space Station (ISS) in 2018 [
13]. In 2020, TU Berlin launched the SALSAT, a CubeSat to continue their spectrum monitoring activities without the ISS constraints [
14], but no results have been published yet. There are also companies, such as Hawk Eye 360 and Aurora Insight, that have started to monitor the spectrum in the last years and are building a constellation to provide frequency spectrum data services, such as geolocation of interference sources [
15,
16,
17].
Most of the published results focus on the average interference power over a certain measurement duration [
10,
11,
13], omitting the time structure of the interference. In addition, the sub-satellite points of some measurements are limited between −51.6° and +51.6° latitude, specifically, the measurements performed by TU Berlin from the ISS [
13] and the SERPENS measurements [
18]. Satellite orbits with higher inclination can extend sub-satellite points further north as in References [
10,
11,
19]. Heatmaps have been the traditional way of showing the average power of interference [
11,
13], but they do not show the variability.
The temporal characteristics of the noise/interference impact what type of error correction coding is needed. For example, turbo-codes have a good performance in the presence of Additive White Gaussian Noise (AWGN), but they are weak codes for burst-noise channels [
1]. Reed-Solomon error correction coding performs better in burst-noise channels than in AWGN [
1]. Channel interleavers can be used in combination with error correction codes for burst noise. A window covering the full temporal dynamics of the interference can be used for the interleaver length since the burst length will be shorter. Moreover, if the interference has a specific time structure, such as pulsed signals, windows of opportunity could be estimated to transmit in between pulses.
To understand the current issues experienced in the TT&C links to small satellites using the UHF radio amateur band, new measurements that combine time and frequency information are needed. Furthermore, the time variability characteristics of the interference can be exploited to improve the communication system design in the band. Ideally, a continuous spectrogram and the probability density function of the interference should be measured to obtain accurate frequency and temporal dynamics. Due to the limited downlink rate of small satellites using the UHF amateur radio band (430–440 MHz) and their power constraints, a low complexity algorithm is desired to measure time and frequency characteristics.
The UHF amateur radio band (430–440 MHz) is shared with other radiocommunication services, such as radiolocation and Earth Exploration Satellites [
20]. As a part of the radiolocation service, there are different types of ground radars (type A, B, and C) in the 420–450 MHz band that transmit up to 5 MW of power [
21]. Radar type A is used for space object tracking and could be the source of interference of satellite communication in the amateur radio band. In Reference [
13], a strong pulsed interference was identified as the ground radar operating in the United Kingdom (UK). Measurements from the SERPENS satellite [
12] also suggest that these ground radars can be interfering in the satellite uplink since high power interference was detected over scarcely populated areas.
These type A radars transmit pulse frequency modulation in the form of linear chirps. For the search mode (when surveying space objects), the chirps have a bandwidth of 100–350 kHz, while, for tracking, the bandwidth is 1 or 5 MHz [
21]. The pulse width can be 0.25, 0.5, 1, 2, 4, 8, or 16 ms, the average duty cycle is 25%, and the pulse repetition frequency is up to 41 Hz [
21]. In Reference [
22], the characteristics of the Precision Acquisition Vehicle Entry (PAVE) Phased Array Warning System (PAWS) early warning radars in the United States (U.S.) are described for an environmental impact statement. These radars are located in Cape Cod (Massachusetts), Beale (California), and Clear (Alaska). For these radars, the pulse width for tracking mode can be 0.25, 0.5, 1, 2, 4, 8, and 16 ms, and, for surveillance, 0.3, 5, and 8 ms. The pulse repetition rate can be between 18 and 72 pulses per second. The 3 dB antenna beamwidth is 2.2°, the same as in Reference [
21]. The PAVE PAWS radars also transmit high power (around 0.5 MW peak power), so they are an expected source of interference in space.
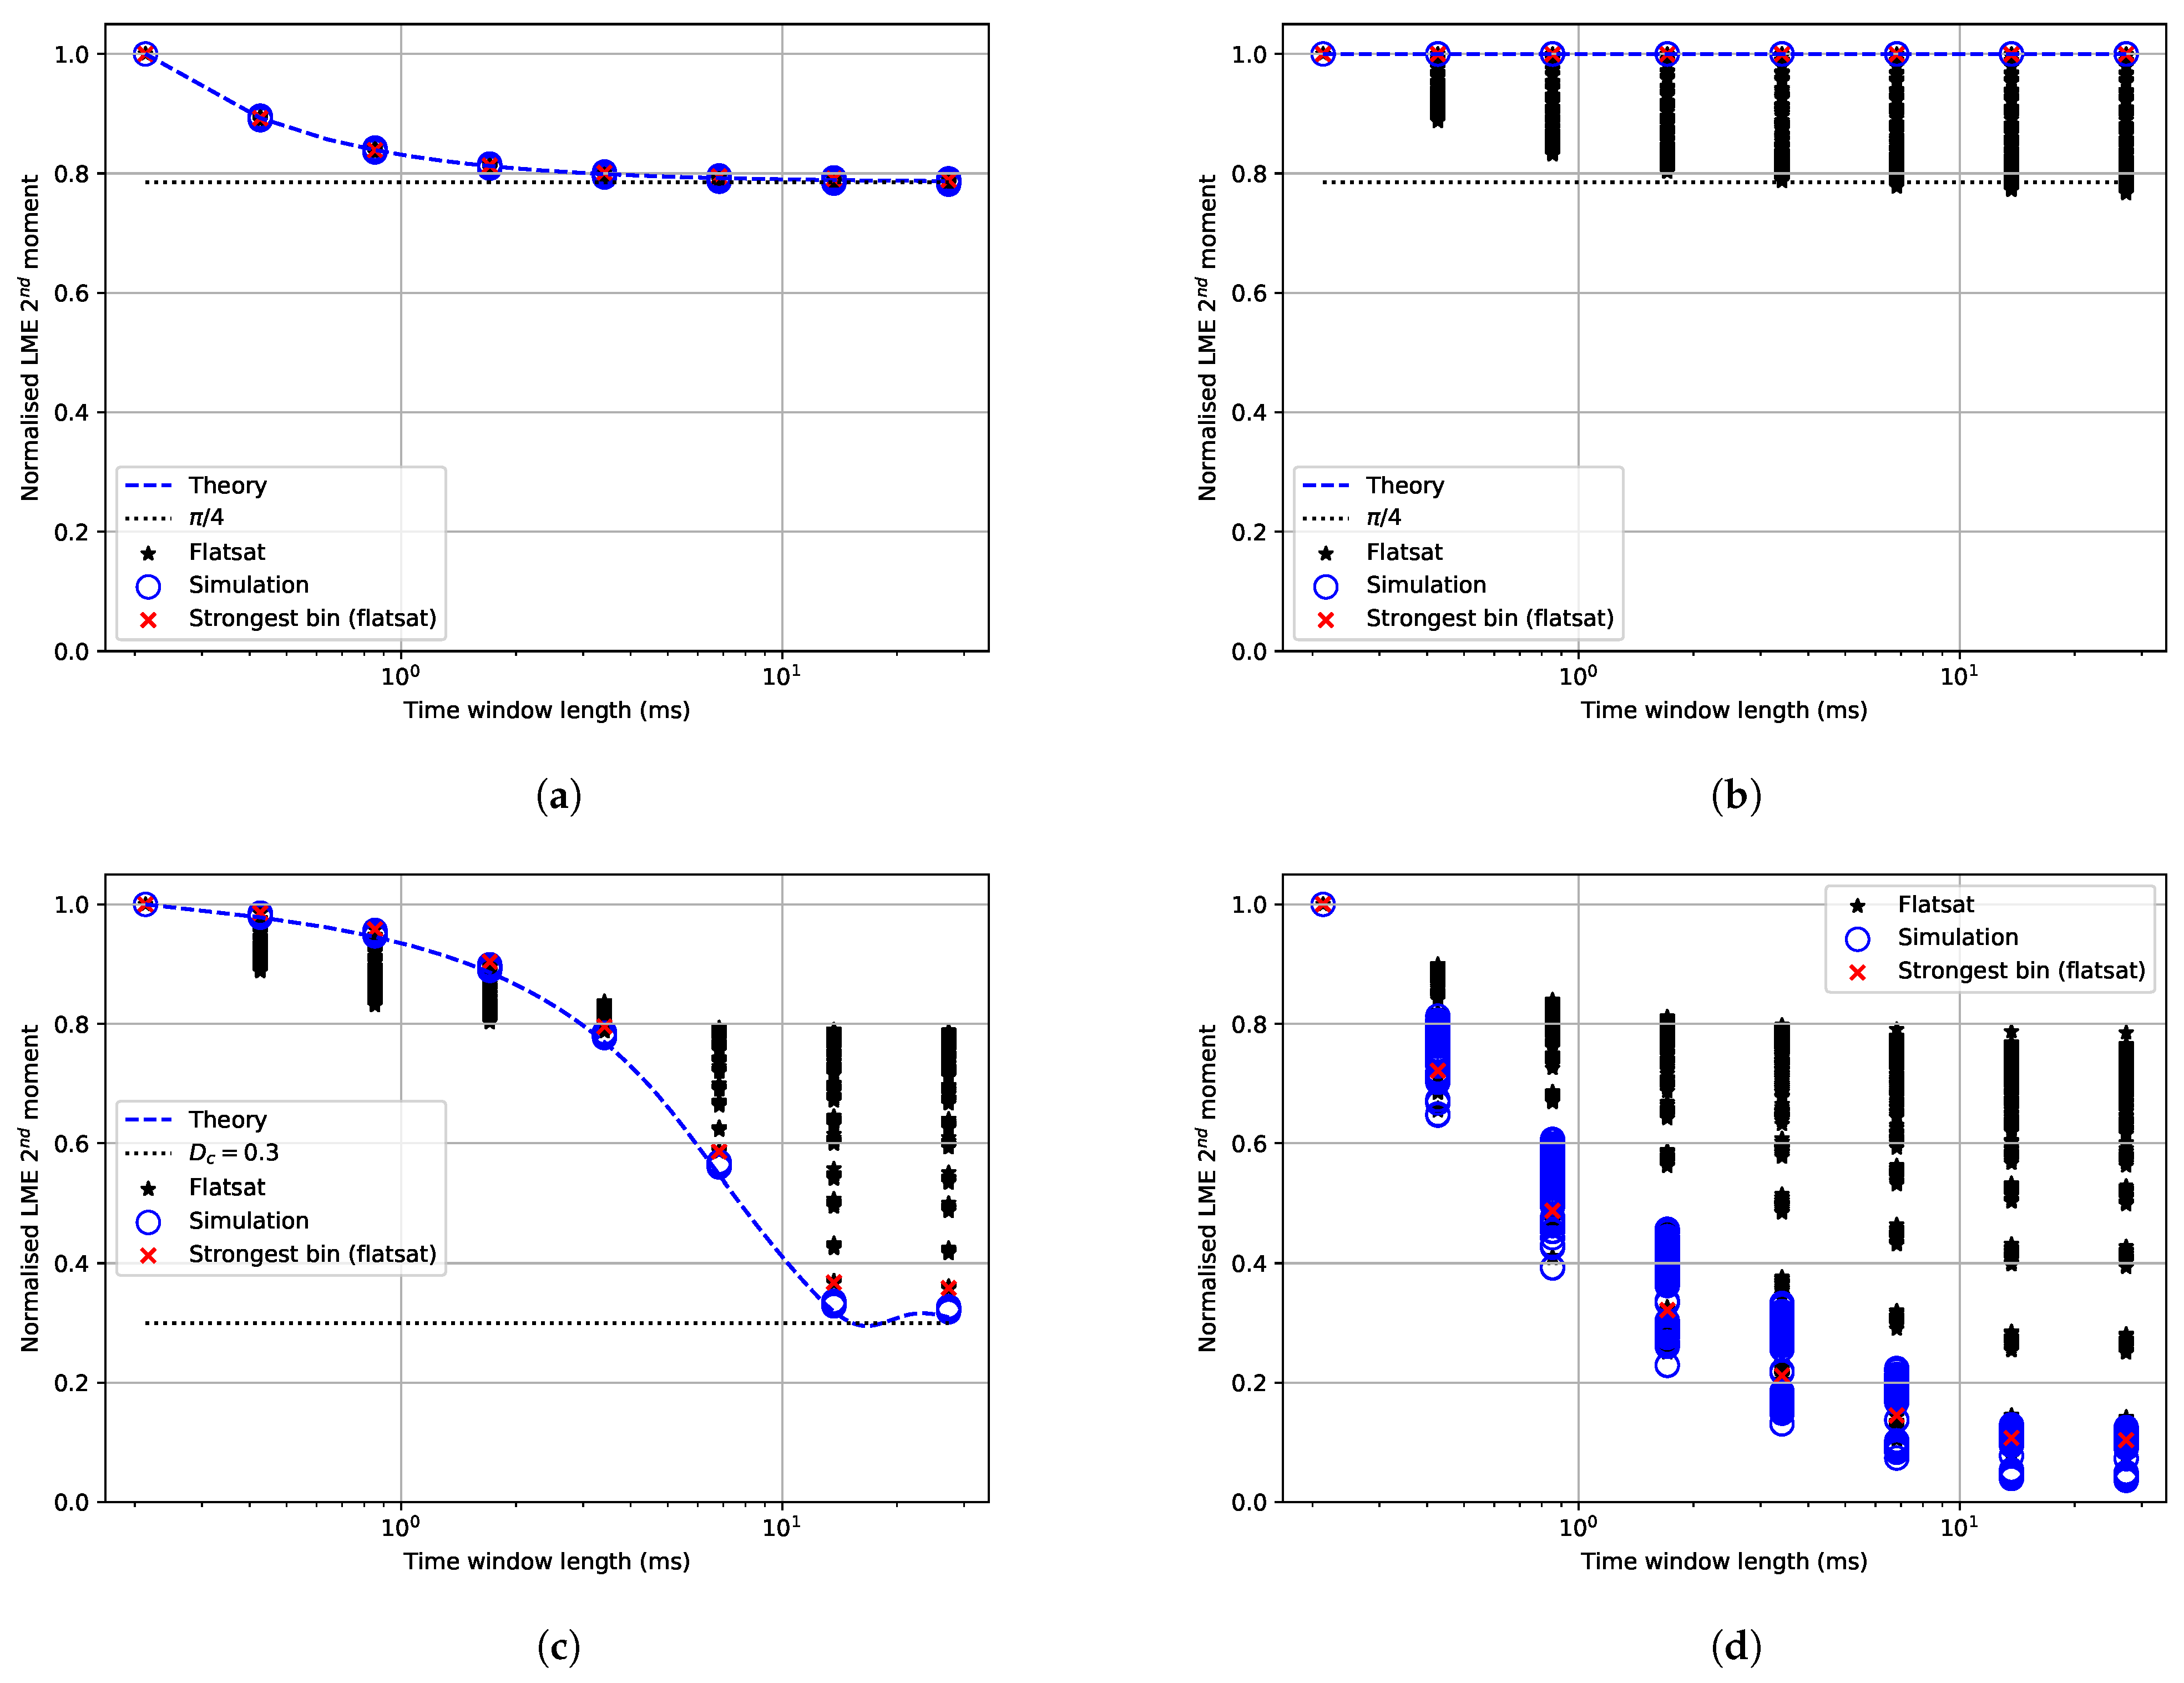
In this article, we present measurements of the radio environment in the 435 MHz band for satellites in Low Earth Orbit (LEO) using the LUME-1 satellite in the spring of 2021 to support interference characterisation. This satellite has an approximately 98° inclination orbit allowing measurements over the polar areas. The LUME-1 is a CubeSat with limited on-board data processing capabilities and low data rates for communication. This called for the development of simple on-board estimation procedures to obtain the time-frequency interference statistics with low downlink data rate requirements. We performed spectrum measurements over five seconds and estimated the time variability of the interference over windows between 0.21 ms and 27.3 ms, measuring the first-order stationarity by estimating the variance of the Local Mean Envelope (LME) with different lengths of averaging windows.
The contributions of this article can be summarised as: (1) development of a low complexity algorithm to measure time-frequency behaviour of interference to be used in low data rate links, (2) validation of the method through theoretical analysis, simulations, hardware-in-the-loop testing and in-orbit measurements on-board a small satellite, and (3) analysis of the in-orbit interference environment measured in the UHF radio amateur band.
The structure of the paper is as follows. In
Section 2, the LUME-1 satellite and its constraints are introduced. The software architecture and measurement algorithm are explained in
Section 3, followed by the description of the setup for simulations, laboratory (flatsat), and satellite measurements in
Section 4. The theoretical, simulation, lab, and in-orbit measurement results are presented in
Section 5 and discussed in
Section 6. Finally, conclusions are presented in
Section 7.
2. LUME-1 Satellite
LUME-1 was launched on 27 December 2018 from Vostochny in Russia into a 510 km Sun-synchronous orbit. This 2U Cubesat was part of the European project Fire RS, where the University of Porto (Portugal), The Laboratory for Analysis and Architecture of Systems (France), the University of Vigo (Spain), and Alén Space (Spain) collaborated together [
23]. The mission ended in June 2019, but the satellite is still operational and available for other research. LUME-1 has a TOTEM SDR on-board [
23], allowing the upload of new software with new functionality.
The Norwegian University of Science and Technology (NTNU) collaborates with the University of Vigo and Alén Space to develop and perform new communication experiments with the satellite. The objective is to estimate the in-band radio interference environment in the UHF radio amateur band (430–440 MHz). New software to estimate the time-frequency characteristics of this radio interference was developed at NTNU during 2020. This software was designed considering the constraints of the LUME-1 satellite. The main limitation is the data throughput and communication window. The default gross data rate configuration is 4.8 kbps, extendable to 9.6 kbps, over the UHF amateur radio band at 437.060 MHz, but the obtained net data rate is significantly lower. When using the 4.8 kbps configuration, given the few daily passes over the Vigo ground station due to latitude (42°) and the high level of interference experienced in the uplink, a continuous 1 kbps downlink rate for 5 min per day is a realistic estimate. For the uplink, the communication is degraded, and the estimated actual data throughput is 200 bps for 5 min per day.
In addition, the satellite is tumbling (at approximately 1 rpm), since the Attitude Control and Determination System (ACDS) is planned to be activated at a later stage. The UHF antenna used is the ANT430 antenna from GomSpace, whose antenna pattern is not completely omnidirectional. According to the total gain measured on the GOMX-1 satellite [
24] (a 2U CubeSat), the gain can vary between −1.5 to 1.6 dBi, depending on the pointing. The antenna is circularly polarised only when seen from the top (left-hand) and bottom (right-hand). Additional losses can be experienced when pointing differently.
The measurements were planned so that operations were as simple as possible. The TOTEM SDR on-board can have a maximum duty cycle of 50% due to power budget limitations. The RF front-end can be tuned within the 435–438 MHz band, and the dynamic range is approximately 66 dB. The RF bandwidth can be adjusted between 200–56,000 kHz [
25], and the ideal sample frequency can be configured within 521–56,000 kSps. In order to use sample frequencies higher than 2 MSps, some digital signal processing must be ported to the Field-Programmable Gate Array (FPGA), requiring extra development. The interference measurement software was developed using GNURadio libraries in C++ and shell scripting.
If the Automatic Gain Control (AGC) was activated, the gain of the Analogue to Digital Converter (ADC) would adapt to the dynamic range of the signal. As the gain cannot be read in real-time, the AGC was deactivated, resulting in a fixed gain for the measurements in this article. Thus, strong signals may saturate the ADC, and weak signals may be below the resolution threshold.
4. Measurement Setup
In this section, the setup for the simulations, hardware-in-the-loop (flatsat), and satellite measurements is explained, including the configuration of the measurement software.
One measurement is defined as one C++ programme execution, and a measurement set contains a group of measurements. Each measurement has a duration and generates a file with date and time as filename. The measurements within a set have a periodicity (time between the start time of two consecutive measurements).
The configuration of the measurements is presented in
Table 1. The center frequency was chosen based on the lowest frequency in the UHF amateur radio band measured in References [
11,
13]. In addition, the frequency 435 MHz is in the middle of the ground radar band 420–450 MHz. To reduce software computational power, the sampling frequency was 600 kSps, rounding up the minimum value (521 kSps). To satisfy the Nyquist criterion and avoid aliasing, the RF bandwidth shall be, at least, half of the sampling frequency [
26]. The bandwidth setting was chosen to be 200 kHz so that there is a margin with regard to Nyquist; the sampling frequency is then three times the bandwidth.
The measurement duration should be long enough to find stationarity, but short enough not to measure the spatial variability due to the satellite’s movement. The duration was five seconds as a trade-off. This interval corresponds to a movement of a 0.3° angle from nadir (center of Earth). The time between measurements is one minute, which defines the spatial resolution. To resolve the 3° beamwidth (rounding up) used by type A space-tracking radars, a corresponding spatial sampling is performed. Thus, measurements were one minute apart.
There is no maximum bandwidth for the 435 MHz according to the International Amateur Radio Union (IARU) band plan [
27], but the Norwegian band plan recommends between 12–20 kHz [
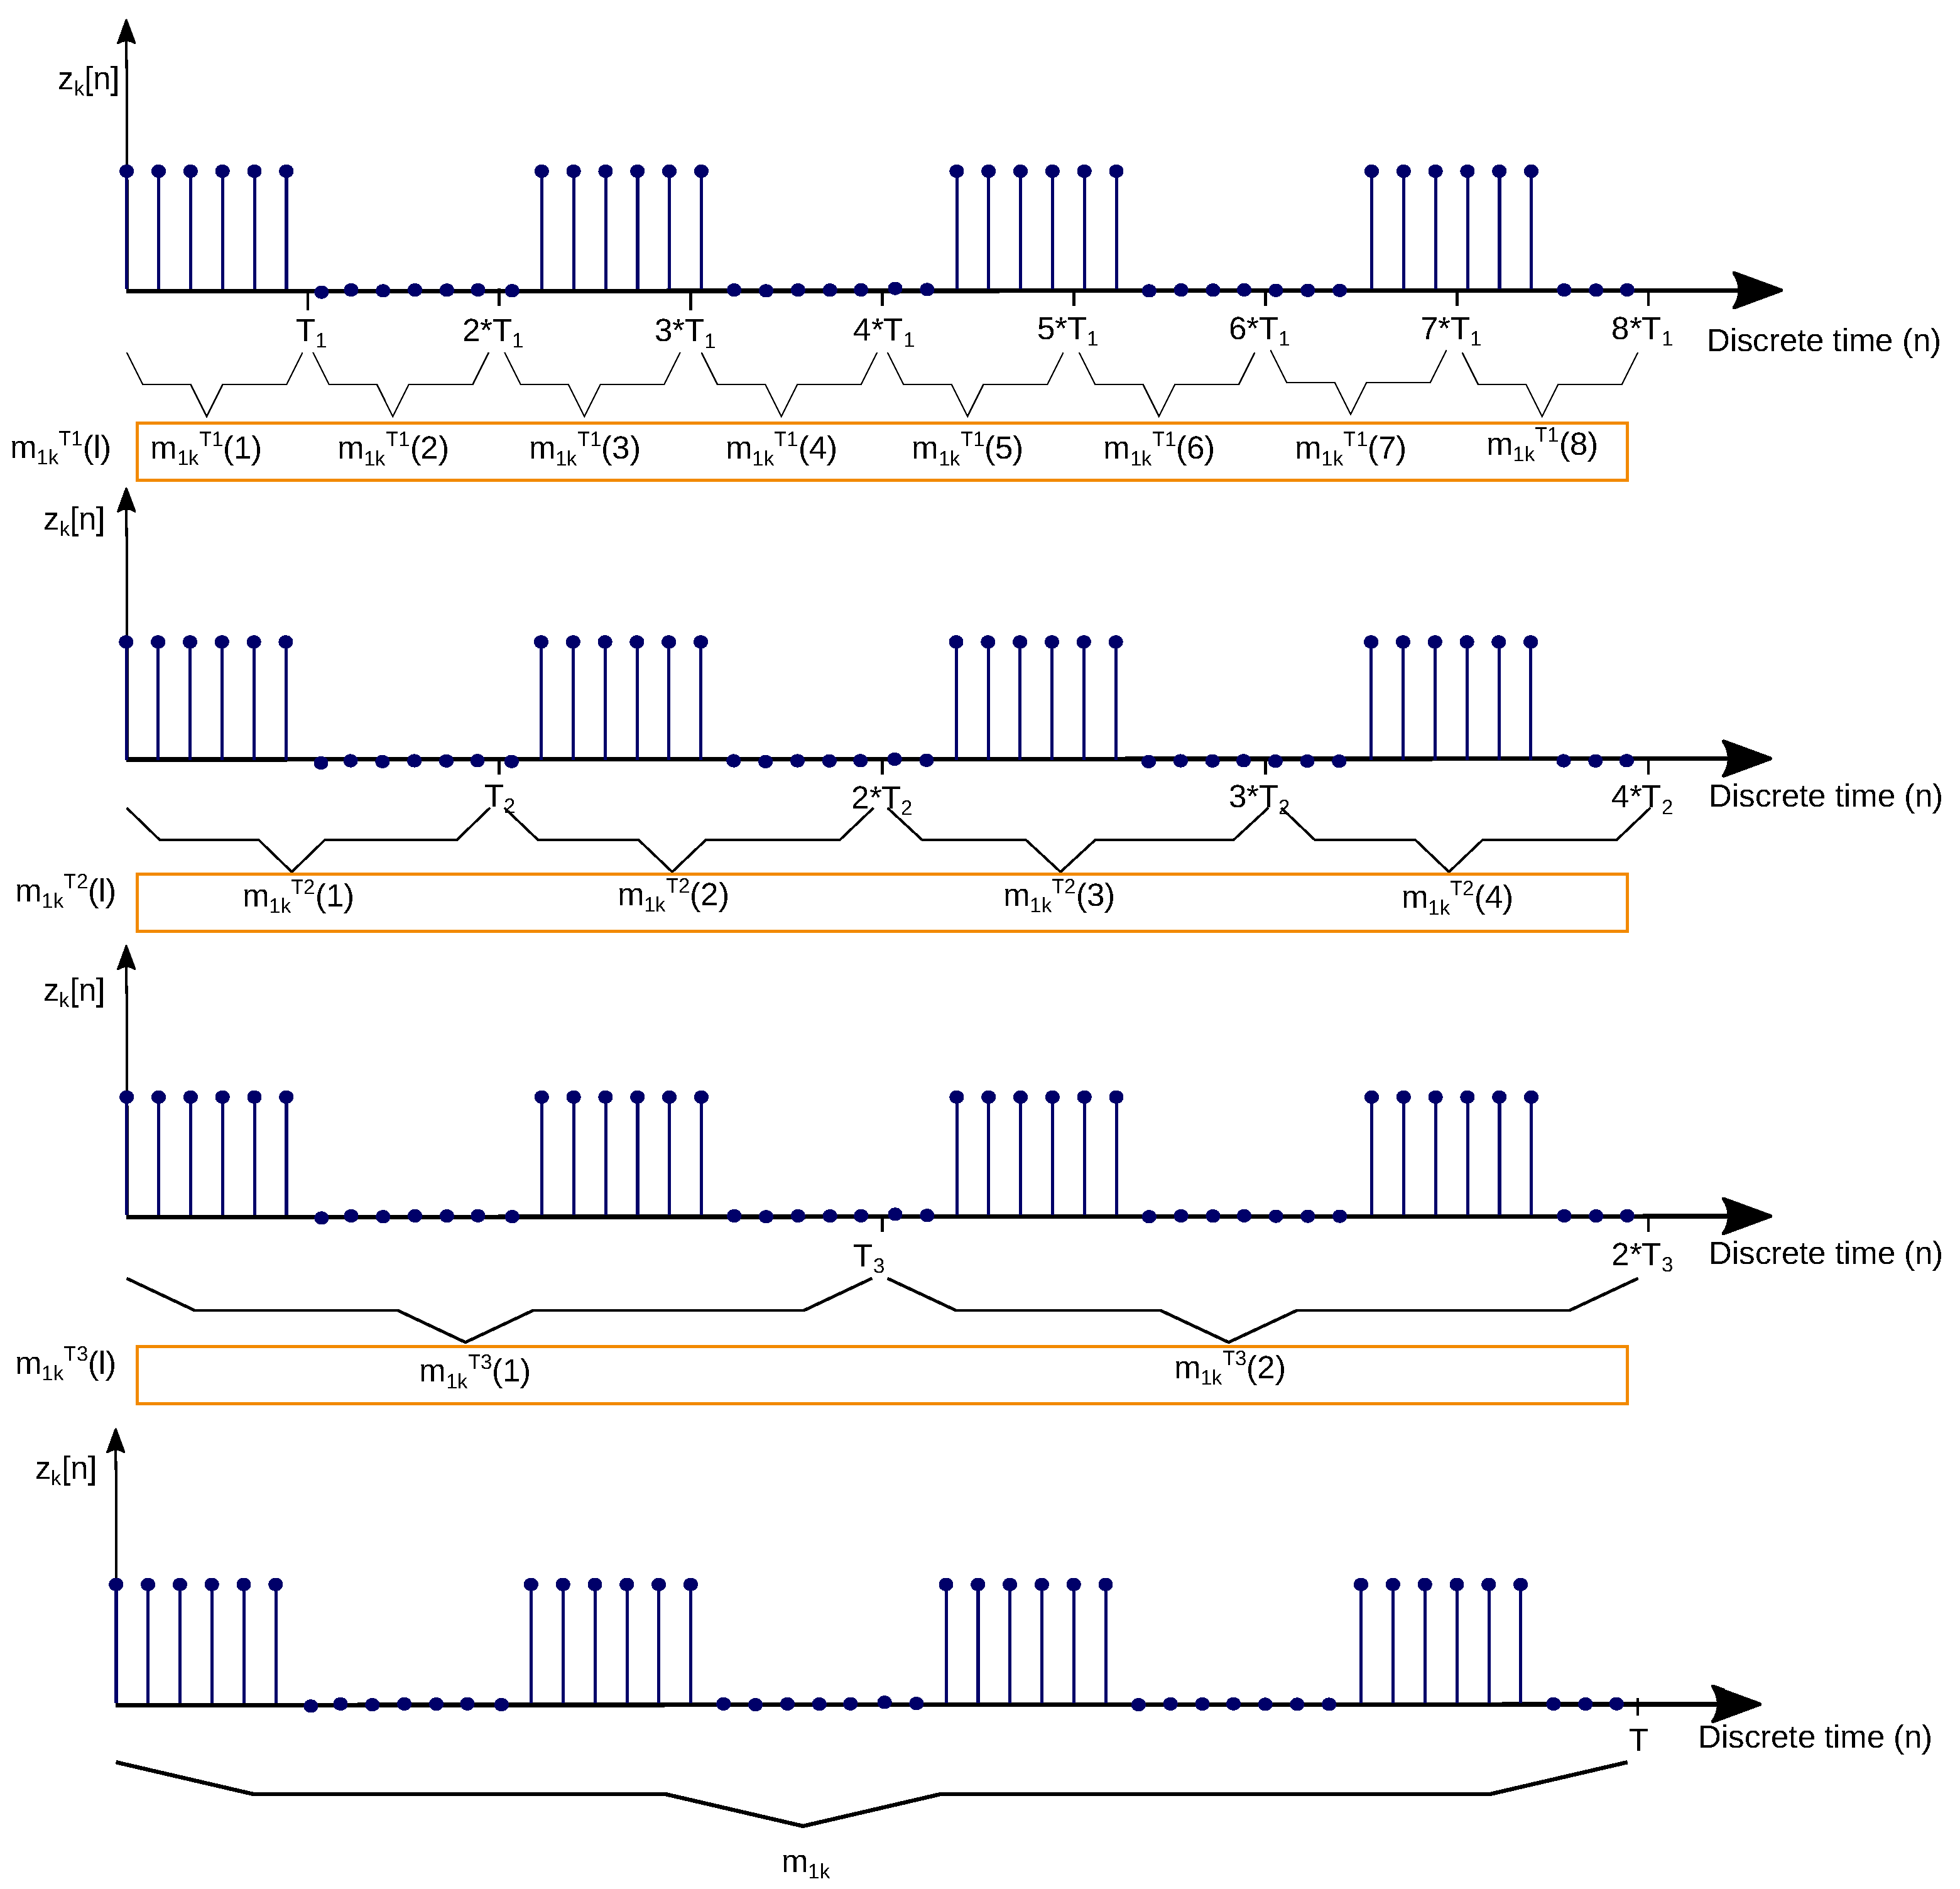
28]. Therefore, the frequency resolution should be higher than these values and traded-off against the data size to downlink since the number of frequency bins is proportional to the data size. The number used was 128 to obtain a frequency resolution better than 5 kHz. The resolution for time variability is determined by the first time window, chosen to be 0.21 ms, since it is lower than the shortest pulse width of the radars mentioned in
Section 1. The smallest step between windows, which is 2, was chosen for this first round of measurement campaigns. The maximum number of outputs and number of bits was configured to obtain better temporal variation resolution and reduce bit quantisation errors.
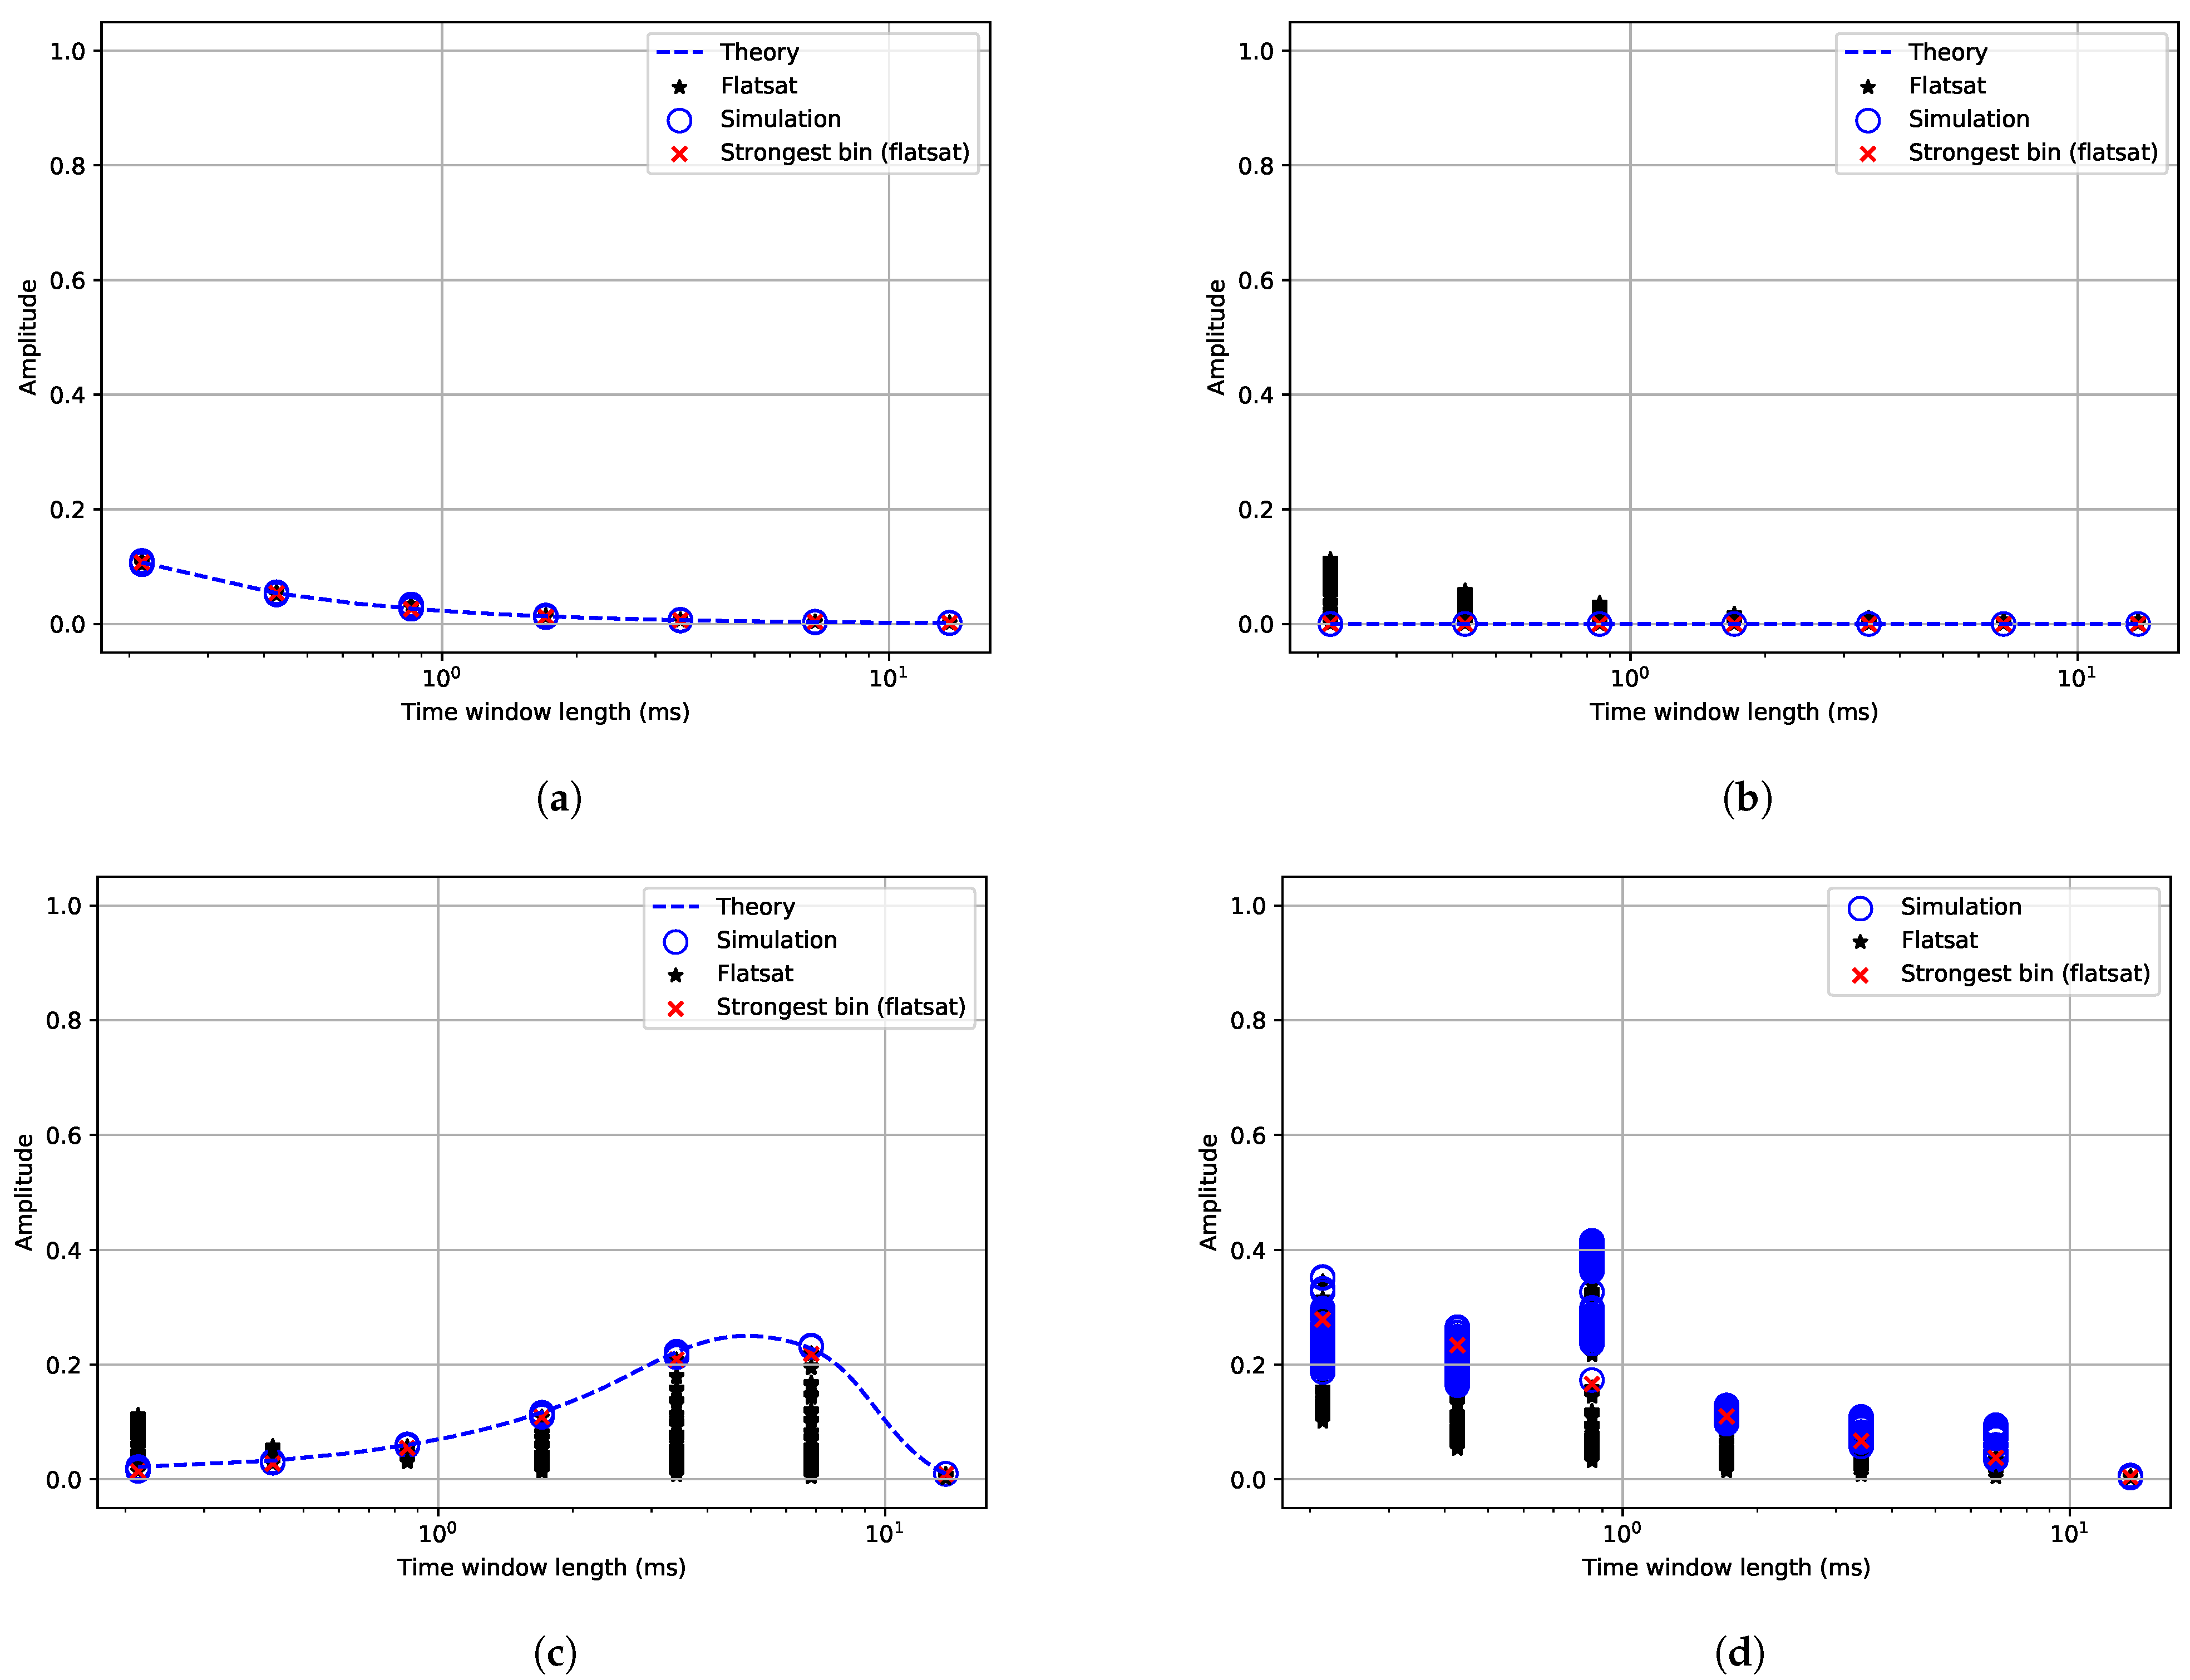
To verify the implementation of the proposed estimator, it was first tested on a set of simulated signals describing different possible interference scenarios using the same configuration. The same scenarios were then tested on the TOTEM SDR in the flatsat setup, generating the signals with another SDR to verify the hardware.
4.1. Simulation Setup
The algorithm was developed and tested using an iterative approach. Simulations were the first step to verify the software implementation of the measurement algorithm. The simulations were developed in C++ using GNURadio libraries. The setup consists of a transmitter and a receiver implemented in software. The transmitter sends simulated interference (test signals) and the receiver runs the measurement algorithm.
The test signals used to validate the algorithm were based on the interference environment that can be encountered by a satellite in LEO using the UHF band (430–440 MHz). The four types of signals that were used in testing and validation are: AWGN, Continuous Wave (CW), pulse wave, and a chirp signal. When there are many independent random processes, an AWGN model can be used. A CW is a stationary signal; thus, it can be used to measure full stationarity. Pulsed signals and chirps are chosen because radiolocation is a primary service in the 420–450 MHz band and are expected to be found.
4.2. Flatsat Setup
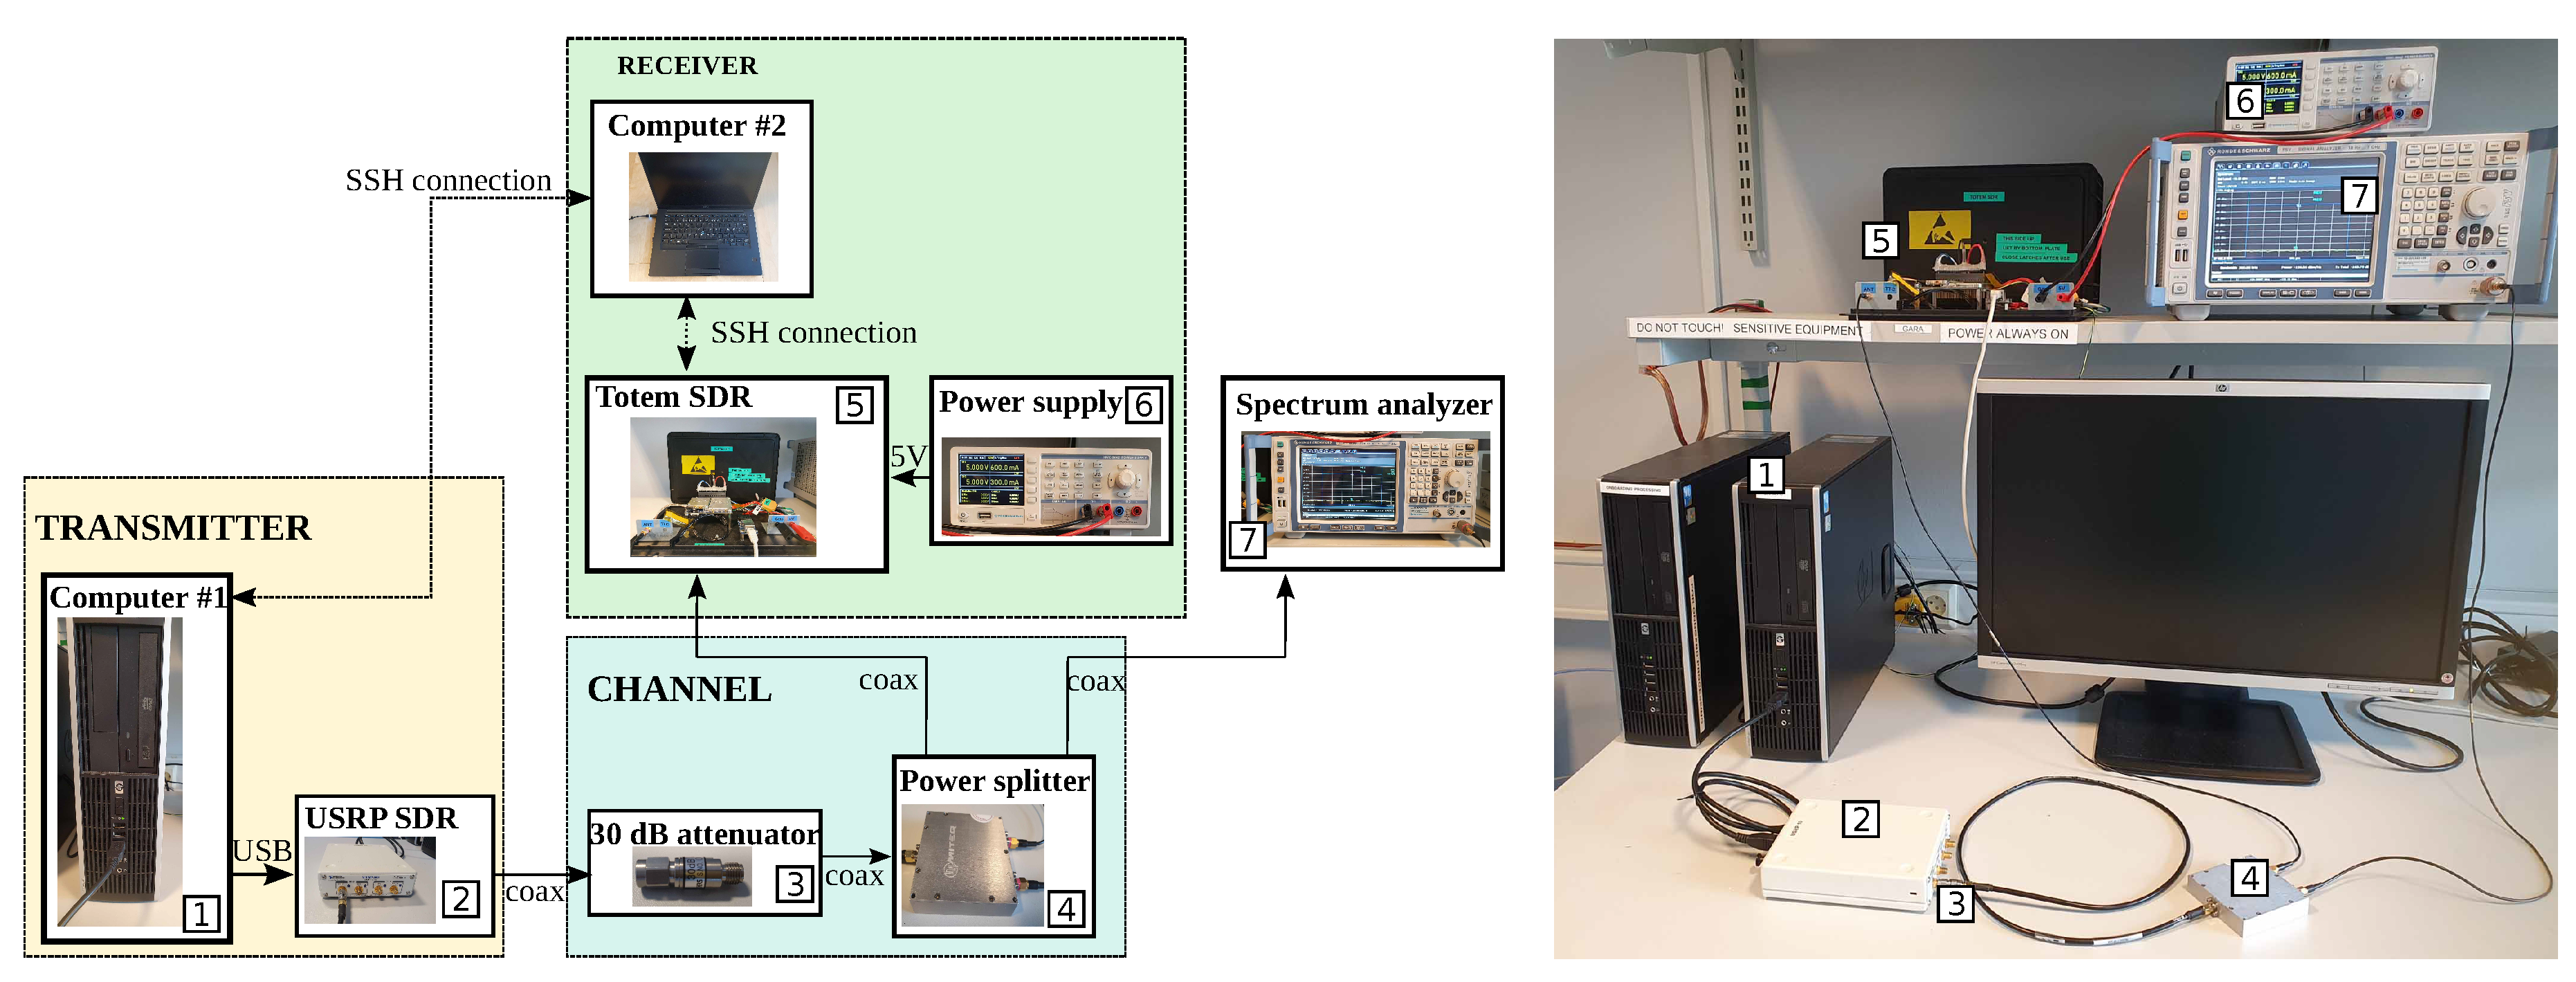
The next step for verification and validation was to include target hardware in the loop. The main components of the flatsat setup were two SDRs: the Ettus USRP-2901 SDR and the TOTEM SDR. The USRP was used as a transmitter of the test signals. The transmitter software was run on GNURadio companion which is controlled by a desktop computer remotely via Secure SHell (SSH). The version of the TOTEM SDR used in the lab is an upgraded version of the SDR in LUME-1. It was used as the receiver, and it ran the measurement software. The TOTEM SDR encompasses a Xilinx Zynq 7020 System on Chip (SoC) running an embedded Linux system [
29], allowing remote access via SSH. The measurement results are saved in files and copied to a computer for analysis.
The lab setup is shown in
Figure 2. The USRP is connected to Computer #1 through USB and the SMA transmitter port of the SDR is connected to a 30 dB attenuator to avoid damaging the receiver with strong signals. The output of the attenuator is connected to a 3 dB power splitter. One output of the splitter is connected to the RF port of TOTEM, and the other to a spectrum analyser (Rohde & Schwarz FSV). The power supply provides 5 V to the TOTEM. Computer #2 controls TOTEM and Computer #1 remotely.
The same test signals used in simulations are transmitted by the USRP, properly upconverted to the frequency range which this TOTEM is designed for (430–440 MHz), mixing them with a Local Oscillator (LO). To avoid the effect produced by the LO leakage, the signals (except the chirp) are transmitted with an offset (100 kHz) with respect to the centre frequency, configured in the USRP. The chirp is not shifted 100 kHz because it would be outside the 3 dB bandwidth.
4.3. Satellite Setup
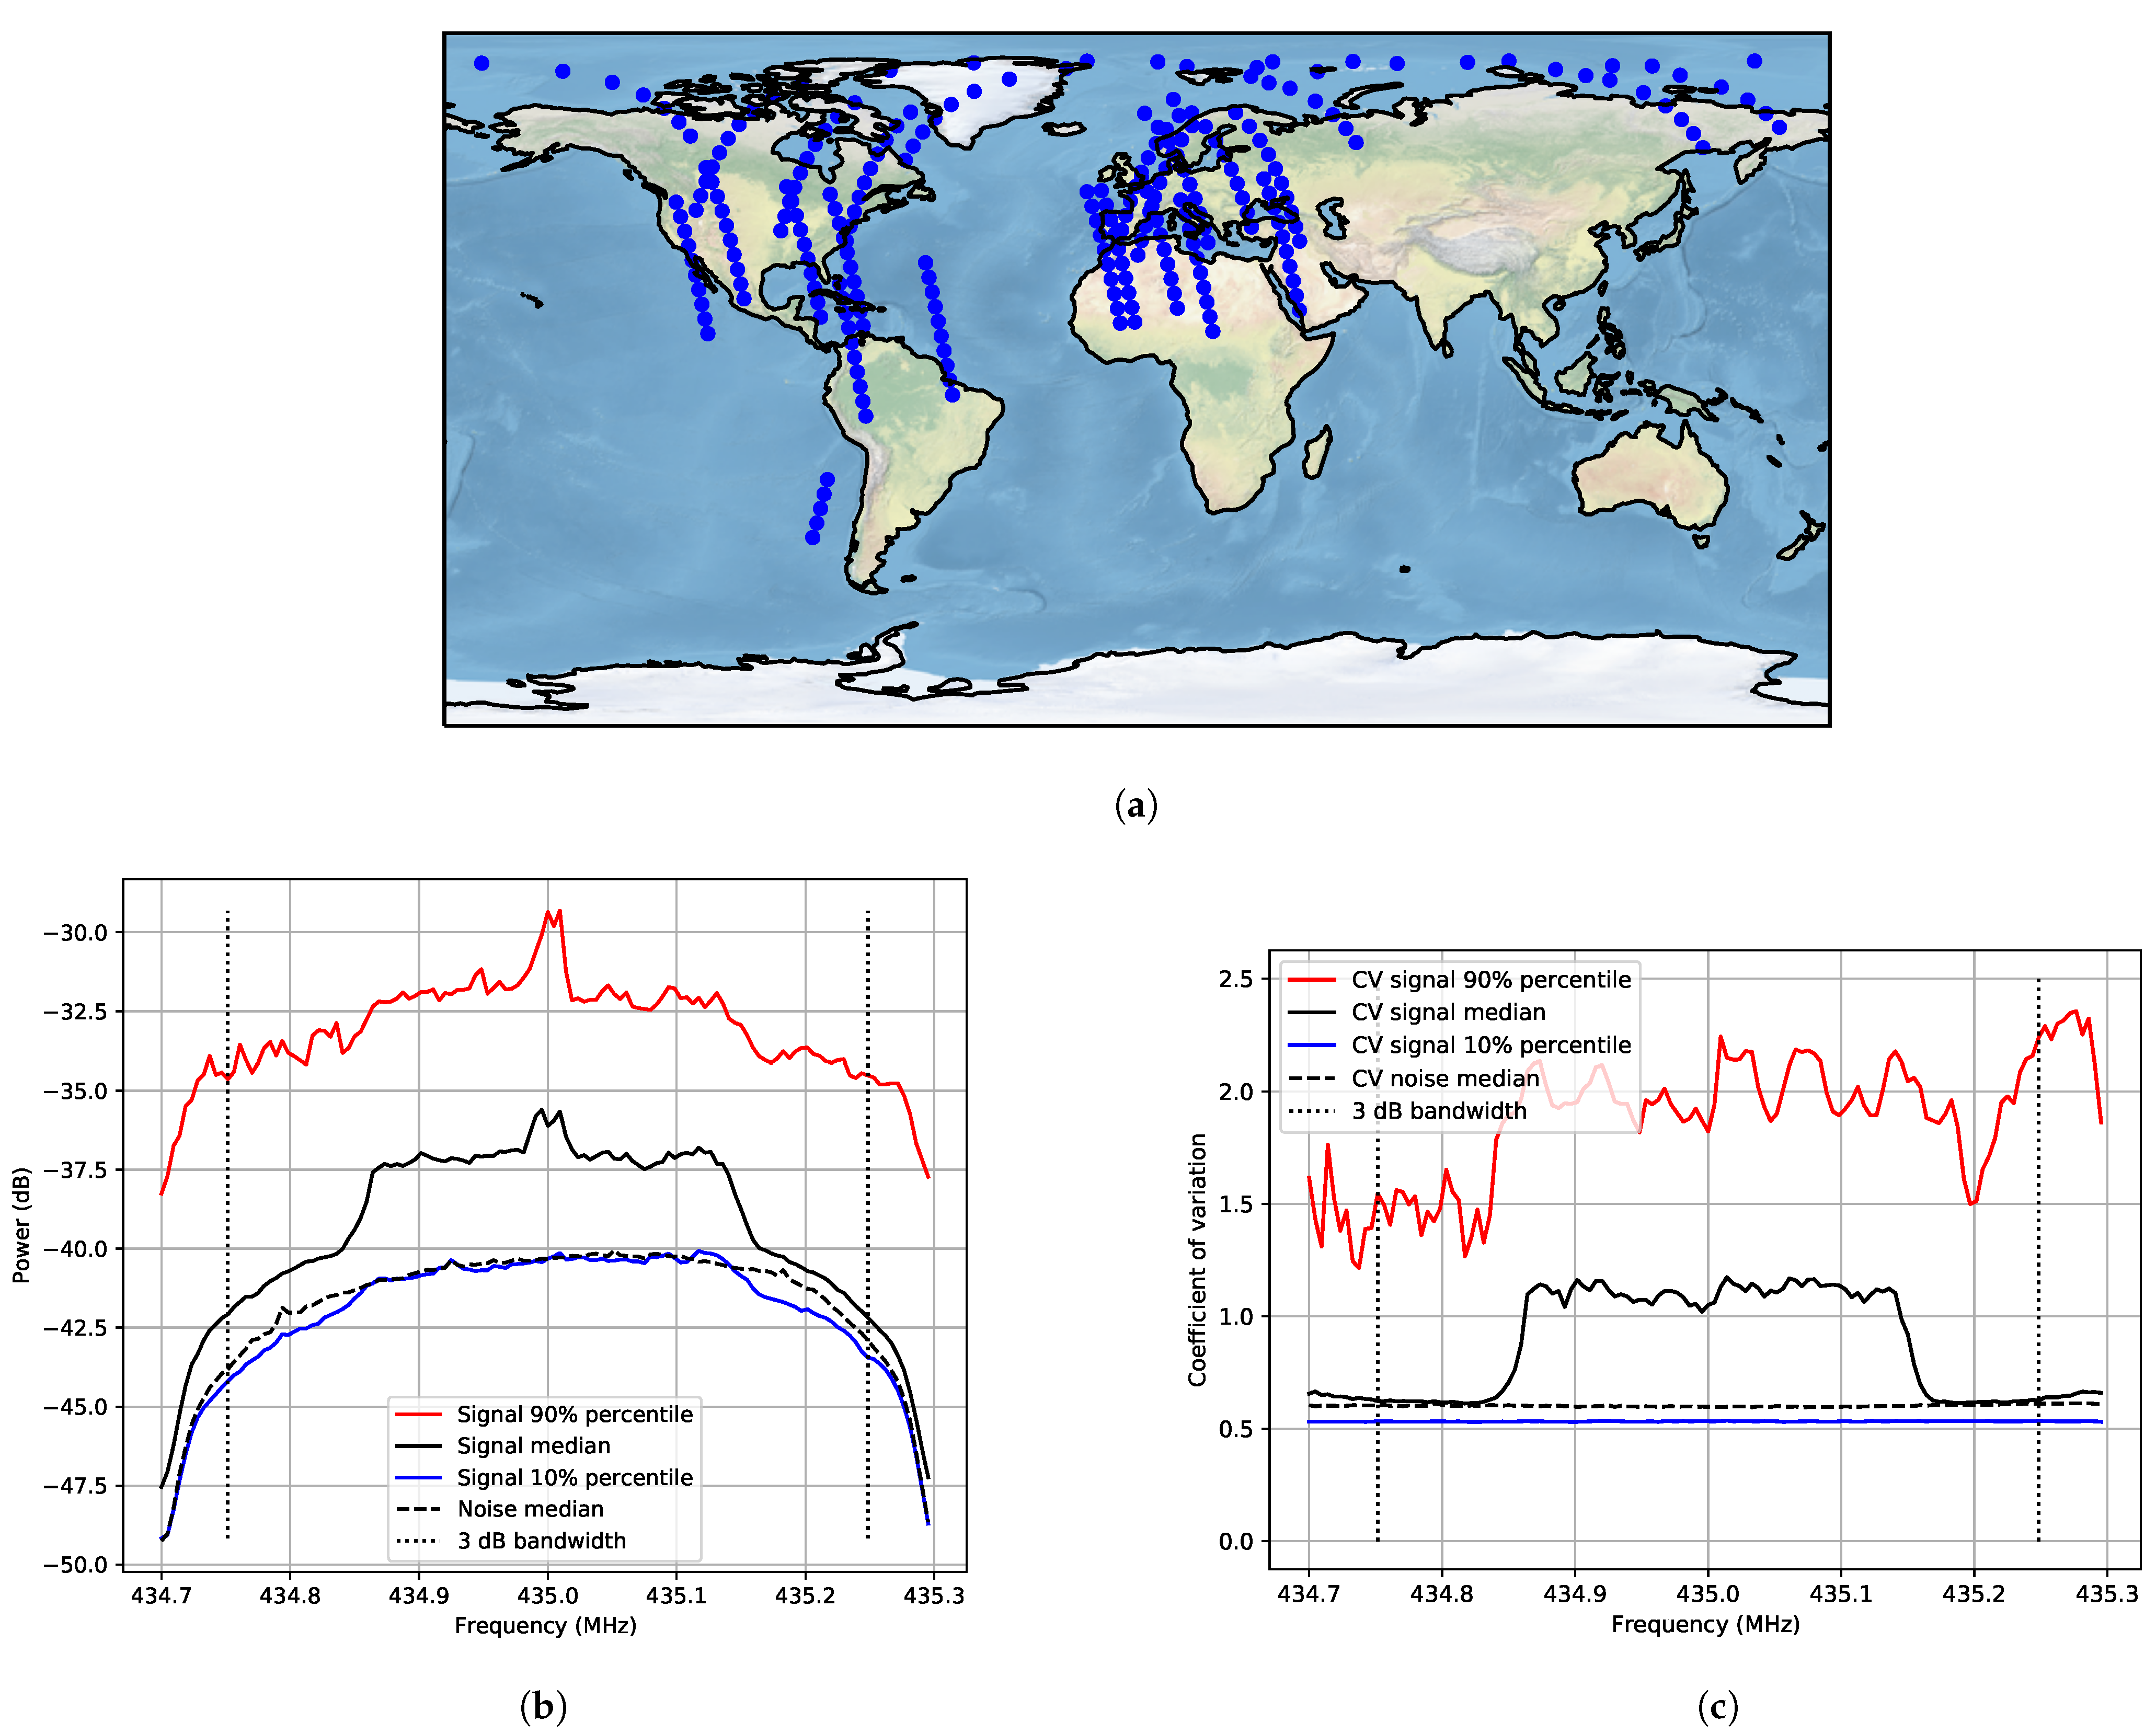
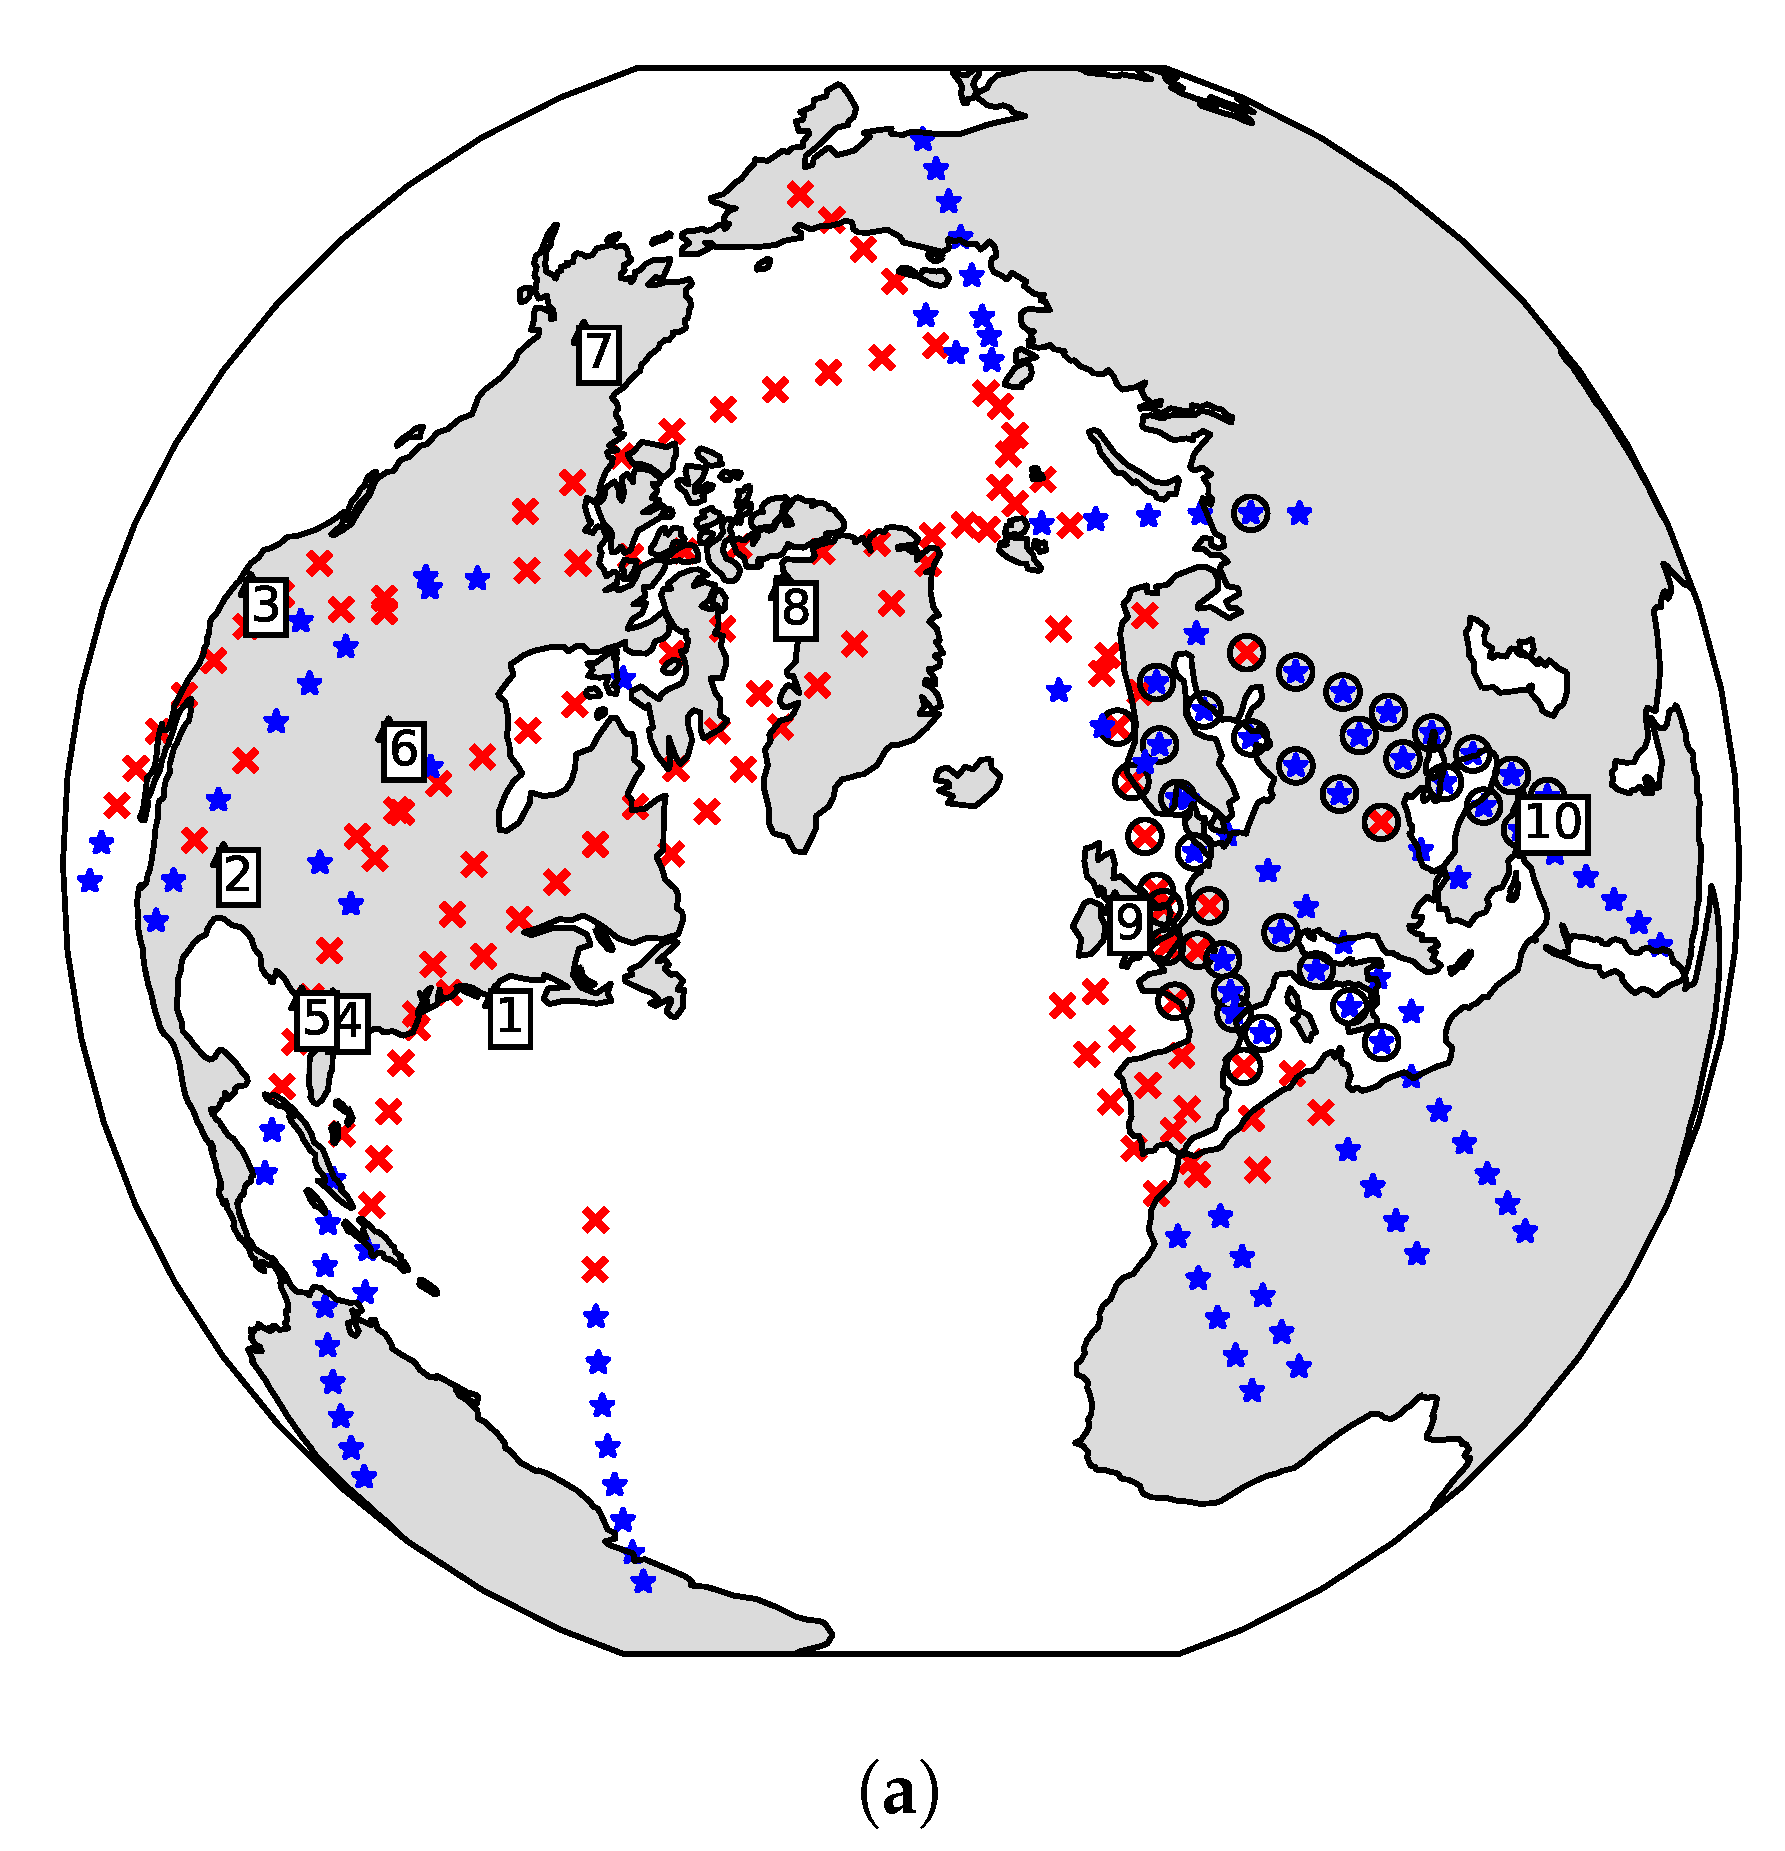
In this article, we present the first measurement results using the algorithm described on-board the LUME-1 satellite. The measurement areas were decided based on where interference has previously been reported in the UHF amateur radio band (America, Europe, north of Africa, and the Middle East) [
11,
12,
13]; over areas where there are known radar sources and can be of interest to Norway (the Arctic) [
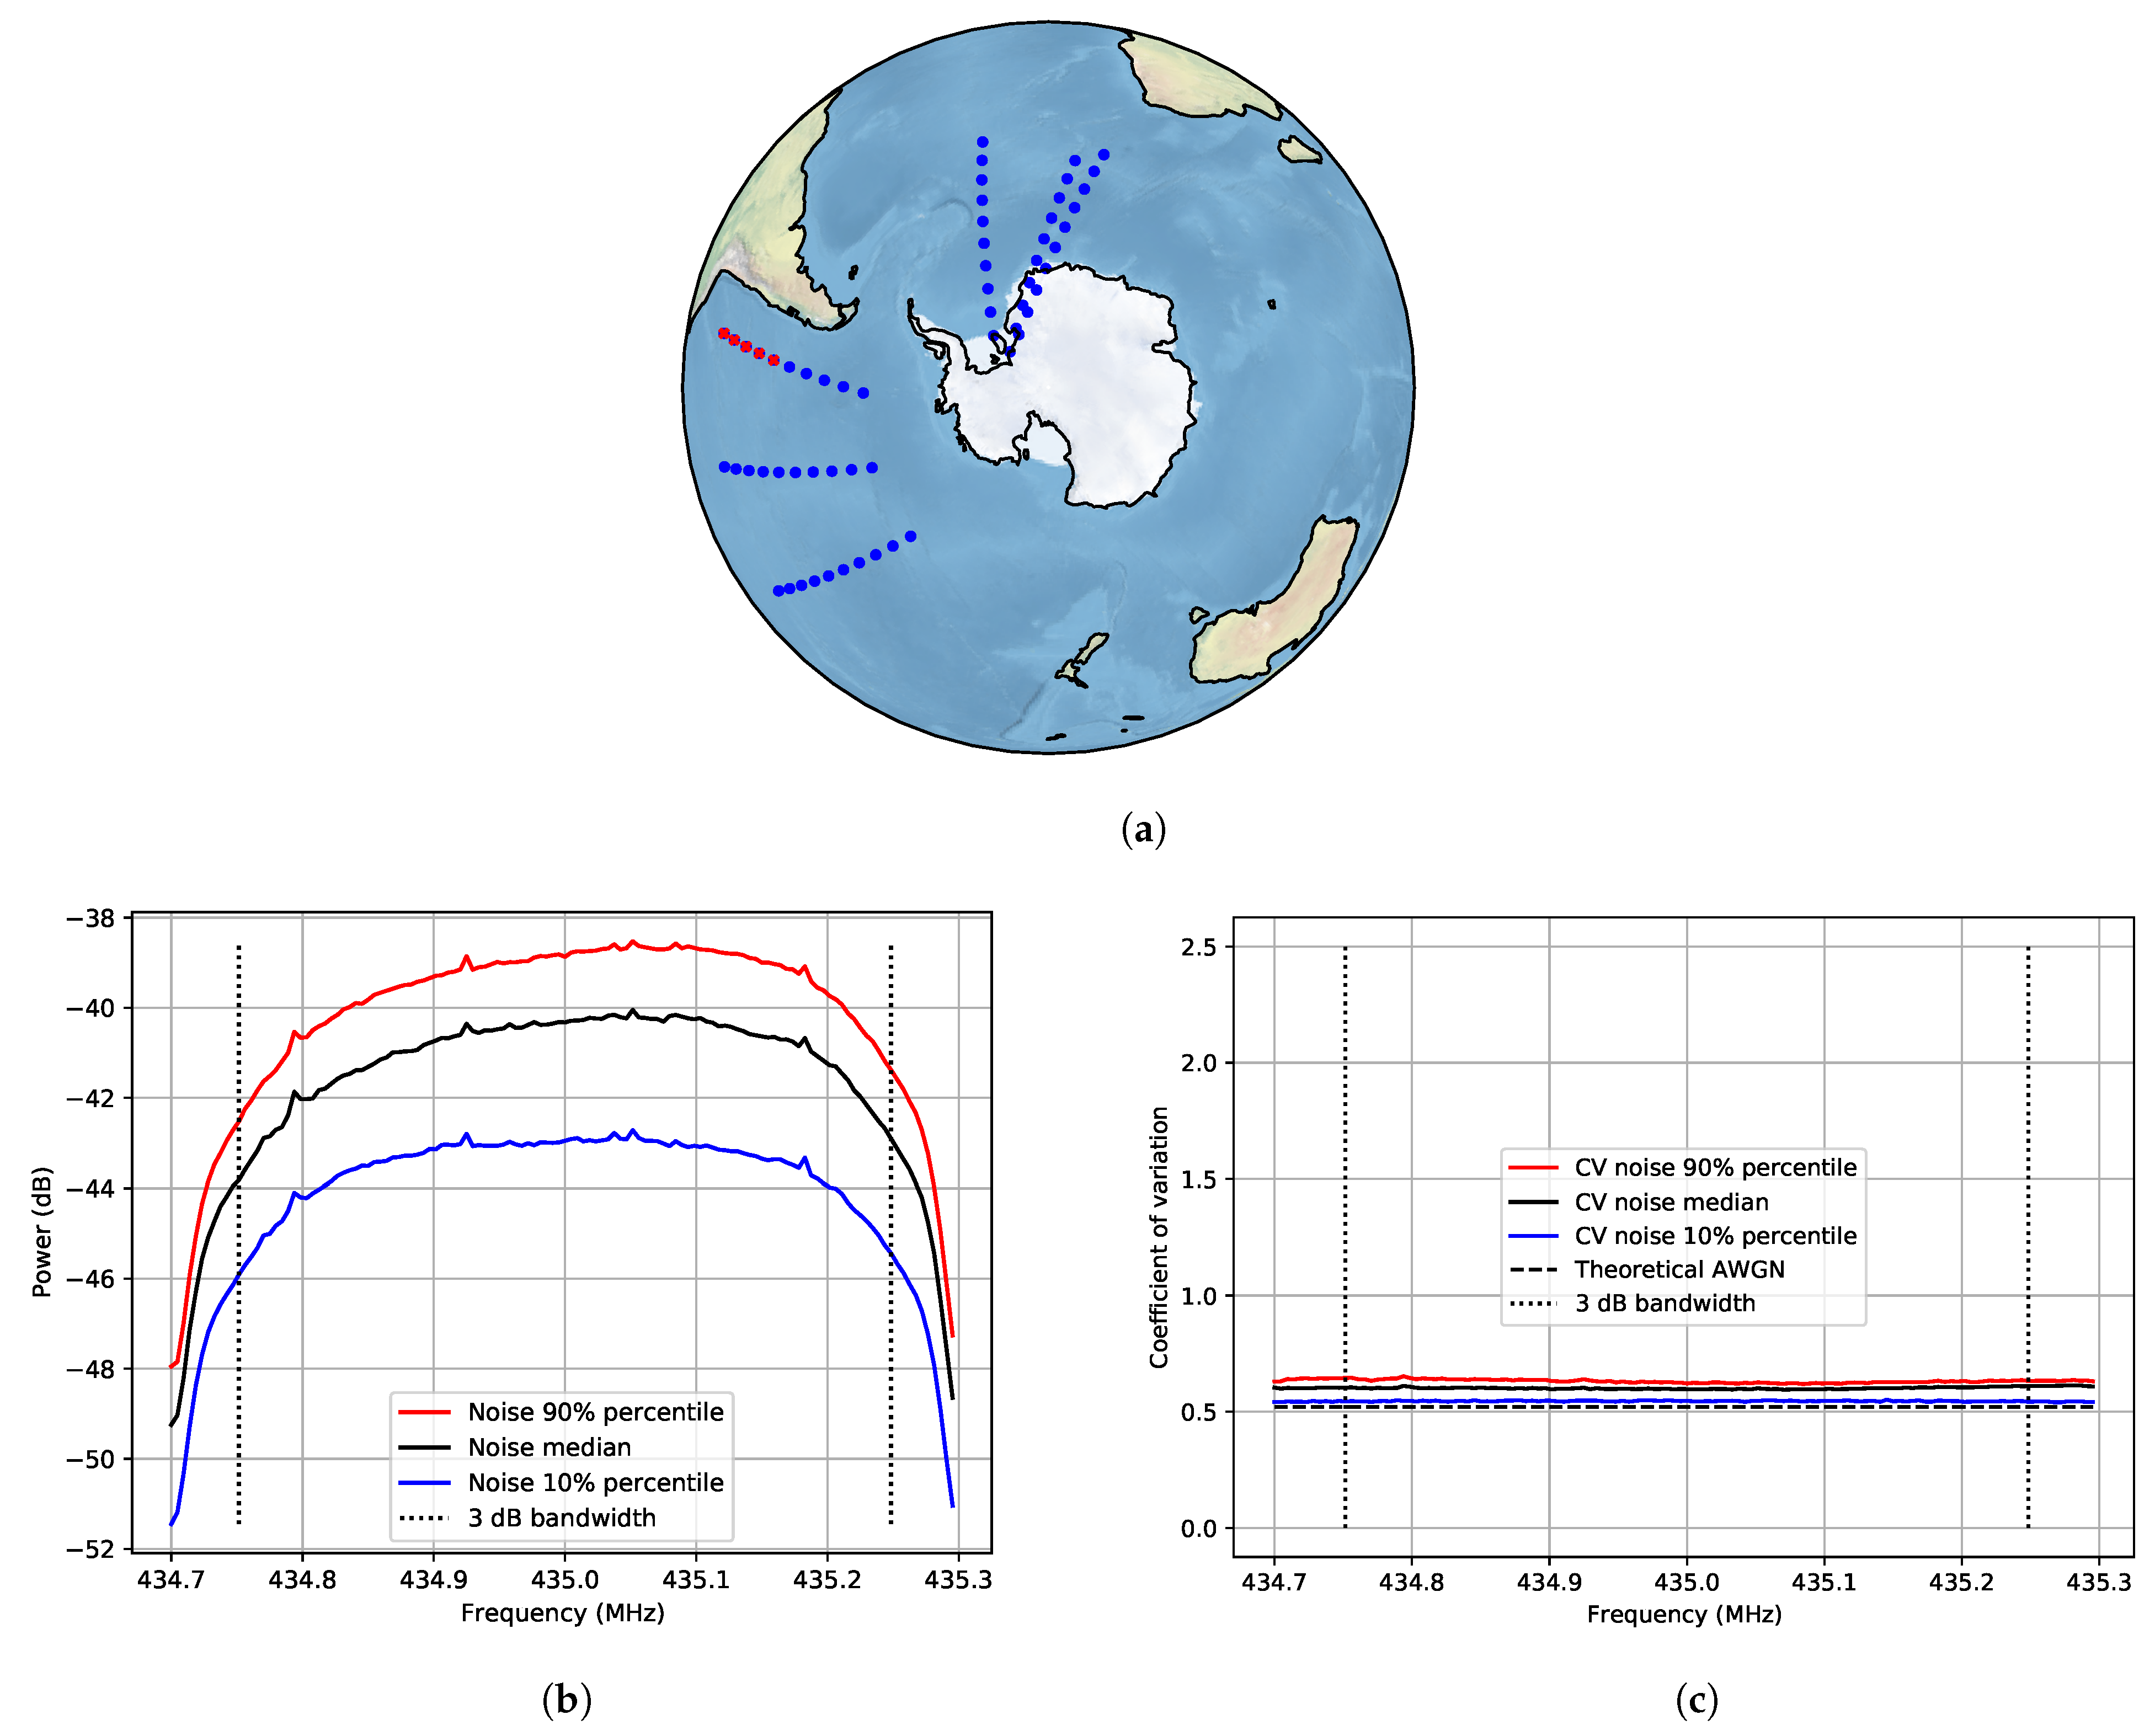
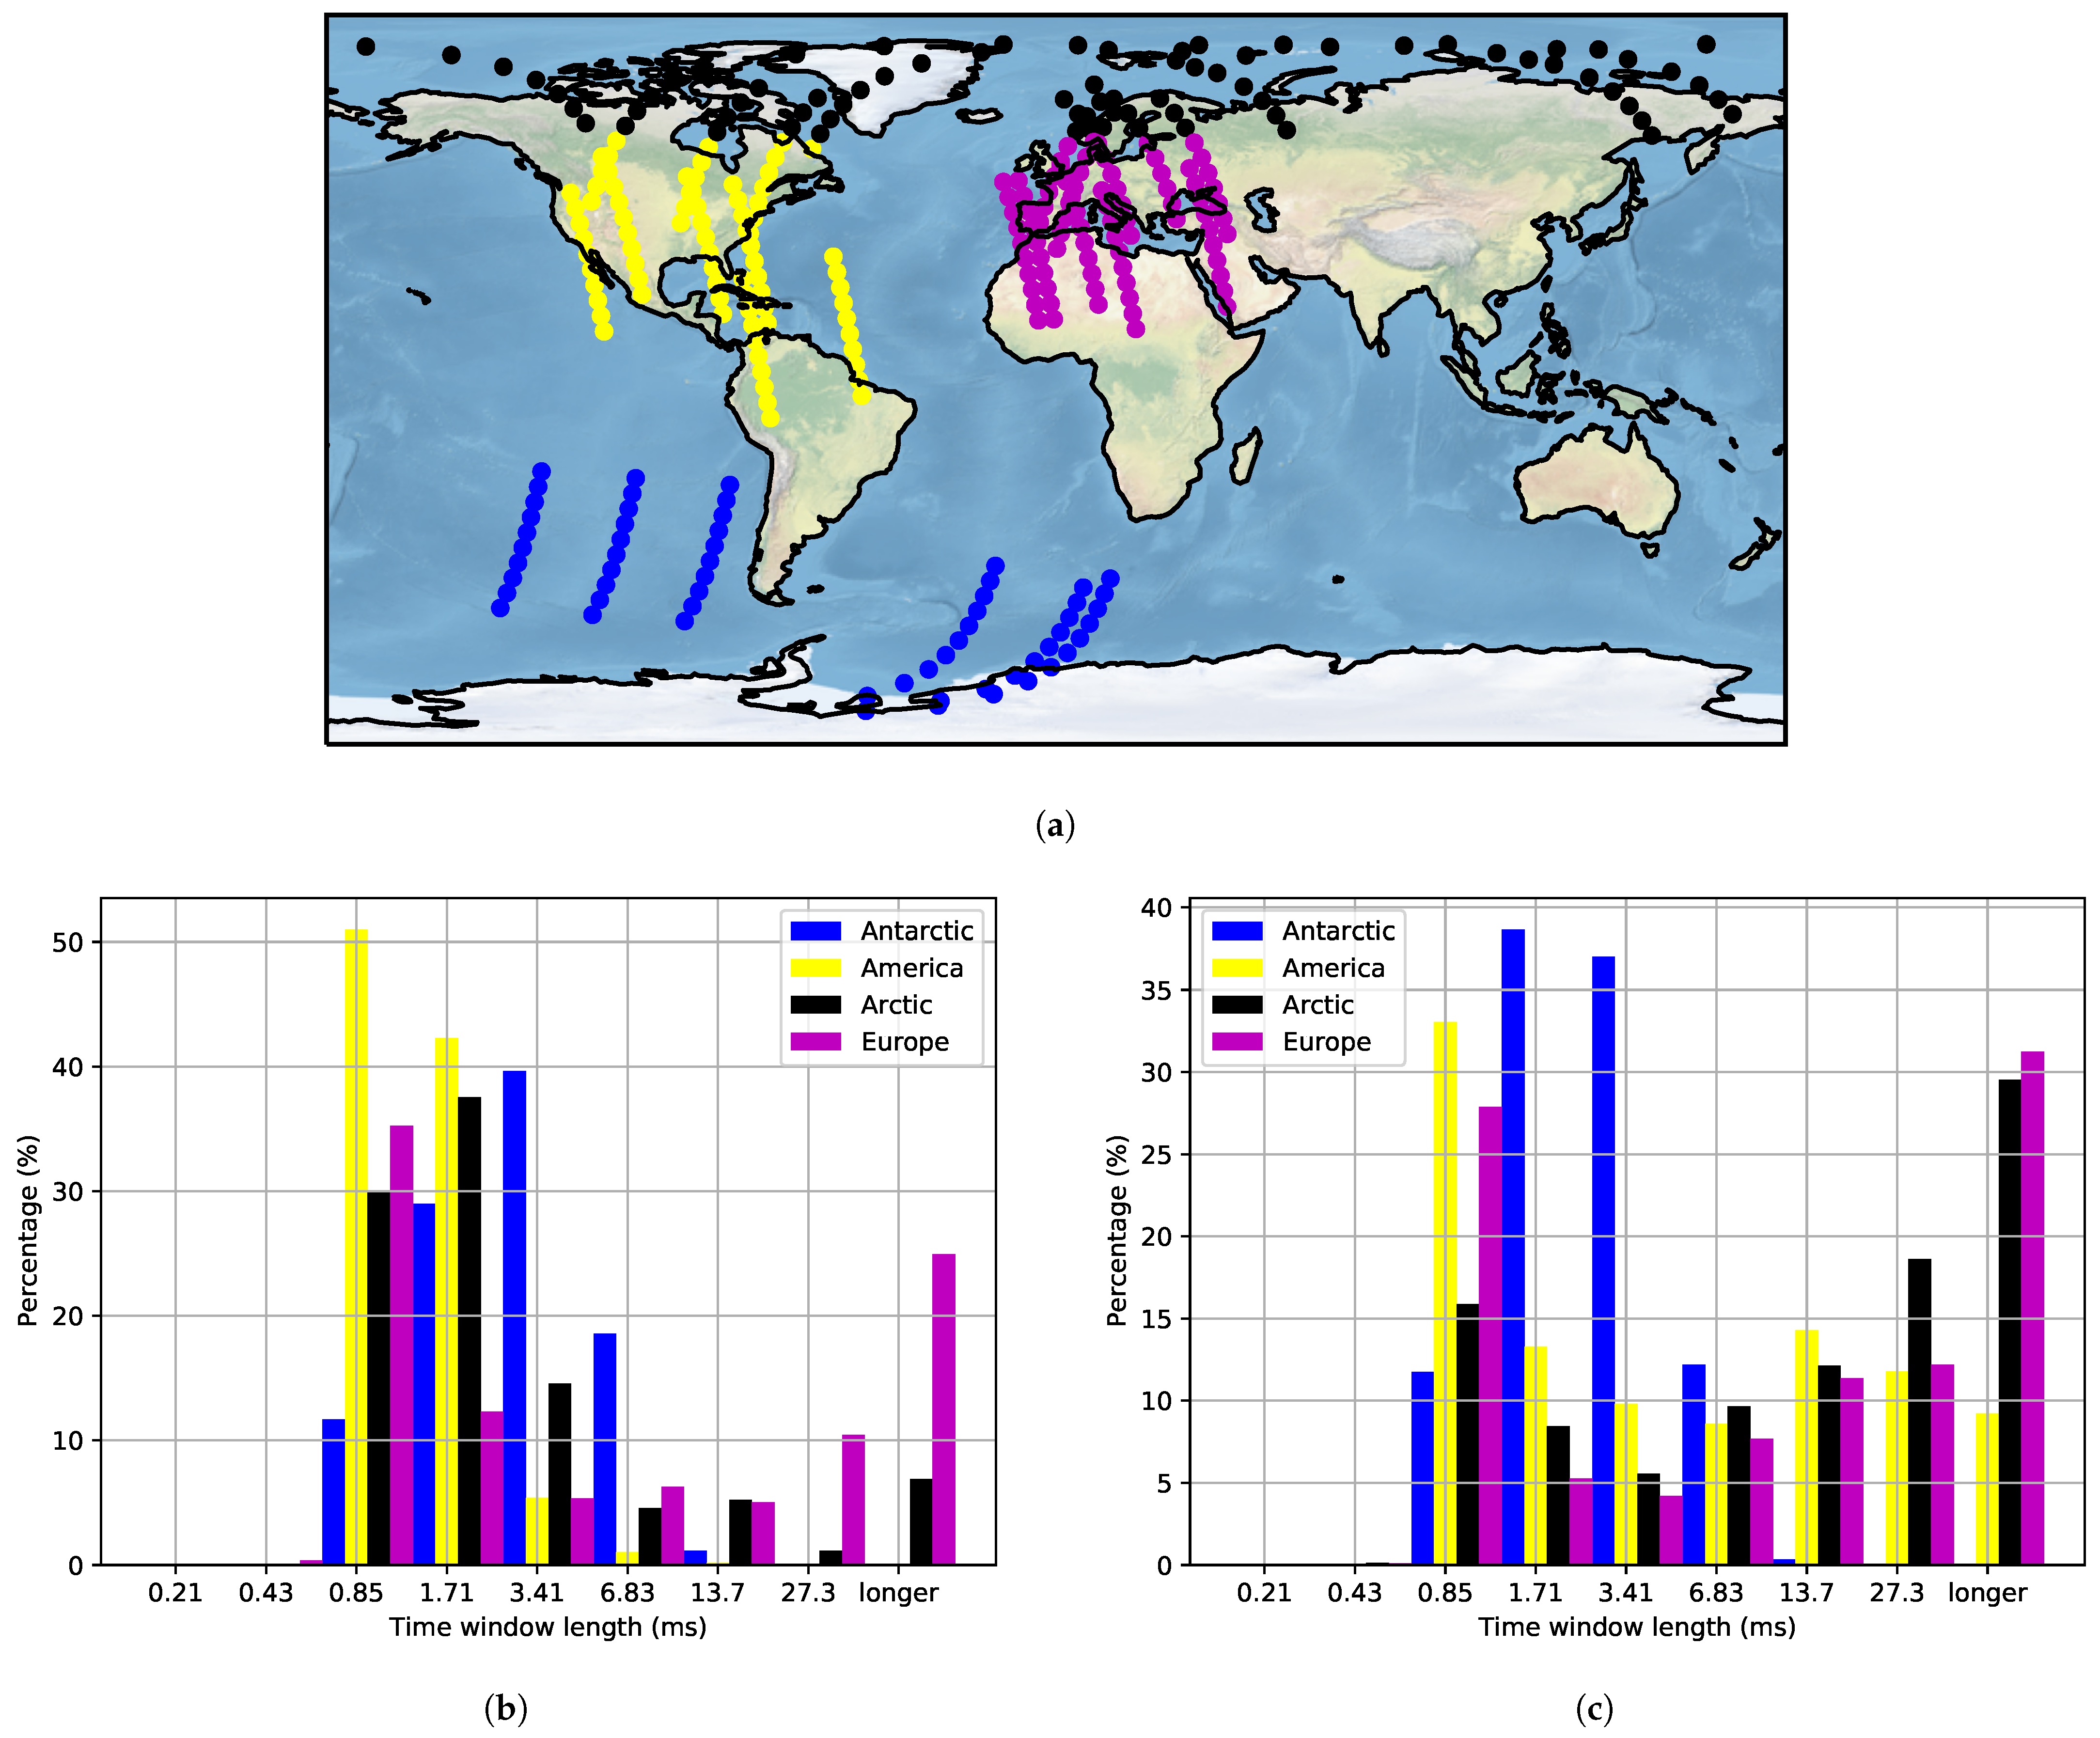
21]; and areas in the ocean (South Pacific and South Atlantic). All measurements are referred to as interference over populated areas, except for the last category. The latter are named noise measurements over non-populated areas because the spectra measured had lower power and because there are lower population concentrations.
The Concept of Operations (CONOPS) for the measurement campaigns is as follows:
Plan schedule. The date and time of passes where the satellite is over the areas of interest are estimated using the Python library
pyorbital and the corresponding Two-Line Element (TLE) from Celestrak [
30].
Upload schedule. When there is availability over the ground station, the schedule for the measurements is uploaded to the satellite. The schedule includes the date and time to execute the command to run the measurement software, the command, and its parameters.
Run measurement. TOTEM is turned on and the measurement software runs for five seconds every minute for 10 min. Afterwards, TOTEM is turned off until the next measurement set.
Downlink data. After all measurements are carried out, the UHF transmitter is turned on to downlink the measurement files.
The size of each data file depends on the number of frequency bins (M), the number of bits per sample (), and the number of outputs of the software (): .
In
Table 2, the data budget for the measurement algorithm described in this paper, with the configuration of
Section 4, is compared to raw spectrum monitoring with the same parameters for five seconds and for one minute continuously. By raw spectrum monitoring, we refer to a spectrogram (commonly known as waterfall plot), which is a representation of the power spectrum of a signal as it changes in time. The on-board processing software provides a data reduction of 203,400 times compared to the 10 min waterfall and 1920 times compared to the five-second waterfall.
Assuming an available downlink rate of 1 kbps, the time estimated to downlink one set of 10 measurements is shown in
Table 3. The number of days to downlink is estimated assuming an average of one pass per day with average five minutes for the 4.8 kbps configuration.
6. Discussion
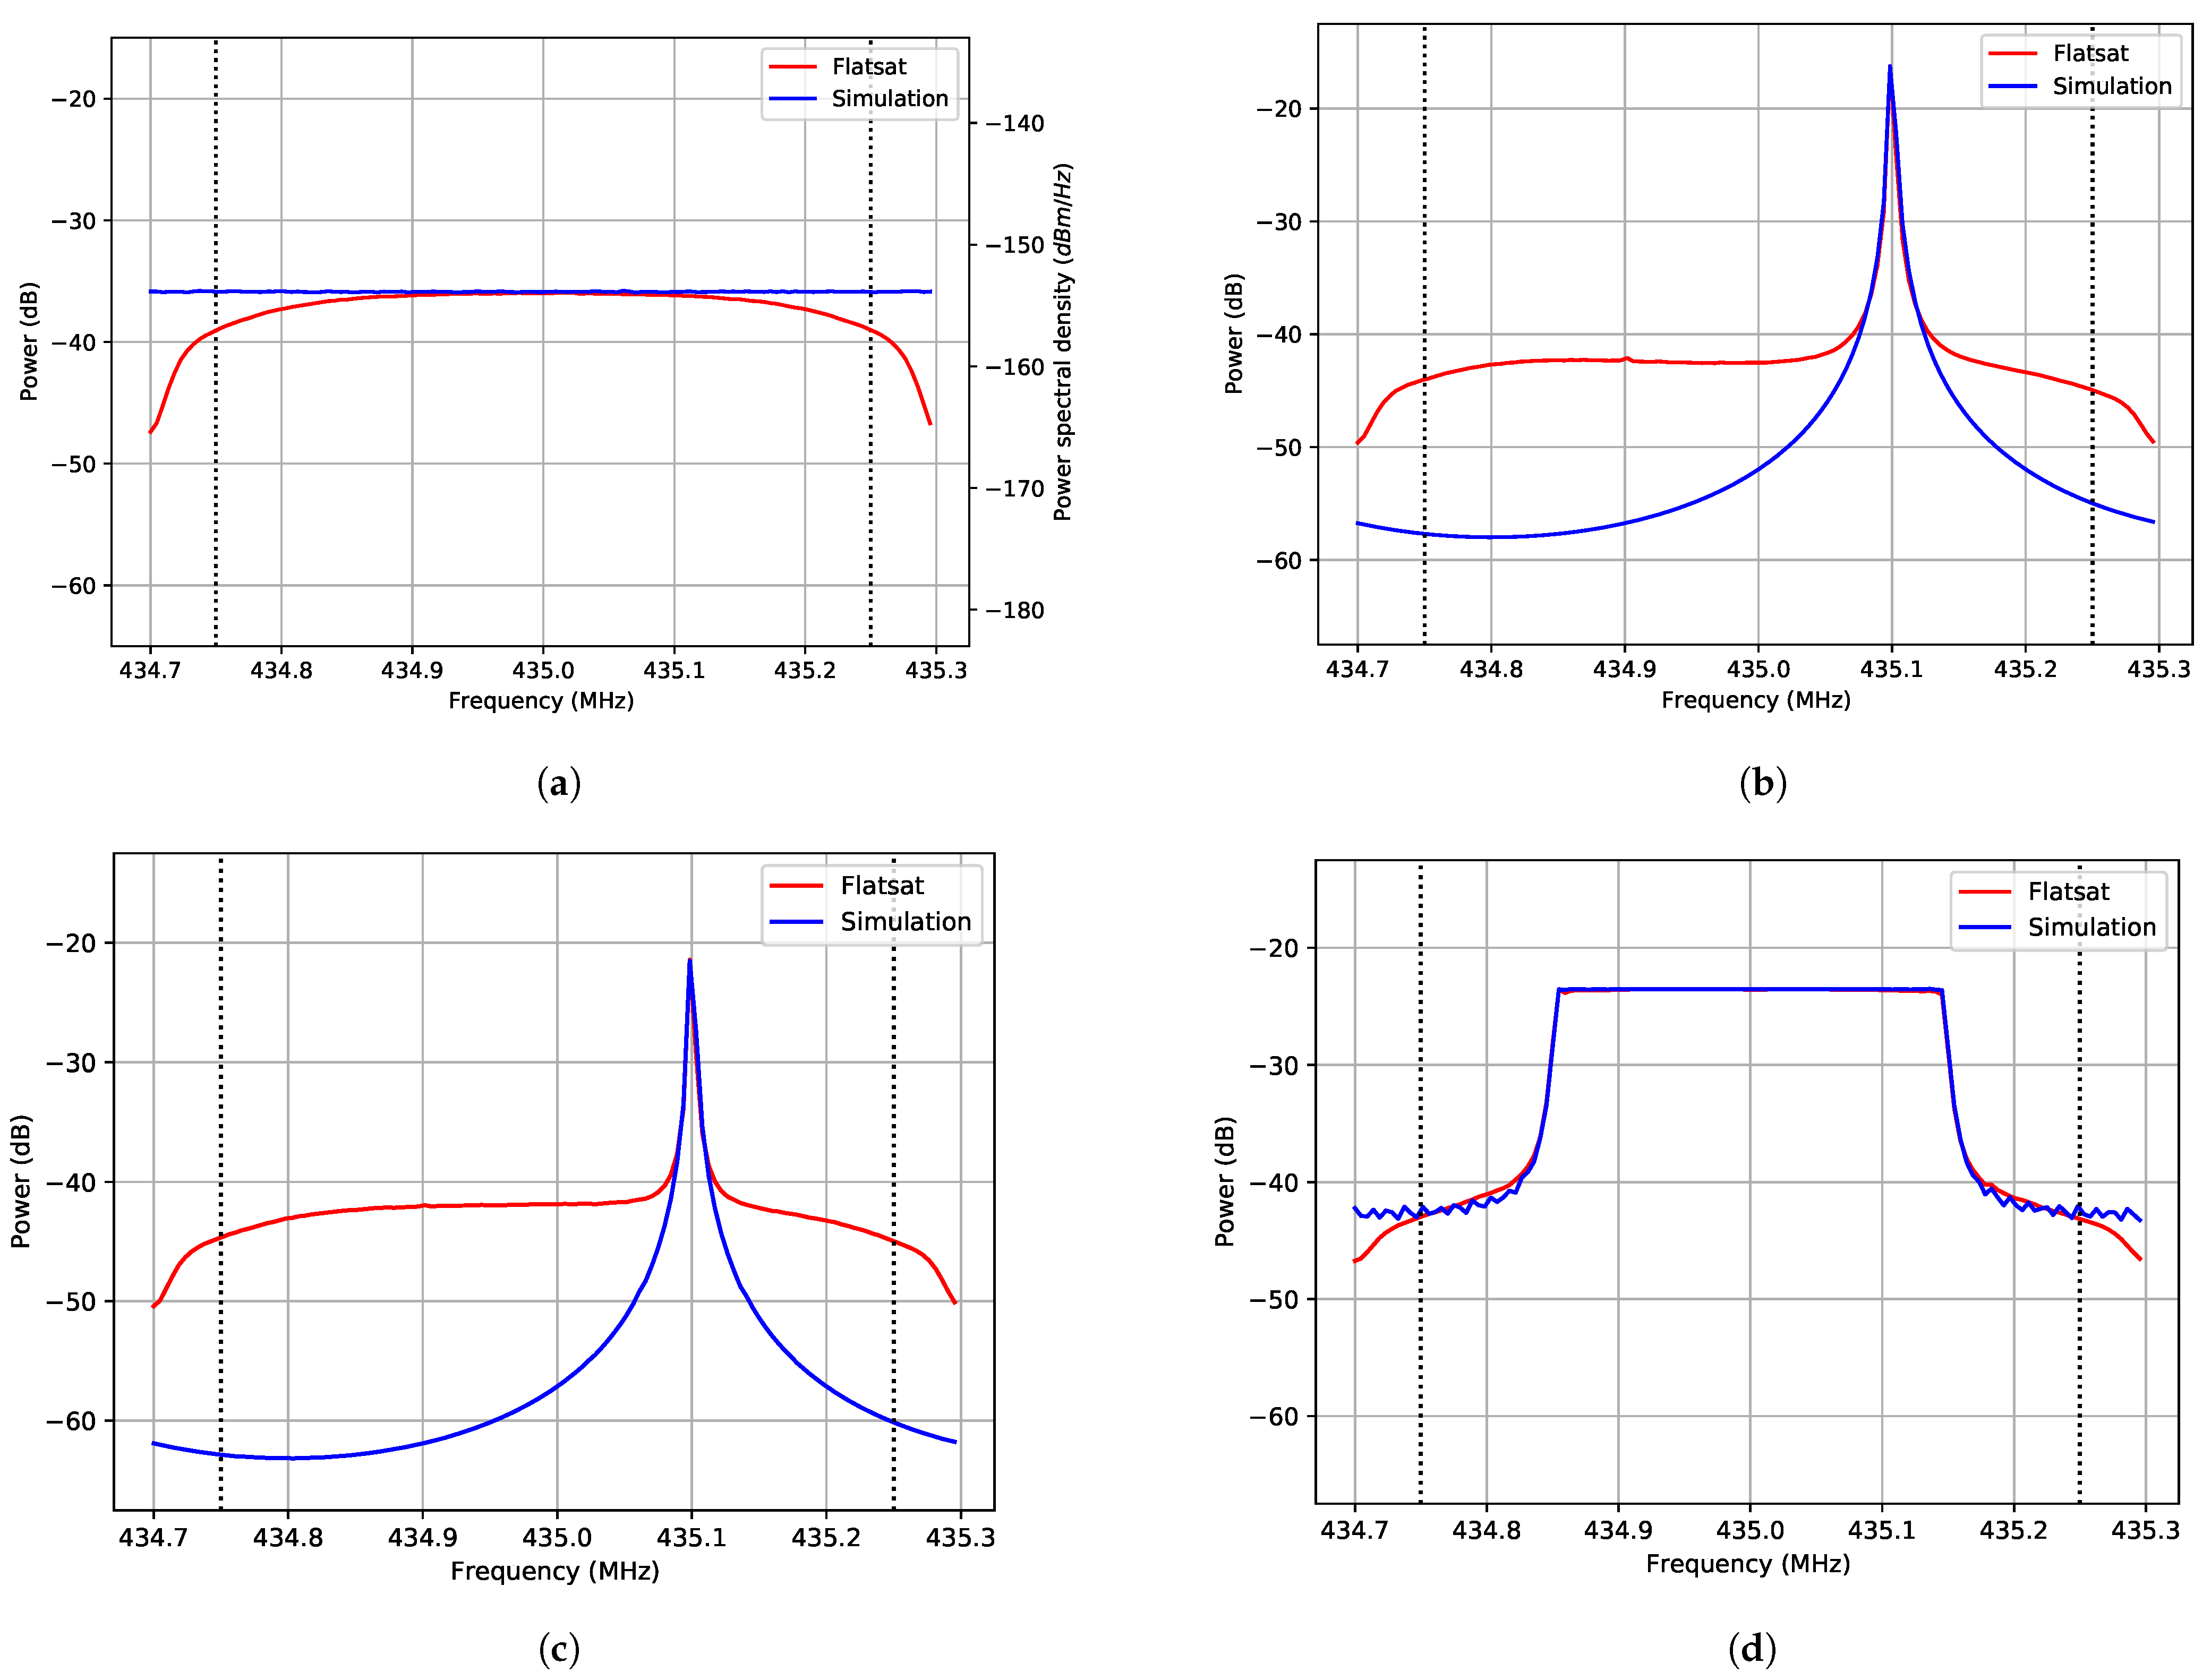
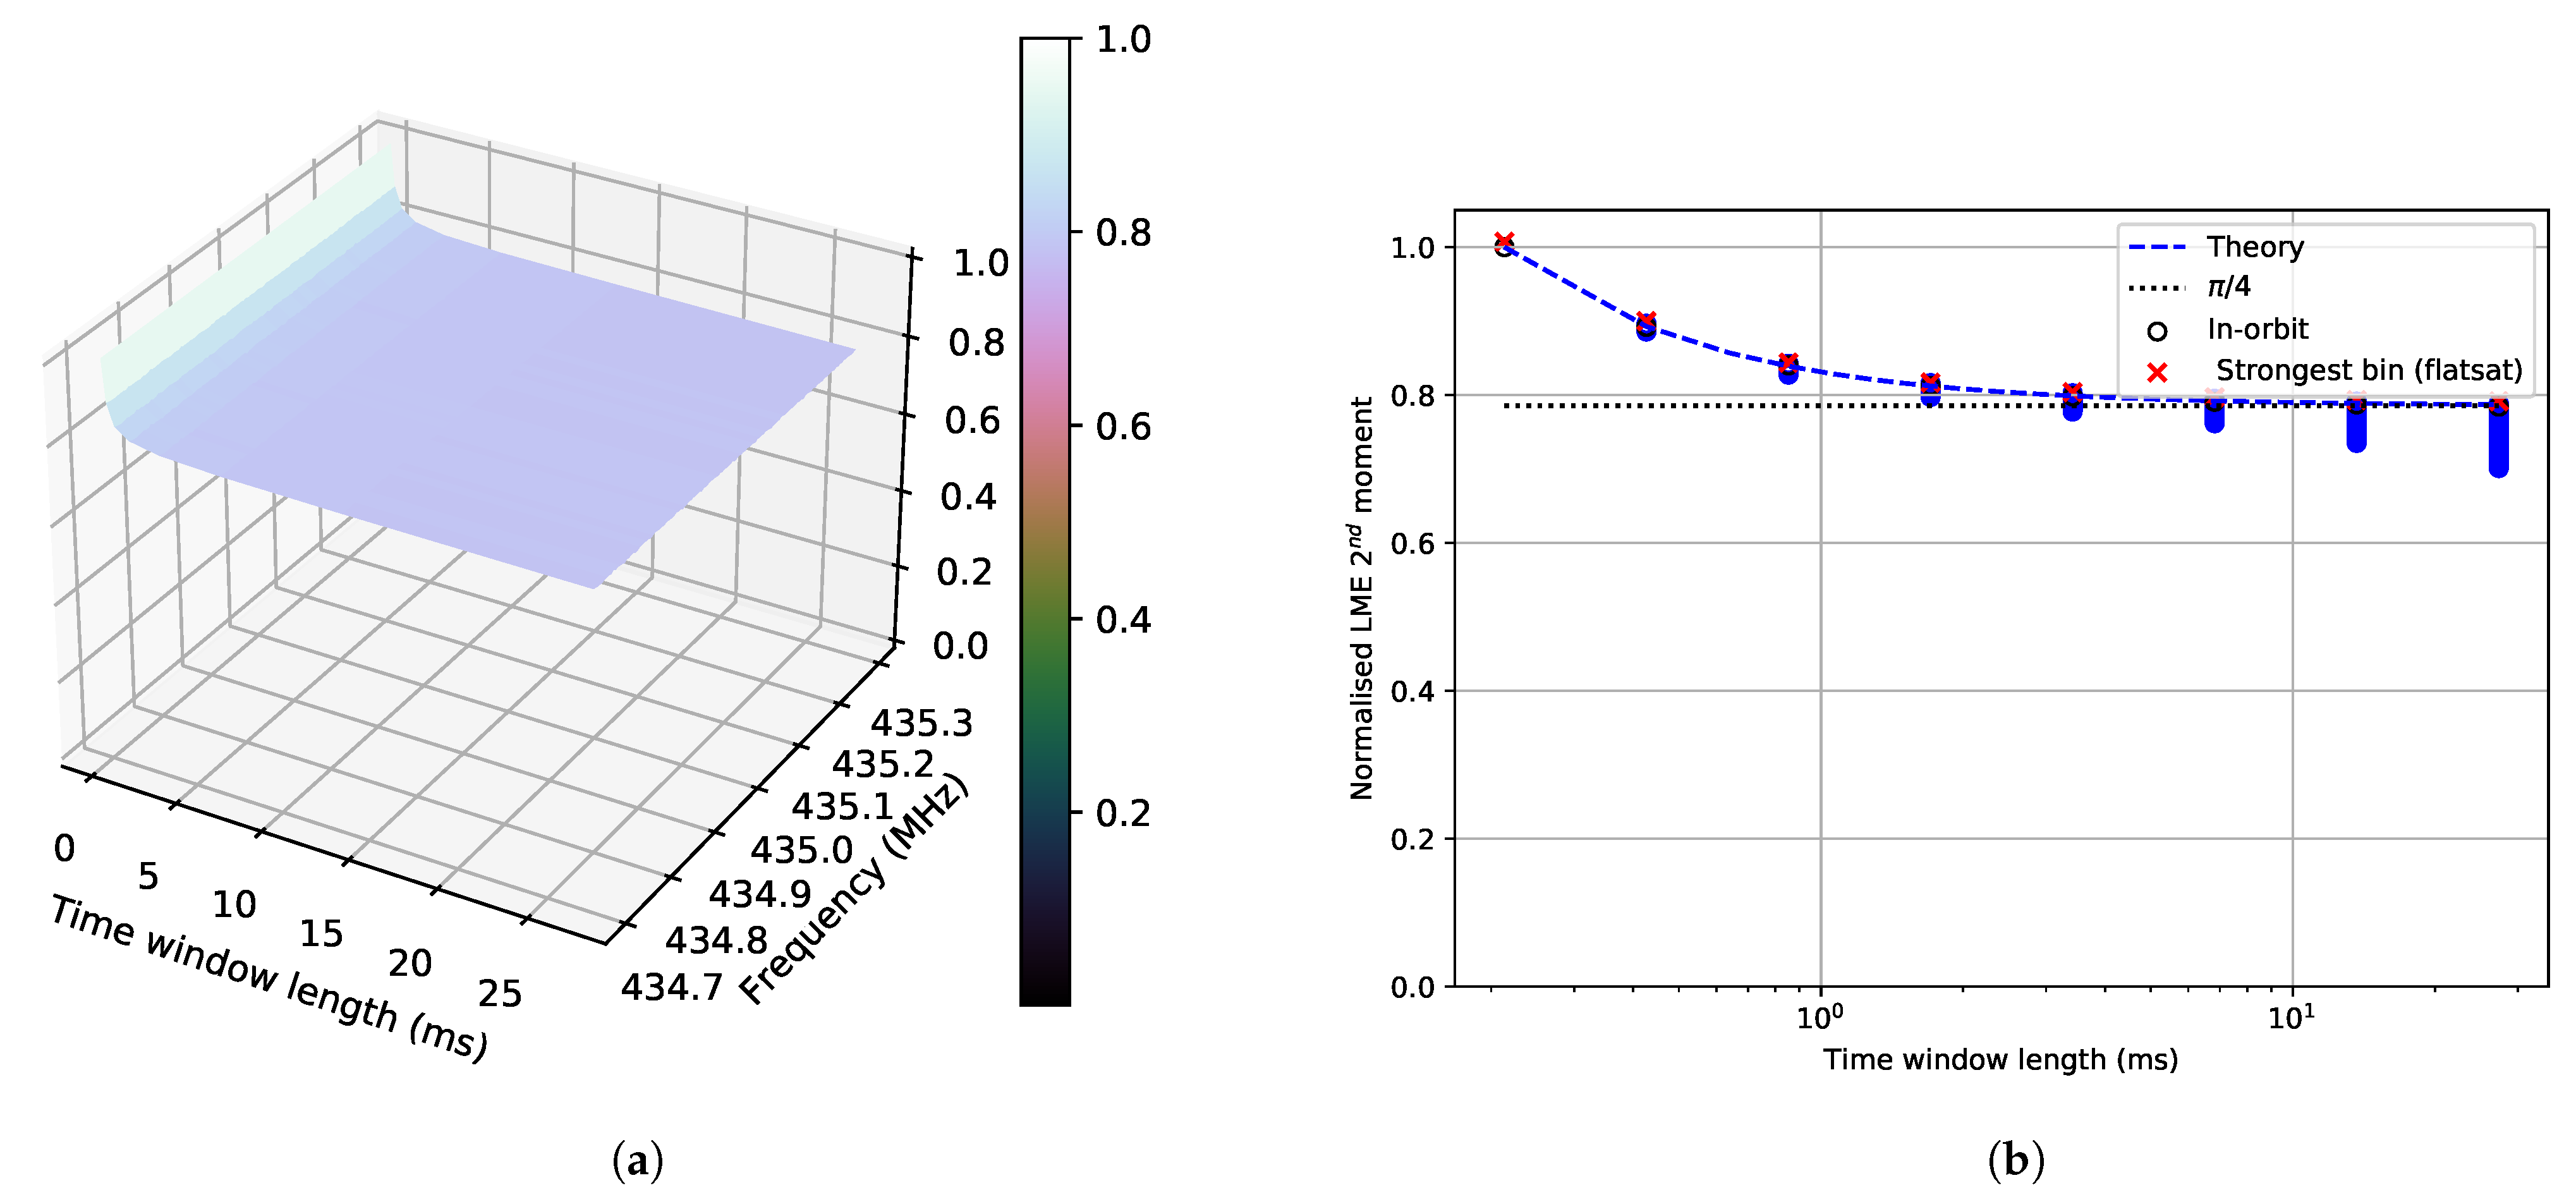
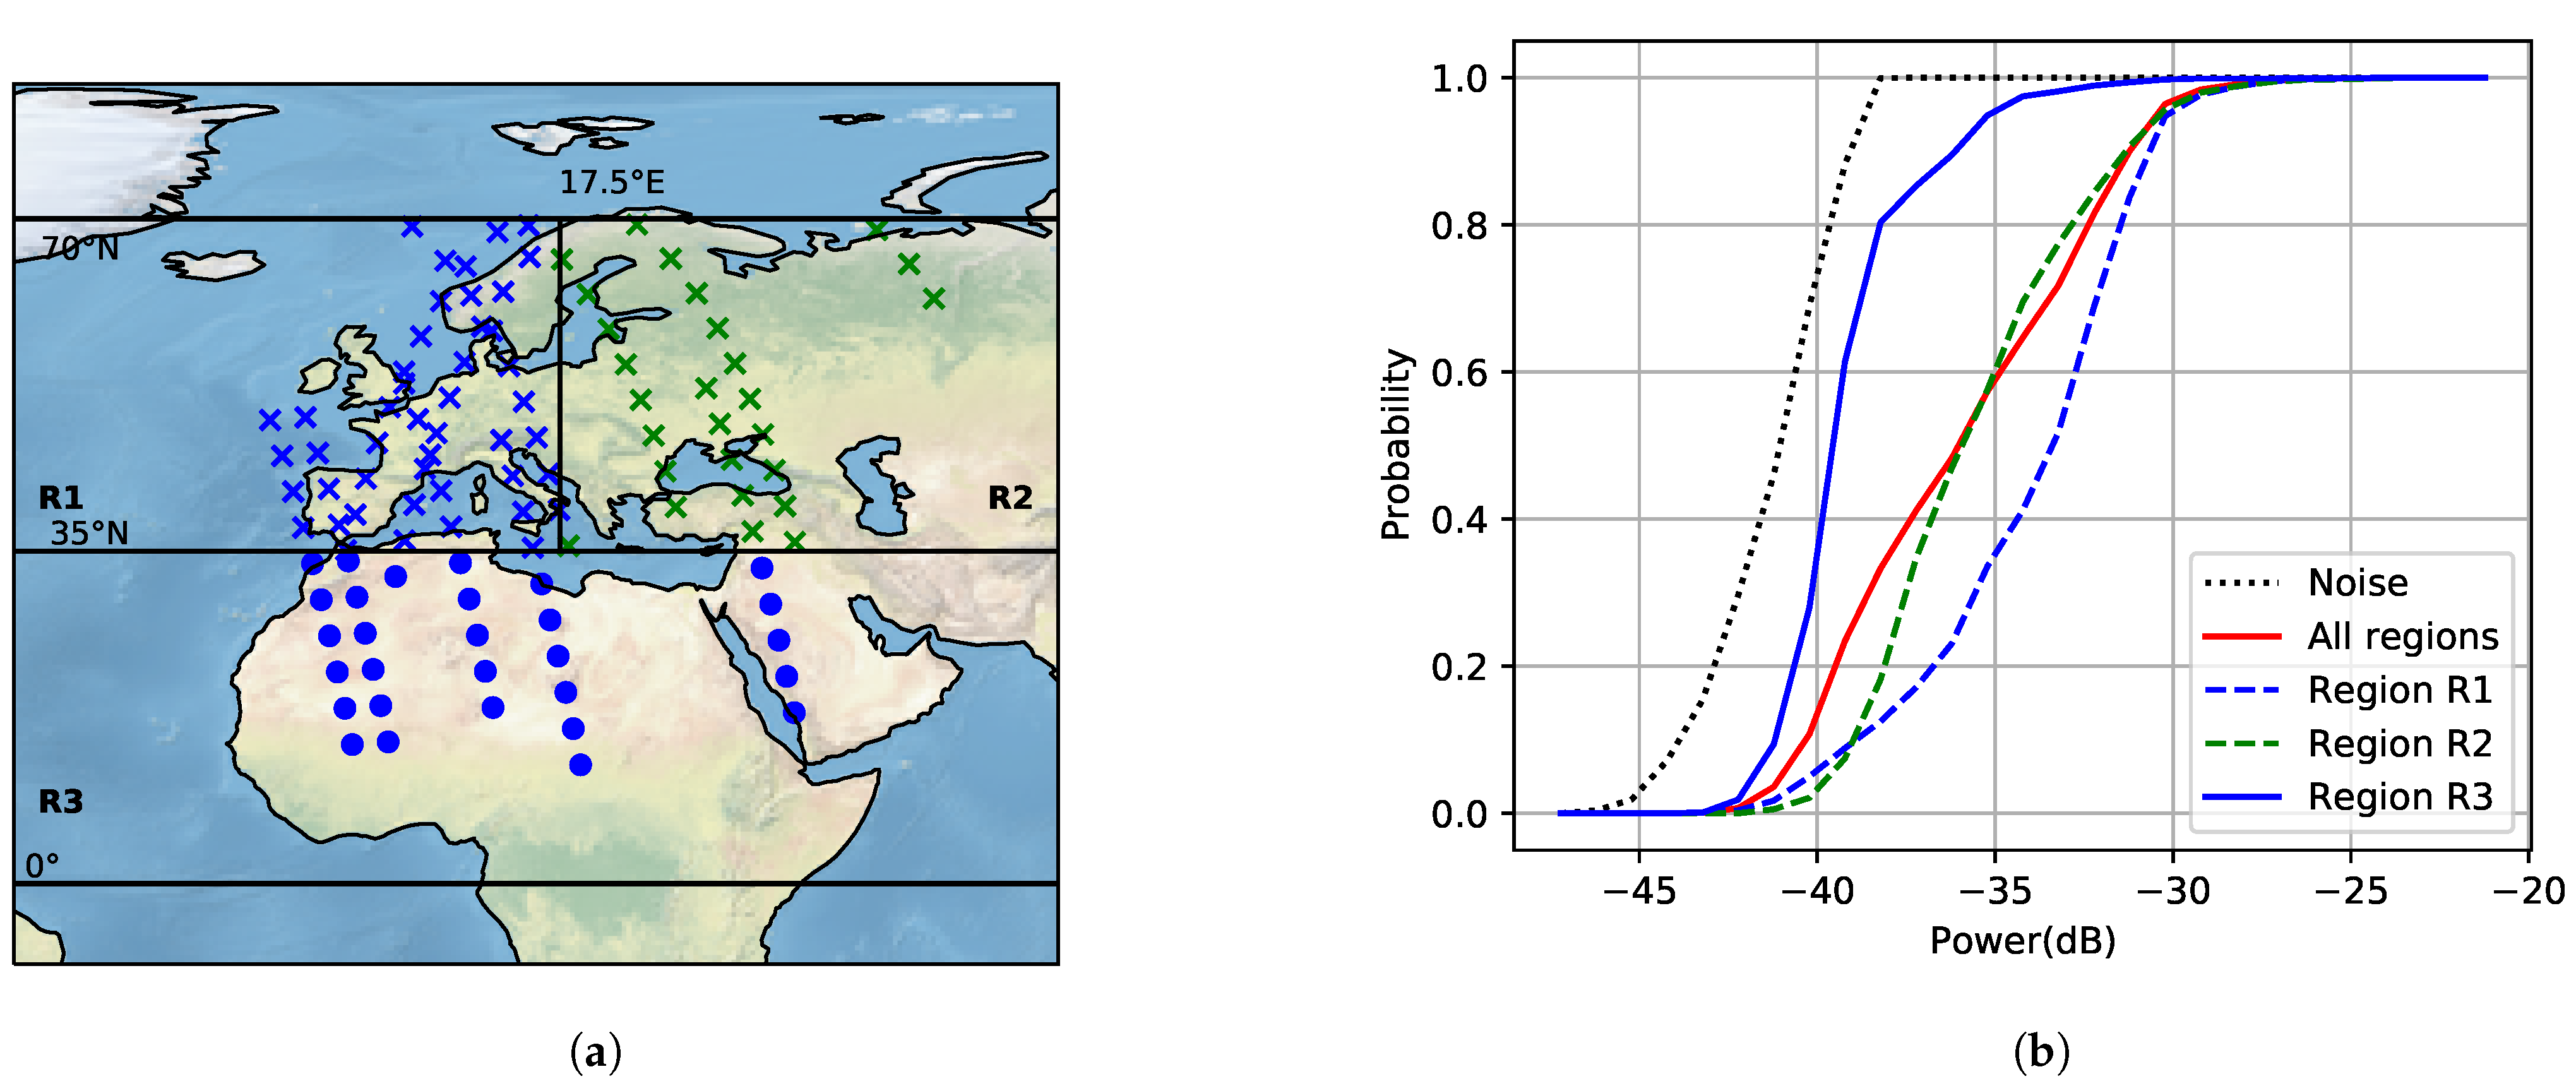
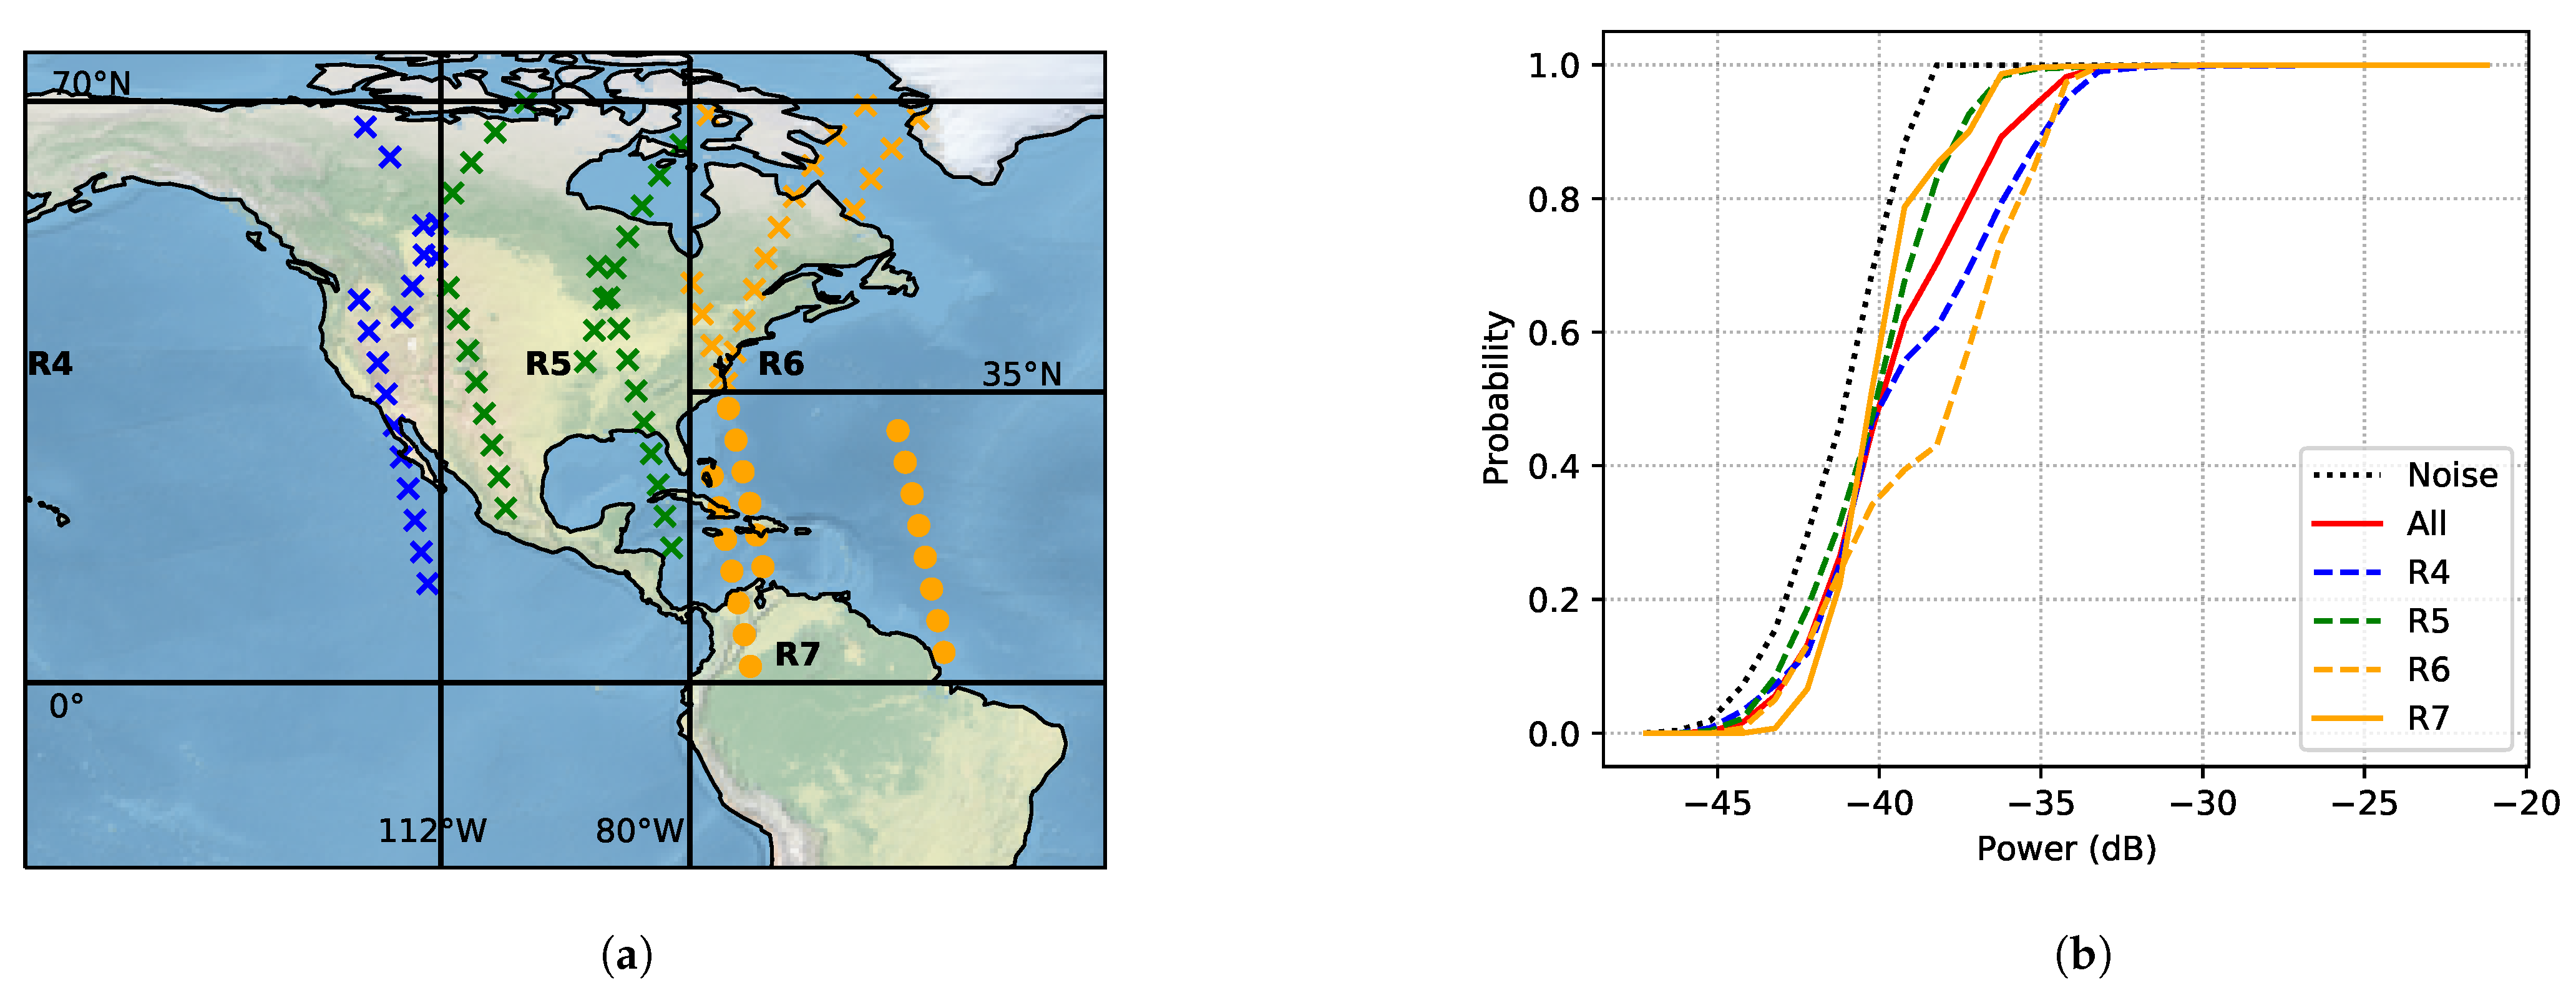
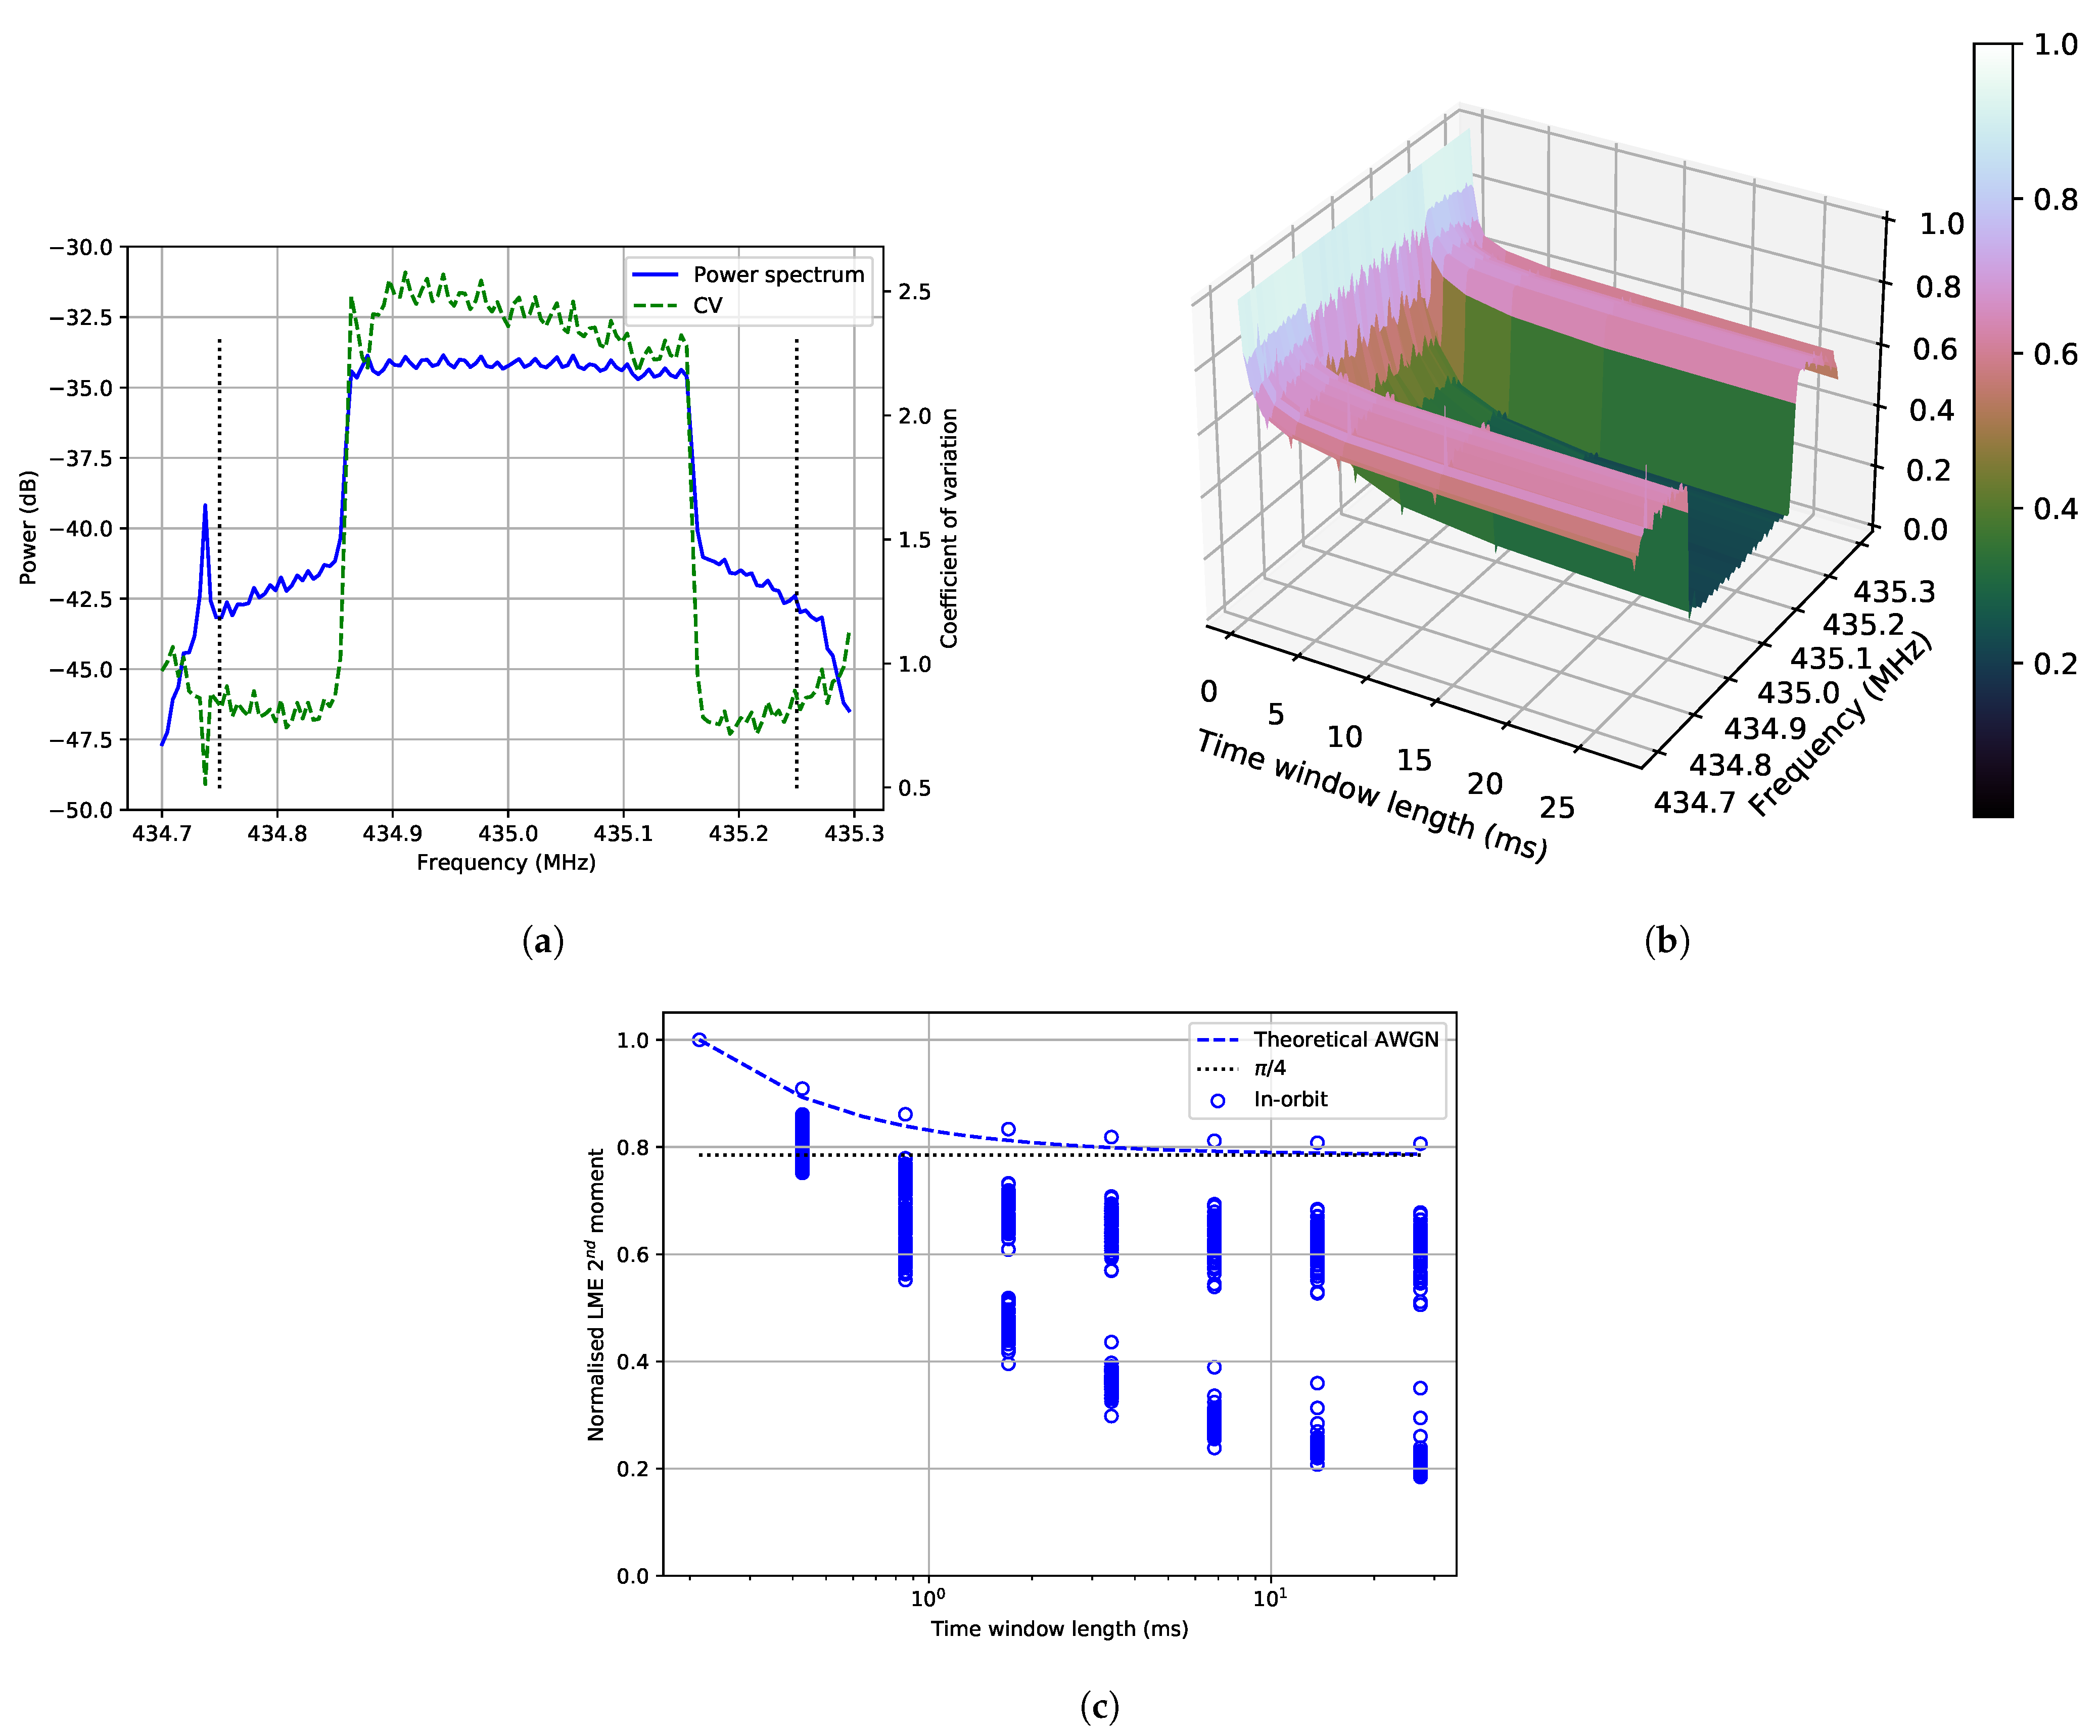
The interference measured over non-populated areas has similar behaviour to the AWGN behaviour both in frequency and time. The in-orbit spectrum measured (
Figure 6b) shows the frequency response of the system that was measured in the lab (
Figure 3a). The measurements over non-populated areas can be used as an in-orbit relative noise floor and justify the use of heatmaps over these areas since the behaviour is close to Gaussian. In the power spectrum, there is a variation that can be caused by the tumbling of the satellite that introduces a variation in antenna gain and polarisation, as well as a variation in internal temperature. On several of the measurement tracks, the satellite moved from daylight (highest internal temperature) to eclipse (lowest internal temperature). This could also be the explanation why the temporal behaviour is not completely Gaussian; perhaps there is a slow variation of internal temperature causing this difference.
For the populated areas, the power levels of the interference are higher than the noise floor. In these areas, there can be a lot of interference sources, such as ground stations for different satellites and amateur radio activity. The results show that the measured interference over different regions has different frequency and time behaviour. There are different types of interference: some have AWGN statistics, others show CW temporal behaviour, and the last type has a pulsed tendency (both band-limited and wide-band). The AWGN is predominant on the edges of the frequency response where no other signals are present. The narrow-band signals (CW) can be beacons from radio amateurs and would be possible to locate with more measurements.
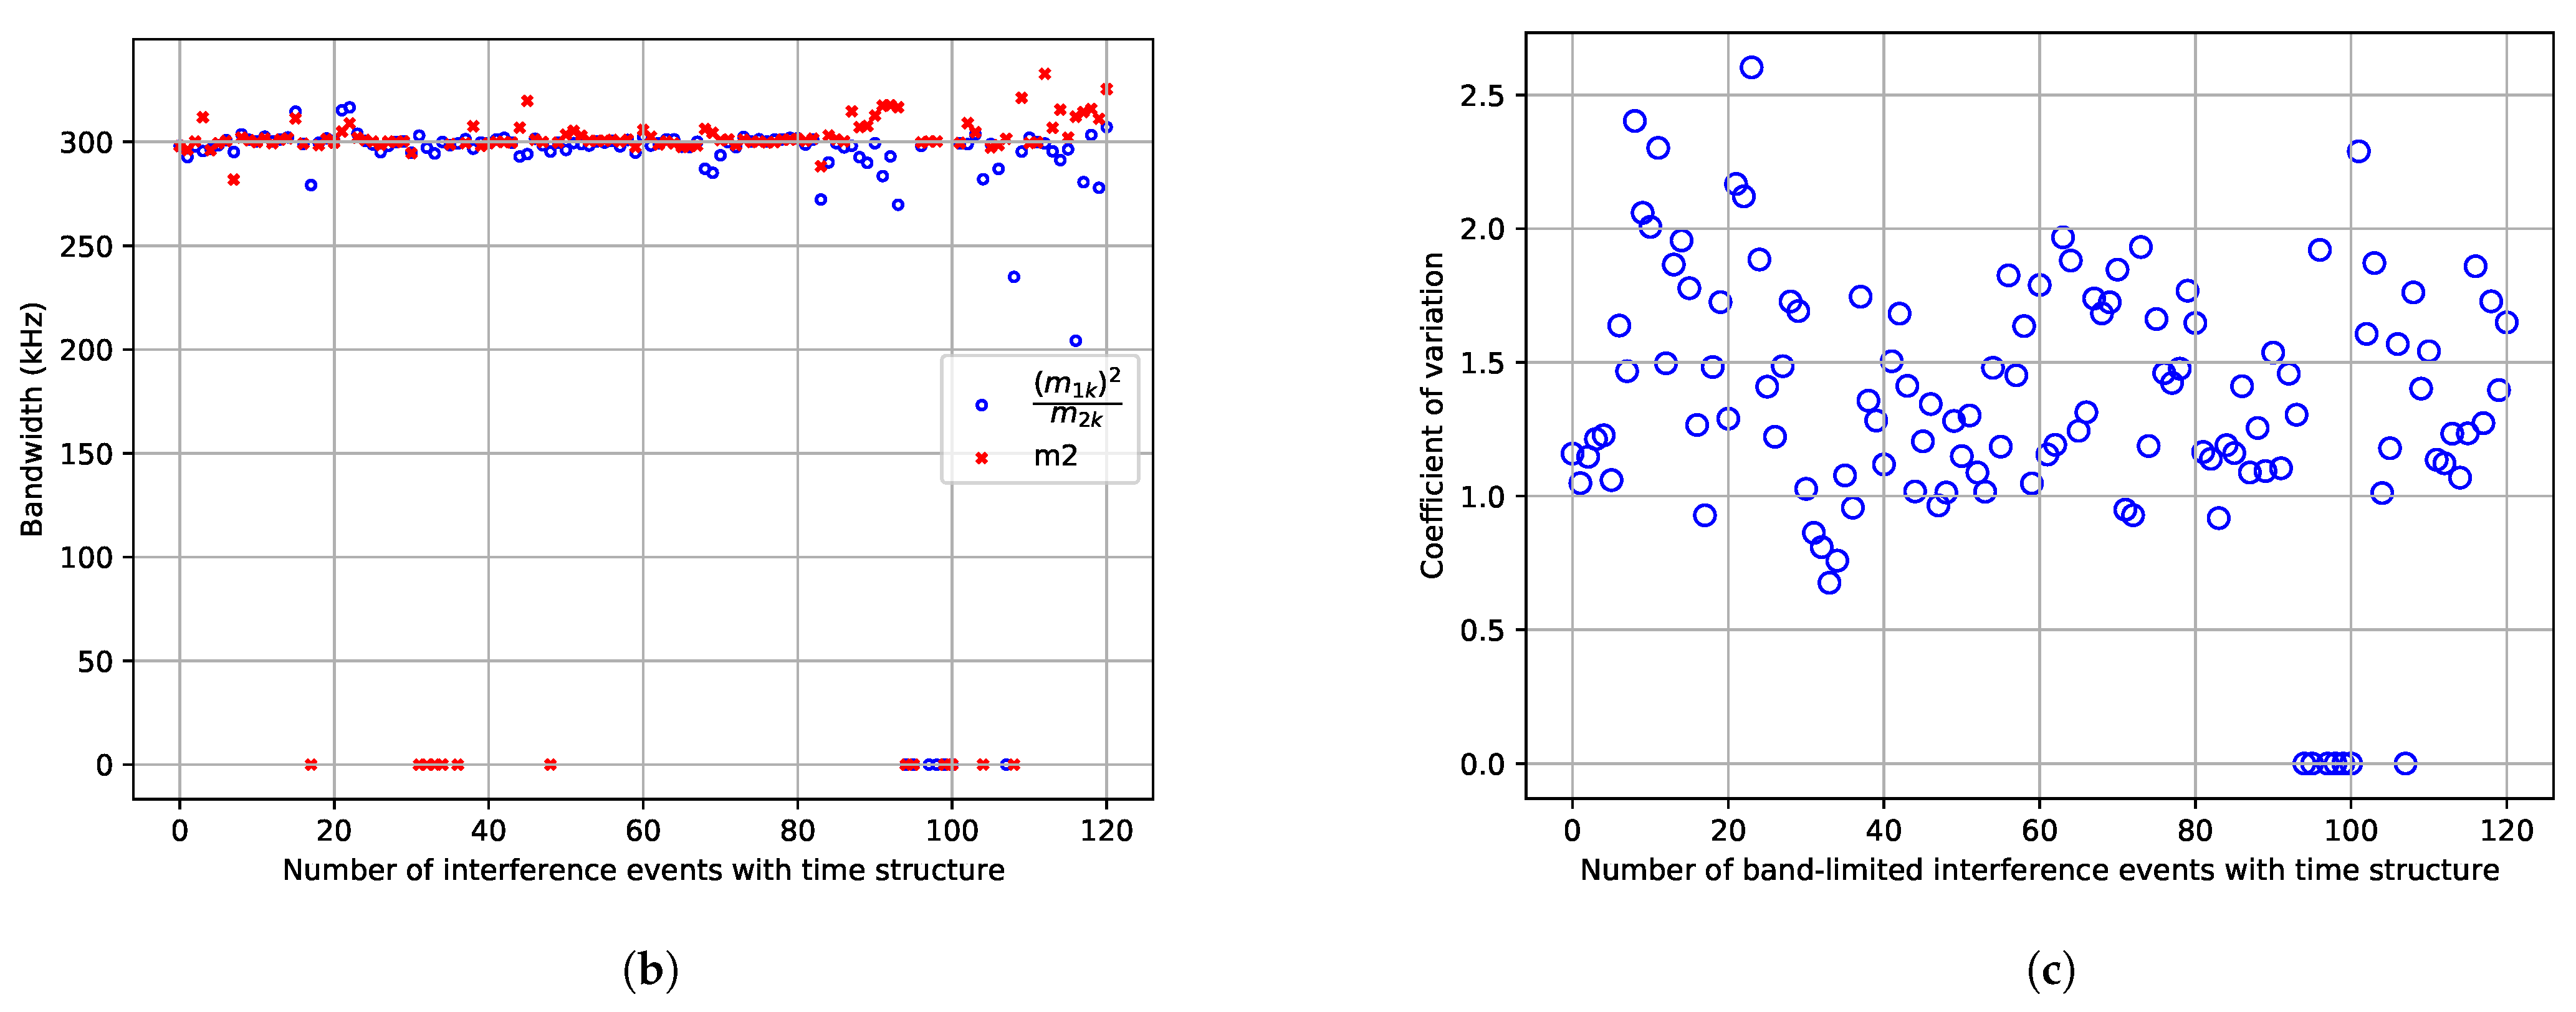
The interference that has roughly 300 kHz bandwidth has higher power than the noise floor and different statistics than CW and AWGN. This signal requires a longer time window to obtain a consistent estimate of the average envelope than the AWGN. It is consistently present over the areas where there are known type A radars. The frequency band measured in this paper is 435 MHz and is exactly in the middle of the band for ground radars (420–450 MHz), so it is expected to see some of that behaviour. The bandwidth also matches the chirp bandwidth for the search mode of type A radars used for space-tracking (100–350 kHz) [
21].
There was also another type of interference with time structure detected over central Europe. However, this interference has a bandwidth higher than what can be seen with the configuration of these measurements (higher than 500 kHz). This interference could be caused by the radar chirps from the tracking mode (1 MHz wide), but it can also be a different source.
The time behaviour measured shows high variability within five seconds. Average power is a useful measure to design a system that works for the average interference environment, but it does not take the temporal structure and dispersion of the interference into account. The CV can be helpful to estimate how much time variability the signal has. The CV is a measure of dispersion. So, if a band has significant power above the general noise floor and the CV is high, the peak power is much higher than the average power. The high CV observed over Europe, the Arctic, and the coastlines of North America indicates a much larger spread in amplitude than for AWGN. A communication system designed to cope with AWGN at the noise levels given by a heatmap fails under these circumstances. The stationarity measurements and the CV show that the interference is not AWGN over populated areas.
The window of stationarity can be used as the required length of an interleaver to obtain average coding performance for each interleaved interval. Even though a lot of measurements are required to increase the reliability of the estimation of the length of this window, we can identify regional trends. For frequencies in the range 434.75–434.83 MHz and 435.19–435.25 MHz, the length could be less than 14 ms for most cases and regions. For the Arctic and Europe, longer lengths are needed for more reliability. In the band 434.83–435.19 MHz, there is a significant portion of measurements over America, Europe, and the Arctic, where window lengths longer than 27 ms are needed.
The results presented are part of the measurement campaigns performed in the first half of 2021. Calibration measurements to estimate absolute power levels are planned for the next phase. A ground station will transmit test signals, such as a CW, with a known power to calibrate the in-orbit power results. Furthermore, global measurements will be performed to obtain an overall view of the interference environment. These measurements will have a lower frequency resolution to decrease the data size of the campaign. The center frequency will also be modified to observe the frequency variability. It is important that future measurements include ECDF measurements of the interference IQ samples, as well as temporal characteristics to enable the choice of the right countermeasures to obtain robust uplink communication.
7. Conclusions
In this article, we have presented an algorithm that can measure frequency and time characteristics of in-orbit interference with low downlink data rate requirements. The method is validated through theoretical analysis, simulations and hardware-in-the-loop testing, and executed in-orbit measurements on the LUME-1 satellite. The studied frequency band was the UHF amateur radio frequencies commonly used for TT&C of small satellites. The in-orbit interference measurements were carried out over the South Pacific, South Atlantic, North America, Europe, North Africa, the Middle East, and the Arctic during the spring of 2021.
As expected, higher interference levels were generally detected over populated areas. Three different time behaviours were distinguished: AWGN, narrow band CW, and pulsed. The pulsed behaviour was seen by analysing the variation of the local mean of the average envelope as a function of window length. High values of the coefficient of variation were estimated in regions with band-limited interference that have significant power over the general noise floor. For that interference, the peak power is much higher than the average power. This interference was observed over areas with known type A ground radars in the UHF band around 435 MHz, and the observed bandwidth of 300 kHz is consistent with the chirp bandwidth for radar search mode [
21]. Furthermore, wide-band interference with pulsed behaviour was measured over Europe, but the bandwidth could not be estimated due to the limited bandwidth of 500 kHz in the measurements.
A global measurement campaign is planned to provide a world overview of the interference environment in the selected band. Calibration measurements using a ground station transmitting to the satellite will enable the use of absolute power levels. Furthermore, different centre frequencies will also be studied, and ECDF measurements of the IQ samples will be planned to obtain the proper interference statistics to design the counter-measures required to improve the reliability of the satellite uplink in the UHF amateur radio band.
