Technical Note

Assessment of Global FY-3C/VIRR Sea Surface Temperature

1
College of Marine Technology, Faculty of Information Science and Engineering, Ocean University of China, Qingdao 266100, China
2
National Satellite Meteorological Center, China Meteorological Administration, Beijing 100081, China
3
Laboratory for Regional Oceanography and Numerical Modeling, Pilot National Laboratory for Marine Science and Technology, Qingdao 266237, China
4
Sanya Oceanographic Institution, Ocean University of China, Sanya 572024, China
*
Author to whom correspondence should be addressed.
Remote Sens. 2021, 13(16), 3249; https://doi.org/10.3390/rs13163249
Submission received: 13 July 2021 / Revised: 13 August 2021 / Accepted: 13 August 2021 / Published: 17 August 2021
(This article belongs to the Section Ocean Remote Sensing)

Abstract

:
Fengyun-3C (FY-3C) is a second-generation meteorological satellite of China that was launched on 23 September 2013. The on board Visible and Infrared Radiometer (VIRR) can be used to observe global sea surface temperature (SST). In this paper, the VIRR SST products are compared with MODIS SST products and buoy measurements from 2015 to 2019. The collocations of VIRR, MODIS, and buoy SST are generated separately during the day and night with the spatial window of 0.05° × 0.05°. The comparison results show that the biases of VIRR SST minus buoy SST during the day and night are −0.21 and −0.13 °C with a corresponding robust standard deviation (RSD) of 0.58 and 0.59 °C, respectively. The mean differences between VIRR and MODIS are −0.10 and 0.08 °C with RSDs of 0.53 and 0.58 °C for the daytime and nighttime, respectively. The consistency of VIRR SST accuracy from 2015 to 2019 and the dependence of VIRR SST error on SST and latitude are also investigated.

Graphical Abstract

1. Introduction

Sea surface temperature (SST) is one of the most crucial parameters in climate research, which is an important input parameter for numerical prediction models and also determines the heat transmission balance at air–sea interfaces [1]. The committee on Earth Observation Satellites (CEOS) has declared SST to be an essential climate variable that has a high impact on climate change [2]. SSTs derived from satellite measurements offer the best observation of global, repeated fields along with accompanying uncertainty characteristics [3]. Polar-orbiting satellites have the advantages of high spatial resolution, short orbital periods, and the same passing local time, implementing numerous types of global observations data [4,5].
Satellite observation of SST began with the launch of High-Resolution Infrared Radiometer (HRIR) on board the Nimbus-1 satellite in 1964. Evaluation of the accuracy of SSTs that are derived from different satellites is a significant factor in generating the climate data record (CDR) [3]. SST validation has been widely conducted by comparison with in situ measurements. The Advanced Very High Resolution Radiometer (AVHRR) SST retrieved by the split window in multi-channel algorithm (MCSST) were compared with drifting buoy SST, indicating that the root mean square error (RMSE) can reach 0.6 °C [6]. Walton et al. applied linear and nonlinear SST (NLSST) algorithms to retrieve SST from AVHRR and validated SST with buoys. They demonstrated that the NLSST had better accuracy, with an SST accuracy of around 0.5 °C [7]. Kilpatrick et al. used AVHRR observations and in situ measurements to establish the matchup database, indicating that the bias and median of AVHHR SST compared with buoy SST were within 0.02 °C, and the standard deviation (SD) was 0.53 °C [8]. Minnett et al. calculated global-scale uncertainty of Moderate Resolution Imaging Spectroradiometer (MODIS) SST by comparing with buoys and Marine-Atmospheric Emitted Radiance Interferometer (M-AERI) SST from July 2002 to mid-2007 [2]. The biases were −0.15 and −0.22 °C for daytime and nighttime, with the corresponding SD of 0.55 and 0.48 °C, respectively. The mean differences of MODIS minus M-AERI SST were 0.04 and −0.02 °C, with SDs of 0.59 and 0.53 °C, respectively [2]. The bias of the daytime Suomi National Polar-orbiting Partnership (Suomi-NPP)/Visible Infrared Imaging Radiometer Suite (VIIRS) SST minus buoy SST was 0.00 °C with an SD of 0.466 °C during the day, and the bias was 0.00 °C with an SD of 0.359 °C at night [9]. The global biases of Advanced Along Track Scanning Radiometer (AATSR) SST minus buoy SST were 0.07 K for daytime and 0.06 K for nighttime, with an SD of 0.23 K in both cases [10].
The second-generation operational meteorological satellite of China, Fengyun-3C (FY-3C), was launched on 23 September 2013. It operates in a sun-synchronous orbit with orbital altitude of 836 km, an orbital inclination of 98.75°, and a descending node at 10:00 am. The Visible and Infrared Radiometer (VIRR) on board FY-3C is a 10-channel radiometer for multi-purpose imaging with a resolution of 1.1 km at nadir, and the swath width is 2800 km. The VIRR has one short-wavelength infrared channel (3.55–3.93 μm) and two long-wavelength infrared channels (10.3–11.3 and 11.5–12.5 μm). FY-3C data are received from five ground stations (Beijing, Guangzhou, Xinjiang, Jiamusi, and Kiruna), and the VIRR SST products are retrieved using MCSST algorithm and distributed by National Satellite Meteorological Center (NSMC) of China Meteorological Administration (CMA) [11,12]. The FY-3C VIRR SSTs were compared with in situ SSTs from May to July 2014, showing the biases of −0.26 K and 0.06 K with SDs of 0.54 and 0.56 K for daytime and nighttime, respectively [11]. Wang et al. assessed the FY−3C/VIRR SST and compared this with the in situ SST in the Arctic from August to December 2014. The validation results indicated that the bias and SD were −0.12 and 0.93 °C, respectively, and the SST error was 0.91 °C on the basis of three-way error analysis [13].
In this paper, the global SST accuracy and long-time series consistency from FY-3C VIRR during the period from 2015 to 2019 are evaluated with reference to MODIS SST and buoy measurements. In Section 2, the dataset is introduced. Section 3 presents the method and comparison results among VIRR, MODIS, and buoy SST. In Section 4, the VIRR SST error sources are discussed. Finally, Section 5 provides a brief conclusion to the article and reveals areas for future improvement.

2. Dataset

The FY-3C VIRR SST daily products are provided by NSMC [14]. The VIRR SST data are stored on 0.05° × 0.05° grids in hierarchical data format (HDF) [15]. The SST quality is divided into three levels [16], and flags such as sea ice, solar glint, and land are also included in the product. In this study, we use the VIRR SST data from 4 January 2015 to 15 November 2019. We choose the best quality VIRR SST data for assessment.
In this study, we use Terra/MODIS SST to validate VIRR SST. The MODIS Version 5 Level-3 SST products are distributed by the National Aeronautics and Space Administration (NASA) Physical Oceanography Distributed Active Archive Center (PO.DAAC) [17]. The MODIS SSTs are projected on regular 1/24° × 1/24° latitude-longitude grids divided into daytime and nighttime data files. The quality flag is also included in MODIS SST products, and the highest quality SST data were used for VIRR SST validation.
The in situ SST used for validation is obtained from the in situ SST quality monitor (iQuam) system, developed by the Center for Satellite Applications and Research (STAR) of the NOAA Satellite and Information Service (NESDIS) [18,19]. The in situ data provided by the iQuam system contain both shipborne and buoy data, and real-time dynamic information is transmitted through the Global Telecommunication System (GTS) [19]. The iQuam in situ data have strict quality control standards and are divided into five quality levels. Figure 1 shows the geophysical distribution of iQuam measurements on 31 December 2015, including eight different platform types of argo floats (Argo), tropical moorings (T-Moored), coastal moorings (C-Moored), high-resolution drifters (HR-Drifter), conventional drifters (Drifter), coral reef watch buoys (CRW), Integrated Marine Observing System (IMOS) ships, conventional ships (Ship). Considering the accuracy of in situ measurements, Argo, T-Moored, C-Moored, HR-Drifter, Drifter and CRW in best quality level are selected for validation.

3. Comparison of VIRR SST with MODIS SST and Buoy SST

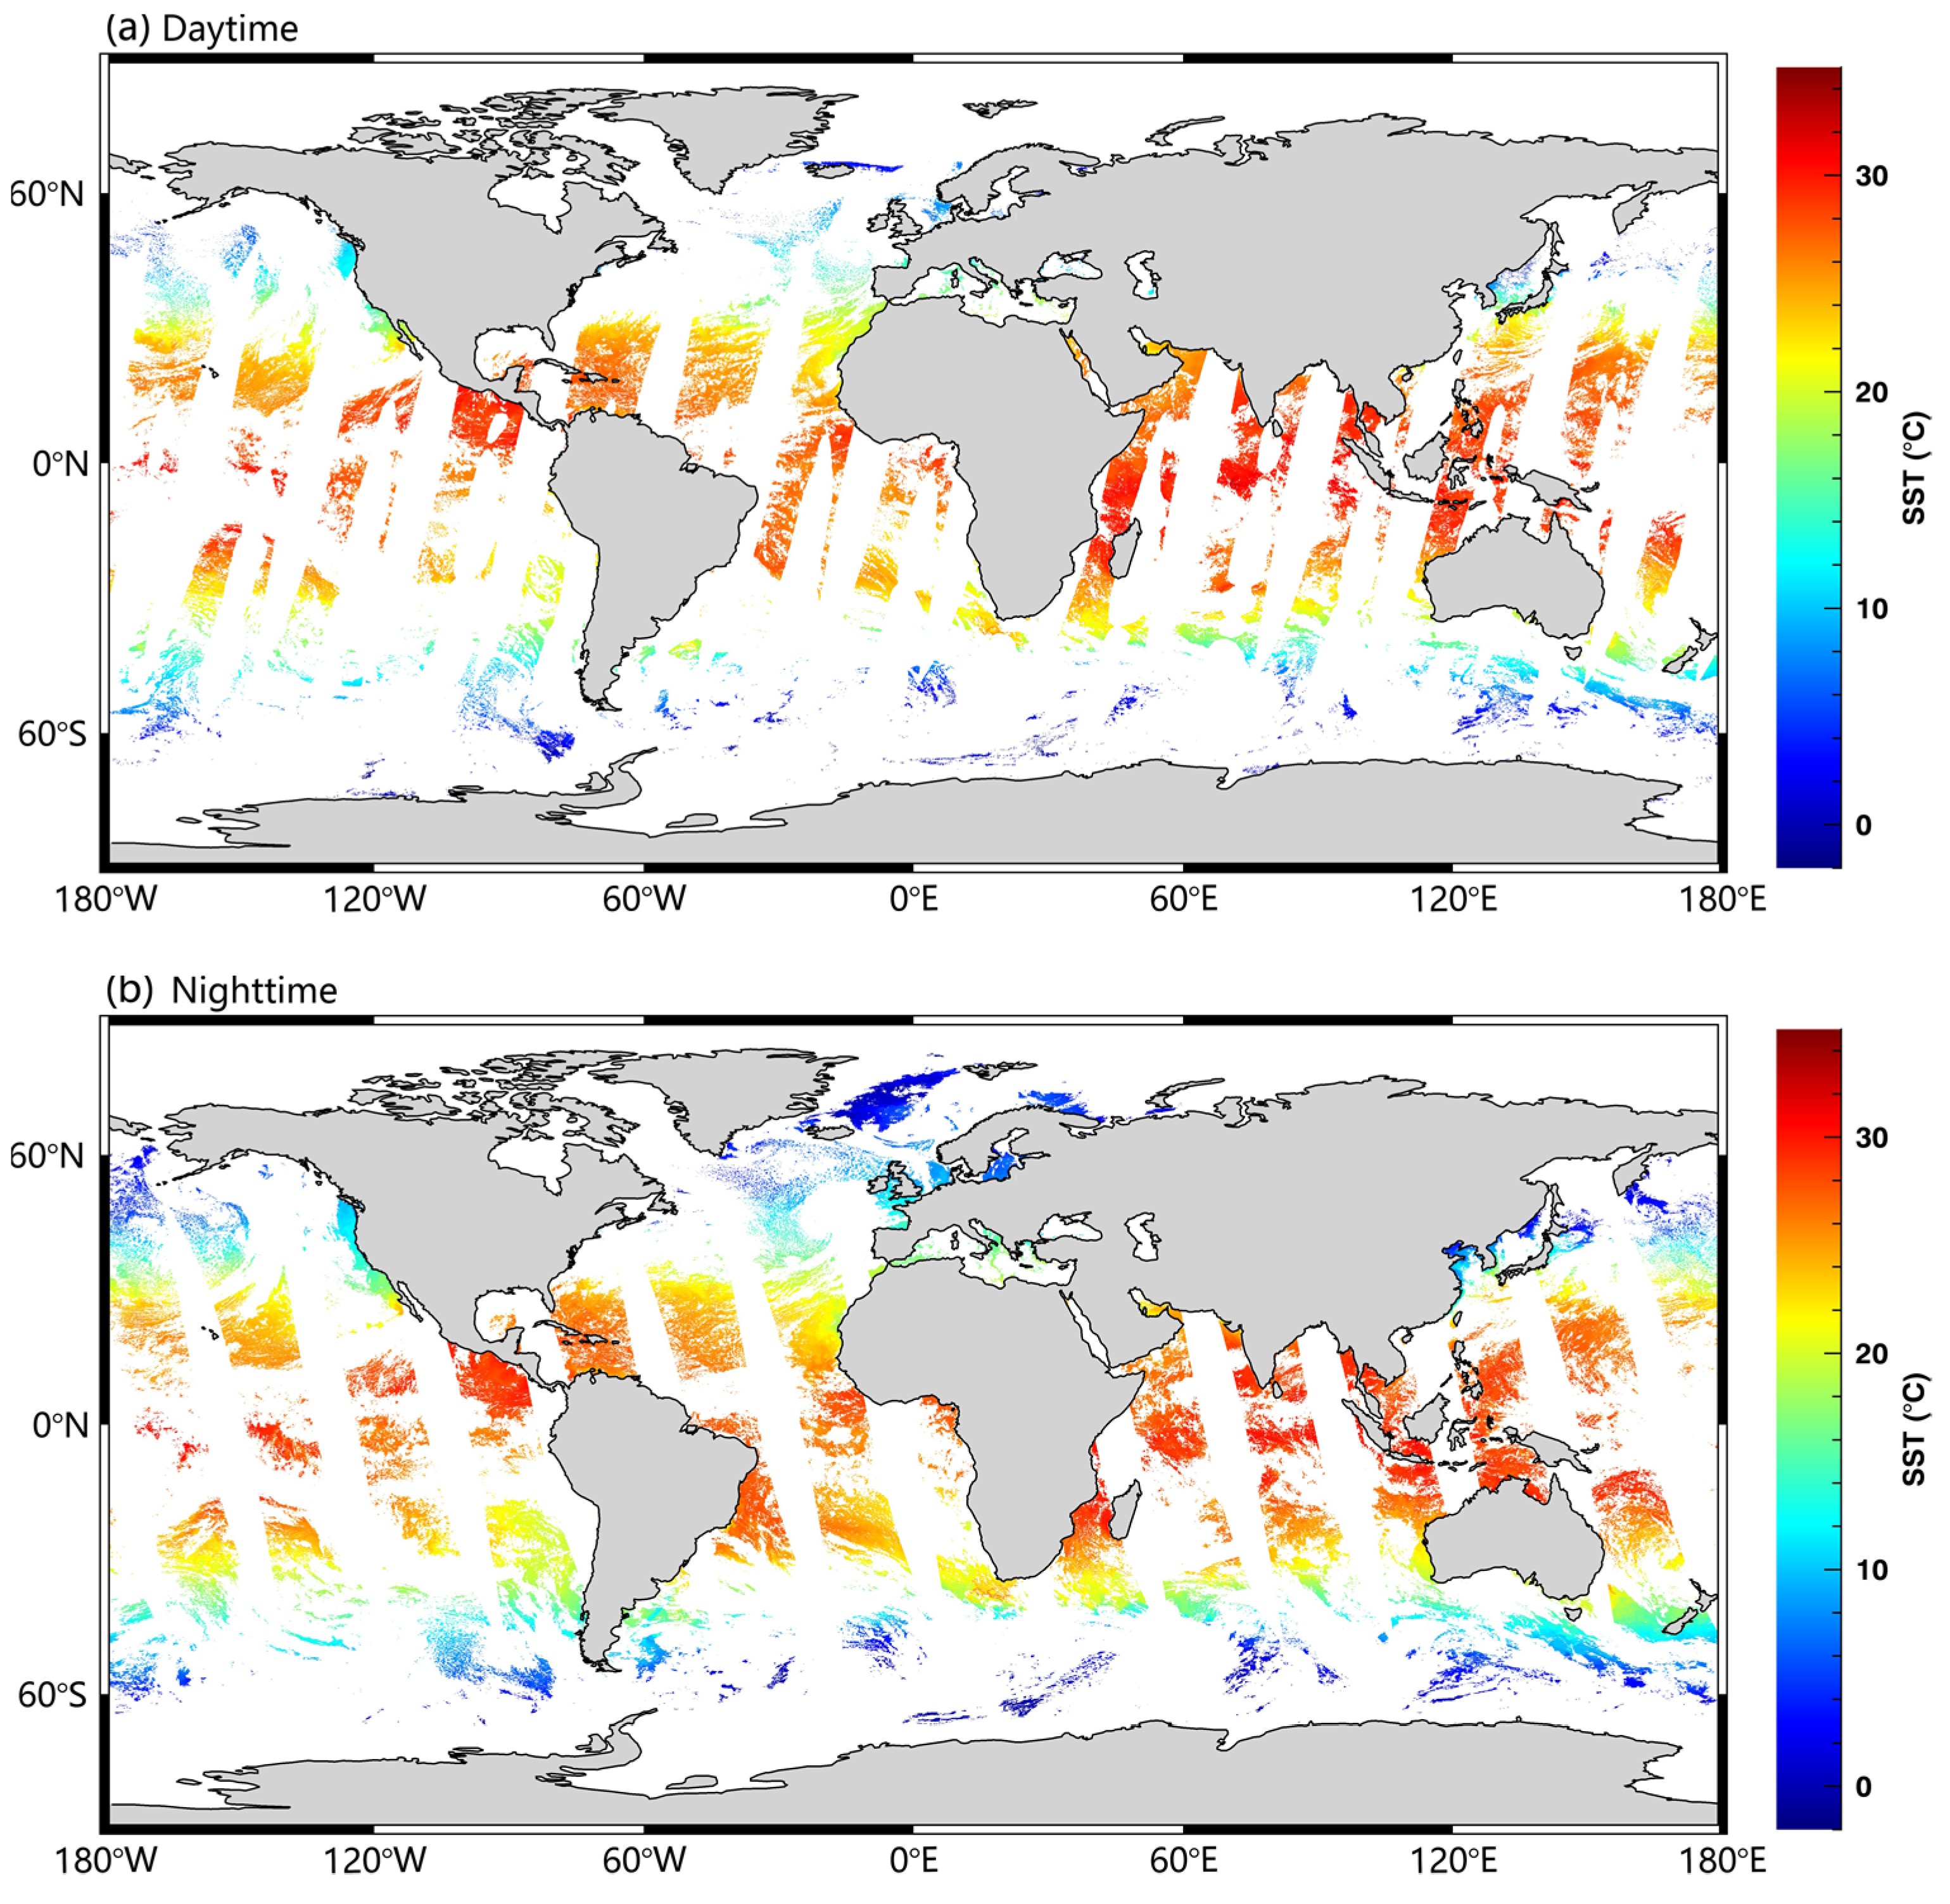
The VIRR SST and MODIS products are on 0.05° × 0.05° and 1/24° × 1/24° grids, respectively. Thus, the MODIS SSTs are re-projected into a 0.05° × 0.05° grid, and the buoy data are also projected into 0.05° × 0.05° grids during the day and night, respectively. The collocations among VIRR, MODIS, and buoy SST are generated in the daytime and nighttime separately with a spatial window of 0.05° × 0.05°. Figure 2a,b show the global VIRR SST on 1 January 2016 in the daytime and nighttime, respectively. Figure 3a,b show the MODIS SST on 1 January 2016 in the daytime and nighttime, respectively.
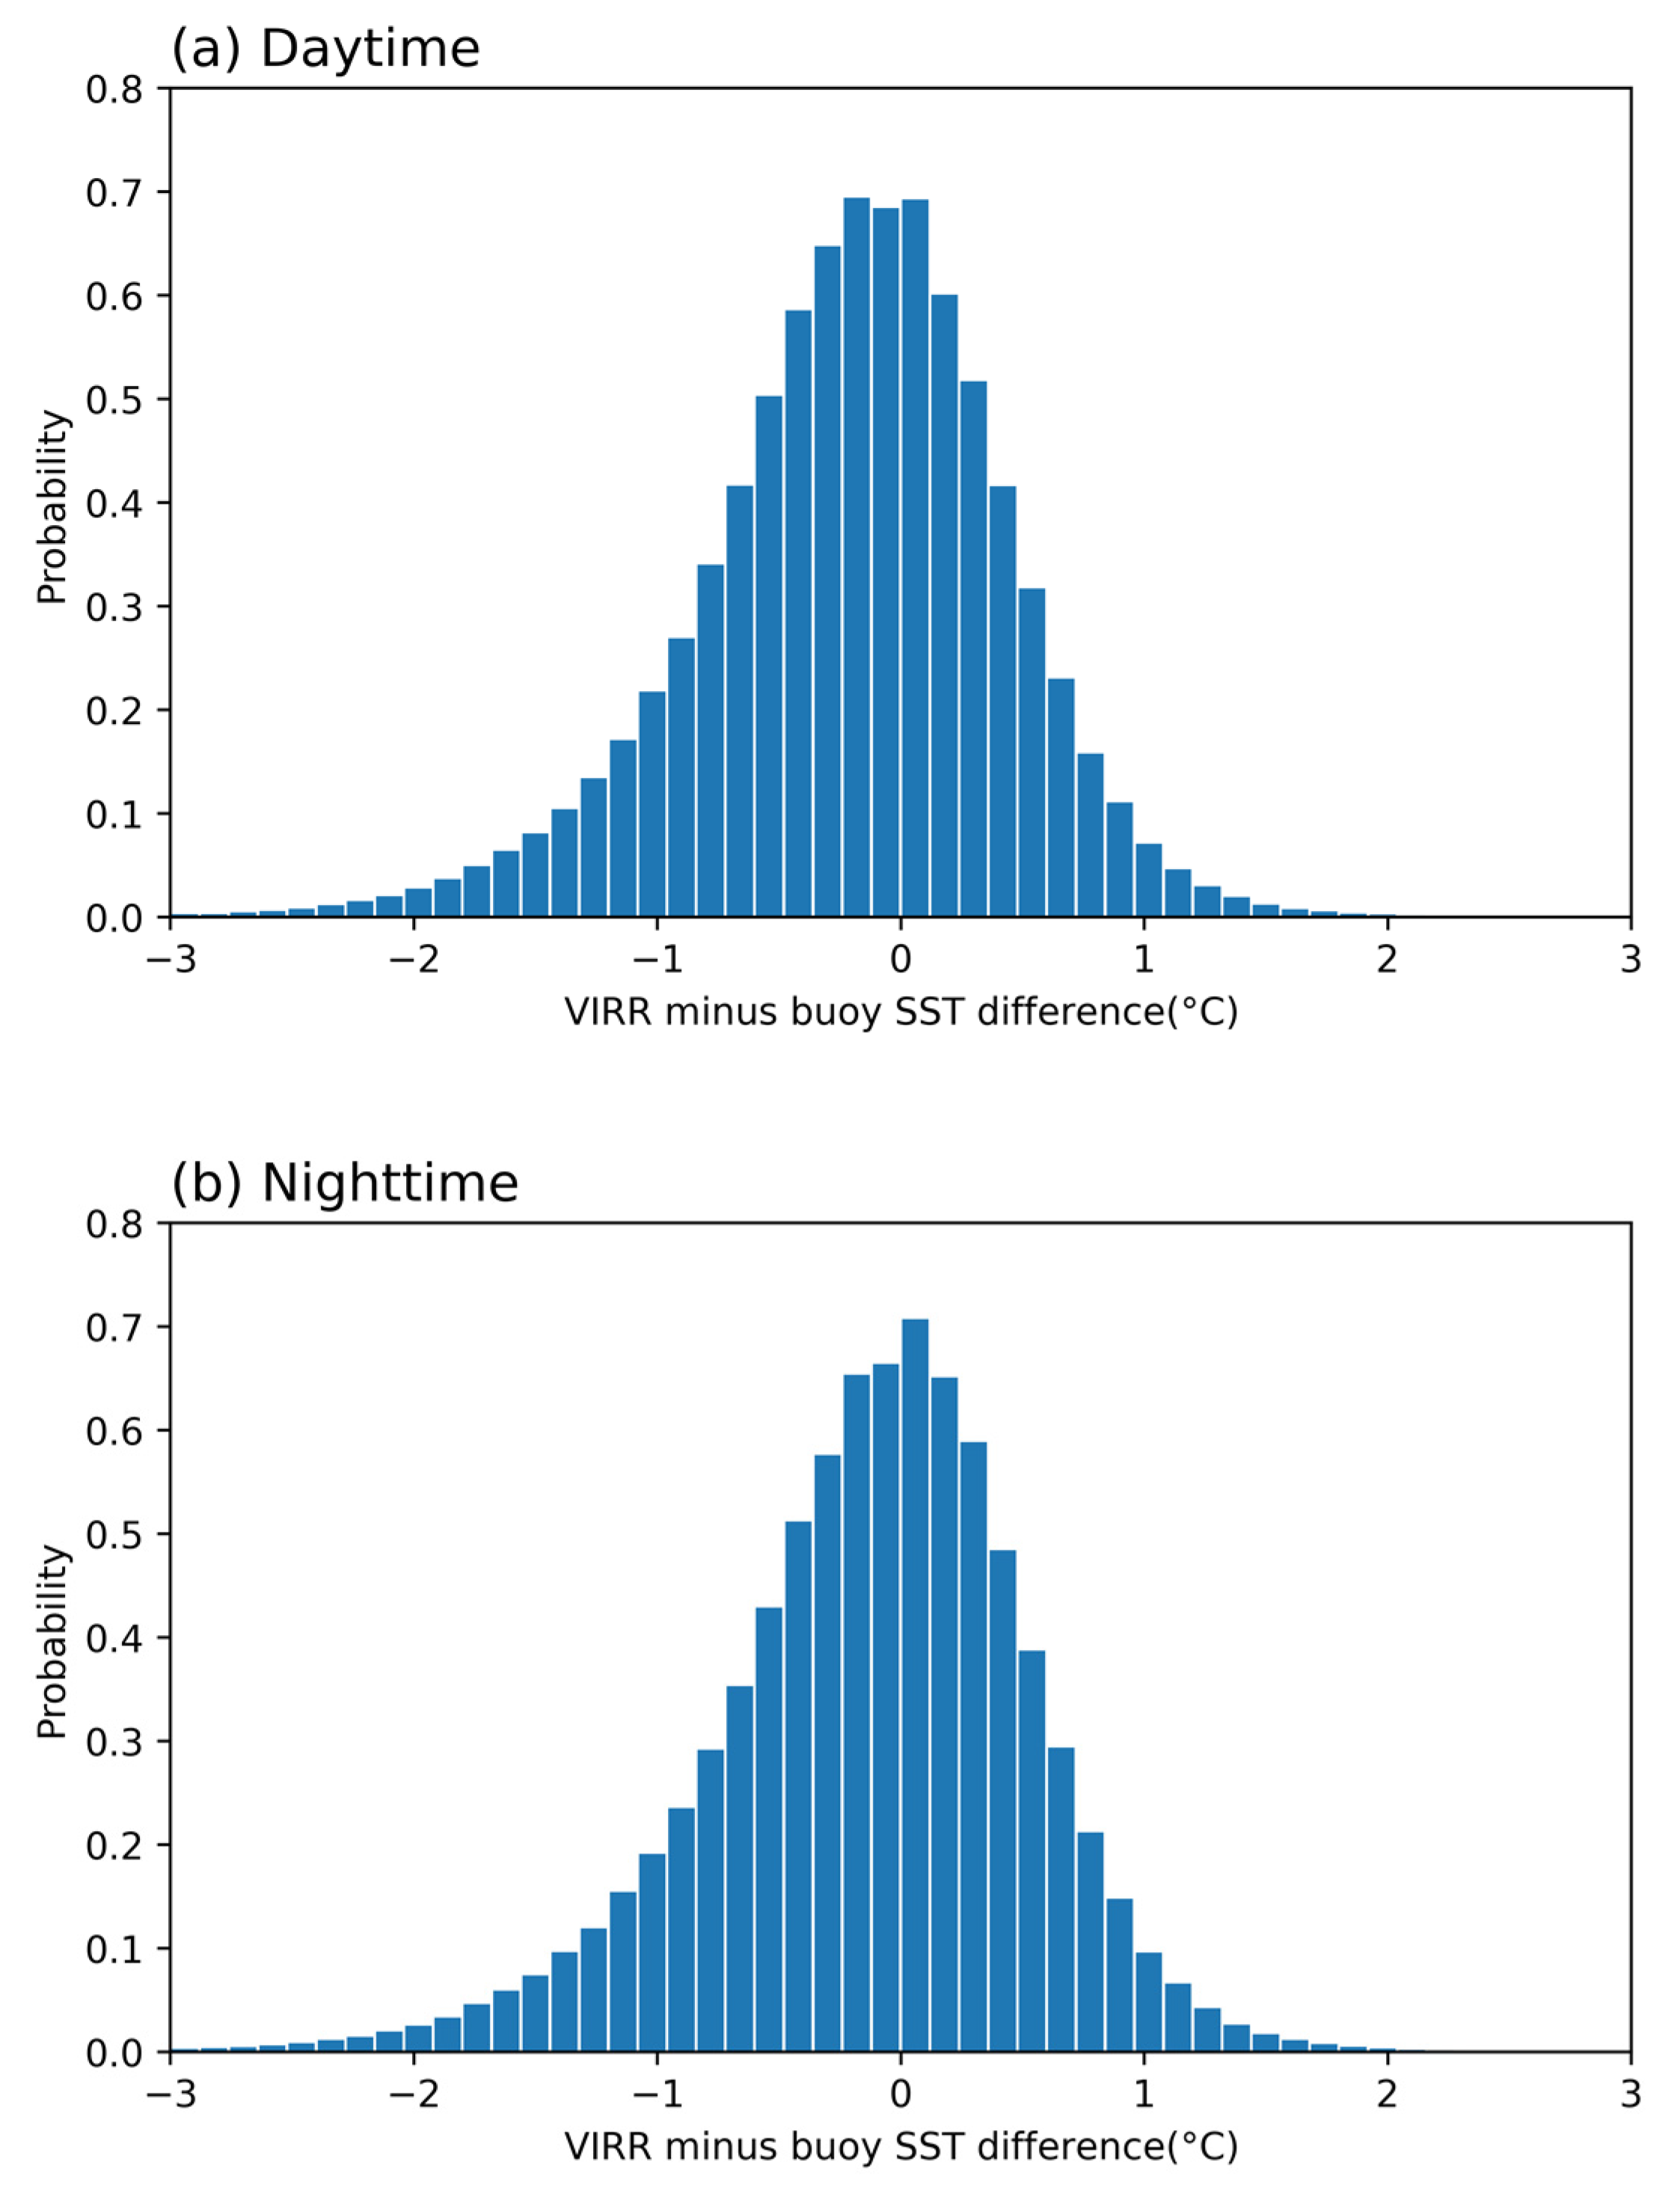
The overall statistics of the SST difference from 2015 to 2019 among the VIRR, buoy, and MODIS data, which are shown in Table 1, and the yearly results are shown in Table 2, including the bias, SD, median, robust standard deviation (RSD), and the proportion of collocations located in the ± 0.3, ± 0.5, and ± 1 °C difference intervals (P). In addition, the results are displayed separately for daytime and nighttime comparison, where “D” represents daytime and “N” represents nighttime. Figure 4a,b are the histograms of VIRR minus buoy SST difference in daytime and nighttime, respectively. According to the statistical results of VIRR SST minus buoy SST from 2015 to 2019, there are 578,565 matching points in the daytime and 646,709 matching points at night. The yearly biases of VIRR minus buoy SST difference are between −0.40 and −0.05 °C during the day and change from −0.36 to 0.08 °C at night, but the yearly SDs and RSDs are stable. The MODIS SST minus buoy SST difference has a smaller RSD around 0.4 °C, but also show negative biases for both daytime and nighttime, with a larger negative bias during the night. The SST observed by the satellite radiometer is the temperature of the sea layer a few microns below the sea surface skin temperature. The buoy SST, which is the bulk temperature, is measured at a depth of 0.2–1.5 m. The discrepancy between skin temperature and bulk temperature is affected by solar radiation heating and sea wind and waves [20]. The seawater is not heated by solar radiation at night, and the sea surface emits long-wave radiation, so the heat exchange between the ocean and the atmosphere can result in a lower skin temperature, making the night SST deviation appear negative. In addition, it is obvious that the histograms of VIRR minus buoy SST difference do not present a Gaussian distribution, and the cold tails shown in histograms are obvious. One of the main reasons for the cold tail is probably a failure to detect clouds.
Figure 5 and Figure 6 show the time series of monthly SST differences of VIRR minus buoy (shown as the red line), MODIS minus buoy (shown as the blue line), and VIRR minus MODIS (shown as the orange line) for daytime and nighttime, respectively. Figure 5a and Figure 6a represent the monthly biases, and Figure 5b and Figure 6b are the monthly SD variations. In Figure 5a and Figure 6a, it can be clearly seen that the fluctuations of monthly biases of VIRR SST minus buoy SST difference, as well as that of VIRR minus MODIS SST difference are obvious, especially during the night. The SDs of VIRR SST minus buoy SST difference remain around 0.6 °C in the daytime and nighttime, as shown in Figure 5b and Figure 6b. For MODIS, the SST difference is relatively stable and the SDs remain around 0.5 °C.
Three-way error analysis is a method for empirically estimating the errors of different data observation types. The variance in observation data can be calculated using the following formula [21,22,23]:
σ i 2 = 0.5 ( V i j + V k j V j k )
σ i 2 is the variance of observation type i. V i j is the variance between two different observation types, i and j, and different observation data are completely independent. Three-way error analysis was developed by Stoffelen for the validation of wind speeds [24] and applied in SST validation by O’Carroll et al. [21,23], Gentemann [22], and Saha et al. [25]. We used three-way error analysis to estimate the error of VIRR, MODIS, and buoy SST between 2015 and 2019. As shown in Table 3, for VIRR, the yearly SST errors are around 0.5~0.6 °C. As for MODIS, the yearly errors, which are around 0.3 °C, are lower than for VIRR. The overall estimated SST errors for VIRR, MODIS, and buoy SST are 0.53, 0.30, and 0.37 °C and 0.58, 0.32, and 0.33 °C during the day and night, respectively.

4. Discussion

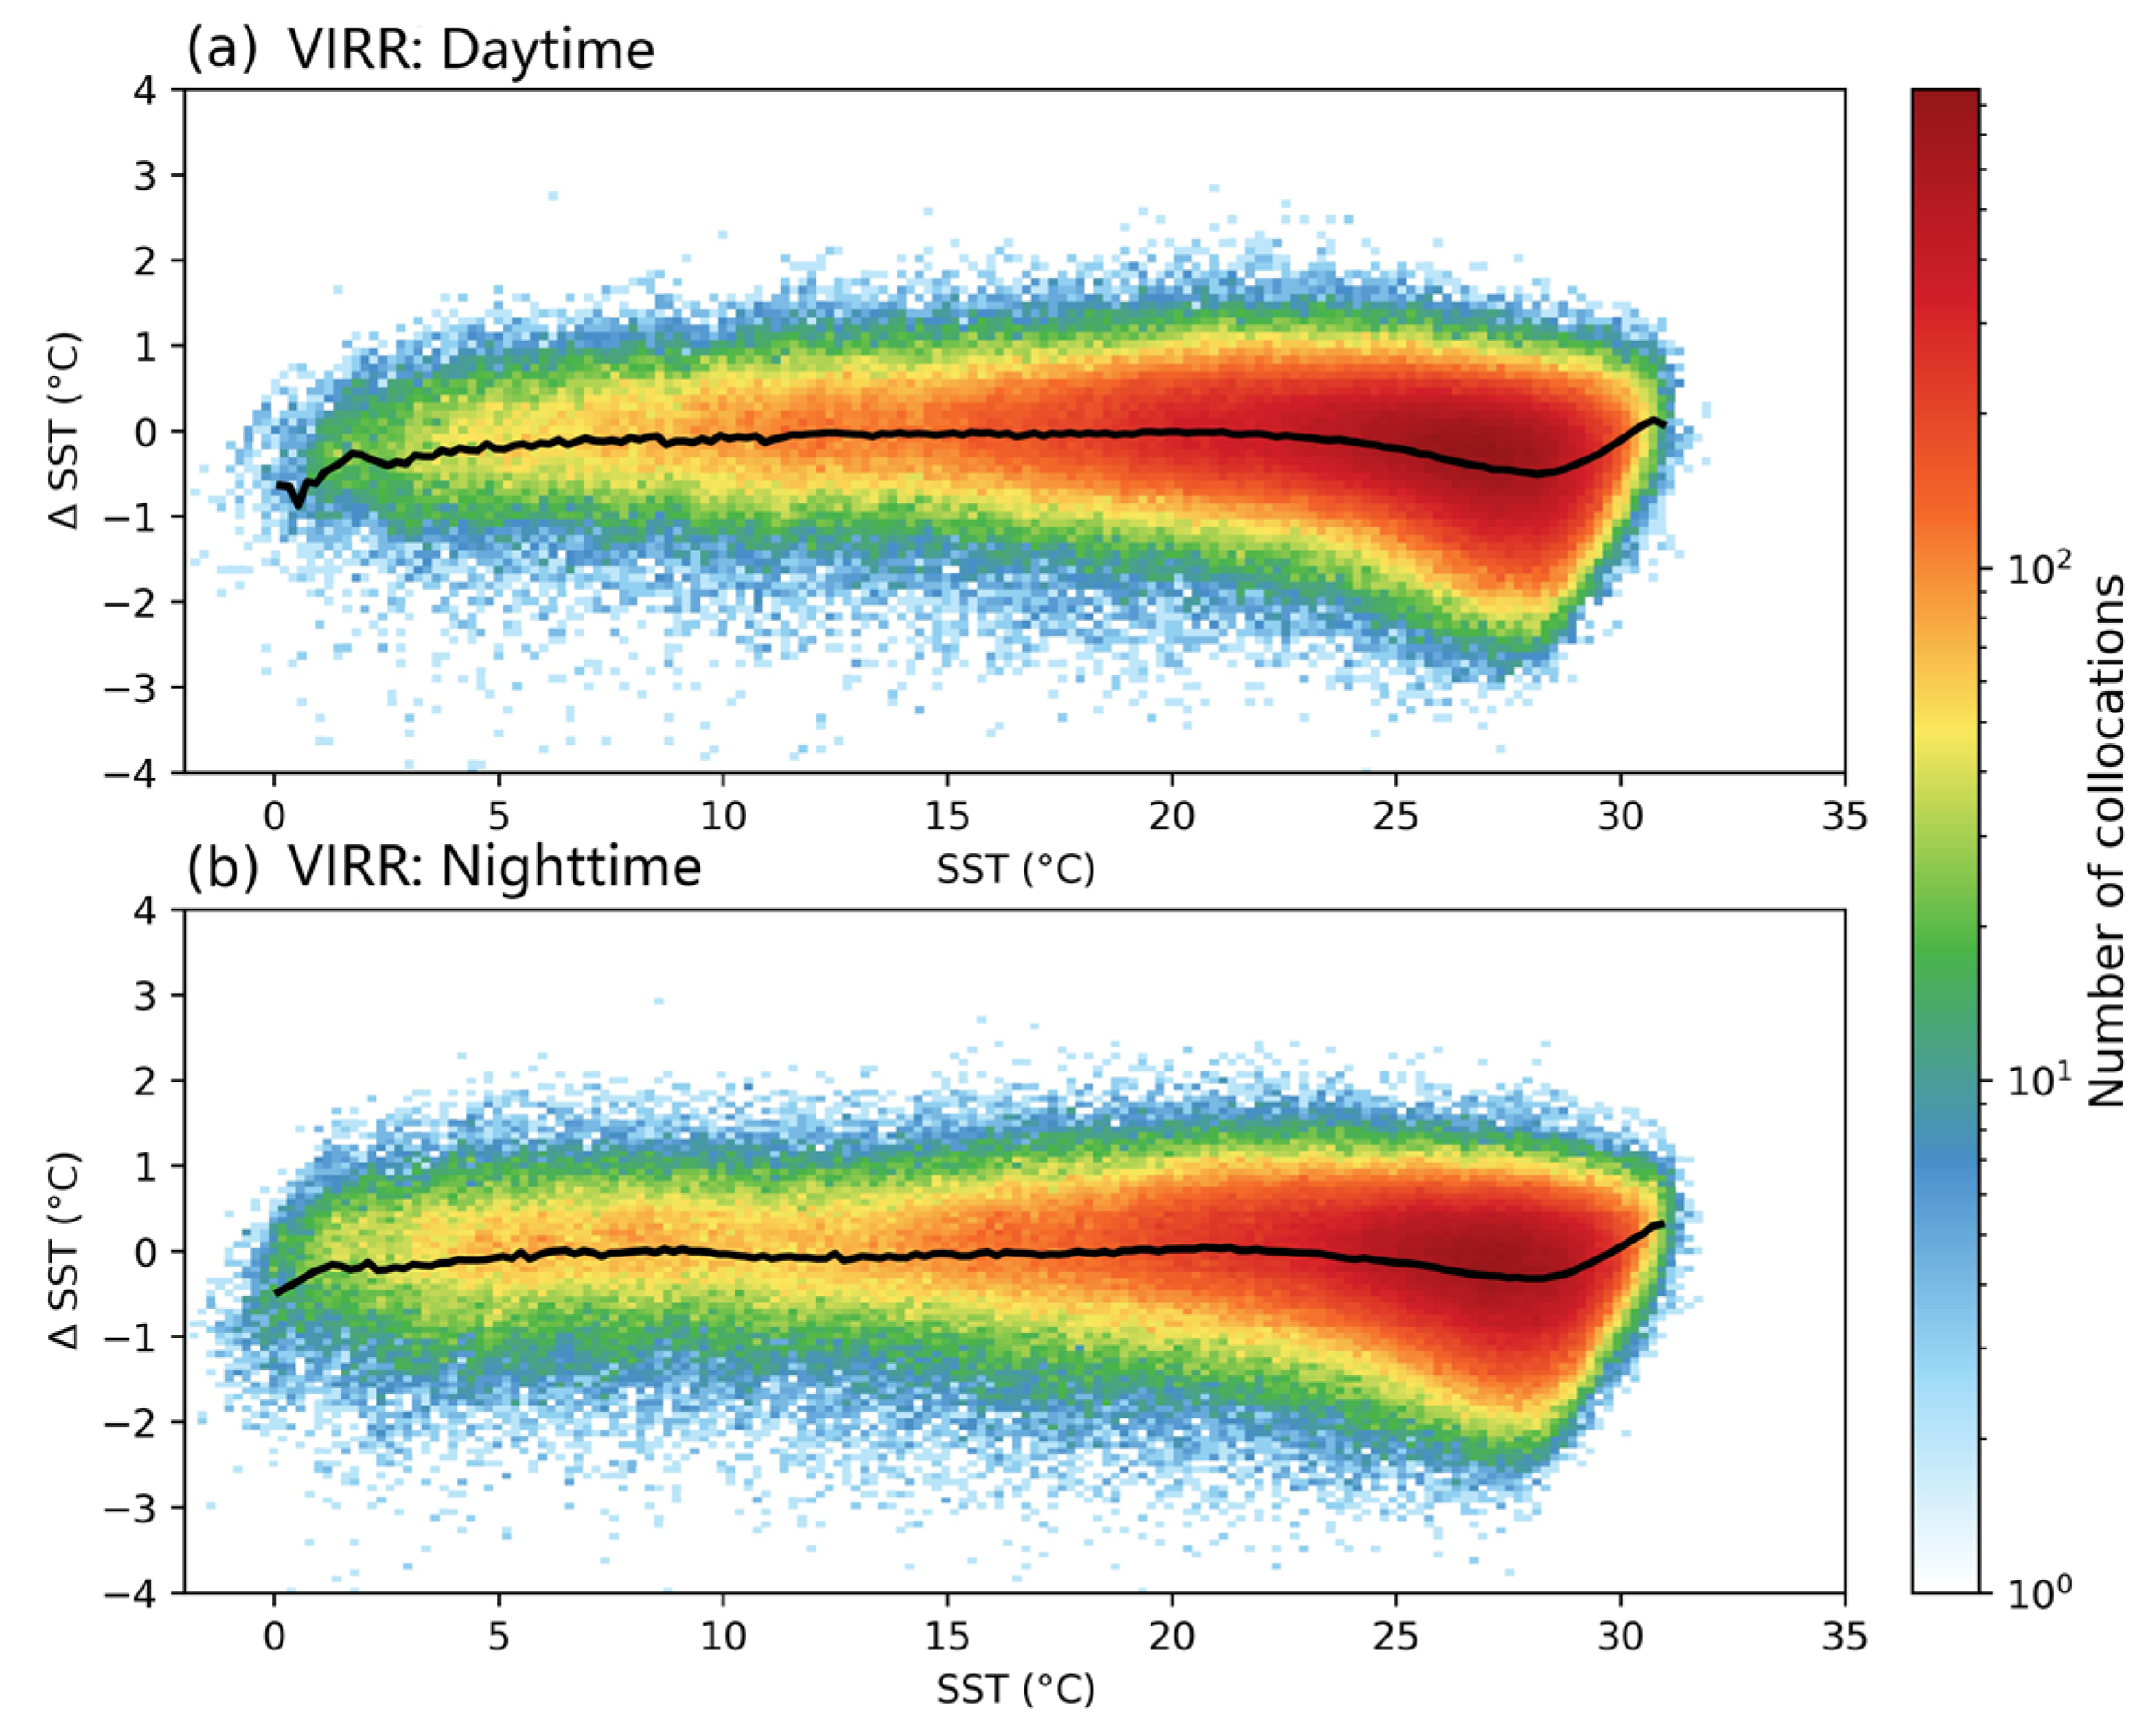
Figure 7a,b show the daytime and nighttime variations in VIRR minus buoy SST difference against buoy SST, respectively. Figure 8a,b show the daytime and nighttime variations in MODIS minus buoy SST difference against buoy SST, respectively. The color indicates the collocation number for every 0.2 °C SST difference and 0.05 °C buoy SST bin. The black lines show the variations in mean SST difference. For VIRR, the negative SST difference compared with buoy SST is significant in cold water below 2 °C, and when the SST ranges from 2.2 to 24 °C, the mean differences remain relatively stable at around −0.2 °C. When the SSTs are higher than 24 °C, the biases drop to −0.32 °C at 27 °C and then increase to 0.50 °C at 31 °C. The dispersion of VIRR minus buoy SST difference becomes significant at high temperatures and is also presented in Figure 8. For MODIS, the overall biases are stable except for the fluctuation in warm water, and the degree of dispersion is much lower than for VIRR.
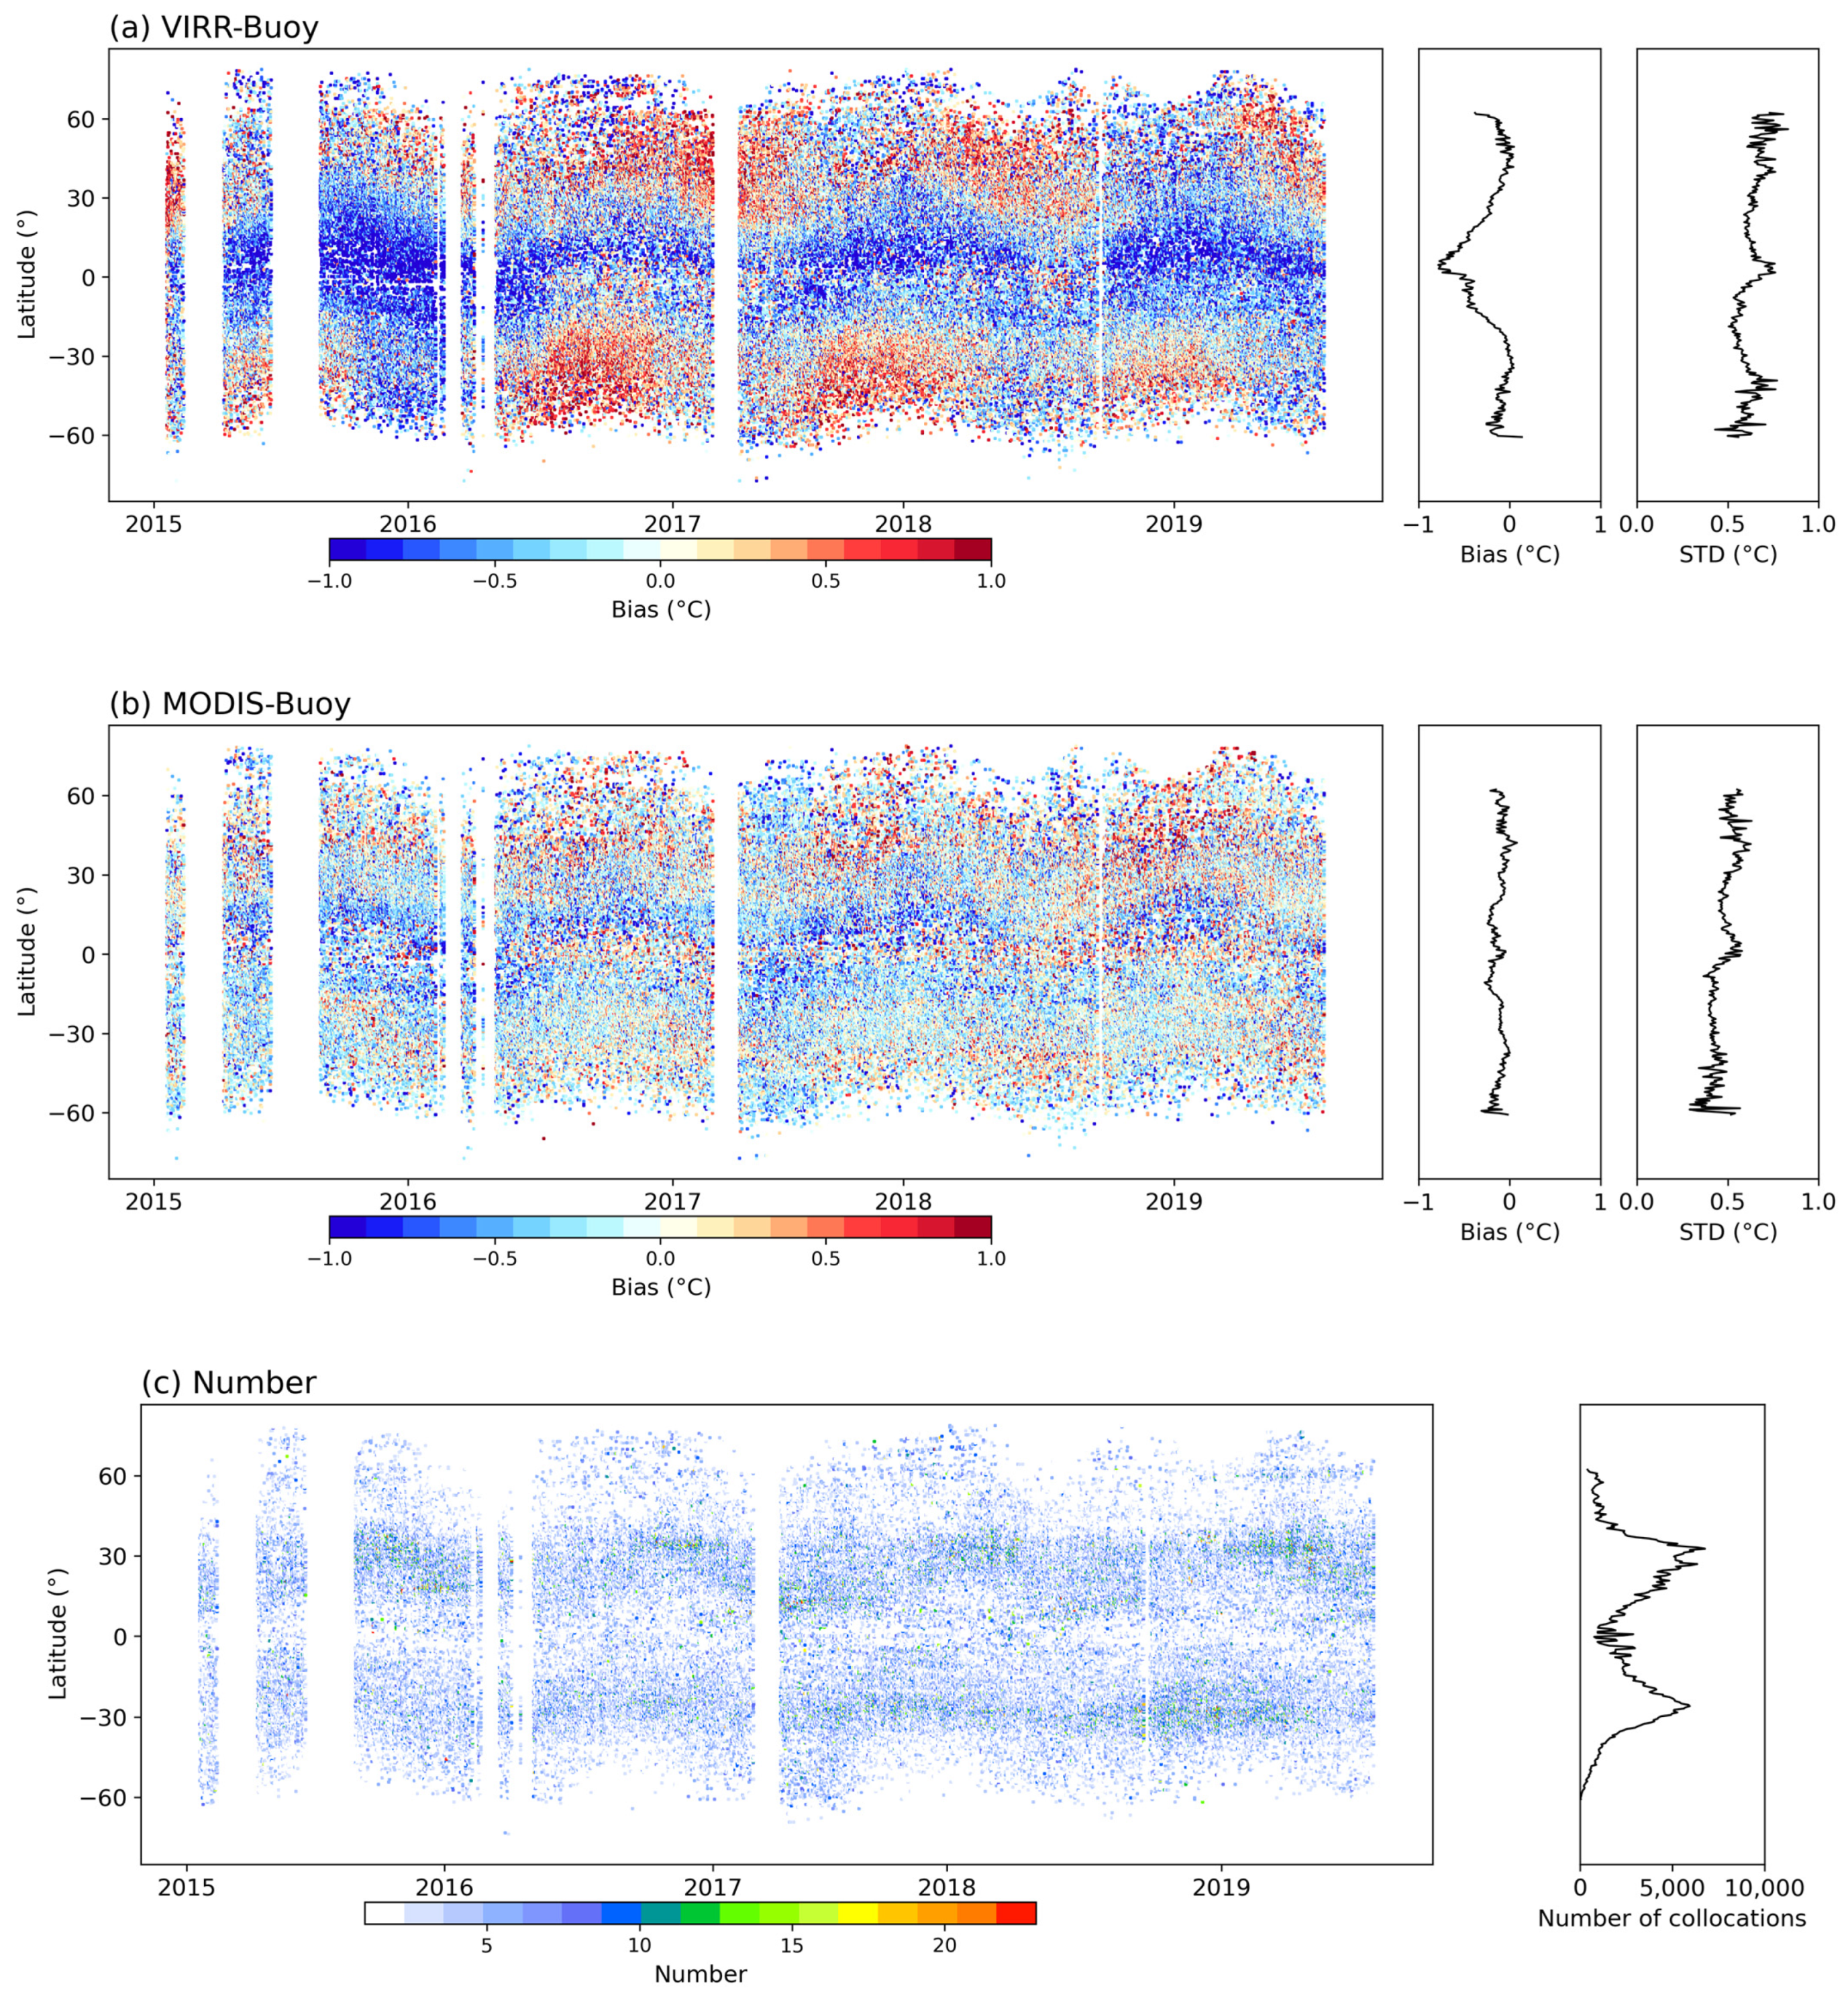
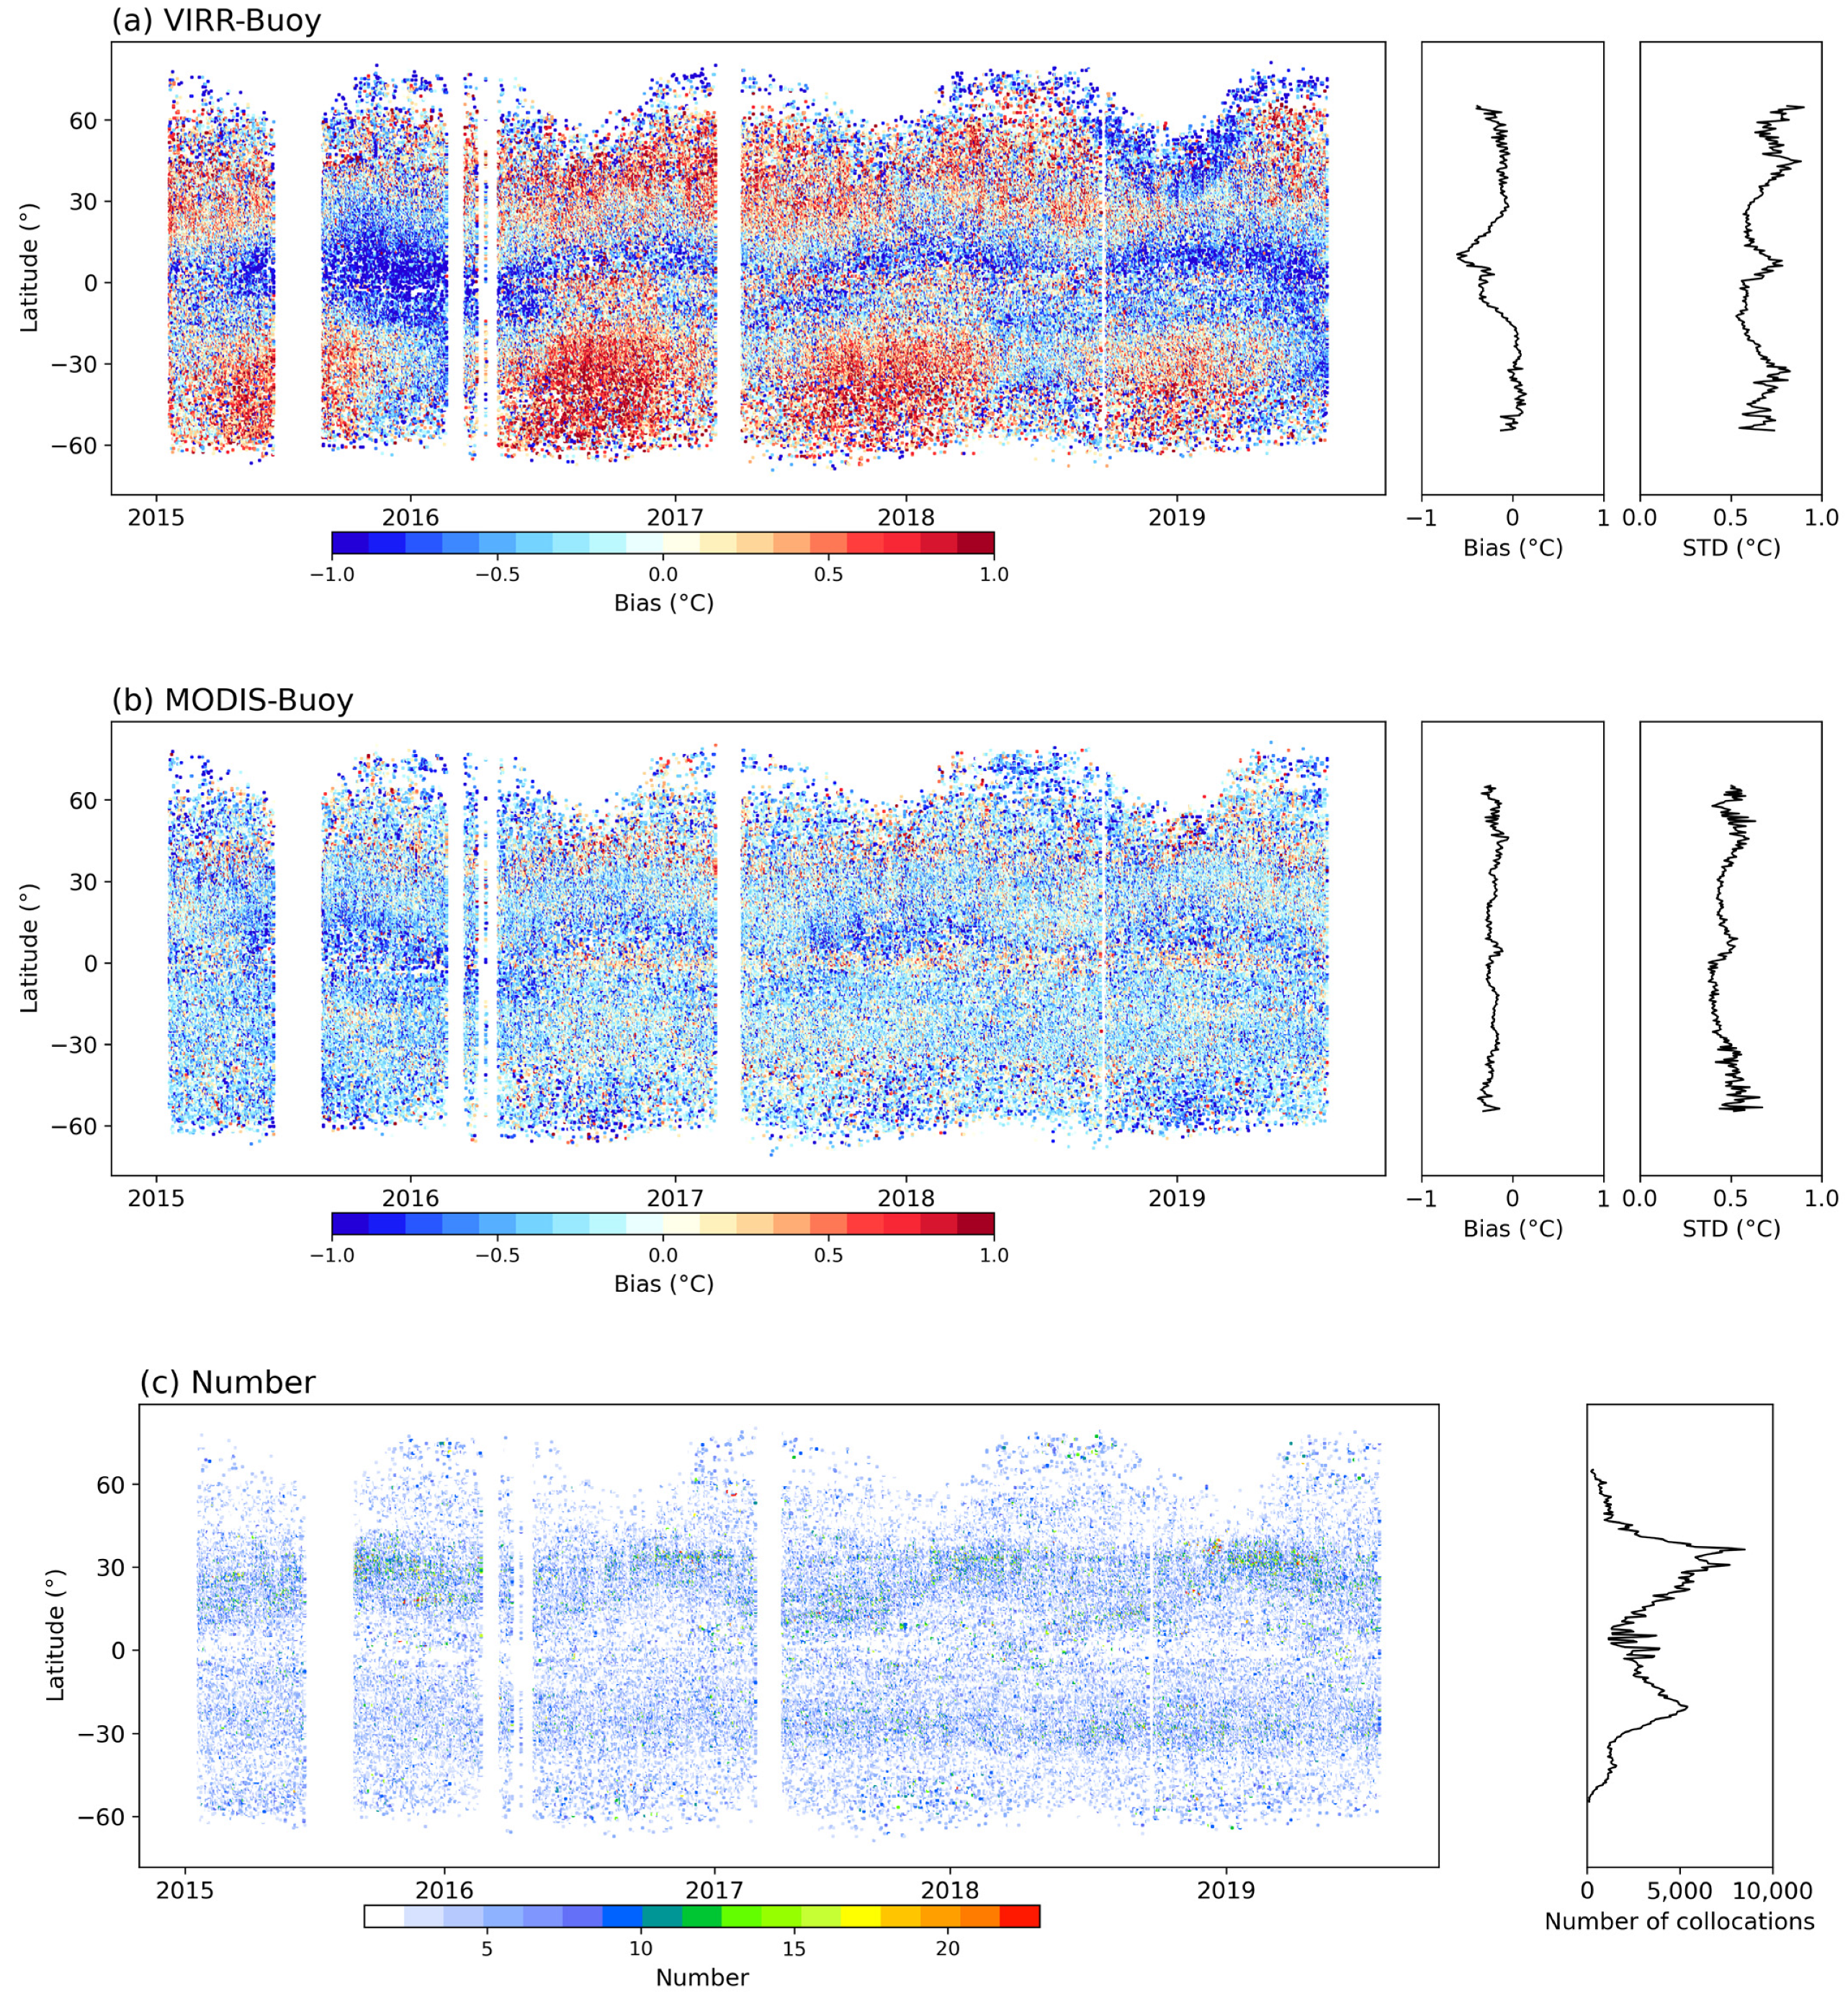
Figure 9 and Figure 10 show the distributions of SST differences and matchup numbers against latitude and time in daytime and nighttime, where Figure 9a and Figure 10a represent the VIRR minus buoy SST difference, Figure 9b and Figure 10b represent the MODIS minus buoy SST difference, and Figure 9c and Figure 10c indicate the collocation numbers, respectively. The left panels in Figure 9a,b and Figure 10a,b are the Hovmöller diagrams, presenting the daily SST difference in each 0.5° latitude bin, and the middle black lines and the right black lines are variations in the biases and SDs against latitude, respectively. For Figure 9c and Figure 10c, the left Hovmöller diagrams show the distributions of collocation number, with the right black curves representing the variation against latitude. Due to the existence of upwelling and surface currents near the equator, the buoys are driven away from the tropical zone, resulting in fewer buoys near the equator which, in turn, causes fewer collocations near the equator [26]. Most matchups are distributed between 70 °S and 70 °N. There are some gaps in the Hovmöller diagrams when the VIRR data are invalid. The dependences of VIRR SST minus buoy SST difference on latitude and season are significant. Most collocations located in low-latitude regions present negative differences. In addition, in the northern hemisphere, most VIRR SSTs are higher than buoy measurements in spring and summer and become lower than buoy SSTs in autumn and winter. These features are opposite in the southern hemisphere. According to the overall variations in biases against latitude, shown as the middle black lines in Figure 9a and Figure 10a, the biases decrease from 0 °C in mid-latitudes to −0.8 °C (in daytime)/−0.6 °C (in nighttime) near the equator and fluctuate significantly in high−latitude regions, and the SDs are relatively lower in the mid−latitude region, compared with low latitudes and high latitudes. For MODIS SST minus buoy SST difference, the latitude and season dependence of biases are not significant, but the trend of SD variations is similar to that of VIRR. The features showing in Figure 9b and Figure 10b are consistent with the results in Gentemann (2014) [22].
According to the above comparison results and analysis of VIRR SST, the dependences of VIRR SST minus buoy SST difference on the SST and latitude are significant, and the features of SST difference distribution change against season. The VIRR SST is retrieved using the MCSST algorithm, and the retrieval coefficients are obtained based on the global matchups of VIRR with buoy SST, not the regional matchups [12]. Thus, the SST retrieval accuracy is relatively low in high latitudes and near the equator due to fewer matchup numbers. Furthermore, to quantitatively evaluate the effect of cloud contamination on VIRR SST quality, we calculate the proportion of VIRR minus buoy SST difference lower than −1.5 °C after correcting for the median skin–subsurface SST temperature difference of −0.17 K [27]. For the collocations from 2015 to 2019, the proportion of VIRR minus buoy SST difference lower than −1.5 °C is 2.3%, indicating that the cloud contamination is a source of error. In addition, the cool skin effect and the mismatch of VIRR with buoy are also factors resulting in SST difference.

5. Conclusions

In this study, FY-3C/VIRR global SST is validated using MODIS SST and buoy measurements as a reference during the period from 2015 to 2019. The VIRR, MODIS, and buoy SSTs are collocated together. The results of comparison show the mean differences of VIRR minus buoy SST are −0.21 and −0.13 °C during the day and night, with an RSD of 0.58 and 0.59 °C, respectively. The biases of VIRR minus MODIS SST difference are −0.10 and 0.08 °C, and the RSDs are 0.53 and 0.58 °C. The three-way error analysis indicates the SST errors of VIRR, MODIS, and buoy SSTs are 0.53 °C/0.58 °C, 0.30 °C/0.32 °C, and 0.37 °C/0.33 °C during the daytime/nighttime, respectively. In addition, the monthly biases of VIRR minus buoy SST difference fluctuate in the range from −0.5 to 0.25 °C, but the monthly SDs remain stable around 0.6 °C. The cold tail shown in histograms of SST difference also indicates that cloud contamination exists in collocations.
Analysis of the dependence of SST difference on latitude indicates that the dependence of VIRR SSTs in low-latitude regions is lower than that of buoy measurements, and the VIRR minus buoy SST difference also presents some dependence mainly because the global VIRR SSTs were retrieved using the same coefficients based on MCSST algorithm and not regional coefficients. The FY-3 VIRR reprocessing SST by NSMC is undergoing, based on the NLSST retrieval algorithm, and will be released in the future. The FY-3 VIRR reprocessing SST data will potentially develop long-term CDR with higher accuracy. In addition, the assessment of VIRR reprocessing SST products will also be carried out by comparing with in situ measurement as well as multi-sensor SST products, such as MODIS and VIIRS SST in the future study.

Author Contributions

Conceptualization, N.L., L.G., S.W. and M.L.; methodology, N.L., L.G. and M.L.; data processing, N.L. and S.W.; analysis, N.L., L.G., S.W. and M.L.; writing—original draft preparation, N.L.; paper review and editing, M.L., L.G. and S.W.; funding acquisition, L.G. and M.L. All authors have read and agreed to the published version of the manuscript.

Funding

This research was funded by the National Key R&D Program of China, grant number 2019YFA0607001; the National Natural Science Foundation of China, grant number 42006161; and Natural Science Foundation of Shandong, grant number ZR2020QD109.

Data Availability Statement

FY3C/VIRR SST data can be requested from the CMA NSMC website (http://satellite.nsmc.org.cn/, accessed on 12 July 2021). MODIS SST data can be downloaded from NASA PO.DAAC website (https://opendap.jpl.nasa.gov/opendap/, accessed on 11 August 2021). The iQuam data can be download from NOAA iQuam website (https://www.star.nesdis.noaa.gov/socd/sst/iquam/, accessed on 12 July 2021). The data of match up results is available from corresponding author.

Acknowledgments

FY-3C/VIRR data were provided by CMA NSMC. Terra/MODIS data were provided by NASA PO.DAAC. iQuam2.1 data were provided by NOAA NESDIS.

Conflicts of Interest

The authors declare no conflict of interest.

References

  1. Barton, I.J.; Prata, A.J. Satellite derived sea surface temperature data sets for climate applications. Adv. Space Res. 1995, 16, 127–136. [Google Scholar] [CrossRef]
  2. Minnett, P.J.; Alvera-Azcárate, A.; Chin, T.M.; Corlett, G.K.; Gentemann, C.L.; Karagali, I.; Li, X.; Marsouin, A.; Marullo, S.; Maturi, E.; et al. Half a century of satellite remote sensing of sea-surface temperature. Remote Sens. Environ. 2019, 233, 111366. [Google Scholar] [CrossRef]
  3. Minnett, P.J.; Corlett, G.K. A pathway to generating Climate Data Records of sea-surface temperature from satellite measurements. Deep Sea Res. Part II Top. Stud. Oceanogr. 2012, 77, 44–51. [Google Scholar] [CrossRef]
  4. Kilpatrick, K.A.; Podestá, G.; Walsh, S.; Williams, E.; Halliwell, V.; Szczodrak, M.; Brown, O.B.; Minnett, P.J.; Evans, R. A decade of sea surface temperature from MODIS. Remote Sens. Environ. 2015, 165, 27–41. [Google Scholar] [CrossRef]
  5. Mcclain, E.P.; Pichel, W.G.; Walton, C.C. Comparative performance of AVHRR-based multichannel sea surface temperatures. J. Geophys. Res. Oceans. 1985, 90, 11587–11601. [Google Scholar] [CrossRef]
  6. Strong, A.E.; McClain, E.P. Improved Ocean Surface Temperatures From Space—Comparisons With Drifting Buoys. Bull. Am. Meteorol. Soc. 1984, 65, 138–142. [Google Scholar] [CrossRef] [Green Version]
  7. Walton, C.C.; Pichel, W.G.; Sapper, J.F.; May, D.A. The development and operational application of nonlinear algorithms for the measurement of sea surface temperatures with the NOAA polar-orbiting environmental satellites. J. Geophys. Res. Oceans. 1998, 103, 27999–28012. [Google Scholar] [CrossRef]
  8. Kilpatrick, K.A.; Podestá, G.P.; Evans, R. Overview of the NOAA/NASA advanced very high resolution radiometer Pathfinder algorithm for sea surface temperature and associated matchup database. J. Geophys. Res. Oceans. 2001, 106, 9179–9197. [Google Scholar] [CrossRef]
  9. Petrenko, B.; Ignatov, A.; Kihai, Y.; Stroup, J.; Dash, P. Evaluation and selection of SST regression algorithms for JPSS VIIRS. J. Geophys. Res. Atmos. 2014, 119, 4580–4599. [Google Scholar] [CrossRef]
  10. Embury, O.; Merchant, C.J.; Corlett, G.K. A reprocessing for climate of sea surface temperature from the along-track scanning radiometers: Initial validation, accounting for skin and diurnal variability effects. Remote Sens. Environ. 2012, 116, 62–78. [Google Scholar] [CrossRef] [Green Version]
  11. Wang, S.; Cui, P.; Zhang, P.; Ran, M.; Lu, F.; Wang, W. FY-3C/VIRR SST Algorithm and cal/val Activities at NSMC/CMA. In Proceedings of the SPIE 9261, Ocean Remote Sensing and Monitoring from Space, Beijing, China, 10 December 2014. [Google Scholar]
  12. Wang, S.; Cui, P.; Zhang, P.; Yang, Z.; Hu, X.; Ran, N.; Liu, J.; Lin, M.; Qiu, H. FY-3C/VIRR Sea Surface Temperature Products and Quality Validation. J. Appl. Meteorol. Sci. 2020, 31, 729–739. [Google Scholar]
  13. Wang, H.; Guan, L.; Chen, G. Evaluation of Sea Surface Temperature from FY-3C VIRR Data in the Arctic. IEEE Geosci. Remote Sens. Lett. 2016, 13, 292–296. [Google Scholar] [CrossRef]
  14. FENGYUN Satellite Data Center. Available online: http://satellite.nsmc.org.cn/ (accessed on 12 July 2021).
  15. Yang, J.; Dong, C. New Generation FY LEO-Meteorological Satellite Operational Products and Applications, 1st ed.; China Science Press: Beijing, China, 2008; pp. 347–348. (In Chinese) [Google Scholar]
  16. Liao, Z.; Dong, Q.; Xue, C. Evaluation of sea surface temperature from FY-3C data. Int. J. Remote Sens. 2017, 38, 4954–4973. [Google Scholar] [CrossRef]
  17. NASA OBPG. NASA OBPG. MODIS Terra Level 3 SST Thermal IR Daily 4 km Daytime v2014.0; Ver. 2014.0; PO.DAAC: Pasadena, CA, USA, 2015; Available online: https://doi.org/10.5067/MODST-1D4D4 (accessed on 11 August 2021).
  18. In Situ SST Quality Monitor. Available online: https://www.star.nesdis.noaa.gov/socd/sst/iquam/ (accessed on 12 July 2021).
  19. Xu, F.; Ignatov, A. In situ SST Quality Monitor (iQuam). J. Atmos. Ocean. Technol. 2014, 31, 164–180. [Google Scholar] [CrossRef]
  20. Gentemann, C.L.; Minnett, P.J.; Ward, B. Profiles of ocean surface heating (POSH): A new model of upper ocean diurnal warming. J. Geophys. Res. Oceans 2009, 114, C07017. [Google Scholar] [CrossRef] [Green Version]
  21. O’Carroll, A.G.; Eyre, J.R.; Saunders, R.W. Three-Way Error Analysis between AATSR, AMSR-E, and In Situ Sea Surface Temperature Observations. J. Atmos. Ocean. Technol. 2008, 25, 1197–1207. [Google Scholar] [CrossRef] [Green Version]
  22. Gentemann, C.L. Three way validation of MODIS and AMSR-E sea surface temperatures. J. Geophys. Res. Oceans 2014, 119, 2583–2598. [Google Scholar] [CrossRef]
  23. O’Carroll, A.G.; August, T.; Le Borgne, P.; Marsouin, A. The accuracy of SST retrievals from Metop-A IASI and AVHRR using the EUMETSAT OSI-SAF matchup dataset. Remote Sens. Environ. 2012, 126, 184–194. [Google Scholar] [CrossRef]
  24. Stoffelen, A. Toward the true near-surface wind speed: Error modeling and calibration using triple collocation. J. Geophys. Res. Oceans 1998, 103, 7755–7766. [Google Scholar] [CrossRef]
  25. Saha, K.; Dash, P.; Zhao, X.; Zhang, H. Error Estimation of Pathfinder Version 5.3 Level-3C SST Using Extended Triple Collocation Analysis. Remote Sens. 2020, 12, 590. [Google Scholar] [CrossRef] [Green Version]
  26. Lumpkin, R.; Maximenko, N.; Pazos, M. Evaluating Where and Why Drifters Die. J. Atmos. Ocean. Technol. 2011, 29, 300–308. [Google Scholar] [CrossRef]
  27. Kilpatrick, K.A.; Podestá, G.; Williams, E.; Walsh, S.; Minnett, P.J. Alternating Decision Trees for Cloud Masking in MODIS and VIIRS NASA Sea Surface Temperature Products. J. Atmos. Ocean. Technol. 2019, 36, 387–407. [Google Scholar] [CrossRef]
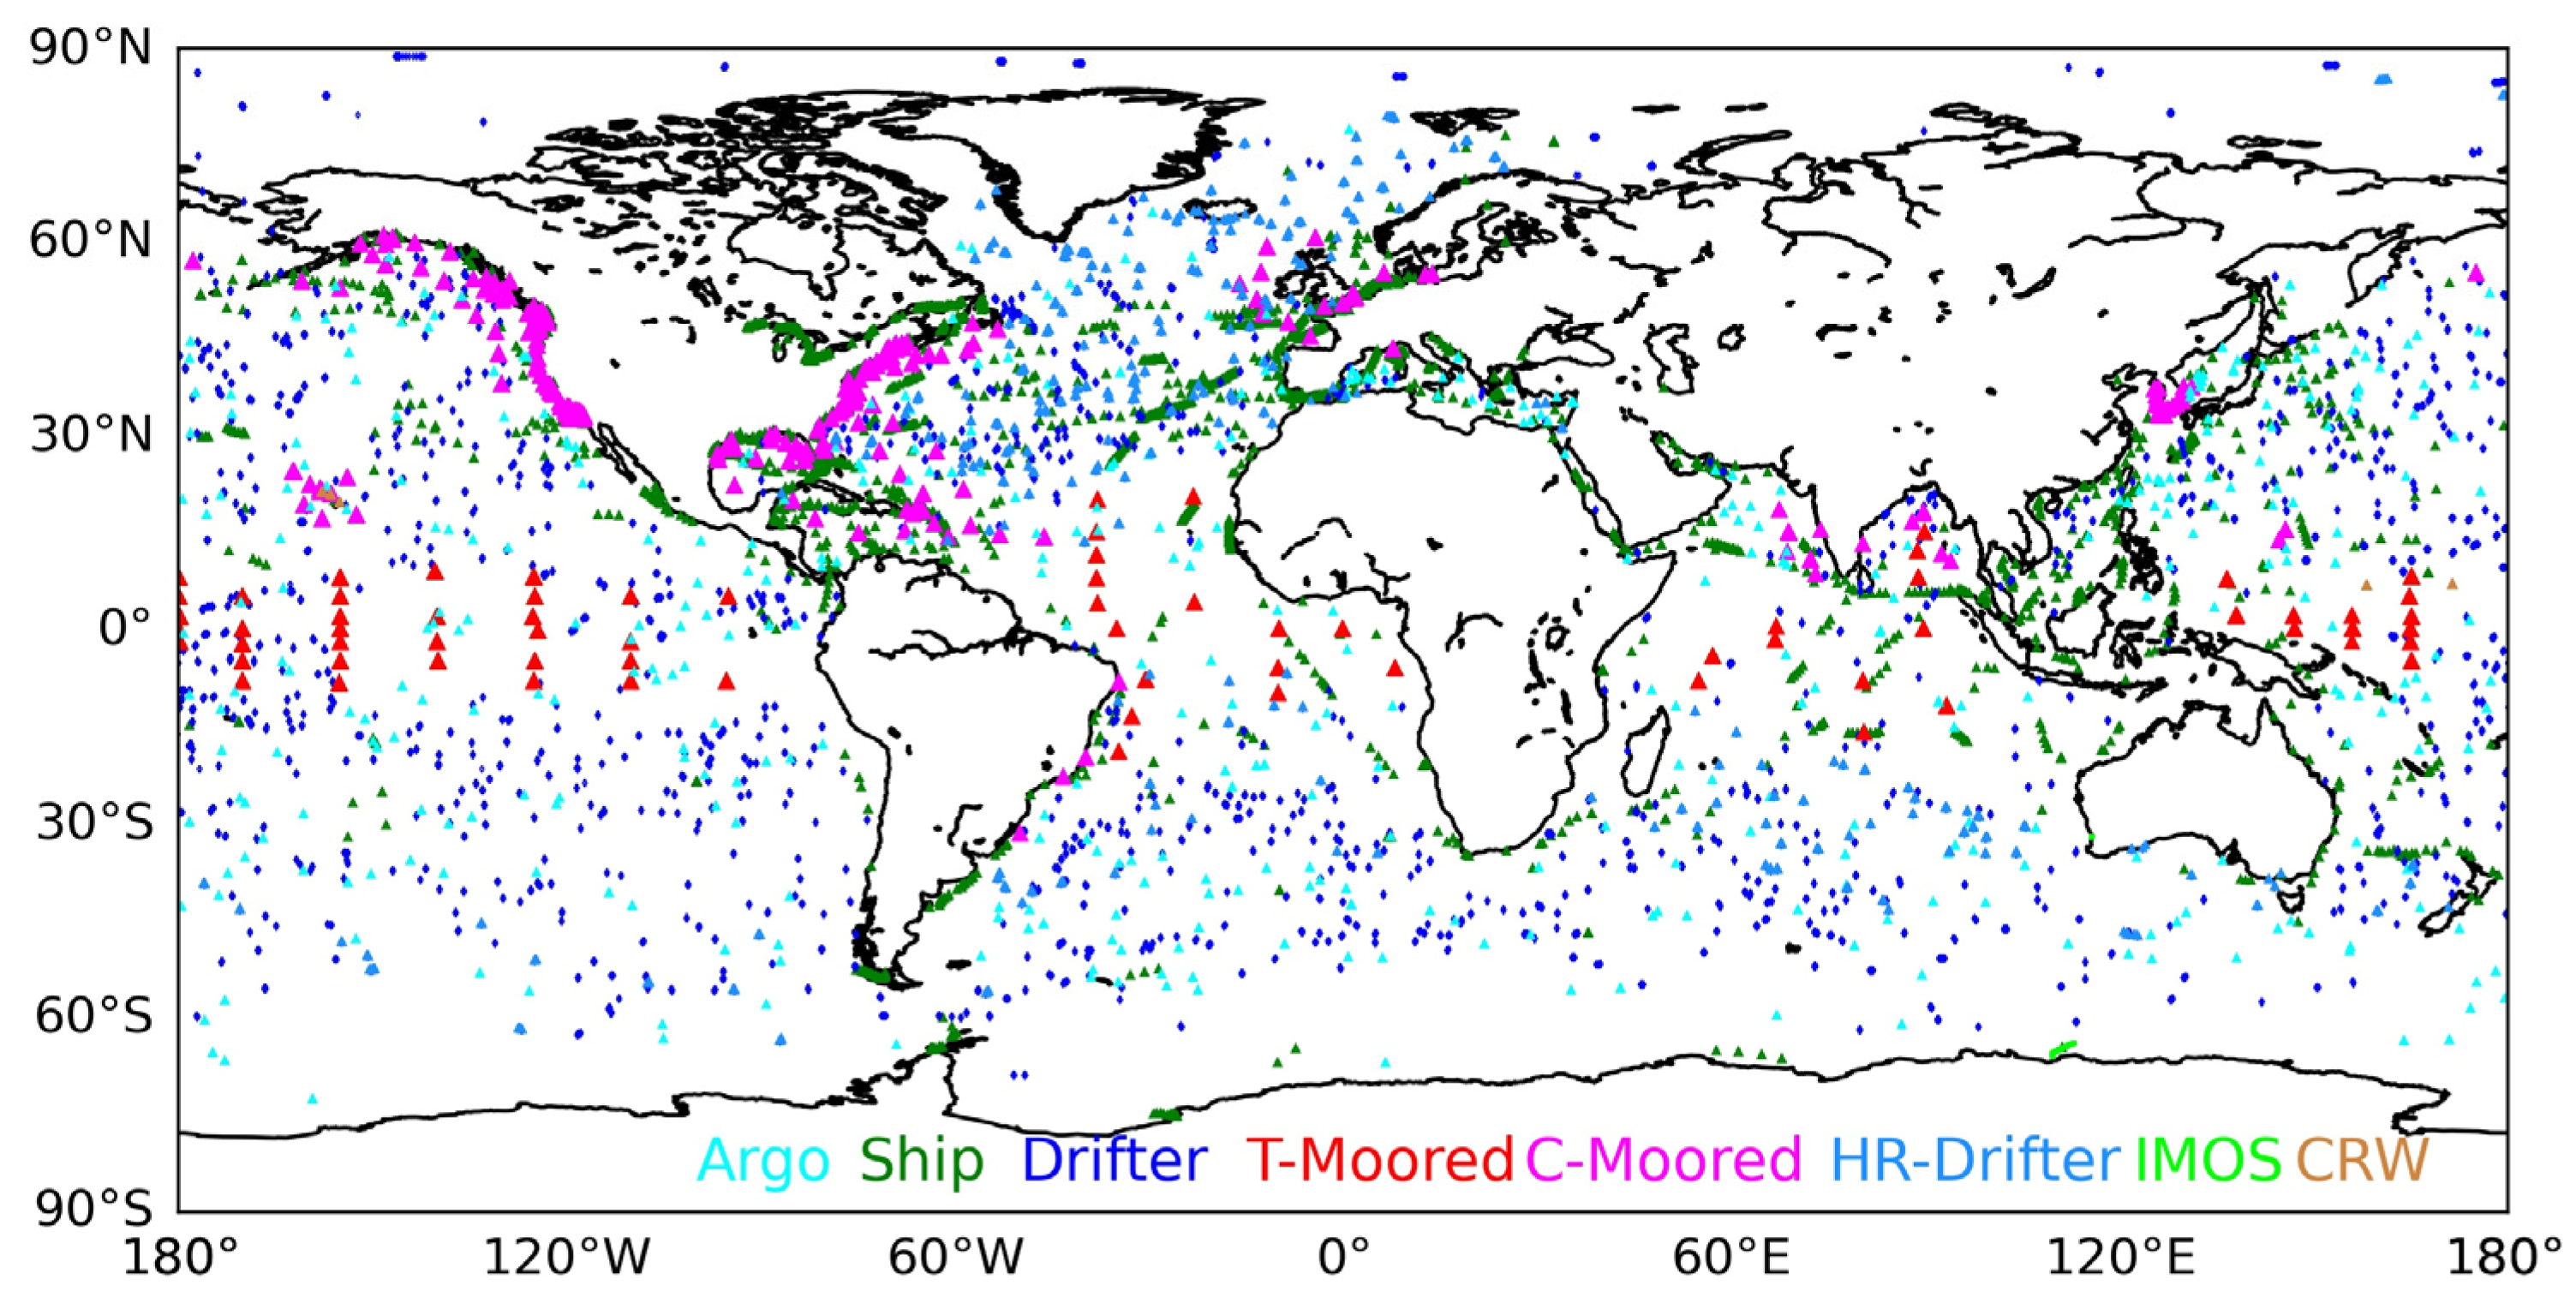
Figure 1. In situ measurements of iQuam2.1 on 31 December 2015.
Remotesensing 13 03249 g001
Figure 2. FY-3C VIRR SST on 1 January 2016, (a) daytime and (b) nighttime.
Remotesensing 13 03249 g002aRemotesensing 13 03249 g002b
Figure 3. MODIS SST on 1 January 2016, (a) daytime and (b) nighttime.
Remotesensing 13 03249 g003
Figure 4. Histogram of VIRR minus buoy SST difference from 2015 to 2019. (a) daytime and (b) nighttime.
Remotesensing 13 03249 g004
Figure 5. Time series of SST difference from January 2015 to November 2019 during daytime: (a) monthly bias and (b) monthly SD. The red lines show the VIRR minus buoy SST difference. The blue lines represent MODIS minus buoy SST difference. The orange lines represent VIRR minus MODIS SST difference.
Remotesensing 13 03249 g005
Figure 6. Time series of SST difference from January 2015 to November 2019 during nighttime: (a) monthly bias and (b) monthly SD. The red lines show the VIRR minus buoy SST difference. The blue lines represent MODIS minus buoy SST difference. The orange lines represent VIRR minus MODIS SST difference.
Remotesensing 13 03249 g006
Figure 7. The variations in VIRR minus buoy SST difference against buoy SST as shown for (a) daytime and (b) nighttime.
Remotesensing 13 03249 g007
Figure 8. The variations in MODIS minus buoy SST difference against buoy SST as shown for (a) daytime and (b) nighttime.
Remotesensing 13 03249 g008
Figure 9. The distributions of (a) VIRR minus buoy SST difference, (b) MODIS minus buoy SST difference, and (c) matchup numbers against latitude in daytime from 2015 to 2019.
Remotesensing 13 03249 g009
Figure 10. The distributions of (a) VIRR minus buoy SST difference, (b) MODIS minus buoy SST difference, and (c) matchup numbers against latitude in nighttime from 2015 to 2019.
Remotesensing 13 03249 g010
Table 1. Statistical results of VIRR, MODIS, and buoy SST measurements during the day and night from 2015 to 2019.
YearSST DifferenceBias
(°C)
SD
(°C)
Median
(°C)
RSD
(°C)
P
(±0.3 °C)
P
(±0.5 °C)
P
(±1 °C)
2015–2019VIRR minus
buoy (D)
−0.210.65−0.160.580.390.600.87
MODIS minus
buoy (D)
−0.100.48−0.090.390.540.760.95
VIRR minus
MODIS (D)
−0.100.61−0.090.530.430.640.91
VIRR minus
buoy (N)
−0.130.67−0.080.590.390.600.87
MODIS minus
buoy (N)
−0.210.46−0.170.370.540.760.95
VIRR minus
MODIS (N)
0.080.670.100.580.390.590.88
Table 2. Yearly statistics results of VIRR, MODIS, and buoy SST measurements during the day and night.
YearSST DifferenceBias
(°C)
SD
(°C)
Median
(°C)
RSD
(°C)
P
(±0.3 °C)
P
(±0.5 °C)
P
(±1 °C)
Daytime2015VIRR minus
buoy (D)
−0.400.68−0.360.600.330.520.82
MODIS minus
buoy (D)
−0.160.47−0.150.390.520.750.95
VIRR minus MODIS (D)−0.240.61−0.230.530.400.610.89
2016VIRR minus
buoy (D)
−0.050.670.000.590.390.600.88
MODIS minus
buoy (D)
−0.100.47−0.080.390.550.760.95
VIRR minus MODIS (D)0.040.610.080.520.430.650.91
2017VIRR minus
buoy (D)
−0.120.63−0.070.560.420.630.89
MODIS minus
buoy (D)
−0.130.47−0.110.380.550.760.95
VIRR minus MODIS (D)0.010.580.030.500.450.670.92
2018VIRR minus
buoy (D)
−0.180.60−0.140.530.420.640.90
MODIS minus
buoy (D)
−0.040.47−0.030.370.570.790.96
VIRR minus MODIS (D)−0.140.58−0.130.510.440.650.91
2019VIRR minus
buoy (D)
−0.350.64−0.300.570.370.560.85
MODIS minus
buoy (D)
−0.130.50−0.110.410.520.740.95
VIRR minus MODIS (D)−0.230.62−0.210.530.400.610.89
Nighttime2015VIRR minus
buoy (N)
−0.180.68−0.110.600.390.600.87
MODIS minus
buoy (N)
−0.270.47−0.230.370.510.730.94
VIRR minus MODIS (N)0.100.660.110.570.390.600.88
2016VIRR minus
buoy (N)
0.080.680.150.580.370.570.87
MODIS minus
buoy (N)
−0.200.46−0.160.370.550.760.95
VIRR minus MODIS (N)0.290.670.310.560.340.540.85
2017VIRR minus
buoy (N)
0.010.640.060.540.410.630.90
MODIS minus
buoy (N)
−0.200.46−0.150.360.560.770.95
VIRR minus MODIS (N)0.200.630.220.530.390.600.89
2018VIRR minus
buoy (N)
−0.180.62−0.140.540.420.630.89
MODIS minus
buoy (N)
−0.200.46−0.160.360.550.770.95
VIRR minus MODIS (N)0.020.630.020.540.420.630.90
2019VIRR minus
buoy (N)
−0.360.66−0.310.610.360.540.83
MODIS minus
buoy (N)
−0.200.46−0.160.370.540.760.95
VIRR minus MODIS (N)−0.160.67−0.150.600.380.580.87
Table 3. Estimated errors of VIRR, MODIS, and buoy SST using three-way analysis from 2015 to 2019.
σ (°C)
DaytimeNighttime
Year201520162017201820192015–2019201520162017201820192015–2019
VIRR0.550.550.500.490.520.530.580.590.540.540.550.58
MODIS0.260.280.280.320.330.300.310.310.320.330.300.32
Buoy0.390.380.380.340.370.370.340.340.330.310.390.33
Publisher’s Note: MDPI stays neutral with regard to jurisdictional claims in published maps and institutional affiliations.