Article

Observed Near-Inertial Waves in the Northern South China Sea

1
CAS Key Laboratory of Ocean Circulation and Waves, Institute of Oceanology, Chinese Academy of Sciences, Qingdao 266071, China
2
Center for Ocean Mega-Science, Chinese Academy of Sciences, Qingdao 266071, China
3
Laboratory for Ocean and Climate Dynamics, Qingdao National Laboratory for Marine Science and Technology, Qingdao 266237, China
4
University of Chinese Academy of Sciences, Beijing 100049, China
*
Author to whom correspondence should be addressed.
Remote Sens. 2021, 13(16), 3223; https://doi.org/10.3390/rs13163223
Submission received: 24 June 2021 / Revised: 6 August 2021 / Accepted: 8 August 2021 / Published: 13 August 2021

Abstract

:
Characteristics of near-inertial waves (NIWs) induced by the tropical storm Noul in the South China Sea are analyzed based on in situ observations, remote sensing, and analysis data. Remote sensing sea level anomaly data suggests that the NIWs were influenced by a southwestward moving anticyclonic eddy. The NIWs had comparable spectral density with internal tides, with a horizontal velocity of 0.14–0.21 m/s. The near-inertial kinetic energy had a maximum value of 7.5 J/m3 and propagated downward with vertical group speed of 10 m/day. Downward propagation of near-inertial energy concentrated in smaller wavenumber bands overwhelmed upward propagation energy. The e-folding time of NIWs ranged from 4 to 11 days, and the larger e-folding time resulted from the mesoscale eddies with negative vorticity. Modified by background relative vorticity, the observed NIWs had both red-shifted and blue-shifted frequencies. The upward propagating NIWs had larger vertical phase speeds and wavelengths than downward propagating NIWs. There was energy transfer from the mesoscale field to NIWs with a maximum value of 8.5 × 10⁻⁹ m2 s−3 when total shear and relative vorticity of geostrophic currents were commensurate. Our results suggest that mesoscale eddies are a significant factor influencing the generation and propagation of NIWs in the South China Sea.

1. Introduction

Near-inertial waves (NIWs) are commonplace internal waves of the global ocean and have frequencies around local inertial frequency f = 2 Ω sin φ, where Ω and φ represent the angular velocity of earth rotation and latitude. The excitation mechanism of NIWs can be rapid-changing wind of sporadic storms [1], localized wave–wave interactions [2], or the interaction between sea floor relief and geostrophic currents [3]. Rapidly changing winds are thought to be dominant energy sources of NIWs that impart energy into the surface mixed layer, leading to an ageostrophic flow that subsequently adjusts and generates NIWs [4,5,6,7]. The global power input to NIWs by winds is 0.3–1.5 TW [8,9,10,11,12], which is comparable to the power conversion of surface tides to internal tides [13] and the work done by winds on oceanic geostrophic currents [14].
Tropical cyclones are extremely high wind events that can generate energetic NIWs due to their strong winds and compact size [1,15,16]. In the wake of tropical cyclones, the distinction between the NIWs’ frequency (ω) and the local inertial frequency (f) is determined by the horizontal wavenumbers (k, l) of the disturbance induced by tropical cyclones according to [17]:
ω 2 = f 2 + c n 2 k 2 + l 2 = f 2 1 + L R 2 k 2 + l 2
where cn is the phase speed of n-th mode internal gravity wave, and LR is the baroclinic Rossby radius of deformation. The spatial scale of NIWs is usually much larger than LR, and consequently the NIWs’ frequency is slightly higher than local inertial frequency, which is referred to as blue-shift. However, red-shift of NIWs’ frequency can occur under the influence of negative background vorticity [18]. Previous research has elucidated general characteristics of NIWs induced by tropical cyclones: (1) the NIWs are concentrated around the wake of tropical cyclones [1,5]; (2) the frequencies of NIWs can be blue-shifted and red-shifted [19,20]; and (3) the NIWs have vertical and lateral scales of hundreds of meters and hundreds of kilometers, respectively [1].
The South China Sea (SCS), a marginal sea located in the northwestern Pacific Ocean, is frequently influenced by locally and western Pacific Ocean generated tropical cyclones [21]. Basic characteristics of NIWs induced by tropical cyclones in the SCS have been analyzed based on in situ observations [19,20,22,23,24,25,26,27,28] and numerical modelling [29,30,31,32]. NIWs in the SCS are frequently modified by background relative vorticity [23,28,33,34], nonlinear wave–wave interactions [33,35,36], and internal tides [37,38].
Modification of NIWs by mesoscale eddies includes frequency shift and wave trapping. Certain detailed characteristics of NIWs generated and propagating within mesoscale eddies in the SCS remain ambiguous. Based on remote sensing datasets and in situ observations, the present study explores characteristics of NIWs generated by the tropical storm Noul within an anticyclonic mesoscale eddy. The rest of the paper is organized as follows: information concerning the tropical cyclone Noul and the in situ observations, and the methodology are introduced in Section 2; the sea surface temperature (SST) response to Noul is presented in Section 3; the oceanic near-inertial responses are shown in Section 4, and Section 5 presents a discussion and summary.

2. Tropical Cyclone, Data and Methods

2.1. Tropical Cyclone and Data

During the observation period, the tropical storm Noul passed through the middle of the South China Sea. A tropical depression emerged over the sea south of the Luzon Island on September 15. On September 16, the depression intensified to a tropical storm and was nominated as Noul. The data of Noul used in this paper are from the Japanese Meteorology Agency (JMA). Noul had maximum wind speed of 23 m/s and radius of 15 m/s wind of 330 km. The closet distance between the center of Noul and the moorings occured on September 17, and the distances were 270 km, 300 km and 430 km for M1, M2 and M3, respectively. Consequently, M1 and M2 were within the radius of 15 m/s wind of Noul.
Three moorings of thermometers and Acoustic Doppler Current Profiler (ADCP) were deployed on early September of 2020 on the continental slope of the northern SCS. The 300-kHz ADCP is up-looking and has a temporal and spatial resolution of 10 min and 8 m. The temporal resolution of the thermometers is 1 min and the spatial resolution of the thermometers ranges from 10 m to 300 m. The three moorings are coded as M1, M2 and M3 according to the deployment sequence of them. The locations and detailed information of the three moorings are shown in Figure 1 and Table 1. The ADCP observed horizontal velocity near the sea surface are contaminated by surface reflection and are discarded.
The TPXO 7.2 dataset are used to remove surface tidal currents from the observed current [13]. The sea surface temperature (SST) data from the Remote Sensing Systems (RSS) with a temporal resolution of 1 day and a spatial resolution of 9 km are utilized to diagnose the SST evolution. The microwave band has through-cloud capability, and the infrared band has high spatial resolution. Consequently, the microwave and infrared optimally interpolated product are adopted. The 10-m wind from the ERA5 reanalysis dataset of the European Center for Medium-Range Weather Forecasts (ECWMF) was used to calculate wind stress. The temporal and spatial resolutions of the wind data are 1-h and 1/4°. All satellites merged absolute dynamic topography (ADT), sea level anomaly (SLA) and the derived geostrophic current data from the Archiving, Validation, and Interpretation of Satellite Oceanographic (AVISO) dataset were utilized to distinguish mesoscale eddies and estimate background vorticity and strain. The ADT, SLA and geostrophic current data have a temporal and spatial resolutions of 1 day and 1/4°. The HYCOM+NCODA Global 1/12° Analysis dataset was adopted to substitute for the hydrography. The HYCOM data have a temporal resolution of 3-h and a spatial resolution of 0.08° and 0.04°.

2.2. Methods

The original horizontal velocity records were decomposed into zonal and meridional current speed, and the two components were resampled to 1 h interval. The barotropic tidal currents was removed from the observation based on the TPXO 7.2 dataset. Afterwards, the rotary spectra of the detided currents were calculated [39], and the near-inertial velocity (u, v) was derived by applying a band-pass Butterworth filter with a pass-band of 0.85 f–1.15 f [23,40] to the detided currents. To eliminate phase distortion, the designed filter was imposed in forward and backward directions, respectively. The near-inertial kinetic energy (NIKE) can be calculated through
NIKE = 1 2 ρ 0 u 2 + v 2 ,
where ρ0 = 1024 kg∙m−3 is the reference density of sea water. The damped slab model can efficiently reproduce near-inertial currents induced by impulsive wind [41,42,43], and was utilized to model the mixed layer near-inertial currents. The mixed layer horizontal velocities in the damped slab model evolve according to
u t f 0 v = τ x ρ 0 H r u v t + f 0 u = τ y ρ 0 H r v
where τx and τy are wind stress, ρ0 water density, H is the mixed layer depth (MLD) and r is a damping coefficient [42]. The MLD was time-varying and was estimated from the HYCOM data, and the damping coefficient is chosen according to the e-folding time of the observed NIWs. Wind stress τ was evaluated according to
τ = ρ a C d U 10 u 10 ,
where ρa = 1.25 kg/m3 is the air density, Cd is the drag coefficient, U10 and u 10 are the magnitude and vector of 10 m wind. The formulation established by Oey et al. [44] was adopted to calculate the drag coefficient. The dependence of the drag coefficient on the magnitude of 10 m wind is
C d × 10 3 = 1.2 , U 10 11   m / s 0.49 + 0.065 U 10 , 11   m / s < U 10 19   m / s 1.364 + 0.0234 U 10 0.00023158 U 10 2 , U 10 > 19   m / s
The rotary vertical wavenumber spectra demonstrate the vertical energy propagation direction and rate of internal waves. According to the vertical wavenumber m, the vertical distribution of the horizontal velocity can be written as u(m) + iv(m) [45],
u ( m ) + i v ( m ) = 1 D 0 D [ u ( z ) + i v ( z ) ] e i m z d z ,
where D is the water depth. The horizontal velocity can be decomposed into positive and negative wavenumbers parts
u ( m ) + i v ( m ) = u + ( m ) e i m z + u ( m ) e i m z ,
where u and u+ are the clockwise and anticlockwise rotating with depth components. The spectra of the clockwise and anticlockwise components are:
C m = 1 2 u u * ¯ A m = 1 2 u + u + * ¯ ,
where Cm (Am) is the clockwise (anticlockwise) spectrum; the overlies represent averaging operation, and * denotes the complex conjugate. Cm (Am) demonstrates the downward (upward) energy propagation rate, and CmAm indicates the energy propagation direction [46]. Positive (negative) CmAm corresponds to downward (upward) energy propagation. Prior to the rotary vertical wavenumber spectra estimation, the vertical and temporal mean of the horizontal velocity were removed [47], and the horizontal velocity was then Wentzel–Kramers–Brillouin (WKB) scaled using the buoyancy frequency calculated from the HYCOM dataset. The velocity at each depth was normalized according to
u n = u z N / N 0 , v n = v z N / N 0 ,
where N and N0 = 1.0205 × 10⁻² s1 are the buoyancy frequency and mean buoyancy frequency during the observed period. The buoyance frequency was calculated from the HYCOM data. To extract the frequency and phase of NIWs, the plane-wave fitting method was utilized [48]. To minimize the effects of stratification, the near-inertial currents were also WKB-scaled in advance. Then, the WKB-scaled near-inertial currents were fitted to the plane-wave equation based on least square method:
Ψ = Re Ψ 0 e i ω t m z ϕ ,
where Ψ 0 is the wave amplitude, ω is the wave radius frequency, m is the wave vertical wavenumber, and ϕ is the wave phase. There exist mesoscale eddies during the observation period, and the roles that mesoscale eddies played in generating NIWs were diagnosed through vorticity, shear, and the Okubo–Weiss parameter of the geostrophic currents. Horizontal velocity gradient tensors were calculated from the AVISO surface geostrophic currents U and V. The relative vorticity ( ζ ) and total strain (S) of the background flow were calculated according to
ζ = V x U y ,
S = S n 2 + S s 2 ,
where S n = U x V y is the normal strain, and S s = V x + U y is the shear strain. The effective Coriolis frequency ( f e f f ) under the influence of relative vorticity and strain is
f e f f = f 0 + ζ / 2 2 S 2 / 4 ,
The Okubo–Weiss parameter denotes the relative importance of total strain and relative vorticity, which is defined as [49]
α 2 = 1 4 S 2 ζ 2 ,
The rate of energy transfer from the mesoscale field to NIWs was estimated following [50,51]:
P = 0.5 u u ¯ v v ¯ S n u v ¯ S s ,
where the overlies represent running mean over three inertial periods.

3. Results

3.1. Thermal Response

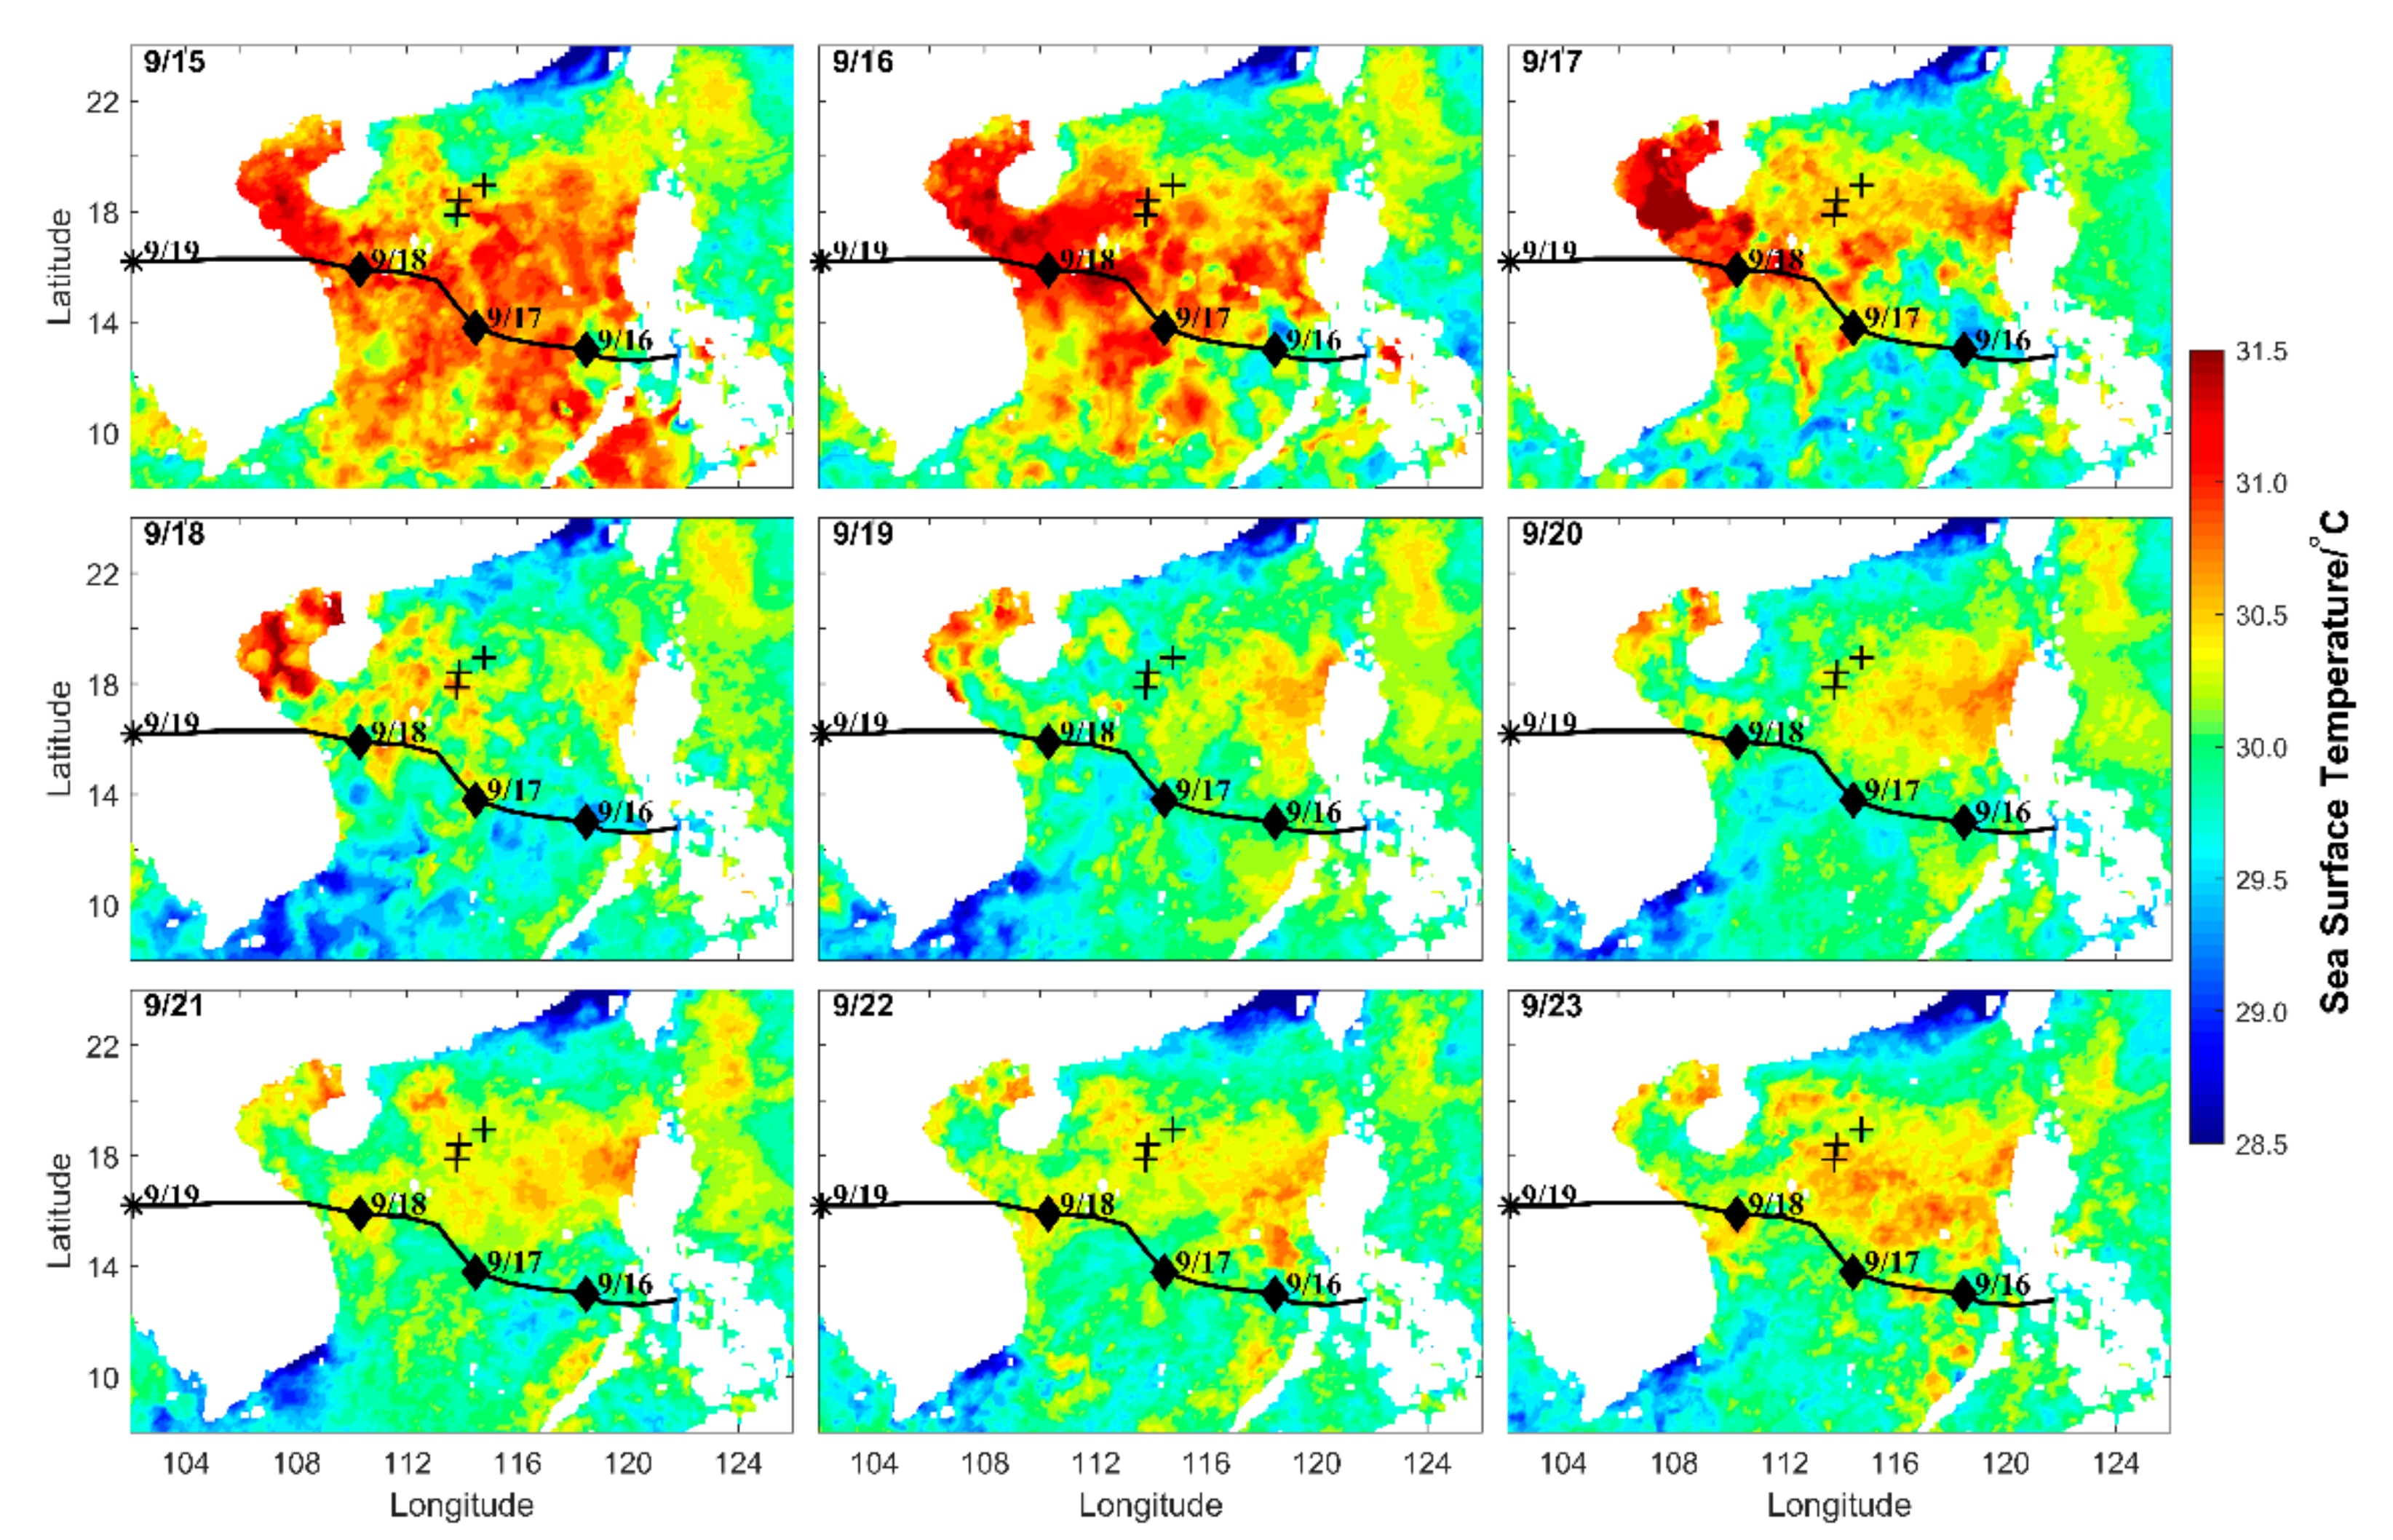
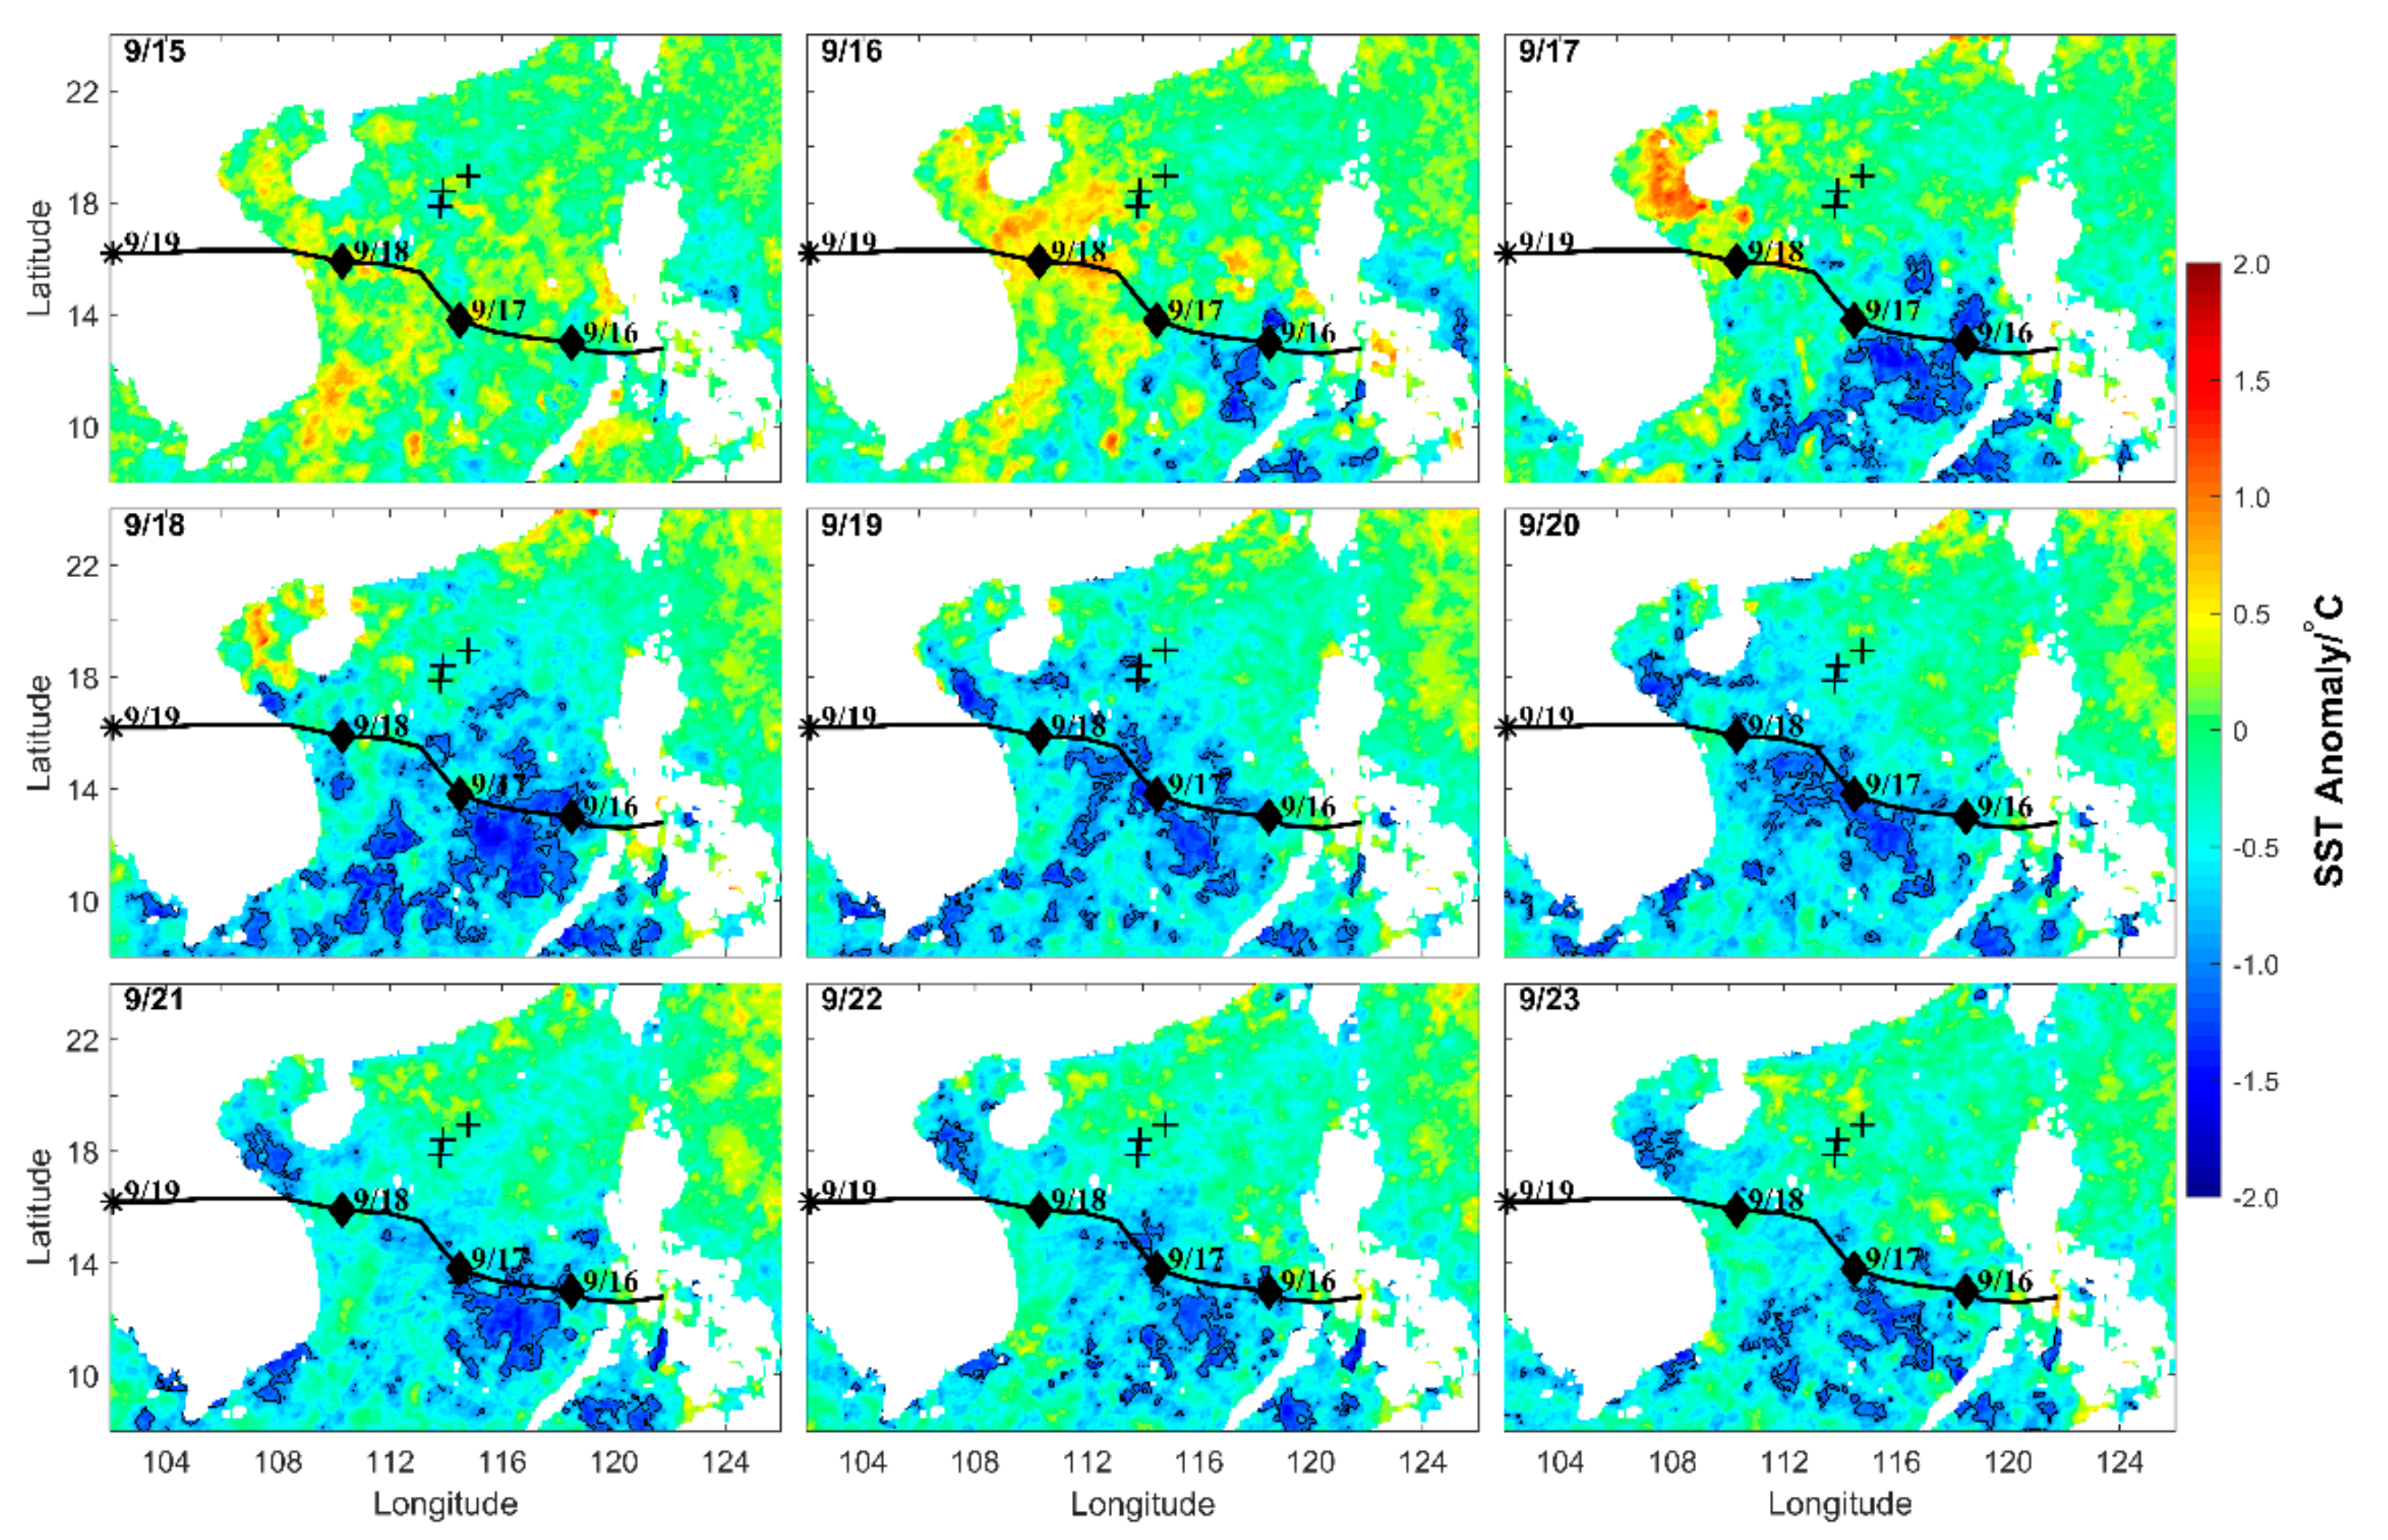
The evolution of SST from September 15 to 23 is shown in Figure 2. Prior to the formation of Noul, the SST in central SCS was generally higher than 30 °C, which facilitated the development of Noul. On September 16, significant sea surface cooling emerged around the typhoon center. The sea surface cooling stretched to the right and left sides of the track of Noul on September 17. After the landfall of Noul, SST in central SCS decreased to below 30 °C and gradually recovered. The typhoon-induced SST anomaly was calculated as the difference between the daily SST and the pre-typhoon SST on September 14 (Figure 3). The SST anomaly became conspicuous and reached –1 °C on September 16. Afterward, the SST anomaly area stretched with the translation of Noul. Unexpectedly, the SST anomaly showed a left-hand bias instead of the commonly observed right-hand bias [52,53]. The maximum surface cooling was −1.95 °C and occurred on September 18.

3.2. Dynamical Response

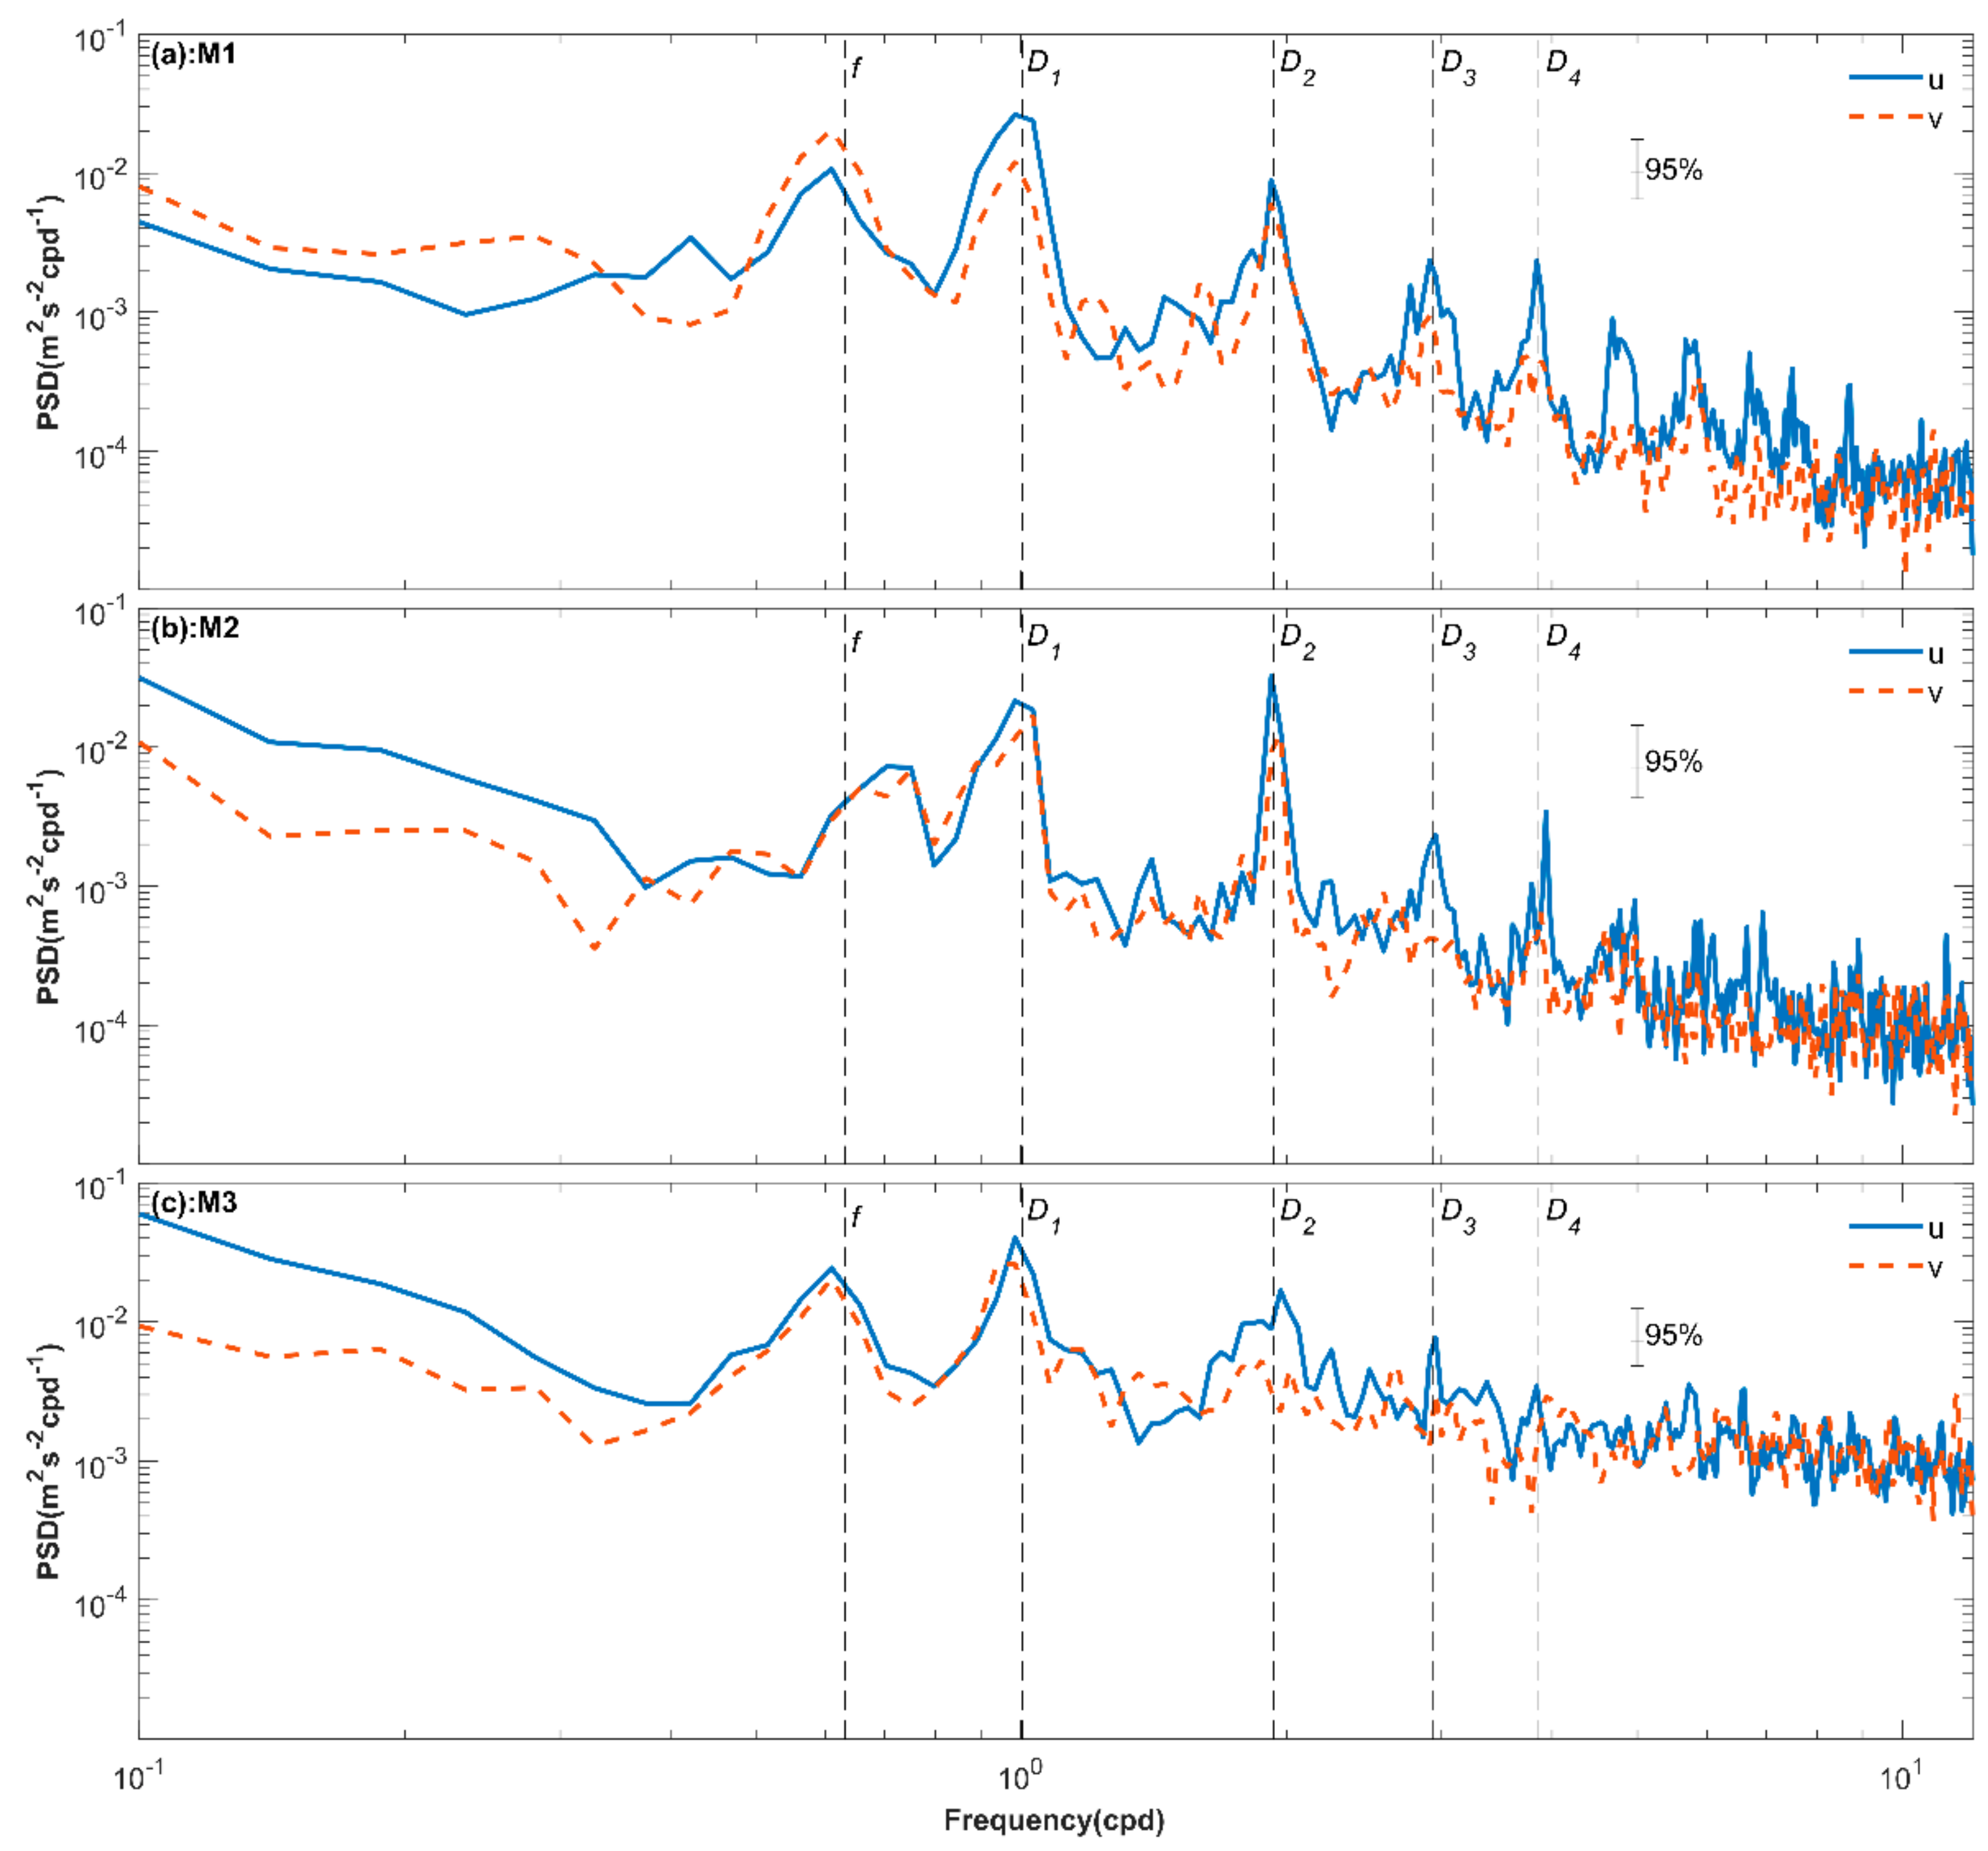
The barotropic tidal currents were removed from the observed horizontal currents using the TPXO 7.2 dataset, and then the power spectra of the horizontal current were estimated (Figure 4). The near-inertial waves, diurnal and semidiurnal internal tides dominated the velocity field of the three moorings. At M1, the near-inertial waves and diurnal internal tides have comparable spectra density, and the semidiurnal internal tides have slightly lower power spectral density. At M2, the semidiurnal and diurnal internal tides have comparable densities that are twofold that of the near-inertial peak. At M3, the diurnal internal tides are slightly more energetic than the near-inertial waves and semidiurnal internal tides. The near-inertial peak at M2 has a frequency higher than the local inertial frequency; however, the near-inertial peaks at M1 and M3 have frequencies lower than local inertial frequencies.
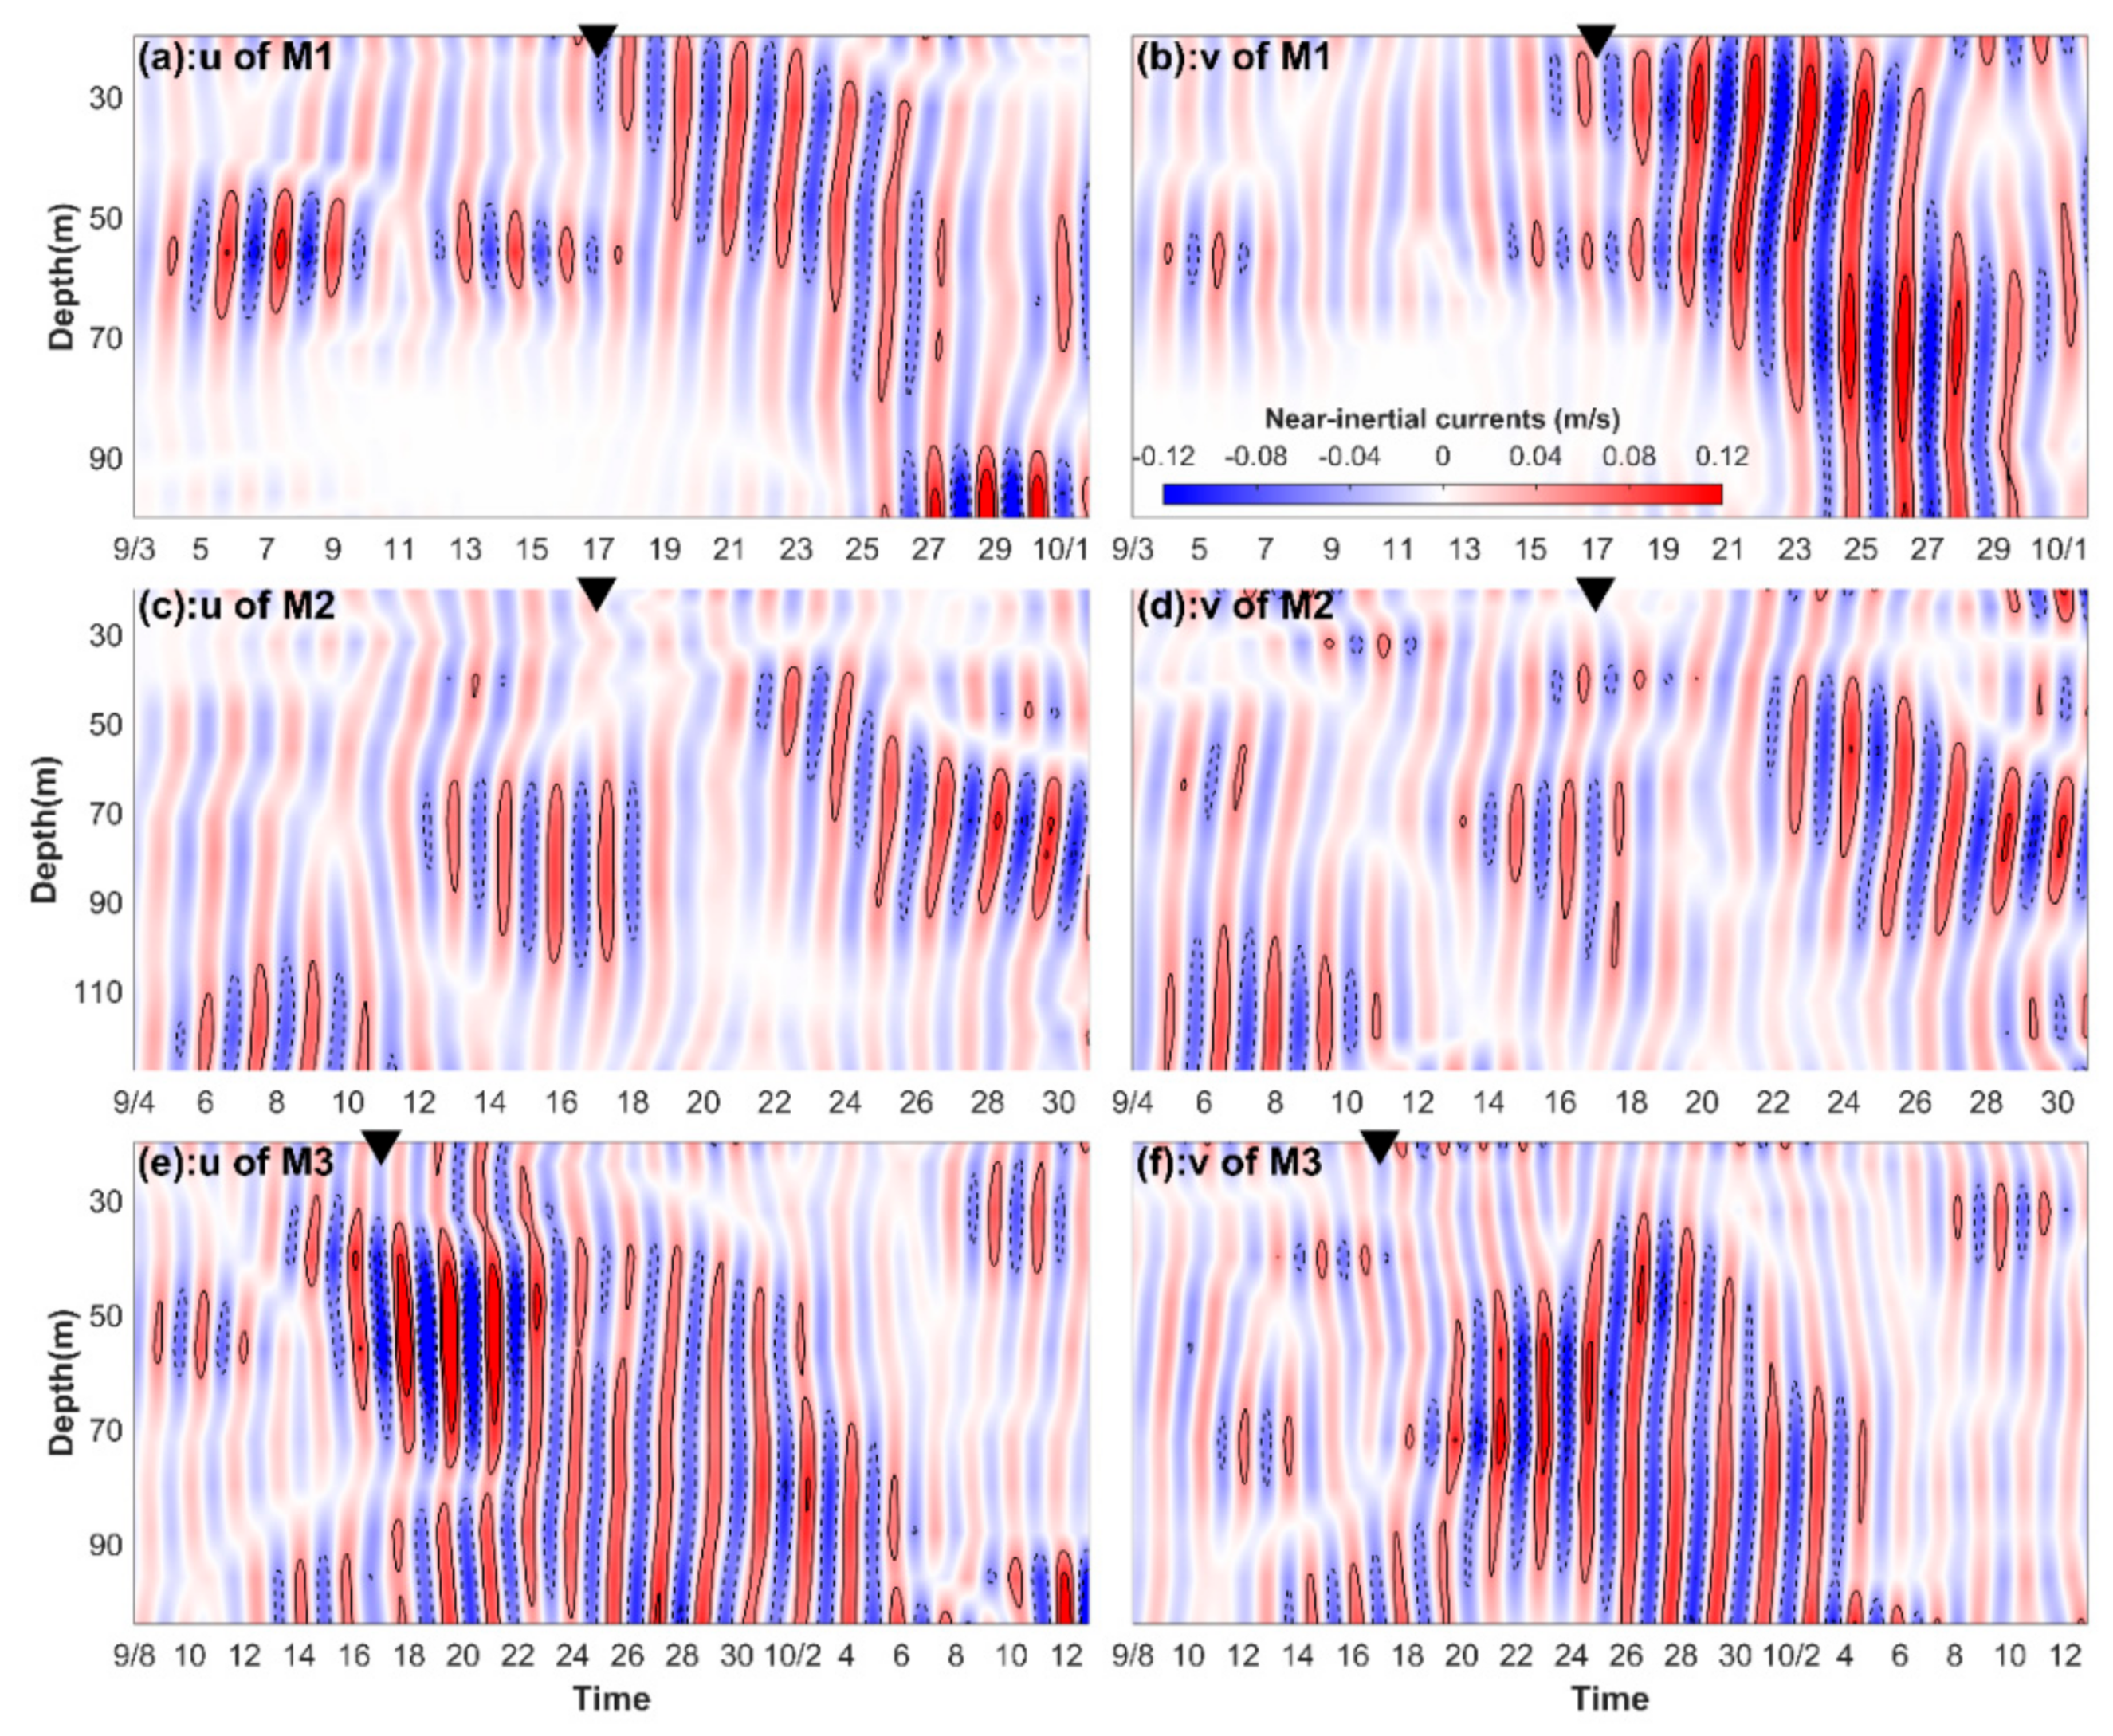
Evolution of near-inertial currents is shown in Figure 5. After the passage of Noul, energetic near-inertial currents emerged at the three mooring stations. The zonal and meridional near-inertial currents were 0.15 m/s for M1 and M2, and 0.10 m/s for M3, values that were smaller than those observed in the northern SCS [19,20,24,33]. For M1 and M3, the near-inertial currents began to be enhanced after the passage of Noul, indicating that NIWs were induced by wind fields of Noul. For M2, the near-inertial currents were not enhanced immediately after the passage of Noul, rather showing an enhancement five days later. The smaller near-inertial currents resulted from the weaker intensity of Noul, which had a maximum wind speed of 23 m/s. The near-inertial currents present a depth-leading phase, which suggests upward phase propagation and download propagation of group velocity [5].
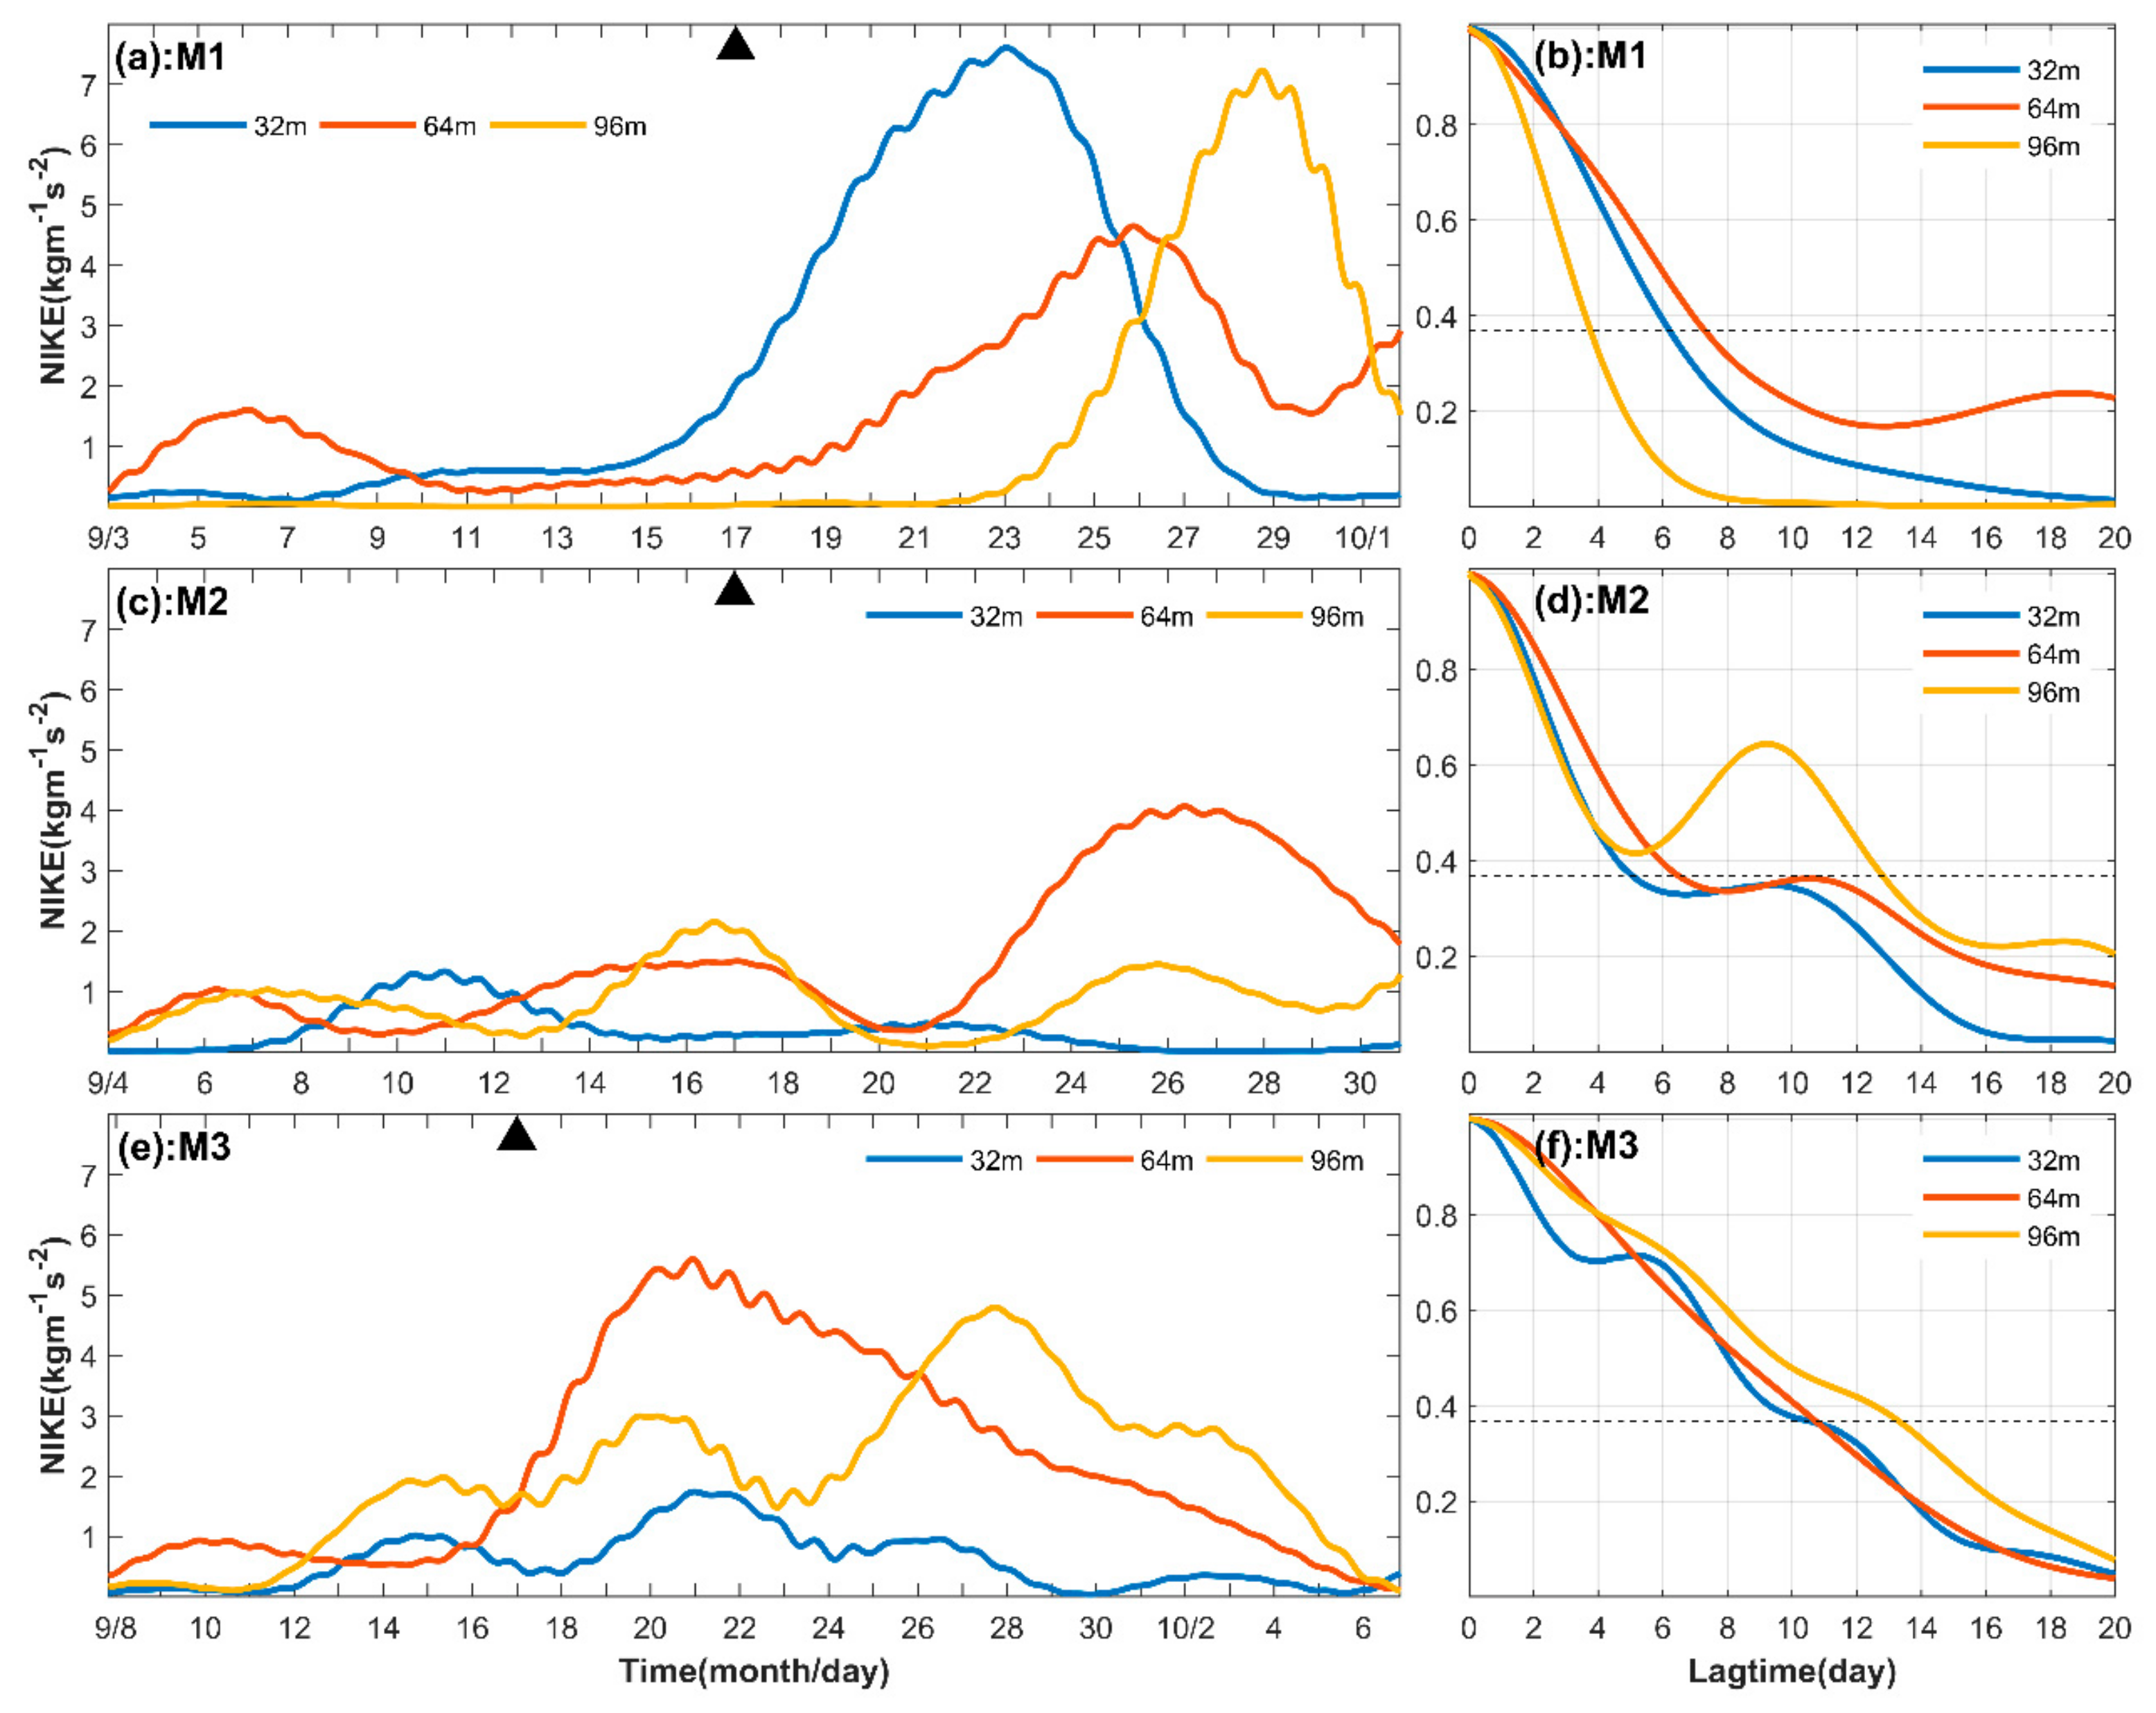
The evolution and autocorrelation of NIKE at the depths of 32 m, 64 m, and 96 m are shown in Figure 6. For M1, the NIKE at 32 m was comparable with that at 96 m with maximum value of 7.5 J/m3, much larger than that at 64 m. NIKE in M1 at 32 m increased abruptly after the passage of typhoon Noul on September 17. The NIKE in M1 at 32 m, 64 m, and 96 m reached maxima on September 23, 26, and 29, suggesting a time lag of NIKE with increasing depth. The time lag indicated downward propagation of NIKE, and the estimated group speed based on the time lag was 11 m/day. The e-folding times of NIWs in M1 were 6, 7, and 4 days at the depths of 32, 64, and 96 m, respectively. There was no significant NIKE enhancement immediately after the passage of Noul in M2. NIKE in M2 at 64 m began to increase on September 22 and reached a maximum value of 4.0 J/m3 on September 26, weaker than those of M1 and M3. The e-folding times of NIWs in M2 were five and six days at 32 and 64 m; however, the e-folding time of NIWs at 96 m fluctuated, as the NIKE at 96 m had three peaks. For M3, NIKE increased after the passage of Noul; this was most conspicuous at 64 m, and the maximum NIKE was 6 J/m3. The attenuation of NIKE in M3 was slower than that in M1. Consequently, the e-folding time of NIWs in M3 was 11 days at the depth of 32 and 64 m and 13 days at the depth of 96 m.
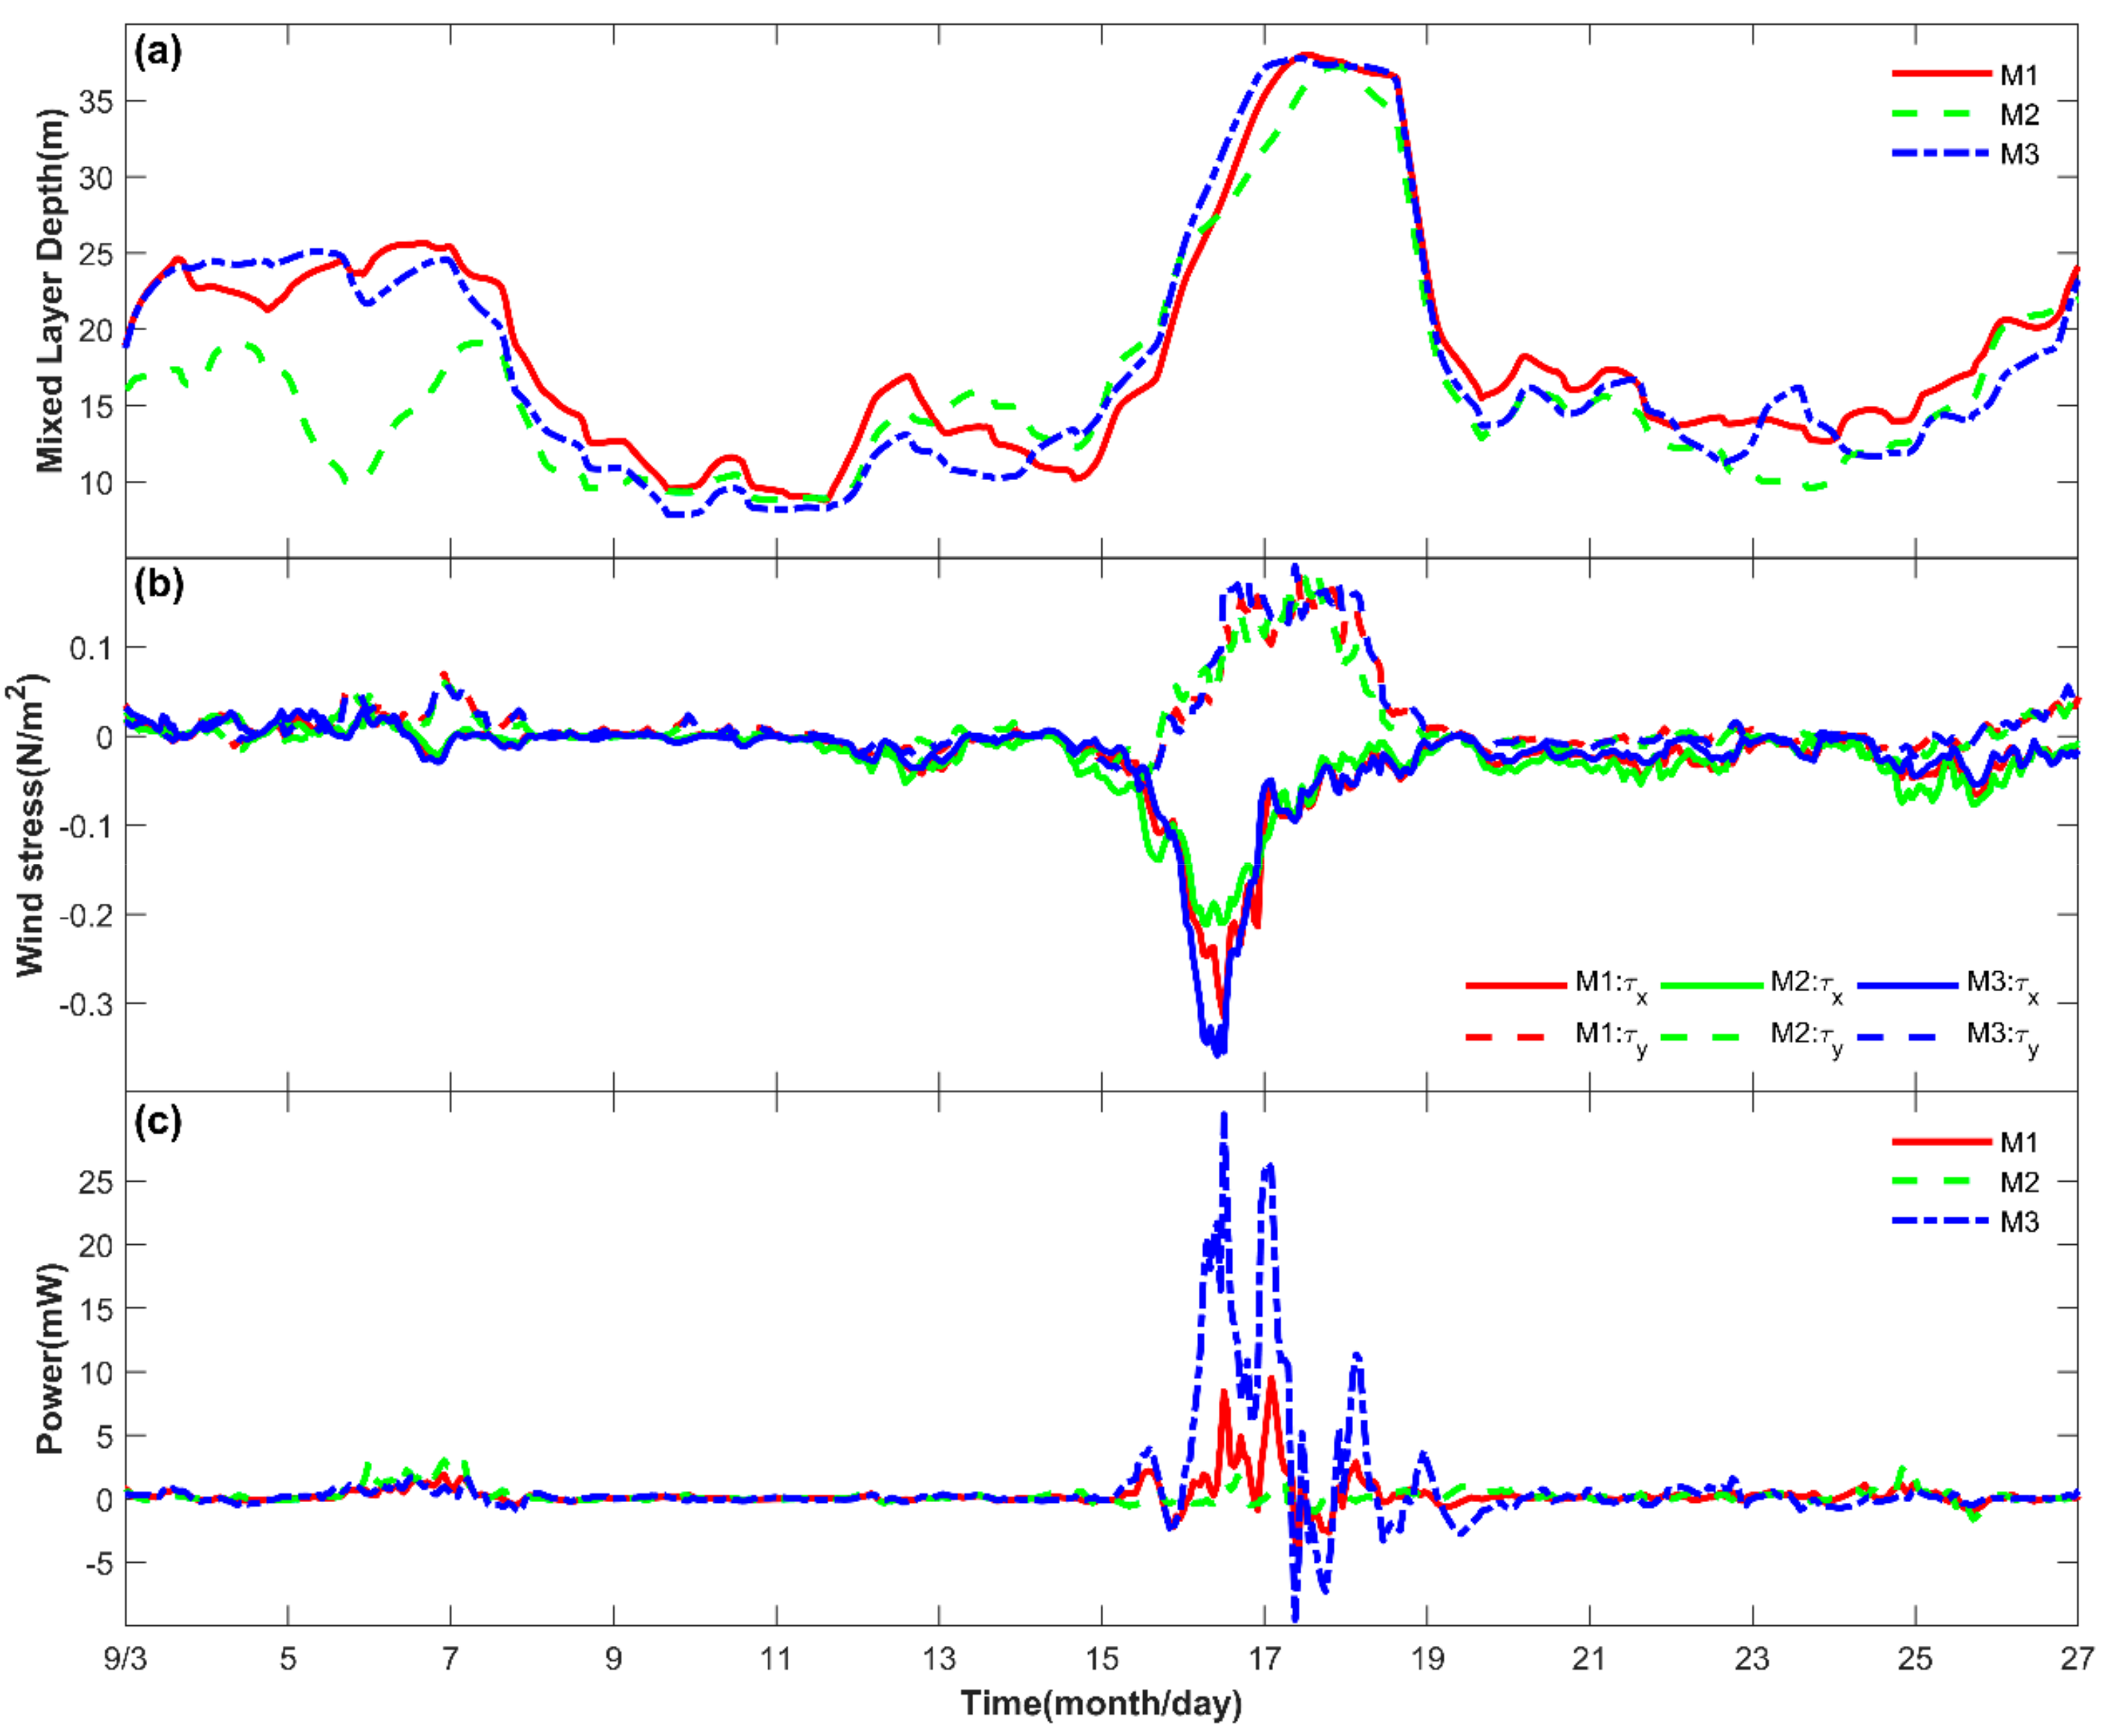
The mixed layer depths of the three mooring stations showed similar trends of deepening from 10 m to 37 m between September 15 and 17 (Figure 7a). The deepening of the mixed layer was related to the wind stress effect of Noul, which intensified to more than 0.30 N/m2 (Figure 7b). The meridional wind stresses of M1, M2, and M3 were comparable; however, the zonal wind stresses varied between mooring stations. M3 had the most intense zonal wind stress, and M2 had the weakest zonal wind stress. The distance of the mooring stations to the center of Noul led to the differences in zonal wind stress. The near-inertial energy flux from the surface wind stress to the mixed layer obtained from the damped slab model is shown in Figure 7c. The mixed layer depth of the model was derived from the HYCOM dataset (Figure 7a), and the damping coefficients were set to 0.25 f, 0.25 f, and 0.15 f according to the e-folding time of NIWs in each mooring station (Figure 6). The results of the damped slab model suggest that Noul stimulated energetic Ekman currents and NIWs. The estimated near-inertial energy flux indicates that M3 had the most powerful energy flux and that M2 had the weakest energy flux. The estimated energy flux is consistent with the observed NIWs, which were energetic in M1 and M3, and weak in M2.
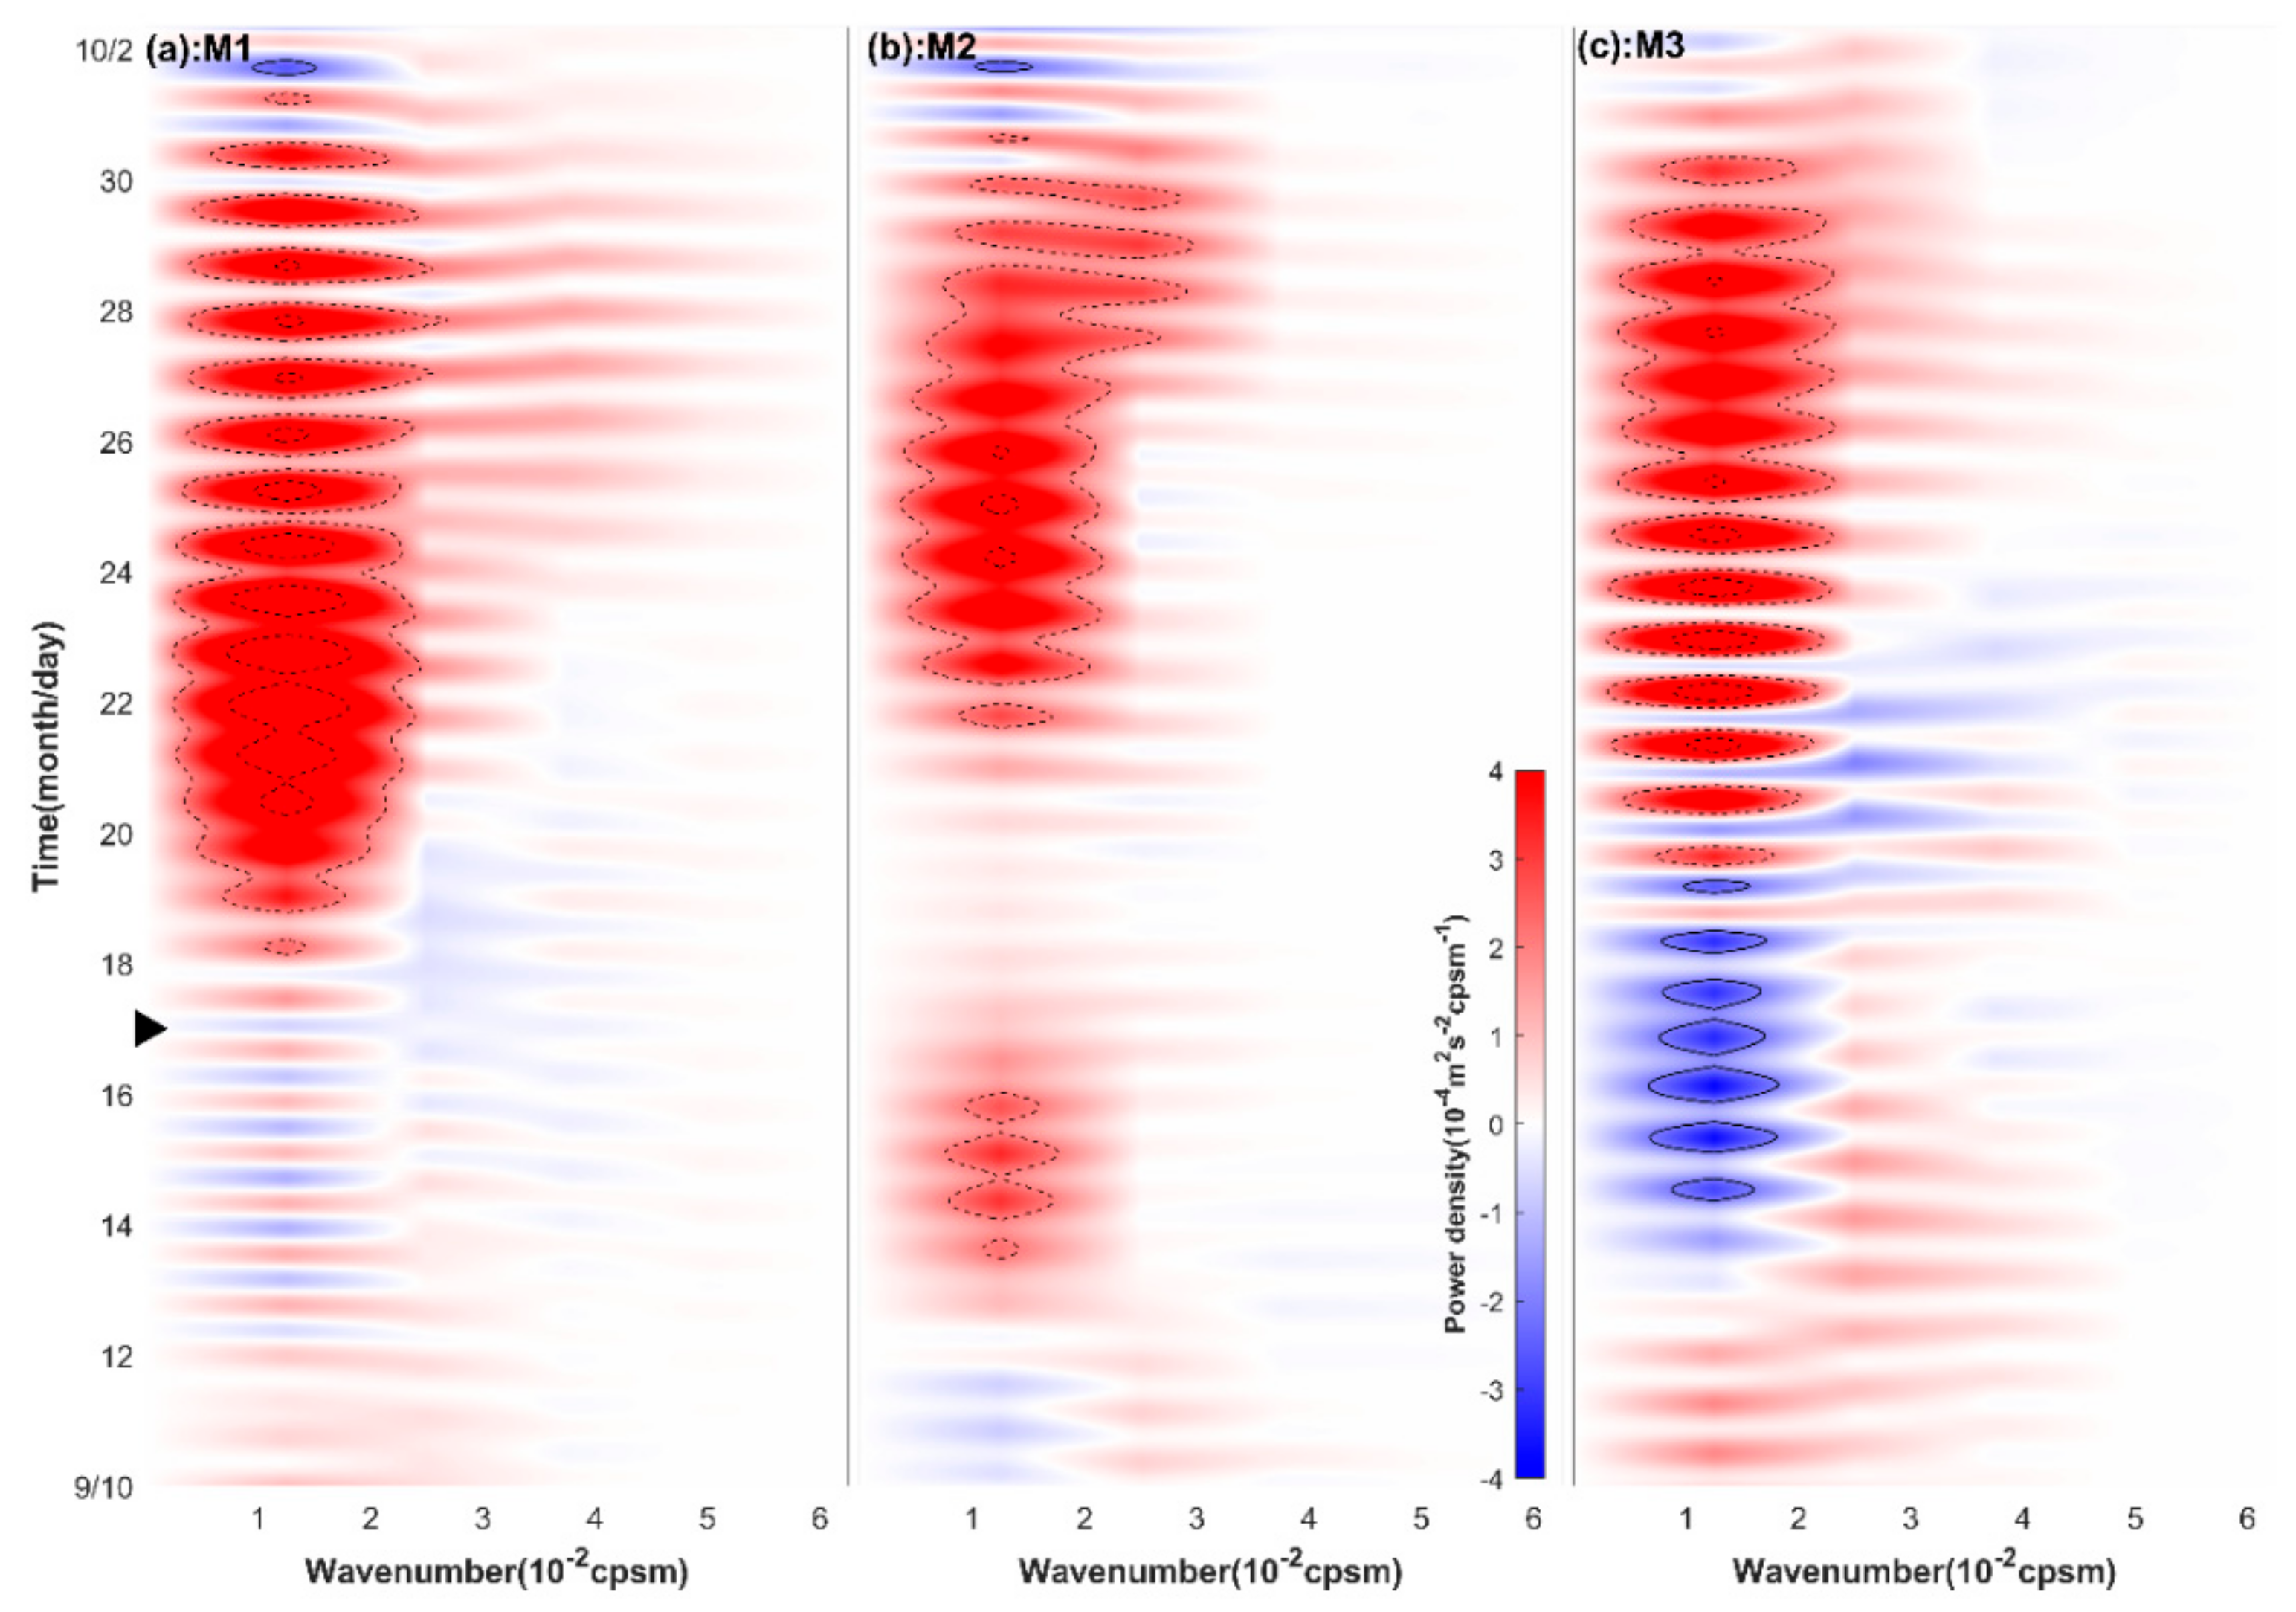
The evolution of the rotary vertical wavenumber spectra for M1, M2, and M3 is shown in Figure 8. The coordinate is WKB-scaled, and the unit of the vertical wavenumber is cycles per stretched meter (cpsm). The NIWs in the three mooring stations have dominant downward propagation of energy, and the downward propagation of near-inertial energy was concentrated in smaller wavenumber bands (<2 × 10⁻² cpsm). Upward propagation of near-inertial energy emerges at the end of each NIW episode and at the beginning of NIW episodes in M3. The spectral density of downward propagating near-inertial energy exceeded 6 × 10⁻⁴ m2 s−2 cpsm−1; however, the spectral density of upward propagating near-inertial energy had a maximum value of about –2 × 10⁻⁴ m2 s−2 cpsm−1 and lasted for about six days in M3. The upward propagation of near-inertial energy indicates that typhoon Noul imparted energy into the thermocline during the forced stage through an inertial pumping-induced pressure anomaly [5]. Afterward, the injected energy propagated upward during the relaxed stage. The temporal integration of the rotary vertical wavenumber spectra indicates that the net near-inertial energy propagation direction was downward.
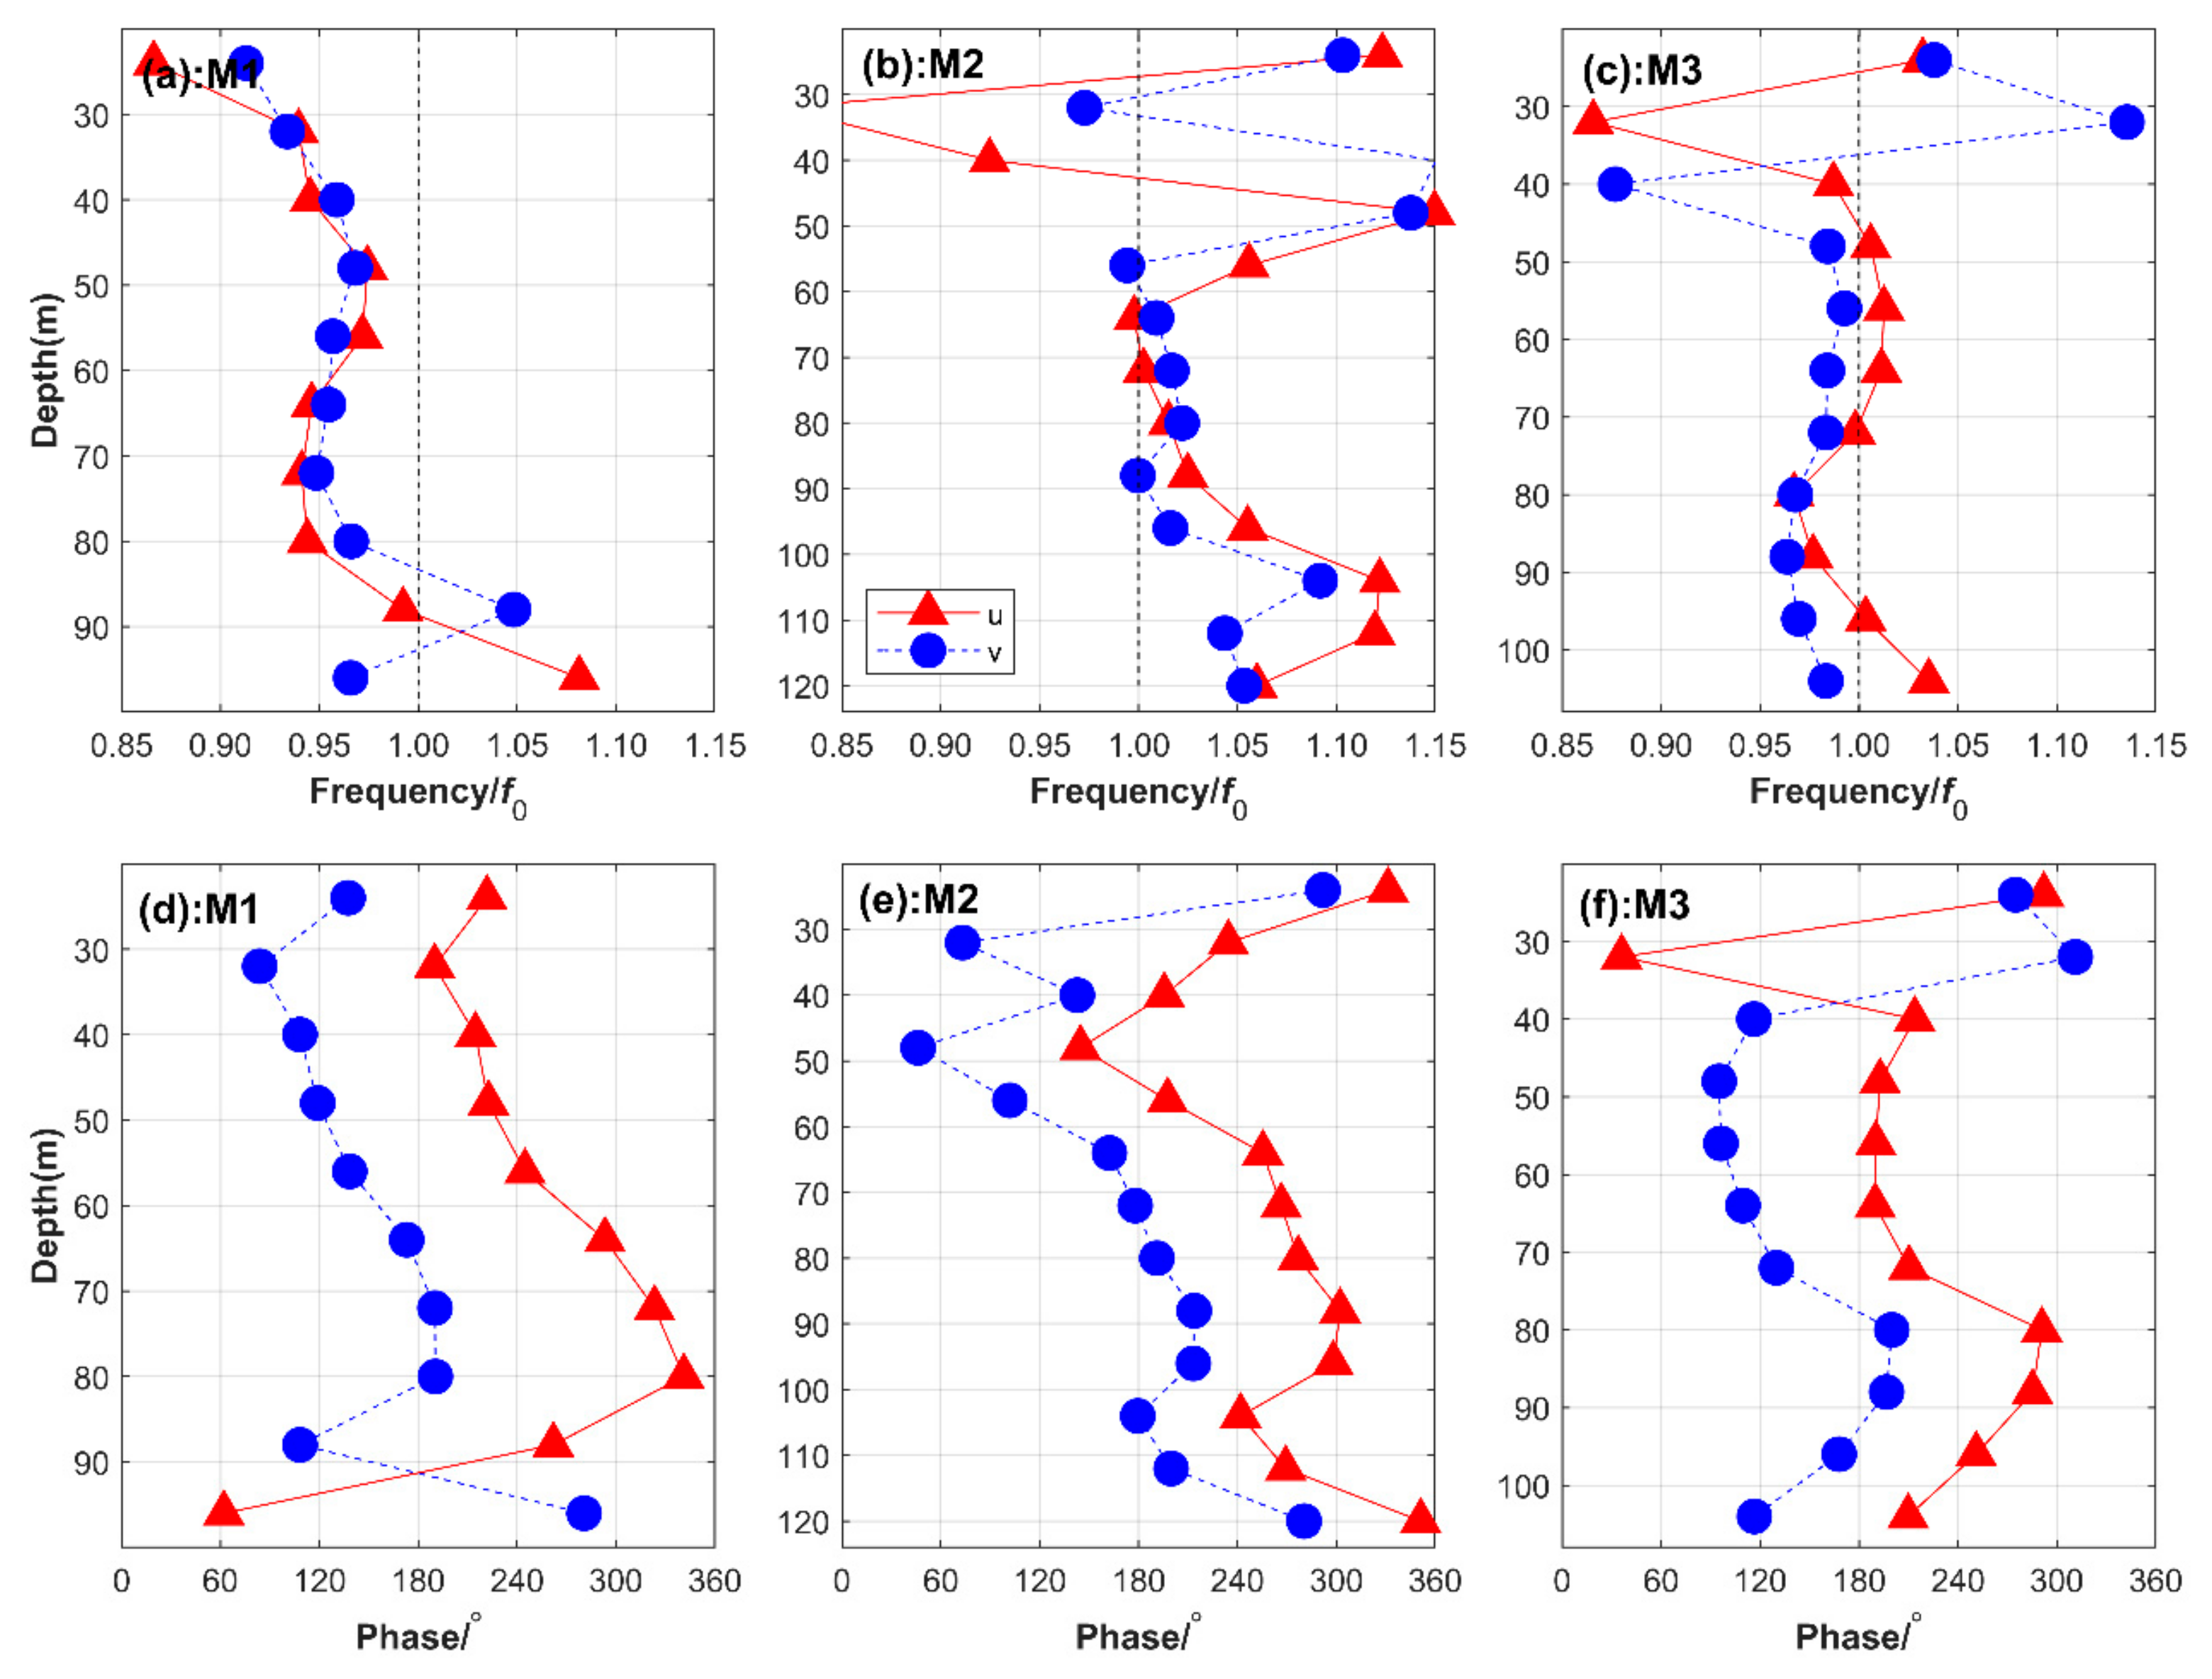
The frequency and phase of NIWs obtained from the plane wave fitting method are shown in Figure 9. NIWs of M1 have red-shifted frequency above 80 m, and the depth-mean frequency is about 0.95 f. The phase of NIWs in M1 shows an evident depth-leading trend indicating upward propagating phase and downward propagating group speed. As the phase of a plane wave changes 360° within one wavelength, the vertical phase speed and wavelength of NIWs in M1 are 3.53 m/h and 134 m, respectively. The frequency of NIWs in M2 shows slight blue-shift, with a depth-mean value of about 1.03 f. NIWs in M2 and M3 show both upward and downward propagating phase speed. NIWs in M2 have downward phase speed above 50 m and upward phase speed below 50 m. The downward and upward phase speeds of NIWs in M2 are –1.08 m/h and 3.18 m/h. NIWs in M3 have upward phase speed between 40 m and 80 m and downward phase speed below 80 m. The upward and downward phase speeds of NIWs in M3 are 4.58 m/h and –2.69 m/h. Parameters of NIWs in M1, M2, and M3 are summarized in Table 2.
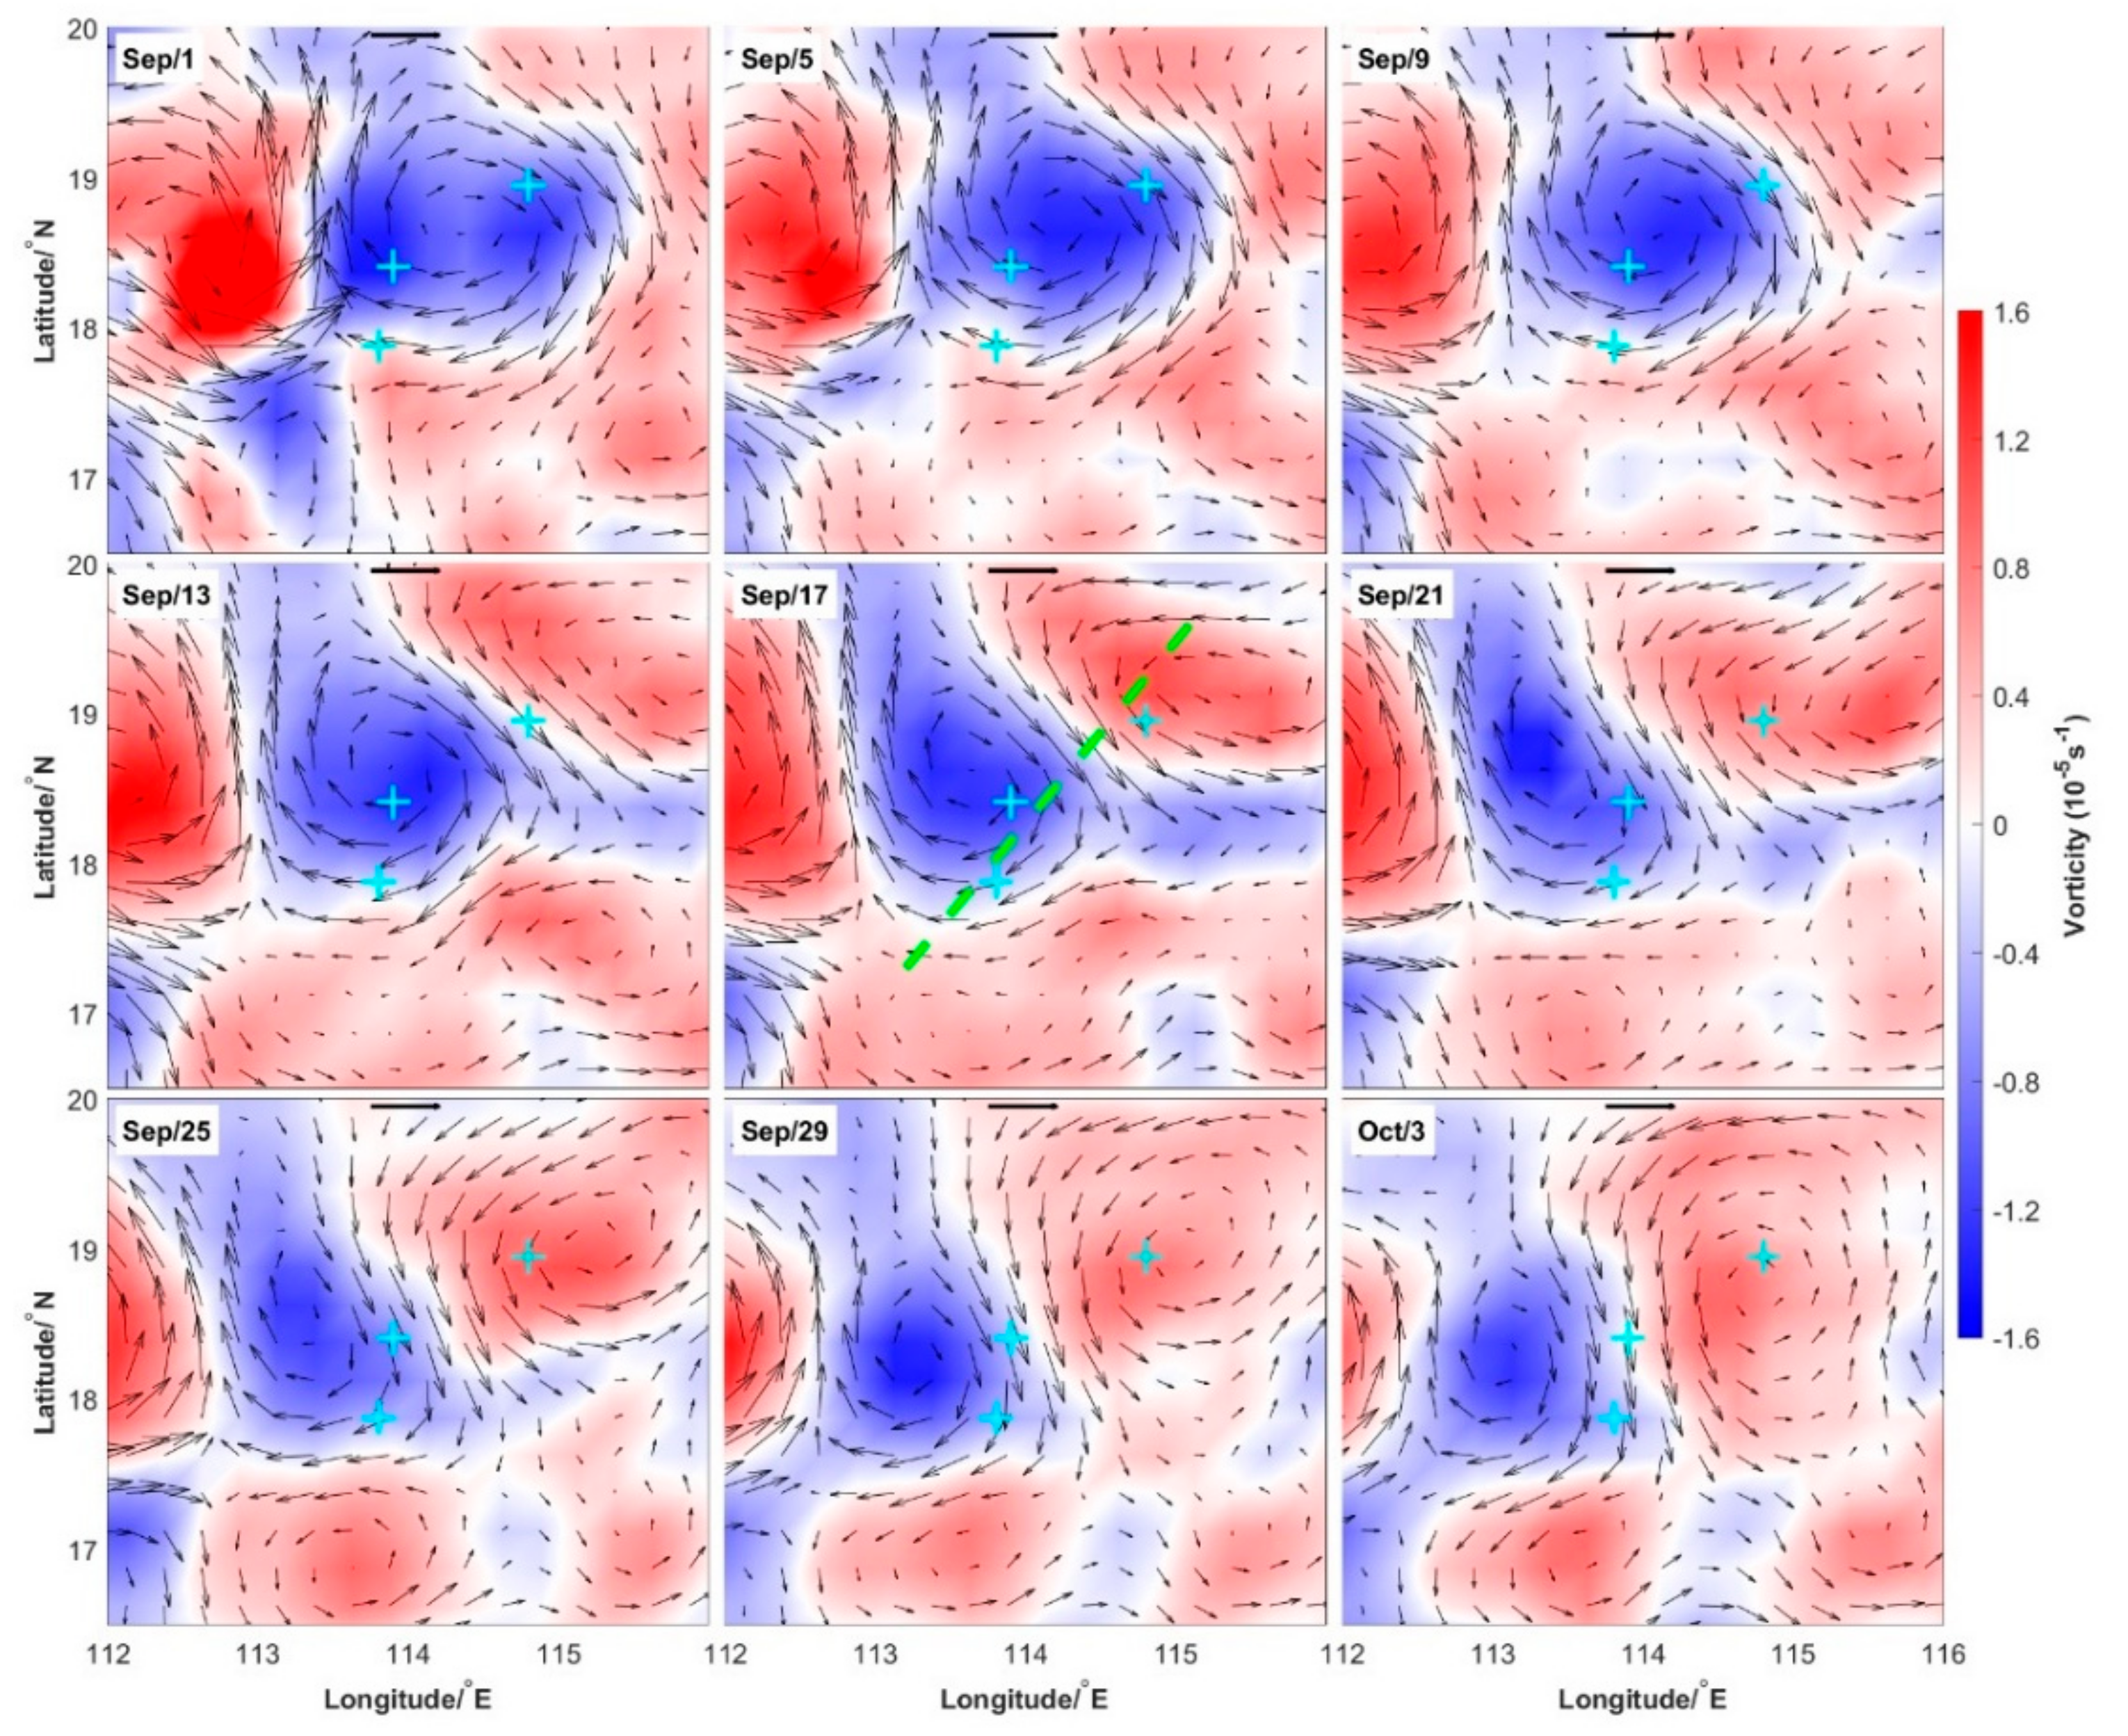
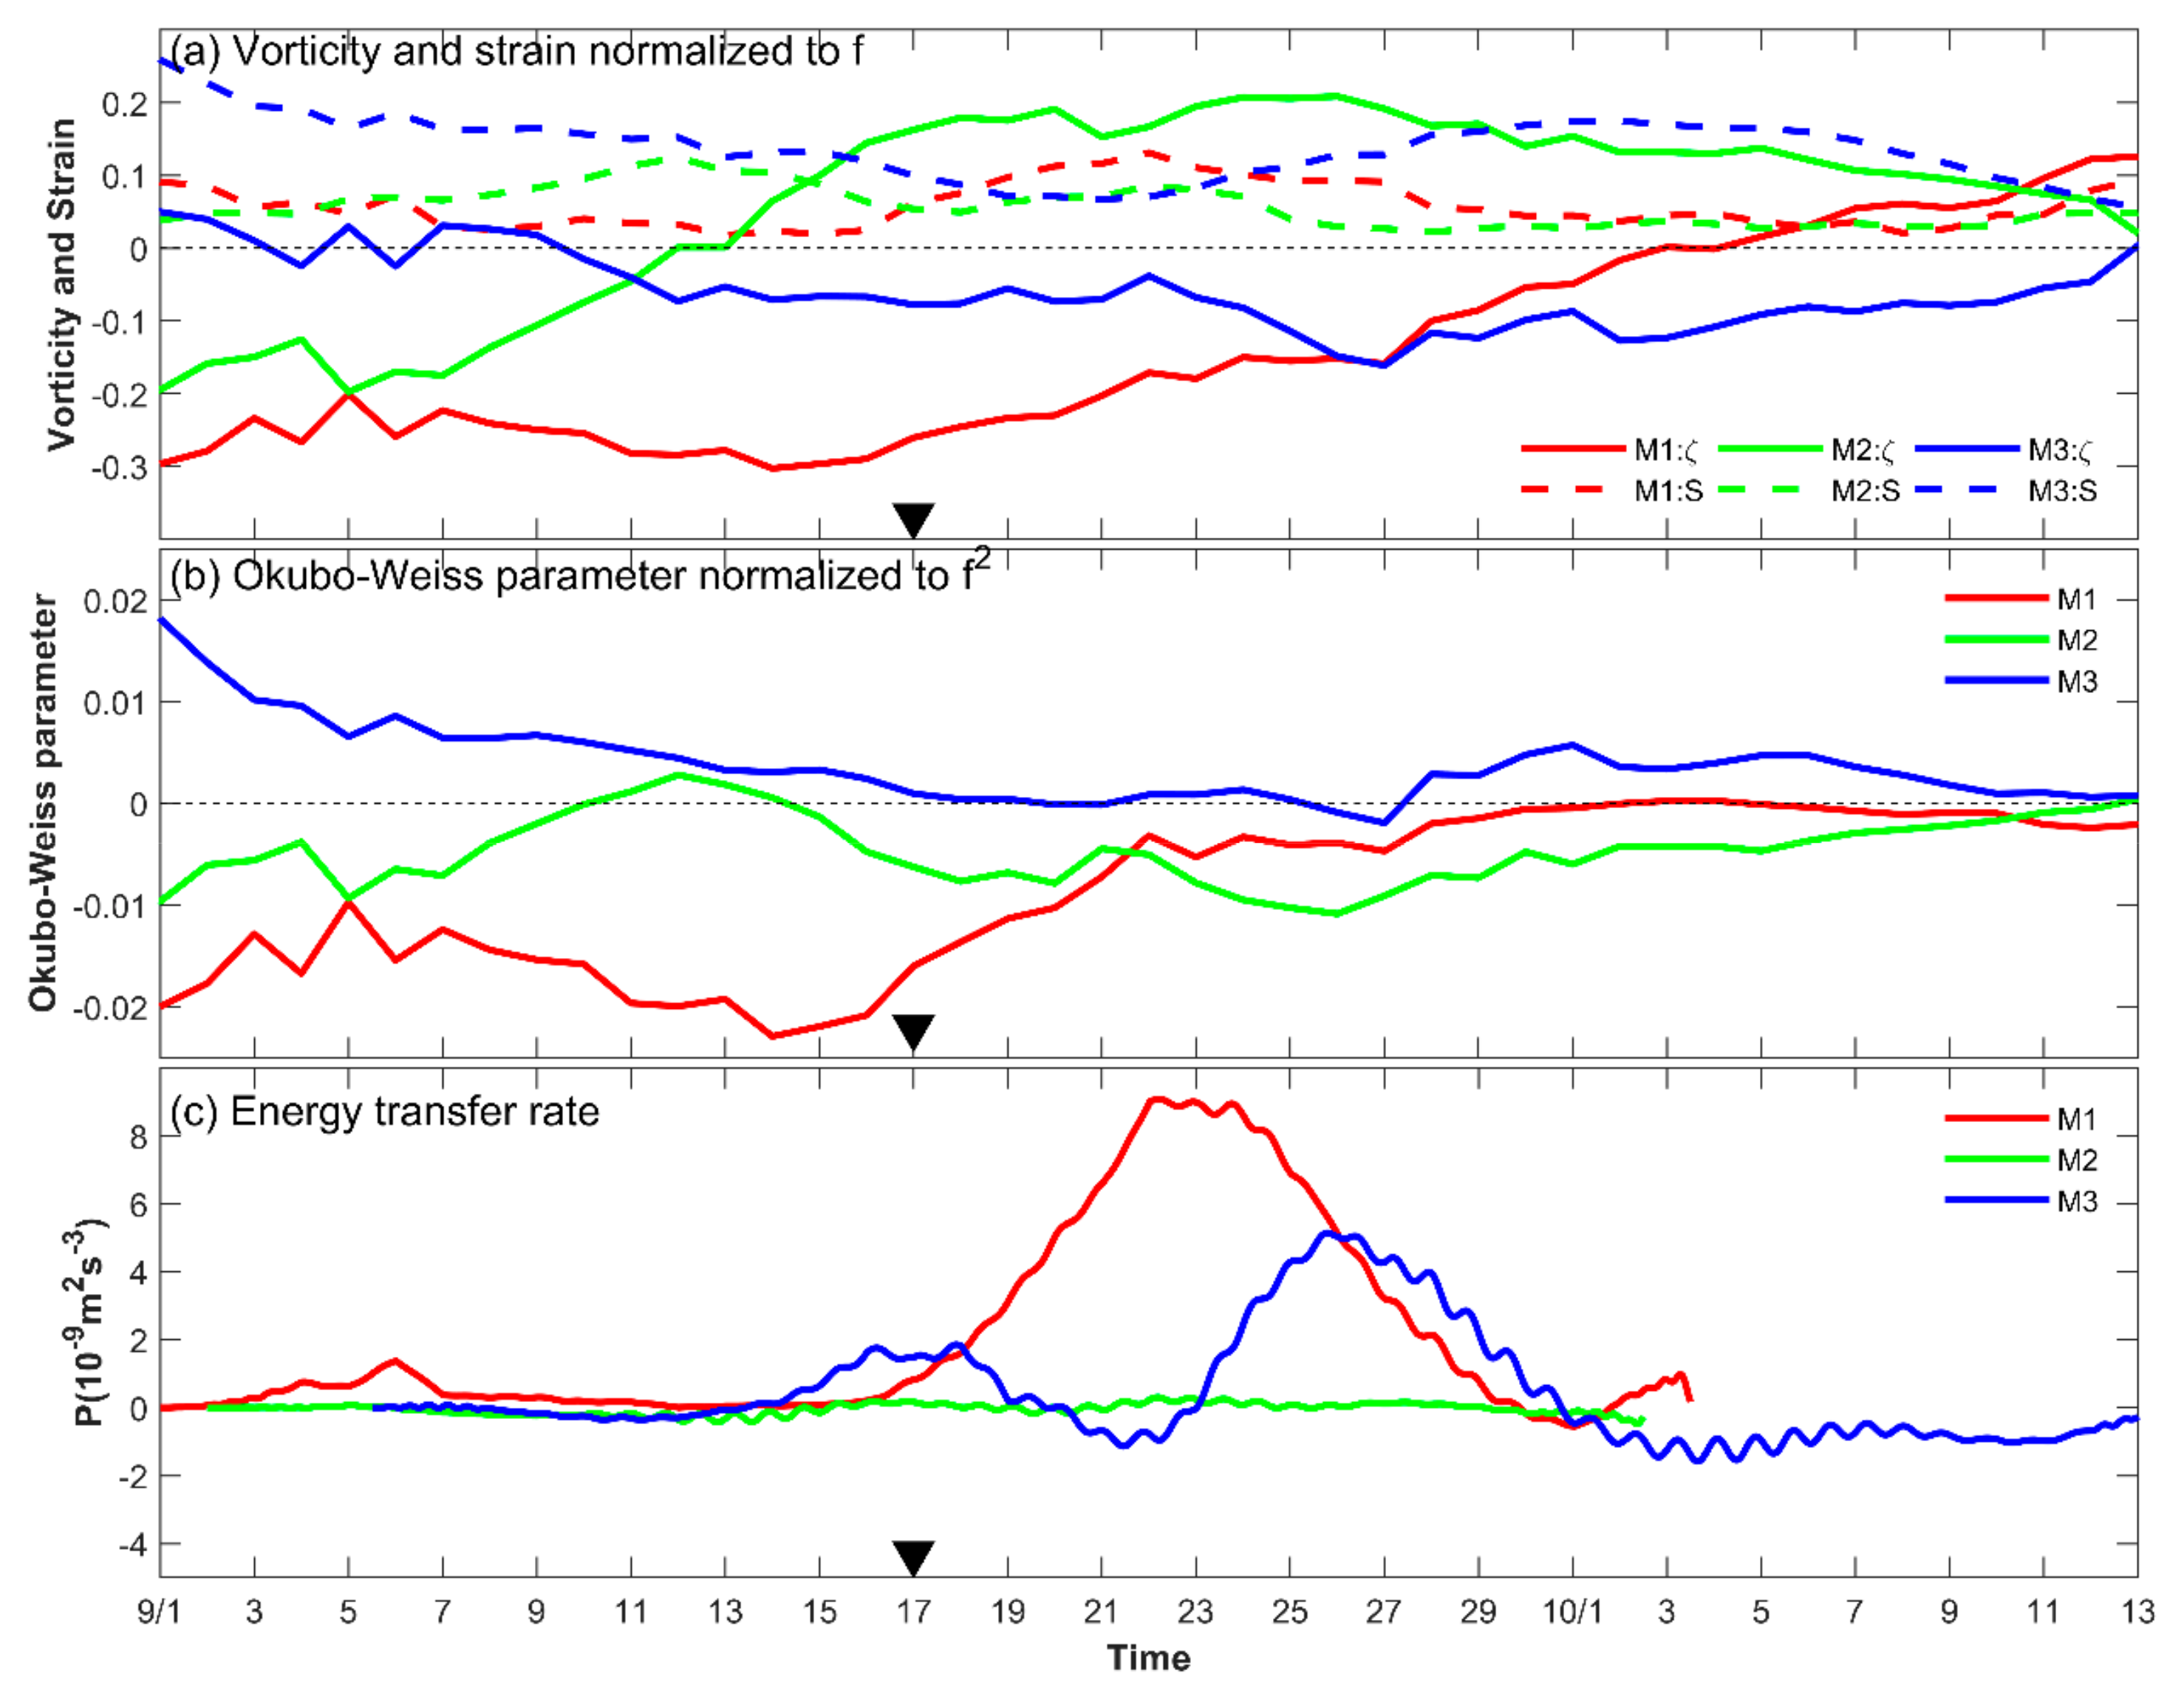
Mesoscale eddies can modify the frequency and propagation of NIWs [18]. The relative vorticity and geostrophic currents from the satellite altimeter are shown in Figure 10. Before the approach of Noul, the moorings were affected by an anticyclonic eddy with maximum relative vorticity reaching −1.6 × 10⁻⁵ s−1 (approximately 0.30 f). The eddy had a radius of about 50 km and maximum angular velocity of 0.50 m/s. When the wind field of Noul influenced the moorings on September 17, M1, M2, and M3 were in the center, at the northeast, and at the southern rim of the eddy, respectively. Evolution patterns of the vorticity, strain, Okubo–Weiss parameter, and energy transfer rate from mesoscale field to NIWs are shown in Figure 11. Red-shifts of NIWs in M1 and M3 are related to the negative relative vorticity, and the blue-shift of NIWs in M2 is related to the positive relative vorticity. The total shear and relative vorticity of geostrophic currents were comparable according to the evolution of the Okubo–Weiss parameter from September 22. Consequently, there exists evident energy transfer from mesoscale field to NIWs, with maximum values of about 8.5 × 10⁻⁹ m2 s−3 in M1 and M3. However, there was no significant energy transfer from the mesoscale field to NIWs in M2.
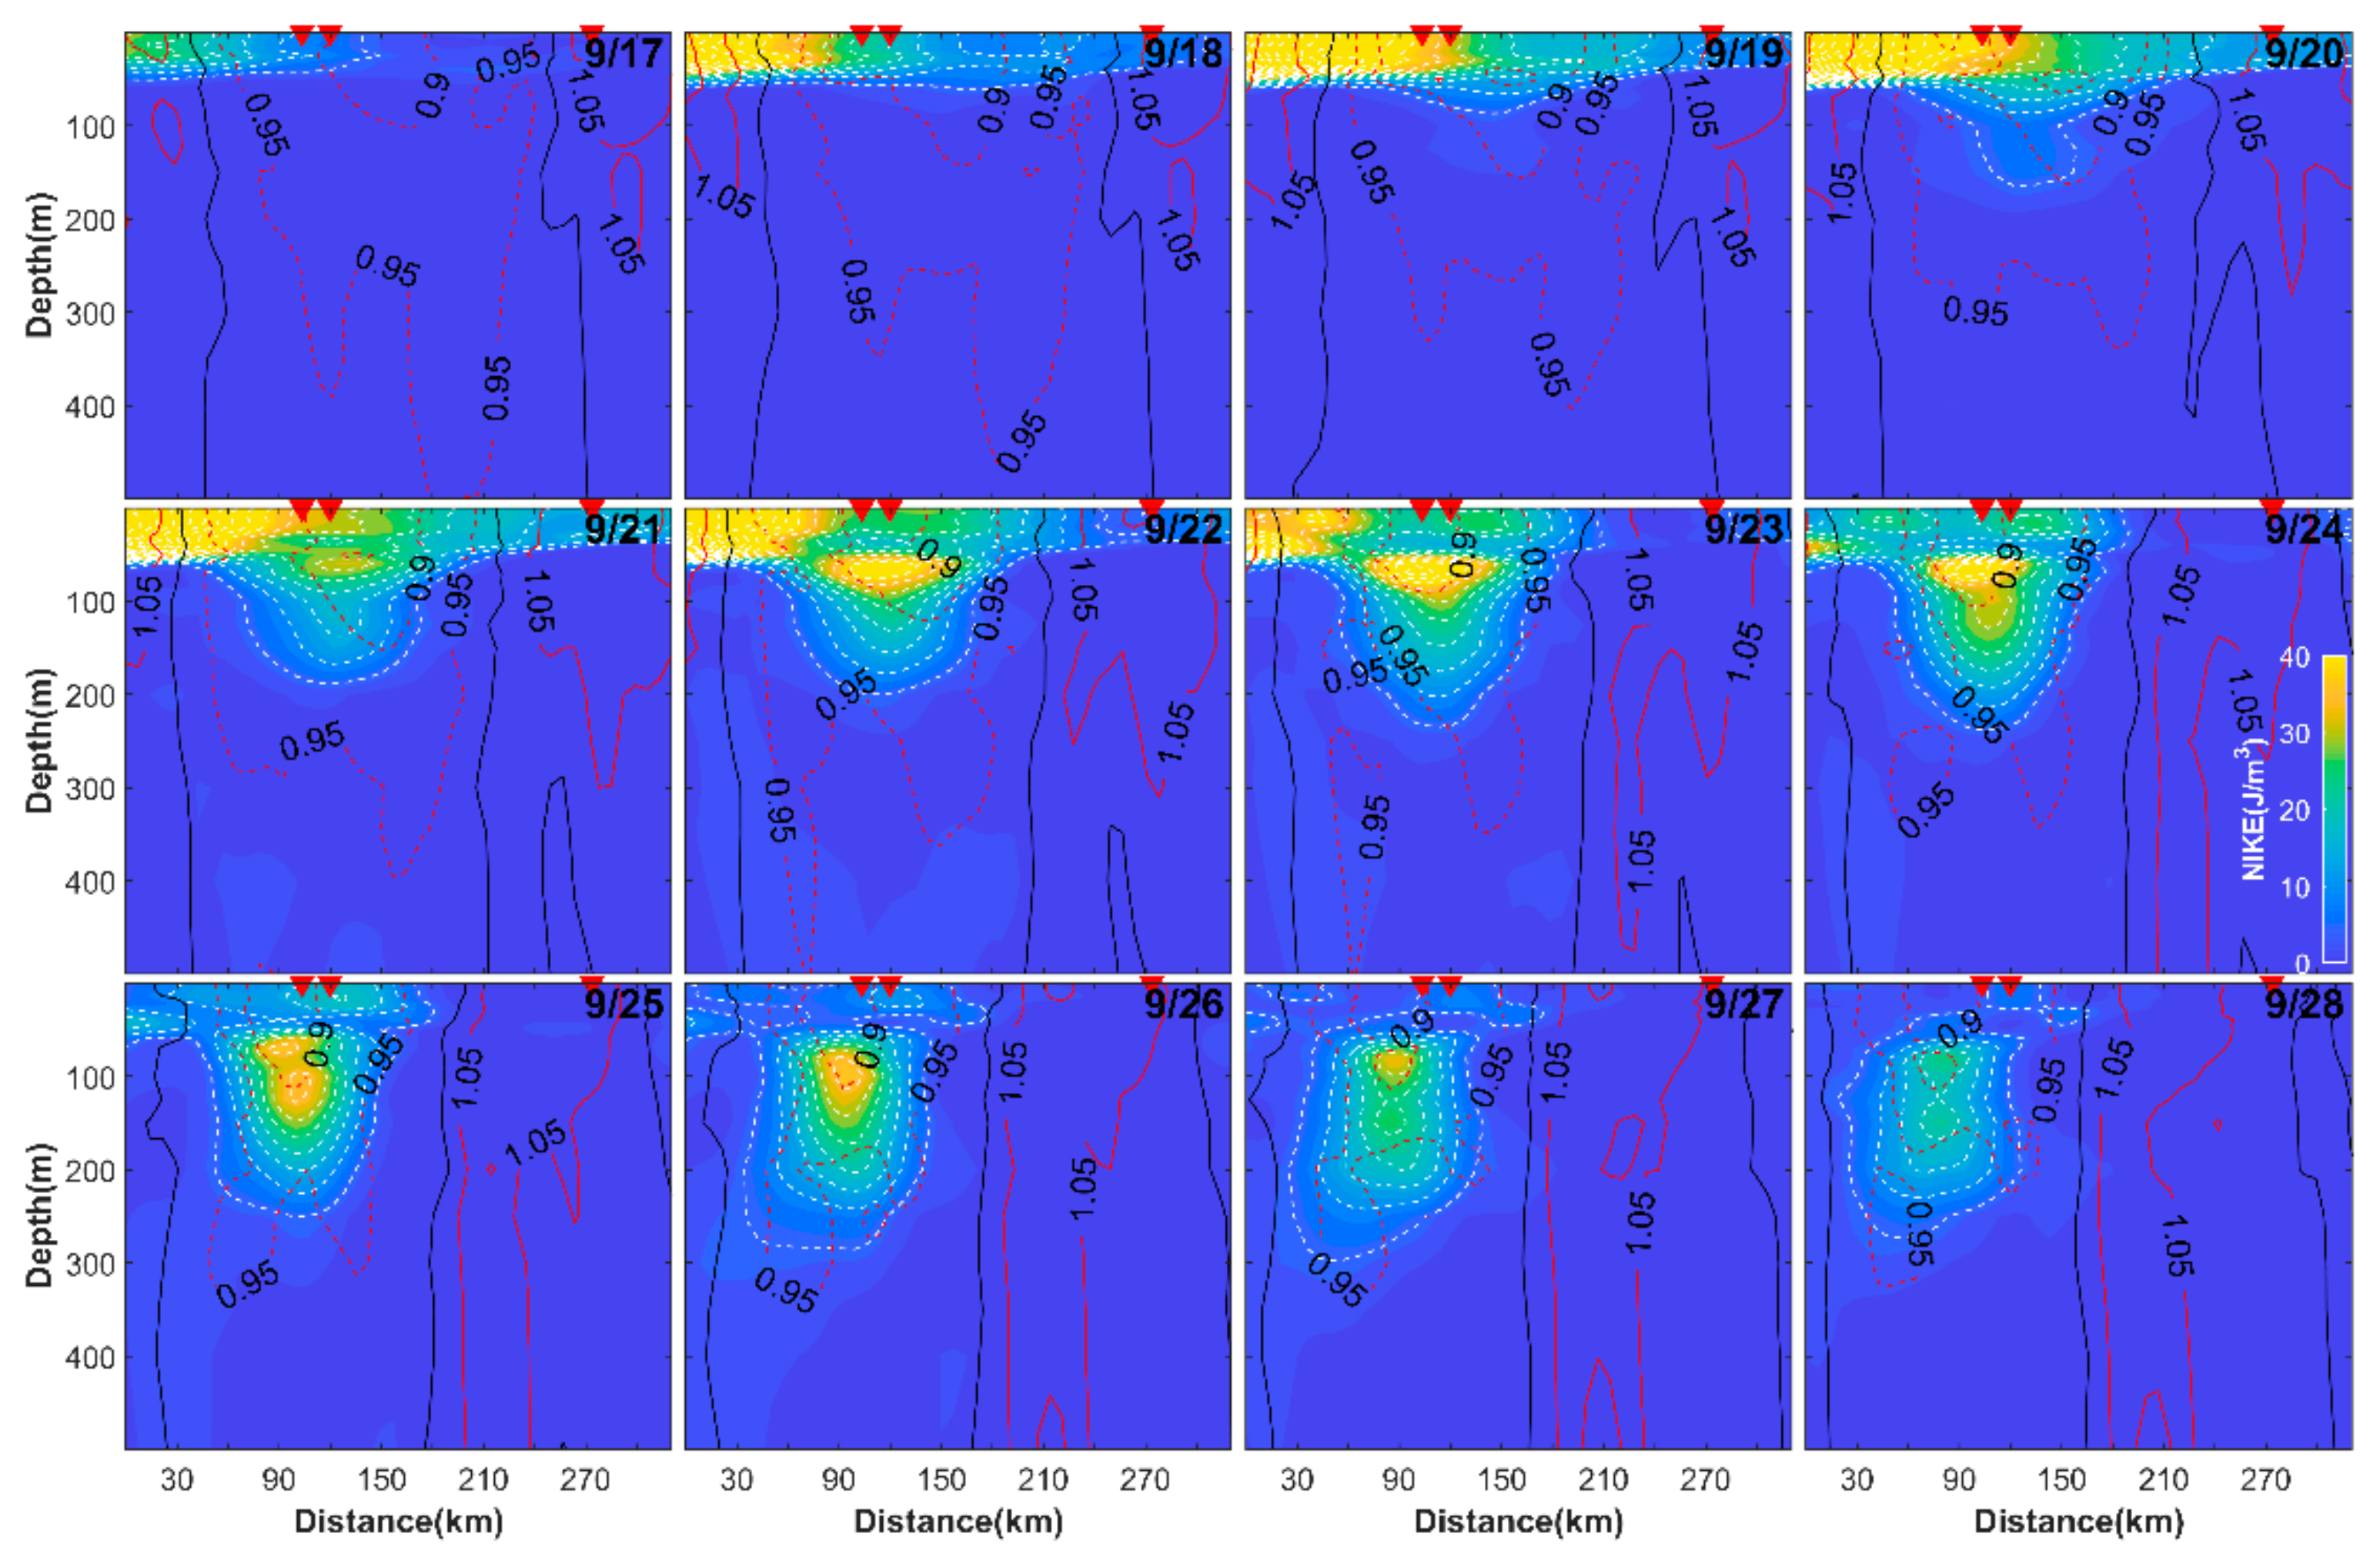
Altimeter remote sensing absolute dynamic topography suggests that the HYCOM analysis data reproduced the anticyclonic eddy due to the assimilation of AVISO data in HYCOM. Moreover, NIWs modelled by the HYOM data evolved in a similar way compared with the observed NIWs. Consequently, the HYCOM data can be used to detect the influence of mesoscale eddies on the observed NIWs. Figure 12 shows the evolution of NIKE and effective Coriolis frequencies along the section in the central subfigure of Figure 10 based on the HYCOM dataset. In the surface layer, high NIKE emerged on September 17 and continued to be enhanced until September 19. Given that M1 was approximately in the center of an anticyclonic eddy on September 17 (see Figure 10), the NIKE is supposed to propagate under the influence of the eddy. On September 20, the NIKE commenced evident downward propagation that lasted until September 28.
The contour of 5 J/m3 extended to 290 m on September 27 in spite of NIKE in the surface layer nearly dissipating. There was a subsurface NIKE core that formed on September 21 and propagated to 100–200 m on September 28. The locations of the subsurface NIKE core migrated with the movement of the anticyclonic eddy, which moved southwestward. The consistency between the location of the subsurface NIKE core and that of the anticyclonic eddy suggests that the NIWs were trapped by the eddy, and the relative vorticity of the eddy promoted the downward propagation of NIKE [1,18]. The results from the HYCOM data, which shows that the effective Coriolis frequencies are higher than unity in M2 and lower than unity in M1 and M3, also verified the modification of frequencies of NIWs by background vorticity.

4. Discussion

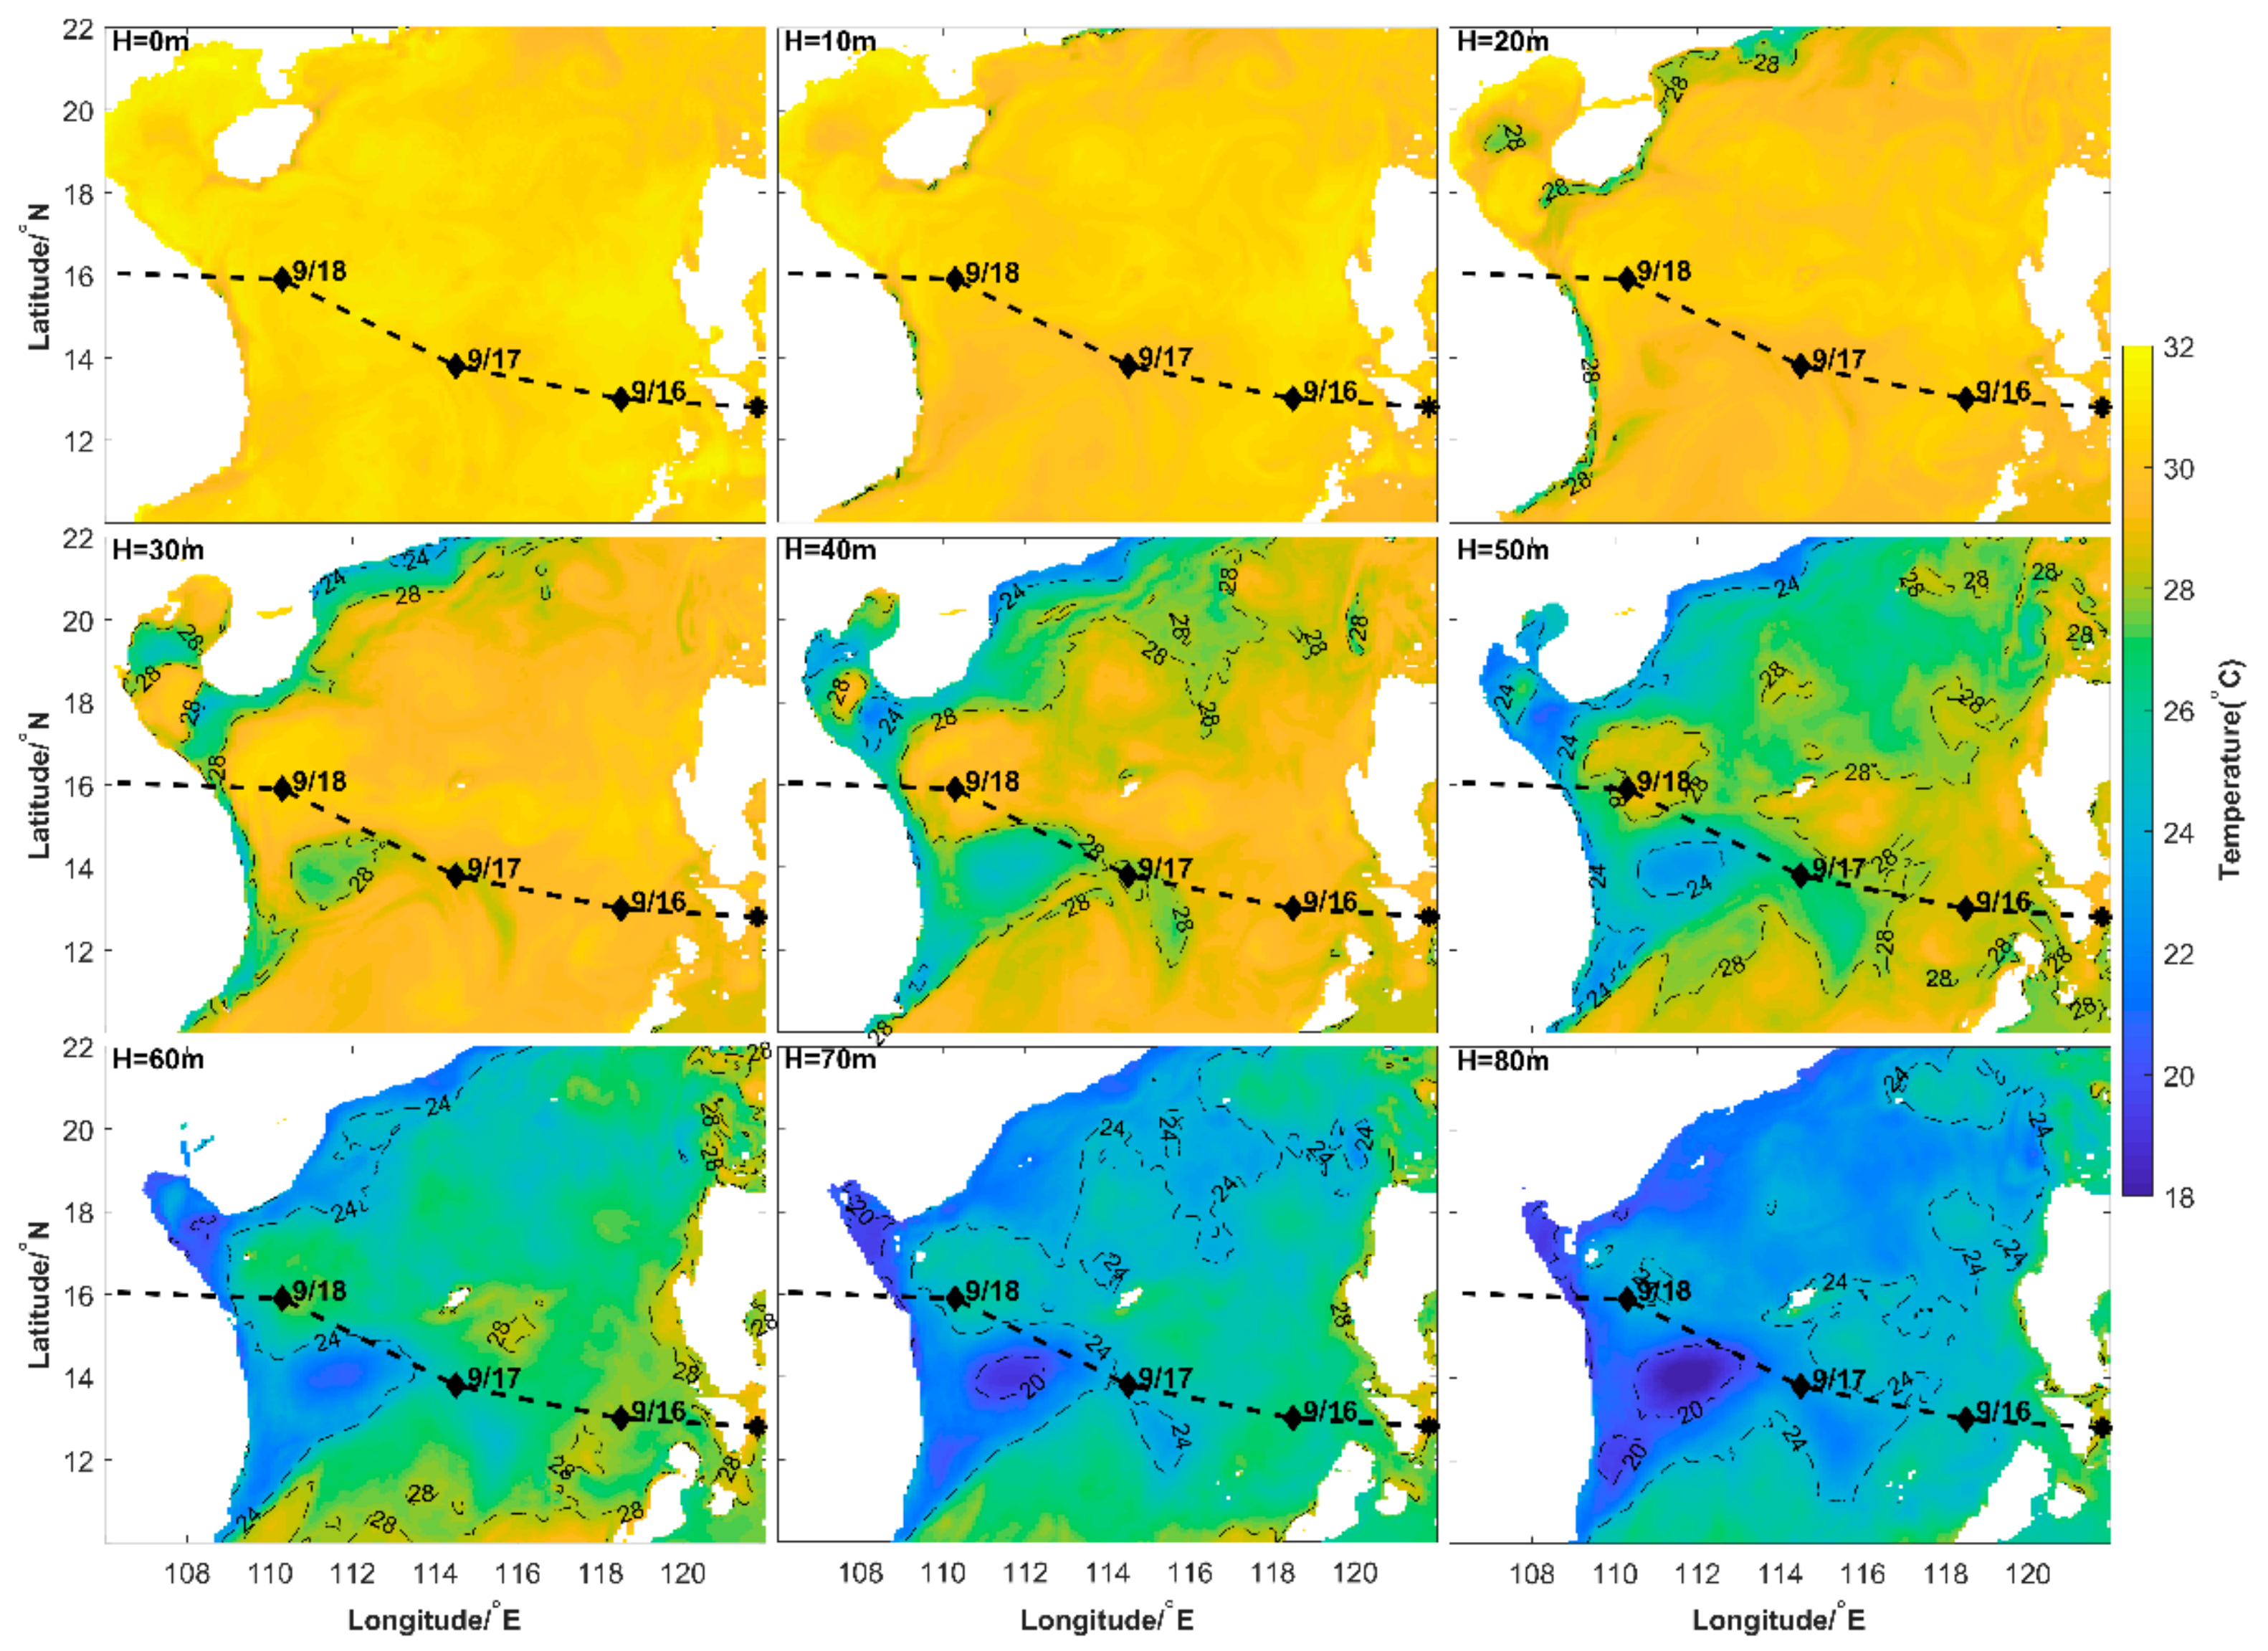
Noul, with maximum wind speed of 23 m/s, was a tropical cyclone in the tropical storm category. Consequently, the SST anomaly induced by Noul was relatively weak, with maximum surface cooling of −1.95 °C. The unusual left-hand bias of surface cooling was distinctive from previous research and was related to the initial oceanic status. The sea surface cooling induced by tropical cyclones mainly resulted from vertical entrainment and inertial pumping. The entrainment and inertial pumping are generally more powerful on the right-hand side of the track of tropical cyclone because of the stronger and clockwise rotating wind, and consequently lead to left-hand bias of surface cooling. According to the HYCOM dataset, the MLD around the track of Noul deepened significantly after the passage of Noul, and the maximum MLD deepening reached 50 m. The vertical profile of water temperature prior to the passage of Noul obtained from the HYCOM dataset are shown in Figure 13. There was a stripe of colder water on the left-hand side of the track of Noul, which became significant from 30 m to 80 m. Consequently, the vertical entrainment accompanied by Noul entrained colder water up at the left-hand side of Noul’s track and led to the left-hand side bias of surface cooling.
Despite the relatively weak intensity of Noul, energetic NIWs emerged at M1 and M3, which were about 300 km away from the center of Noul. Moreover, in the results of the slab model, the near-inertial energy flux from wind to ocean was insignificant in M2, indicating that NIWs in M2 were not stimulated by the winds of Noul. The probable reason is that M2 was outside of the 15 m/s wind radius of Noul, and the rate of change of wind in M2 was insufficient (see Figure 7b). The HYCOM dataset reproduced the evolution of NIWs despite the modelled near-inertial currents being larger than the observations.
The southwestward moving anticyclonic mesoscale eddy affected the frequency, e-folding time, and propagation of the observed NIWs. Negative relative vorticity resulted in red-shifts of NIWs in M1 and M3, and the positive relative vorticity led to blue-shift of NIWs in M2. Our results were consistent with the theory that anticyclonic mesoscale eddy facilitates energy transfer from mesoscale field to NIWs [54,55]. The energy transfer from mesoscale field to NIWs at M1 and M3, whose maximum value was 8.5 × 10⁻⁹ m2 s−3, was much greater than previous reports in the southwestern Japan Sea [56]. When the mixed layer NIKE dissipated, the subsurface NIKE around the mesoscale eddy still persisted, suggesting that the anticyclonic mesoscale eddy with negative vorticity trapped the NIWs [57,58]. The trapping effect is supposed to induce the larger e-folding time of NIWs in M3. While the energy propagation rate of downward-propagating NIWs overwhelmed that of upward propagating NIWs, the upward group speeds of NIWs in M2 and M3 were nearly threefold and twofold the downward group speed of NIWs. Upward propagation of near-inertial energy emerged at the end stage of NIWs in the three moorings (see Figure 8), which may have been caused by the reflection of subsurface layer NIWs.

5. Conclusions

Based on in situ observations, remote sensing, and reanalysis of data, characteristics of NIWs in the northern SCS induced by tropical storm Noul were analyzed. The in situ observations comprised three moorings that were under the influence of mesoscale eddies during the observation period. Noul had a maximum wind speed of 23 m/s, and consequently the sea surface cooling induced by Noul had a maximum value of only –1.95 °C and showed a left-hand bias instead of the more common right-hand bias.
Spectral analysis suggests that the near-inertial, diurnal, and semidiurnal frequency motions dominated the velocity field of the three moorings. The near-inertial currents had an amplitude of 0.21 m/s for M1 and M3, and 0.14 m/s for M2. For M1, the NIKE had a maximum value of 7.5 J/m3 and increased abruptly after the passage of typhoon Noul on September 17. There was a time lag of NIKE maximum with increasing depth, and the estimated group speed was 10 m/day. NIKE in M2 had a maximum value of 4.0 J/m3, weaker than those in M1 and M3. For M3, NIKE increased after the passage of Noul, and the maximum NIKE was 6 J/m3. The e-folding times of NIWs in M1, M2, and M3 were 4–7, 5–6, and 11–13 days. The larger e-folding time of M3 is related to the negative relative vorticity.
The NIWs in the three mooring stations have dominant downward propagation of energy concentrated in smaller wavenumber bands (<2 × 10⁻² cpsm). Upward propagation of near-inertial energy emerges at the end of each NIW episode and at the beginning of NIW episodes in M3. The upward propagation of energy at the end stage of each NIWs is thought to be related to the reflection of NIWs within the negative vorticity mesoscale eddy. The spectral density of downward propagating near-inertial energy exceeded 6 × 10⁻⁴ m2 s−2 cpsm−1; however, the spectral density of upward propagating near-inertial energy had a maximum value of about –2 × 10⁻⁴ m2 s−2 cpsm−1.
NIWs in M1 had red-shifted frequencies, and the depth-mean frequency was about 0.95 f. The phase of NIWs in M1 shows an evident depth-leading trend indicating upward propagating phase speed and downward propagating group speed. The vertical phase speed and wavelength of NIWs in M1 were 3.53 m/h and 134 m, respectively. The frequency of NIWs in M2 shows a slight blue-shift, with a depth-mean value of about 1.03 f. NIWs in M2 and M3 show both upward and downward propagating phase speeds. The downward and upward phase speeds of NIWs in M2 were 1.08 m/h and 3.18 m/h. The upward and downward phase speeds of NIWs in M3 were 4.58 m/h and 2.69 m/h. The frequency shifts of NIWs are consistent with the background relative vorticity.
M1 and M3 were affected by an anticyclonic eddy with maximum relative vorticity reaching about −0.30 f, corresponding to an effective Coriolis frequency of 1.15 f. Red-shifts of NIWs in M1 and M3 were caused by the negative relative vorticity, and the blue-shift of NIWs in M2 was induced by the positive relative vorticity [1,18]. There exists evident energy transfer from mesoscale field to NIWs, with maximum values of about 8.5 × 10⁻⁹ m2 s−3 in M1 and M3, where the total shear and relative vorticity have comparable values. Mesoscale eddies occur frequently in the northern SCS, and our results suggest that mesoscale eddies are potential factors influencing the generation and propagation of NIWs.

Author Contributions

Conceptualization, P.H. and Y.H.; methodology, B.Y.; investigation, B.Y.; data curation, B.Y.; writing—original draft preparation, B.Y.; writing—review and editing, P.H.; visualization, B.Y.; supervision, Y.H.; project administration, P.H.; funding acquisition, P.H. and B.Y. All authors have read and agreed to the published version of the manuscript.

Funding

This research was funded by the Natural Key Research and Development Program of China, grant number 2016YFC1400104, and the National Natural Science Foundation of China, grant number 41706017.

Institutional Review Board Statement

Not applicable.

Informed Consent Statement

Not applicable.

Data Availability Statement

The data presented in this study are available on request from the corresponding author.

Acknowledgments

Data of the tropical cyclones are available online at https://www.jma.go.jp/jma/indexe.html (accessed on 1 June 2021). The Remote Sensing Systems sea surface temperature data are available at http://www.remss.com/ (accessed on 1 June 2021). The ERA5 wind products are available at https://www.ecmwf.int/en/forecasts/dataset/ecmwf-reanalysis-v5 (accessed on 1 June 2021). The absolute dynamic topography and geostrophic current data from AVISO dataset is available at https://www.aviso.altimetry.fr/en/data.html (accessed on 1 June 2021). The HYCOM+NCODA Global Analysis data are available at https://www.hycom.org/dataserver/gofs-3pt1/analysis (accessed on 1 June 2021). The TPXO 7.2 dataset are available at https://www.tpxo.net/home (accessed on 1 June 2021). The processed mooring data used to construct figures in this work are also available, and anyone who wants to get access to these data could contact the corresponding author.

Conflicts of Interest

The authors declare no conflict of interest. The funders had no role in the design of the study; in the collection, analyses, or interpretation of data; in the writing of the manuscript, or in the decision to publish the results.

References

  1. Alford, M.H.; MacKinnon, J.A.; Simmons, H.L.; Nash, J.D. Near-inertial internal gravity waves in the ocean. Annu. Rev. Mar. Sci. 2016, 8, 95–123. [Google Scholar] [CrossRef] [Green Version]
  2. MaKinnon, J.A.; Winters, K.B. Subtropical catastrophe: Significant loss of low-mode tidal energy at 28.9°. Geophys. Res. Lett. 2005, 32, L15605. [Google Scholar] [CrossRef] [Green Version]
  3. Nikurashin, M.; Ferrari, R. Radiation and dissipation of internal waves generated by geostrophic motions impinging on small-scale topography: Theory. J. Phys. Oceanogr. 2010, 40, 1055–1074. [Google Scholar] [CrossRef]
  4. Rossby, C.G. On the mutual adjustment of pressure and velocity distributions in certain simple current systems, II. J. Mar. Res. 1937, 1, 239–263. [Google Scholar] [CrossRef]
  5. Gill, A.E. On the behavior of internal waves in the wakes of storms. J. Phys. Oceanogr. 1984, 14, 1129–1151. [Google Scholar] [CrossRef] [Green Version]
  6. D’Asaro, E.A. A collection of papers on the ocean storms experiment. J. Phys. Oceanogr. 1995, 25, 2817–2818. [Google Scholar] [CrossRef]
  7. Moehlis, J.; Llewellyn-Smith, S.G. Radiation of mixed layer near-inertial oscillations into the ocean interior. J. Phys. Oceanogr. 2001, 31, 1550–1560. [Google Scholar] [CrossRef]
  8. Alford, M.H. Improved global maps and 54-year history of wind-work on ocean inertial motions. Geophys. Res. Lett. 2003, 30, 1424. [Google Scholar] [CrossRef] [Green Version]
  9. Jiang, J.; Lu, Y.; Perrie, W. Estimating the energy flux form the wind to ocean inertial motions: The sensitivity to surface wind fields. Geophys. Res. Lett. 2005, 32, L15610. [Google Scholar] [CrossRef]
  10. Furuichi, N.; Hibiya, T.; Niwa, Y. Model-predicted distribution of wind-induced internal wave energy in the world’s oceans. J. Geophys. Res. 2008, 113, C09034. [Google Scholar] [CrossRef]
  11. Simmons, H.L.; Alford, M.H. Simulating the long-range swell of internal waves generated by ocean storms. Oceanography 2012, 25, 30–41. [Google Scholar] [CrossRef]
  12. Rimac, A.; von Storch, J.S.; Eden, C.; Haak, H. The influence of high-resolution wind stress field on the power input to near-inertial motions in the ocean. Geophys. Res. Lett. 2013, 40, 4882–4886. [Google Scholar] [CrossRef]
  13. Egbert, G.D.; Erofeeva, S.Y. Efficient inverse modeling of barotropic ocean tides. J. Atmos. Ocean. Technol. 2002, 19, 183–204. [Google Scholar] [CrossRef] [Green Version]
  14. Wunsch, C. The work done by the wind on the oceanic general circulation. J. Phys. Oceanogr. 1998, 28, 2332–2340. [Google Scholar] [CrossRef]
  15. Price, J.F. Internal wave wake of a moving storm. part I. scales, energy budget and observations. J. Phys. Oceanogr. 1983, 13, 949–965. [Google Scholar] [CrossRef] [Green Version]
  16. Cuypers, Y.; Vaillant, X.L.; Bouruet-Aubertot, P.; Vialard, J.; McPhaden, M.J. Tropical storm induced near-inertial internal waves during the Cirene experiment: Energy fluxes and impact on vertical mixing. J. Geophys. Res. Ocean. 2013, 118, 358–380. [Google Scholar] [CrossRef] [Green Version]
  17. Garrett, C. What is the “near-inertial” band and why is it different from the rest of the internal wave spectrum? J. Phys. Oceanogr. 2001, 31, 962–971. [Google Scholar] [CrossRef]
  18. Kunze, E. Near-inertial wave propagation in geostrophic shear. J. Phys. Oceanogr. 1985, 15, 544–565. [Google Scholar] [CrossRef]
  19. Yang, B.; Hou, Y.J. Near-inertial waves in the wake of 2011 Typhoon Nesat in the northern South China Sea. Acta Oceanol. Sin. 2014, 33, 102–111. [Google Scholar] [CrossRef]
  20. Yang, B.; Hou, Y.J.; Hu, P.; Liu, Z.; Liu, Y.H. Shallow ocean response to tropical cyclones observed on the continental shelf of the northwestern South China Sea. J. Geophys. Res. Ocean. 2015, 120, 3817–3836. [Google Scholar] [CrossRef]
  21. Wang, G.H.; Su, J.L.; Ding, Y.H.; Chen, D. Tropical cyclone genesis over the South China Sea. J. Mar. Syst. 2007, 68, 318–326. [Google Scholar] [CrossRef]
  22. Sun, L.; Zheng, Q.A.; Tang, T.Y.; Chuang, W.S.; Li, L.; Hu, J.Y.; Wang, D.X. Upper ocean near-inertial response to 1998 Typhoon Faith in the South China Sea. Acta Oceanol. Sin. 2012, 31, 25–32. [Google Scholar] [CrossRef]
  23. Chen, G.X.; Xue, H.J.; Wang, D.X.; Xie, Q. Observed near-inertial kinetic energy in the northwestern South China Sea. J. Geophys. Res. Ocean. 2013, 118, 4965–4977. [Google Scholar] [CrossRef] [Green Version]
  24. Yang, B.; Hou, Y.J.; Hu, P. Observed near-inertial waves in the wake of Typhoon Hagupit in the northern South China Sea. Chin. J. Oceanol. Limnol. 2015, 33, 1265–1278. [Google Scholar] [CrossRef]
  25. Cao, A.; Guo, Z.; Song, J.; Lv, X.; He, H.; Fan, W. Near-inertial waves and their underlying mechanisms based on the South China Sea internal wave experiment (2010–2011). J. Geophys. Res. Ocean. 2018, 123, 5026–5040. [Google Scholar] [CrossRef]
  26. Ma, Y.; Zhang, S.; Qi, Y.; Jing, Z. Upper ocean near-inertial response to the passage of two sequential typhoons in the northwestern South China Sea. Sci. China Earth Sci. 2019, 62, 863–871. [Google Scholar] [CrossRef]
  27. Wang, G.; Li, D.; Wei, Z.; Li, S.; Wang, Y.; Xu, T. Observed near-inertial waves in the wake of typhoon Linfa (2015) in the northern South China Sea. J. Ocean Univ. China 2019, 18, 1013–1021. [Google Scholar] [CrossRef]
  28. Li, R.X.; Chen, C.S.; Dong, W.J.; Beardsley, R.C.; Wu, Z.X.; Gong, W.P.; Liu, Y.Q.; Liu, T.M.; Xu, D.Y. Slope-intensified storm-induced near-inertial oscillations in the South China Sea. J. Geophys. Res. Oceans 2021, 126, e2020JC016713. [Google Scholar] [CrossRef]
  29. Ding, W.; Liang, C.; Liao, G.; Li, J.; Lin, F.; Jin, W.; Zhu, L. Propagation characteristics of near-inertial waves along the continental shelf in the wake of the 2008 typhoon Hagupit in the northers South China Sea. Bull. Mar. Sci. 2018, 94, 1293–1311. [Google Scholar] [CrossRef]
  30. Wu, R.; Zhang, H.; Chen, D.; Li, C.; Lin, J. Impact of typhoon Kalmaegi (2014) on the South China Sea: Simulations using a fully coupled atmosphere-ocean-wave model. Ocean Model. 2018, 131, 132–151. [Google Scholar] [CrossRef]
  31. Xu, J.; Huang, Y.; Chen, Z.; Liu, J.; Liu, T.; Li, J.; Cai, S.; Ning, D. Horizontal variations of typhoon-forced near-inertial oscillations in the South China Sea simulated by a numerical model. Cont. Shelf Res. 2019, 180, 24–34. [Google Scholar] [CrossRef]
  32. Cao, A.; Guo, Z.; Pan, Y.H.; Song, J.B.; He, H.L.; Li, P.L. Near-inertial waves induced by Typhoon Megi (2010) in the South China Sea. J. Mar. Sci. Eng. 2021, 9, 440. [Google Scholar] [CrossRef]
  33. Sun, L.; Zheng, Q.A.; Wang, D.X.; Hu, J.Y.; Tai, C.K.; Sun, Z.Y. A case study of near-inertial oscillation in the South China Sea using mooring observations and satellite altimeter data. J. Oceanogr. 2011, 67, 677–687. [Google Scholar] [CrossRef]
  34. Sun, Z.Y.; Hu, J.Y.; Zheng, Q.A.; Li, C.Y. Strong near-inertial oscillations in geostrophic shear in the northern South China Sea. J. Oceanogr. 2011, 67, 377–384. [Google Scholar] [CrossRef]
  35. Guan, S.D.; Zhao, W.; Huthnance, J.; Tian, J.W.; Wang, J.H. Observed upper ocean response to typhoon Megi (2010) in the Northern South China Sea. J. Geophys. Res. Ocean. 2014, 119, 3134–3157. [Google Scholar] [CrossRef] [Green Version]
  36. Shen, J.Q.; Fang, W.D.; Zhang, S.W.; Qiu, Y.; Zhang, J.P.; Xie, X.H. Observed internal tides and near-inertial waves in the northern South China Sea: Intensified f-band energy induced by Parametric Subharmonic Instability. J. Geophys. Res. Ocean. 2020, 125, e2020JC016324. [Google Scholar] [CrossRef]
  37. Liu, J.; He, Y.; Li, J.; Cai, S.; Wang, D.; Huang, Y. Case study of nonlinear interaction between near-inertial waves induced by typhoon and diurnal tides near Xisha Islands. J. Geophys. Res. Ocean. 2018, 123, 2768–2784. [Google Scholar] [CrossRef]
  38. Boyer, A.L.; Alford, M.H.; Pinkel, R.; Hennon, T.D.; Yang, Y.J.; Ko, D.; Nash, J. Frequency shift of near-inertial waves in the South China Sea. J. Phys. Oceanogr. 2020, 50, 1121–1135. [Google Scholar] [CrossRef] [Green Version]
  39. Gonella, J. A rotary-component method for analyzing meteorological and oceanographic vector time series. Deep Sea Res. Oceanogr. Abstr. 1972, 19, 833–846. [Google Scholar] [CrossRef]
  40. Byun, S.S.; Park, J.J.; Chang, K.I.; Schmitt, R.W. Observation of near-inertial wave reflections within the thermostad layer of an anticyclonic mesoscale eddy. Geophys. Res. Lett. 2010, 37, L01606. [Google Scholar] [CrossRef] [Green Version]
  41. Pollard, R.T.; Millard, R.C. Comparison between observed and simulated wind-generated inertial oscillations. Deep Res. Oceanogr. Abstr. 1970, 17, 813–821. [Google Scholar] [CrossRef]
  42. D’Asaro, E.A. The energy flux from the wind to near-inertial motions in the surface mixed layer. J. Phys. Oceanogr. 1985, 15, 1043–1059. [Google Scholar] [CrossRef] [Green Version]
  43. Alford, M.H. Internal swell generation: The spatial distribution of energy flux from the wind to mixed layer near-inertial motions. J. Phys. Oceanogr. 2001, 31, 2359–2368. [Google Scholar] [CrossRef]
  44. Oey, L.Y.; Ezer, T.; Wang, D.; Fan, S.; Yin, X. Loop Current warming by Hurricane Wilma. Geophys. Res. Lett. 2006, 33, L08613. [Google Scholar] [CrossRef] [Green Version]
  45. Leaman, K.D.; Sanford, T.B. Vertical energy propagation of inertial waves: A vector spectral analysis of velocity profiles. J. Geophys. Res. 1975, 80, 1975–1978. [Google Scholar] [CrossRef]
  46. Liu, J.L.; Cai, S.Q.; Wang, S.G. Observations of strong near-bottom current after the passage of Typhoon Pabuk in the South China Sea. J. Mar. Res. 2011, 87, 102–108. [Google Scholar] [CrossRef]
  47. Silverthorne, K.E.; Toole, J.M. Seasonal kinetic energy variability of near-inertial motions. J. Phys. Oceanogr. 2009, 39, 1035–1049. [Google Scholar] [CrossRef]
  48. Alford, M.H.; Gregg, M.C. Near-inertial mixing: Modulation of shear, strain and microstructure at low latitude. J. Geophys. Res.-Ocean. 2001, 106, 16947–16968. [Google Scholar] [CrossRef]
  49. Okubo, A. Horizontal dispersion of floatable particles in the vicinity of velocity singularities such as convergences. Deep Res. Oceanogr. Abstr. 1970, 17, 445–454. [Google Scholar] [CrossRef]
  50. Jing, Z.; Chang, P.; Dimarco, S.F.; Wu, L. Observed energy exchange between low-frequency flows and internal waves in the Gulf of Mexico. J. Phys. Oceanogr. 2018, 48, 995–1008. [Google Scholar] [CrossRef]
  51. Polzin, K.L. Mesoscale eddy-internal wave coupling. Part II: Energetics and results from PolyMode. J. Phys. Oceanogr. 2010, 40, 789–801. [Google Scholar] [CrossRef]
  52. Price, J.F.; Sanford, T.B.; Forristall, G.Z. Forced stage response to a moving hurricane. J. Phys. Oceanogr. 1994, 24, 233–260. [Google Scholar] [CrossRef]
  53. Zhang, H.; Chen, D.; Zhou, L.; Liu, X.; Ding, T.; Zhou, B. Upper ocean response to typhoon Kalmaegi (2014). J. Geophys. Res. Ocean. 2016, 121, 6520–6535. [Google Scholar] [CrossRef]
  54. Whitt, D.B.; Thomas, L.N. Resonant generation and energetics of wind-forced near-inertial motions in a geostrophic flow. J. Phys. Oceanogr. 2015, 45, 181–208. [Google Scholar] [CrossRef]
  55. Jing, Z.; Wu, L.; Ma, X. Energy exchange between the mesoscale oceanic eddies and wind-forced near-inertial oscillations. J. Phys. Oceanogr. 2017, 47, 721–733. [Google Scholar] [CrossRef]
  56. Noh, S.; Nam, S. Observations of enhanced internal waves in an area of strong mesoscale variability in the southwestern East Sea (Japan Sea). Sci. Rep. 2020, 10, 9068. [Google Scholar] [CrossRef] [PubMed]
  57. Jeon, C.; Park, J.H.; Park, Y.G. Temporal and spatial variability of near-inertial waves in the East/Japan Sea from a high-resolution wind-forced ocean model. Geophys. Res. Ocean. 2019, 124, 6015–6029. [Google Scholar] [CrossRef]
  58. Kawaguchi, Y.; Wagawa, T.; Igeta, Y. Near-inertial internal waves and multiple-inertial oscillations trapped by negative vorticity anomaly in the central Sea of Japan. Progr. Oceanogr. 2020, 181, 102240. [Google Scholar] [CrossRef]
Figure 1. The track of the 2020 typhoon Noul with its six-hour positions denoted by asterisks (tropical depression) and squares (tropical storm). The locations of the three mooring stations are denoted by the red pentagrams, and the 2000 m isobath is denoted by the thin dashed lines.
Remotesensing 13 03223 g001
Figure 2. Evolution of SST from September 15 to 23 based on the Remote Sensing System (RSS) dataset. The black line and diamonds show the track and center of Noul. The black plus signs denote the three moorings.
Remotesensing 13 03223 g002
Figure 3. Evolution of SST anomaly from September 15 to 23. The SST anomaly is calculated relative to SST on September 14. The black contours denote –1 °C. The black line and diamonds show the track and center of Noul. The black plus signs denote the three moorings.
Remotesensing 13 03223 g003
Figure 4. Depth-mean power spectra of zonal (red line) and meridional (blue line) horizontal currents with the barotropic tidal currents removed. The unit of the horizontal axis is cycles per day (cpd), and the vertical axis is the power spectral density (PSD) with units of m2 s2 cpd−1. The 95% confidence intervals are denoted by the vertical lines, and the near-inertial (f), diurnal (D1), semidiurnal (D2), one-third day (D3) and one-fourth day (D4) frequencies are shown by the dashed vertical lines.
Remotesensing 13 03223 g004
Figure 5. Evolution of zonal and meridional near-inertial currents obtained by a band-pass filter in M1, M2, and M3. The dashed contours are –0.05 and –0.10 m/s, and the solid contours are 0.05 and 0.10 m/s. The triangles denote the passage of typhoon Noul.
Remotesensing 13 03223 g005
Figure 6. Near-inertial kinetic energy at the depths of 32 m, 64 m, and 96 m for M1 (a), M2 (c), and M3 (e), and the autocorrelation of near-inertial kinetic energy at the depths of 32 m, 64 m, and 96 m for M1 (b), M2 (d), and M3 (f). The approach of typhoon Noul is denoted by the triangles in (a,c,e).
Remotesensing 13 03223 g006
Figure 7. (a) The 25-h moving averaged mixed layer depths of M1, M2, and M3 based on the HYCOM dataset; (b) zonal (solid lines) and meridional (dashed lines) wind stress calculated from ERA5 dataset; and (c) near-inertial energy flux from surface wind stress to oceanic mixed layer obtained from the results of the damped slab model.
Remotesensing 13 03223 g007
Figure 8. The rotary vertical wavenumber spectra of NIWs in M1 (a), M2 (b), and M3 (c). The dashed contours denote 2 × 10⁻⁴ and 6 × 10⁻⁴ m2 s−2 cpsm−1, and the solid contours denote −2 × 10⁻⁴ m2 s−2 cpsm−1. The horizontal axis has units of cycles per stretched meter (cpsm), and the passage of Noul is denoted by the triangle.
Remotesensing 13 03223 g008
Figure 9. The peak frequency and phase of NIWs for M1 (a,d), M2 (b,e) and M3 (c,f).
Remotesensing 13 03223 g009
Figure 10. Evolution of relative vorticity (color) and geostrophic currents (arrows) based on the AVISO dataset. The cyan plus signs denote the mooring locations, and the black lines at the top of each figure denote the velocity of 0.5 m/s. The dashed green line in the centered subfigure is the cross section chosen to diagnose the modulation of NIWs by mesoscale eddy based on the HYCOM dataset.
Remotesensing 13 03223 g010
Figure 11. Evolution of (a) vorticity ( ζ ) and strain (S) normalized to inertial frequency (f), (b) Okubo–Weiss parameter normalized to f2, and (c) depth-mean energy transfer rate from mesoscale field to NIWs. The approach time of typhoon Noul is denoted by the black triangle.
Remotesensing 13 03223 g011
Figure 12. Evolution of NIKE (color and white dashed contours) and effective Coriolis frequency (black contours, red solid contours and red dashed contours) along the section in the central subfigure of Figure 10 based on the HYCOM dataset. The uppermost red inverted triangles denote the locations of M3, M1, and M2 from left to right, respectively. The white dashed contours denote NIKE and start at 5 J/m3 with a stride of 5 J/m3. The red dashed, black solid and red solid contours denote effective Coriolis frequencies that lower than unity, equal to unity and higher than unity, respectively.
Remotesensing 13 03223 g012
Figure 13. Water temperature from sea surface to 80 m on September 14 obtained from the HYCOM dataset.
Remotesensing 13 03223 g013
Table 1. Detailed information of the three moorings.
MooringM1M2M3
Position113.90°E, 18.41°N114.80°E, 18.95°N113.80°E, 17.88°N
Water depth (m)220524502485
Inertial frequency (cpd)0.63160.64950.6139
Range of ADCP24–96 m24–120 m24–104 m
Range of thermometers100–1500 m100–1600 m100–1500 m
Observation period9/1–10/39/2–10/19/6–10/14
Table 2. Parameters of the observed NIWs in M1, M2, and M3.
MooringM1M2M3
Frequency (f)0.951.030.98
e-folding time (days)4~75~611~13
Phase speed (m/h)upwardNA 13.184.58
downward3.531.082.69
Wavelength (m)upwardNA1118179
downward13440105
1 NA denotes not available.
Publisher’s Note: MDPI stays neutral with regard to jurisdictional claims in published maps and institutional affiliations.