Abstract
Wetlands are of immense importance for archaeological research due to excellent preservation conditions for organic material. However, the detection and registration of archaeological remains in waterlogged areas, such as peatlands, bogs, mires, or lakeshores are very challenging. Alternative methods that can support traditional archaeological registrations and that can help to survey wetlands more efficiently are needed. One goal of the “Arkeologi på nye veier” (Archaeology on new ways) project, initiated by Nye Veier AS, was to develop and test a practical solution for non-invasive geophysical surveys in wetland environments in support of traditional archaeological investigations. For that purpose, a custom GPR system for wetland investigations was assembled, tested and applied at Gausdal (Flekkefjord municipality, Agder county) in Norway within the E39-southwest infrastructure project. The GPR survey resulted in promising data, clearly showing the buried remains of an old road within the investigated area. This case study demonstrated the potential of GPR measurements in peatlands as a valuable asset for archaeological registration projects in such environments. However, despite these first encouraging results, wetlands remain very challenging environments, and realistic expectations, as well as a good understanding of the potential and limitations of this approach are a prerequisite for meaningful surveys.
1. Introduction
Within the framework of the road development project E39-southwest between the Norwegian cities of Kristiansand and Stavanger, the state-founded construction company Nye Veier AS in cooperation with the Directorate of Cultural Heritage (Riksantikvaren) initiated the project “Arkeologi på nye veier” (Archaeology on new ways). One goal of this project was to test different non-invasive prospection and investigation methods for exploration archaeology, and to integrate them into the traditional archaeological surveying approach. The Norwegian cultural heritage law (Kulturminneloven §9) obligates an archaeological evaluation in case of planned public and larger private developments, as well as changes in zoning plans of a certain area. The goal of the archaeological evaluation is to assess whether the planned development conflicts with automatically protected cultural heritage monuments (i.e., all monuments and artefacts pre-dating the year 1537). The results of the evaluation form the basis for the respective county archaeologists and responsible archaeological museums, to make further decisions on the subsequent procedure, and to plan archaeological excavations where necessary.
In 2020, Agder county, the University of Oslo (UiO), and the Norwegian Maritime Museum (NMM) conducted archaeological registrations connected to the E39 development project in Flekkefjord municipality, Agder county. The Norwegian institute for cultural heritage research (NIKU) supported these investigations with geophysical archaeological prospection surveys using motorised ground-penetrating radar (GPR) arrays and multi-channel magnetometry, as well as analyses of airborne laser scanning data [1]. Only some smaller areas covering a total of 3.5 ha with open grassland were suitable for motorised geophysical prospection surveys. The main regions that are affected by the infrastructure project consist of mountainous, forested areas with several lakes and wetlands.
Over the past decade, large-scale high-resolution motorised geophysical archaeological prospection have been gradually introduced into Norwegian cultural heritage management [2,3,4,5]. Challenges for archaeological prospection in Norway are that the targeted structures are mostly rather small (such as postholes or pits) and often difficult to distinguish from natural features in the ground. Experiences made on dry land have shown that the most effective near-surface geophysical survey method for archaeological geophysical prospection in Norway is high-resolution GPR on a larger scale, in order to detect many of the hidden structures and to obtain a spatial understanding of them in their geological context. The potential of magnetic prospection is highly limited, as in many parts of the country, shallow bedrock adversely affects the results. Even though large areas of Norway are covered with wetlands, no larger geophysical archaeological prospection surveys have been conducted in such environments so far. Therefore, practical tests of a suitable prospection method and the extension of a non-invasive geophysical archaeological prospection approach into wetlands have been the focus of this research project.
Waterlogged archaeological sites can offer excellent preservation conditions for organic material compared to other drier sites, and therefore are of potentially great importance for archaeological and environmental research ([6], p. 12). A problem is that most of these sites are not responsive to conventional prospection techniques, such as aerial photography, topographical surveys, or field-walking. Trial excavations and mechanical trenching are the traditional methods within archaeological registration projects in such environments, but they are invasive, and often rather difficult to perform. There exists a dire need for additional non-invasive methods that can supplement the traditional archaeological registration approach and that are easy to apply. Categories of cultural heritage encountered in wetlands, as well as problems and possibilities connected with commissioned archaeology at such sites have already been described by Lagerås in 2003 [7].
Geophysical surveys in wetlands are tricky and non-trivial, as all the usual challenges encountered in archaeo-geophysics, such as field procedure, necessary contrasts between target material and surrounding soil, or depth of burial are accentuated in waterlogged environments. Schmidt et al. [8] mentioned in the EAC guidelines the use of geophysics in archaeology that electric conductivity and magnetic susceptibility measurements, as well as GPR surveys, are possible methods with at least some potential in wetland environments, but they are generally rather pessimistic towards the actual benefits of such methods there.
“Geophysical techniques are overall less successful in wetland evaluation. Structural remains (such as pile dwellings, trackways) in organic sediments, in particular, are often not detectable with geophysics. Traditional dry-land geophysical techniques are best applied in areas of relative dryness and shallow overburden (‘islands’, or wetland margins), and features so detected may then have some indirect bearing on the likely location of significant sites elsewhere. Aerial photographs and remote sensing (Donoghue and Shennan 1988, Cox 1992), linked with augering and test trenching, can offer the best overall evaluation, geophysics being applied for the examination of specific shallow or marginal sites.” ([8], p. 48).
Wetlands are defined as “all kinds of wet soils or shallow waters from fresh water lacustrine to salt marine environments” ([9], p. 162), and thus comprise a huge variety in their characteristics, ranging from peatlands, such as limnic peats, mires and bogs, to coasts and lakeshores. Therefore, it is self-evident that there cannot exist one single method that fits for all of these environments, but that local site-specific conditions always have to be considered.
In general, the potential of the GPR method for geoarchaeological investigations of wetlands is considerable [10]. GPR surveys have been tested and used for quite some time already for the study of bogs and ponds [11,12], mapping peat depth [13,14], and studying peat stratigraphy [15]. Regarding archaeological prospection in wetlands and bogs [16], the use of GPR has been reported by several authors over the past two decades [17,18,19,20], even for the detection of organic material in waterlogged sediments [21].
Based on these published experiences and some earlier positive results with individual GPR profiles collected across Norwegian lakes [22], as well as readily accessible GPR equipment, it had been decided to use and test the GPR method for dense 2.5D surveys and 3D imaging of structures in wetlands within this project. The goal was to see how far GPR surveys with closely spaced measurements can resolve structures buried or sunken in the bog/wetland, compared to most earlier work which has mainly been based on the measurement and analysis of individual 2D GPR profiles. Aside from exploring the suitability of the GPR method for 3D GPR surveys in wetlands, the aims for the here presented case study were to find a practical solution for a corresponding, simple-to-use GPR survey system. To achieve these goals, NIKU assembled a GPR system that could efficiently and easily be deployed in wetland environments. Initially, it was also considered to test a drone-mounted GPR system operated at very low altitude, but that was prevented in the investigation areas due to low-rise vegetation in the form of 0.5 m–2 m tall grass and bushes. Instead, different GPR antennae from two GPR manufacturers were tested at a first case study site, to gain experience and to find the most suitable system. Subsequently, further GPR wetland surveys have been conducted within the E39 infrastructure project at Gausdal in 2020.
2. Materials and Methods
2.1. Description of the GPR System Used
For the intended GPR surveys in wetlands, it was first necessary to find a technical solution suitable for investigations in such environments. The system should be easy to operate in uneven terrain, permitting surveys along straight, parallel lines. Furthermore, the electronic components should be protected against the water, with the entire system ideally being able to float wherever necessary. In order to generate a 3D data volume, the possibility of performing a 2.5D survey consisting of numerous parallel straight lines acquired in a bustrophodonical measurement pattern over a defined area was considered necessary. The traditional GPR survey approach, relying on a staked-out measurement grid on the surface of the survey area, involving measurement tapes and cord lines, is unpractical in wetlands due to the variable height of the low-rise vegetation and the soft or water-covered ground surface. Therefore, a RealTime Kinematic Global Navigation Satellite System (RTK-GNSS) solution was used for digital navigation. To overcome the technical challenges, a single-channel GPR system was mounted in a sled, which provided stable measurement conditions for surveys on wetland. For precise, automated data-positioning, the GPR system was time-triggered and connected with a Septentrio Altus NR3 RTK-GNSS.
Data acquisition was managed via the corresponding control unit of the respective GPR system. For reliable navigation of the GPR system and to make sure that the survey lines were straight, parallel sections without gaps in-between, the position data of the RTK-GNSS system were split and, in parallel, connected to a field tablet computer (Figure 1) run by navigation software LoggerVis developed by Ludwig Boltzmann Institute for Archaeological Prospection and Virtual Archaeology (LBI ArchPro) visualising the measured lines on a screen. This wetland GPR system setup was initially tested at Farriseidet in Larvik, and Table 1 presents the antennae and data acquisition parameters.
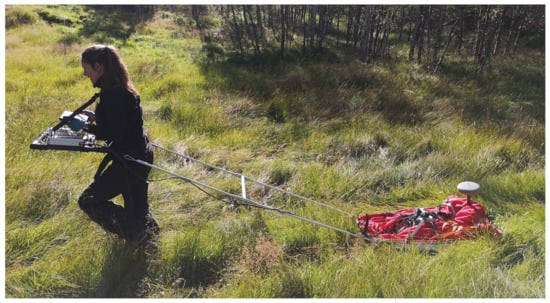
Figure 1.
Setup of the GPR system for survey on wetland at Gausdal: The GPR antenna and RTK-GNSS receiver are placed in a sled, which is towered over the uneven, wet terrain. The GPR control unit and a tablet computer for navigation is carried in front of the operator. Image: Manuel Gabler, NIKU.

Table 1.
Systems and acquisition parameters used for the data presented.
The purpose of these practical field trials was to test the general setup of the system on wetland in order to evaluate its suitability and fieldworthiness, to gain practical experience, and to compare both data quality and GPR pulse penetration of the different GPR systems and antennae. Based on these results, which are described in detail in Section 4.1, it has been decided to use the Guideline Geo MALÅ GX 450 MHz antenna system for further wetland GPR investigations at Gausdal.
2.2. Data Processing and Visualisation
Processing and visualisation of the collected GPR data was carried out using the software ApRadar developed by the LBI ArchPro and the Central Institute for Meteorology and Geodynamics in Vienna. This highly specialised software is designed for the processing of large-scale GPR data to generate GPR depth-slices, used for further data interpretation. It permits the efficient application of various GPR data-processing algorithms for enhanced subsurface imaging. Commonly applied data-processing steps [23] using ApRadar are position assignment and corresponding data interpolation, time-zero computation and corrections, band-pass frequency filtering, spike and background removal (overall or determined over a running, suitable distance range), amplitude gain corrections, 2D or 3D migration, 1D or 2D depth-conversion after velocity analysis, and Hilbert transform). The generated output are several stacks of georeferenced GPR depth-slices (5, 10, 20, 30, 40 and 50 cm thickness). Preliminary results can be generated for quality control minutes after completion of the fieldwork. Modern workstations permit the processing of very large data sets covering hundreds of hectares of data [5]. Currently, ApRadar does not offer an interactive visualisation of the 2D GPR profile sections, which is why Sandmeier’s ReflexW software [24] was used for velocity analysis through hyperbola-fitting. Profile sections were plotted after processing in ReflexW using the GPR Viewer software provided by Larry Conyers. For detailed analysis and spatial interpretation, the resulting GPR depth-slice images were loaded into ESRI ArcMap 10.2.2.
3. Survey Sites
3.1. Gausdal
Gausdal is a small village in the Flekkefjord municipality in the western part of Agder county. It is situated in a narrow valley with steep slopes, running from Lake Lølandsvatnet in the northwest to Lake Årsvatnet in the southeast. The topography within and surrounding the village is undulating, with some exposed bedrock outcrops and, for the most part, rather agriculturally poor soils. Several sections along the western side of the valley and directly south of the village are susceptible to retaining water, and therefore are rather boggy, although efforts have been made to drain these areas to use them for agriculture. The area has been continuously inhabited from at least the late Middle Ages, but it is likely that permanent settlement dates further back in time. A few Stone Age finds and scattered features dating back to the Iron Age were found during recent archaeological investigations. However, intensive, long-term agriculture has had a large impact on the area, and it is likely that other buried archaeological remains have been destroyed.
With regard to the archaeological record of more recent times, the situation is better: Gausdal has several rather large headlands and turnrows along field boundaries, as well as the well-preserved sections “Town road” leading south from the village toward Årsvatnet over partly boggy terrain and small mires. The road is perhaps better described as a track way that was used for transport and communication from communities around Gausdal to Flekkefjord, which is the nearest coastal town, until the road that follows Årdalen from Lølandsvatnet down to Flikka was built in 1870 ([25], pp. 151, 356, 357). It seems that between Gausdal and Årsvatnet, the “Town road” was only improved to allow for heavier traffic close to the village, where it is about 190 cm wide, with a paved road surface made up of 7–15 cm large, irregularly shaped stones that are set between two rows of larger stones that are 20–40 cm in size (Figure 2). Although the road was built in a mire, the excavations found no indication of a construction beneath the stones to support the road surface. The GPR investigations in that area were conducted on 25–27 August 2020, and in particular, fields A and B (Figure 3) showed clear structures in the data and are further described in that article. The ground was completely waterlogged and overgrown with grass, but was in general easy to walk on with wellies.
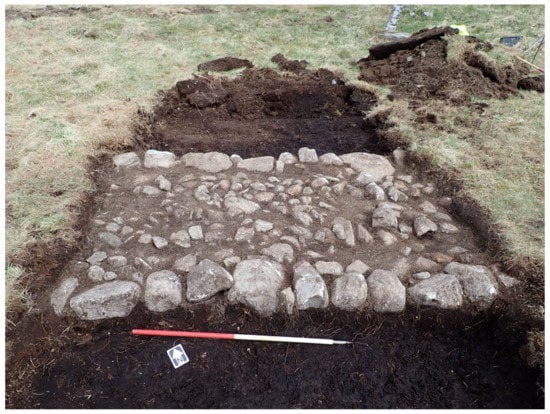
Figure 2.
Excavation trench from Gausdal clearly showing the stone-set road remains in the mire. Image: Emma Norbakk, Agder county.
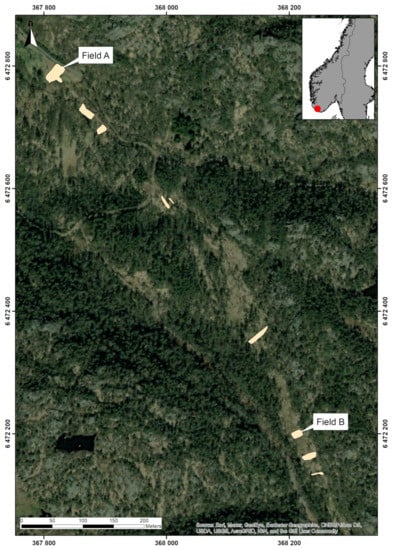
Figure 3.
Overview of the bog-areas that have been investigated with GPR at Gausdal (marked in beige). Fields A and B showed positive prospection anomalies that are described in detail in this article. Coordinates are in ETRS 1989 UTM 32N.
3.2. Farriseidet
Farriseidet is a small land bridge between lake Farris in the north and Larviksfjord to the south in the town of Larvik, Vestfold and Telemark county. Over centuries, this area has constituted an important nodal point, and therefore is rich in finds from different time periods. In 2008, the Norwegian Maritime Museum conducted maritime archaeological registrations in connection with a road construction project, which led to the detection of numerous, earlier unknown archaeological finds [26]. One area south of Lake Farris shows clear linear/rectangular structures in the topography. Today, the area consists of peatland along the lakeshore. In periods with low water levels, it is possible to walk over the structures. Archaeologists of the NMM conducted investigations by test trenching, and registered clearly defined stone structures that were covered with about half a meter of peat ([26], p. 45f). The function of these large structures is unknown, but it is assumed that they might have been fish-basins belonging either to the manor of Fresjegodset in the period 1540–1653, or to the Linaaes manor in the 19th century ([27], p. 125f). Another theory is that these structures are connected to shipping and could possibly relate to the remains of ship halls.
As this site is located in a wetland containing known buried archaeological remains, with easy accessibility, it was chosen as a test site for the wetland GPR trials. Parts of this test area were investigated with four different GPR antennae on 17 and 18 June 2020. At that time, the ground was completely water-saturated and overgrown with grass and reeds, but it was possible to walk on it with rubber boots.
4. Results
4.1. Results of the GPR Test Surveys Conducted at Farriseidet
The investigations at Farriseidet showed that the setup of the GPR system in a sled worked very well in the wetland environment. Protecting the instruments and keeping the electronics safe and dry while simultaneously ensuring close ground-coupling for the GPR antenna, it could easily be dragged over the wet and uneven terrain. The sled followed the operator steadily along the intended survey lines due to the rigid connection of the towing bars. On shallow water areas, it was even able to float. The only limitation was actually the ability of the operator to walk in the mire without getting physically stuck. The field tablet computer in front of the operator for visual guidance enabled good navigation control over the survey lines and data acquisition. However, even though the sled was generally running smoothly, in areas with very bumpy terrain and low vegetation, it was exposed to some side motions. As the RTK-GNSS receiver was mounted in the sled, it followed the side motions and the absolute data positioning was still very accurate. However, due to these lateral variations in position, it was not meaningful to apply the commonly recommended 25 cm cross-line profile spacing for dry land, and 50 cm spacing was used instead.
The test measurements conducted with the four different GPR antennae showed that all of them are suited for investigations in wetlands. Based on a visual comparison of the GPR profiles in ReflexW, both depth penetration and data quality of the two different systems (Guideline Geo MALÅ and Sensors & Software) were quite similar (Figure 4) and showed only some variations in terms of the signal-to-noise ratio. As expected, the level of detail was greatest in the 500 MHz antenna. However, the depth-penetration of the 450 MHz, 250 MHz and 160 MHz antennae was substantially greater. The Sensors & Software antennae suffered from external high-frequency radio noise caused by the RTK-GNSS mobile phone connection nearby placed. All tested antennae were high-quality professional GPR systems that are known to produce excellent data. Figure 4 presents profiles that should not be used to judge the quality of the system, but rather reflect what, under the specific challenging circumstances, was achieved in this case.
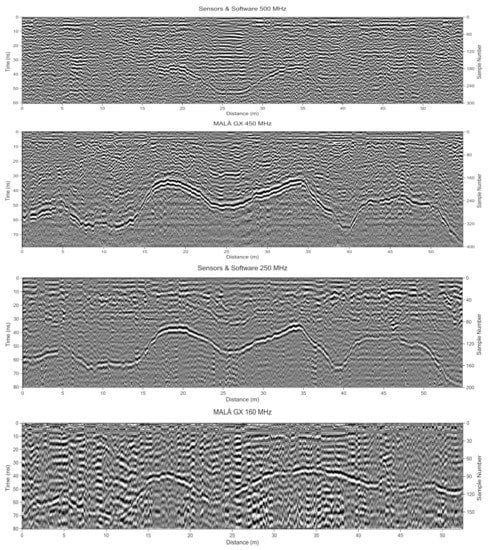
Figure 4.
Comparison of GPR profiles from the survey area at Farriseidet acquired with different GPR antennae. All profiles show the reflection from the top of the bedrock, as well as internal structures in the peat. From top to bottom: Sensors & Software Noggin Plus 500 MHz, MALÅ GX 450 MHz, Sensors & Software Noggin Plus 250 MHz, MALÅ GX 160 MHz. Note that the 500 MHz data were only recorded down to 60 ns, and that the 160 MHz profile was recorded along a slightly deviating track (parallel but 3 m to the south of the other profiles), which explains the difference in the appearance of the bedrock reflection. While the 450 MHz appears as a good compromise regarding imaging resolution and depth penetration, all antennae worked well in the waterlogged soil, and under more controlled circumstances, the data quality of all systems would be expected to be much greater. Images were generated with GPR Viewer, courtesy of Larry Conyers.
Of all four tested antenna systems, the MALÅ GX 450 MHz provided a clear depiction of the top interface of the underlying bedrock, as well as detailed internal structures within the body of the bog. In comparison, the data of the 160 MHz GX appear, in this situation, rather chunky, with obviously more dominant low-frequency content and fewer details. Similarly, the Noggin 500 MHz shows good signal penetration and crisp, detailed data, while the 250 MHz centre frequency antenna lacks finer detail and suffered from some external high-frequency noise.
The connection with a RTK-GNSS for data-positioning and time-triggering instead of odometer-triggering is a standard solution for both GPR systems. The Sensors & Software 250 MHz system stopped recording the RTK-GNSS data, and the MALÅ 450 MHz antenna had a connection error during the test measurement. The split parallel GNSS position data stream used for navigation worked well during the entire measurement, and therefore, this error was not realised directly in the field. While the issue with the MALÅ 450 MHz was simply a disconnected cable, it could not be reconstructed if the problem with the Sensors & Software system was based on an operating error or a technical issue.
As the GPR measurements were time-triggered, the in-line GPR trace spacing depends on the sampling frequency and the walking speed of the operator. Between the two tested systems, the Guideline Geo MALÅ GX system offered a higher sampling rate per second (20 Hz vs. 1 Hz), enabling a better in-line measurement density, as shown in Table 1.
Due to the above-mentioned issues with the parallel data collection, only data from the Sensors & Software 500 MHz antenna and the MALÅ GX 160 MHz antenna could be processed and imaged into 3D GPR depth-slices. For the 2D migration and time-to-depth conversion, the signal velocity was determined to 6 cm/ns through hyperbola fitting, and the data were processed into 10 cm thick depth-slices. Both antennas worked well for the imaging of the present archaeological structures and revealed the location of the previously known stone structures covered by peat at Farriseidet in approximately 20–40 cm depth (Figure 5). Due to the shallow depth of burial of the structures, the higher frequency antenna resulted in a more defined image of the stone structures. Based on the visual analysis of the GPR profiles, the MALÅ GX 450 MHz antenna provided the clearest picture of the top of the underlying bedrock, and detailed internal structures within the bog. As the archaeological situation at Gausdal is similar to Farriseidet, with archaeological structures expected to be located at shallow depth, it was decided to use the MALÅ GX 450 MHz system for the following investigations at Gausdal within the framework of the E39 project.
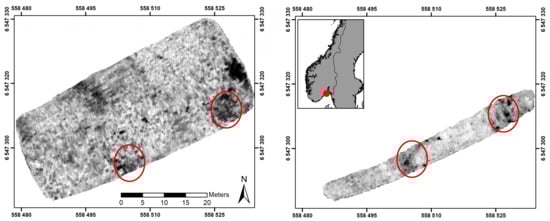
Figure 5.
GPR depth-slices from 20–40 cm depth acquired with the Guideline Geo MALÅ 160 MHz (left) and Sensors & Software 500 MHz antenna (right) at Farriseidet. The hidden stone structures, that are known from earlier archaeological investigations, are imaged as reflective, black features in the GPR data (marked with red ellipses). The extent of the survey area was reduced after initial identification of the relevant structures in the 160 MHz antenna data. Coordinates are in ETRS 1989 UTM 32N.
4.2. GPR Investigations at Gausdal
The GPR surveys conducted at Gausdal worked well in all of the test areas. The GPR pulse penetration depth varied due to the depth down to the bedrock, but reached down to 2 m with good data quality throughout. Two areas showed very clear structures in the GPR depth-slices, and were additionally investigated with excavations, as described in more detail below. The results from the other areas are not relevant for this article but can be found in the project report [1].
Field A (Figure 3) was of primary interest, as parts of the “Town road” (Figure 2) that dates back at least to the 19th century had been discovered with help of test trenches dug prior the GPR investigation. The trenches had been refilled and the later GPR investigations in the same area could clearly identify the road remains and map its course within the surveyed field. In the GPR data depth-slice images from 15–55 cm depth, this road is visible as a linear, 2 m wide, reflective anomaly that is oriented in NW-SE direction (Figure 6). The GPR profiles show varying depths of the mire down to 1.5 m maximum, indicating that the road was originally already built on wetland. This is in line with the findings of the excavations conducted earlier in the area. In one excavation trench, the road surface which was 1.9 m wide was found under about 10 cm of topsoil in a location where the mire was 90 cm deep, underlain with bedrock. An interesting aspect was the fact that the refilled excavation trenches were no longer visible in the GPR data after only three months, which is explained by the complete water saturation of the soil and the corresponding lack in contrast regarding the relative dielectric permittivity (RDP) (cf. [10], pp. 69–72).
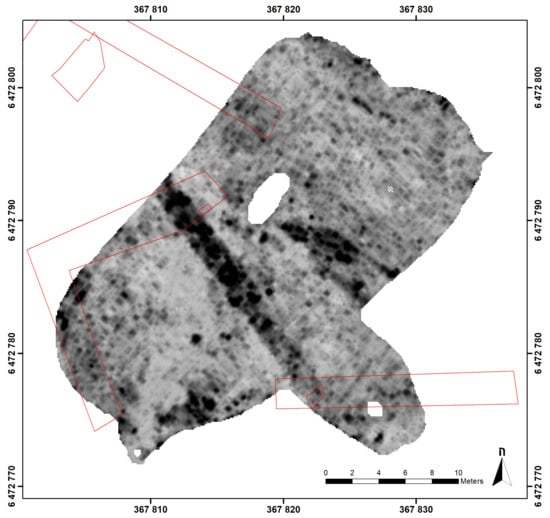
Figure 6.
The GPR depth-slice (15–55 cm depth) from Field A at Gausdal clearly showing the anomaly caused by the buried remains of the old stone-paved road as a 2 m wide, strongly reflective linear structure running in the NW-SE direction. The red marked areas show the location of the excavation trenches. Coordinates are in ETRS 1989 UTM 32N.
To locate the continuation of the road, additional smaller GPR surveys in the mires along the Gausdal valley were conducted. Unfortunately, it was not possible to track the exact location of the road in any of the other investigated areas. In a mire further to the south (marked as Field B in Figure 3), a reflective linear structure in the N-S direction was clearly visible in the data at approximately 50–60 cm depth. Prior to data migration and velocity analysis, it appeared possible that this structure could be caused by remains of the road. However, after more careful data processing and analysis, the linear anomaly has been interpreted as being caused by a modern cable or pipe (Figure 7). To verify this interpretation, a small test trench was dug, which confirmed that the buried structure is a modern cable that had not been marked in the corresponding infrastructure map (Figure 8). Despite the negative archaeological outcome, it was a positive confirmation of the functionality and potential of the GPR method in wetland environments.
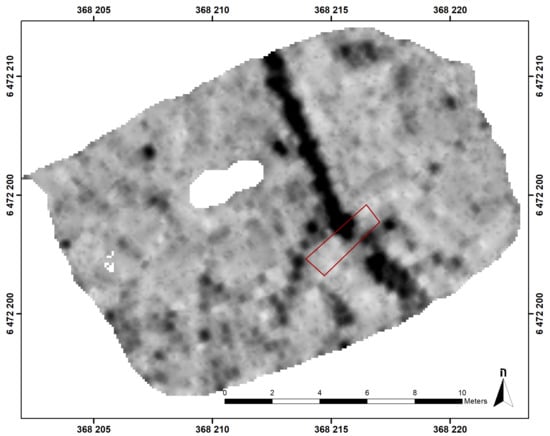
Figure 7.
The GPR depth-slice (50–60 cm depth) from Field B at Gausdal clearly showing the cable as a strongly reflective, 50 cm wide linear structure in approximately the N-S direction. The red marked area shows the location of the excavation trench. Coordinates are in ETRS 1989 UTM 32N.
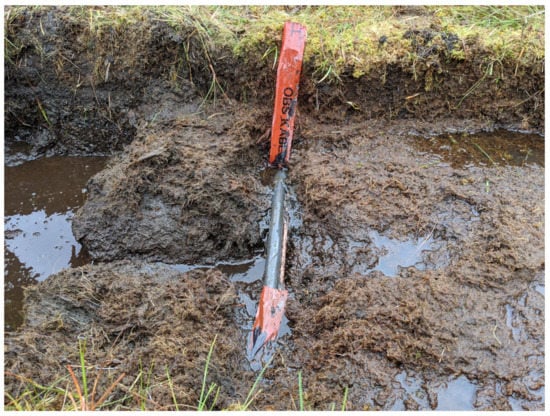
Figure 8.
The excavation in Field B confirming the presence of a modern cable that had been detected with GPR. Image: Claes Olof Johan Uhnér, UiO.
Another test area that previously has not been mentioned, demonstrated a clear limitation of this survey approach for prospection in wetland environments: due to overgrown sinkholes in the mire, it was simply not possible to safely walk over the area. Therefore, the safe collection of any meaningful GPR data was not possible there. It was considered to test a drone-mounted GPR system to overcome this issue, but a low-altitude flight would not be possible due to the local vegetation in the investigation areas. An alternative option to overcome this problem would be to conduct surveys in such difficult terrain in the winter when the ground is frozen and snow-covered [28].
5. Discussion
The results of the test surveys show that 2.5D GPR measurements can be conducted successfully on wetland for archaeological prospection, offering additional possibilities for archaeological investigations. The quality of the GPR signal was good within the water-saturated soils, and the chosen solution with a towed sled, automatic data-positioning, and additional digital navigation worked well. Some high-frequency noise was observed in the Sensors & Software data, probably induced from the RTK-GNSS mobile phone connection for retrieval of the correction signal. Buried remains of a stone structure at Farriseidet, as well as of a historic road and a modern cable in a mire in Gausdal could clearly be mapped and identified in this case study. However, it has to be considered that the discovered archaeological features were stone-set structures close to the surface in a shallow mire. These are favourable conditions for GPR prospection, and the positive results must be seen in this perspective.
In the same field where the road was detected at Gausdal, four 2 m wide search trenches were excavated and refilled prior to the GPR survey. While the traces of such large trenches can normally be clearly identified in GPR data collected under dry conditions on land, in this water-saturated wetland environment the trenches were not visible anymore in the GPR data three months after excavation. This illustrates the challenges encountered regarding geophysical contrast of archaeological features in wetland environments.
Conyers ([10], pp. 69–72) discusses the excellent depth-penetration of GPR pulses and good resolution of the GPR method in partly or fully freshwater-saturated peat bogs and swamps, which are due to the low electric conductivity and RDP values as high as 70 (with fresh water having a RDP of 80, see Table 2). The decreased wavelength of the GPR pulses (Table 3) in waterlogged media offers greater vertical imaging resolution for the separation of interfaces and other encountered structures. According to Conyers, soil water content and its distribution in the subsurface is the most important parameter when it comes to the generation of GPR reflections ([29], p. 34).
Table 2.
Material properties in different relevant media after Conyers [29] and Leckebusch [http://gpr-parameters.ch (accessed on 28 May 2021)]. The relatively high dielectric pemittivity of peat and cultural layers in fresh water explains the difficulty in detecting organic structures in water-logged environments, despite the electrical conductivity still offering contrasts. The underlying bedrock or stone structures within the peat, mostly granite, again show sufficient deviation to warrant strong reflections.
Table 3.
Wavelength in [m] as function of frequency and RDP, respectively pulse velocity (cf. Conyers [10], p. 23). The vertical imaging resolution is dependent on the wavelength, and Conyers ([10], p. 25) pointed out that under real-world conditions, one wavelength separation is required for resolution, instead of the theoretical minimum of a quarter wavelength.
The RDP is expressed as
with c as the speed of light (0.2998 m/ns) and v as the velocity of the radar pulse in the material (measured in m/ns). The reflection coefficient R of a GPR pulse reflection occurring at an interface between the overlying medium 1 and the underlying medium 2 is
with being the RDP of the overlying material and representing the underlying material [29]. Thus, in water-logged peat bogs and wetlands with only little relative changes of the RDP between successive layers, little or no reflections are generated. While the GPR method should be able to image the interface between organic layers and underlying bedrock, or of stone structures embedded within the stratification, it will be challenging to image reflections between different layers of similar water saturation if no substantial RDP differences are caused by changing geochemistry.
As it can be seen in Table 2, changes in water saturation significantly affect the value ranges of the dielectrical constant and electrical conductivity. When soil is water-saturated, the difference in RDP between soil layers disturbed or undisturbed by excavation activities become too small for any significant reflection of the GPR pulse to be generated. A potential organic archaeological layer in wetland will most likely have similar geophysical properties as the surrounding material, making it impossible or very difficult to distinguish it using GPR measurements. On dry land however, refilled trenches, pits or postholes can be detected by GPR measurements due to the relative change in pore volume of the disturbed soil and contained soil humidity. On the other hand, the Table also shows a clear difference between the parameters of stone towards the wet soil. That enables a high chance for detecting stone structures, as demonstrated by the results presented above.
Another challenge of GPR prospection in wetland is GPR pulse attenuation , which is computed as a function of the RDP and the electrical conductivity () [30]:
Based on the large value ranges for water-saturated soil, the pulse attenuation of, for example, cultural layers in freshwater, can vary from 0.021 to 1.9 db/m. This demonstrates that due to the large variability of the geophysical properties of water-saturated soils, it is nearly impossible to generalise whether the GPR method can successfully be used in a particular wetland area or not. This project had the goal to investigate the general practical applicability of the GPR method in wetlands and should not be seen as a comparison of antennae, which would have required a more laboratory-like setting. No further invasive analyses of the soil in the investigated areas have been conducted. However, it would be the logical next step to include soil parameter analysis and further trials in different types of wetland.
At the two test sites, the data quality and GPR pulse penetration depth were satisfying, with reflections recorded from down to 2 m depth in the water-logged soil. However, since the crossline data resolution had to be reduced from 25 cm to 50 cm due to the very uneven and bumpy terrain, the spatial sampling, and thus, imaging conditions suffered. Therefore, a general point to consider in the case of wetland investigations is a reduced imaging resolution caused by a larger-than-desirable cross-line sample spacing. Nevertheless, if one has realistic expectations regarding the potential of GPR surveys in wetlands, they can be an effective means for archaeological investigations. It is unrealistic to expect the detection of smaller organic structures, such as those associated with postholes or smaller pits, but large stone structures caused by pavings, embankments, and house foundations or larger stone-filled cooking pits in shallow bogs or at lakeshores can most likely be successfully detected with the help of GPR. Likewise, changes in geochemistry and differences in clay content or clay layers could become detectable due to the different RDPs and conductivities involved. The presented approach is rather easy to apply and enables the efficient investigation of approximately 3000 m2 per day with 50 cm cross-line spacing, thus offering a relatively fast, non-destructive method for archaeological investigations of selected areas in bogs or wetland. Care should be taken in order to avoid electromagnetic interference between the RTK-GNSS radio antennae and the recorded GPR spectrum through physical distancing of the radio antenna from the GPR antenna.
6. Conclusions
The presented project had the goal of developing and testing a stable and efficient GPR system for archaeological 2.5D surveys in wetlands. Using a towed sled containing the GPR and automatic RTK-GNSS positioning system including digital navigation worked very well in the investigated areas. The GPR signal quality was very good in the water-saturated soils and the approach permitted the investigation of approximately 3000 m2 per day with 50 cm cross-line and 2 cm in-line GPR trace spacing.
The stone structure at Farriseidet known from earlier test trenching and the buried historical road in the mire at Gausdal were clearly detected and imaged in the GPR data. Even though road remains could not be found in the other surveyed areas, the detection of an earlier unknown modern cable demonstrated the functionality of the GPR approach in wetland environments. The inability of the method to detect traces of three-month-old excavation trenches is explained by the lack of contrast in the water-logged environment, illustrating the challenge to detect features other than those which are strongly reflecting.
In general, the experiences and observations made in this project fit well with earlier results reported from other projects utilising GPR in wetland environments. Such surveys are challenging and the variety of possible archaeological structures that can be found is clearly limited, compared to surveys on dry land where variable soil moisture can provide more nuanced results. However, with realistic expectations and correct handling of the equipment, 2.5D GPR surveys offer a powerful asset for archaeological investigations in wetlands. Further research dealing with the effect of different types of water-logged soils and associated archaeological features on GPR data would be needed. To this end, as the next logical step, high-resolution, extensive 2.5D GPR test surveys should be conducted in combination with multi-offset electromagnetic induction measurements as those possible with the DualEM 21HS Sensor, in order to exploit in these challenging environments both dielectric permittivity, as well as apparent electrical conductivity contrasts. We shall be back in the bog.
Author Contributions
System development, M.G.; Software, A.H.; Data acquisition, M.G., M.K., C.O.J.U., N.O.S.; Data processing: M.G., A.H.; Data interpretation: M.G., I.T.; Project administration: M.G., C.O.J.U., N.O.S., P.N.; writing—review and editing, M.G., I.T., C.O.J.U. All authors have read and agreed to the published version of the manuscript.
Funding
This research was funded by Nye Veier AS and the Norwegian Institute for Cultural Heritage Research (NIKU) within the research project “Arkeologi på nye veier”. The APC was funded by NIKU.
Institutional Review Board Statement
Not applicable.
Informed Consent Statement
Not applicable.
Data Availability Statement
The data is available on reasonable request. The authors retain the right for publication of the data.
Acknowledgments
We would like to thank Solveig Walskaar, project leader from Nye Veier AS, who was a great support during the project. Many thanks to Frans-Arne Hedlund Stylegar from Nye Veier AS, who was responsible for the coordination of the different cultural heritage management organisations within this project. Special thanks to the project partners, and to the field archaeologists for their support during the fieldwork, as well as to the landowners who granted access to the investigation areas. We are grateful to Christer Tonning and Petra Schneidhofer from Vestfold and Telemark county, as well as Severin Eskeland from Eskeland electronics, who provided us with the Guideline Geo MALÅ GX systems for this project. Since 2010, NIKU is a partner of the Vienna-based LBI ArchPro. In this project the LBI ArchPro software ApRader was used for data processing and visualisation. The LBI ArchPro has been founded as an international cooperation between academic institutes, national archaeological and geophysical research departments, governmental cultural heritage agencies, as well as commercial archaeological prospection service providers and SMEs. Since 2010, the following partners have contributed to the here presented research and development: Ludwig Boltzmann Gesellschaft (A), Amt der Niederösterreichischen Landesregierung (A), University of Vienna (A), Technische Universität Wien (A), Central Institute for Meteorology and Geodynamics—ZAMG (A), Airborne Technologies (A), 7reasons (A), Austrian Academy of Sciences—ÖAW (A), Austrian Archaeological Institute—ÖAI (A), Römisch—Germanisches Zentralmuseum Mainz—RGZM (D), University of Birmingham (GB), Riksantikvarieämbetet UV/Statens Historiska Museer (S), Norwegian Institute for Cultural Heritage—NIKU (N), Vestfold and Telemark fylkeskommune—Kulturarv (N), and Archäologie für Westfalen—LWL (D).
Conflicts of Interest
The authors declare no conflict of interest.
Abbreviations
The following abbreviations are used in this manuscript:
| GPR | Ground-Penetrating Radar |
| LBI ArchPro | Ludwig Boltzmann Institute for Archaeological Prospection and Virtual Archaelogy |
| NIKU | Norwegian Institute for Cultural Heritage Research |
| NMM | Norwegian Maritime Museum |
| RDP | Relative dielectric permittivity |
| RTK-GNSS | RealTime Kinematic Global Navigation Satellite System |
| UiO | University of Oslo |
References
- Gabler, M.; Kristiansen, M.; Causevic, J. Inngrepsfrie Arkeologiske Registreringsmetoder i “Arkeologi på nye veier” E39 Sørvest. Flekkefjord Kommune/Agder Fylke; Report; Norsk Insititutt for Kulturminneforskning: Oslo, Norway, 2020. [Google Scholar]
- Gustavsen, L.; Paasche, K.; Risbøl, O. Arkeologiske Undersøkelser: En Vurdering av Nyere Avanserte Arkeologiske Registreringsmetoder i Forbindelse med Vegutbyggingsprosjekter; Report; Vegdirektoratet: Oslo, Norway, 2013. [Google Scholar]
- Stamnes, A.A. The Application of Geophysical Methods in Norwegian Archaeology. A Study of the Status, Role and Potential of Geophysical Methods in Norwegian Archaeological Research and Cultural Heritage Management. Ph.D. Thesis, NTNU, Trondheim, Norway, 2016. [Google Scholar]
- Nau, E.; Gustavsen, L.; Kristiansen, M.; Gabler, M.; Paasche, K.; Hinterleitner, A.; Trinks, I. Motorized archaeoloigcal geophysical prospection for large infrastructure projects—Recent examples from Norway. In AP 2017. 12th International Conference of Archaeological Prospection: 12th–16th September 2017, The University of Bradford; Jennings, B., Gaffney, C., Sparrow, T., Gaffney, S., Eds.; Archaeopress Publishing Ltd.: Oxford, UK, 2017; pp. 163–165. [Google Scholar]
- Trinks, I.; Hinterleitner, A.; Neubauer, W.; Nau, E.; Löcker, K.; Wallner, M.; Gabler, M.; Filzwieser, R.; Wilding, J.; Schiel, H.; et al. Large-area high-resolution ground-penetrating radar measurements for archaeological prospection. Archaeol. Prospect. 2018, 25, 171–195. [Google Scholar] [CrossRef]
- Coles, J.; Lawson, A. European Wetlands in Prehistory; Clarendon Press: Oxford, UK, 1987. [Google Scholar]
- Lagerås, P. Approaches and Methods for Commissioned Archaeology in Wetlands: Experience from the E4 Project in Skåne, Southern Sweden. Eur. J. Archaeol. 2003, 6, 231–249. [Google Scholar] [CrossRef]
- Schmidt, A.; Linford, P.; David, A.; Gaffney, C.; Sarris, A.; Fassbinder, J. EAC Guidelines for the Use of Geophysics in Archaeology: Questions to Ask and Points to Consider. EAC Guidelines 2; Europae Archaeologia Consilium (EAC), Association Internationale sans But Lucratif (AISBL): Namur, Belgium, 2015. [Google Scholar]
- Koster, E.; Favier, T. Peatlands, past and present. In The Physical Geography of Western Europe; Koster, E., Ed.; Oxford Press: Oxford, UK, 2005; pp. 161–168. [Google Scholar]
- Conyers, L. Ground-Penetrating Radar for Geoarchaeology; Wiley-Blackwell: Hoboken, NJ, USA, 2016. [Google Scholar]
- Mellett, J. Profiling of ponds and bogs using ground-penetrating radar. J. Paleolimnol. 1995, 14, 233–240. [Google Scholar] [CrossRef]
- Theimer, B.; Nobes, D.; Warner, B.G. A study of the geoelectrical properties of peatlands and their influence on ground-penetrating radar surveying. Geophys. Prospect. 1994, 42, 179–209. [Google Scholar] [CrossRef]
- Rogers, S.S.; Clague, A.; Boehm, H.D.V. Ground Penetrating Radar Mapping of Peat Depth. JST-JICA Symposium in Bogor 13–14 September 2012. 2012. Available online: http://www.kalteng.org/remote-sensing.php?newsID=188 (accessed on 28 May 2021).
- Pladoa, J.; Sibulb, I.; Mustasaara, M.; Jõelehta, A. Ground-penetrating radar study of the Rahivere peat bog, eastern Estonia. Est. J. Earth Sci. 2011, 60, 31–42. [Google Scholar] [CrossRef]
- Akpabio, G.; Johnson, U.; Cana, C.; Agbasi, O. Peat stratigraphy mapping using ground penetration radar and geotechnical engineering implications. Int. J. Adv. Geosci. 2017, 5, 46–56. [Google Scholar] [CrossRef] [Green Version]
- Chapman, H.P.; Van de Noort, R. High-Resolution Wetland Prospection, using GPS and GIS: Landscape Studies at Sutton Common (South Yorkshire), and Meare Village East (Somerset). J. Archaeol. Sci. 2001, 28, 365–375. [Google Scholar] [CrossRef]
- Clarke, C.M.; Utsi, E.; Utsi, V. Ground penetrating radar investigations at North Ballachulish Moss, Highland, Scotland. Archaeol. Prospect. 1999, 6, 107–121. [Google Scholar] [CrossRef]
- Utsi, E. Wetlands viewed through the antennas of a Ground Penetrating Radar. In Archaeology from the Wetlands: Recent Perspectives, Proceedings of the 11th WARP Conference, Edingburgh, UK, 6 May 2007; Society of Antiquaries: Edingburgh, UK, 2005; pp. 213–218. [Google Scholar]
- Armstrong, K. Archaeological Geophysical Prospection in Peatland Environments. Ph.D. Thesis, Bournemouth University, Poole, UK, 2010. [Google Scholar]
- Koivisto, S.; Latvakoski, N.; Perttola, W. Out of the Peat: Preliminary Geophysical Prospection and Evaluation of the Mid-Holocene Stationary Wooden Fishing Structures in Haapajärvi, Finland. J. Field Archaeol. 2018, 43, 166–180. [Google Scholar] [CrossRef] [Green Version]
- Weller, A.; Bauerochse, A. Detecting Organic Materials in Waterlogged Sediments. In The Oxford Handbook of Wetland Archaeology; Oxford University Press: Oxford, UK, 2013; pp. 412–432. [Google Scholar]
- Paulsson, S. Georadarmålinger ved Kroskund området i Holekommune. Oppdrag 97282. a.s.GeoPhysix; Report; Norsk Sjøfartsmuseum: Oslo, Norway, 1997. [Google Scholar]
- Leckebusch, J. Ground-penetrating radar: A modern three-dimensional prospection method. Archaeol. Prospect. 2003, 10, 213–240. [Google Scholar] [CrossRef]
- Sandmeier, K. ReflexW Version 8.1. Program for Processing of Seismic, Acoustic or Electromagnetic Reflection, Refraction and Transmission Data; Software Manual: Karlsruhe, Germany, 2016. [Google Scholar]
- Hageland, T.N. Gamle veger i Vest-Agder; Kristiansand: Statens vegvesen Vest-Agder, Norway, 2000. [Google Scholar]
- Nymåen, P.; Wahl, T. Farriseidet i Larvik—et Veghistorisk Knutepunkt. Arkeologisk Registrering under Vann i Planområde for ny E18 i Deler av Farrisvannet, Larvik Kommune, Vestfold Fylke; Report; Norsk Sjøfartsmuseum: Oslo, Norway, 2008. [Google Scholar]
- Nyhus, P. Larvik A-Å; Østlands-Posten: Larvik, Norway, 1999. [Google Scholar]
- Gabler, M.; Trinks, I.; Nau, E.; Hinterleitner, A.; Paasche, K.; Gustavsen, L.; Kristiansen, M.; Tonning, C.; Schneidhofer, P.; Kucera, M.; et al. Archaeological Prospection with Motorised Multichannel Ground-Penetrating Radar Arrays on Snow-Covered Areas in Norway. Remote Sens. 2019, 11, 2485. [Google Scholar] [CrossRef] [Green Version]
- Conyers, L.B. Interpreting Ground-Penetrating Radar for Archaeology; Routledge: London, UK, 2012. [Google Scholar]
- Davis, J.; Annan, A. Ground Penetrating Radar for High Resolution Mapping of Soil and Rock Stratigraphy. Geophys. Prospect. 1989, 37, 531–551. [Google Scholar] [CrossRef]
Publisher’s Note: MDPI stays neutral with regard to jurisdictional claims in published maps and institutional affiliations. |
© 2021 by the authors. Licensee MDPI, Basel, Switzerland. This article is an open access article distributed under the terms and conditions of the Creative Commons Attribution (CC BY) license (https://creativecommons.org/licenses/by/4.0/).