Abstract
The Global Ecosystem Dynamics Investigation (GEDI) full-waveform (FW) LiDAR instrument on board the International Space Station (ISS) has acquired in its first 18 months of operation more than 25 billion shots globally, presenting a unique opportunity for the analysis of LiDAR data across multiple domains (e.g., forestry, hydrology). Nonetheless, not all acquired GEDI shots provide exploitable waveforms due to instrumental (e.g., transmitted energy, viewing angle) and atmospheric conditions (e.g., clouds, aerosols). In this study, we analyzed the quality of all available GEDI acquisitions over France, Tunisia, and French Guiana, in order to determine the extent of the impact of instrumental and climatic factors on the viability of these acquisitions. Results showed that with favorable acquisition conditions (i.e., cloud-free acquisitions), the factor with the highest impact on the viability of GEDI data is the acquisition time, as acquisitions around noon were the least viable due to higher solar noise. In addition to acquisition time, the viewing angle, the transmitted energy, and the aerosol optical depth all affected, to a lesser extent, the viability of GEDI data. Nonetheless, the percentage of exploitable cloud-free GEDI acquisitions ranged from 75 to 91% of all total acquisitions, depending on the acquisition site. The analysis of the quality of GEDI shots acquired in the presence of clouds showed that clouds have a greater impact on their exploitability, with sometimes as much as 69% of acquired data being unusable. For cloudy acquisitions, the two factors that mostly affect the LiDAR signal are the cloud optical depth (or cloud opacity) and cloud water content. Overall, nonviable GEDI data represent less than 50% of total acquisitions across the different instrumental, climatic, and environmental conditions.
1. Introduction
In the last couple of decades, light detection and ranging (LiDAR) has gained momentum in many applications that range from the mapping of atmospheric characteristics (density, composition, wind speed, direction) to the 3D mapping of terrain objects at very high resolutions, and in many scientific domains (e.g., atmospheric studies, forestry, bathymetry, urban physiognomy, the monitoring of Earth’s ice sheets, archeology, etc.) [1,2,3,4,5,6,7].
LiDARs, as their name implies, estimate the elevation of an object by measuring the two-way time travel of light, more specifically laser, from the sensor to the targets. Nonetheless, LiDAR is a broad term that encompasses a large range of LiDAR systems with different configurations, laser wavelengths, pulse repetition frequency (controls the spatial sampling of the system), the type of the returned echoes, etc. Moreover, it is common for LiDAR systems to be equipped with multiple lasers that operate simultaneously to increase the sampling rates or surface, or have different optical wavelengths in order to accommodate different applications (e.g., visible green for bathymetry, and near-infrared for topography [8]).
Perhaps the most significant difference between LiDAR systems is the way they record and process the returned echoes. In general, LiDAR systems can be grouped into two broad categories: discrete return systems, and full-waveform (FW) systems. Discrete return systems record a discrete number of returned ranging points as a series of x, y, and z coordinates known as point clouds. Some systems record only the first and last return echoes of targets within the travel path of the emitted light, while others can also record intermediate points, and some newer systems can also record the intensity [9]. Discrete return LiDARs are characterized by their small footprints (<1 m) and their high point density (several points/m2), and are generally mounted on aircrafts (e.g., planes, helicopters, unmanned aerial vehicles), and they are most commonly referred to as airborne laser scanners (ALS), or used on the ground (terrestrial laser scanners, TLS). Finally, given the very small footprint size and the very narrow field of view of the lasers used in ALS [8], scanning mechanisms are used in order to increase the spatial coverage; the most common scanners are the oscillating mirror, rotating polygon, Palmer scan, and the Risley prisms scanner [8].
The other category of LiDAR systems are the full-waveform (FW) systems, and these systems acquire a time-varying distribution of backscattered radiation from the different targets within the illuminated surface. Therefore, in some contexts, FW LiDARs could provide much richer information about the spatial arrangement of structures within their waveforms [10]. In contrast to discrete LiDAR systems, FW LiDARs are almost exclusively spaceborne systems, and given the altitude and speed of the platform they are mounted on, FW systems are characterized by large footprint sizes (>10 m) and small sampling density. In addition, current FW systems are not equipped with sophisticated scanners; therefore, sampling is mostly performed along a single line. Therefore, to increase spatial coverage, recent spaceborne LiDAR systems are equipped with multiple lasers.
The first operational spaceborne LiDAR system was the LiDAR In-space Technology experiment (LITE), which operated in the cargo bay of the space shuttle Discovery during the STS-64 mission in September 1994 [11]. LITE was built primarily to measure and detect clouds and aerosols in the troposphere and stratosphere, derive temperature and density profiles in the stratosphere at heights between 25 and 40 km, and to determine the heights of the planetary boundary layer [11]. LITE was equipped with two redundant flashlamp-pumped Nd:YAG lasers which were frequency-doubled and -tripled to provide simultaneous output pulses of 1064 nm, 532 nm, and 355 nm, with a pulse repetition frequency (PRF) of 10 Hz. At the surface, the laser beam spread to approximately 470 and 290 m for, respectively, the 1064 and 532 nm beams, and footprints were spaced every 740 m [11]. During its 11-day mission, LITE collected almost two million laser pulses [11].
After the LITE instrument, the Geoscience Laser Altimeter System (GLAS) on board the Ice, Cloud and Land Elevation Satellite (ICESat) became operational in 2003 and was decommissioned in 2009 [12]. During its mission, GLAS made a total of 1.98 billion laser altimetry and atmospheric measurements. However, not all acquired GLAS footprints were exploitable due to laser anomalies [13] as well as atmospheric conditions. In a study conducted by Baghdadi et al. [14], it was reported that only 32.8% of acquired GLAS waveforms were viable for further processing for forestry applications.
In 2019, a new full-waveform (FW) spaceborne LiDAR mission became operational through the Global Ecosystem Dynamics Investigation (GEDI) instrument on board the International Space Station (ISS) for a two-year nominal duration. GEDI’s main objective is to provide information about canopy structure, biomass, and topography [15]. GEDI’s main instrument comprises three lasers emitting 1064 nm light, with a PRF of 242 Hz. One of the lasers’ output is split into two beams called coverage lasers, while the remaining two remain at full power, thus producing a total of four beams. Next, laser output is rapidly deflected by 1.5 mrad using beam dithering units (BDUs) in order to produce eight tracks of data on the ground. Four of these tracks are coverage tracks, and four are full power tracks. The eight produced tracks are separated by ~600 m across-track, with a footprint diameter of ~25 m and a distance between footprint centers of 60 m along-track [15]. The echoed waveforms are digitized to a maximum of 1246 bins with a vertical resolution of 1 ns (15 cm), corresponding to a maximum of 186.9 m of height ranges, with a vertical accuracy over relatively flat, nonvegetated surfaces of ~3 cm [15] and about 10–20 m horizontally. GEDI resembles ICESat-1 by the way it measures vertical structures (i.e., waveforms); however, given GEDI’s higher PRF (242 vs. 40 Hz for ICESat-1), and its much smaller footprint size (~25 vs. ~60 m for ICESat-1), GEDI should provide a much denser database, and, along with its smaller footprint size, improved measurements over forested areas with high sloping terrain.
In its first 18 months of operation, GEDI has acquired over 25 billion waveforms globally. Nonetheless, similar to its predecessor, GEDI’s waveforms are affected by instrumental and atmospheric conditions. Therefore, the objective of this study is to analyze the effects of instrumental and atmospheric conditions on the viability of acquired GEDI waveforms. In this study, we consider a GEDI waveform as viable if the number of detected modes or peaks is higher than one. In fact, one or more detected modes indicate that the transmitted waveform made at least one contact on the ground, while waveforms with no detectable modes represent only noise. The study was conducted on GEDI data acquired over three countries with different climatic conditions: France, on the western edge of Europe; Tunisia, on the Mediterranean coast of Northwest Africa; and, finally, French Guiana, an overseas department and single territorial collectivity of France on the northern Atlantic coast of South America. The atmospheric data used were provided by the Meteosat Second Generation satellites and MODIS.
2. Materials and Methods
2.1. Study Sites
Three countries were considered in this study, encompassing different climates (Figure 1). The first country is metropolitan France (without Corsica Island), with a total size of 535,000 km2. The climate, based on the Köppen−Geiger classification [16], is mainly oceanic (Cfb, Cwb, and Cfc) with a small southern part, close to the Mediterranean Sea, belonging to the Csa and Csb categories (warm or hot dry summers). The second country is Tunisia, with an area of 163,610 km2. Tunisia’s climate is mild, generally warm and temperate, with rainier winters than the summers. The climate is mostly classified as Csa by the Köppen−Geiger system [16]. Finally, the third region considered is French Guiana. French Guiana has a surface area of 83,534 km2 and has a tropical climate belonging to the Am (tropical monsoon) category, with a small part in the northwest belonging to Af (tropical rainforest), according to the Köppen−Geiger system [16].
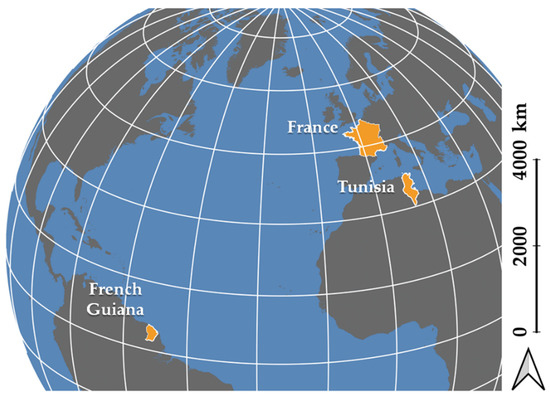
Figure 1.
Location of the three study sites.
2.2. GEDI Dataset
GEDI data used in this study are already processed and published by the Land Processes Distributed Active Archive Center (LP DAAC, https://e4ftl01.cr.usgs.gov/GEDI/ (access on 6 August 2021)), and comprise 18 months (mid-April 2019 until September 2020) of acquired data (we used version 001 of the processed GEDI data). Currently, three products (L1B, L2A, and L2B) are available for download. The L1B data product [17] contains detailed information about the transmitted and received waveforms, the location and elevation of each waveform footprint, and other ancillary information, such as the mean and standard deviation of the noise, and acquisition dates and times. The L2A product [18] contains data of elevation and height metrics of the vertical structures within the waveform. These height metrics are issued from the processing of the received waveforms from the L1B product. Finally, the L2B data product [19] provides footprint-level vegetation metrics such as canopy cover, vertical profile metrics, plant area index (PAI), and foliage height diversity (FHD). In this study, the number of detected peaks, local acquisition hour (LH), the amplitude of the extended Gaussian fit to the transmitted waveform (ATW), and the viewing angle of the laser at acquisition time (VA) were extracted from the L1B data product and used. Overall, 103,363,533 GEDI shots were acquired over our three study sites, with 86,288,642 shots acquired over metropolitan France, 12,590,033 shots acquired over Tunisia, and 4,484,858 shots acquired over French Guiana.
2.3. Meteosat Second Generation Satellites
The Meteosat Second Generation satellites (MSG) are a system of satellites established under cooperation between the European Organization for the Exploitation of Meteorological Satellites (EUMETSAT) and the European Space Agency (ESA). MSG operates in geostationary orbit at 36,000 km altitude over Europe and Africa and provides detailed full disc imagery for the detection of fast-developing severe weather, weather forecasting, and climate monitoring. MSG’s main instrument is the Spinning Enhanced Visible and InfraRed Imager (SEVIRI), and it observes the Earth in 12 spectral channels. Eight of the channels are in the thermal infrared spectrum and provide, among other, data about the temperatures of clouds, land, and sea surfaces at 3 km resolution at nadir (~5 km over Europe or Guiana). One of the channels is the high-resolution visible (HRV) channel, and it has a sampling distance at nadir of 1 km. EUMETSAT products are already processed by the Satellite Application Facilities (SAF) in support of nowcasting and very short-range forecasting (NWC). Finally, cloud processed products are provided each 15 min, if image latency (difference between acquisition time and image availability time) is more than 3 h, and each hour if latency is less than 3 h. In this study, we used the following four cloud products (https://www.icare.univ-lille.fr (access on 6 August 2021)):
- Cloud mask (CMA): The main purpose of the CMA product is to outline all cloud-free pixels in a satellite scene at each acquisition with very high accuracy. More in detail, the CMA product is used to separate GEDI cloudy acquisitions from cloud-free acquisitions.
- Cloud type (CT): The cloud type product is used to classify cloud types based on the elevation and the transparency of clouds, and contains 15 classes.
- Cloud top temperatures and heights (CTTH): The CTTH product contains information regarding cloud top heights (CTH) and cloud top temperatures (CTT) for all the pixels identified as cloudy from the CMA product in a given satellite scene.
- Cloud effective cloudiness (CEC): The CEC provides a cloudiness rating ranging from 0 (semitransparent clouds) to 1 (thick clouds).
A detailed description of the algorithm for the generation of the cloud products can be found in the Algorithm Theoretical Basis Document for Cloud Products Processors of the NWC/GEO [20].
2.4. MODIS Terra Cloud Products
In addition to the MSG dataset, three MODIS Terra cloud products were also used (http://neo.sci.gsfc.nasa.gov/Search.html (access on 6 August 2021)). In contrast to the MSG cloud products, the MODIS Terra cloud products are daily averages of cloud properties, and they are available at a resolution of 0.1° × 0.1° (~11 km by ~11 km at the Equator). The following MODIS Terra products were used in this study:
- Cloud optical thickness (COT): COT represents the transparency of the cloud, and it measures the degree at which the cloud prevents light from passing. Moreover, COT is directly dependent on the cloud thickness, the liquid or ice water content, and the size distribution of the water droplets or ice crystals.
- Cloud water content (CWC): CWC is a measure of the total amount of liquid or ice water contained in a cloud in a vertical 0.1° × 0.1° column of atmosphere, expressed in g/m2.
- Aerosol optical depth (AOD): AOD is a measure of how much sunlight is blocked from reaching the ground due to the presence of aerosol particles such as dust, haze, or smoke. AOD is a dimensionless variable that can be related to the amount of aerosol in the atmospheric column. The product is available at 0.1° × 0.1° resolution.
2.5. SRTM DEM
The Shuttle Radar Topography Mission (SRTM) digital elevation model (DEM) with a spatial resolution of 30 m was used in this study in order to compare GEDI and the SRTM DEM elevation differences between viable and nonviable GEDI shots.
2.6. Methodology
While the GEDI instrument captured an unprecedented amount of FW LiDAR globally, not all the acquired shots are viable for further processing. Noisy or nonviable GEDI acquisitions are caused by instrumental factors (e.g., low power at firing time) or due to instrumental and atmospheric factors at the same time. The atmospheric factors that affect the GEDI acquisition are mostly related to the composition of the clouds, and the GEDI return signal’s strength will greatly vary between cloud-free shots and clouded acquisitions. For example, COT is a measure of how much light is attenuated due to the scattering and absorption by the cloud droplets. Thus, the higher the COT, the lower the probability of GEDI to pass through and return. Another atmospheric factor is the cloud’s water content that attenuates GEDI signals due to light absorption by the water droplets or ice crystals.
In order to analyze in depth the effects of the instrumental and environmental factors affecting the GEDI signal, GEDI waveforms need to be separated between viable and nonviable acquisitions. Traditionally, viable FW LiDAR acquisitions were selected based on several filters, such as a low difference between the waveform’s elevation and that from the SRTM DEM; a high signal-to-noise ratio; the removal of saturated waveforms; and finally, using cloud-free shots. In this study, viable GEDI shots were selected based on the number of detected modes from the L2A data product. In essence, we consider a GEDI waveform to be viable if the number of detected modes in the waveform is higher than or equal to one (Figure 2a,b). Nonviable shots refer to acquisitions where no peaks were detected in the waveform (i.e., noisy waveforms, Figure 2c).
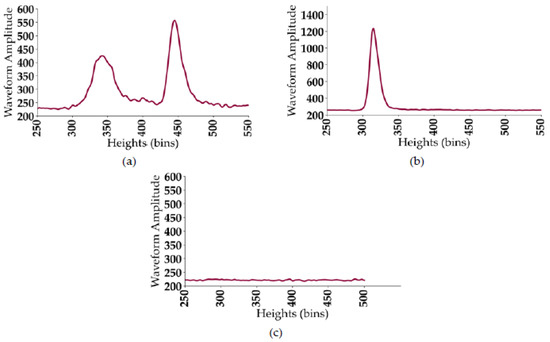
Figure 2.
Example of different GEDI acquisitions. (a) Waveform acquired over forest stands (two modes); (b) waveform acquired over bare grounds (one mode); and (c) nonviable waveform (zero modes). One (1) bin is equivalent to one (1) ns that corresponds to 15 cm sampling distance in the waveform. The waveform amplitudes are counts from the analog-to-digital converter (ADC) on the instrument.
Next, GEDI shots were separated between cloud-free and cloudy acquisitions using the CMA dataset. The nonviable GEDI shots from the cloud-free datasets were analyzed based on instrumental variables, as well as the time of acquisition and the aerosol optical depth. For cloudy acquisitions, the nonviability of the GEDI shots was analyzed based on instrumental variables, time of acquisition, and cloud properties at acquisition time.
Finally, in order to determine which of the instrumental and environmental variables had the most effect on the nonviability of the GEDI acquisitions, a variable importance test was carried out through a random forest classifier. The random forest classifier has the objective of classifying GEDI shots as either viable or nonviable, based on instrumental and/or environmental variables. Variable importance is based on the mean decrease of accuracy (MDA) and is measured as follows: first, the predictive accuracy (a) of the full model (model using all the variables) is calculated. Next, the variable with which to calculate its importance (v) is permuted N iterations, and at each iteration (i), model accuracy is calculated (). Finally, the importance of v () is
Two random forest classifiers were built. The first classifier considers only cloud-free GEDI shots, while the second classifier considers only cloudy GEDI shots. The variables used for each classifier are presented in Table 1.

Table 1.
Variables used for each random forest classifier to analyze each variable’s importance in the case of cloud-free acquisitions and cloudy acquisitions. IAF corresponds to instrumental and acquisition time factors. AF corresponds to atmospheric factors.
3. Results and Discussion
The results presented in the following sections represent the analysis results over the combined data from the three study sites. As the results were similar for each study site, a decision was made to combine the data from the three sites in order to obtain a larger dataset with more robust conclusions.
3.1. Overall Quality of GEDI Acquisitions
The results presented in Table 2 show that, due to favorable climatic conditions (less frequent clouds), the highest number of viable GEDI acquisitions is observed over Tunisia with 81.7% of the 12.59 M acquisitions. Over France and French Guiana, the number of viable shots decreases to, respectively, 55.3% and 48.5%.

Table 2.
Summary of the quality of GEDI acquisitions over the three study sites.
For the three countries, the percentage of viable GEDI shots correspond mostly to cloud-free acquisitions, with 83.0% of viable shots acquired in the absence of clouds over Tunisia, 65.5% over France, and 52.4% over French Guiana. Nonetheless, GEDI acquisitions could still be viable even over cloudy acquisitions, in particular for France (34.5% of shots) and French Guiana (47.6%). These viable cloudy acquisitions were most likely acquired in the presence of thin or transparent clouds that do not critically attenuate the LiDAR signal.
For nonviable shots, the majority of these shots were acquired in the presence of clouds; 73.7% of shots were nonviable over Tunisia, 91.4% over France, and 83.5% over French Guiana (Table 2). Over the three countries, 90% of nonviable GEDI acquisitions were due to atmospheric conditions (cloud presence), in contrast to 10% due to mostly instrumental factors.
3.2. Comparison between GEDI and SRTM DEM Elevations
We also compared GEDI elevations to the SRTM DEM elevations at 30 m resolution. In this study, we used the variable elevation called elev_lowestmode, which corresponds to the elevation of the center of the last-detected mode (essentially the ground elevation). It should be noted that the reported ground elevation is accurate only for viable shots. For nonviable shots, the reported elevation is not accurate, as it could correspond to the elevation of the clouds (if no penetration of the LiDAR signal occurred). The analysis carried out on the whole database (three countries with ~103 M shots) shows that for the nonviable data, 96.5% of the GEDI elevations have a difference of greater than 50 m from the SRTM DEM elevations, and close to 70% of the elevations have a difference of greater than 400 m. For viable data, 86% of GEDI shots have elevations within 50 m of SRTM data, and the remaining 14% have a difference between 50 and 100 m.
The comparison of GEDI and SRTM elevations over French Guiana (study site with almost exclusively forest cover) shows that close to 85% of the difference between SRTM and GEDI elevations is less than 50 m, with the remaining differences (~15%) being less than 100 m (Figure 3). The obtained results show a good agreement between the elevations of viable GEDI shots and SRTM DEM elevations as the canopy height map of French Guiana displays canopy heights reaching 55 m [21]. Indeed, Bourgine and Baghdadi [22] assessed the C-band SRTM DEM over French Guiana and found that the accuracy of elevations is about 10 m (standard deviation of errors). Moreover, in their study they reported that the elevations provided by the SRTM DEM correspond to the elevation of the canopy cover in addition to a slight penetration (between 2.3, for very dense forests, and 8.5 m, in comparison to aerial laser scanning (ALS) elevations, with the highest bias corresponding to the most dense forest areas). Therefore, and as an example, for canopy heights of about 55 m, the difference between the elevations provided by the SRTM DEM (elevation of canopy cover—minimum penetration) and a viable GEDI shot’s elevation (ground elevation) would be in the order of ~50 m (55 m–2.3 m).
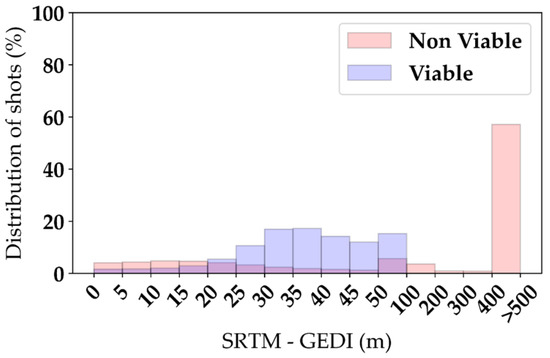
Figure 3.
Distribution of the difference between SRTM DEM and GEDI elevations for GEDI shots acquired over French Guiana. Data were analyzed separately for viable and nonviable shots.
3.3. Quality of Cloud-Free GEDI Acquisitions
In this section, we analyzed the dependency between the nonviable cloud-free GEDI data and instrumental factors (viewing angle (VA), amplitude of fit-transmitted waveform (ATW)), and other factors, such as the time of acquisition (local hour (LH)) and aerosol optical depth (AOD). The analysis is based on the combined GEDI data over the three countries (43.8% of all the acquired data were cloud-free).
The results presented in Figure 4a show that the percentage of nonviable shots slightly increases with increasing VA. In fact, less than 5% increase was observed, in nonviable shots, between GEDI data acquired with low VA (≤0.5°) and those acquired with a relatively large VA (≥2.5°).
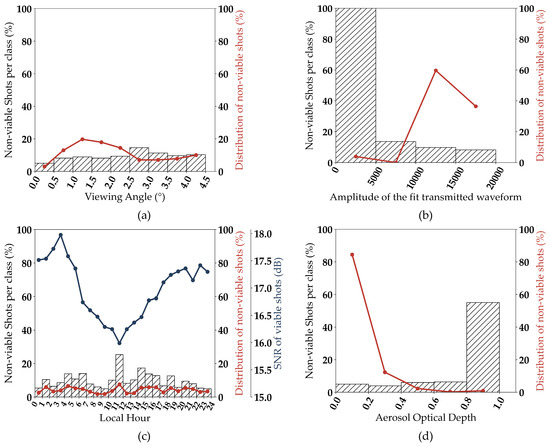
Figure 4.
Percentage of nonviable GEDI data (in %) acquired without clouds according to (a) viewing angle; (b) amplitude of the fit-transmitted energy; (c) local hour (SNR of viable shots in blue); and (d) aerosol optical depth.
Regarding the amplitude of the fit-transmitted waveform (ATW), Figure 4b shows that all the shots with ATW lower than 5000 were nonviable. Nonetheless, GEDI acquisitions with ATW lower than 5000 represent less than 5% of all GEDI acquisitions. For acquisitions with higher ATW (ATW ≥ 10,000), the influence of the amplitude of the transmitted waveform on the viability of the shots is very weak, as only a very light decrease of nonviable shots was observed with increasing ATW. These results indicate that the ATW of the majority of GEDI acquisitions (more than 95%) is optimal and ensures received waveforms with good quality.
Regarding the effect of acquisition time on the viability of GEDI waveforms, the results presented in Figure 4c show that the percentage of nonviable shots is highest around noon (between 11 am and 12 pm local time), with around 25% of the total shots being nonviable. Indeed, it is known that the amount of solar radiation is at a maximum around 12:00 (noon) when the sun is directly overhead [14]. The high noise induced by the solar radiation could explain the higher percentage of nonviable shots acquired between 11:00 and 12:00 local time. Moreover, solar radiation noise also affects the quality of the viable footprints. Indeed, our analysis of the signal-to-noise ratio (SNR, defined as 10 × log10 of the ratio of the difference between the maximum amplitude and the mean background noise to the standard deviation of the background noise) showed that the acquisitions with the lowest SNR were footprints acquired between 11:00 and 13:00 local time, with SNR differences reaching almost 2dB between footprints acquired around noon (lowest SNR) and those acquired in the early morning or late at night (highest SNR) (Figure 4c, SNR of viable shots).
Finally, we analyzed the effect of the presence of aerosol particles (AOD) on the nonviability of acquisitions. The results in Figure 4d show that around 55% of GEDI acquisitions with high AOD (≥0.8) were nonviable, in contrast to less than 15% for AOD ≤ 0.4. However, the percentage of shots acquired with AOD ≥ 0.8 represent less than 0.4% of all acquisitions. This can be related to the expected signal attenuation for a two-way transmission through a layer of varying optical thickness. Aerosol optical depths of 0.1, 0.2, 0.4, 0.8, and 1.2 will, respectively, yield a signal attenuation of 18%, 33%, 55%, 80%, and 90%. From these figures, we can estimate that the GEDI LiDAR signal level enables a significant fraction of viable shots to be recorded as long as the aerosol optical depth remains below 0.4, while optical depths greater than 0.8 will block about half of the signal, and optical depths greater than 1.2 are likely to completely prevent acquisitions of viable shots.
3.4. Quality of Cloudy GEDI Acquisitions
The nonviability of GEDI acquisitions in the presence of clouds is mostly related to the cloud attenuation or multiple scattering by clouds on the backscattered LiDAR signal. This is evident by the fact that the percentage of nonviable GEDI waveforms increased from 9.5% over cloud-free acquisitions (number of cloud-free nonviable shots divided by the number of all cloud-free shots) to 66.9% over cloudy acquisitions (number of cloudy nonviable shots divided by the number of all cloudy shots). The effects of multiple scattering by clouds on the backscattered LiDAR signal are well known [23]. In general, scattered photons take a longer path than photons that travel in a clear medium, which increases their travel time and biases their range measurements [24,25], and sometimes photon travel time is stretched beyond recognition [26]. Moreover, given the narrow field-of-view of the receiver, the backscattered photons may not even be captured by the instrument. Nonetheless, not all cloudy GEDI acquisitions are affected in the same manner, as the composition of the clouds (e.g., cloud optical thickness, water content), as well as their elevation and temperatures, play a major role in the multiple scattering and attenuation of the LiDAR signal [23,24,25,26].
Figure 5a shows that for semitransparent clouds, only 30% to 40% of shots were nonviable. This percentage of nonviable shots increased to more than 90% to 100% for clouds with higher opacity. The relationship between cloud opacity and the nonviability of GEDI shots is shown in more detail in Figure 5b. Figure 5b shows that for a cloud effective cloudiness (CEC) between 0 and 0.2 (i.e., very semitransparent clouds), the percentage of nonviable shots is less than 20%, and this percentage increases to more than 75% for CEC greater than 0.8 (i.e., very opaque clouds or fully cloudy pixels).
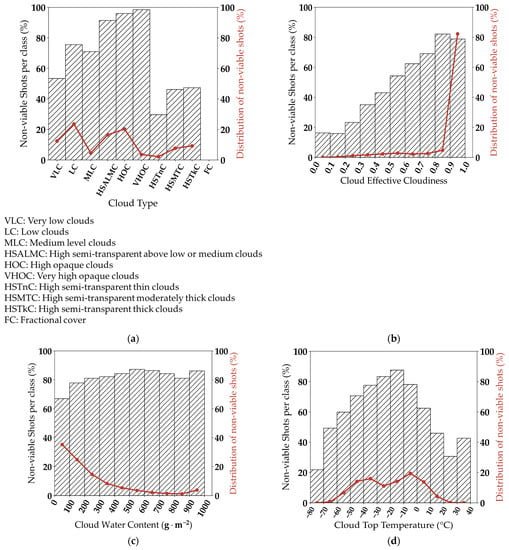
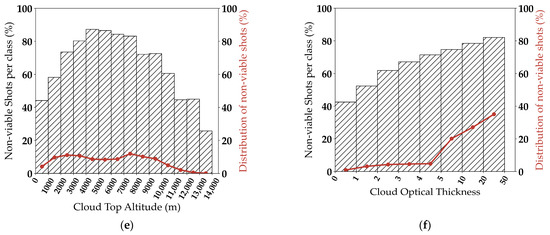
Figure 5.
Percentage of nonviable GEDI data (in %) acquired in cloudy conditions according to (a) cloud type; (b) cloud effective cloudiness; (c) cloud water content; (d) cloud top temperature; (e) cloud top altitude; and (f) cloud optical thickness.
For very low-, low-, and mid-level clouds (Figure 5a), the percentage of nonviable shots increased from ~58% for very low-level clouds to more than 75% for both low- and mid-level clouds. This increase is mostly related to the cloud water content (CWC) of the clouds (calculated from MODIS data), which increased from ~190 g/m2 for the very low clouds to ~230 g/m2 for low clouds and ~200 g/m2 for mid-level clouds. The effects of CWC on the nonviability of GEDI is shown in detail in Figure 5c. Indeed, for CWC between 0 and 100 g/m2, 70% of acquired shots were nonviable, while this percentage increased to around 80% for CWC greater than 100 g/m2.
Regarding cloud temperatures, Figure 5d shows that the percentage of nonviable shots increased when cloud temperatures increased from −80 °C (20% of shots are nonviable) to around 0 °C (80% of shots are nonviable). Then, for positive temperatures, the percentage of nonviable shots decreased to 40% for temperatures higher than 10 °C. The decrease of the percentage of nonviable shots with decreasing temperatures (e.g., for temperatures ≤−20 °C) is consistent with the fact that higher and colder clouds have higher probability of being thin semitransparent cirrus that can be transparent to LiDAR beams (slight or no attenuation of the LiDAR signal). With increasing temperatures (>−20 °C), the amount of ice crystals decreases and, thus, the percentage of nonviable shots increases due to the increased presence of water droplets that attenuate the LiDAR signal. Indeed, the average CWC at temperatures lower than −20 °C is 159.1 g/m2 and increases to 247.3 g/m2 for temperatures between −20 and 0 °C. Moreover, liquid clouds tend to have higher extinction due to higher particle concentrations than ice clouds, and are therefore more likely to completely block the LiDAR signal. For cloud temperatures between 0 and 10 °C, almost 60% of acquired shots are nonviable and this is again due to the presence of water droplets (average CWC of 199.3 g/m2). Finally, for cloud temperatures higher than 10 °C, the percentage of nonviable shots decreases to almost 40% due to the decrease in CWC, which has an average of 166.4 g/m2. It is also consistent with the fact that very low and warmer clouds tend to be fractional clouds that let the LiDAR signal partly pass through.
Moreover, results presented in Figure 5e show that the percentage of nonviable shots is the highest for clouds located at heights between three and eight km (~80% of shots are nonviable). These middle clouds include altocumulus and altostratus clouds. These clouds are usually composed of a higher content of liquid water droplets (average CWC of 241.8 g/m2) than clouds located at altitudes lower than three km (average CWC of 209.2 g/m2) and clouds higher than eight km (average CWC of 216.3 g/m2). In fact, for the clouds at altitudes lower than three km, and those higher than eight km, the percentage of nonviable shots varied between 25% and 70%.
Finally, Figure 5f shows that the percentage of nonviable GEDI shots increased with increasing cloud optical thickness (COT), similar to what was previously observed in the case of aerosols. For clouds, around 40% of nonviable shots were acquired when the COT was smaller than 1.0 and this number rapidly increased, reaching about 70% for optical thickness between 4.0 and 5.0, and 80% for COT greater than 20. It should be noted here that COTs greater than 3.0, corresponding to a signal attenuation of 99.7%, are most likely to yield 100% of nonviable shots if the cloud layer fully covers the GEDI field of view. Therefore, our interpretation of Figure 5f is that viable shots are still reported, probably due to broken cloud covers that let signals pass through unattenuated. This is confirmed by the almost linear increase of nonviable shot percentages with increasing effective cloud fraction (panel b of Figure 5). Effective cloud fraction corresponds to a radiatively equivalent cloud fraction such that a fully cloudy pixel with a low albedo can have the same radiative impact at the top of atmosphere (TOA) as a partly cloudy pixel containing broken clouds with a high albedo.
The effect of instrumental factors on the viability of GEDI shots acquired with cloudy conditions is similar to that of cloud-free acquisitions. Figure 6a shows that the percentage of nonviable shots decreased with increased ATW. For ATW below 5000, all the acquired GEDI shots were nonviable, as with cloud-free acquisitions. For the majority of the remaining GEDI shots (ATW between 5000 and 20,000), we observed a 10% decrease in the percentage of nonviable shots with increased ATW between 5000 and 10,000 to ATW between 15,000 and 20,000.
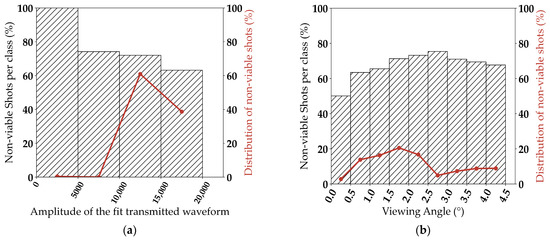
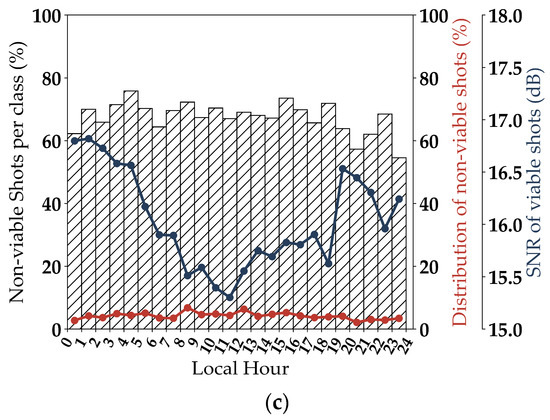
Figure 6.
Percentage of nonviable GEDI data (in %) acquired in cloudy conditions according to (a) amplitude of the fit-transmitted energy; (b) viewing angle; and (c) local hour (SNR of viable shots in blue).
Regarding the effect of the viewing angle, Figure 6b shows an increase in the percentage of nonviable shots with increased VA. Indeed, the percentage of nonviable shots increased from around 50% for VA between 0° and 0.5° to around 70% for VA higher than 2°.
In contrast to cloud-free shots, the time of acquisition does not present any clear effect on the nonviability of GEDI shots acquired in cloudy conditions (Figure 6c). This is mostly due to the presence of other factors (i.e., clouds) that have a stronger effect on GEDI’s LiDAR signal. Thus, the decoupling of the effect of solar noise from the other factors is not possible. Nonetheless, the effect of solar noise on the viable GEDI acquisitions is clear. Indeed, our analysis of the SNR of all viable shots in cloudy conditions showed that those acquired at noon had the lowest SNR (~1.5 dB difference to early morning acquisitions) (Figure 6c, SNR of viable shots).
3.5. Variable Importance Analysis
To analyze which variable has the most effect on the viability of GEDI acquisitions, two variable importance tests were carried out. The first test considers only cloud-free acquisitions, while the second considers only cloudy acquisitions. Moreover, in the case of cloudy acquisitions, the tested atmospheric variables could be highly collinear, and the permutation of one variable might have a little effect on the model’s performance, as the model can obtain the same information from another correlated variable. Therefore, in the case of cloudy acquisitions, in addition to the variable importance of each factor, we calculated the combined variable importance of all the atmospheric factors (AF, Table 1), as well as all the instrumental and acquisition time factors (IAF, Table 1).
For cloud-free acquisitions, the results in Figure 7a show that the variable most affecting the viability of GEDI acquisitions is the acquisition time (Figure 7a, LH) with a mean decrease in accuracy (MDA) of 39.5%, followed by the viewing angle (Figure 7a, VA) with an MDA of 31.2%. The aerosol optical depth (Figure 7a, AOD) has a weaker effect on the viable GEDI shots in comparison to LH and VA, with an MDA of 15.8%. Lastly, the ATW has the least effect on the acquired GEDI shots, with an MDA of 2.6%. The low effect of ATW is due to the very small number of acquired shots with ATW less than 5000.
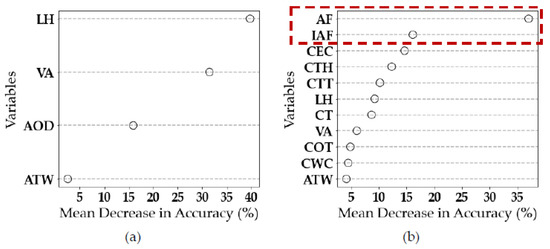
Figure 7.
Classification of the variable importance (a) in the case of cloud-free acquisitions using the instrumental (VA and ATW), acquisition time (LH), and environmental (AOD) factors, and (b) for cloudy acquisitions using atmospheric (CEC, CTH, CTT, CT, COT, CWC), instrumental (VA and ATW), and acquisition time (LH) factors. The importance is measured via the mean decrease in accuracy (MDA) over 50 repetitions.
For cloudy acquisitions, results showed that the combined importance of the atmospheric factors (Figure 7b, AF) has a much larger impact on the viability of GEDI acquisitions than the instrumental, acquisition time, and environmental factors (Figure 7b, IAF). Indeed, for AF, the reported MDA was 37.0%, in comparison to 16.0% for IAF. For the individual contribution of the variables on the viability of GEDI acquisitions in cloudy conditions, the most important variables were all atmospheric variables (CEC, CTH, CTT, and CT) with an MDA ranging between 9.7% and 14.5%, followed by the acquisition time (LH, MDA = 9.1%) and the viewing angle (VA, MDA = 6.0%). Finally, the variables with the least effect were the cloud optical thickness (COT), ATW, and cloud water content (CWC), with an MDA for the three variables of less than 5%. Nonetheless, and while both the cloud optical thickness and cloud water content have a significant impact on the penetration of LiDAR signals, and thus the viability of GEDI acquisitions, the apparent low importance of both COT and CWC is most probably due to the low temporal and spatial resolution of both variables. Indeed, the available COT and CWC variables are daily averages of, respectively, the cloud optical thickness and cloud water content at resolutions much lower (0.1° × 0.1°) than the size of GEDI footprints (25 m).
4. Conclusions
In this study, we analyzed several instrumental and environmental factors affecting the viability of GEDI acquisitions. The study was conducted over three countries across different climatic conditions. Our results over cloud-free GEDI acquisitions showed that the most contributing factor for the nonviability of GEDI shots is the acquisition time. Indeed, shots acquired around noon were the most nonviable due to solar noise, which is highest at these times. Moreover, with cloud-free conditions, the instrumental factors equally affecting the viability of GEDI acquisitions are the viewing angle, and the laser power (replaced by amplitude of the extended Gaussian fit to the transmitted waveform, ATW) in this study). Nonetheless, the percentage of affected GEDI shots due to the two previously mentioned instrumental factors is very small. In summary, with cloud-free conditions, nonviable shots represent 25% of the total acquisitions over French Guiana and less than 10% over Tunisia and France (number of cloud-free nonviable shots divided by the number of all cloud-free shots).
Our analysis of nonviable shots with cloudy conditions showed that climatic factors have the most effect on the quality of GEDI acquisitions. In fact, with cloudy conditions, close to 65% of shots were nonviable over France and French Guiana, and 49% over Tunisia. The percentage of nonviable shots with cloudy conditions is dependent on cloud characteristics, as it increases with cloud water content and opacity.
Overall, nonviable GEDI data represent less than 50% of total GEDI acquisitions across the different instrumental, climatic, and environmental conditions, which is an improvement in comparison to its predecessor, the ICESat-1, where the acquisition viability was lower due to the occasional low transmitted energy. Even though slightly less than half of GEDI acquisitions are unexploitable, GEDI acquired, and is still acquiring, an unprecedented amount of full-waveform acquisitions globally.
Author Contributions
I.F.: conceptualization, methodology, software, validation, formal analysis, data curation, visualization, writing—original draft. N.B.: conceptualization, methodology, validation, formal analysis, data curation, writing—original draft. J.R.: validation, formal analysis, data curation, writing—original draft. All authors have read and agreed to the published version of the manuscript.
Funding
This research received funding from the French Space Study Center (CNES, TOSCA 2021 project), the National Research Institute for Agriculture, Food and the Environment (INRAE), and the French Research Infrastructure “Data Terra” with its land component “Theia”.
Data Availability Statement
GEDI data were downloaded free of charge from the Land Processes Distributed Active Archive Center. MODIS data were downloaded from NASA’s Earth Observations (NEO) platform. MSG data were downloaded from the ICARE thematic center.
Acknowledgments
The authors would like to thank the GEDI team and the NASA Land Processes Distributed Active Archive Center (LPDAAC) for providing the GEDI data. The authors would also like to thank the ICARE thematic center for the processing and providing the MSG data.
Conflicts of Interest
The authors declare no conflict of interest.
References
- Fernandez-Diaz, J.; Carter, W.; Shrestha, R.; Glennie, C. Now You See It… Now You Don’t: Understanding Airborne Mapping LiDAR Collection and Data Product Generation for Archaeological Research in Mesoamerica. Remote Sens. 2014, 6, 9951–10001. [Google Scholar] [CrossRef] [Green Version]
- Fayad, I.; Baghdadi, N.; Guitet, S.; Bailly, J.-S.; Hérault, B.; Gond, V.; El Hajj, M.; Tong Minh, D.H. Aboveground Biomass Mapping in French Guiana by Combining Remote Sensing, Forest Inventories and Environmental Data. Int. J. Appl. Earth Obs. Geoinf. 2016, 52, 502–514. [Google Scholar] [CrossRef] [Green Version]
- Abdallah, H.; Bailly, J.-S.; Baghdadi, N.; Lemarquand, N. Improving the Assessment of ICESat Water Altimetry Accuracy Accounting for Autocorrelation. ISPRS J. Photogramm. Remote Sens. 2011, 66, 833–844. [Google Scholar] [CrossRef] [Green Version]
- Coops, N.C.; Tompalski, P.; Goodbody, T.R.H.; Queinnec, M.; Luther, J.E.; Bolton, D.K.; White, J.C.; Wulder, M.A.; van Lier, O.R.; Hermosilla, T. Modelling Lidar-Derived Estimates of Forest Attributes over Space and Time: A Review of Approaches and Future Trends. Remote Sens. Environ. 2021, 260, 112477. [Google Scholar] [CrossRef]
- Hermosilla, T.; Palomar-Vázquez, J.; Balaguer-Beser, Á.; Balsa-Barreiro, J.; Ruiz, L.A. Using Street Based Metrics to Characterize Urban Typologies. Comput. Environ. Urban Syst. 2014, 44, 68–79. [Google Scholar] [CrossRef] [Green Version]
- Brenner, A.C.; DiMarzio, J.P.; Zwally, H.J. Precision and Accuracy of Satellite Radar and Laser Altimeter Data Over the Continental Ice Sheets. IEEE Trans. Geosci. Remote Sens. 2007, 45, 321–331. [Google Scholar] [CrossRef]
- Davis, A.B. Multiple-Scattering Lidar from Both Sides of the Clouds: Addressing Internal Structure. J. Geophys. Res. 2008, 113, D14S10. [Google Scholar] [CrossRef] [Green Version]
- Wehr, A.; Lohr, U. Airborne Laser Scanning—An Introduction and Overview. ISPRS J. Photogramm. Remote Sens. 1999, 54, 68–82. [Google Scholar] [CrossRef]
- Wagner, W.; Ullrich, A.; Melzer, T.; Briese, C.; Kraus, K. From Single-Pulse to Full-Waveform Airborne Laser Scanners: Potential and Practical Challenges. Int. Arch. Photogramm. Remote Sens Spat. Inf. Sci 2004, 35, 201–206. [Google Scholar]
- Alexander, C.; Tansey, K.; Kaduk, J.; Holland, D.; Tate, N.J. Backscatter Coefficient as an Attribute for the Classification of Full-Waveform Airborne Laser Scanning Data in Urban Areas. ISPRS J. Photogramm. Remote Sens. 2010, 65, 423–432. [Google Scholar] [CrossRef] [Green Version]
- Winker, D.M.; Couch, R.H.; McCormick, M.P. An Overview of LITE: NASA’s Lidar In-Space Technology Experiment. Proc. IEEE 1996, 84, 164–180. [Google Scholar] [CrossRef]
- Schutz, B.E.; Zwally, H.J.; Shuman, C.A.; Hancock, D.; DiMarzio, J.P. Overview of the ICESat Mission. Geophys. Res. Lett. 2005, 32, L21S01. [Google Scholar] [CrossRef] [Green Version]
- Abshire, J.B.; Sun, X.; Riris, H.; Sirota, J.M.; McGarry, J.F.; Palm, S.; Yi, D.; Liiva, P. Geoscience Laser Altimeter System (GLAS) on the ICESat Mission: On-Orbit Measurement Performance. Geophys. Res. Lett. 2005, 32, L21S02. [Google Scholar] [CrossRef] [Green Version]
- Baghdadi, N.N.; El Hajj, M.; Bailly, J.-S.; Fabre, F. Viability Statistics of GLAS/ICESat Data Acquired Over Tropical Forests. IEEE J. Sel. Top. Appl. Earth Obs. Remote Sens. 2014, 7, 1658–1664. [Google Scholar] [CrossRef] [Green Version]
- Dubayah, R.; Blair, J.B.; Goetz, S.; Fatoyinbo, L.; Hansen, M.; Healey, S.; Hofton, M.; Hurtt, G.; Kellner, J.; Luthcke, S.; et al. The Global Ecosystem Dynamics Investigation: High-Resolution Laser Ranging of the Earth’s Forests and Topography. Sci. Remote Sens. 2020, 1, 100002. [Google Scholar] [CrossRef]
- Peel, M.C.; Finlayson, B.L.; McMahon, T.A. Updated World Map of the Köppen-Geiger Climate Classification. Hydrol. Earth Syst. Sci. 2007, 11, 1633–1644. [Google Scholar] [CrossRef] [Green Version]
- Dubayah, S.L.R. GEDI L1B Geolocated Waveform Data Global Footprint Level V001; NASA: Washington, DC, USA, 2020.
- Dubayah, S.L.R. GEDI L2A Elevation and Height Metrics Data Global Footprint Level V001; NASA: Washington, DC, USA, 2020.
- Dubayah, S.L.R. GEDI L2B Canopy Cover and Vertical Profile Metrics Data Global Footprint Level V001; NASA: Washington, DC, USA, 2020.
- Le Gléau, H. Algorithm Theroretical Basis Document for Cloud Products Processors of the NWC/GEO; Météo-France: Paris, France, 2016. [Google Scholar]
- Fayad, I.; Baghdadi, N.; Bailly, J.-S.; Barbier, N.; Gond, V.; Hérault, B.; El Hajj, M.; Fabre, F.; Perrin, J. Regional Scale Rain-Forest Height Mapping Using Regression-Kriging of Spaceborne and Airborne LiDAR Data: Application on French Guiana. Remote Sens. 2016, 8, 240. [Google Scholar] [CrossRef] [Green Version]
- Bourgine, B.; Baghdadi, N. Assessment of C-Band SRTM DEM in a Dense Equatorial Forest Zone. Comptes Rendus Geosci. 2005, 337, 1225–1234. [Google Scholar] [CrossRef]
- Spinhirne, J.D. Lidar Clear Atmosphere Multiple Scattering Dependence on Receiver Range. Appl. Opt. 1982, 21, 2467. [Google Scholar] [CrossRef]
- Duda, D.P.; Spinhirne, J.D.; Eloranta, E.W. Atmospheric Multiple Scattering Effects on GLAS Altimetry. I. Calculations of Single Pulse Bias. IEEE Trans. Geosci. Remote Sens. 2001, 39, 92–101. [Google Scholar] [CrossRef]
- Yang, W.; Ni-Meister, W.; Lee, S. Assessment of the Impacts of Surface Topography, off-Nadir Pointing and Vegetation Structure on Vegetation Lidar Waveforms Using an Extended Geometric Optical and Radiative Transfer Model. Remote Sens. Environ. 2011, 115, 2810–2822. [Google Scholar] [CrossRef]
- Davis, A.B. Some New Lidar Equations for Laser Pulses Scattered Back from Optically Thick Media Such as Clouds, Dense Aerosol Plumes, Sea Ice, Snow, and Turbid Coastal Water; Singh, U.N., Ed.; SPIE: San Diego, CA, USA, 2013; p. 88720E. [Google Scholar]
Publisher’s Note: MDPI stays neutral with regard to jurisdictional claims in published maps and institutional affiliations. |
© 2021 by the authors. Licensee MDPI, Basel, Switzerland. This article is an open access article distributed under the terms and conditions of the Creative Commons Attribution (CC BY) license (https://creativecommons.org/licenses/by/4.0/).


