Article

Impact of Port Construction on the Spatial Pattern of Land Use in Coastal Zones Based on CLDI and LUT Models: A Case Study of Qingdao and Yantai

1
College of Geodesy and Geomatics, Shandong University of Science and Technology, Qingdao 266590, China
2
State Key Laboratory of Resources and Environmental Information System, Institute of Geographic Sciences and Natural Resources Research, Chinese Academy of Sciences, Beijing 100101, China
*
Author to whom correspondence should be addressed.
Remote Sens. 2021, 13(16), 3110; https://doi.org/10.3390/rs13163110
Submission received: 27 May 2021 / Revised: 31 July 2021 / Accepted: 1 August 2021 / Published: 6 August 2021
(This article belongs to the Special Issue GIS and RS in Ocean, Island and Coastal Zone)

Abstract

:
Ports are an important type of land use in coastal cities, and the development of ports has a significant influence on the spatial pattern of land use in port cities. However, the research focusing on economic indicators hardly reflects the process of changes in the spatial distribution of land development in coastal port cities. This paper introduces a spatial association rule method to establish a coastline and land development intensity (CLDI) model and land use transfer (LUT) model in the vertical direction of coastal zones to mine the association rules between shoreline change and land development intensity along the sea–land gradient in the Qingdao and Yantai coastal zones and to explore the important land development sequence patterns. The results showed that, in the early stage of regional development, the land development intensity decreased from sea to land. In the later stage, as the industry transferred to nearby towns, the land units with extremely strong and strong levels started to move to the end or middle of the sequence. With the improvement of the urban construction level, the simple LUT pattern sequence that increased building land through the occupation of cultivated land and forestland was replaced gradually by complex sequences with multiple components. The relationship between land development and distance from the port showed that the areas with strong land development intensity gradually moved from coastal to inland areas over time. Port shipping has a profound influence on port city land use patterns. Industrial transfer drives the development of surrounding towns during the metaphase. This trend was used to build a second port to realize the division of transportation capacity, as the old port’s carrying capacity tended to become saturated. This paper revealed the general changes in the important land use patterns in port areas through a comparative study of the Qingdao and Yantai port areas and the differences among different geographical locations and development processes. This study provides a reference for the rational planning of coastal zone spatial layouts and provides a model basis for the analysis of the spatial structure of coastal zones. This information can be used to coordinate the relationship between ports and cities and promote the sustainable development of coastal zones.

1. Introduction

Ports are an important node between sea and land, and port development drives land development and land use transformation in coastal zones [1]. Additionally, the port has a close connection with the hinterland of the city where it is located. On the one hand, cities provide both a material basis and policy and economic support for port construction and expansion. A port city uses its own location advantages to establish a complete logistics system for the port. On the other hand, port-led industrial agglomerations promote infrastructure and transportation construction, further affecting the development of industry and capital to hinterland cities, which is an important reason for coastal land change [2]. The interaction between ports and cities leads to the spatial pattern and structure of land use in port cities being different from those in general cities, and port cities exhibit a unique spatiotemporal distribution pattern from sea to land [3,4,5]. The spatial pattern of land use refers to the spatial allocation of land development intensity and the order of land use transfer in this study, which reflects the spatiotemporal characteristics and gradual changes in coastal zones [6,7,8].
The spatial evolution relationship between ports and cities is the focus of research on the process of port city development. Currently, the most relevant studies are focused on analyses of industrial structure, freight throughput, trade volume and other economic fields. For example, Peralta et al. (2020) presented a preliminary analysis of urban logistics spaces in Barranquilla and explored how to improve the city’s logistic system [6]. Debrie and Raimbault (2016) studied the roles of different urban functional departments in port planning and construction by comparing ports in Venlo and Strasbourg [7]. Mario et al. (2020) compared the development pattern of Algeciras-Gibraltar Bay in Spain and that of Osaka-Kobe Bay in Japan and studied port-city integration and the influence of large offshore engineering (reclamation works) [8]. In addition, we cannot ignore that there are other land use transformations in coastal areas that are the product of other reasons, such as real estate speculation, reclamation works and impact on economic social policies [9,10,11].
The spatial difference in land use patterns in coastal zones is very significant and requires a combination of big data for an effective analysis [12,13,14,15]. Currently, the close combination of data mining technology and geoscience studies has solved many scientific problems in geography [12,15]. Among them, the association rule algorithm has been widely used [16,17,18,19]. Association rule mining refers to discovering meaningful associations in a large data set to identify the correlations and laws between elements. For example, Wang (2013) searched for the optimal combination of dividing points from continuous intervals by employing genetic algorithms (GAs), in which the properties of the obtained strong association rules were treated as fitness functions to guide the algorithm iteration; then, they were used to mine the observation data from forest ecological stations to explore the relationships between forest growth and local temperature, humidity, precipitation, soil and other factors [20]. Bembenik (2014) presented a new method of mining spatial association rules and collocations in spatial data with extended objects using Delaunay diagrams. This method does not require previous knowledge of analyzed data or the specification of any space-related input parameters and is efficient in terms of execution time [21]. Abbes et al. (2018) proposed an efficient knowledge-based approach for vegetation monitoring using the normalized difference vegetation index (NDVI) time series combined with generated association rules to mine the relationship between climate factors and vegetation coverage in Northwestern Tunisia [22].
At present, the application of association rule mining in geoscience research has gradually focused on combinations with specific geographical elements. Mining the correlations between geographic elements strives to make it a suitable approach for a variety of geoscience research scenarios [17,23]. For example, Gharbi et al. (2016) built a predictive model by mining the association rules of land use change in the process of urbanization to predict the land use change in Nancy, France [23]. Alessandro and Tomaselli (2010) proposed and reformulated an association rule analysis (ARA) in the form of an in-depth investigation method of the spatial pattern of land cover and vegetation maps to reveal the effects of human manufacturers on the contiguous vegetation mosaics of natural and seminatural areas [24]. Anputhas et al. (2016) structured an association rule model of land use and environmental change to predict the adjacency relations between land use changes and the environment [25]. Ding et al. (2017 and 2019) developed a model based on the association rule algorithm to mine coastal land use sequence patterns in the sea–land direction and relied on this model to explore the spatial heterogeneity of land use in the coastal zone of Bohai Bay [26,27]. However, there have been few studies on the relationship between port construction and the spatial order and mutual allocation of land development intensity and land conversion mode. The impact of shipping and wharf construction on the regional development pattern and how to improve the utilization efficiency of port shorelines and to strengthen hinterland land development are problems that urgently need to be addressed in the development of coastal cities.
This study aims to reveal the sequence combination of land use patterns in the sea–land direction under different coastline change intensities in port cities, especially in port areas, and the distribution of the land use transfer pattern from sea to land. This paper selected the port areas of Qingdao and Yantai as the experimental area, and Landsat remote sensing images from 1990, 2000, 2010 and 2020 were used to extract the land use types. Then, an overlay analysis was performed to obtain land use change information. After that, according to the trend of the coastline, a sector-annular grid sample segmentation method was proposed to divide the coastal zone in the experimental area and calculate the land development intensity (LDI) level of each grid unit. The coastline and land development intensity (CLDI) model and land use transfer (LUT) model were established based on the units from sea to land to mine the spatial association rules by analyzing a decision table by means of the frequent pattern tree (FP-tree) algorithm. Finally, we compared the land development patterns and spatial association rules of the coastal zones of the two port cities and revealed the impact of port construction on the spatial pattern of the coastal zone. The results can provide a reference for exploring the coordinated development mode of ports and cities and the reasonable spatial layout of land and sea, which is conducive to promoting the sustainable development of coastal zones.

2. Materials and Methods
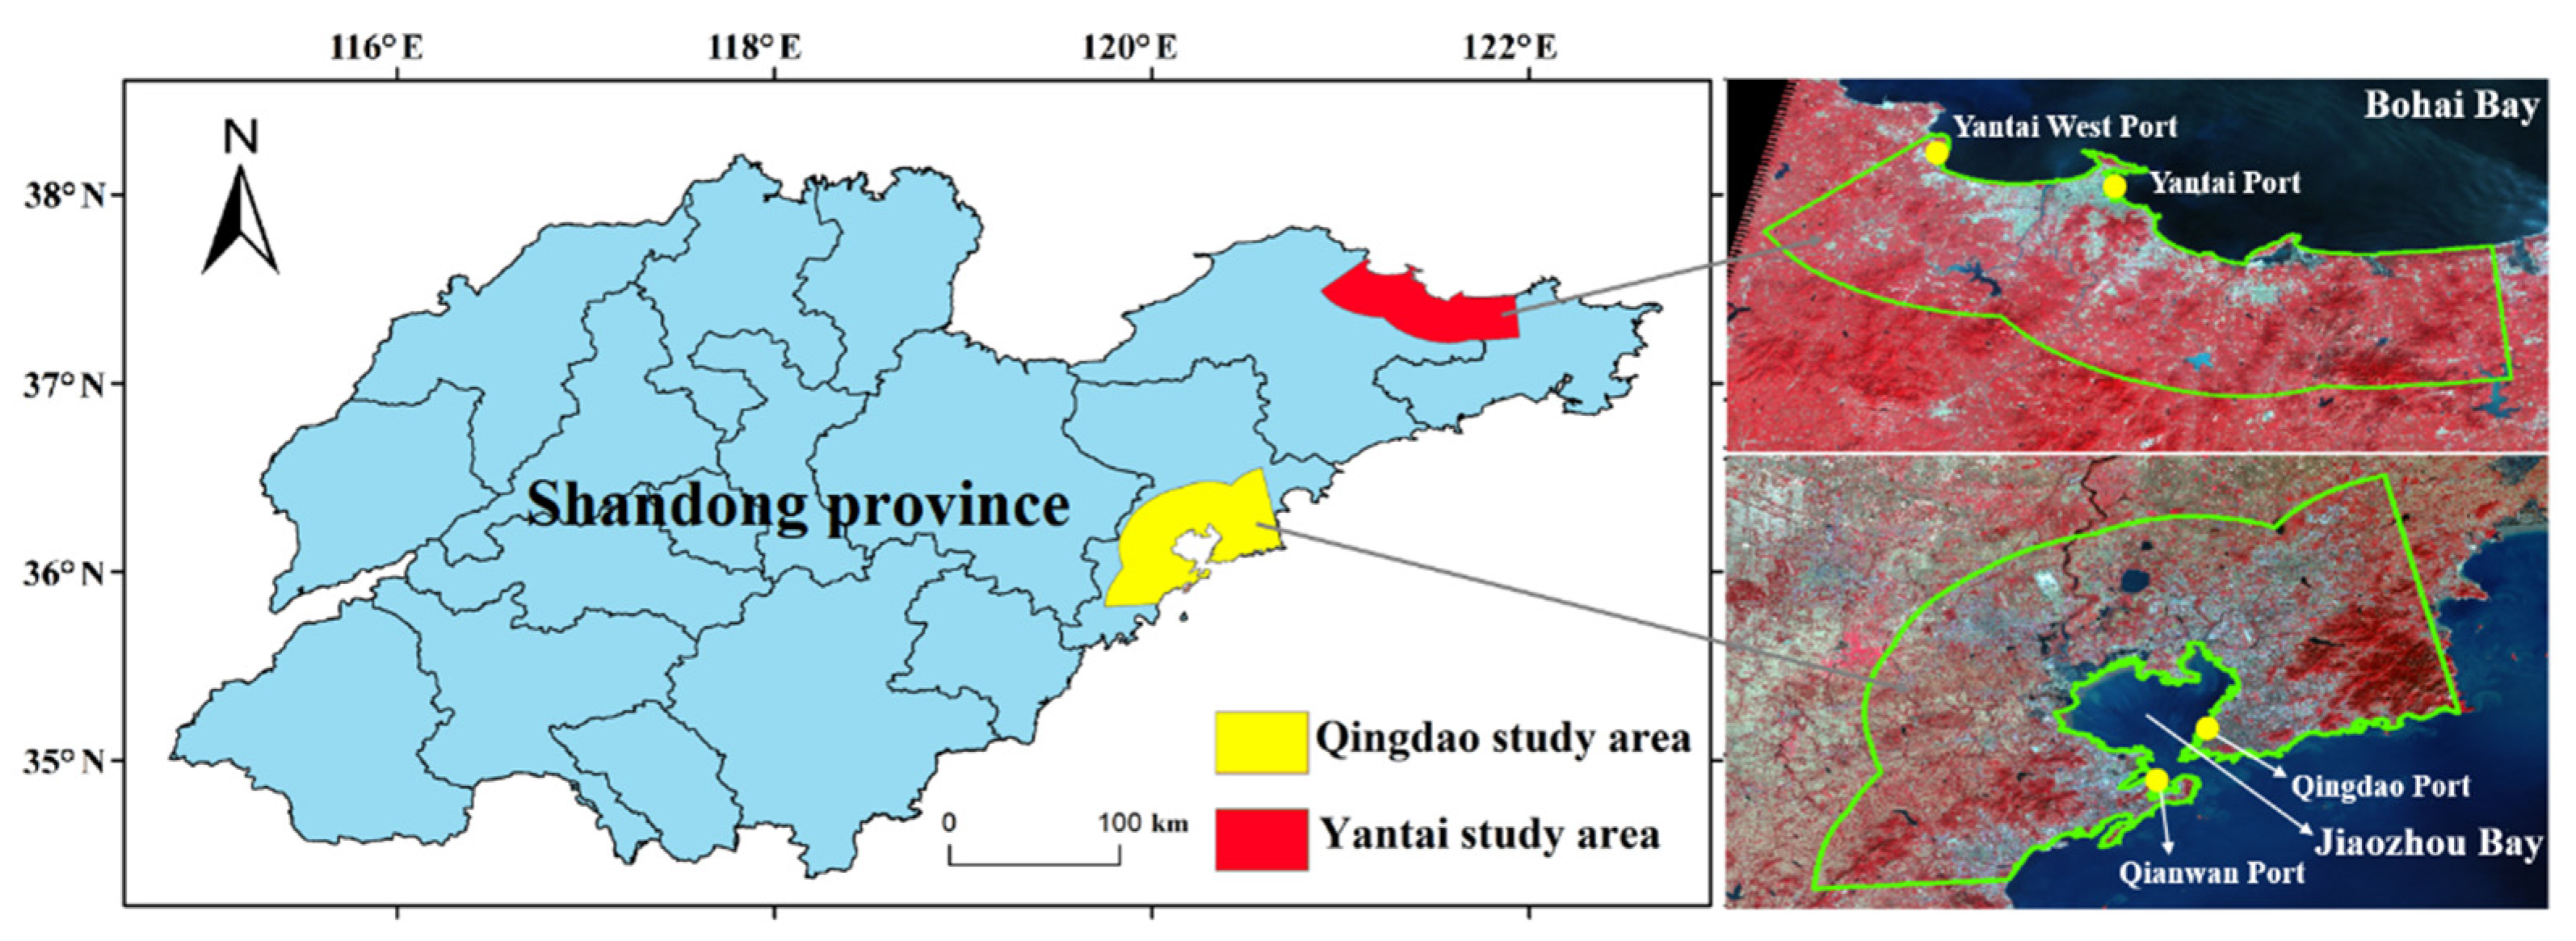
2.1. Study Area

This study selected the Qingdao Port area and Yantai Port area as the experimental coastal zones (Figure 1). Qingdao is located in the south of Jiaodong Peninsula, Shandong Province, China. Qingdao features a temperate monsoon climate with an average annual precipitation of 662 mm. The north and northwest are plains, and the southwest and east are dominated by low mountains and hills. The Laoshan area in the east has a typical mountainous terrain [28]. The ports of Qingdao, which are located in Jiaozhou Bay, mainly include Qingdao Port (the old port) and Qianwan Port. Yantai is located in the north of Jiaodong Peninsula. Qingdao also features a temperate monsoon climate, and the average annual precipitation is 525 mm. The main terrain in Yantai is low mountains and hills, and the low mountain area is located in the middle of Yantai City. The coastal plain is half-encircled by hills from west to east and faces Bohai Bay. In addition, there is a vast plain in the southeast [29]. The ports of Yantai include Yantai Port and Yantai West Port.
The port areas of Qingdao and Yantai were both used, and an area within 25 km perpendicular to the shoreline was selected as the experimental area. This region can fully reflect the development and construction processes of ports and coastal areas and can reflect the overall expansion of building land on the basis of effectively retaining the spatial trend of the coastline. Furthermore, it can reveal the development of adjacent regions to some extent.

2.2. Research Data

In this study, remote sensing images from 1990, 2000, 2010 and 2020 were obtained from the Landsat series satellite image dataset from the USGS [30]. The images taken in 1990, 2000 and 2010 were obtained from the Landsat-5 Thematic Mapper (TM) dataset and have a spatial resolution of 30 m, and the images taken in 2020 were obtained from the Landsat-8 Operational Land Imager (OLI) dataset and have a panchromatic band spatial resolution up to 15 m. Both were recorded in world geodetic system 1984 (WGS84) format. The radiometric calibration tool in ENVI 5.3 and the FLAASH atmospheric correction model were used to preprocess the images from various periods.

2.3. Remote Sensing Image Classification

Since the land use type information in this paper was used to calculate the LDI and represent the land use transfer pattern, only the first classification was extracted. The specific land use types included building land (BL), waters (Wa), aquaculture and salt field (AS), cultivated land (CL), forestland (FL), garden plot (GP) and other land (OL). The classification method of remote sensing images involves comprehensive index classification and visual interpretation to extract land use information from four periods (1990, 2000, 2010 and 2020).
The normalized difference water index (NDWI, Formula (1)) was used to separate Wa from the images, and then, the ASs were distinguished through visual interpretation [31]. Second, the NDVI (Formula (2)) was used to extract vegetation. In the category of vegetation [32], the NDVI value of FL was higher, and the NDVI value of the GPs was lower and then combined with visual interpretation to identify the boundaries of the FL, GPs and CL. The normalized difference built-up index (NDBI, Formula (3)) was established based on the reflectivity of the building land (impervious surface) in mid-infrared bands being higher than that in the near-infrared band, and the NDBI was used to extract the building land [33].
NDWI = (GreenNIR)/(Green + NIR)
NDVI = (NIRRed)/(NIR + Red)
NDBI = (MIRNIR)/(MIR + NIR)
After classifying the land use types of the Qingdao and Yantai study areas in four periods, it was necessary to revise the classification results by comparing them with each other. After that, the regions of interest (ROIs) of the land use types in different periods were selected on the Landsat TM or OLI images for precision validation, and the results were expressed by a confusion matrix. Taking the classification precision validation results of the two experimental areas in 2020 as an example, 20 samples were selected for each type of land as the ROI, and the confusion matrix is shown in Table 1 and Table 2. The verification results showed that the kappa coefficients were all greater than 0.8; thus, the accuracy of the interpretation met the needs of the study.

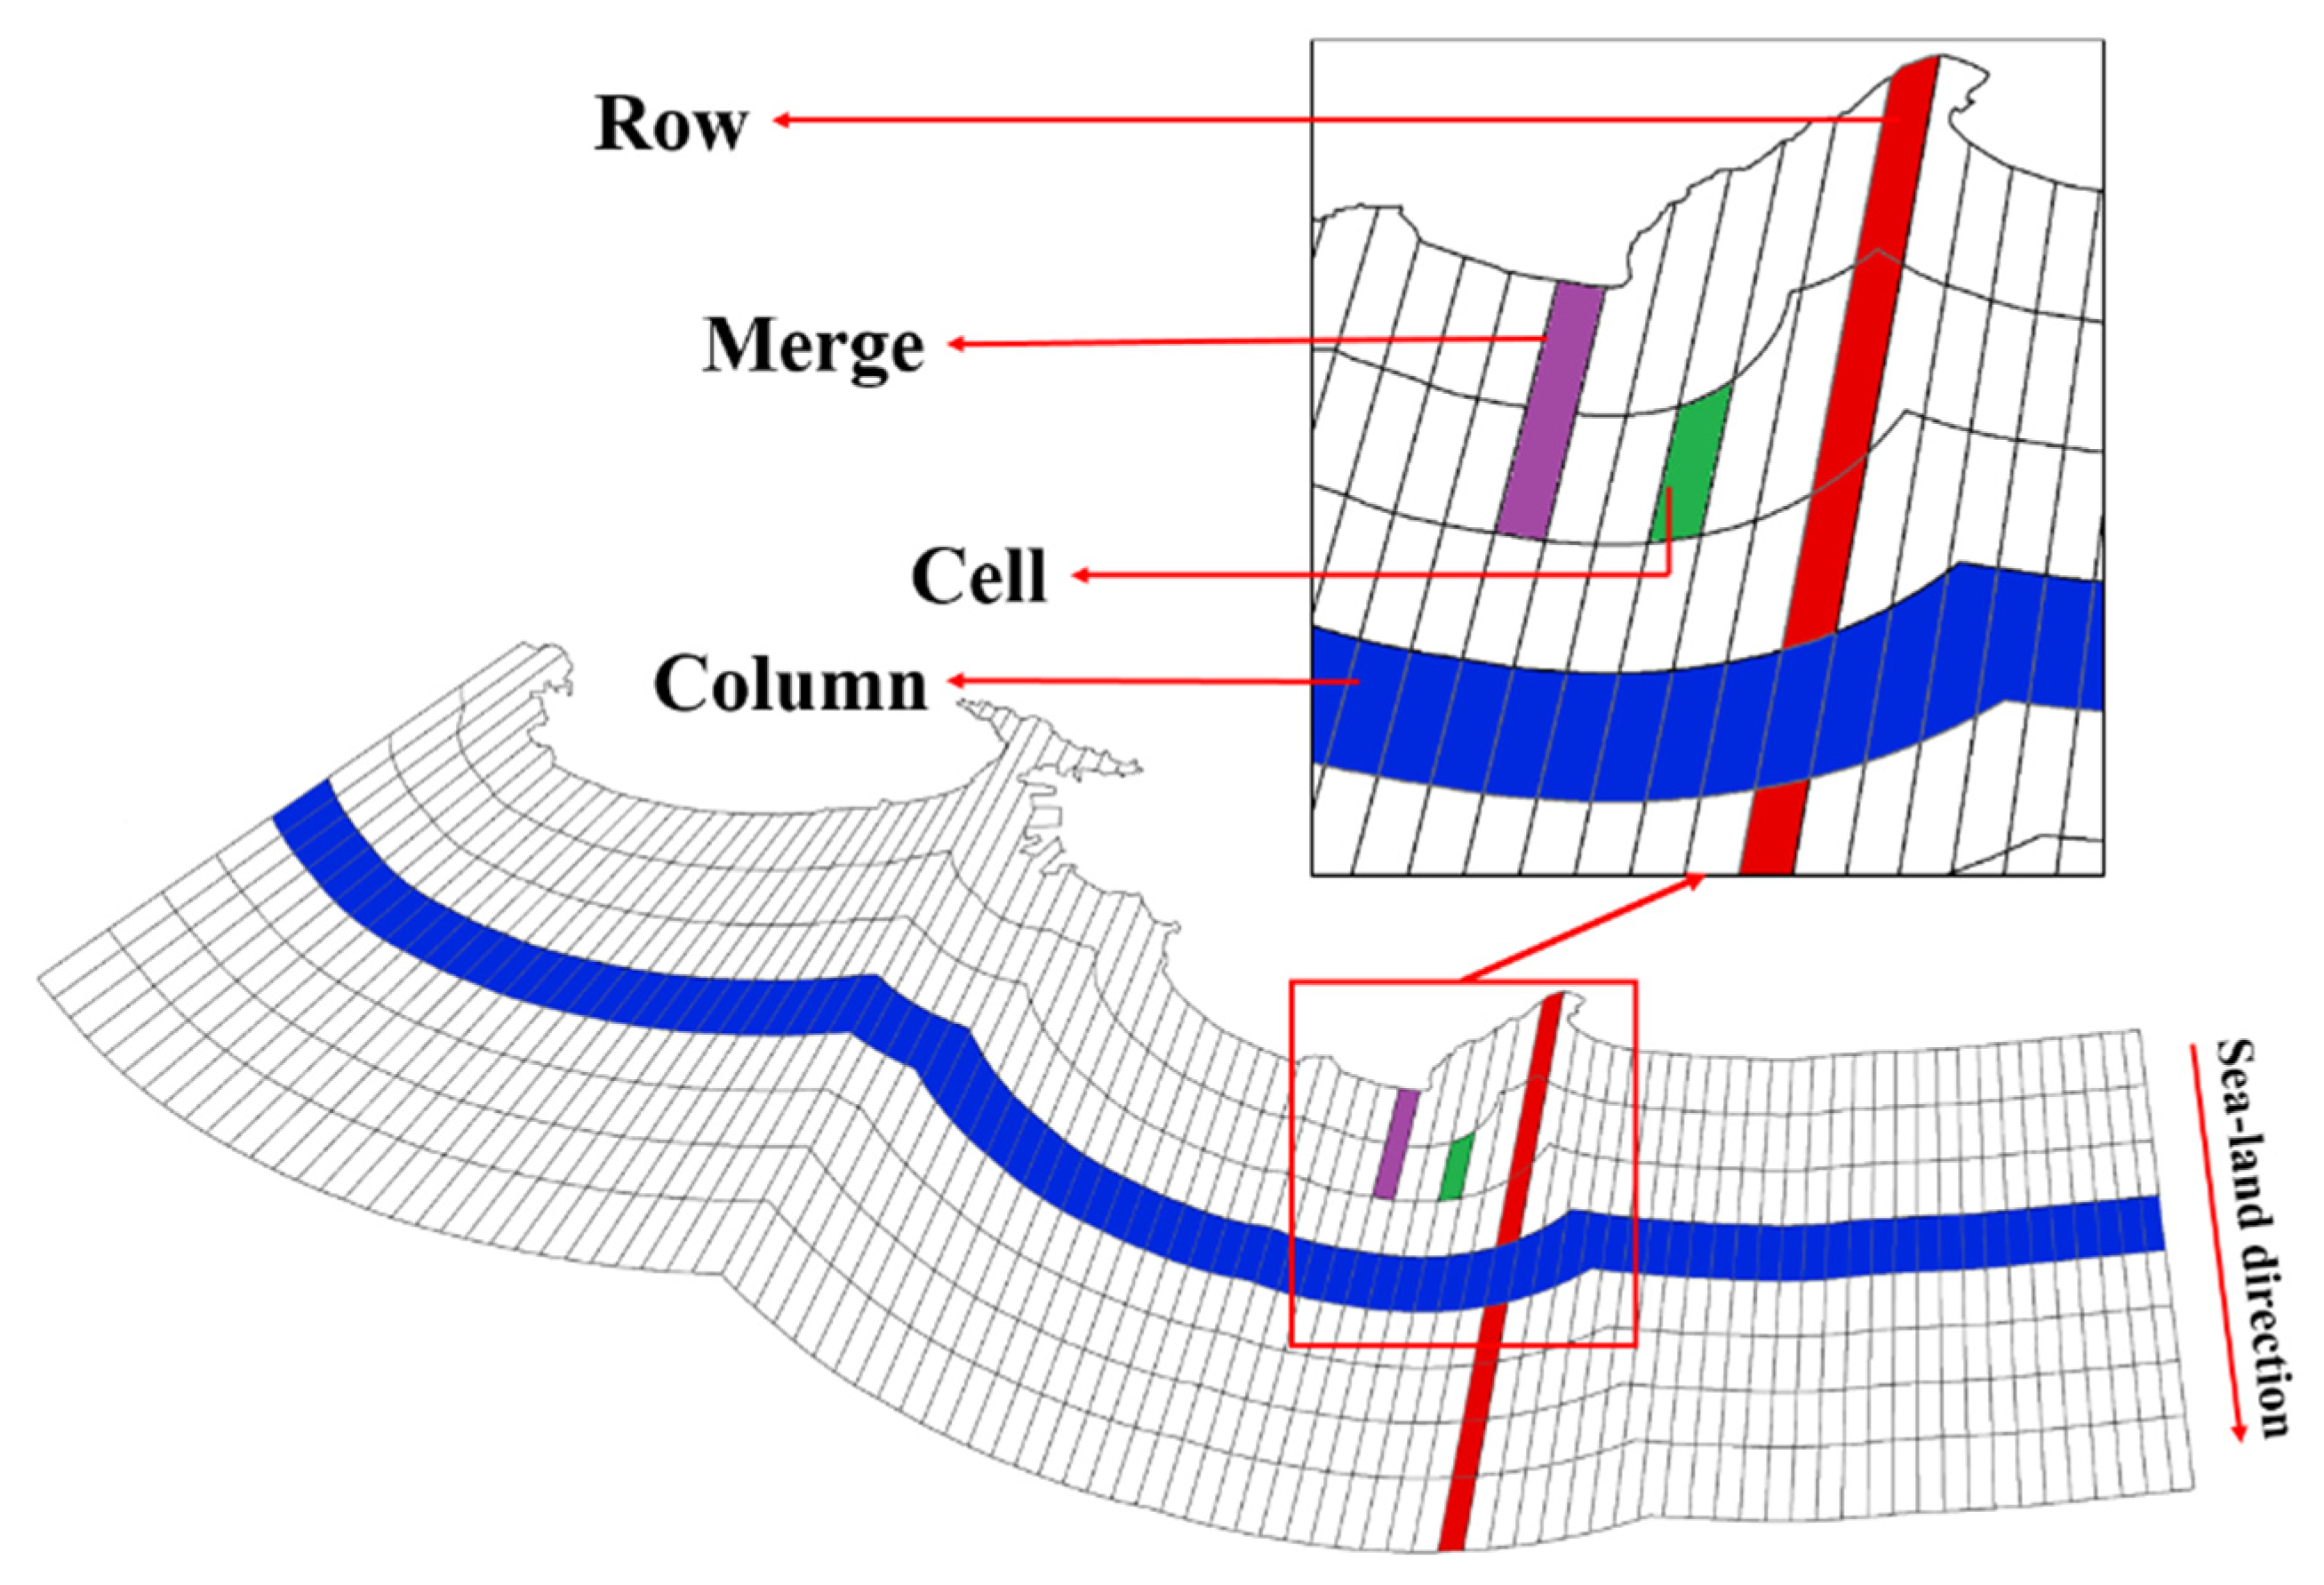
2.4. Association Rule Mining Method

Association rule mining refers to discovering meaningful associations from a large dataset, i.e., identifying frequently occurring sets of attribute values (frequent item sets) from the dataset and then using the resulting frequent item sets to describe the association rules [34]. Whether a data point belongs to a frequent item set relies on whether the support (S) and confidence (C) exceed the support and confidence thresholds set by the operator [35]. Yan et al. (2020) took the Port of Kuala Lumpur, Malaysia as the experimental area to establish spatial association models that reflected the relationship between the spatial pattern and allocation of land use along the sea–land gradient in the coastal zone [36]. It was preliminarily verified that an association rule mining model could be used to explore the association rules between port shorelines and land use patterns.
This study greatly improved the model and established a new model to reflect the influence of port construction on the spatial pattern of land use in coastal zones. This improvement was mainly reflected in the following aspects: (1) According to the spatial features of the Shandong Peninsula coastal zone, this study improved the grid unit division method and made it more closely fit the coastline trend. This sample segmentation effect was more in line with the spatial features of the geographic elements. The samples were divided by constructing a sector-annular grid that matched the shape of the coastal zone. (2) The coast in this study was no longer limited to the port shoreline; rather, it included all coastline changes in the study area. We built a new CLDI model to express the correlation between the coastlines and LDI and probe how coastline changes affect land use patterns in port areas. To study the important land use transfer patterns in port areas, a new LUT model was established to express the land use transfer sequence pattern in the sea–land direction. (3) To analyze and compare the differences in the spatial utilization patterns in different port coastal zones and study the direction, distance and relevance of the port construction and land development in different regions, this research selected the two port areas of Qingdao and Yantai for a comparative study; additionally, the general law of port city expansion and the differences of the association pattern due to the different development process of ports were explored. (4) This research used the FP-tree algorithm to replace the original Apriori algorithm. Compared with the Apriori algorithm, the FP-tree algorithm based on the tree structure does not need to generate candidate frequent item sets but directly obtains frequent item sets. This structure can greatly reduce the number of times the database is traversed, thereby improving the algorithm efficiency.

2.4.1. CLDI Model

To establish the spatial association model, the study area must be divided into grid samples. The grid samples aimed to capture the sea–land distribution in coastal topography, and the samples were divided by constructing a sector-annular grid that matched the shape of the coast. First, based on the vectorization of the regional shoreline, multiple buffer zones (columns, Figure 2) were generated from the coast to the inland areas at certain intervals, taking the two sides perpendicular to both ends of the coastline as the radius of the sector annulus and taking the coastline between the two radii as the inner arc; additionally, the outer edge that belonged to the outskirts of the buffer zones was used as the outer arc to construct a sector-annular grid that matched the shape of the coastal zone. Finally, two extension lines with radii toward the ocean were made and intersected, and the intersection of the two radii represented the center of the circle. After that, the two radii were used as the starting and ending edges, rotation segmentation (row, Figure 2) was carried out according to certain intervals (such as 1.5°) and the vertical lines in the sea–land direction were obtained by dividing the buffer zone at each intersection to form grid units (cell, Figure 2). This sample segmentation method not only effectively preserved the spatial trend of the shoreline but also reflected the spatial adjacency of the LDI.
After dividing grid samples, the grid samples were overlaid with land use change vector data to obtain the land use change rate of each grid unit. The LDI of the grid unit was divided into four levels using the Jenks natural breaks method: weak (rate of change < 16.93%), medium (16.93% ≤ rate of change < 38.26%), strong (38.26% ≤ rate of change < 62.88%) or extremely strong (62.88% ≤ rate of change). To reduce the data redundancy and maintain the validity of the sample information, the grid units with the same LDI level were merged into one unit (as shown in Figure 2). After merging, the distribution of LDI in three interval periods was obtained and is shown in Figure 3. A set of sample sequences included the units along the same direction perpendicular to the shoreline, and the sample set was used to establish the decision table of the association models.
The decision table of the CLDI association model is expressed as {Lm, DnDn ………}, where L represents the change intensity of the coastline, which is the ratio (in percentage) of the increase in the shoreline to the total length of the shoreline in the row interval; m represents the intensity level, which is 1, 2, 3 or 4, corresponding to weak (0 ≤ L < 0.75%), medium (0.75% ≤ L < 2.15%), strong (2.16% ≤ L < 7.37%) or extremely strong (7.38% ≤ L), respectively; D represents the LDI; and n represents the intensity level, which is 1, 2, 3 or 4, corresponding to weak, medium, strong or extremely strong, respectively. For example, if the coastline change in the same sample strip is strong and the corresponding LDI sequence in the landward direction is strong, medium and extremely strong, then its sample form in MATLAB is {L3, D3D2D4}, where L3 and D3D2D4 are each considered one item, so the sample {L3, D3D2D4} can be considered a 2-item set. All samples were substituted into the FP-tree algorithm in the form of 2-item sets for mining the association rules.

2.4.2. LUT Model

The LUT sequence used the same row distance as the CLDI model and took the land use transfer map patch sequence in the sea–land direction as the samples to discover the landward spatial order of the LUT types. The LUT information was obtained by superimposing the land use type maps in two interval periods. After intersecting the LUT map patches with the rows (rows, Figure 2) perpendicular to the shoreline, the various types of map patches were sorted from sea to land. Then, excluding tiny map patches and unchanged land use types, adjacent patches with the same LUT type were merged to obtain a sequence of LUT types in Qingdao and Yantai (for example, the sequence of OL to BL > FL to GP > GP to BL), as shown in Figure 4 and Figure 5. The decision table established using the LUT model was expressed as {TaTbTc ……}, where T represents the LUT type and a, b, c … represent the 20 LUT types, with a, b and c representing the transfer from CL to BL, FL to BL and FL to GP, respectively. Each sample was expressed as a decision table and was substituted into the FP-tree algorithm for mining the association rules. For example, the sample {FL to BL > GP to BL > FL to GP} was expressed as the item set {TbThTc}. Similarly, after the transformation into Boolean form and matrix transposition, the support and confidence were calculated based on the inner product of the matrices, and then, the important LUT sequences were extracted.

3. Results

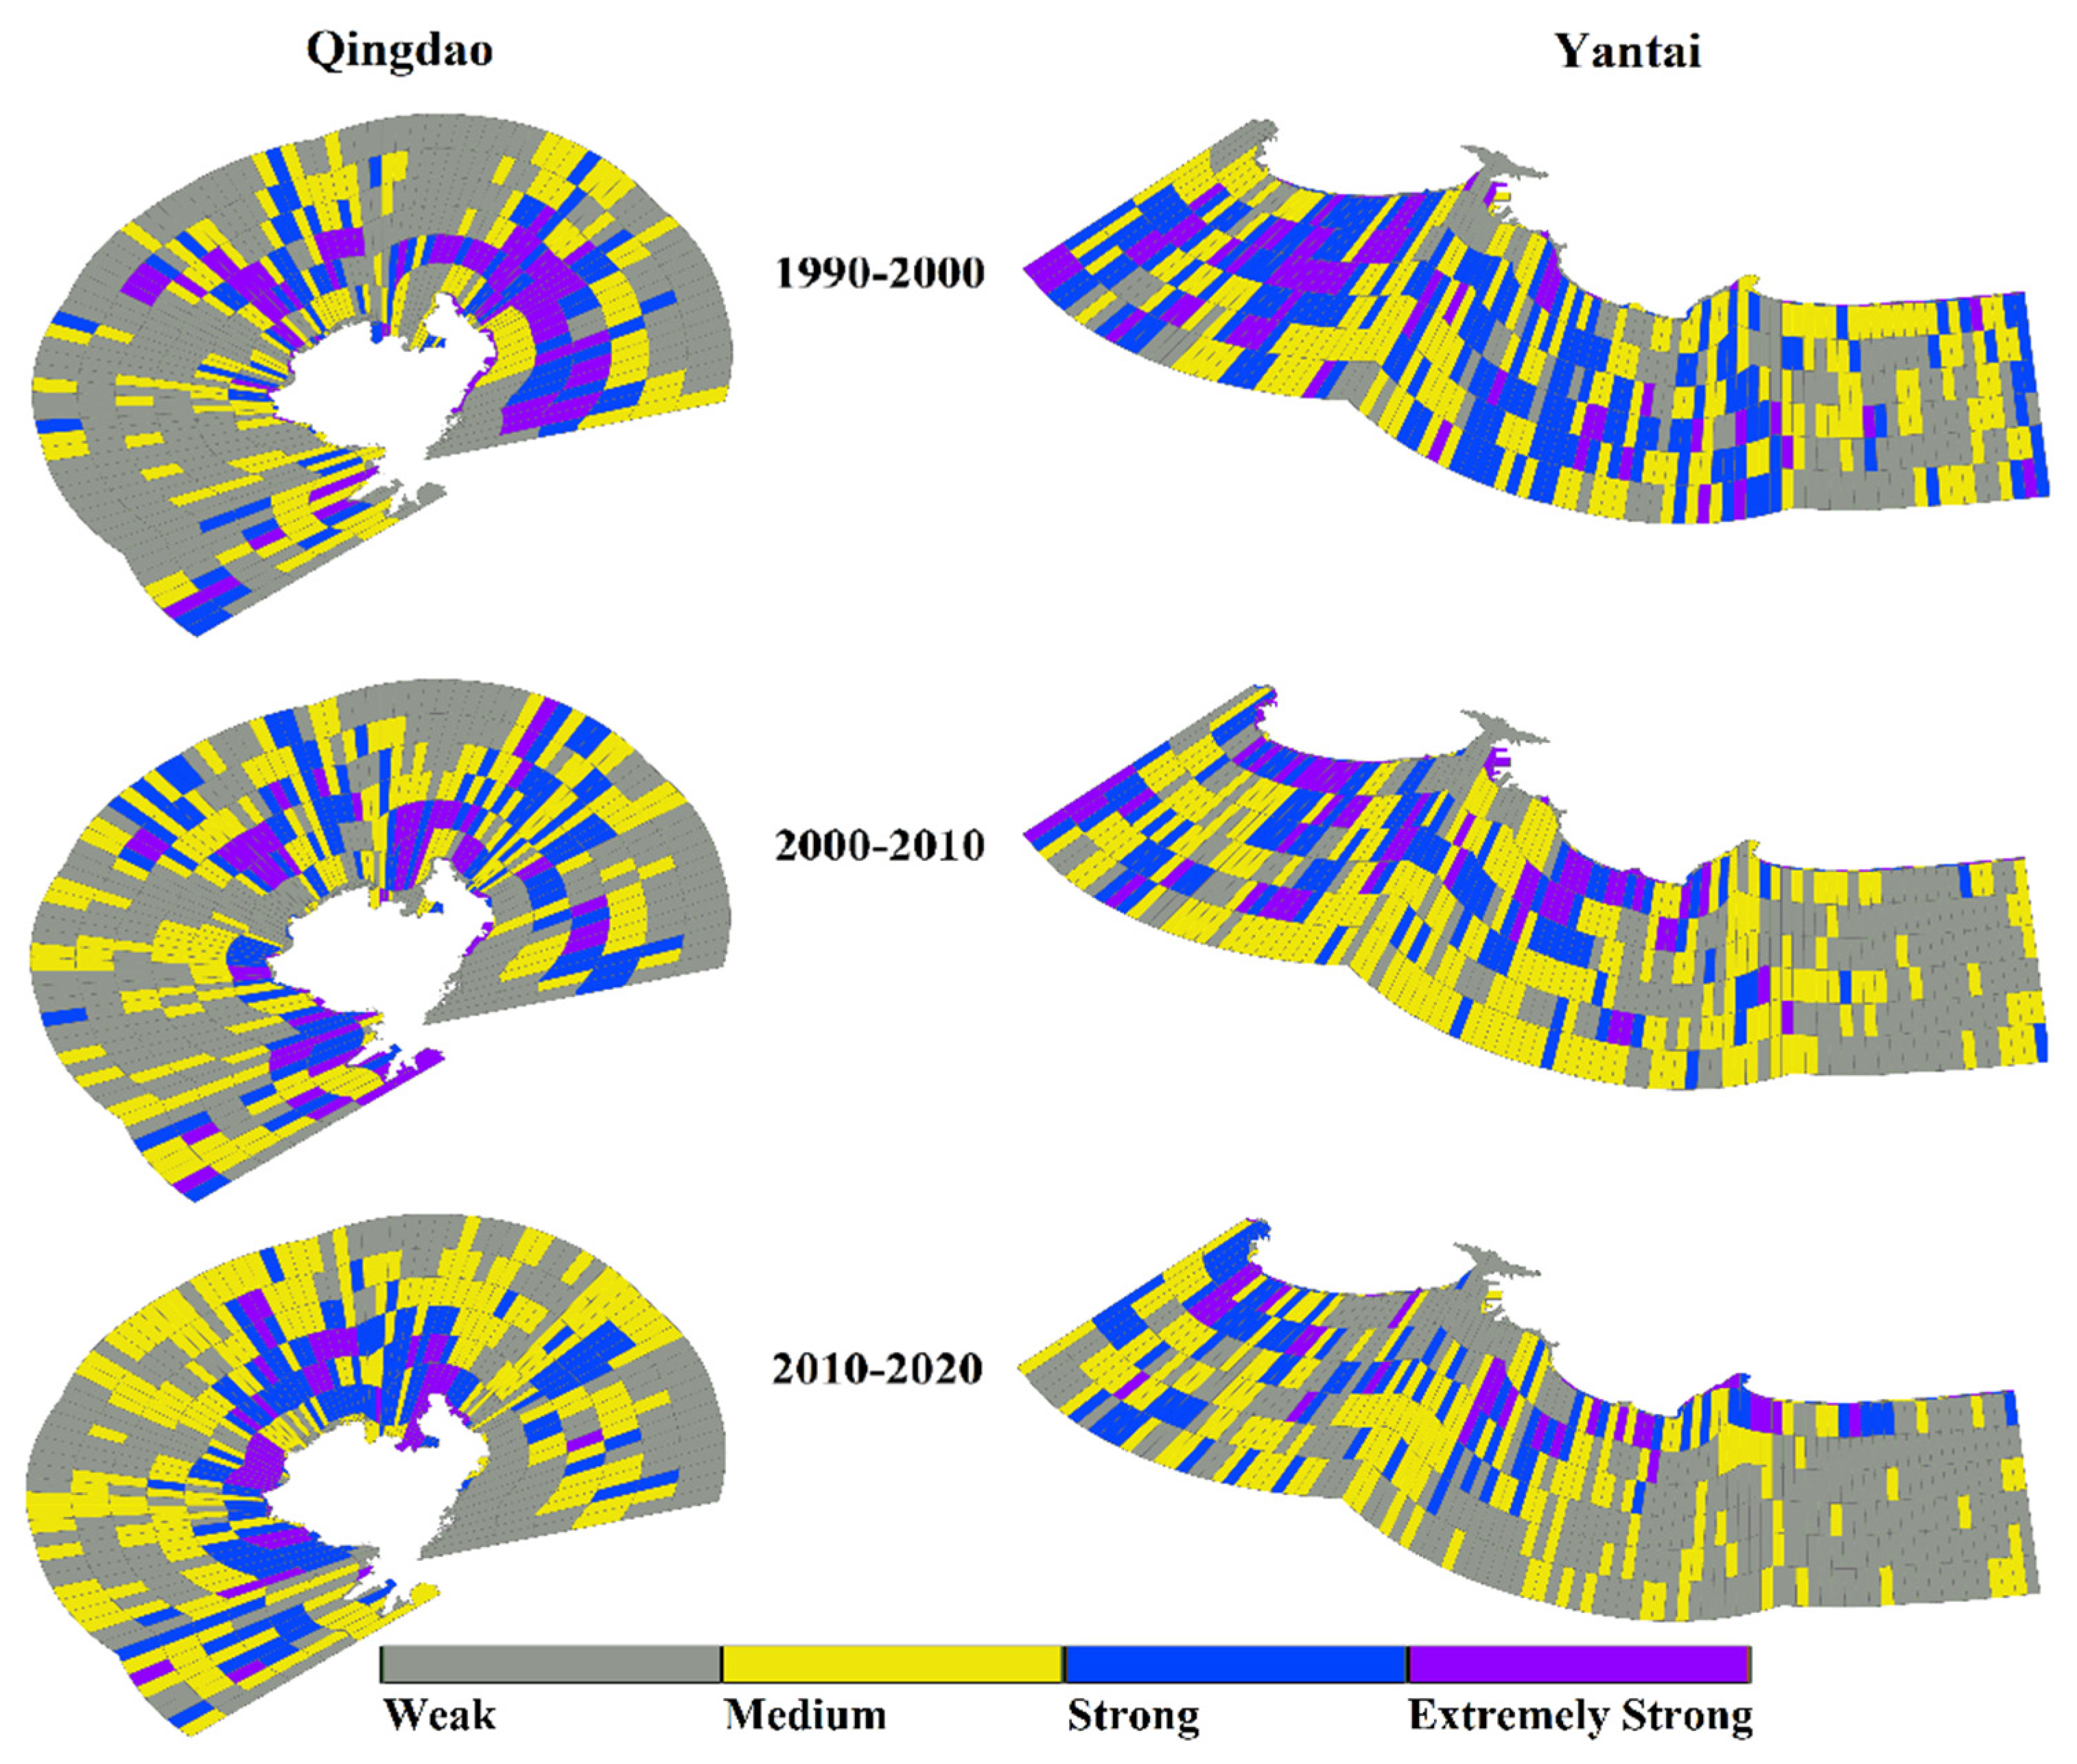
3.1. The Land Use Patterns in the Qingdao Port Area

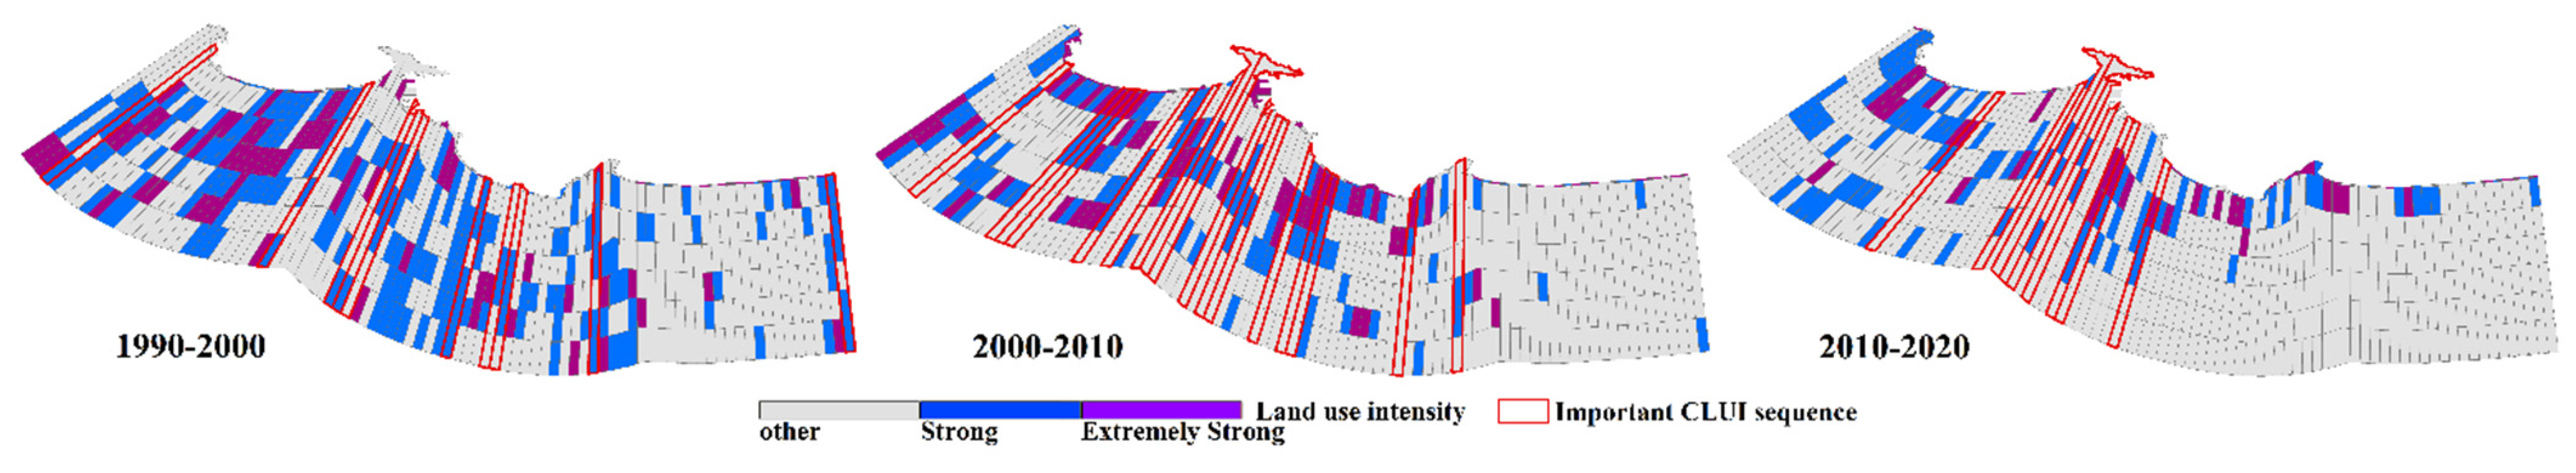
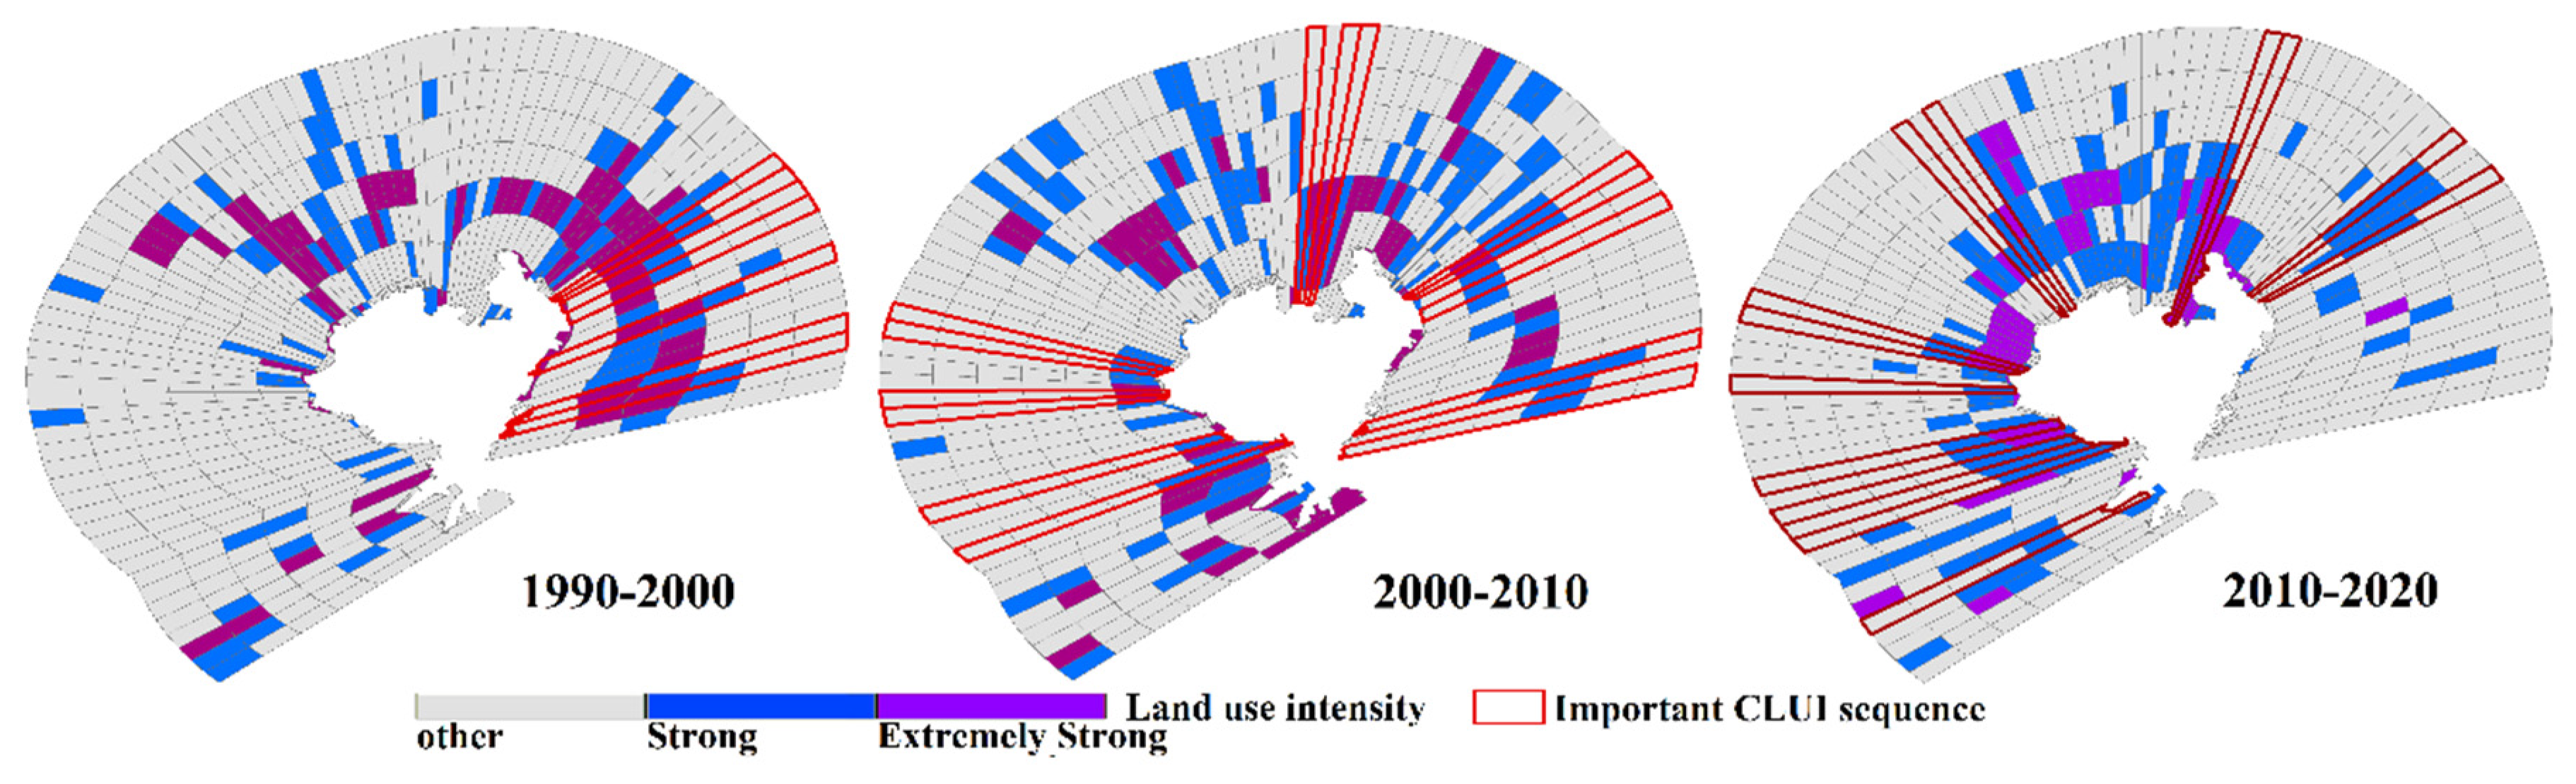
3.1.1. Association Rules between Coastline Change and Land Development Intensity in Qingdao

Through the decision table of the shoreline change and LDI grade sequence, the association rules of the Qingdao port areas in each period were obtained, as shown in Table 3. To prevent losing some rules with low support but high confidence with close relevance to this study, especially the association rules related to the sample of the Qingdao port areas, the minimum support threshold and the minimum confidence were set to 2–7% and 20–25%, respectively, after repeated experiments.
The number of types of association rules and complexity of the association rules gradually increased. This result reflected that the general trend of LDI was a gradual increase in Qingdao (Table 3). In 1990–2000, the strong association rules in Qingdao were Weak Change Coastline -> Weak > Extremely Strong > Strong > Medium > Weak and Extremely Strong Change Coastline -> Medium > Extremely Strong > Strong > Medium > Weak. The extremely strong coastline change was mainly concentrated along the coast of Qingdao port. The significant changes in the coastline were mainly due to the expansion of the Qingdao port area and land renewal in the Qingdao south district, which was also the most active period of Qingdao port construction.
In 2000–2010, the dominant LDI sequences associated with coastline change were Weak Change Coastline -> Extremely Strong > Medium > Weak and Extremely Strong Change Coastline -> Strong > Medium > Weak. In this period, the strong and extremely strong units, which were located at the heads of the sequences, increased significantly, and the intensity gradually decreased from sea to land. Overall, the number of strong and extremely strong units was also the largest. All 10 strong association rules had extremely strong units, and five of them corresponded to coastlines with strong or greater changes. In addition, the strong and extremely strong change coastlines were mostly located in the deep-water berth area of the Qianwan port. In the Qingdao port area, only a short stretch of the extremely strong change coastline existed in the north.
In 2000–2010, the coastlines with strong or greater changes were concentrated in Northern Jiaozhou Bay and Northern Qianwan port. The typical sequence patterns included Weak Change Coastline -> Weak > Strong > Medium and Extremely Strong Change Coastline -> Extremely Strong > Strong > Medium > Weak, and the support of these two patterns was much higher than that of the others. In this period, the distribution of the CLDI sequence was mainly divided into the following two types: the LDI that corresponded to the strong change coastlines weakened along the sea–land gradient, and the strong or greater land development units were located in the middle of the sequences that corresponded to the weak change coastlines.
Qingdao maintained a good development trend in the three periods. The CLDI sequence patterns varied in the two periods from 2000 to 2020 and were gathered toward the seashore. In the first decade, the coastlines with strong or greater changes with related sequences were laid out around the Qingdao port area but were obviously transferred to the seashore area of the Qianwan port after 2000.

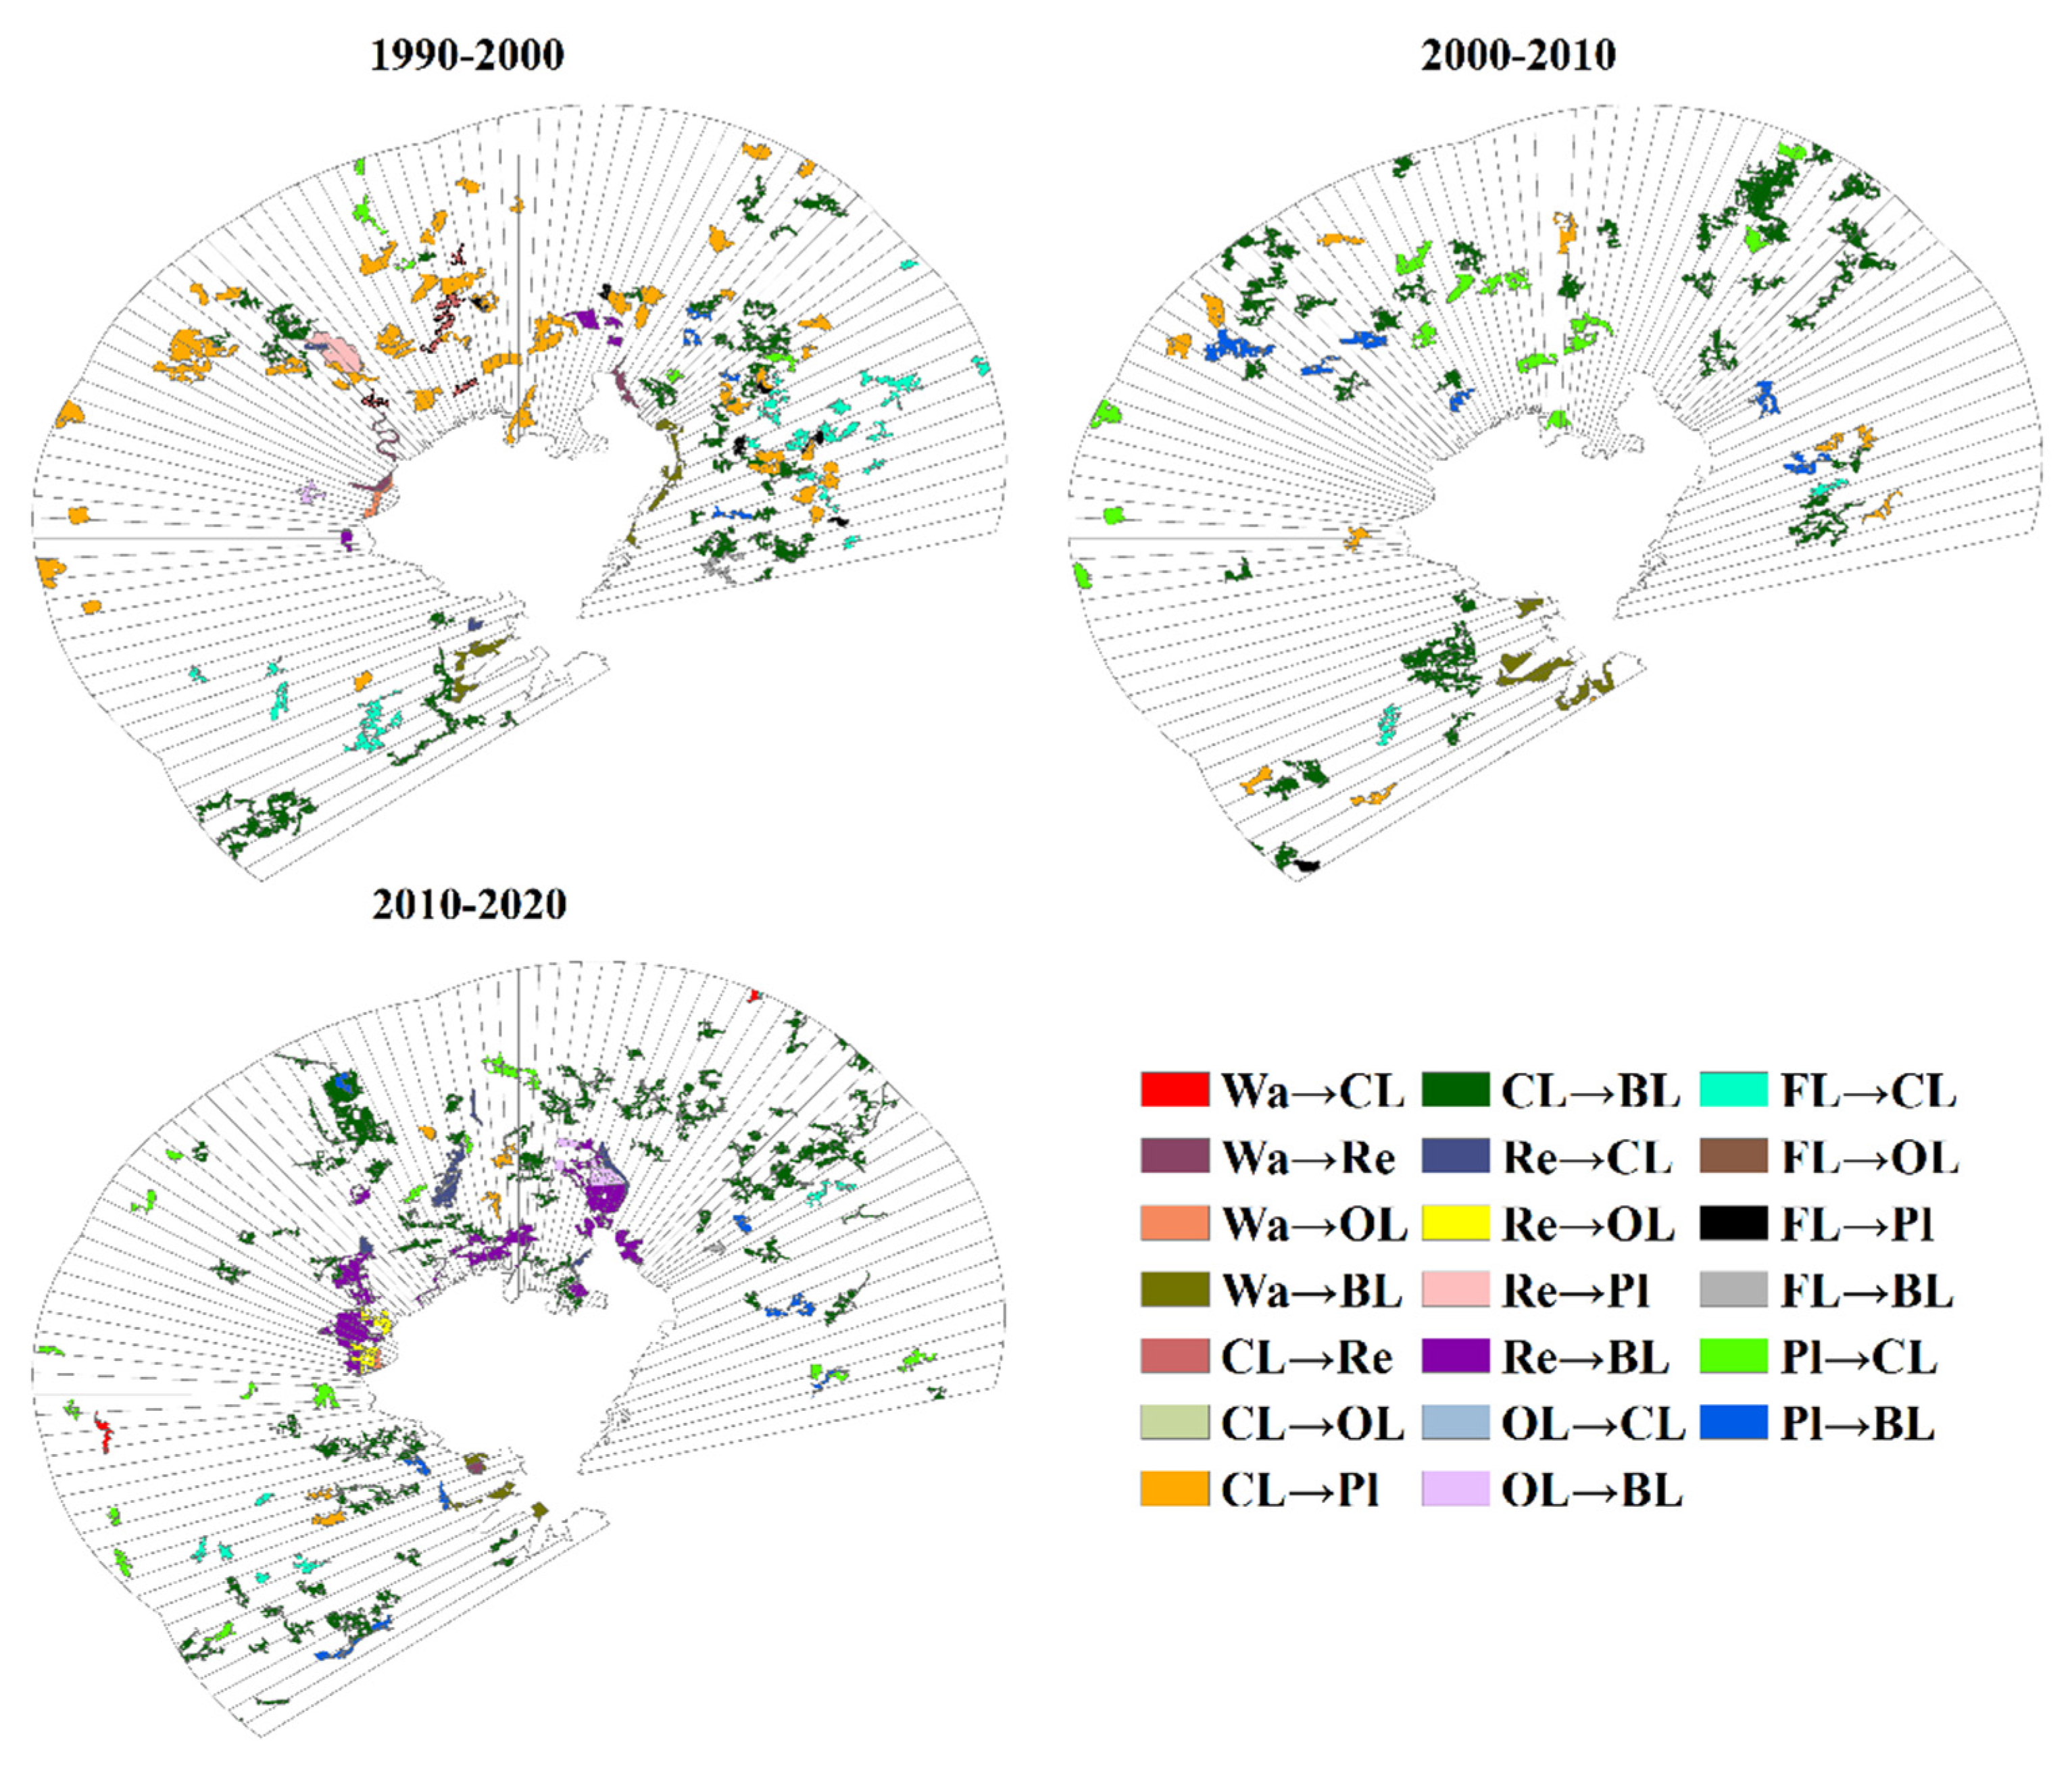
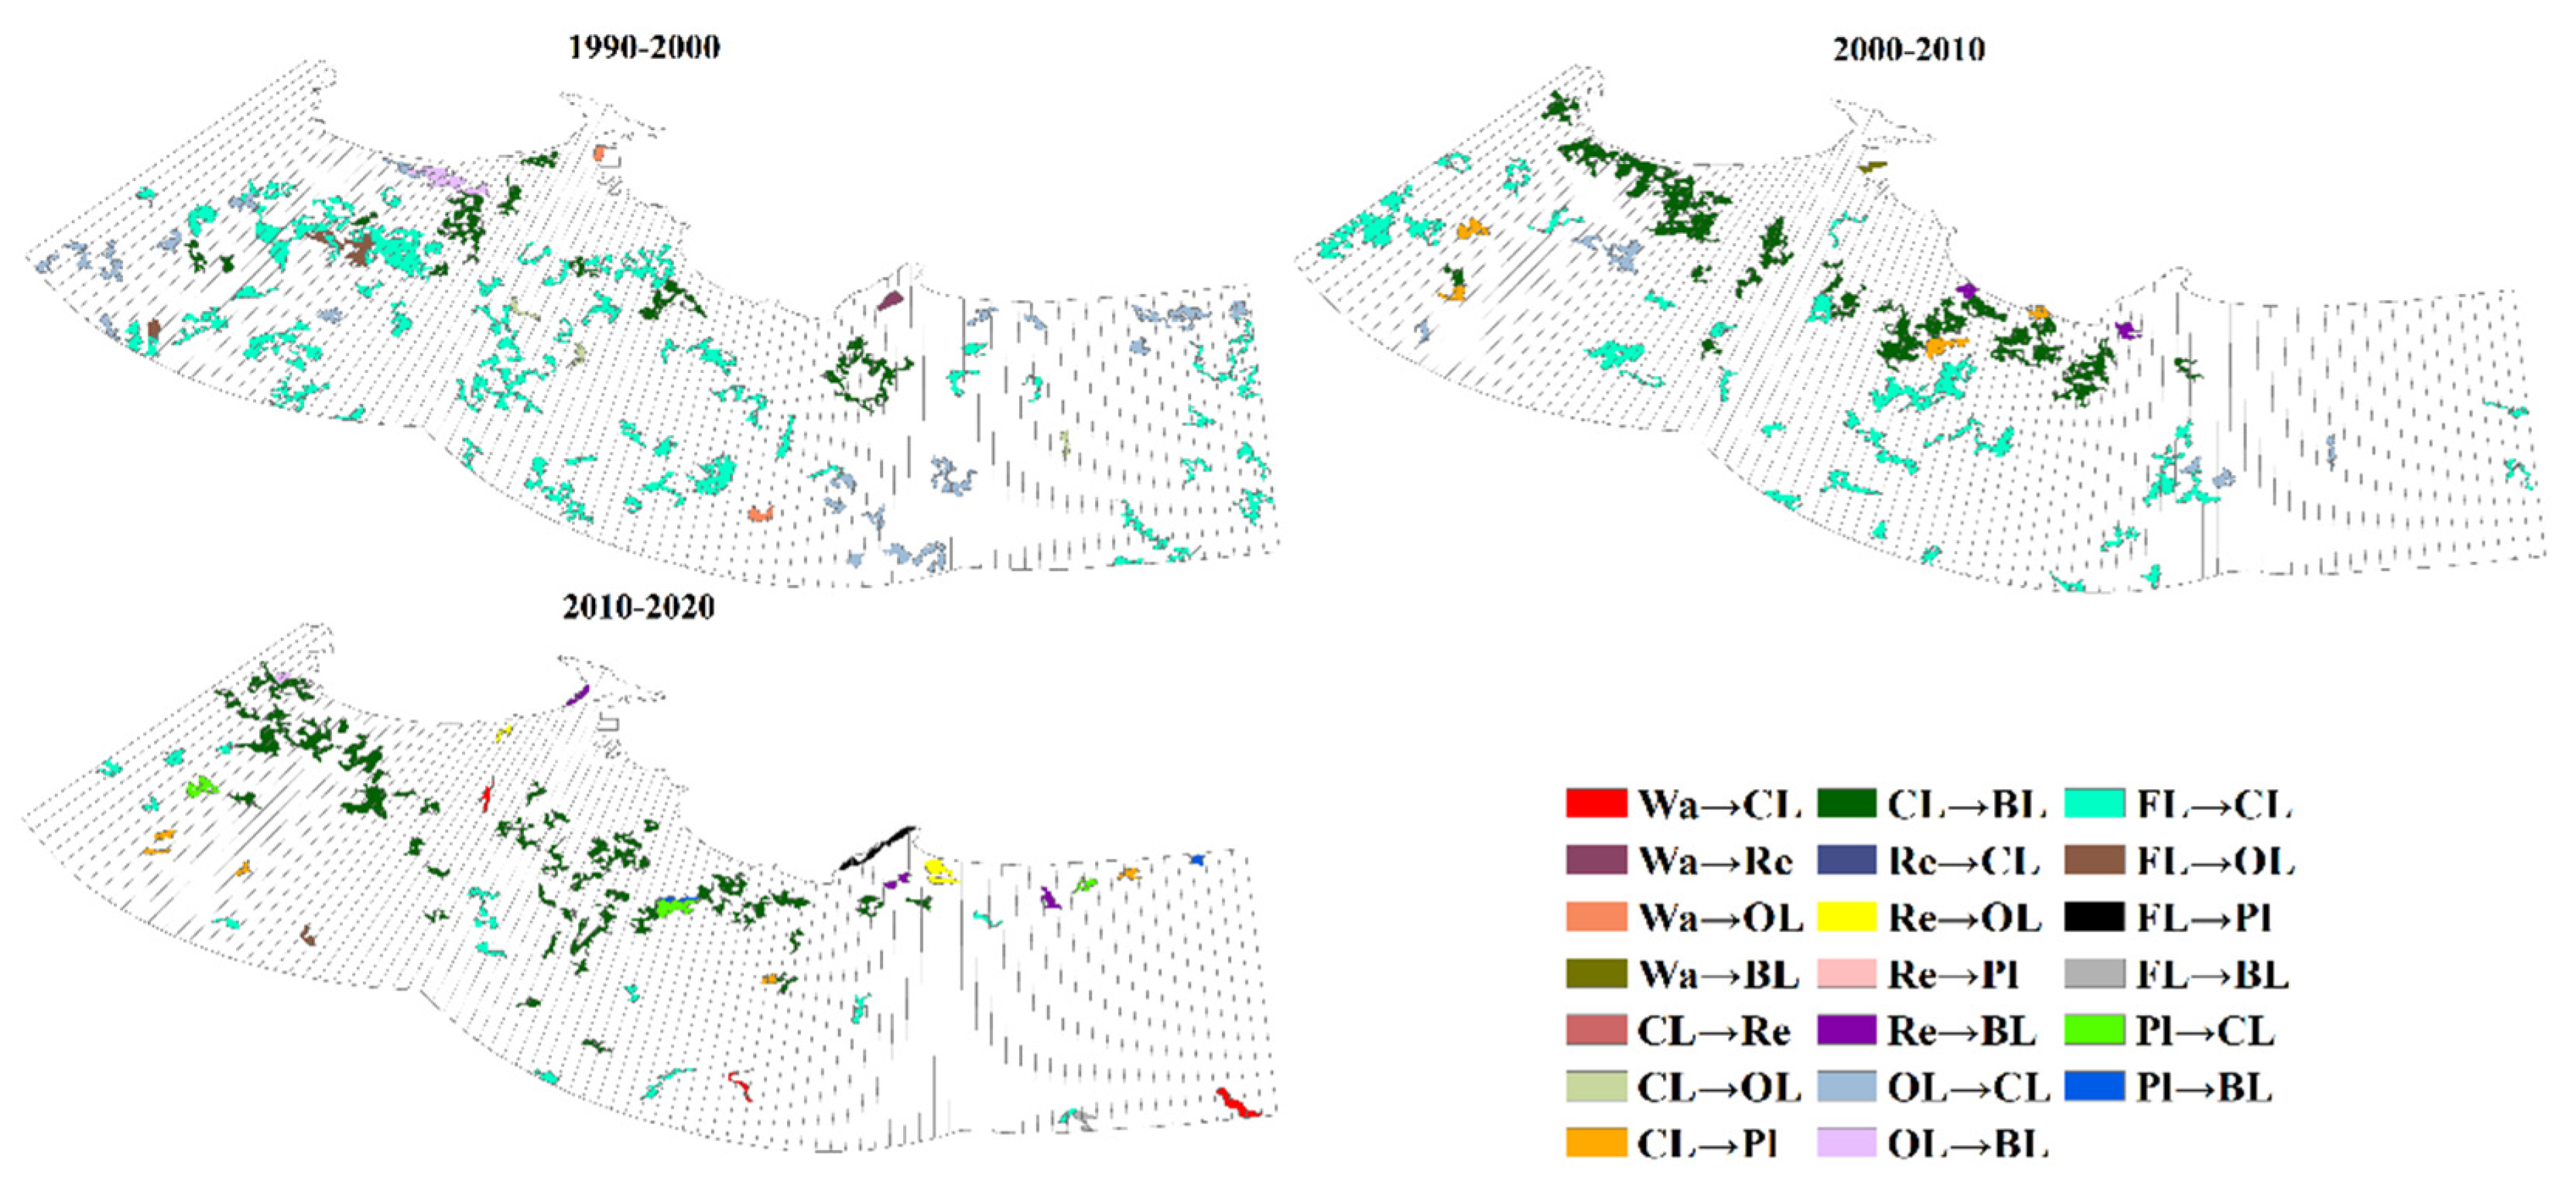
3.1.2. Association Rules of Land Use Transfer in Qingdao

The land use transfer pattern in the Qingdao port area showed that, during 1990–2000, the main land use types transferred out were Wa, CL and FL. The BL was the main type of land transferred (Table 4). In the port coastline, the typical association rules were the LUT sequence pattern of Wa → BL > CL → BL > FL → CL > CL → BL, Wa → OL > OL → BL > CL → GP and Wa → BL > CL → BL > GP → BL > CL → BL > CL → GP > FL → CL > CL → GP > FL → CL. Most of the sequences had samples transferred from Wa; in addition, most of the samples in the middle of the sequence were transferred from CL to BL. At the end of the sequence, FL and OL were the main types of land transferred out, and most of them were transferred into GP.
In 2000–2010, the LUT in the Qingdao seashore area mostly occurred in the Qianwan port area. The LUT sequence pattern was Wa → BL > CL → BL > FL → CL > CL → BL > CL → GP. During this period, the LUT pattern of the study area was dominated by the transfer of CL and GP into BL and mainly occurred at the front of the sequence. In 2010–2020, the types of LUT sequences were reduced, and the diversity of the sequence composition also decreased. The main land type transferred out was AS. At the front of the sequence, a large number of lands that changed from AS to BL appeared in the seashore area, and the corresponding CLDI sequence appeared as strong and extremely strong land units in the coastal zone during this period. The types of LUT sequences were Wa → OL > AS → OL > AS → BL, CL → BL > AS → BL and AS → OL > AS → BL > CL → BL > GP → CL.

3.2. The Land Use Patterns in the Yantai Port Area

3.2.1. Association Rules between Coastline Change and Land Development Intensity in Yantai

During 1990–2000, Yantai’s strong change and above LDI units were widely distributed and scattered in the region (Table 5). The CLDI sequence patterns were relatively diverse in this period. Overall, most of the strong units that belonged to the sequence with weak change coastlines were located inland, and the LDI sequences corresponding to the strong change coastlines were dominated by strong and above LDI units. From 2000 to 2010, the areas with high LDI were concentrated in the coastal zone between Western Yangma Island and Eastern Penglai International Airport. In addition, the number of weak and medium units in the inland areas increased significantly. The typical sequence patterns included Strong Change Coastline -> Extremely Strong > Strong > Medium > Weak > Medium, Weak Change Coastline -> Weak > Medium > Strong > Medium and Extremely Strong Change Coastline -> Strong > Medium > Strong > Medium. Although there were Strong and Extremely Strong Change Coastlines east of Yangma Island, the LDI of the sea–land sequence in the corresponding position was still weak.
In 2010–2020, the LDI significantly weakened, and the focus of land development shifted inland. The downtown area of Yantai was basically filled with weak change units. The LDI sequences that were strongly associated with the weak change coastlines were Weak Change Coastline -> Weak > Extremely Strong > Strong > Weak and Weak Change Coastline > Weak > Strong > Medium. It could be concluded that strong and extremely strong units were mostly located in the middle of the sequence. However, the overall change units were still mostly medium, and the end of the sequence close to the interior was dominated by weak units. Strong change coastlines and sequences with strong LDI in the seashore area extended to the suburbs on both sides of Fushan District, and a large number of strong and above LDI units appeared in the eastern and western suburbs, represented by Yangma Island and the Yantai Economic Development Zone. The CLDI sequence patterns were as follows: Extremely Strong Change Coastline -> Strong > Weak > Medium > Weak and Extremely Strong Change Coastline > Extremely Strong > Medium > Weak.
Overall, in the past 30 years, the strong and above units located in the Yantai Port area had a clear tendency to move toward the seashore area, and the number decreased. The leading role of the Yantai port in regional land development was not as prominent as that of the Qingdao port. Even in the period when the coastline of the Yantai Port grew rapidly, the LDI in the sea–land direction corresponding to the port was not high. Since 2000, the regions with strong changes have been distributed symmetrically on both sides, with the Zhifu Peninsula as the central axis. The sequence corresponding to the strong change coastline was basically composed of strong change and above units, and weak change units existed only in the interior at the end of the sequence. The sea–land sequences corresponding to the coastline with a development intensity below medium were basically dominated by weak change units, and strong change units existed only in the middle of the sequence.

3.2.2. Association Rules of Land Use Transfer in Yantai

The main type of land transferred in was CL, followed by BL in the Yantai coastal zone during 1990–2000 (Table 6). The LUT of the seashore area was not dramatic, and only a large area of Wa around Zhifu Port was transferred into BL and OL. FL was the major land use type that was transferred out; in the middle and the end of many sequences, a lot of FL was transferred into CL. The typical LUT sequences were CL → BL > FL → CL, OL → CL > FL → CL and FL → CL > CL → BL > FL → CL.
From 2000 to 2010, FL was still the main type of land that was transferred out, and BL replaced CL as the major type of land transferred in; most was converted from CL near the sea. The strong association rules were as follows: CL → BL > FL → CL > CL → BL, CL → BL > FL → CL > CL → BL > CL → GP > OL → CL and CL → BL > FL → CL > OL → CL. During this period, the speed of urbanization in the coastal zone was obviously accelerated and symmetrically distributed on the eastern and western sides of the Yantai old town (Fushan District and Zhifu District). The number of plots transferred into BL decreased obviously in the sea–land direction, but the type of FL to CL increased. The overall feature was that the front end of the sequence contained CL to BL, and the end contained FL to CL. The middle part of the sequence was a mixture of FL and CL to BL and FL to CL.
In 2010–2020, most of the plots with obvious changes in the Yantai port area were located in the front and middle of the sequence. The LUT in seashore areas was obviously reduced, and the composition of each sequence was also simplified. Frequently, a sequence contained only one or two types of LUT patterns. CL to BL was still the main LUT type in this period. The frequent sequence patterns were CL → BL > FL → CL and CL → BL > GP → BL> GP → CL > FL → CL. The sequences that existed from FL to CL on the end included OL → BL > CL → BL > FL → CL and FL → GP > CL → BL > FL → CL.

4. Discussion

4.1. Characteristics of Land Use Patterns in the Qingdao Port Area

From 1990 to 2000, Qingdao, as a major city on the Jiaodong Peninsula, rapidly urbanized and relied on early industrial accumulation [37]. Since the BL of the eastern old town was basically saturated, the industrial sector in the old city transferred to the Licang and Laoshan Districts and connected the Chengyang and Jimo Districts to form a chain of industrial zones around Qingdao. This process was shown in the association rules as the following CLDI sequences associated with the Qingdao port: Extremely Strong Change Coastline -> Medium > Extremely Strong > strong > Medium > Weak and Weak > Extremely Strong > Strong > Weak (Figure 6). The old town in the south of the city focused on cultivating the modern service industry, which led to many secondary industries relocating to neighboring towns. For this reason, the CLDI units above strong were mostly located in the middle of the sequence, and the LUT sequence Wa → AS > CL → GP > CL → BL > CL → GP showed that the expansion units of BL were concentrated in the middle of the sequences. At this time, the western coast had just finished the preliminary planning and land consolidation of the Qianwan Port Economic Development Zone, so the land use change was not yet dramatic, and the sequences in this area were occupied by medium-intensity units.
From 2000 to 2010, the function of berthing freighters was mainly transferred from Qingdao Port to Qianwan Port, and the industrial sector moved from the east bank to the west bank. The westward migration of the freight center spurred industrial structure adjustment and enhanced port-vicinity industry agglomeration. Several strong and extremely strong CLDI units have accumulated in the Qianwan port area. The typical sea–land CLDI sequence on the western coast exhibited the pattern of Extremely Strong Change Coastline -> Strong > Medium > Weak, and the LDI decreased from sea to land (Figure 6). The speed of coastline development in the Qingdao Port area was slow, so the strong LDI units were mainly located in the middle of the sequences. The most prominent LUT sequence pattern of the western coast port area was Wa → BL > CL → BL > FL → CL > CL → BL > CL → GP, and the growth rate of BL was the fastest. The sequences located on the eastern coast were represented by the pattern CL → BL > GP → BL > CL → BL > CL → GP. At the end of the sequence, large areas of CL and GP were transferred into BL in the interior.
In 2010–2020, Qingdao undertook industrial transfer by building six industrial zones—namely, Yanghe Equipment Manufacturing Industry Base, Dongjiakou Chemical Industrial Park, Jimo Automotive Parts Industrial Park, Xinhe Chemical Industrial, Jiangshan Light Industrial Park and Nvdao Shipbuilding Industry Base [38]. Strong change areas were mostly distributed in Laidong, Jiaozhou, Pingdu and other places close to the coastline, forming Weak Change Coastline -> Weak > Strong > Medium and AS → OL > AS → BL > CL → BL > GP → CL sequence patterns (Figure 6). The mode of port-driven urban construction was replaced by the mode of surrounding industrial renewal, and the land development along the port shoreline weakened and presented a Weak Change Coastline -> Weak > Medium > Weak sequence pattern. Under the export-oriented development strategy emphasizing airport and seaport traffic, the Jiaodong airport and its supporting facilities, such as the Eurasian economic and trade cooperation industrial park, were constructed, and this series of projects promoted the transfer of the areas surrounding GP and CL into BL. As a result, the Northwestern Jiaozhou Bay region and Jiaozhou suburbs, as the core of the new zone, radiated to the surroundings and formed AS → BL > CL → BL > AS → BL > CL → BL and AS → BL > AS → CL > CL → BL LUT sequence patterns.

4.2. Characteristics of Land Use Patterns in the Yantai Port Area

The main development area of the Yantai study area from 1990 to 2000 was located on the outskirts of the Fushan District and Zhifu District. The construction of the Yantai port and the Taozi Bay Sewage Treatment Plant were the main reasons for the increase in seashore building land. In this period, the extremely strong areas were mainly located in the middle of the sea–land sequence (Fushan District), and the seashore area mainly presented strong changes (Figure 7). This result was due to the expansion of rural CL and GPs inland. The intensity of this process was much higher than the urban renewal or infrastructure upgrading near the sea, and the LUT pattern was widely distributed and scattered in the same period.
The development and utilization activities of the Yantai coastal zone increased from 2000 to 2010. The deep-water berths in the northern part of Yantai Port and the sea reclamation project in the warehouse of the port authority, as well as the filling and excavation of the dock of the Dayu shipyard in the Western Yantai economic and technological development area, transferred part of the maritime space into BL and resulted in a decrease in Wa. The mariculture and tourism industry of Yangma Island in the west also transferred part of the sea area into AS and made use of marine tourism resources to develop the tourism industry [39]. The utilization of seashore areas has increased significantly with the development of the coastline. The types of sea-related land, such as docks, workshops and warehouses, increased; from the Yantai development area to Zhifu District, a large connected strong change coastline was formed (Figure 7). BL occupied CL frequently in areas close to the sea. In Laishan Town, Muping District and other inland areas, much FL was transferred into CL. The sequence close to the sea and port has a high LDI for the entire sequence, but the intensity decreases from sea to land. The land far from the coastline has a single LUT pattern.
In 2010–2020, the Yantai west port became the key development area. During the 13th five-year plan, the west port undertook the transfer and transportation function of ore, crude oil, gas and other commodities or bulk cargo from Zhifu Port. The land use changed dramatically, but the LDI decreased in the sea–land direction. The type of LUT sequence was mostly CL → BL > FL → CL. Land development slowed southeast of Yangma Island, except for a few strong units in the seashore area, and other regions were contiguous weak units. Yangma Island invested in the construction of vacation villages, marine tourism centers, yacht harbors and other facilities, resulting in the CLDI sequence with the following pattern: Extremely Strong Change Coastline -> Extremely Strong > Medium > Weak (Figure 7). Zhifu District and Fushan District land development was nearly saturated, and the type of LUT sequence in this position was CL → BL.

4.3. The Impacts of Port Construction on the Spatial Pattern of Land Utilization and Suggestions

Land development in Qingdao is a process of gradually spreading from the old city to the surrounding urban agglomeration [38]. Qingdao has maintained a good development trend over the 30 years, but the key development areas have varied. The intensity of land development in Yantai has decreased with time, and the most intense development has been in the seashore area. The development characteristics of Qingdao were more obvious than those of Yantai in the early stages, the strong LDI units were concentrated in the eastern suburbs of the old town, and the LDI units far from the coast and the old town were weaker. In Yantai, except for the Fushan and Zhifu Districts, which contained several strong units, the rest of the small-scale development plots were scattered. Driven by the development of seashore tourism and the construction of deep-water berths in the middle and late stages, the development of seashore areas has greatly increased, and the “Extremely Strong” and “Strong” units have moved to the coastal zone between Yangma Island and Zhifu Bay, the seashore area of Fushan District and Zhifu Port. The focus of Qingdao’s port construction has been moved from Qingdao Port to Qianwan Port, Huangdao District. Jiaozhou and Hongdao Districts have become new key development areas, and the LDI has decreased obviously along the sea–land direction. The land use pattern dominated by shipping in the Qingdao and Yantai port areas is prominent. Both Qingdao and Yantai built new port areas in the middle and later stages and made them the new focus of shoreline development. The radiating and pulling effect of the old ports on the port-vicinity industry has gradually shifted to the new ports with larger scales and throughput and more uses. The original ports have retained the regional characteristics, such as military uses, tourism and passenger transport.
In the early stage of port city construction, the port function was singular, and the port vicinity industry gradually clustered. Therefore, it is necessary to increase investment in infrastructure before the surge in freight throughput, expand wharf facilities and warehousing land and reserve space to accommodate more port-vicinity industries. The growth period of the interactive evolution of the port and the port city is the stage of the explosive growth of the port industry, and the extremely strong change units swiftly appear at the front of the sequence, developing the port into the center of the scale effect and driving land development in the middle of the sequence. For this reason, it is particularly important to strengthen road network construction and to build land–port transportation hubs to improve regional accessibility. Enhanced communication with the surrounding towns paves the way for further industrial transfer. When the mature period of port-city interactions arrives, the original port construction land will be depleted, and it is advisable to incorporate the surrounding towns into a unified planning system to coordinate the orderly transfer of capital and technology to the surrounding towns and give full play to the radiation effect of the ports on the hinterland. Port areas ought to explore pluralistic development strategies and increase investments in scientific research and education [40,41]. For example, Yantai has a long beach coastline; thus, it should increase its development of tourism resources and pay attention to both economic and environmental benefits. At the end of port city development, the strong change units start to move to the middle of the sequence. Land conversion occurs not only around the port but also toward the hinterland and promotes the development of the urban hinterland. To adapt to the needs of urban industrial upgrading, the industrial distribution of coastal cities should be reasonably adjusted to promote coordinated development. If the development of the original port area tends to be saturated, the land development in the port area becomes increasingly weaker. Therefore, a new port should be planned and constructed in time, and the division of functions between the new and old ports should be scientifically arranged. For example, Yantai built a new port to separate passengers and cargo, and the original port provides transport support for tourism development. Qingdao’s new port, Qianwan Port, is developing shipbuilding and oil and gas transportation functions.

5. Conclusions

In view of the complex and dramatic changes in coastal land use patterns, this paper used remote sensing image series data to research the association between shoreline change and LDI and the LUT pattern in the sea and land directions. The spatial relationship was introduced into the association rule mining model. According to the terrain features of coastal zones, this paper designed a sample division method by constructing a sector-annular grid to determine the samples and then established spatial association models (CLDI and LUT models) that reflected the relationship between the spatial pattern and allocation of LDI in the sea–land direction, which provided reference models for the spatiotemporal analysis of the coastal zones.
Port shipping has a profound influence on the land use patterns of port cities. However, different port cities have different locational factors and development bases, so there are differences in the land use patterns along the sea–land direction. Qingdao is the core city of the region, and the interaction between the port and city is strong and has maintained a good trend of development for a long time. In the early stage, development was carried out around the Qingdao Port area and the surrounding area of the old town. In the middle stage, the key development areas moved to the Qianwan Port area. In the later stage, the transfer of port vicinity industries to the surrounding important cities and towns was the main form of land expansion. The land development intensity of the Yantai Port area was relatively high in the early and middle stages but slowed significantly in the later stage. The Strong Change Coastline -> Extremely Strong > Strong > Medium > Weak CLDI sequence and the OL → BL > CL → BL > FL → CL LUT sequence spatially coincided.
The “one city with two ports” development strategy of Qingdao and Yantai is very similar. In the early stages of development, Qingdao Port and Zhifu Port played a leading role in driving the land development of the port vicinity economic development zone. In the middle stage, land resources in the Qingdao old town adjacent to the port area were exhausted. Qianwan Port, built and put into operation in 2002, took on the functions of freight, oil and gas transport from the old port. Since Yantai planned to develop the tourism industry, Zhifu Port stopped expanding in 2013, and the newly built Yantai west port was used to divert the functions of industrial and raw mineral material imports and shipbuilding from Zhifu Port. The old port retained the passenger transport and logistics transfer functions to adapt to the development of tourism. The port construction process of the two study areas changed the spatial allocation of the LDI and LUT patterns in these coastal zones and promoted continuous adjustment and changes in the spatial structure of the port cities.
Coastal industries gradually move inward to the hinterland, along with the construction of the port area. Hence, it is necessary to plan ahead and appropriately strengthen the development of the interior. At the same time, we should note that the expansion of the city cannot be based on the occupation of FL and CL and should reasonably optimize the land use structure and spatial pattern. When the port is mature and the port vicinity industry displays an outflow trend, a new port can be planned and constructed. Furthermore, it is necessary to rationally distribute the functions of the two ports, scientifically arrange the industrial transfer from the old port, improve the land transportation network to enhance the accessibility of coastal city groups and promote coordinated development among the regions.

Author Contributions

Conceptualization, J.Y., F.S. and R.X.; formal analysis, R.X. and J.B.; funding acquisition, J.Y. and F.S.; methodology, R.X., J.B. and F.J.; writing—original draft, R.X. and writing—review and editing, J.Y., R.X., J.B. and F.J. All authors have read and agreed to the published version of the manuscript.

Funding

This research was funded by the Chinese Academy of Sciences Strategic Leading Special A “Earth Big Data Science Project” (XDA19060300) and the Major Science and Technology Innovation Projects of Shandong Province (2019JZZY020103).

Institutional Review Board Statement

Not applicable.

Informed Consent Statement

Not applicable.

Data Availability Statement

The data presented in this study are available on request from the corresponding author.

Acknowledgments

We appreciate the critical and constructive comments and suggestions from the reviewers that helped improve the quality of this manuscript. We would also like to offer our sincere thanks to those who participated in the data processing and provided constructive comments for this study.

Conflicts of Interest

The authors declare no conflict of interest.

References

  1. Akhavan, M. Development dynamics of port-cities interface in the Arab Middle Eastern world The case of Dubai global hub port-city. Cities 2017, 60, 343–352. [Google Scholar] [CrossRef]
  2. Sun, Z.J.; Zhang, Y.J. Research on international trade ports and the regional industrial development of Japan. Urban Rural Plan 2019, 1, 106–116. [Google Scholar]
  3. Chen, X. The Interactive radiation effect between port city and hinterland city in Ningbo bay area. J. Ningbo Univ. (Lib. Ed.) 2020, 33, 110–121. [Google Scholar]
  4. Yagoub, M.M.; Kolan, G.R. Monitoring coastal zone land use and land cover changes of Abu Dhabi using remote sensing. J. Indian Soc. Remote Sens. 2006, 34, 57–68. [Google Scholar] [CrossRef]
  5. Uenlue, T. Transformation of a Mediterranean port city into a ‘city of clutter’: Dualities in the urban landscape The case of Mersin. Cities 2013, 30, 175–185. [Google Scholar] [CrossRef]
  6. Karen, M.P.; Jesus, G.F.; Jairo, R.T.; Laura, P.A. Defining and characterizing urban logistics spaces: Insights from a port city and generalization issues. In Proceedings of the 8th International Conference in Information Systems, Logistics and Supply Chains, Austin, TX, USA, 22 April 2020. [Google Scholar]
  7. Debrie, J.; Raimbault, N. The port–city relationships in two European inland ports: A geographical perspective on urban governance. Cities 2016, 50, 180–187. [Google Scholar] [CrossRef] [Green Version]
  8. Martín-Antón, M.; Campo, J.M.; Negro, V.; Luengo Frades, J.; Moreno Blasco, L.J.; Jiménez Verdejo, J.R. Land use and port-city integration in reclamation areas: A comparison between Spain and Japan. J. Coast Res. 2020, 95, 278. [Google Scholar] [CrossRef]
  9. Magarotto, M.G.; da Costa, M.F.; Tenedório, J.A.; Silva, C.A. Vertical growth in a coastal city: An analysis of Boa Viagem (Recife, Brazil). J. Coast Conserv. 2016, 20, 31–42. [Google Scholar] [CrossRef]
  10. Rocha, J.; Ferreira, J.C.; Simões, J.; Tenedório, J.A. Modelling coastal and land use evolution patterns through neural network and cellular automata integration. J. Coast. Res. 2007, 827–831. Available online: http://www.jstor.org/stable/26481698 (accessed on 27 May 2021).
  11. Freire, S.; Santos, T.; Tenedório, J.A. Recent urbanization and land use/land cover change in Portugal the influence of coastline and coastal urban centers. J. Coast. Res. 2009, 1499–1503. Available online: http://www.jstor.org/stable/25738039 (accessed on 27 May 2021).
  12. Morueta-Holme, N.; Svenning, J.C. Geography of plants in the new world: Humboldt’s relevance in the age of big data. Ann. Mo. Bot. Gard. 2018, 103, 315–329. [Google Scholar] [CrossRef] [Green Version]
  13. Misra, A.; Balaji, R. A study on the shoreline changes and land-use/ land-cover along the south Gujarat coastline. Procedia Eng. 2015, 116, 381–389. [Google Scholar] [CrossRef] [Green Version]
  14. Ozturk, D.; Sesli, F.A. Shoreline change analysis of the Kizilirmak Lagoon Series. Ocean Coast Manag. 2015, 118, 290–308. [Google Scholar] [CrossRef]
  15. Setiawan, Y.; Lubis, M.I.; Yusuf, S.M.; Prasetyo, L.B. Identifying change trajectory over the Sumatra’s forestlands using moderate image resolution imagery. Procedia Environ. Sci. 2015, 24, 189–198. [Google Scholar] [CrossRef] [Green Version]
  16. Xu, C.; Jie, B.; Chen, W.; Pan, L. Association rule analysis of factors contributing to extraordinarily severe traffic crashes in China. J. Saf. Res. 2018, 67, 65–75. [Google Scholar] [CrossRef] [PubMed]
  17. Rauch, J. Logic of association rules. Appl. Intell. 2005, 22, 9–28. [Google Scholar] [CrossRef]
  18. Nourani, V.; Molajou, A. Application of a hybrid association rules/decision tree model for drought monitoring. Glob Planet Chang. 2017, 159, 37–45. [Google Scholar] [CrossRef]
  19. Ludwig, C.; Fendrich, S.; Zipf, A. Regional variations of context-based association rules in OpenStreetMap. Trans. GIS 2020, 27, 602–621. [Google Scholar] [CrossRef]
  20. Wang, J.; Fan, Y.; Dong, X.; Xu, B. Improving association rules by optimizing discretization based on a hybrid GA: A case study of data from forest ecology stations in China. In Proceedings of the 2013 Fourth International Conference on Emerging Intelligent Data and Web Technologies, Xi’an, China, 9 September 2013. [Google Scholar]
  21. Bembenik, R.; Ruszczyk, A.; Protaziuk, G. Discovering collocation rules and spatial association rules in spatial data with extended objects using delaunay diagrams. In Proceedings of the Joint Rough Set SymposiumInternational Conference on Rough Sets and Emerging Intelligent Systems Paradigms, Madrid, Spain, 9 July 2014. [Google Scholar]
  22. Abbes, A.B.; Hemissi, S.; Farah, I.R. An efficient knowledge-based approach for random variation interpretation in NDVI time series. Environ. Earth Sci. 2018, 77, 761–767. [Google Scholar] [CrossRef]
  23. Gharbi, A.; Runz, C.D.; Faiz, S.; Akdag, H. Towards Association Rules as a Predictive Tool for Geospatial Areas Rvolution. In Proceedings of the International Conference on Geographical Information Systems Theory; Springer: Vienna, Austria, 1975; ISBN 978-3-211-81378-2. [Google Scholar]
  24. Ferrarini, A.; Tomaselli, M. A new approach to the analysis of adjacencies: Potentials for landscape insights. Ecol. Model. 2010, 221, 1889–1896. [Google Scholar] [CrossRef]
  25. Anputhas, M.; Janmaat, J.J.A.; Nichol, C.F.; Wei, X.A. Modelling spatial association in pattern based land use simulation models. J. Environ. Manag. 2016, 181, 465–476. [Google Scholar] [CrossRef]
  26. Ding, Z.; Liao, X.; Su, F.Z.; Fu, D. Mining coastal land use sequential pattern and its land use associations based on association rule mining. Remote Sens. 2017, 9, 116. [Google Scholar] [CrossRef] [Green Version]
  27. Ding, Z.; Su, F.Z.; Zhang, J.; Zhang, Y.; Tang, X. Clustering coastal land use sequence patterns along the sea–land direction: A case study in the coastal zone of Bohai Bay and the Yellow River Delta, China. Remote Sens. 2019, 11, 2024. [Google Scholar] [CrossRef] [Green Version]
  28. Qingdao Institute of Local History. General Situation of Qingdao. Available online: http://qdsq.qingdao.gov.cn/n15752132/n15752711/160812110726762883.html (accessed on 3 February 2021).
  29. Yantai Municipal People’s Government. General Situation of Yantai. Available online: http://www.yantai.gov.cn/col/col11751/index.html (accessed on 3 February 2021).
  30. United States Geological Survey. EarthExplorer. Available online: https://earthexplorer.usgs.gov/ (accessed on 29 July 2020).
  31. Jackson, T.J.; Chen, D.; Cosh, M.; Li, F.; Hunt, E.R. Vegetation water content mapping using Landsat data derived normalized difference water index for corn and soybeans. Remote Sens. Environ. 2004, 92, 475–482. [Google Scholar] [CrossRef]
  32. Goward, S.N.; Markham, B.; Dye, D.G.; Dulaney, W.; Yang, J. Normalized difference vegetation index measurements from the advanced very high resolution radiometer. Remote Sens. Environ. 1991, 35, 257–277. [Google Scholar] [CrossRef]
  33. Wang, M.H.; Yan, J.F. Research on extraction method of building land based on multivariate information. Beijing Surv. Mapp. 2018, 32, 1393–1396. [Google Scholar]
  34. Sanchez, D.; Vila, M.A.; Cerdaa, L.; Serrano, J.M. Association rules applied to credit card fraud detection. Expert Syst. Appl. Int. J. 2009, 36, 3630–3640. [Google Scholar] [CrossRef]
  35. Zaki, M.J. Mining non-redundant association rules. Data Min Knowl. Discov. 2004, 9, 223–248. [Google Scholar] [CrossRef]
  36. Yan, J.F.; Xiao, R.M.; Su, F.Z.; Wang, T. Mining the association rules between port shoreline and land utilization intensity: A case study in the coastal zone of Kuala Lumpur, Malaysia. Geocarto Int. 2020, 1–18. [Google Scholar] [CrossRef]
  37. Lin, Z.; Qi, S.; Chenchang, D. Study on the influencing factors of spatial and temporal evolution of urban industrial land:take Qingdao as an example. In Proceedings of the Annual National Planning Coference, Chongqing, China, 6 March 2019; p. 13. [Google Scholar]
  38. Sun, J.W. Study on the Characteristics of Integrated Development of Qingdao Port, Industry and City. Master’s Thesis, Dalian University of Technology, Dalian, China, 2019. [Google Scholar]
  39. Gao, N. The Research of Yantai City Government Function on the Interanction Development of Port and City. Master’s Thesis, Shandong University of Science and Technology, Qingdao, China, 2018. [Google Scholar]
  40. Elvira, N.; Maria, P. Strategic vision of a Euro-Mediterranean port city: A case study of Palermo. Sustainability 2013, 5, 3941–3959. [Google Scholar]
  41. Li, M.; Zhang, Z.; Lo Seen, D.; Sun, J.; Zhao, X. Spatiotemporal Characteristics of Urban Sprawl in Chinese Port Cities from 1979 to 2013. Sustainability 2016, 8, 1138. [Google Scholar] [CrossRef] [Green Version]
Figure 1. Geographic distribution map of the study area (Landsat-8 OLI image, 2020).
Remotesensing 13 03110 g001
Figure 2. Schematic diagram of the grid division.
Remotesensing 13 03110 g002
Figure 3. Distribution of the LDI in the study areas of Qingdao and Yantai.
Remotesensing 13 03110 g003
Figure 4. Schematic diagram of the LUT sequence samples in the Qingdao coastal zone (BL: building land; Wa: waters; CL: cultivated land; GP: garden plot; FL: forestland; OL: other land; AS: aquaculture and salt field).
Remotesensing 13 03110 g004
Figure 5. Schematic diagram of the LUT sequence samples in the Yantai coastal zone (BL: building land, Wa: waters, CL: cultivated land, GP: garden plot, FL: forestland, OL: other land and AS: aquaculture and salt field).
Remotesensing 13 03110 g005
Figure 6. Distribution of the important CLDI sequences in the Qingdao coastline zone.
Remotesensing 13 03110 g006
Figure 7. Distribution of the important CLDI sequences in the Yantai coastline zone.
Remotesensing 13 03110 g007
Table 1. Parameters of precision in the Qingdao coastal zone in 2020 (%).
ClassificationBuilding LandForestlandWaterCultivated LandAquaculture and Salt FieldOther LandGarden Plot
Building land92.899.3804.540.2717.140
Forestland0.0280.9200.02006.58
Water0093.3507.1100
Cultivated land3.019.546.6591.540.541.1414.56
Aquaculture and salt field000091.4200
Other land4.090.1600.620.6781.720
Garden plot0003.280078.86
Overall accuracy = 85.87% Kappa coefficient = 0.82
Table 2. Parameters of precision in the Yantai coastal zone in 2020 (%).
ClassificationBuilding LandForestlandWaterCultivated LandAquaculture and Salt FieldsOther LandGarden Plot
Building land81.8401.950018.490
Forestland084.1402.670011.83
Water4.05087.9606.7800
Cultivated land0.074.27094.990.3507.41
Aquaculture and salt fields0010.1091.9900
Other land14.040000.8881.510
Garden plot011.5902.340080.75
Overall accuracy = 85.67% Kappa coefficient = 0.82
Table 3. Association rules between the coastline change and land development intensity in Qingdao.
PeriodRuleSupportConfidence
1990–2000Weak Change Coastline -> Weak > Extremely Strong > Strong > Medium > Weak3.41%100.00%
Extremely Strong Change Coastline -> Medium > Extremely Strong > Strong > Medium > Weak3.41%100.00%
Weak Change Coastline -> Weak > Extremely Strong > Weak2.27%66.67%
Weak Change Coastline -> Medium > Weak > Strong2.27%66.67%
Medium Change Coastline -> Weak > Medium > Weak2.27%66.67%
Medium Change Coastline -> Medium > Strong > Weak2.27%66.67%
Extremely Strong Change Coastline -> Extremely Strong > Medium > Weak2.27%100.00%
2000–2010Weak Change Coastline -> Extremely Strong > Medium > Weak5.68%100.00%
Extremely Strong Change Coastline -> Strong > Medium > Weak5.68%83.33%
Weak Change Coastline -> Weak > Strong > Weak3.41%100.00%
Extremely Strong Change Coastline -> Weak > Extremely Strong > Strong > Medium3.41%100.00%
Weak Change Coastline -> Weak > Medium > Extremely Strong > Medium > Weak2.27%100.00%
Weak Change Coastline -> Medium > Extremely Strong > Medium > Weak2.27%100.00%
Medium Change Coastline -> Strong > Medium > Weak > Medium2.27%66.67%
Extremely Strong Change Coastline -> Medium > Strong > Medium > Weak2.27%100.00%
Strong Change Coastline -> Strong > Weak > Medium > Weak2.27%50.00%
Extremely Strong Change Coastline -> Strong > Weak > Medium > Weak2.27%50.00%
2010–2020Weak Change Coastline -> Weak > Weak > Medium > Weak5.68%71.43%
Weak Change Coastline -> Weak > Strong > Medium5.68%100.00%
Extremely Strong Change Coastline -> Extremely Strong > Strong > Medium > Weak5.68%100.00%
Medium Change Coastline -> Strong > Medium > Weak4.55%80.00%
Strong Change Coastline -> Strong > Medium > Weak > Medium4.55%80.00%
Medium Change Coastline -> Strong > Extremely Strong > Medium3.41%75.00%
Extremely Strong Change Coastline -> Strong > Weak > Medium > Weak3.41%100.00%
Weak Change Coastline -> Weak > Medium > Strong > Weak2.27%100.00%
Medium Change Coastline -> Medium > Strong > Medium2.27%100.00%
Medium Change Coastline -> Medium > Extremely Strong > Medium > Weak > Medium2.27%100.00%
Extremely Strong Change Coastline -> Extremely Strong > Medium > Weak2.27%66.67%
Table 4. LUT association rules in the Qingdao area.
PeriodRuleSupportConfidence
1990–2000CL → GP10.84%100.00%
CL → BL6.02%100.00%
AS → BL > CL → GP6.02%100.00%
Wa → OL > Wa → AS > CL → GP3.61%100.00%
Wa → AS > CL → GP > CL → BL > CL → GP2.41%100.00%
Wa → AS > CL → BL > GP → BL > CL → BL > CL → GP > CL → BL > CL → GP2.41%100.00%
Wa → OL > OL → BL > CL → GP2.41%100.00%
Wa → BL > CL → BL > CL → GP > CL → BL > FL → GP > CL → GP > OL→ GP > GP → CL > CL → GP2.41%100.00%
Wa → BL > CL → BL > FL → CL > CL → BL2.41%100.00%
Wa → BL > CL → BL > GP → BL > CL → BL > CL → GP > FL → CL > CL→ GP > FL → CL2.41%100.00%
CL → AS > CL → GP > CL → AS > CL → GP > CL → BL > CL → GP2.41%100.00%
CL → GP > AS → BL2.41%100.00%
FL → BL > CL → BL > FL → CL2.41%100.00%
2000–2010CL → BL19.74%100.00%
GP → CL > CL → BL9.21%100.00%
GP → CL7.89%100.00%
GP → BL6.58%100.00%
Wa → BL > CL → BL5.26%100.00%
CL → BL > GP → BL > CL → GP3.95%100.00%
CL → BL > GP → BL > CL → BL > CL → GP3.95%100.00%
Wa → BL > CL → BL > FL → CL > CL → BL > CL → GP2.63%100.00%
CL → BL > GP → BL > CL → BL2.63%100.00%
GP → CL > CL → BL > CL → GP2.63%100.00%
GP → BL > CL → BL > GP → CL > CL → BL > CL → GP2.63%100.00%
GP → BL > CL → BL > GP → CL > CL → BL > GP → CL2.63%100.00%
2010–2020CL → BL10.87%100.00%
AS → BL > CL → BL8.70%100.00%
Wa → OL > AS → OL > AS → BL3.26%100.00%
CL → BL > AS → BL3.26%100.00%
AS → OL > AS → BL > CL → BL > GP → CL3.26%100.00%
CL → BL > GP → BL > CL → BL2.17%100.00%
AS → OL > AS → BL2.17%100.00%
AS → BL > CL → BL > AS → BL > CL → BL2.17%100.00%
AS → BL > AS → CL > CL → BL2.17%100.00%
GP → CL > Wa → CL > GP → CL2.17%100.00%
GP → BL > CL → BL2.17%100.00%
Note: BL: building land, Wa: waters, CL: cultivated land, GP: garden plot, FL: forestland, OL: other land and AS: aquaculture and salt field.
Table 5. Association rules between the coastline change and land development intensity in Yantai.
PeriodRuleSupportConfidence
1990–2000Weak Change Coastline -> Medium > Strong > Medium > Strong5.56%100.00%
Medium Change Coastline -> Weak > Medium > Strong > Medium3.33%100.00%
Extremely Strong Change Coastline -> Strong > Weak > Strong3.33%100.00%
Weak Change Coastline -> Weak > Medium > Strong > Extremely Strong2.22%100.00%
Weak Change Coastline -> Weak > Strong > Medium > Weak2.22%66.67%
Extremely Strong Change Coastline -> Medium > Weak > Strong2.22%100.00%
Strong Change Coastline -> Strong > Extremely Strong > Strong > Medium2.22%100.00%
Extremely Strong Change Coastline -> Strong > Extremely Strong > Strong2.22%100.00%
Extremely Strong Change Coastline -> Strong > Extremely Strong > Strong > Extremely Strong > Medium2.22%100.00%
Extremely Strong Change Coastline -> Extremely Strong > Strong > Medium2.22%100.00%
2000–2010Strong Change Coastline -> Extremely Strong > Strong > Medium > Weak > Medium6.67%85.71%
Weak Change Coastline -> Weak > Medium > Strong > Medium5.56%100.00%
Weak Change Coastline -> Weak > Strong > Medium5.56%100.00%
Extremely Strong Change Coastline -> Strong > Medium > Strong > Medium3.33%100.00%
Strong Change Coastline -> Medium > Weak > Medium > Weak2.22%50.00%
2010–2020Weak Change Coastline -> Weak > Extremely Strong > Strong > Weak4.44%100.00%
Weak Change Coastline -> Weak > Strong > Medium3.33%100.00%
Weak Change Coastline -> Weak > Medium > Strong > Weak2.22%100.00%
Weak Change Coastline -> Strong > Medium > Strong > Weak2.22%66.67%
Medium Change Coastline -> Strong > Weak > Medium > Weak2.22%50.00%
Extremely Strong Change Coastline -> Medium > Weak > Medium > Weak2.22%50.00%
Extremely Strong Change Coastline -> Strong > Weak > Medium > Weak2.22%50.00%
Extremely Strong Change Coastline -> Extremely Strong > Medium > Weak2.22%100.00%
Table 6. LUT association rules in the Yantai area.
PeriodRuleSupportConfidence
1990–2000OL → CL > FL → CL14.77%100.00%
FL → CL13.64%100.00%
CL → BL > FL → CL10.23%100.00%
FL → CL > OL → CL6.82%100.00%
FL → CL > CL → BL > FL → CL5.68%100.00%
Wa → AS > CL → BL > OL → CL3.41%100.00%
Wa → OL > FL → CL > CL → OL > FL → CL3.41%100.00%
CL → BL > FL → CL > OL → CL3.41%100.00%
OL → BL > CL → BL > FL → CL3.41%100.00%
OL → CL > FL → CL > FL → OL > FL → CL2.27%100.00%
FL → CL > OL → CL > FL → CL > CL → BL > OL → CL2.27%100.00%
2000–2010CL → BL > FL → CL35.53%100.00%
CL → BL > FL → CL35.53%35.53%
FL → CL9.21%100.00%
CL → BL > OL → CL7.89%100.00%
AS → BL > CL → BL > CL → GP > FL → CL3.95%100.00%
AS → BL > FL → CL3.95%100.00%
CL → GP > CL → BL > FL → CL2.63%100.00%
CL → BL > FL → CL > CL → BL2.63%100.00%
CL → BL > FL → CL > CL → BL > CL → GP > OL → CL2.63%100.00%
CL → BL > FL → CL > OL → CL2.63%100.00%
CL → BL > FL → CL > OL → CL > FL → CL2.63%100.00%
OL → CL > FL → CL2.63%100.00%
FL → CL > CL → BL > FL → CL2.63%100.00%
2010–2020CL → BL > FL → CL19.05%100.00%
CL → BL17.86%100.00%
CL → GP3.57%100.00%
CL → BL > CL → GP3.57%100.00%
CL → BL > FL → OL3.57%100.00%
AS → OL > CL → BL3.57%100.00%
FL → GP > AS → BL > CL → BL3.57%100.00%
Wa → CL > CL → BL2.38%100.00%
CL → BL > GP → CL > CL → GP2.38%100.00%
CL → BL > GP → BL > GP → CL > FL → CL2.38%100.00%
OL → BL > CL → BL > FL → CL2.38%100.00%
FL → GP > CL → BL > FL → CL2.38%100.00%
GP → BL > Wa → CL2.38%100.00%
Note: BL: building land, Wa: waters, CL: cultivated land, GP: garden plot, FL: forestland, OL: other land and AS: aquaculture and salt field.
Publisher’s Note: MDPI stays neutral with regard to jurisdictional claims in published maps and institutional affiliations.

