Article

Active Strike-Slip Faulting and Systematic Deflection of Drainage Systems along the Altyn Tagh Fault, Northern Tibetan Plateau

1
Institute of Geomechanics, Chinese Academy of Geological Sciences, Beijing 100081, China
2
Key Laboratory of Active Tectonics and Geological Safety, Ministry of Natural Resources, Beijing 100081, China
3
Key Laboratory of Deep-Earth Dynamics of Ministry of Natural Resources, Institute of Geology, Chinese Academy of Geological Sciences, Beijing 100037, China
4
College of Oceanography, Hohai University, Nanjing 210098, China
5
School of Earth Science and Resources, Chang’an University, Xi’an 710054, China
*
Author to whom correspondence should be addressed.
Remote Sens. 2021, 13(16), 3109; https://doi.org/10.3390/rs13163109
Submission received: 28 June 2021 / Revised: 29 July 2021 / Accepted: 4 August 2021 / Published: 6 August 2021

Abstract

:
Systematic deflection of drainage systems along strike-slip faults is the combination of repeated faulting slipping and continuous headward erosion accumulated on the stream channels. The measurement and analysis of systematically deflected stream channels will enhance our understanding on the deformational behaviors of strike-slip faults and the relationship between topographic response and active strike-slip faulting. In this study, detailed interpretation and analysis of remote sensing images and DEM data were carried out along the Altyn Tagh Fault, one typical large-scale strike-slip fault in the northern Tibetan Plateau, and together with the statistical results of offset amounts of 153 stream channels, revealed that (i) the drainage systems have been systematically deflected and/or offset in sinistral along the active Altyn Tagh Fault; (ii) The offset amounts recorded by stream channels vary in the range of 7 m to 72 km, and indicate a positively related linear relationship between the upstream length L and the offset amount D, the channel with bedrock upstream generally has a better correlation between L and D than that of non-bedrock upstream; (iii) River capture and abandonment are commonly developed along the Altyn Tagh Fault, which probably disturbed the continuous accumulation of offset recorded on individual stream channel, suggesting that the real maximum cumulative displacement recorded by stream channels might be larger than 72 km (lower bound) along the Altyn Tagh Fault. Along with the cumulative displacements recorded by other regional-scale strike-slip faults in the Tibetan Plateau, these results demonstrate that the magnitude of tectonic extrusion along these first-order strike-slip faults after the collision of India–Asia plates might be limited.

Graphical Abstract

1. Introduction

Topographic evolution is a joint result of the tectonic deformation that tends to build topography and the surface processes that tend to tear them down [1]. Therefore, the topographic feedback associated with tectonism is an important tool to study the deformational characteristics and behaviors of faulting and folding, especially for somewhere that is actively deforming [2,3,4]. Among all these geomorphic indicators, drainage systems exhibit excellent quality for quantitatively assess the tectonic process and present-day crustal deformation [5,6,7,8]. The geometry and morphology of drainage systems usually make a change when across active faults or folds [2,7,8,9,10], of which the most commonly used topographic marker is the systematic deflection and/or offset of stream channels produced by strike-slip faulting [4,11,12,13]. For example, based on the restoration of three main tributaries of the Yangtze River, the total displacement along the strike-slip Ganzi-Yushu-Xianshuihe Fault in the southeastern Tibetan Plateau was suggested to be ~60 km [4]. Along the Fuyun Fault in northwestern China, the characteristic slip of 6.3 m was obtained by analyzing the offset distribution of 290 deflected stream channels and terraces [14]. The single-event offset of the 1920 Haiyuan Ms 8.5 earthquake on the Haiyuan Fault in the northeastern Tibetan Plateau was reevaluated to be ~5 m based on the offset measurement of stream channels by the high-resolution light detection and ranging (LiDAR) data [15]. Similarly, the characteristic slip of ~6 m at the eastern Altyn Tagh Fault was revealed according to the results of 321 offset measurements below 30 m [16]. Thus, the measurement and analyses of offset stream channels represent an effective method to study the recurrence behaviors and displacement accumulation of strike-slip faults.
However, previous publications are mainly focused on the maximum cumulative displacement or local expressions of drainage systems produced by certain strike-slip fault. A complete and systematic measurement and analysis of offset amounts of stream channels along the entire strike-slip fault is still lacking, which hinders our understanding on how the stream channels with different orders of magnitude response and accumulate the strike-slip displacement at different timescales.
The accumulation of offset amount on stream channel is achieved through repeated fault slipping events during long-term geologic history. Meanwhile, the upstream of stream channels lengthens with the continuous headward erosion process. Based on the interaction between strike-slip faulting and offset accumulation, a hypothesis concerning with the upstream length of stream channel and offset amount was reached [13,17].
In this study, we chose the Altyn Tagh Fault, the northern border of the Tibetan Plateau (Figure 1), as a carrier to study the relationship between strike-slip faulting and offset cumulation of drainage systems. With the availability of high-resolution remote sensing image, and three-dimensional stereoscopic inspected technology, the seismic recurrence characteristics of active faults could be revealed by precise measurement and analyses of offset amounts of rivers or gullies [14,15,16]. In order to get a better understanding of the geomorphic feedback to strike-slip faulting and improve knowledge of fault behaviors, a total of 153 stream channels, including small gullies developed on alluvial fan along the Altyn Tagh Fault, were interpreted and analyzed, of which the upstream length L and offset amount D were measured. On the basis of statistical results, the mathematic relationship between these two parameters was presented, which provides a new insight into the interaction between development of drainage systems and offset accumulation along active strike-slip faults. Finally, the tectonic implication and role that the Altyn Tagh Fault plays on the geodynamics of the Tibetan Plateau were discussed.

2. Tectonic Setting

The Altyn Tagh Fault, a large-scale strike-slip fault with a length of ~2000 km, defines the northern border of the Tibetan Plateau (Figure 1). Although the total cumulative offset and initiation time of left-lateral strike-slip faulting of the Altyn Tagh Fault are still disputed, it is undoubtful that the Altyn Tagh Fault plays a crucial role in accommodating eastward extrusion of the Tibetan Plateau responding the ongoing convergence of Indian plate into the Eurasian plate [18,19,20]. The geologically constrained total displacement of ~500 km was suggested based on the restoration of Paleozoic granite [21]. Subsequently, the total displacement along the Altyn Tagh Fault was estimated to be ~470 km inferred from the displaced Ordovician and Permian pluton [22], consistent with total slip of 470 ± 70 km since its initiation at 49 Ma [23]. Chen et al. [24] determined the maximum left-lateral displacement to be 500 ± 130 km since 24 Ma by paleomagnetic constraints. Actually, the spatial distribution of the sinistral strike-slip displacement varies along different section of the Altyn Tagh Fault [25,26]. A gradually reduced displacement to the northeast was supported by some researches. A ~400 km displacement at the western and middle segment since 40–37 Ma and ~150 km displacement since 25–17 Ma at its eastern segment was suggested [25]. Variable cumulative offsets were also supported with the estimations of 120–125 km for the west segment, 80–100 km for the central segment, and 60–75 km for the east segment since late Miocene–early Pliocene [26]. Therefore, the maximum cumulative offset recorded by different geologic or geomorphic units varies greatly along different segments of the Altyn Tagh Fault at different timescales, and because of that, it is essential that when we estimate the offset amount, the corresponding timing for this offset should be defined.
Although the initiation time for the Altyn Tagh Fault remains controversial, it is widely accepted that the left-lateral strike-slip faulting is activated since the collision of Indian-Eurasian plates in Cenozoic [27]. The long-term geologic rate, late Quaternary slip rate, and geodetic rate determined by Global Positioning System (GPS) and Interferometric Synthetic Aperture Radar (InSAR) technology along the Altyn Tagh Fault gave a wide range that varies as much as 3–5 times [28,29]. Yin and Harrison [30] estimated a geologic rate of 7–9 mm/yr inferred from the 280 ± 30 km cumulative displacement since ~30 Ma ago. An average slip rate of 9 ± 2 mm/yr was obtained from the 470 ± 70 km displacement since 49 Ma ago [23]. Yue et al. [31] determined the slip rate to be 12–16 mm/yr inferred from 375 ± 25 km displacement since the late Oligocene, and a rate of 10 mm/yr since 16.4 Ma [32]. Based on the analyses of sedimentary characteristics and structural deformation of late Cenozoic basin at the central segment of the Altyn Tagh Fault, 80–100 km left-lateral displacement cumulated in the past ~5 Ma was suggested and thus estimated the average slip rate of 16–20 mm/yr [33]. By restoring the modern Xorkol Basin to its Oligocene position across the Altyn Tagh Fault, an upper bound on the post-early Miocene long-term slip rate was suggested to be 10 mm/yr since 16 Ma [34].
The late Quaternary slip rate of the Altyn Tagh Fault is mainly inferred from the displaced geomorphic features and associated dating results. A rapid slip rate of 20–30 mm/yr was estimated based on the analyses of deflected stream channels, alluvial terrace, and glacial moraines since Holocene [19,35]. Xu et al. [36] reported the Holocene slip rate at different sections of the Altyn Tagh Fault with the values of 17.5 ± 2 mm/yr at the western-central section, 11 ± 3.5 mm/yr at the central section, and 4.8–2.2 mm/yr in the east. Based on the radiocarbon and cosmogenic nuclides dating of deflected alluvial fan and fluvial terrace, the average slip rate was suggested to be 20.3 ± 1.1 mm/yr at the eastern segment of the Altyn Tagh Fault [37]. Wang et al. [38,39] obtained a Holocene slip rate of 11.4 ± 2.5 mm/yr through offset measurement and dating of fluvial terraces and alluvial fans. At the central segment (86.7–88.5°E), similar slip rates concentrating in this range of 8–17 mm/yr have also been obtained by several studies [28,29,40,41]. Xiang et al. [42] classified the offset amounts of river system and obtained the Holocene slip rate of 4.7–6.7 mm/yr in the east.
The low slip rate along the Altyn Tagh Fault is supported by the results of GPS and InSAR observations. At 86–92°E, the slip rate was suggested to be 9 ± 5 mm/yr inferred from the continuous GPS stations across the fault [43,44,45], consistent with the independent results of 9 ± 2 mm/yr and 8–9 mm/yr [46,47]. Zhang et al. [29] reported a slip rate of 11.9 ± 3.3 mm/yr at 89–91°E, 4 mm/yr at 94–96°E, and 3.9 ± 2.3 mm/yr at ~96°E, respectively. Based on the results of GPS array, a slip rate of 9.0 ± 4 mm/yr was obtained [48]. The most recent GPS observations gave a left-lateral slip rate of 8.1 ± 0.7 mm/yr at ~86°E, 8.6 ± 1.5 mm/yr at ~90.4°E, and 4.5 ± 0.8 mm/yr at ~94.6°E [49], consistent with the InSAR-derived slip rate of 6.4 mm/yr between 91.5°E and 95°E [50]. The geologic rate, late Quaternary rate and geodetic rate of different sections along the Altyn Tagh Fault are summarized in Table 1. In addition, historical large earthquakes have repeatedly occurred on the Altyn Tagh Fault including the most recent surface-rupturing events of the Yutian 2008 Mw 7.1 and 2014 Mw 6.9 earthquakes, which produced 31-km-long and 28-km-long coseismic surface ruptures, respectively [47,51].

3. Method and Results

3.1. Theoretical Principle of Systematic Deflection of Stream Channels

It was first reported by Russell [52] that the cumulative offset of rivers becomes larger with the increasing magnitude of rivers after an investigation of river network, in which stream channels were cut through by Haywards Fault in the east of San Francisco Bay. Afterwards, Matsuda [11] proposed a positively linear relation between the upstream length L (referring to the channels from the headwater to the deflected point) and the offset amount D with a certain coefficient for intramontane active faults based on the statistical data from some typical active strike-slip faults in Japan,
D ≈ a·L
where a is dimensionless coefficient. Furthermore, Matsuda [11] found that slip rates s and coefficients a-value of the strike-slip faults in Japan also showed a linear relationship: s (mm/yr) ≈ 10·a (mm/yr). This linear relationship had been used to estimate unknown slip rates of strike-slip faults in Japan. Gaudemer et al. [17] proposed that headward lengthening could be expressed as equation of headward erosion rate (h) and time (t):
L = h·t
Considering that displacement could also be expressed as
D = s·t
where s is slip rate. Combining Equations (1)–(3),
D/L = s/h = a
The Equation (4) explains the linear relationship between D and L, which reflects the nature of tectonic geomorphology resulting from the synchronous accumulation of both the offset amount and the upstream lengths of channels produced by repeated fault slipping and continuous headward erosion.

3.2. Interpretation and Measurement of Deflected Stream Channels

First, the active fault trace of the Altyn Tagh Fault and the deflected stream channels distributed in both sides were interpreted using 90 m resolution SRTM (Shuttle Radar Topography Mission) data (Figure 2A and Figure 3A) and Google Earth images (Figure 2B, Figure 3B, Figure 4, Figure 5, Figure 6 and Figure 7).
Although without field observations, deflection of the stream channels has been assured by other accompanied geomorphic features including linear valleys (Figure 2, Figure 3 and Figure 7), offset ranges (Figure 4C and Figure 7A,C), offset terraces and alluvial fans (Figure 5 and Figure 6), saddles, fault scarps, etc. Preserved surface ruptures developed on alluvial fans can be clearly recognized and traced from the high-resolution satellite images (Figure 4B). The systematical offset of streams or gullies, which are usually studied as geomorphic markers of repeated or clustered earthquakes [14,15], could also be recognized in this study. The gullies AT060–AT081 running on the alluvial fan display an almost uniform geometry with the left-lateral displacement of 7–69 m (Figure 5). The minimum value of ~7 m recorded by gully AT076 probably indicates the most recent seismic events (one or more events). Other offsets suggested possible overlapping to this minimum offset associated with the repeated surface-rupturing events.
Our interpretation confirms that rivers with a large order of magnitude tend to accumulate larger offset amount. For example, the channels AT001, AT003, and AT007 in Figure 2A and channels AT031–AT034 in Figure 3A with the upstream length larger than 1000 m have a significantly larger offset amount than that of channels AT009–AT023 and AT024–AT030. Besides, channels with similar upstream length usually accumulated similar offset amount. For example, the deflected channels AT036–AT058 with similar upstream lengths of 400–700 m accumulated offset in the range of 80–170 m (see channels in Figure 4C).

3.3. Measurement and Results

Based on the above detailed interpretation, the offset amounts and upstream lengths of stream channels were measured along the entire Altyn Tagh Fault (Figure 2, Figure 3, Figure 4, Figure 5, Figure 6 and Figure 7, Table S1). For channels with no distinct deflection points, the offsets were measured by projecting the stable trends of both the upstreams and downstreams to the fault traces. Measurement uncertainty results mainly from projecting the deflected point to the fault trace and are approximately proportional to the amount of deflection and bending. Previous studies usually measured upstream channel lengths from topographic maps or data manually or automatically. In this study, we extracted horizontal stream length in ArcGIS automatically.
Totally, 153 distinctively deflected stream channels have been measured for upstream lengths (L) and the offset amounts (D), and these are plotted on D–L double-log diagram as shown in Figure 8a. The a-value distributed in this range of 0.025 to 1.47 with an average value of 0.26 and standard deviation of 0.16. In general, the headward erosion is influenced by various factors including climate, lithology, regional topography, etc. Besides, the preservation of deflection is also determined by events such as river capture and lateral migration. These factors resulted in the deviation of the a-value.

4. Three Types of Stream Channels

The stream channels developed either in bedrock or unconsolidated sediment such as fluvial terraces and alluvial fans, which are named as bedrock channel and non-bedrock channel in this study, respectively. Because the erosion resistance of unconsolidated sediment is obviously lower than bedrock, this usually results in larger headward erosion rate if the channel-head locates in the alluvial sediment. In this case, the upstream length (L) tends to become larger than that of bedrock channel in spite of the same deflection accumulation (D).
In another case, the downstream channel developed on piedmont alluvial fans tends to wander laterally or to be captured easily, which breaks the previous displacement accumulation and causes smaller deflection (D) than bedrock channel with the same upstream length (L). For these reasons, we sorted the deflected channels into three types: bedrock channel, non-bedrock channel, and non-bedrock downstream (Figure 9, Figure 10 and Figure 11), based on which L and D were statistically plotted and analyzed. The average a-value with standard deviation σ has been calculated for three types of channels (Figure 9, Figure 10 and Figure 11, Table 2).
In total, 65 bedrock channels were measured and analyzed. The L and D displayed good linear relationship with correlation coefficient of 0.85 (Figure 9, Table S1). In the same location, the phenomenon that rivers with longer upstream length accumulated larger the amount of deflection could be observed (Figure 2 and Figure 3). Channels with shorter upstream lengths from ~200 m to ~4000 m have been sinistrally deflected for ~70 m to ~600 m. Channels with larger upstream lengths from ~2500 m to ~60,000 m have accumulated offset of 1 km to 28 km. This result indicates an accumulation of deflection along the Altyn Tagh Fault, whereby longer upstream river channels usually accumulated greater amounts of deflection.
The offset accumulated by non-bedrock channels seems to be limited, not excessing 100 m, suggesting that the associated alluvial fans and fluvial terraces formed recently. Twenty-seven channels with upstream lengths from ~30 to ~910 m have been offset for 7 to 69 m (Figure 5 and Figure 7B, Table S1), showing poor linear relationship between L and D with a low correlation coefficient of 0.24 (Figure 10). Moreover, the upstream length of streams with similar offset from ~30 m to ~50 m also varies across order of magnitudes, from ~60 m to ~910 m, which is probably related to nonuniform headward erosion rate on the fluvial terraces and alluvial fans.
In addition, 61 non-bedrock channels with non-bedrock downstream have also been measured. The L and D show good linear relationship with a high correlation coefficient of 0.98 (Figure 11, Table S1), which is mathematically attributed to channel AT035 which was deflected for ~72 km (Figure 1B). The average a-value of the non-bedrock downstream channel (0.24 ± 0.17) shows no distinct minus than that of the bedrock channel (0.28 ± 0.15), but the coefficient of variance (73%) is larger than the bedrock channel (52%) (Table 2), which is mainly related to the irregularly preserved D. For example, the downstreams shown in Figure 6, as well as a few channels in Figure 7, have been developed on piedmont alluvial fans. No fixed channels could be identified from the satellite images because of horizontal migration of channels, usually with the tendency to eliminate lateral displacement. The measured D for these channels should be smaller than the real offset amount since the formation of the upstream channels.

5. Discussion

5.1. Accurate Measurement of the Offset Amount

Accurate interpretation of active fault traces and systematical statistics of deflected channels is the precondition of studying systematic deflection of stream channels. First, the naturally curved stream channels should be excluded. In general, the systematic deflection of stream channels along active strike-slip faults is always accompanied by other deformational indicators such as offset fluvial terraces and alluvial fans (Figure 5 and Figure 6), even the well-preserved surface rupture (Figure 4B), etc.
The river morphology usually has a close relationship with the local lithology. For bedrock channels of intermontane rivers, characterized by the rapid downward erosion, the planimetric position is generally relative stationary, and thus the horizontal cumulative offset can be well preserved [13]. As shown in Figure 9 and Figure 11, a high correlation coefficient of 0.85 and 0.98 are obtained for the bedrock channels and bedrock channels with non-bedrock downstreams, respectively, indicating good linear relationship between L and D. Here, it is necessary to make a statement that it seems to show a poor linear relationship for these channels with large upstream lengths in the linear coordinate system, actually, this appearance is caused mathematically due to the very limited channel which have large upstream lengths (four channels in Figure 9 and one channel in Figure 11). Thus, in order to avoid the big discrepancy on the order of magnitude among these upstream lengths, we also make the double logarithmic diagrams which show better linear relationship between L and D. These rivers with downstream channels developed in unconsolidated or weakly consolidated alluvial fan or terrace deposits are prone to occur river capture and lateral migration, which easily result in river course transformation [9,53]. As shown in Figure 5, the abandoned downstream channels filled by deposits make it difficult to recognize the original stream channels. In addition, some downstream channels developed in diluvial fans splay into fan-shape pattern without obvious channel, leading to low accuracy of offset measurement.
The uncertainty of offset measurement results mainly from projecting the offset or deflected piercing point to the fault trace and is approximately proportional to the offset amount. Good tendency of upstream and downstream and little bending amount at the deflected point would allow a higher accuracy of offset measurement. In contrast, the wandering and swerving channels and large bending at the deflected point can result in big uncertainty. According to the morphology and pattern of stream channels, the uncertainty is preliminarily divided into four levels (5% for almost no bending, 10% for good tendency and small bending, 20% for good tendency and great bending or poor tendency and small bending, and 50% for poor tendency and great bending). For example, for channel AT130 (Figure 7A), the downstream wanders in the alluvial fan deposits and lacks a distinct deflected point along active fault trace, which probably yields an uncertainty of as much as 50%. However, a low uncertainty of 10% is suggested for channel AT034 (Figure 3A), in which stationary channels and distinct deflected point with little bending amount can be recognized and projected to the fault.
In the process of interpretation and measurement, it is also quite common that we could not see any displacement of individual river even find opposite offset along the Altyn Tagh Fault, which is probably caused by complex factors including stream capture, rising base level, aridification, flooding, shutter ridge, etc. [54]. Ouchi [55] analyzed the field-measured planform geometry and longitudinal profiles of some channels offset by the San Andreas fault and concluded that whether a channel crossing a strike-slip fault shows a clear offset depends heavily on the history and fluvial conditions of the channel. Offset rivers remain the adjustment condition after instantaneous deformation by fault displacement until the next fault slip deforms them, then the process of deformation and adjustment resumes all over again.
In addition, smaller offsets of 2–5 m were reported by field observations [56] and high-resolution topographic data [16]. Due to the resolution of Google Earth images, smaller offsets than 7 m could not be found in this study. Therefore, it is possible that the displacement of 7 m was produced by multi-events in recent paleoseismic history. Because of natural curve, interpretation of active channels alone does not provide reliable evidence of fault slipping [10]. Systematic deflection of stream channels reaches the assumption that larger stream channels usually accumulate larger offset amounts, and young rivers accumulate less offsets. It would be of higher reliability to interpret deflected channels with various magnitudes. Besides, due to the frequently developed river capture and abandonment, the stream channels often occur lateral migration and swerving as shown in Figure 4C; therefore, the change of flow direction of single channel does not indicate fault slipping. Another assumption could be reached is that channels with similar upstream length should accumulate similar offset amount, which is best explained by channels AT097 to AT101 with the same magnitude of upstream lengths (Figure 6C).

5.2. Headward Erosion Rate along the Altyn Tagh Fault

Headward erosion is one of the basic forces for drainage system development. However, because that headward erosion is the process of removing sediments rather than sedimentation, no material was left for radioactive dating. Furthermore, due to the untraceable migrating track of the head area, low-temperature thermochronology such as zircon/apatite fission track and U-Th/He dating techniques applied in revealing vertical exhumation is also incapable. This study probably provides a new solution to explore the headward erosion rate as presented in the vicinity of the Altyn Tagh Fault in the northern Tibetan Plateau.
According to Equation (4), headward erosion rate could be estimated from the slip rate of the Altyn Tagh Fault and the statistical a-value. Matsuda [11] suggested an empirical h-value of 10 mm/yr for Japan, which was supported by the further investigations [13]. The headward erosion process is determined by the comprehensive effect of lithology, topography, vegetation, climate, tectonism, etc. That is why the a-value varies in the range of 0.025 to 1.47 with a large span (Figure 8a). As stated above, channels with non-bedrock downstream generally present less offset accumulation than the truth due to river capture and abandonment. Thus, we use bedrock channels to estimate the headward erosion rate in this study. Considering that most geological and GPS slip rate distributed in the range of 10 to 15 mm/yr (see tectonic setting section and Table 1) and the average a-value for bedrock channels (0.28 ± 0.15), we estimated the headward erosion rate along the Altyn Tagh Fault to be in this range of 36 to 54 mm/yr with an average value of 45 mm/yr, that is, 45 km/Ma. This result is the first report about the headward erosion rate along the Altyn Tagh Fault. Craddock et al. [53] reported the headward erosion rate is ~350 km/Ma along the Haiyuan Fault, east of the Altyn Tagh Fault (Figure 1A), which is nearly 8 times larger than the Altyn Tagh Fault. It might be difficult to determine which factor make such differences of incision rate between Altyn Tagh Fault and Haiyuan Fault due to the complexity of incision rate influenced by multi-factors as mentioned above. The headward incision rate of 45 km/Ma presented here is an average estimation along the Altyn Tagh Fault (probably vary at different segments), which provides important climatic or tectonic information in the vicinity of the Altyn Tagh Fault. More future work is required to test its reliability and potential significance for studying of active tectonics and tectonic geomorphology.

5.3. Implications for the Tectonic Deformation of the Tibetan Plateau

How the Tibetan Plateau was constructed and uplifted in response to the ongoing India–Asia convergence since ~50 Ma is fundamental in understanding the geodynamic process of continental tectonics, especially for study focusing on the tectonic characteristics of plateau marginal deformation throughout the late Cenozoic during the plateau outward expansion [27]. Two representative end-member modes related to the geodynamics of the Tibetan Plateau have been proposed in the past three decades. Some scientists deemed that the plateau material was extruded along the major strike-slip faults eastward or southeastward to the open space as much as hundreds to thousands of kilometers, stressing the strong local deformation along these first-order strike-slip faults just as the Altyn Tagh Fault [18], while other researchers argued that the strain of the plateau was absorbed by more broadly distributed and diffused deformation dominated by crustal shortening and thickening [57]. One of the causes that leads to the disagreement is the lack of quantitative evaluations of strain absorbed by tectonic extrusion and shortening, respectively.
This study probably provides a new insight to assess the magnitude of strike-slip displacement. As shown in this study, in the northern border of the Tibetan Plateau, the maximum observed cumulative offset recorded by the stream channels along the Altyn Tagh Fault is ~72 km as indicated by river AT035 (Figure 1B). This result is comparable with the 80–100 km displacement in the order of magnitude since late Tertiary inferred from the reconstruction of outlet channels and Neogene sediments along two sides of the fault [26]. According to the regional geology, sedimentary analyses and magnetostratigraphic ages [26,37,43], the 72-km-long displacement was suggested to accumulate at least 5–10 Ma ago, suggesting an average slip rate of the Altyn Tagh Fault of 7.2–14.4 mm/yr. The result corroborates well with the general consensus of long-term geologic slip rate of 9–15 mm/yr along the Altyn Tagh Fault (Table 1). Here, we have to say that the total cumulative displacement along the Altyn Tagh Fault since its initiation of left-lateral strike-slip faulting should be larger than 72 km due to the river capture and abandonment. Walker and Allen [54] reported that the maximum observed offset recorded by rivers (~3.5 km) is also smaller than the total fault displacement of at least ~5 km along the Kuh Banan fault in Iran, and they attributed this reducing to stream capture. With the assumption that the long-term geologic rate is relatively stable, the total cumulative displacement along the Altyn Tagh Fault lies in the range of 360–720 km since ~50 Ma.
The maximum offsets of other large-scale strike-slip faults within and surrounding the Tibetan Plateau were also reported by recent publications. For example, for the Haiyuan Fault (see Figure 1A for location), the maximum horizontal displacement was suggested to be ~14 km based on the reversion of geologic and topographic units [58,59]. To the south, the cumulative displacement of the West Qinling Fault in the northeastern Tibetan Plateau (see Figure 1A for location) was constrained to be ~18 km by restoring the deflected Yellow River and basement rocks along two sides of this fault [60]. In the southeastern Tibetan Plateau, the maximum displacement of the Ganzi-Yushu-Xianshuihe Fault (see Figure 1A for location) was revealed to be ~60 km by rebuilding the deflected Yangtze drainage systems, basement rocks, topography and geophysical data [4]. Although the total displacement of the Altyn Tagh Fault still remains unclear, the evidence presented in this study documents that the offset amount cumulated since late Cenozoic (5–10 Ma) should be a few tens of kilometers. These cumulative offsets presented above demonstrate that the magnitude of tectonic extrusion to the east along these first-order strike-slip faults in the Tibetan Plateau might be limited since the collision of India-Asia plates.

6. Conclusions

Based on the interpretations and analyses of high-resolution remote sensing images and the measurement of systematically offset drainage systems along the Altyn Tagh Fault, the following conclusions can be drawn.
(1)
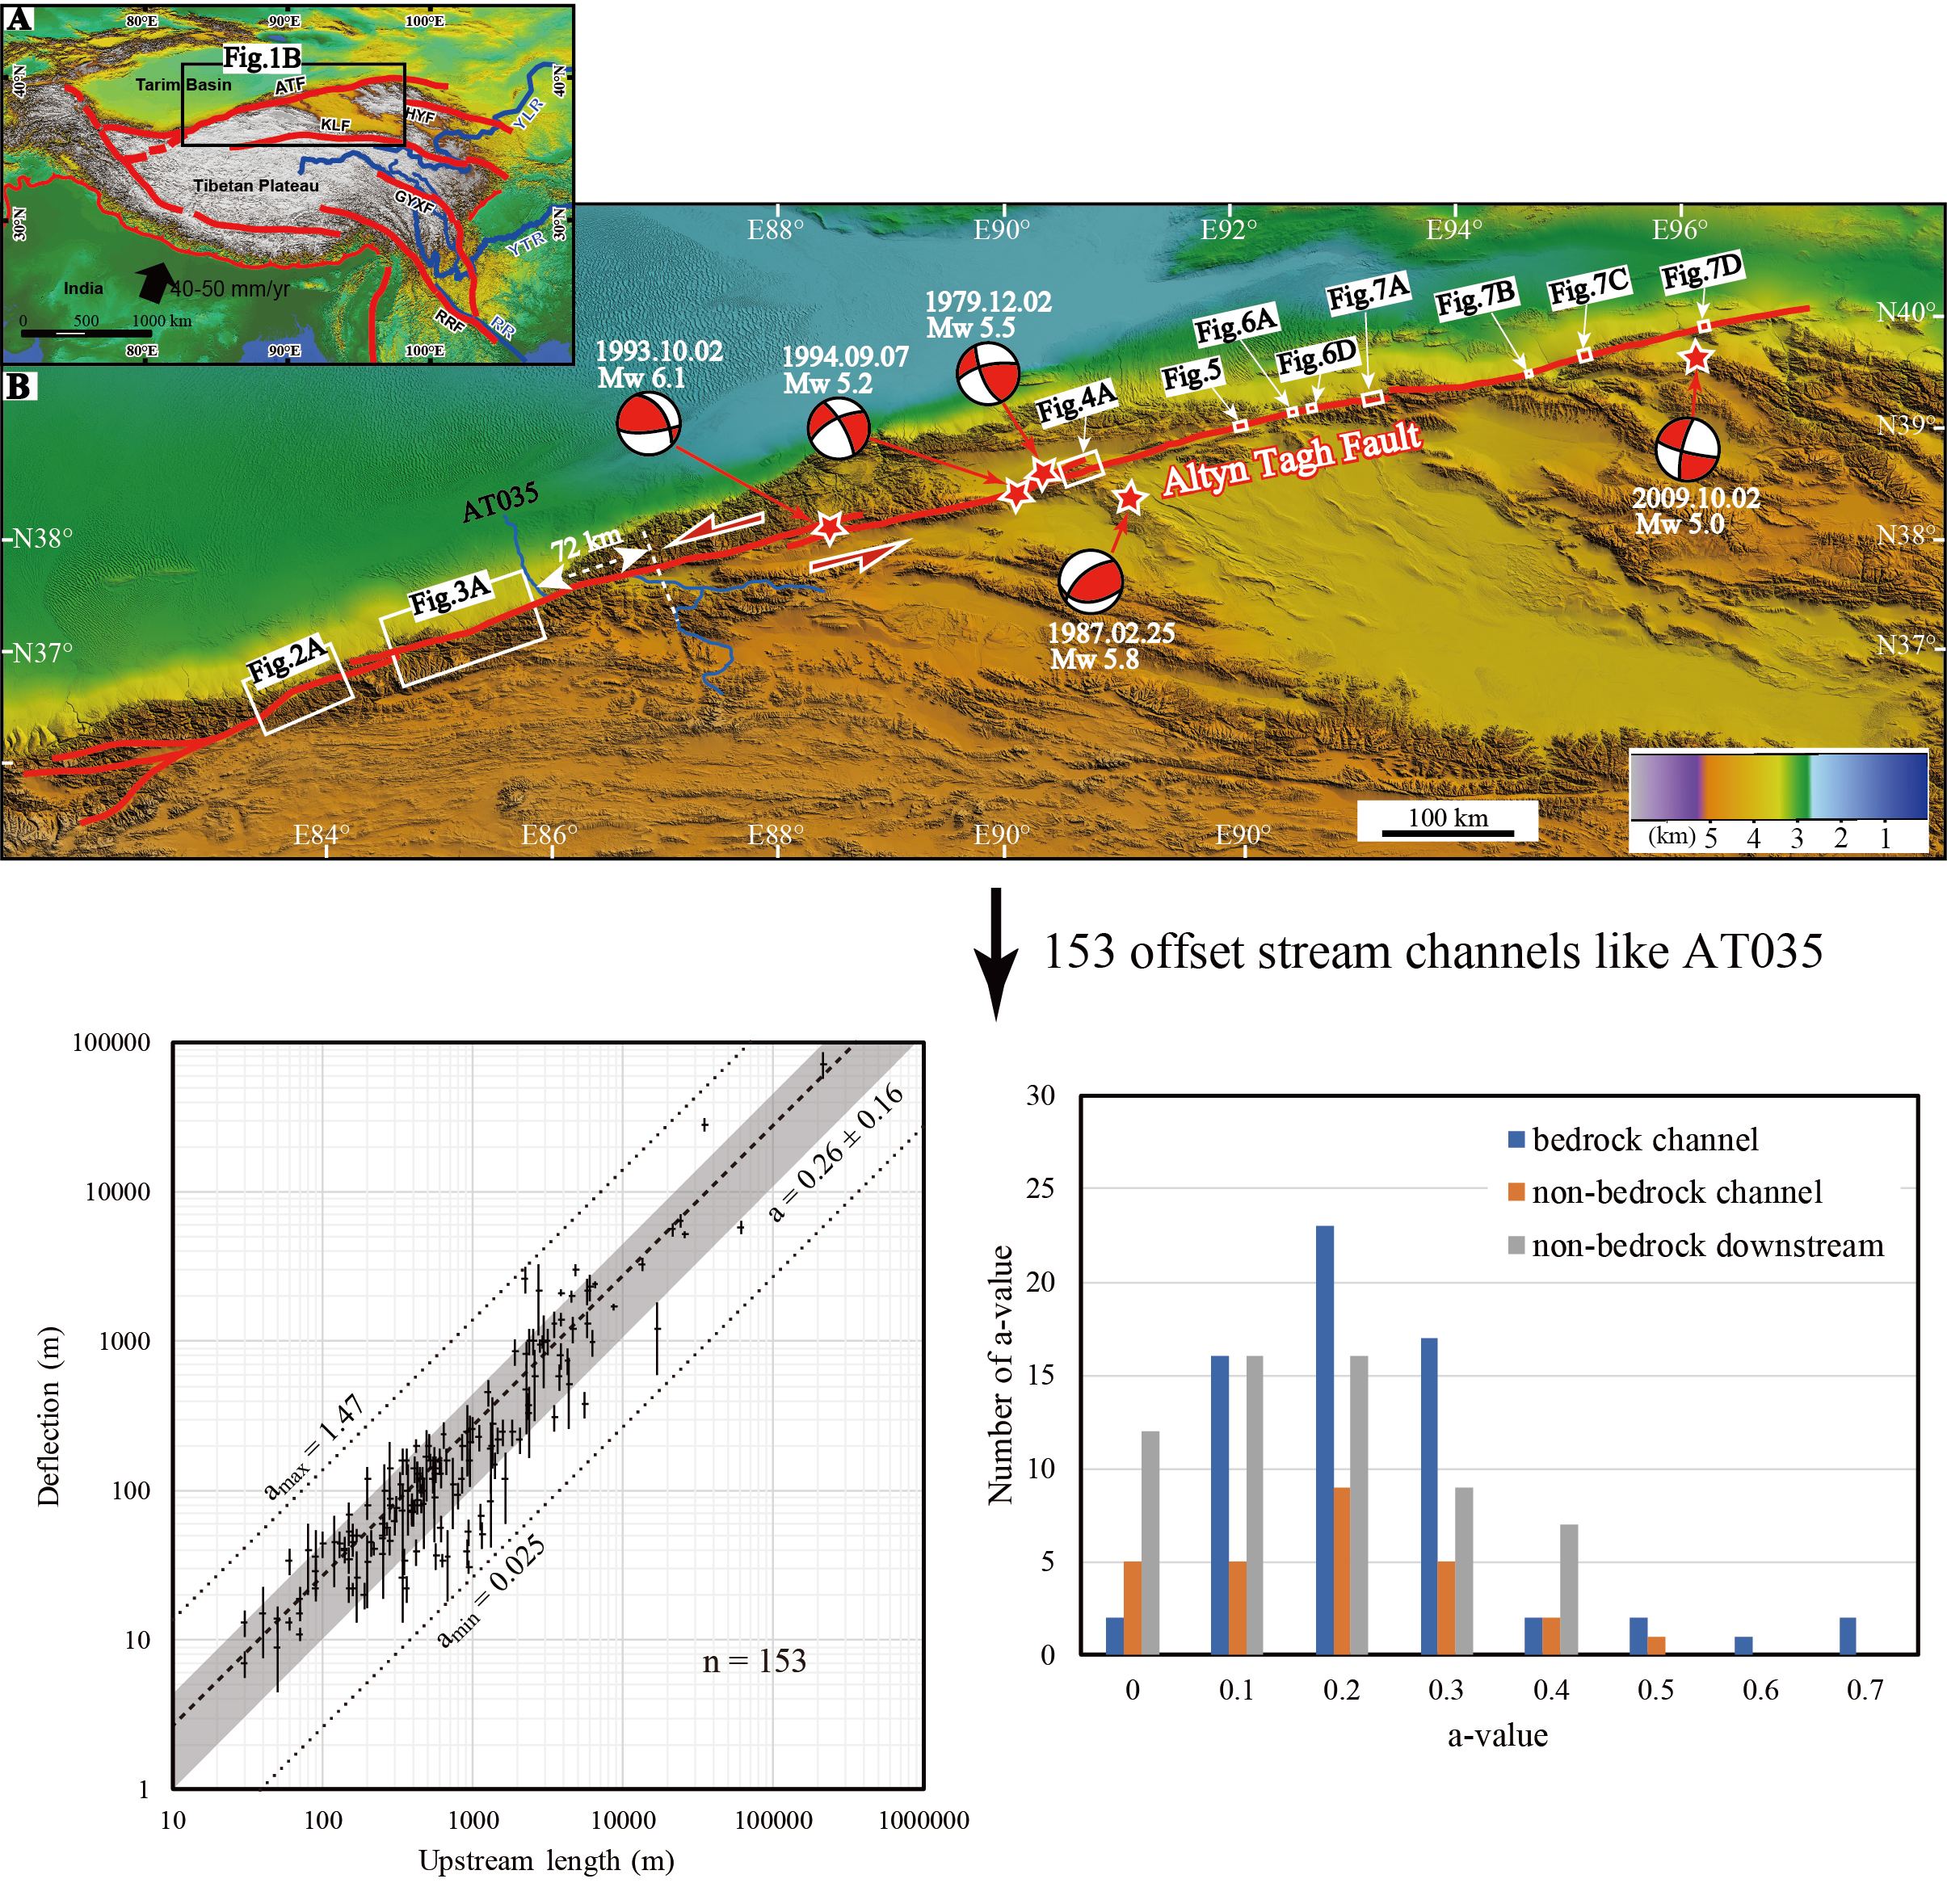
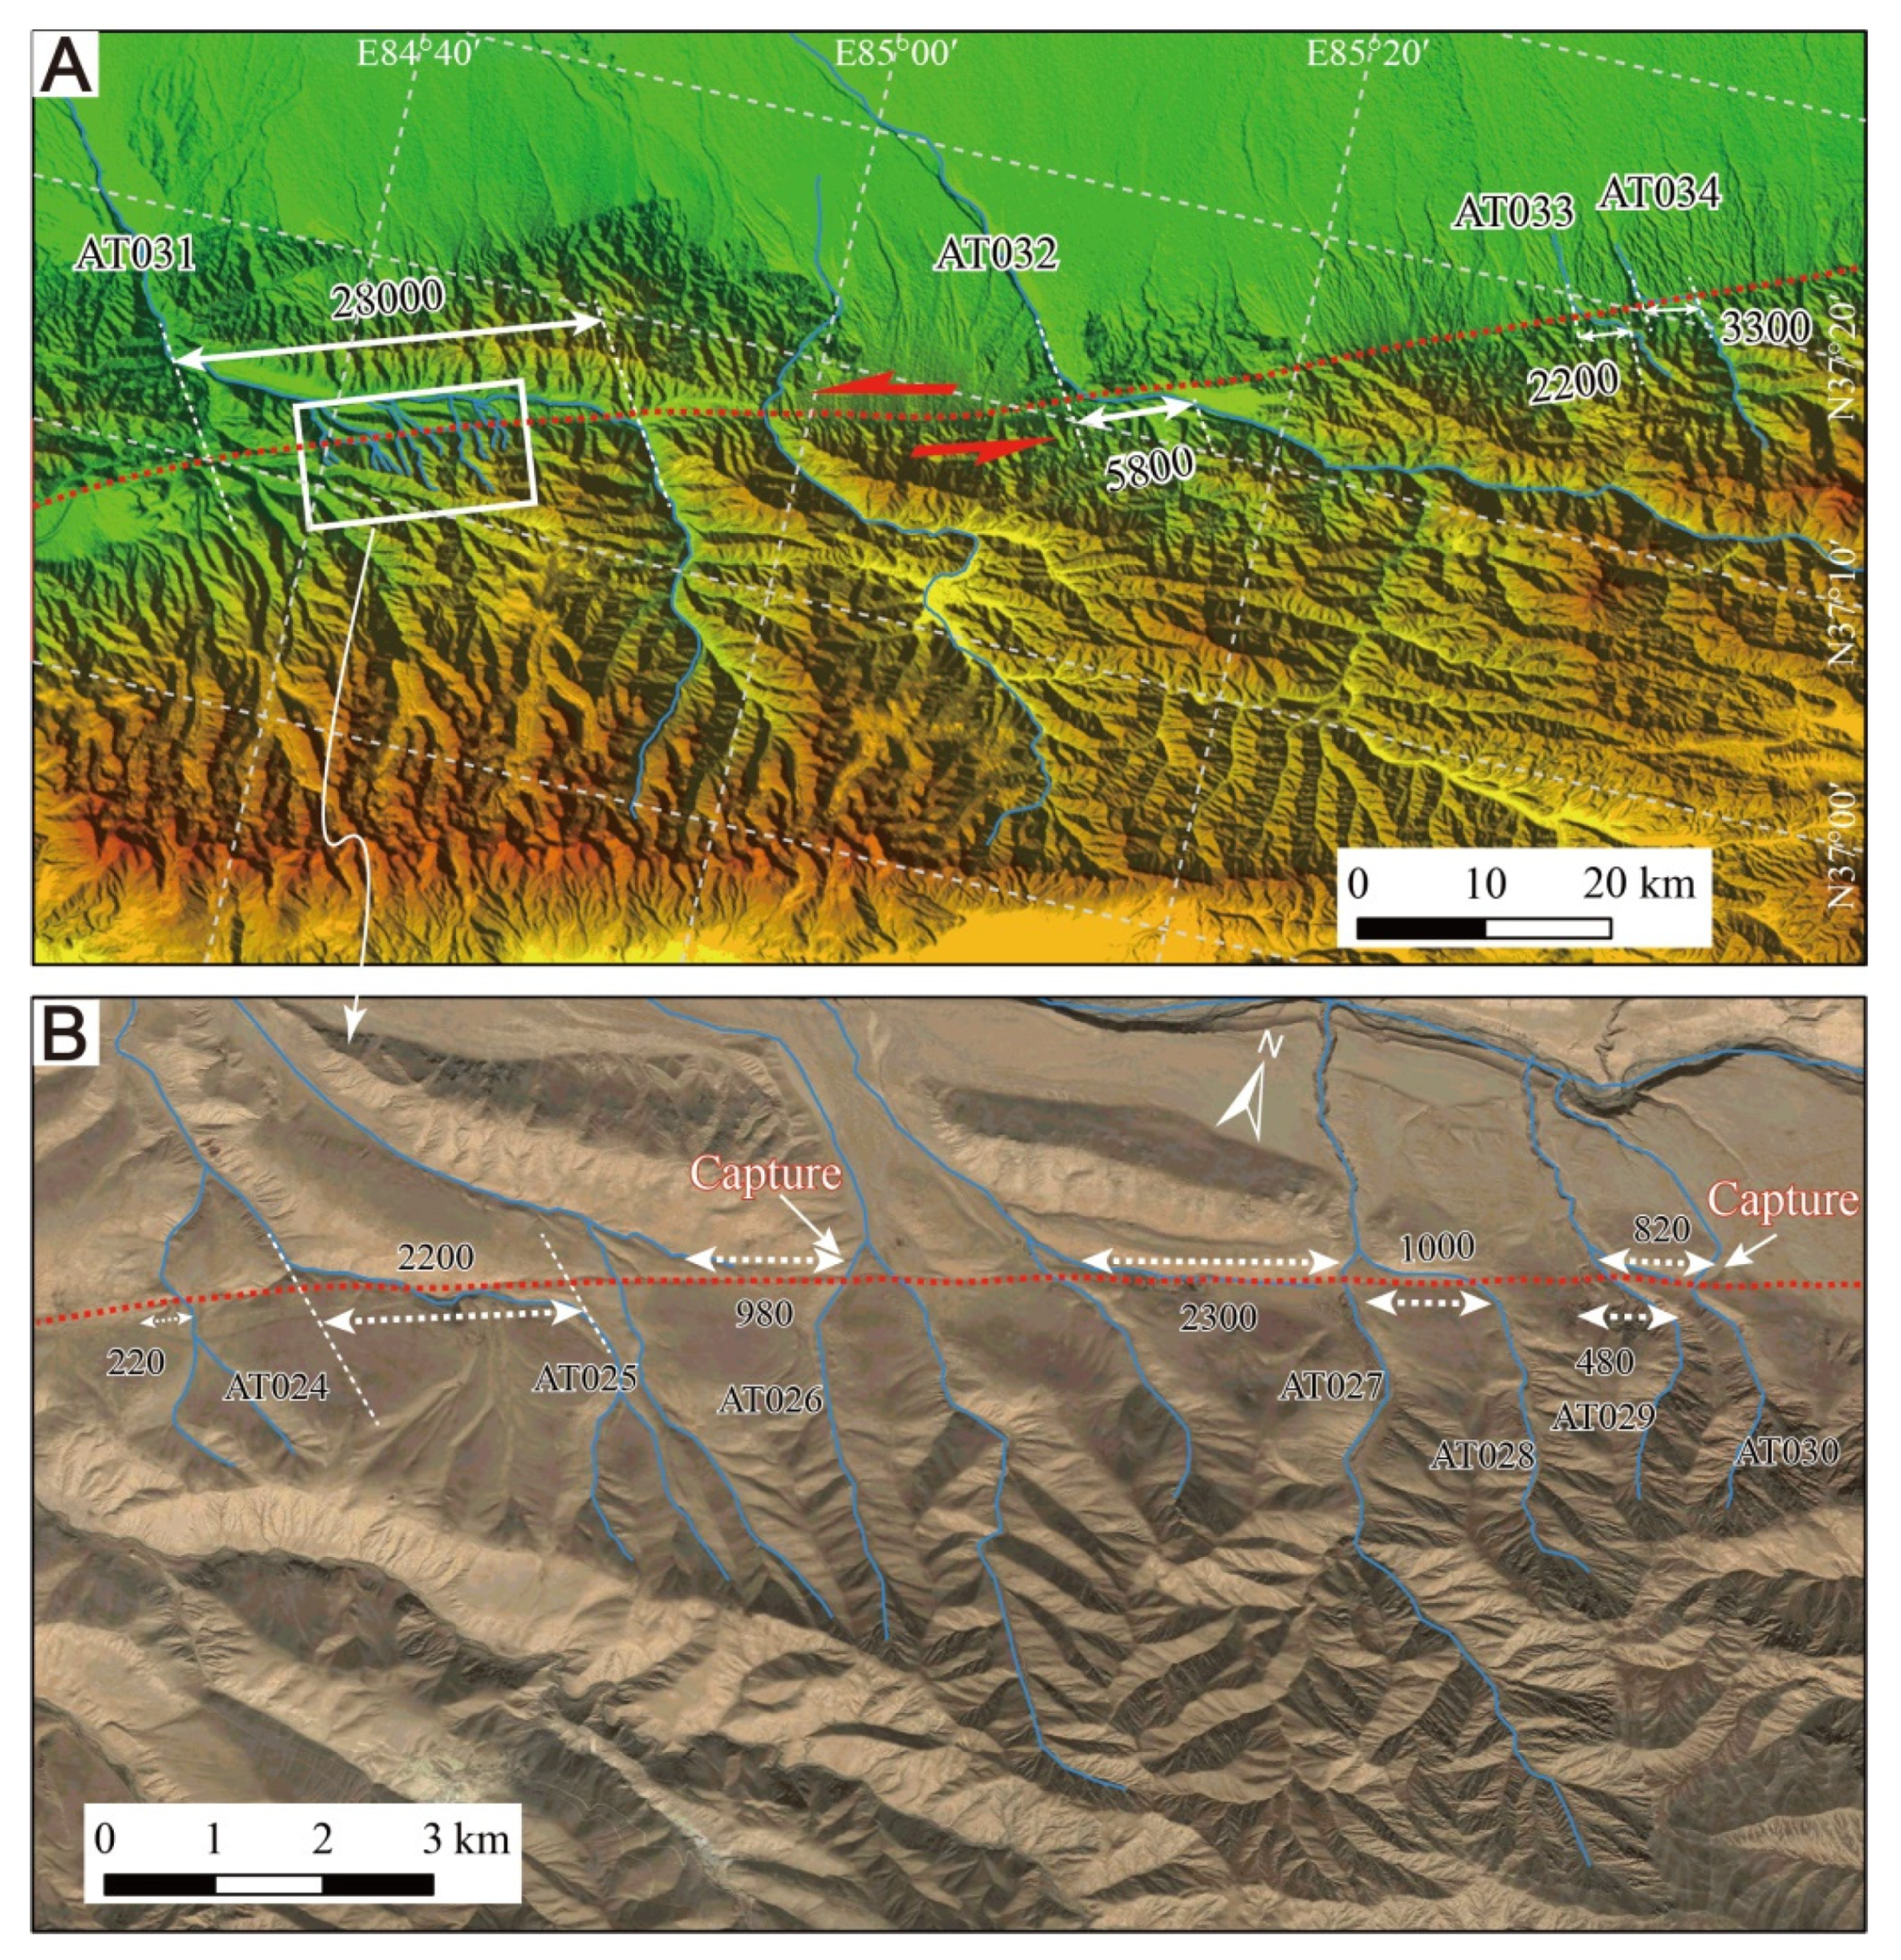
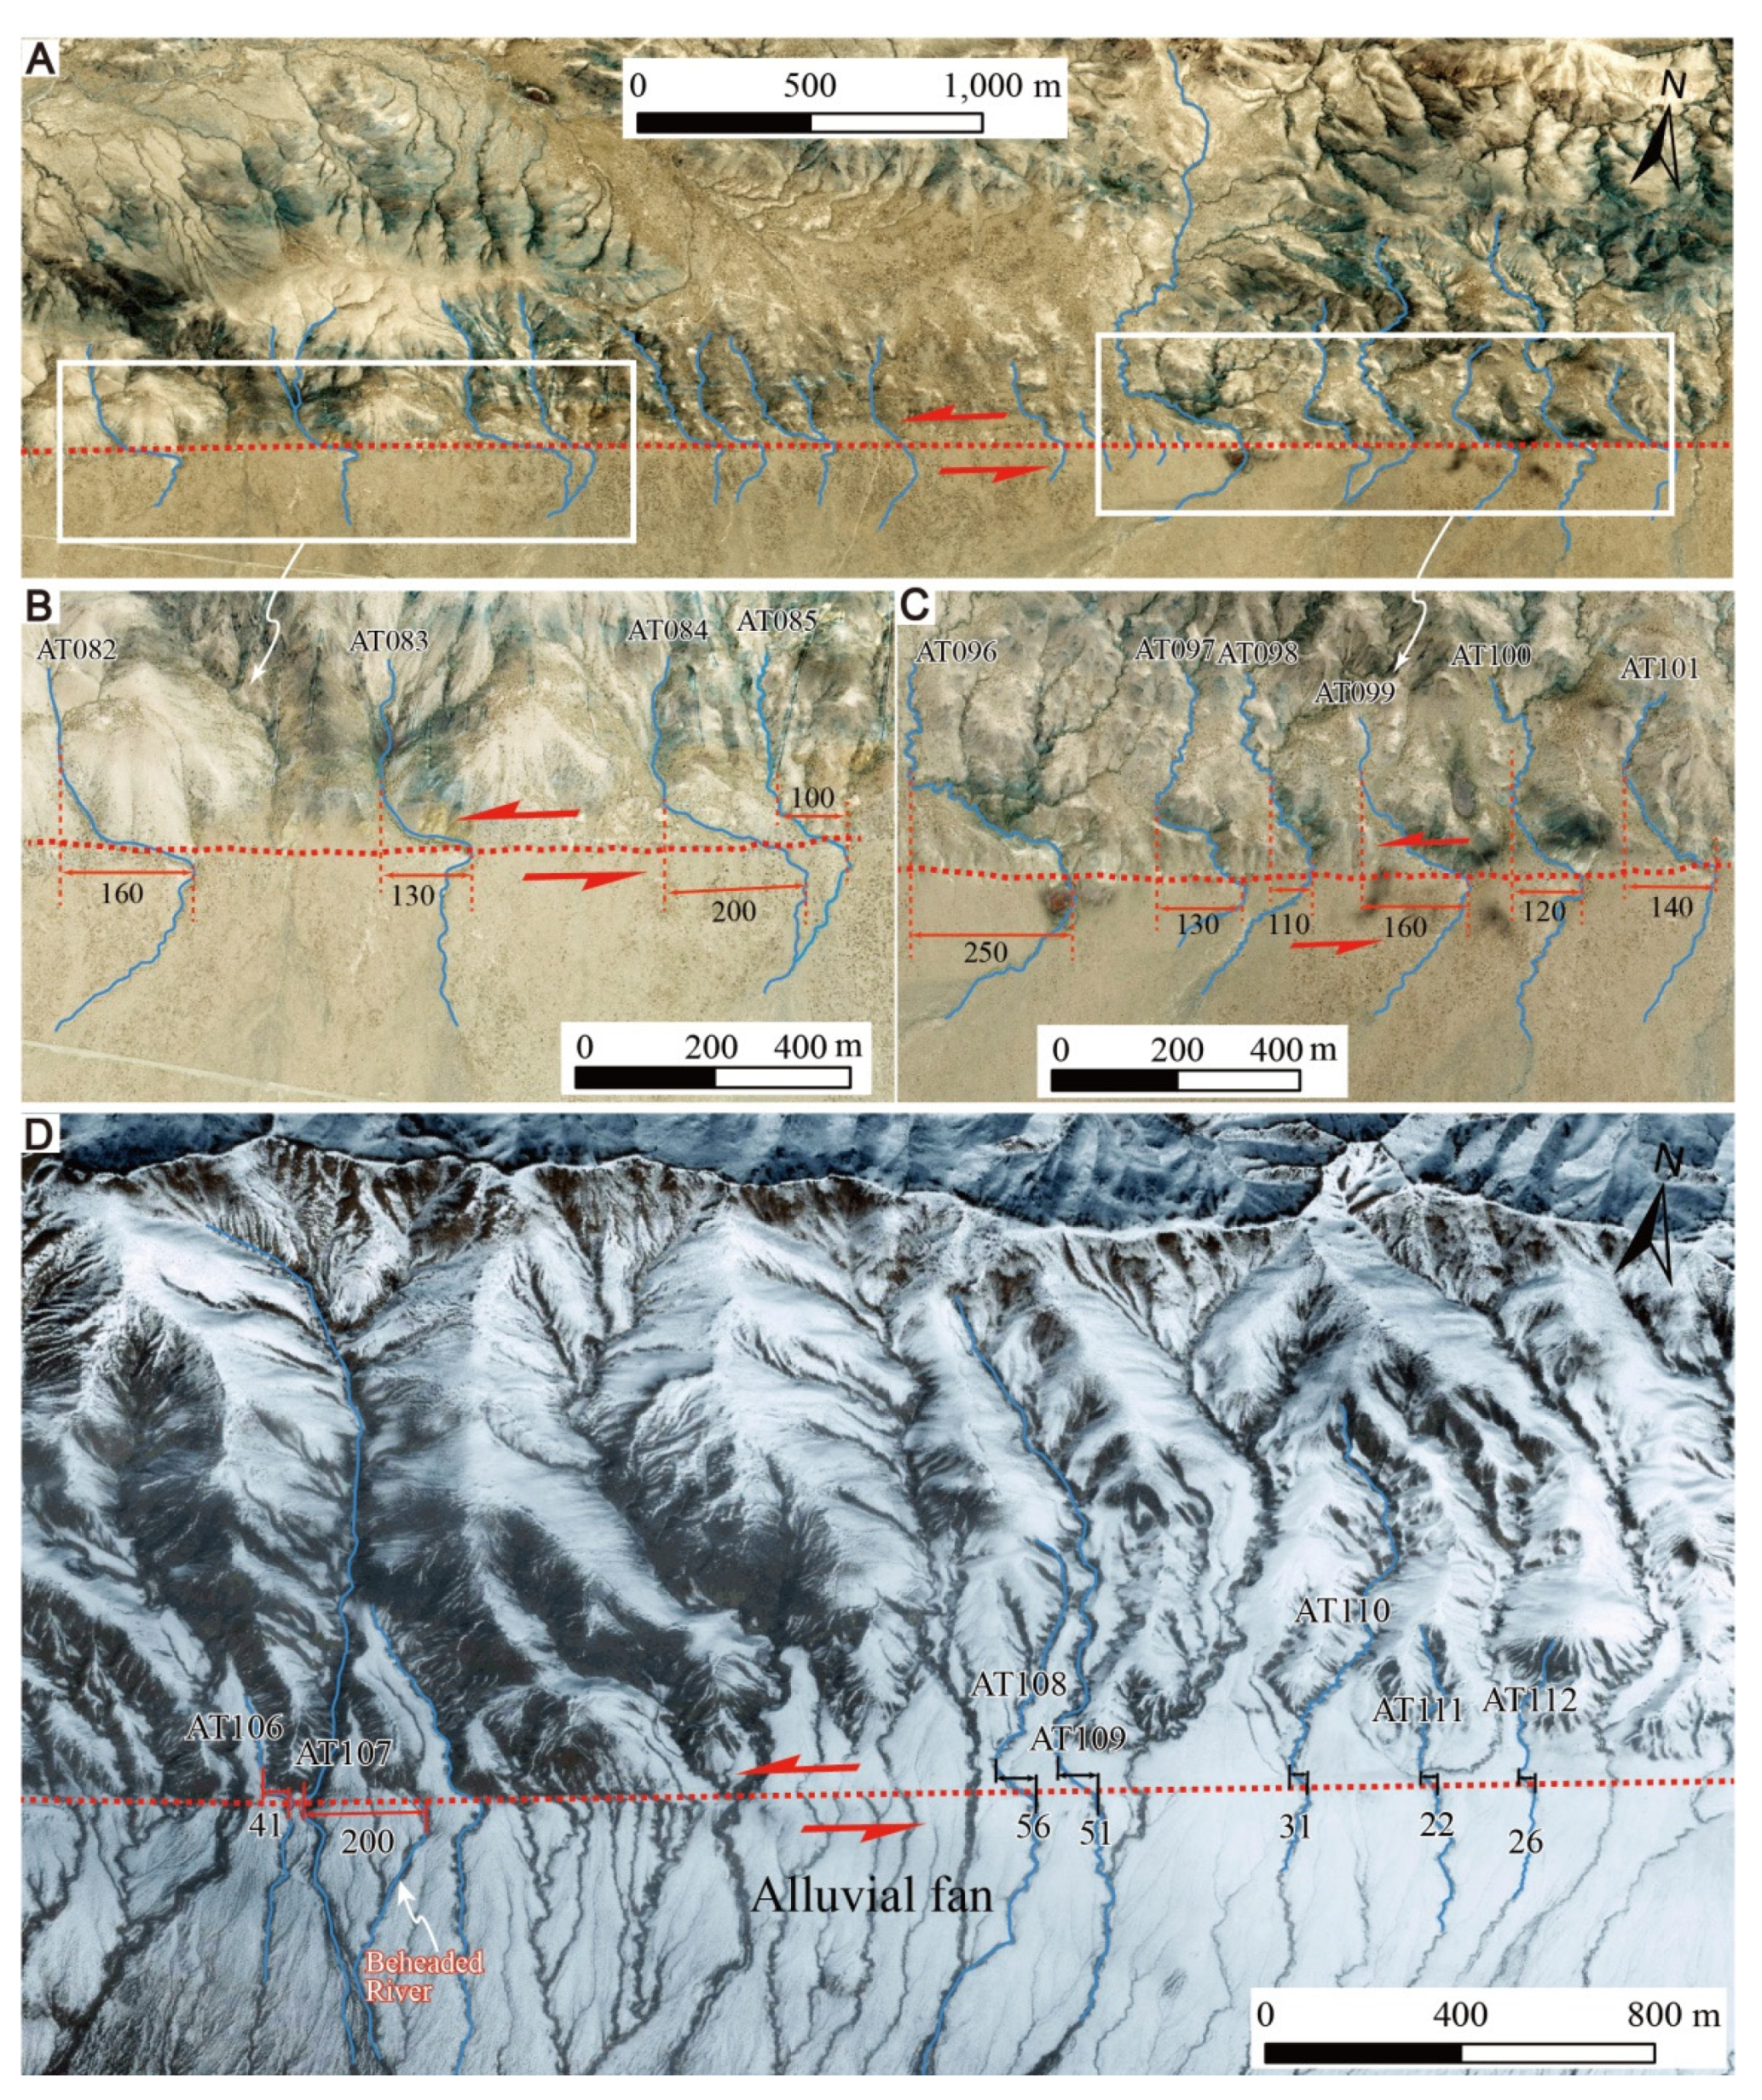
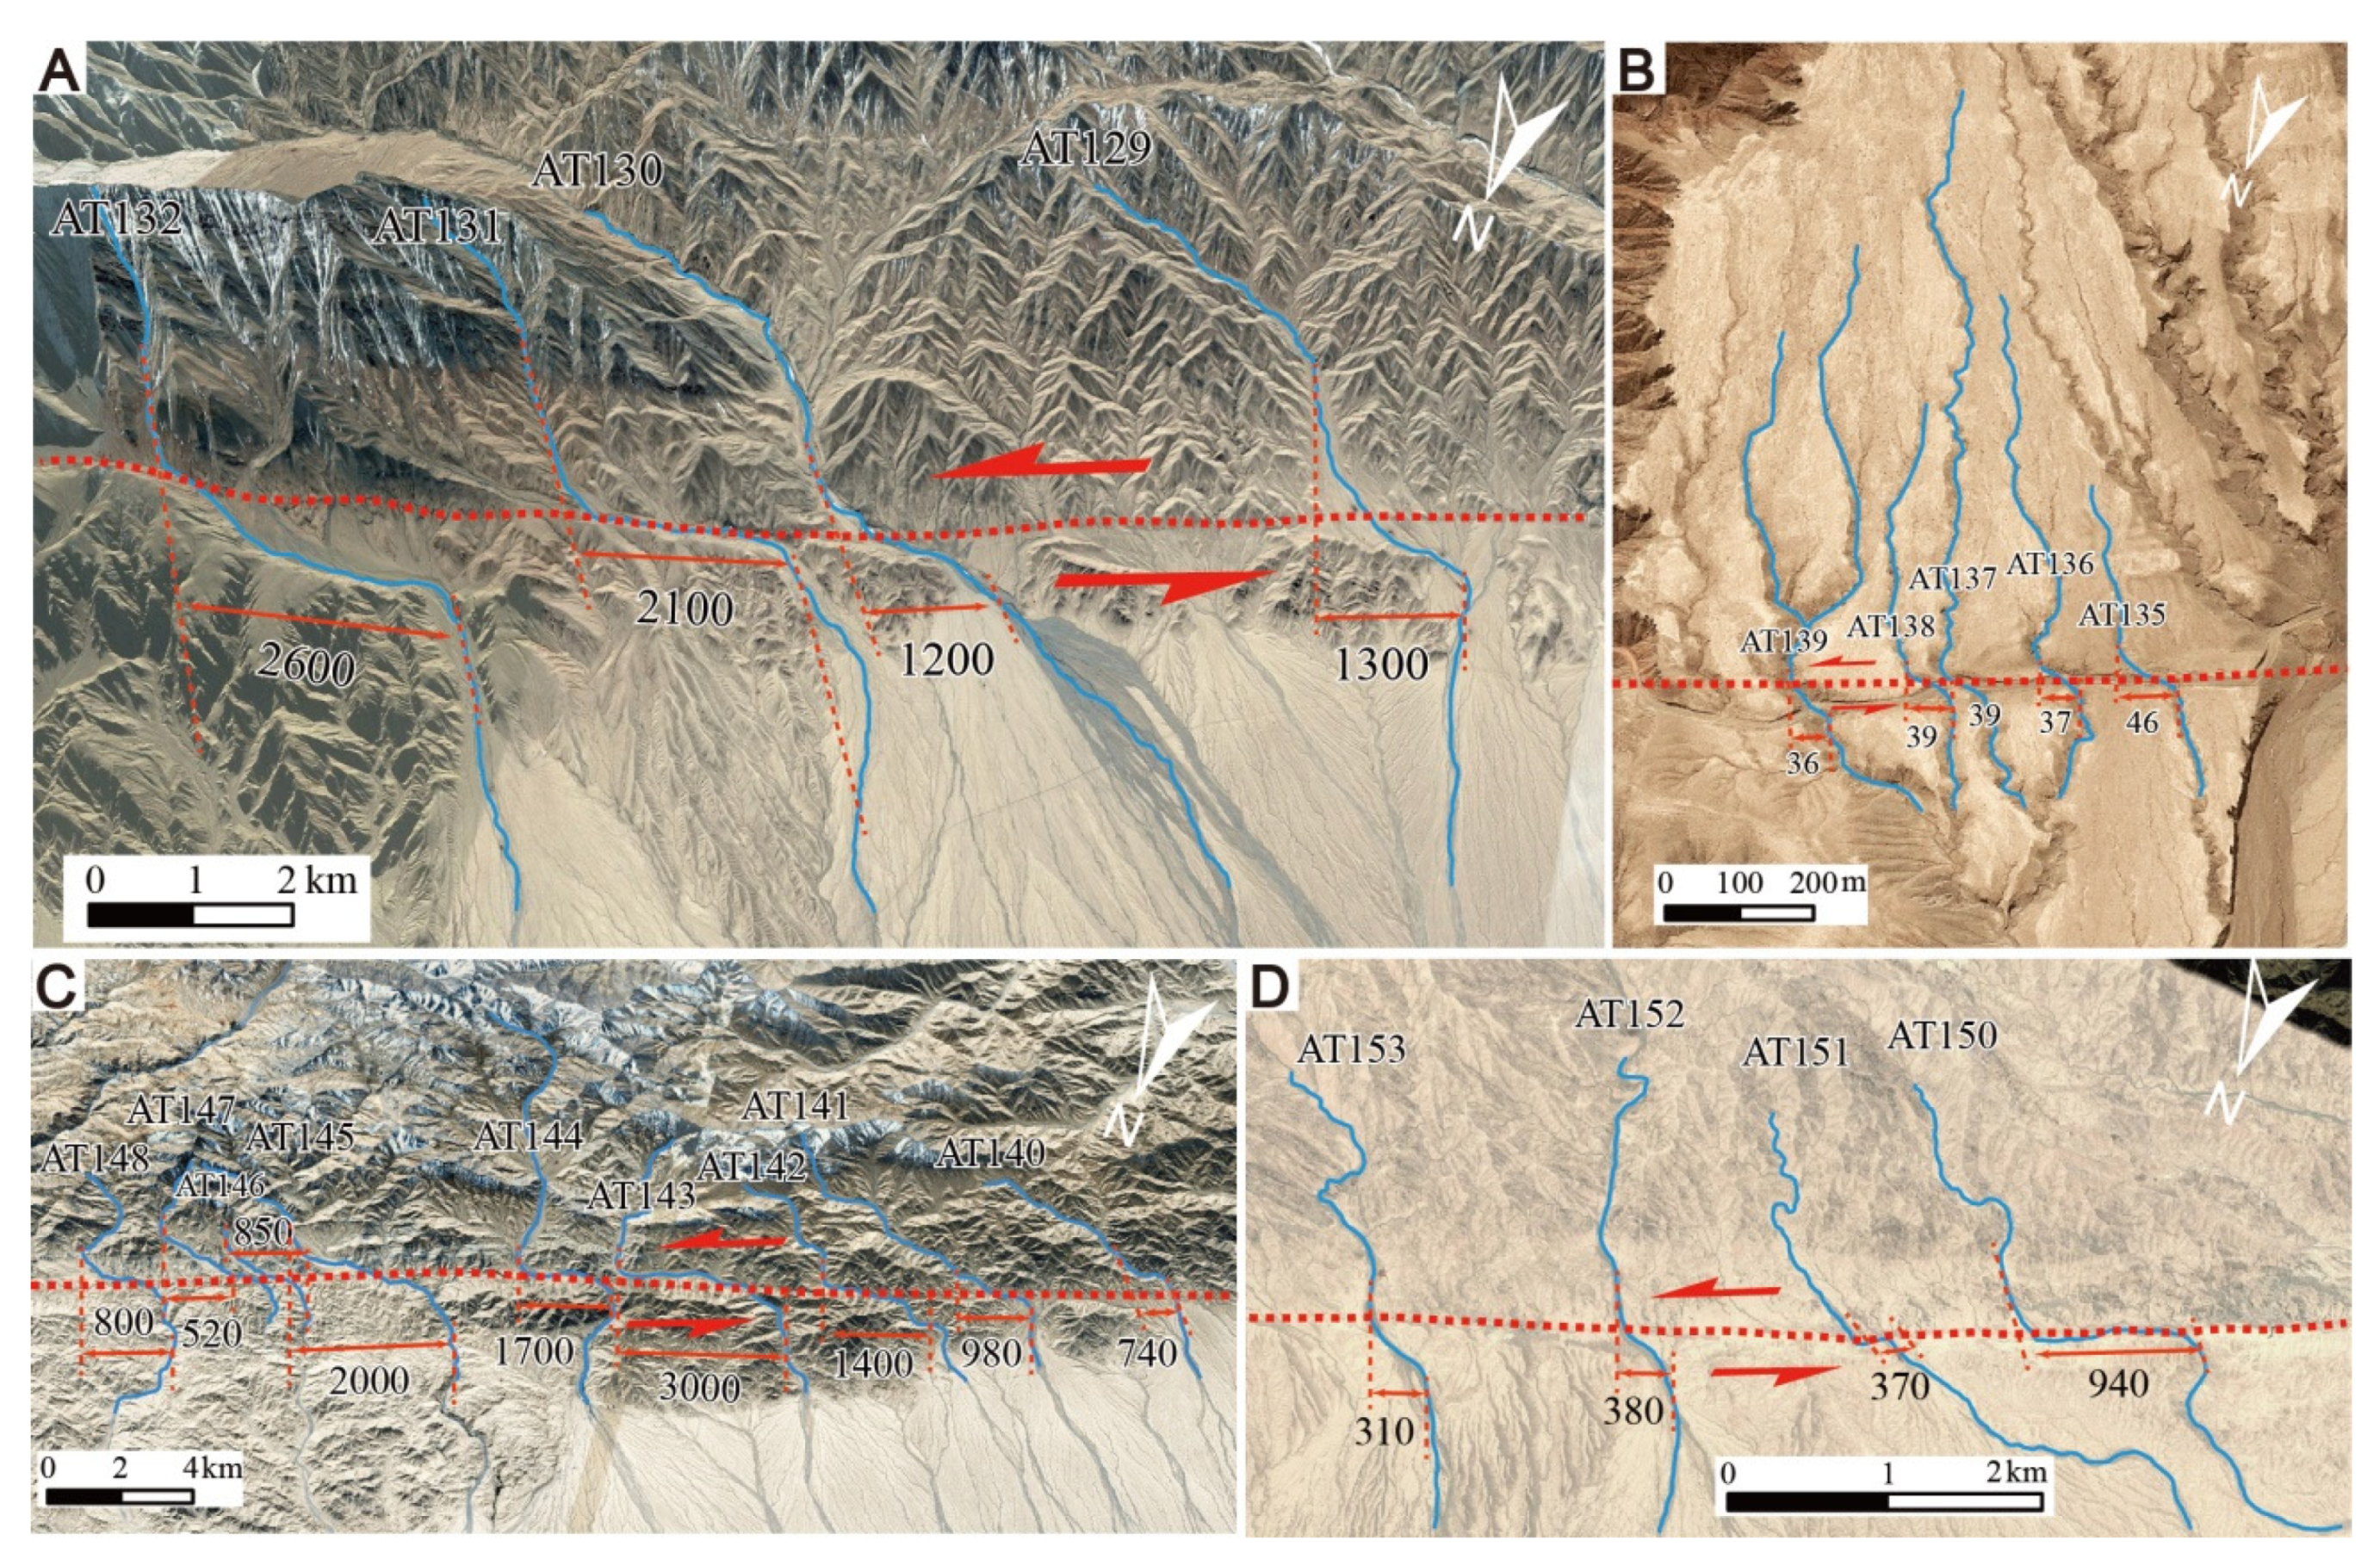
The stream channels have been systematically deflected and/or offset in a sinistral sense along the active Altyn Tagh Fault in the northern Tibetan Plateau.
(2)
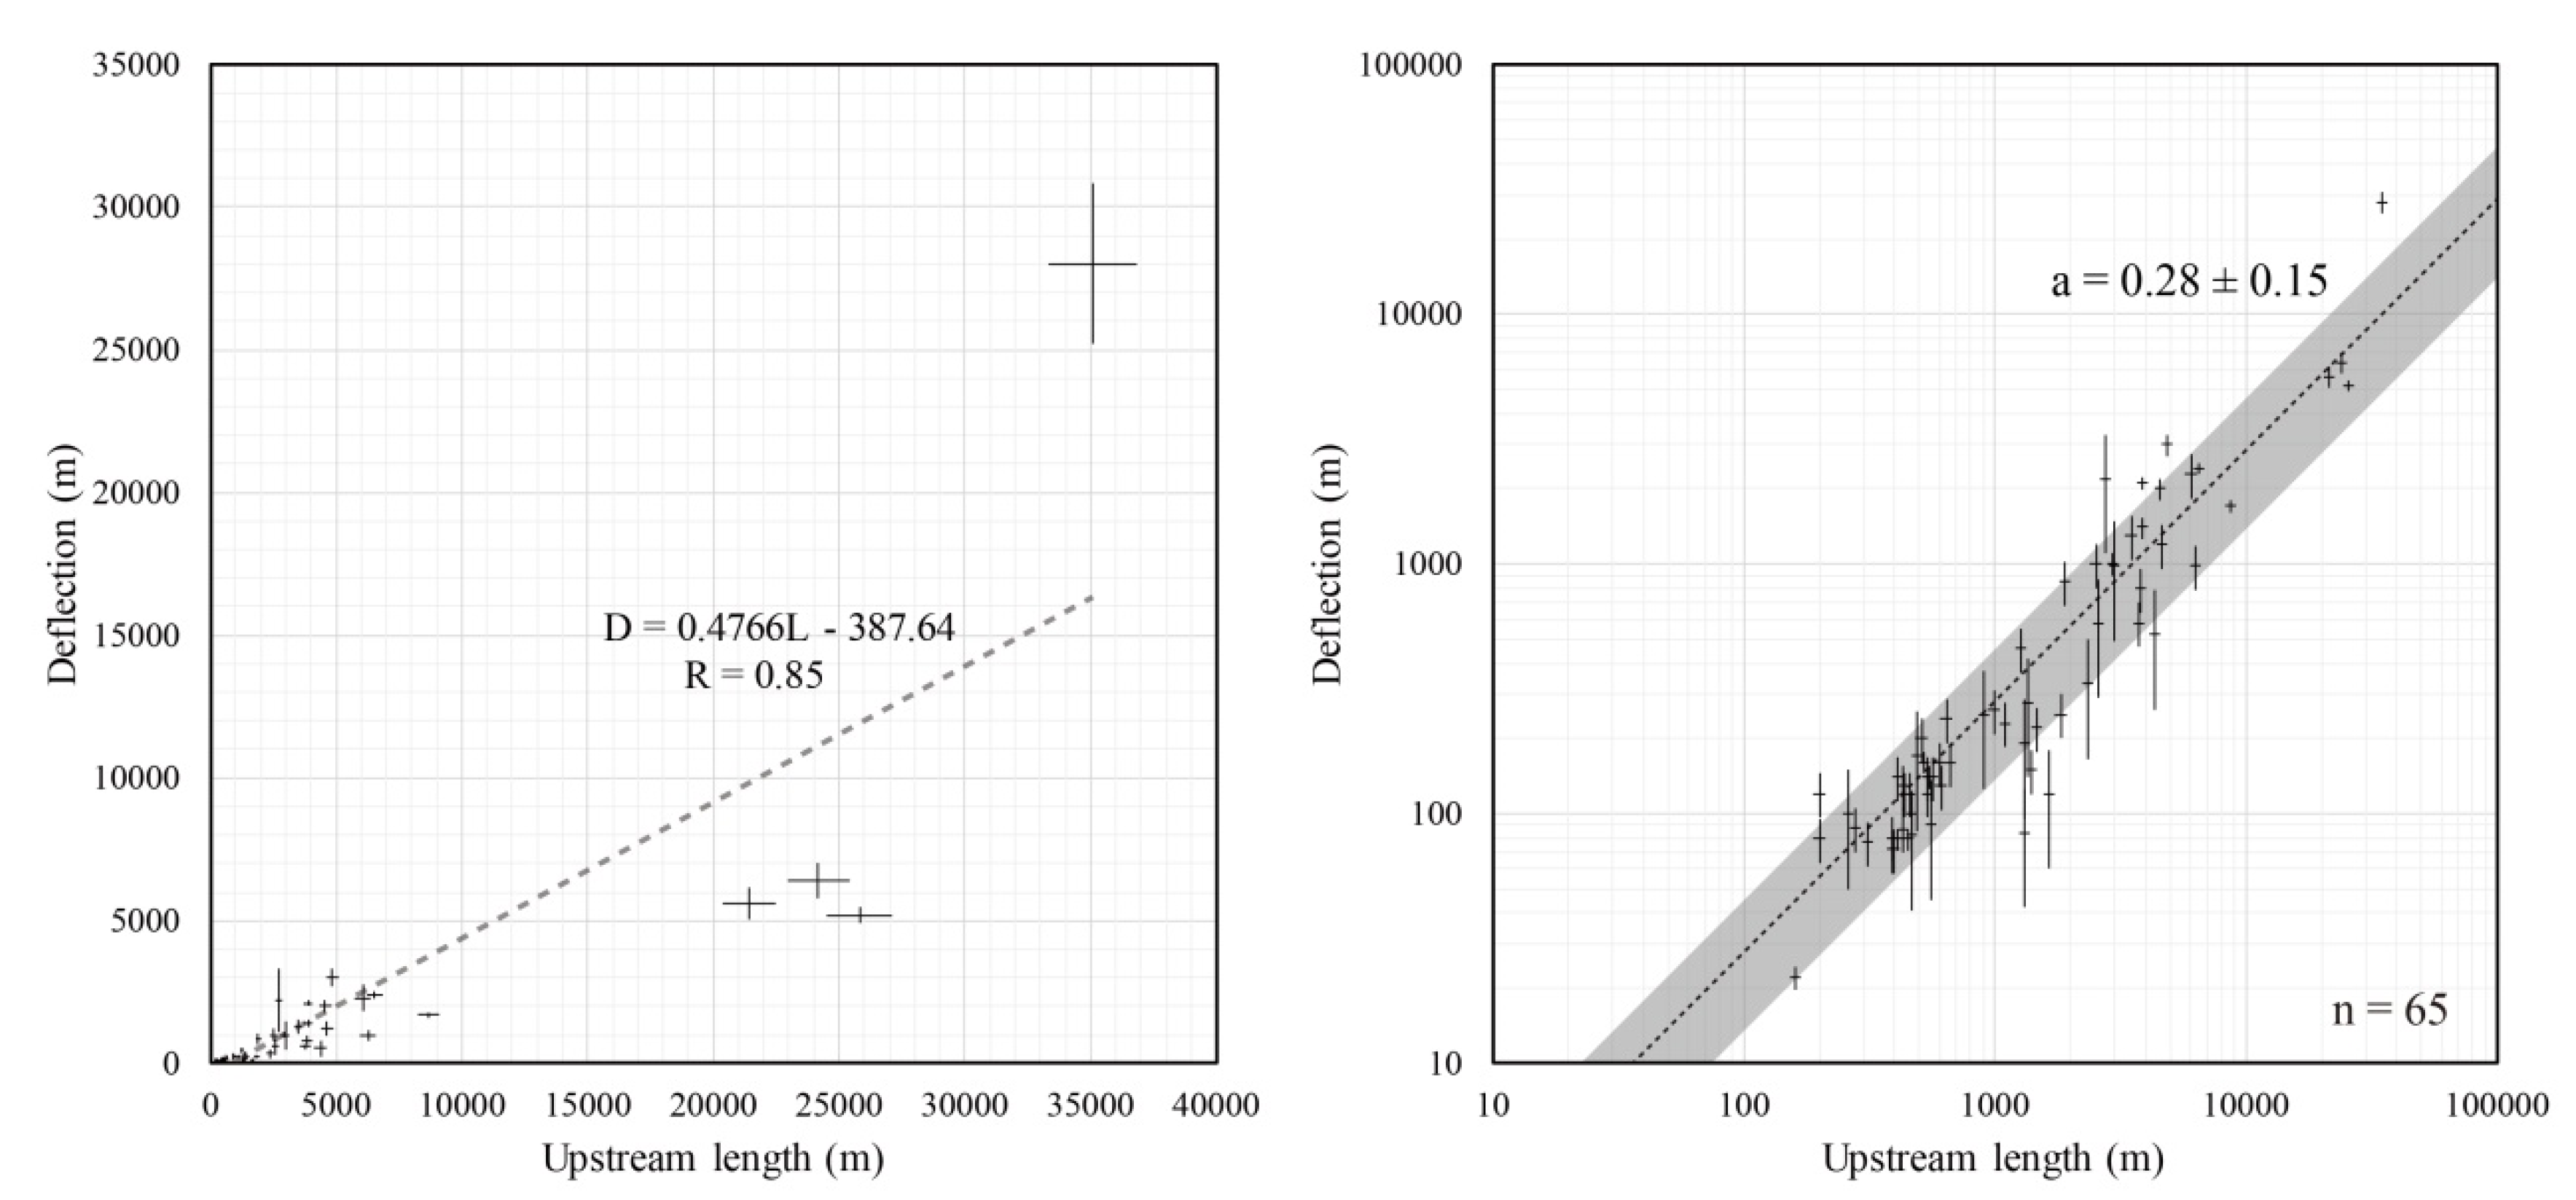
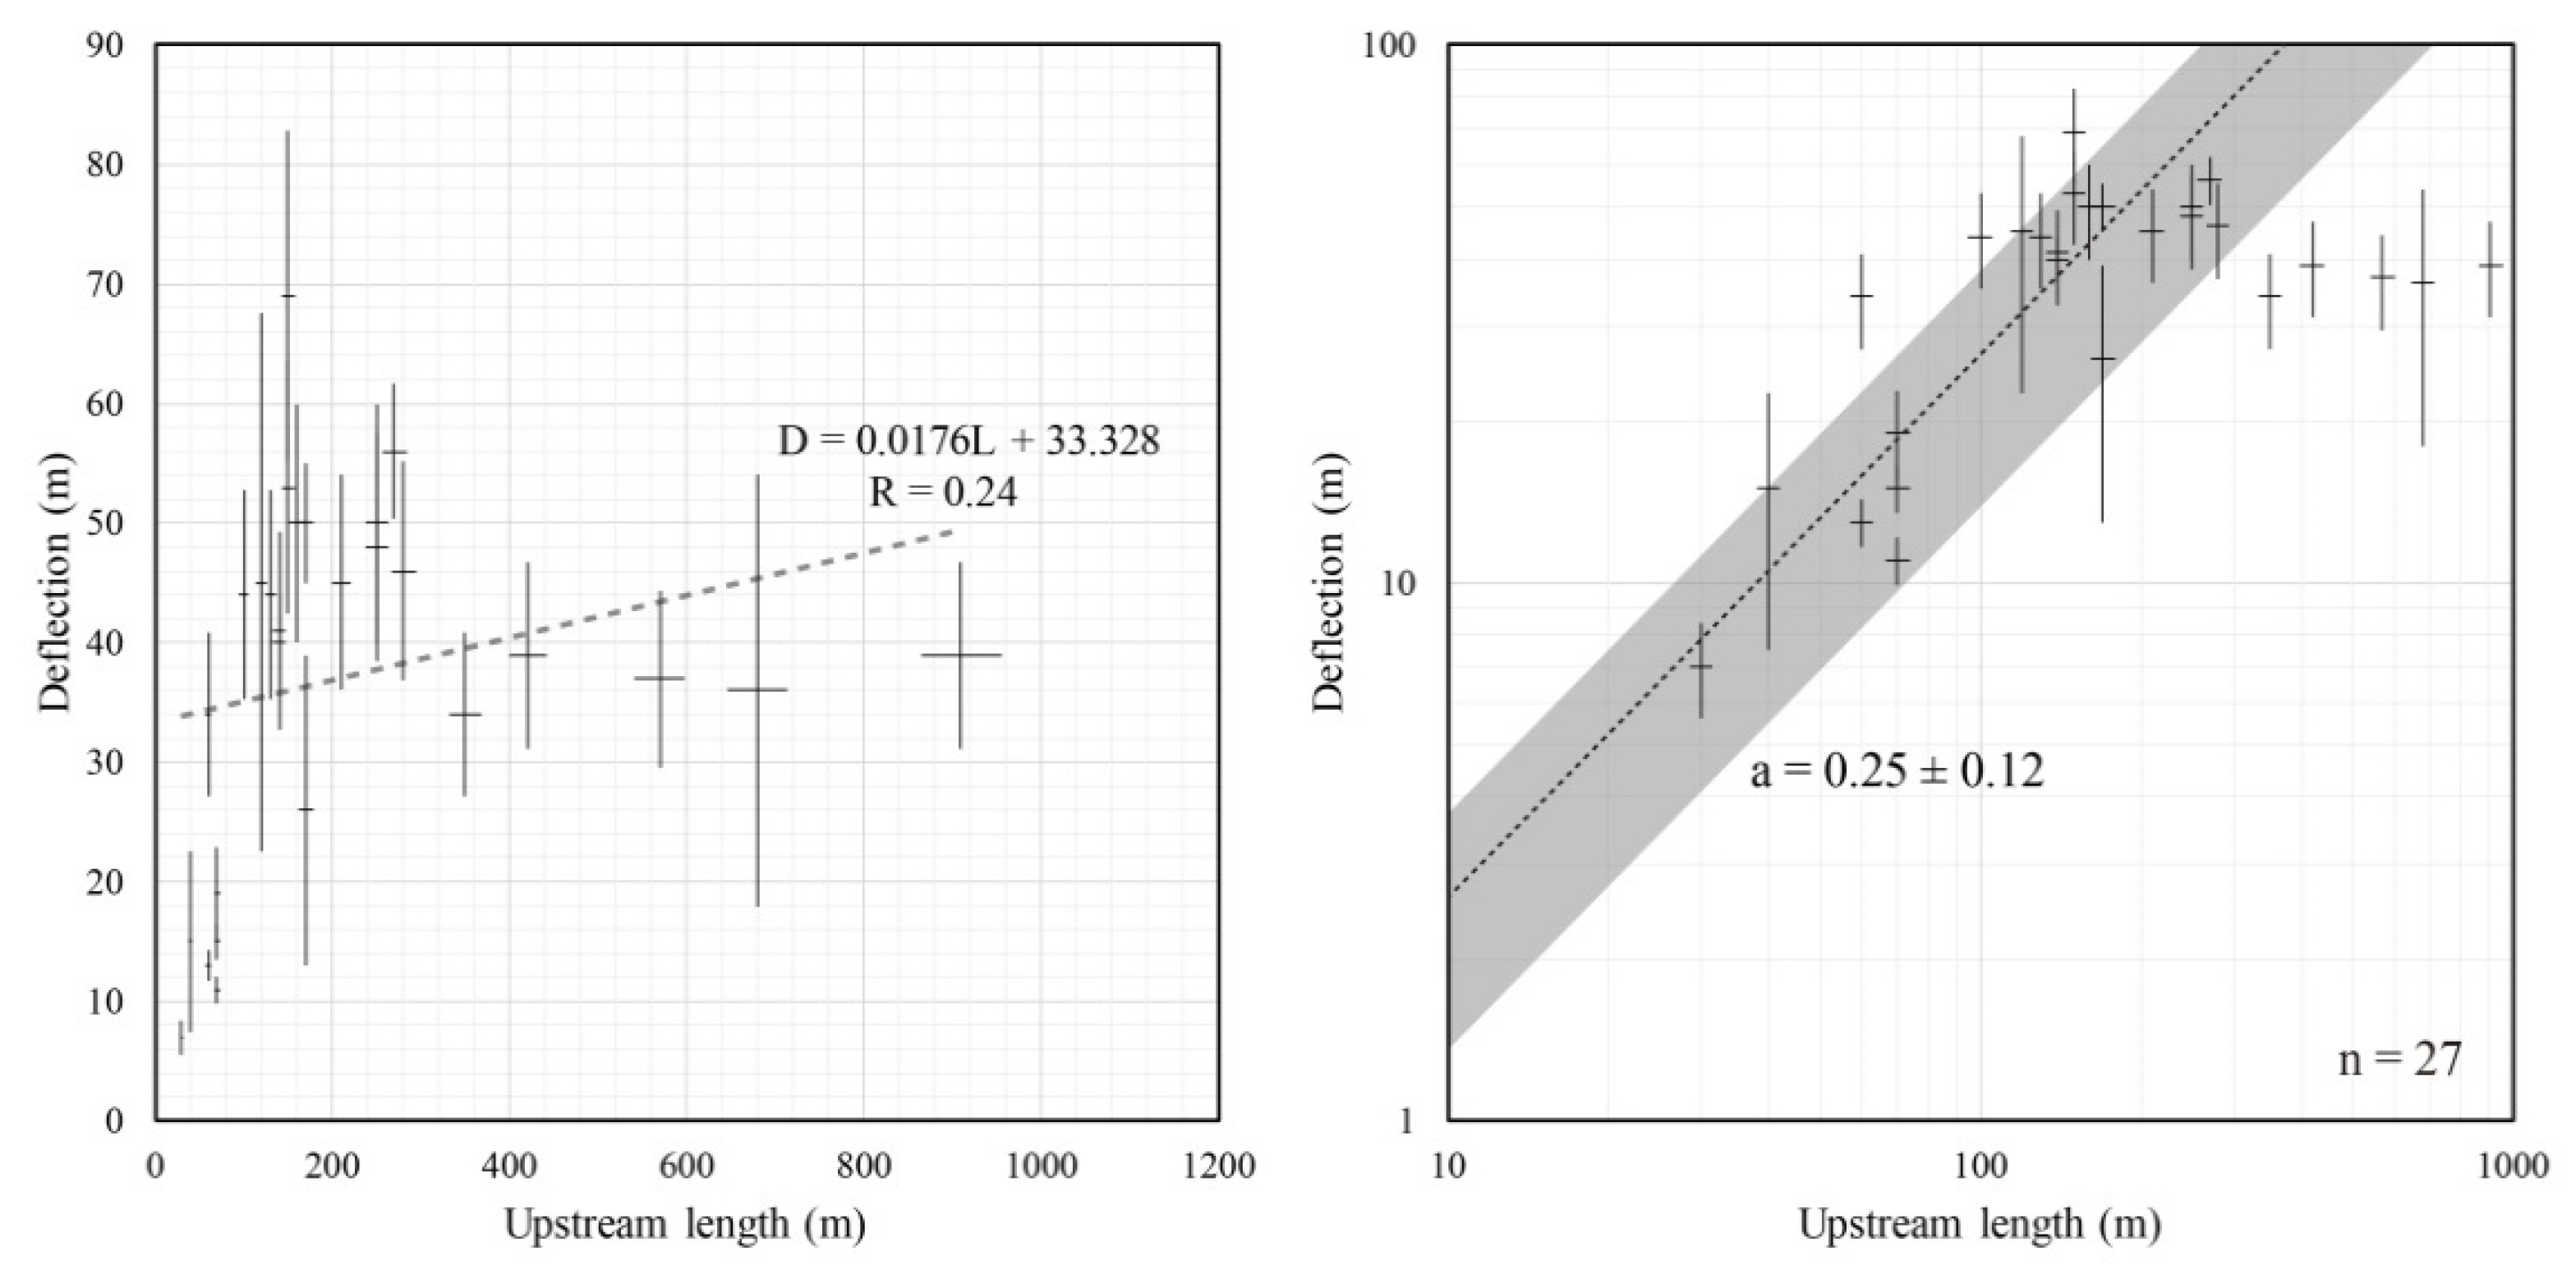
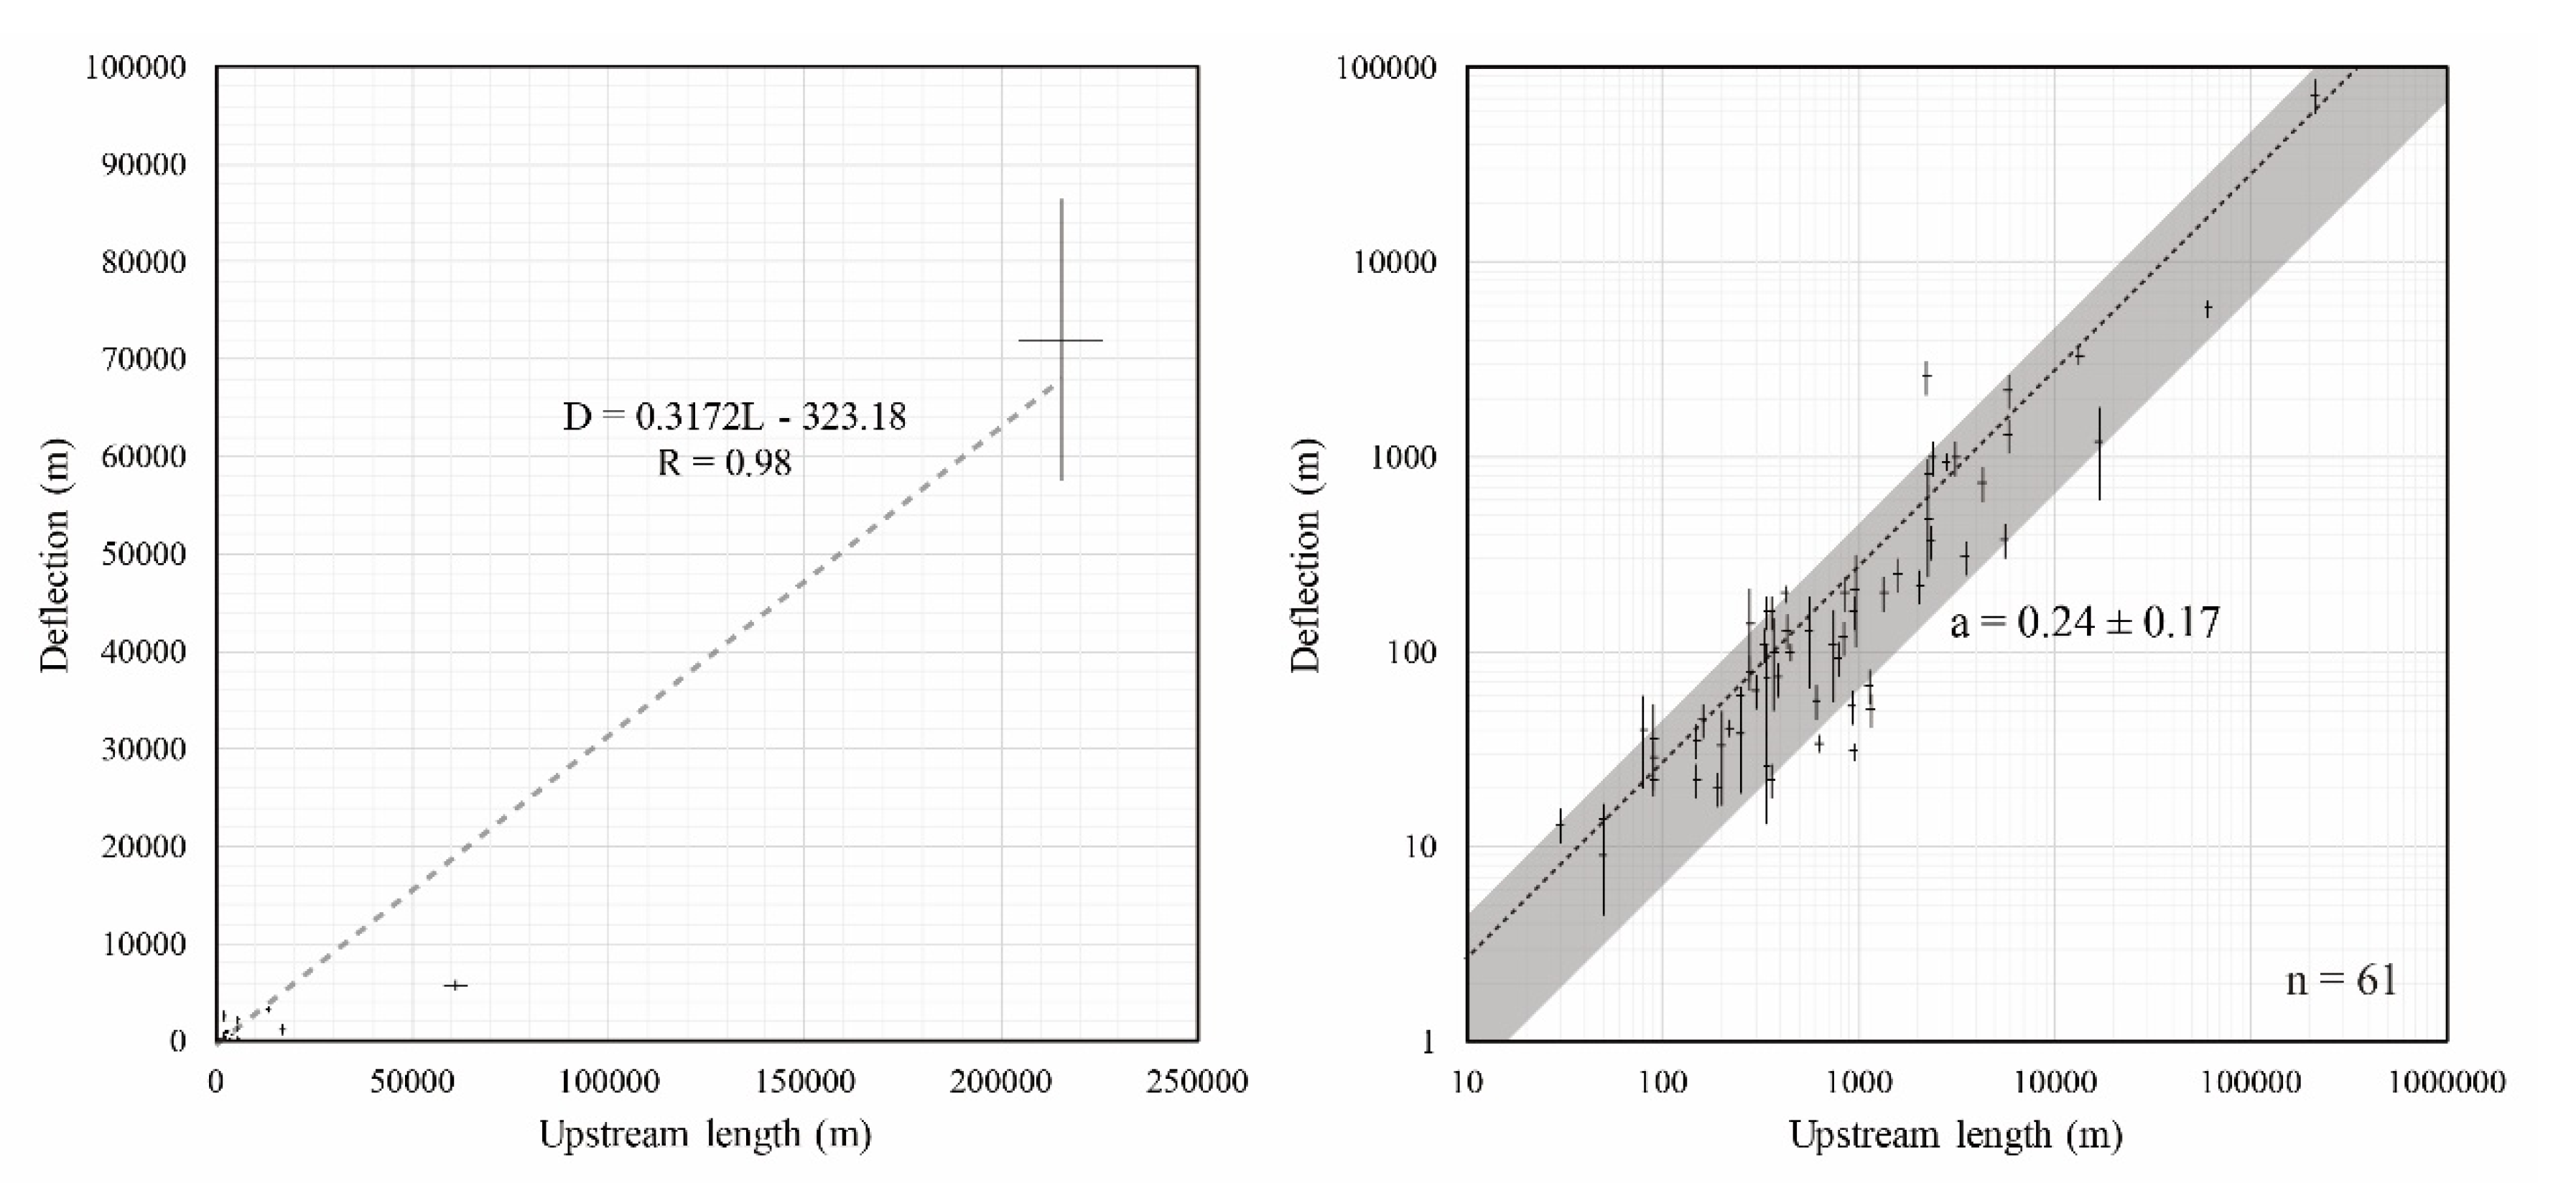
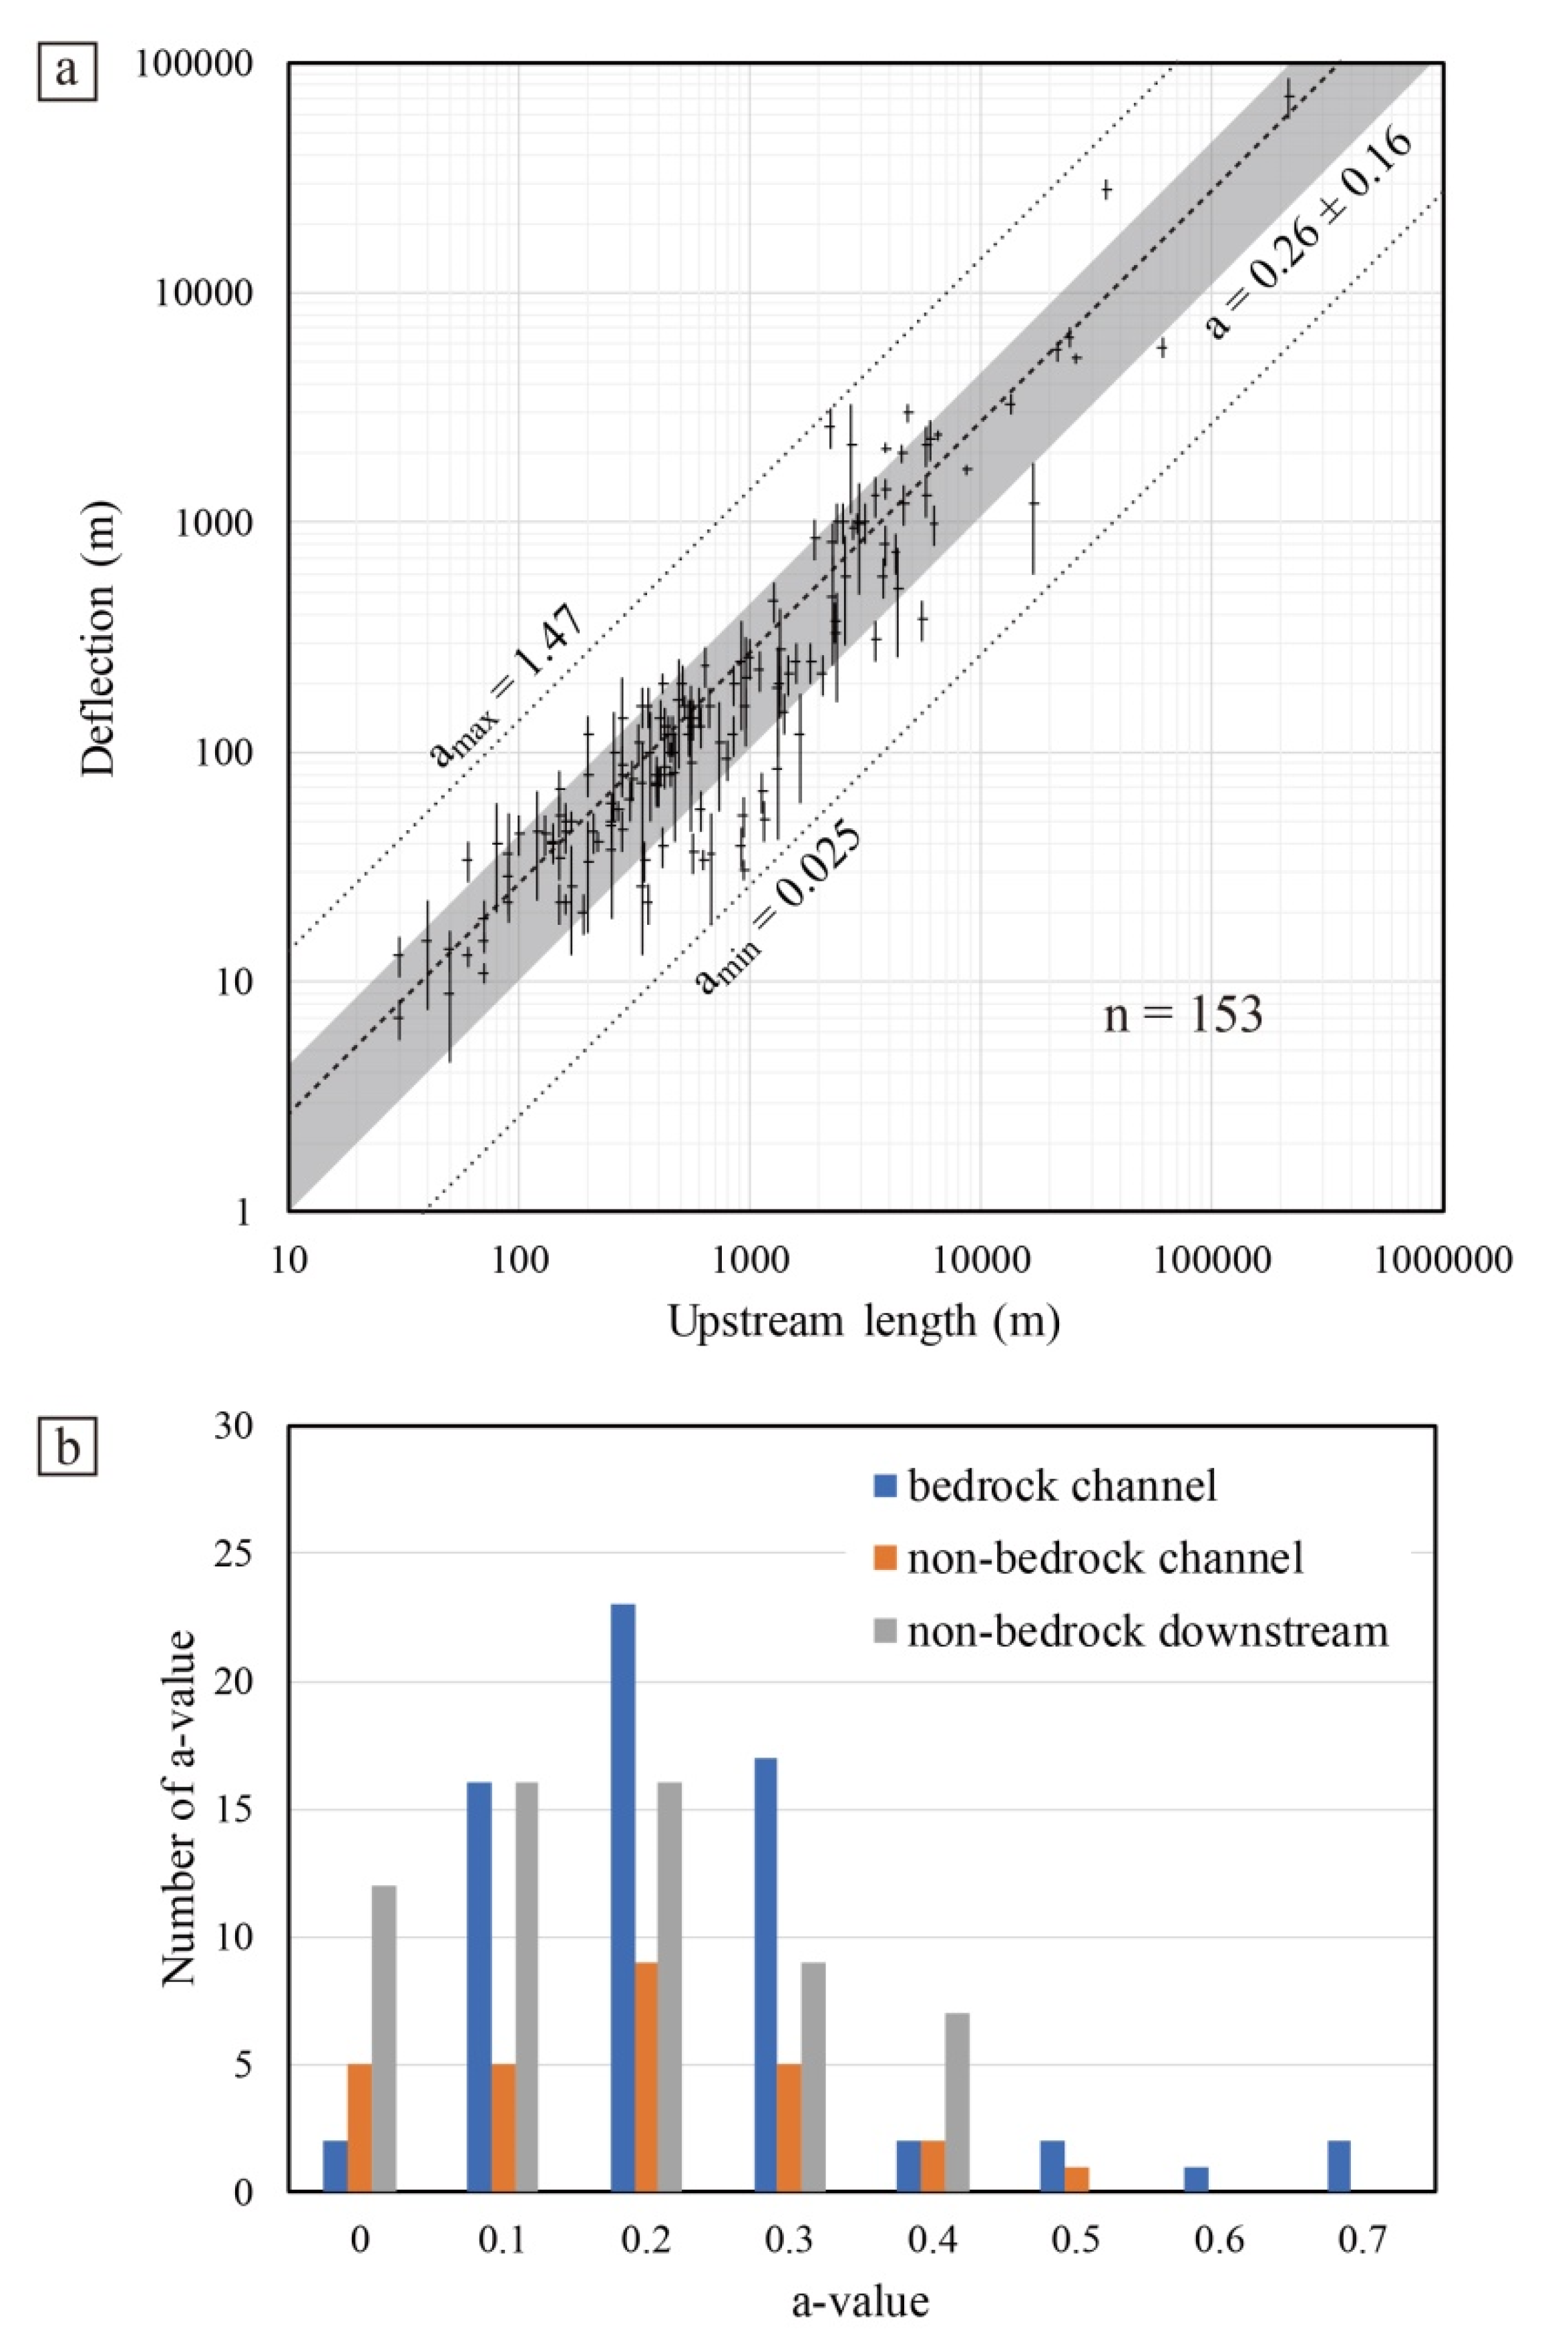
A positively related linear relationship between the upstream length L and the offset amount D was obtained along the Altyn Tagh Fault, indicating that the larger rivers generally accumulate larger offset. The channel with bedrock upstream generally has a better correlation between L and D than that of non-bedrock upstream.
(3)
The maximum observed cumulative offset recorded by rivers on the Altyn Tagh fault is ~72 km, nevertheless, the real total maximum displacement might be larger than 72 km due to possible river capture and abandonment. Along with these cumulative displacements recorded by other regional-scale strike-slip faults, a limited extrusion to the east is suggested to decipher the deformation of the Tibetan Plateau after the India-Asia collision.
(4)
This study provides an example of studying the relationship between development of drainage systems and long-term strike-slip faulting. As a reliable geomorphic feature, the systematic deflection of stream channels is a good carrier to understand the deformational behaviors of strike-slip faulting.

Supplementary Materials

The following are available online at https://www.mdpi.com/article/10.3390/rs13163109/s1, Table S1: Upstream length (L), deflection amount (D) and the corresponding a-value of the offset channels along the Altyn Tagh Fault.

Author Contributions

P.C. contributed to conceive the idea, satellite interpretations and write the manuscript, B.Y. prepared partial figures and discussed the contents, Y.L. helped check the English writing. All authors have read and agreed to the published version of the manuscript.

Funding

This research was funded by the National Natural Science Foundation of China (Grant Number: 41873063, 4187225, 41902210), Basic Science Foundation of Institute of Geomechanics (No. DZLXJK202107, awarded to P. Chen), and the fund from the Key Laboratory of Deep-Earth Dynamics of Ministry of Natural Resource, Institute of Geology, Chinese Academy of Geological Sciences (J1901-16).

Acknowledgments

The authors are grateful to the editor and three anonymous reviewers for their critical comments that greatly improved the article. Thanks are also due to Kristie Shen for her kindly help during the process of manuscript processing.

Conflicts of Interest

The authors declare no conflict of interest.

References

  1. Burbank, D.W.; Anderson, R.S. Tectonic Geomorphology, 2nd ed.; Blackwell Publishing Ltd.: Oxford, UK, 2011; pp. 1–5. [Google Scholar]
  2. Jackson, J.; Norris, R.; Youngsun, J. The structural evolution of active fault and fold systems in central Otago, New Zealand: Evidence revealed by drainage patterns. J. Struct. Geol. 1996, 18, 217–234. [Google Scholar] [CrossRef]
  3. Walker, R.T. A remote sensing study of active folding and faulting in southern Kerman province, SE Iran. J. Struct. Geol. 2005, 28, 654–668. [Google Scholar] [CrossRef]
  4. Yan, B.; Lin, A. Systematic deflection and offset of the Yangtze River drainage system along the strike-slip Ganzi-Yushu-Xianshuihe Fault Zone. Tibet. Plateau. J. Geodyn. 2015, 87, 13–25. [Google Scholar] [CrossRef]
  5. Strahler, A.N. Quantitative analysis of watershed geomorphology. Am. Geophys. Union Trans. 1957, 38, 913–920. [Google Scholar] [CrossRef] [Green Version]
  6. Brookfield, M.E. The evolution of the great river systems of the southern Asia during the Cenozoic India-Asia collision: Rivers draining southwards. Geomorphology 1998, 22, 285–312. [Google Scholar] [CrossRef]
  7. Kirby, E.; Whipple, K. Quantifying differential rock-uplift rates via stream profile analysis. Geology 2001, 29, 415–418. [Google Scholar] [CrossRef]
  8. Chen, P.; Lin, A. Topographic divides formed by active flexural folding in the NE marginal zone of the Tibetan Plateau. Geomorphology 2019, 332, 1–9. [Google Scholar] [CrossRef]
  9. Wallace, R.E. The San Andreas fault in the Carrizo Plain-Temblor Range region, California. San Andreas fault in southern California: A guide to San Andreas fault from Mexico to Carrizo Plain. Calif. Div. Mines Geol. Spec. Rep. 1975, 118, 241–250. [Google Scholar]
  10. Huang, W. Morphologic patterns of stream channels on active Yishi Fault, southern Shandong Province, Eastern China: Implications for repeated great earthquakes in the Holocene. Tectonophysics 1993, 219, 283–304. [Google Scholar] [CrossRef]
  11. Matsuda, T. Active fault assessment for Irozaki fault system, Izu Peninsula. In Reports on the Earthquake off the Izu Peninsula, 1974, and the Disaster; Tsuchi, R., Ed.; Kurofune Press: Shizuoka, Japan, 1975; pp. 121–125. (In Japanese) [Google Scholar]
  12. Noriega, G.R.; Arrowsmith, J.R.; Grant, L.B.; Young, J.J. Stream channel offset and Late Holocene slip rate of the San Andreas Fault at the Van Matre Ranch Site, Carrizo Plain, California. Bull. Seismol. Soc. Am. 2006, 96, 33–47. [Google Scholar] [CrossRef]
  13. Maruyama, T.; Lin, A. Tectonic history of the Rokko active fault zone (southwest Japan) as inferred from cumulative offsets of stream channels and basement rocks. Tectonophysics 2000, 323, 197–216. [Google Scholar] [CrossRef]
  14. Klinger, Y.; Etchebes, M.; Tapponnier, P.; Narteau, C. Characteristic slip for five great earthquakes along the Fuyun fault in China. Nat. Geosci. 2011, 4, 389–392. [Google Scholar] [CrossRef]
  15. Ren, Z.K.; Zhang, Z.Q.; Chen, T.; Yan, S.L.; Yin, J.H.; Zhang, P.Z.; Zheng, W.J.; Zhang, H.P.; Li, C.Y. Clustering of offsets on the Haiyuan Fault and their relationship to paleo-earthquakes. Geol. Soc. Am. Bull. 2016, 128, 3–18. [Google Scholar] [CrossRef]
  16. Kang, W.; Xu, X.; Oskin, M.E.; Yu, G.; Luo, J.; Chen, G.; Luo, H.; Sun, X.; Wu, X. Characteristic slip distribution and earthquake recurrence along the eastern Altyn Tagh fault revealed by high-resolution topographic data. Geosphere 2019, 16, 392–406. [Google Scholar] [CrossRef] [Green Version]
  17. Gaudemer, Y.; Tapponnier, P.; Turcotte, D.L. River offsets across active strike-slip faults. Ann. Tecton. 1989, 3, 55–76. [Google Scholar]
  18. Tapponnier, P.; Peltzer, G.; Ledain, A.Y.; Cobbold, P. Propagating extrusion tectonics in Asia–New insights from simple experiments with plasticine. Geology 1982, 10, 611–616. [Google Scholar] [CrossRef]
  19. Tapponnier, P.; Xu, Z.Q.; Roger, F.; Meyer, B.; Amaud, N.; Wittlinger, G.; Yang, J.S. Oblique stepwise rise and growth of the Tibet Plateau. Science 2001, 294, 1671–1677. [Google Scholar] [CrossRef]
  20. Wittlinger, G.; Tapponnier, P.; Ooupinet, G.; Jiang, M.; Shi, D.; Herquel, G.; Masson, F. Tomographic evidence for localized lithospheric shear along the Altyn Tagh fault. Science 1998, 282, 74–76. [Google Scholar] [CrossRef] [PubMed] [Green Version]
  21. Peltzer, G.; Tapponnier, P. Formation and evolution of strike-slip faults, rifts, and basins during the India-Asia collision: An experimental approach. J. Geophys. Res. 1988, 93, 15085–15117. [Google Scholar] [CrossRef]
  22. Cowgill, E.; Yin, A.; Harrison, T.M.; Feng, W.X. Reconstruction of the Altyn Tagh fault based on U–Pb geochronology: Role of backthrusts, mantle sutures and heterogeneous crustal strength in the forming the Tibetan plateau. J. Geophys. Res. 2003, 108. [Google Scholar] [CrossRef]
  23. Yin, A.; Rumelhrt, P.E.; Bulter, R.; Cowgill, E.; Harrison, T.M.; Foster, D.A.; Foster, D.A.; Ingersoll, R.V.; Zhang, Q.; Zhou, X.Q.; et al. Tectonic history of the Altyn Tagh fault system in northern Tibet inferred from Cenozoic sedimentation. GSA Bull. 2002, 114, 1257–1295. [Google Scholar] [CrossRef]
  24. Chen, Y.; Gilder, S.; Halim, N.; Cogne, J.P.; Courtillot, V. New paleomagnetic constraints on central Asian kinematics: Displacement along the Altyn Tagh fault and rotation of the Qaidam Basin. Tectonics 2002, 21, 1–19. [Google Scholar] [CrossRef] [Green Version]
  25. Ding, G.Y.; Chen, J.; Tian, Q.J.; Shen, X.H.; Xing, C.Q.; Wei, K.B. Active faults and magnitudes of left-lateral displacement along the northern margin of the Tibetan Plateau. Tectonophysics 2004, 380, 243–260. [Google Scholar] [CrossRef]
  26. Zhang, Y.Q.; Chen, Z.L.; Yang, N. New geological evidence for late Cenozoic left-lateral displacement along the Altyn Tagh Fault. Geoscience 2001, 15, 8–12, (In Chinese with English Abstract). [Google Scholar]
  27. Yin, A. Cenozoic tectonic evolution of the Himalayan orogen as constrained by along-strike variation of structural geometry, exhumation history, and foreland sedimentation. Earth Sci. Rev. 2006, 76, 1–131. [Google Scholar] [CrossRef]
  28. Cowgill, E.; Gold, R.D.; Chen, X.; Wang, X.; Arrowsmith, J.R.; Southon, J. Low Quaternary slip rate reconciles geodetic and geologic rates along the Altyn Tagh fault, northwestern Tibet. Geology 2009, 37, 647–650. [Google Scholar] [CrossRef]
  29. Zhang, P.Z.; Molnar, P.; Xu, X.W. Late Quaternary and present-day rates of slip along the Altyn Tagh Fault, northern margin of the Tibetan Plateau. Tectonics 2007, 26. [Google Scholar] [CrossRef] [Green Version]
  30. Yin, A.; Harrison, T.M. Geologic evolution of the Himalayan-Tibetan orogeny. Annu. Rev. Earth Planet. Sci. 2000, 28, 211–280. [Google Scholar] [CrossRef] [Green Version]
  31. Yue, Y.; Ritts, B.D.; Graham, S.A. Initiation and long-term slip history of the Altyn Tagh fault. Int. Geol. Rev. 2001, 43, 1087–1093. [Google Scholar] [CrossRef]
  32. Yue, Y.; Ritts, B.D.; Hanson, A.D.; Graham, S.A. Sedimentary evidence against large strike-slip translation on the northern Altyn Tagh fault, NW China. Earth Planet. Sci. Lett. 2004, 228, 311–323. [Google Scholar] [CrossRef]
  33. Chen, Z.L.; Zhang, Y.Q.; Chen, X.H.; Wang, X.F.; Washburn, Z.; Arrowsmith, J. Late Cenozoic sedimentary process and its Response to the slip history of central Altyn Tagh Fault, northern Qinghai-Tibetan plateau. Sci. China (D) 2001, 44, 103–111. [Google Scholar] [CrossRef]
  34. Yue, Y.; Ritts, B.D.; Graham, S.A.; Wooden, J.L.; Gehrels, G.E.; Zhang, Z. Slowing extrusion tectonics: Lowered estimate of post-Early Miocene slip rate for the Altyn Tagh fault. Earth Planet. Sci. Lett. 2003, 217, 111–122. [Google Scholar] [CrossRef]
  35. Peltzer, G.; Tapponnier, P.; Armijo, R. Magnitude of late Quateranry left-lateral displacements along the north edge of Tibet. Science 1989, 246, 1285–1289. [Google Scholar] [CrossRef] [PubMed]
  36. Xu, X.W.; Tapponnier, P.; Van Der Woerd, J.; Ryerson, F.J.; Wang, F.; Zheng, R.Z.; Chen, W.B.; Ma, W.T.; Yu, G.H.; Chen, G.H.; et al. Late Quaternary left-lateral strike-slip rate of the Altyn Tagh Fault zone and its transferring model of tectonic movement. Sci. China (Ser. D) 2003, 33, 967–974. [Google Scholar]
  37. Mériaux, A.S.; Ryerson, F.J.; Tapponnier, P.; Van der Woerd, J.; Finkel, R.C.; Xu, X.W.; Xu, Z.Q.; Caffee, M.W. Rapid slip along the central Altyn Tagh Fault: Morphochronologic evidence from Cherchen He and Sulamu Tagh. J. Geophys. Res. 2004, 109, B06401. [Google Scholar] [CrossRef]
  38. Wang, F.; Xu, X.; Zheng, R. Slip-rate on the eastern Altyn Tagh fault since 20 ka BP. Seismol. Geol. 2003, 24, 349–358, (In Chinese with English Abstract). [Google Scholar]
  39. Wang, F.; Xu, X.; Zheng, R. Study on Holocene strike-slip rates of the middle Altyn Tagh fault by terraces offset measurement. Seismol. Geol. 2004, 26, 61–70, (In Chinese with English Abstract). [Google Scholar]
  40. Gold, R.D.; Cowgill, E.; Arrowsmith, J.R.; Gosse, J.; Chen, X.; Wang, X. Riser diachroneity, lateral erosion, and uncertainty in rates of strike-slip faulting: A case study from Tuzidun along the Altyn Tagh Fault, NW China. J. Geophys. Res. 2009, 114, B04401. [Google Scholar] [CrossRef] [Green Version]
  41. Mériaux, A.S.; Van Der Woerd, J.; Tapponnier, P.; Ryerson, F.J.; Finkel, R.C.; Lasserre, C.; Xu, X. The Pingding segment of the Altyn Tagh fault (91°E): Holocene slip-rate determination from cosmogenic radionuclide dating of offset fluvial terraces. J. Geophys. Res. Solid Earth 2012, 117, B9. [Google Scholar] [CrossRef] [Green Version]
  42. Xiang, H.; Guo, S.; Zhang, W.; Zhang, B. River offset and slip rate of the east segment of Altyn Tagh fault zone since the Quaternary. Seismol. Geol. 2000, 22, 129–138, (In Chinese with English Abstract). [Google Scholar]
  43. Bendick, R.; Bilham, R.; Freymueller, J.; Larson, K.; Yin, G. Geodetic evidence for a low slip rate in the Altyn Tagh fault system. Nature 2000, 404, 69–72. [Google Scholar] [CrossRef]
  44. Wallace, K.; Yin, G.; Bilham, R. Inescapable slow slip on the Altyn Tagh fault. Geophys. Res. Lett. 2004, 31, L09613. [Google Scholar] [CrossRef] [Green Version]
  45. Shen, Z.K.; Wang, M.; Li, Y.; Jackson, D.D.; Yin, A.; Dong, D.; Fang, P. Crustal deformation along the Altyn Tagh fault system, western China, from GPS. J. Geophys. Res. 2001, 106, 30607–30622. [Google Scholar] [CrossRef]
  46. Thatcher, W. Microplate model for the present-day deformation of Tibet. J. Geophys. Res. 2007, 106, B1401. [Google Scholar] [CrossRef]
  47. Xu, X.W.; Tan, X.B.; Wu, G.D.; Chen, J.B.; Shen, J.; Fang, W.; Song, H.P. Surface rupture features of the 2008 Yutian MS 7.3 earthquake and its tectonic nature. Seismol. Geol. 2011, 33, 462–471, (In Chinese with English Abstract). [Google Scholar]
  48. He, J.; Vernant, P.; Chéry, J.; Wang, W.; Lu, S.; Ku, W.; Xia, W.; Bilham, R. Nailing down the slip rate of the Altyn Tagh fault. Geophys. Res. Lett. 2013, 40, 5382–5386. [Google Scholar] [CrossRef]
  49. Zheng, G.; Wang, H.; Wright, T.J.; Lou, Y.; Zhang, R.; Zhang, W.; Shi, C.; Huang, J.; Wei, N. Crustal deformation in the India-Eurasia collision zone from 25 years of GPS measurements. J. Geophys. Res. Solid Earth 2017, 198, 1367–9312. [Google Scholar] [CrossRef]
  50. Liu, C.J.; Ji, L.Y.; Zhu, L.Y.; Zhao, C.Y. InSAR-constrained interseismic deformation and potential seismogenic asperities on the Altyn Tagh fault at 91.5°E–95°E, northern Tibetan Plateau. Remote Sens. 2018, 10, 943. [Google Scholar] [CrossRef] [Green Version]
  51. Li, H.B.; Pan, J.W.; Sun, Z.M.; Liu, D.L.; Zhang, J.J.; Li, C.L.; Liu, K.; Marie-Luce, C.; Yun, K.; Gong, Z. Seismogenic structure and surface rupture characteristics of the 2014 Ms7.3 Yutian Earthquake. Acta Geol. Sin. 2015, 89, 180–194, (In Chinese with English Abstract). [Google Scholar]
  52. Russell, R.J. Recent horizontal offsets along the Haywards Fault. J. Geol. 1926, 34, 507–511. [Google Scholar] [CrossRef]
  53. Craddock, W.H.; Kirby, E.; Harkins, N.W.; Zhang, H.P.; Shi, X.H.; Liu, J.H. Rapid fluvial incision along the Yellow River during headward basin integration. Nat. Geosci. 2010, 3, 209–213. [Google Scholar] [CrossRef]
  54. Walker, F.; Allen, M.B. Offset rivers, drainage spacing and the record of strike-slip faulting: The Kuh Banan Fault, Iran. Tectonophys 2012, 530, 251–263. [Google Scholar] [CrossRef] [Green Version]
  55. Ouchi, S. Development of offset channels across the San Andreas fault. Geomorphology 2005, 70, 112–128. [Google Scholar] [CrossRef]
  56. Yun, L.; Zhang, J.; Wang, J.; Yang, X.P.; Qu, J.F.; Zhang, B.H.; Zhao, H. Active deformation to the north of the Altyn Tagh fault: Constraints on northward growth of the northern Tibetan Plateau. J. Asian Earth Sci. 2020, 198, 104312. [Google Scholar] [CrossRef]
  57. England, P.; Houseman, G. Finite strain calculations of continental deformation 2. Comparison with the India-Asia collision zone. J. Geophys. Res. 1986, 112, 3664–3676. [Google Scholar] [CrossRef]
  58. Zhang, P.Z.; Burchfiel, B.C.; Molnar, P.; Zhang, W.Q.; Jiao, D.C.; Deng, Q.D.; Wang, Y.P.; Royden, L.H.; Song, F.M. Amount and style of late Cenozoic deformation in the Liupan Shan area, Ningxia autonomous region, China. Tectonics 1991, 10, 1110–1129. [Google Scholar] [CrossRef]
  59. Burchfiel, B.C.; Zhang, P.Z.; Wang, Y.P.; Zhang, W.Q.; Song, F.M.; Deng, Q.D.; Monlar, P.; Royden, L. Geology of the Haiyuan fault zone, Ningxia-Hui Autonomous Region, China, and its relation to the evolution of the northeastern margin of the Tibetan Plateau. Tectonics 1991, 10, 1091–1110. [Google Scholar] [CrossRef]
  60. Chen, P.; Lin, A. Tectonic topography and Late Pleistocene activity of the West Qinling Fault, northeastern Tibetan Plateau. J. Asian Earth Sci. 2019, 176, 68–78. [Google Scholar] [CrossRef]
Figure 1. Index map showing the tectonic background and topographic features of the study area. (A) Tectonic setting of the study area showing the location and the major active faults within and surrounding the Tibetan Plateau. (B) Color-shaded relief map showing the topographic characters and locations along Altyn Tagh Fault. Epicenters and focal mechanism solutions are from the Global Harvard CMT catalogue (http://www.globalcmt.org, last accessed 15 May 2021). ATF: Altyn Tagh Fault; HYF: Haiyuan Fault; WQLF: West Qinling Fault; KLF: Kunlun Fault; GYXF: Ganzi-Yushu-Xianshuihe Fault. LMSF: Longmenshan Fault Zone; RRF: Red River Fault; YLR: Yellow River; YTR: Yangtze River; RR: Red River. Noting the 72 km deflection recorded by river AT035.
Remotesensing 13 03109 g001
Figure 2. (A) SRTM 90 m resolution color-shaded relief map showing the topography features and offset large river channels (see Figure 1B for location, Table S1 for measurement uncertainty). (B) High-resolution Google Earth images showing the offset of small rivers (AT009–AT023) with a relatively short upstream length. Red dotted line indicates the active fault trace. All the offsets are in meters.
Remotesensing 13 03109 g002
Figure 3. (A) SRTM 90 m resolution color-shaded relief map showing the topography features and offset large river channels (see Figure 1B for location, Table S1 for measurement uncertainty). (B) High-resolution Google Earth images showing the offset of small rivers (AT024–AT030) with a short upstream length. Red dotted line indicates the active fault trace. All the offsets are in meters.
Remotesensing 13 03109 g003
Figure 4. (AC) Google earth images showing the surface rupture developed in the alluvial fan and systematical offset of rivers (AT038–AT044) along Altyn Tagh Fault with the displacement amount varying from 79 m to 140 m (see Figure 1B for location, Table S1 for measurement uncertainty). Red short arrows and dotted line indicate the active fault trace. All the offsets are in meters.
Remotesensing 13 03109 g004
Figure 5. Systematical deflection of gullies (AT060–AT081) developed on the alluvial fan with the offset amount of a few meters to tens of meters (see Figure 1B for location, Table S1 for measurement uncertainty). Noting the capture and abandonment of stream channels associated with active faulting. The minimum offset of 7 m recorded by gully AT076 was probably generated by certain individual earthquake or multi-events. All the offsets are in meters.
Remotesensing 13 03109 g005
Figure 6. (AD) Google earth images showing the tectonic geomorphology and systematic deflection of stream channels, of which the downstream channels developed in the alluvial fan deposits (AT082–AT085, AT096–AT101, and AT106–AT112) associating with left-lateral strike-slip faulting along Altyn Tagh Fault (see Figure 1B for location, Table S1 for measurement uncertainty). All the offsets are in meters.
Remotesensing 13 03109 g006
Figure 7. (AD) Google earth images showing the tectonic geomorphology and systematic deflection of stream channels associating with left-lateral strike-slip faulting along Altyn Tagh Fault (see Figure 1B for location, Table S1 for measurement uncertainty). All the offsets are in meters.
Remotesensing 13 03109 g007
Figure 8. (a) Double logarithmic diagram showing the relationship between the deflection amount (D) and the upstream channel length (L) in the study area. The deflection amount D indicates a linear relationship with the upstream length of stream channel L. (b) Histograms show distribution of the a-value of the three types of channels (see Section 4 for detailed discussions).
Remotesensing 13 03109 g008
Figure 9. Diagram showing the relationship between the deflection amount (D) and the upstream channel length (L) of bedrock channels. The statistical results of 65 channels indicate a good linear relationship with correlation coefficient of 0.85 (the left one is linear coordinate system, and the right one is double logarithmic coordinate system).
Remotesensing 13 03109 g009
Figure 10. Diagram showing the relationship between the deflection amount (D) and the upstream channel length (L) of non-bedrock channels. Twenty-seven channels with upstream length from ~30 to ~910 m have been offset for 7 to 69 m, showing poor linear relationship between L and D (the left one is linear coordinate system, and the right one is double logarithmic coordinate system).
Remotesensing 13 03109 g010
Figure 11. Diagram showing the relationship between the deflection amount (D) and the upstream channel length (L) of bedrock channels with non-bedrock downstream channels. Sixty-one stream channels have been measured. The L and D also represented a good linear relationship with high correlation coefficient of 0.98 (the left one is linear coordinate system, and the right one is double logarithmic coordinate system).
Remotesensing 13 03109 g011
Table 1. Summary of slip rates along the Altyn Tagh Fault.
TypeTimescaleSlip Rate (mm/yr)Reference No.
Geologic rate49 Ma9 ± 2[23]
24 Ma36 ± 9[24]
30 Ma7–9[30]
late Oligocene12–16[31]
16.4 Ma10[32]
~5 Ma16–20[33]
16 Ma10[34]
Late Quaternary rateHolocene20–30[35]
Holocene17.5 ± 2 (western segment)
11 ± 3.5 (central segment)
4.8–2.2 (eastern segment)
[36]
late Pleistocene20.3 ± 1.1[37]
Holocene11.4 ± 2.5[38,39]
Holocene8–17[40,41]
Holocene4.7–6.7[42]
Geodetic rate 9 ± 5[43,44,45]
9 ± 2[46]
8–9[47]
9.0 ± 4[48]
6.4 (91.5°E–95°E)[50]
8.1 ± 0.7 (~86°E)[49]
8.6 ± 1.5 (~90.4°E)
4.5 ± 0.8 (94.6°E)
11.9 ± 3.3 (89°E–91°E)
4 (94°E–96°E)[29]
3.9 ± 2.3 (~96°E)
Table 2. Statistical analysis of a-value.
All ChannelsBedrock ChannelNon-Bedrock ChannelNon-Bedrock Downstream
Number of Channels153652761
Average a-value0.260.280.250.24
Standard deviation (±σ)0.160.150.130.17
Coefficient of Variance (%)60525373
Correlation coefficient (L and D)0.950.850.240.98
Publisher’s Note: MDPI stays neutral with regard to jurisdictional claims in published maps and institutional affiliations.

