
An Adjustment Approach for Aerosol Optical Depth Inferred from CALIPSO


Abstract
:1. Introduction
2. Datasets and Methods
2.1. CALIOP Data
2.2. Ground-Based AOD Data
2.3. Meteorological Observation
3. Retrieval of CALIPSO AOD
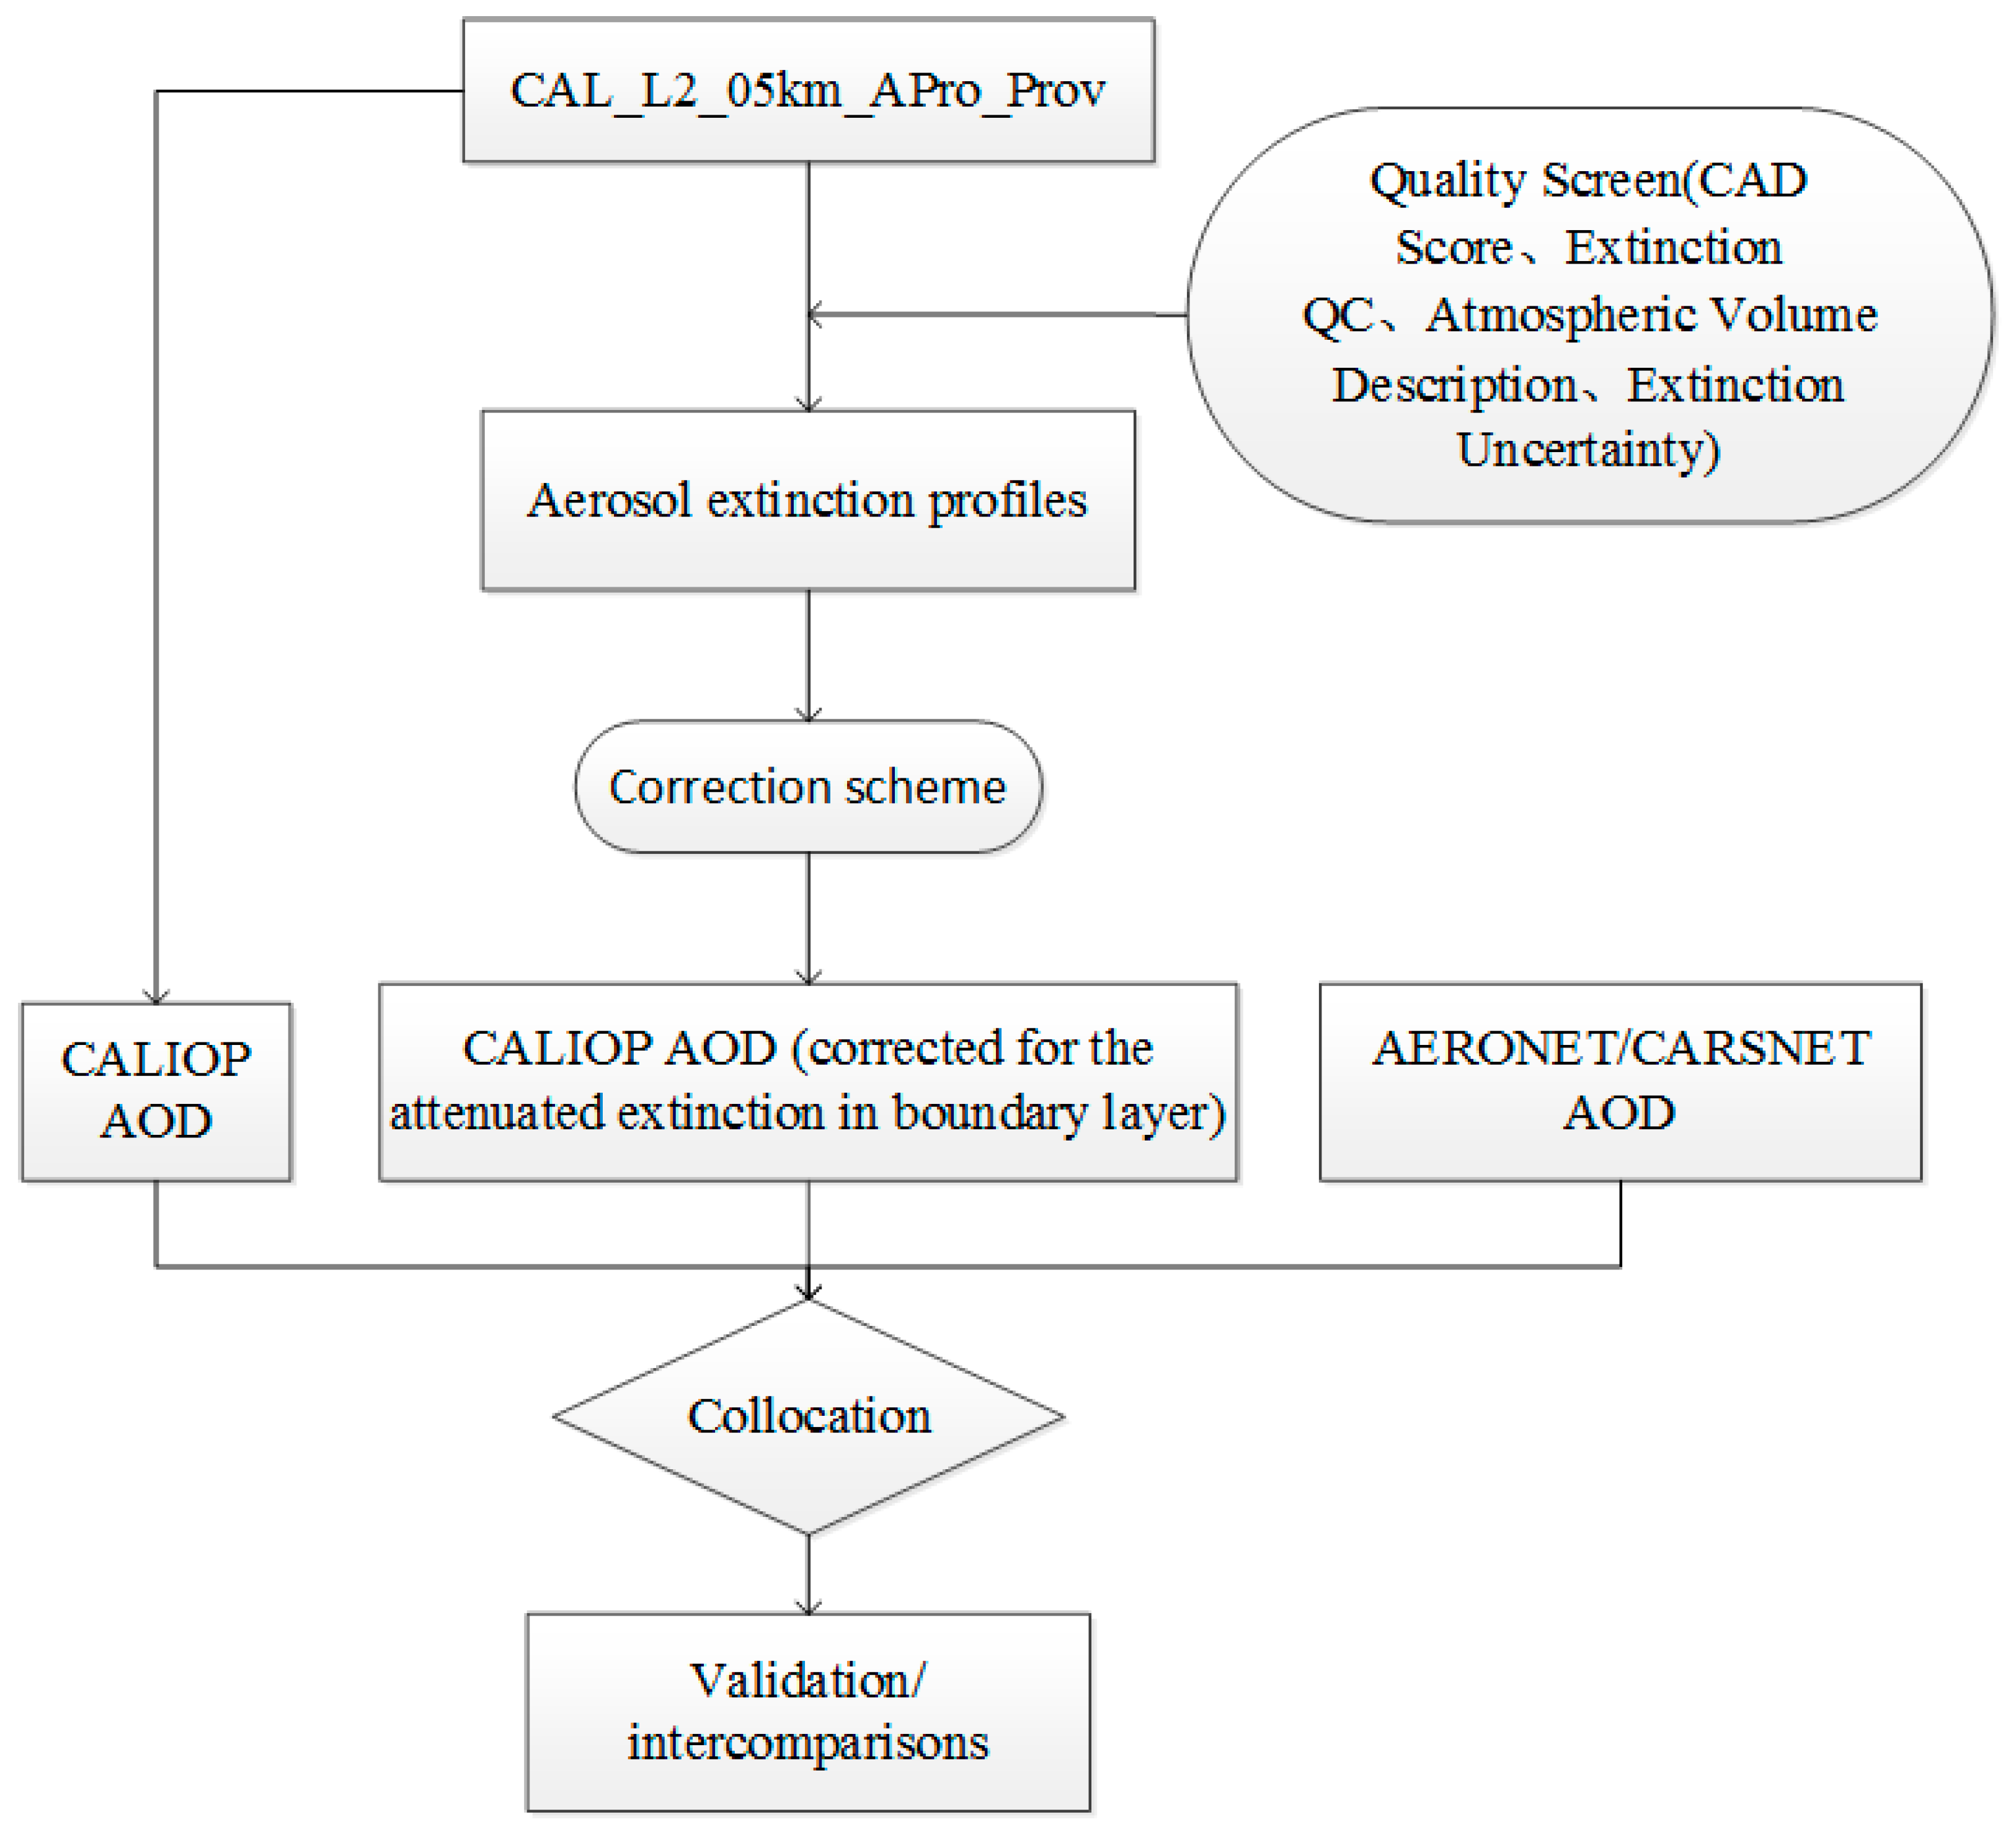
3.1. CALIPSO AOD Retrieval and Quality Control
3.2. CALIPSO AOD Correction
3.3. Matching Method
4. Results
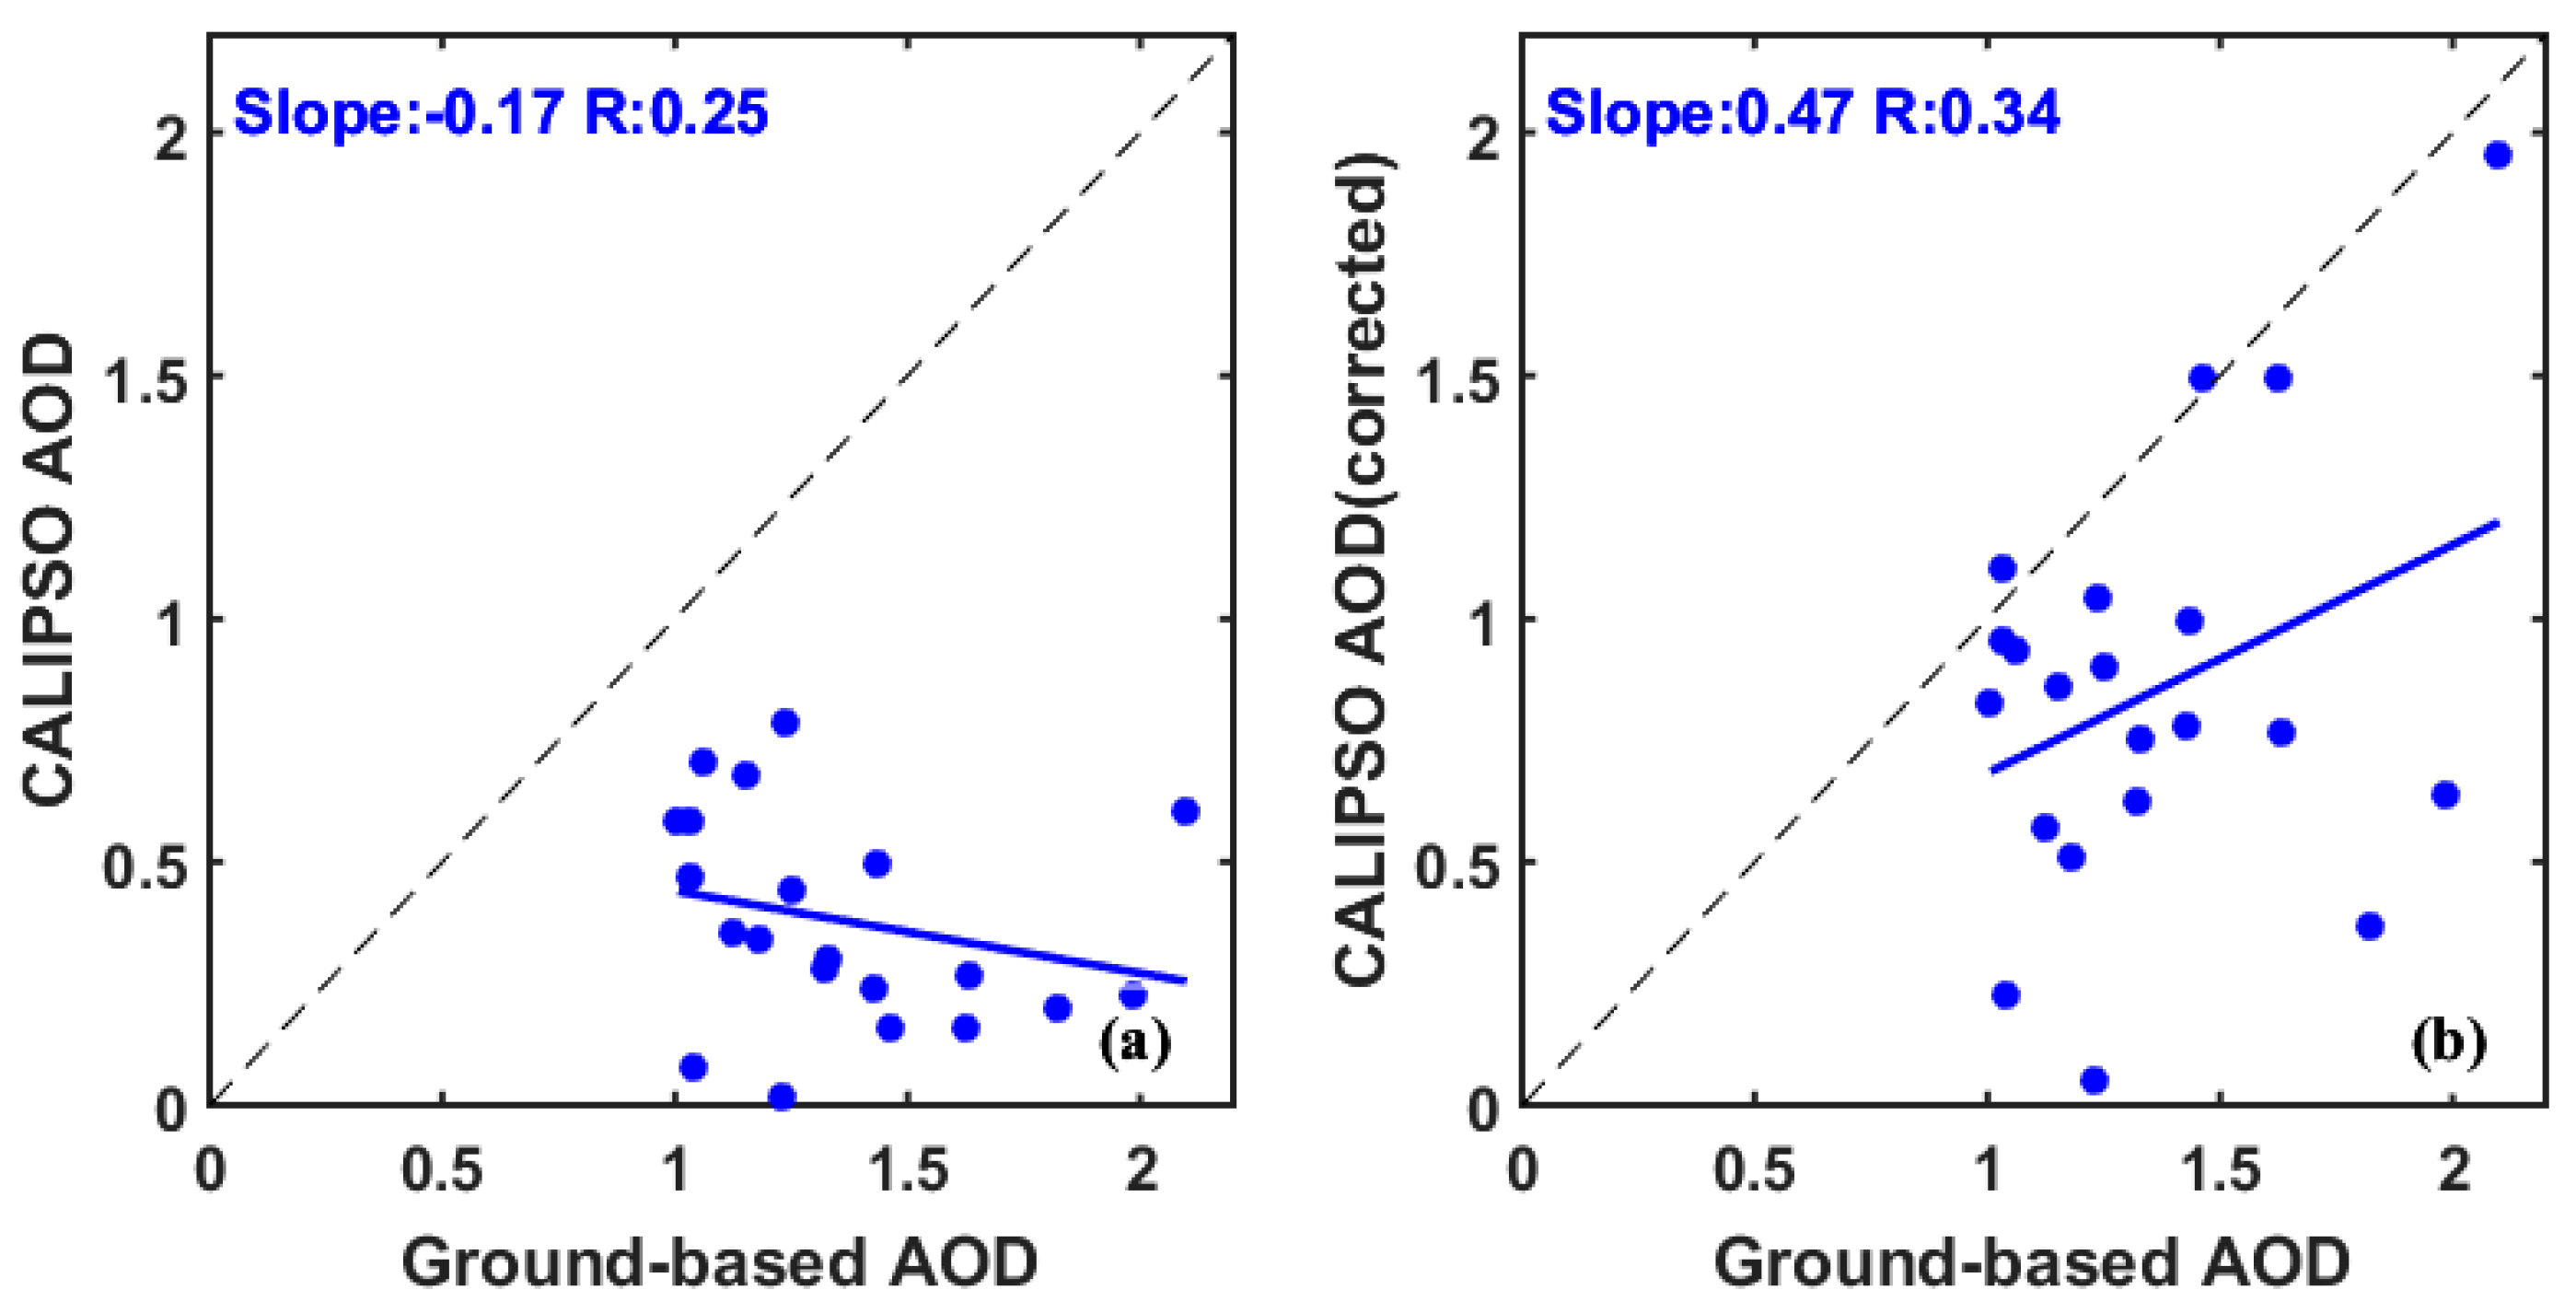
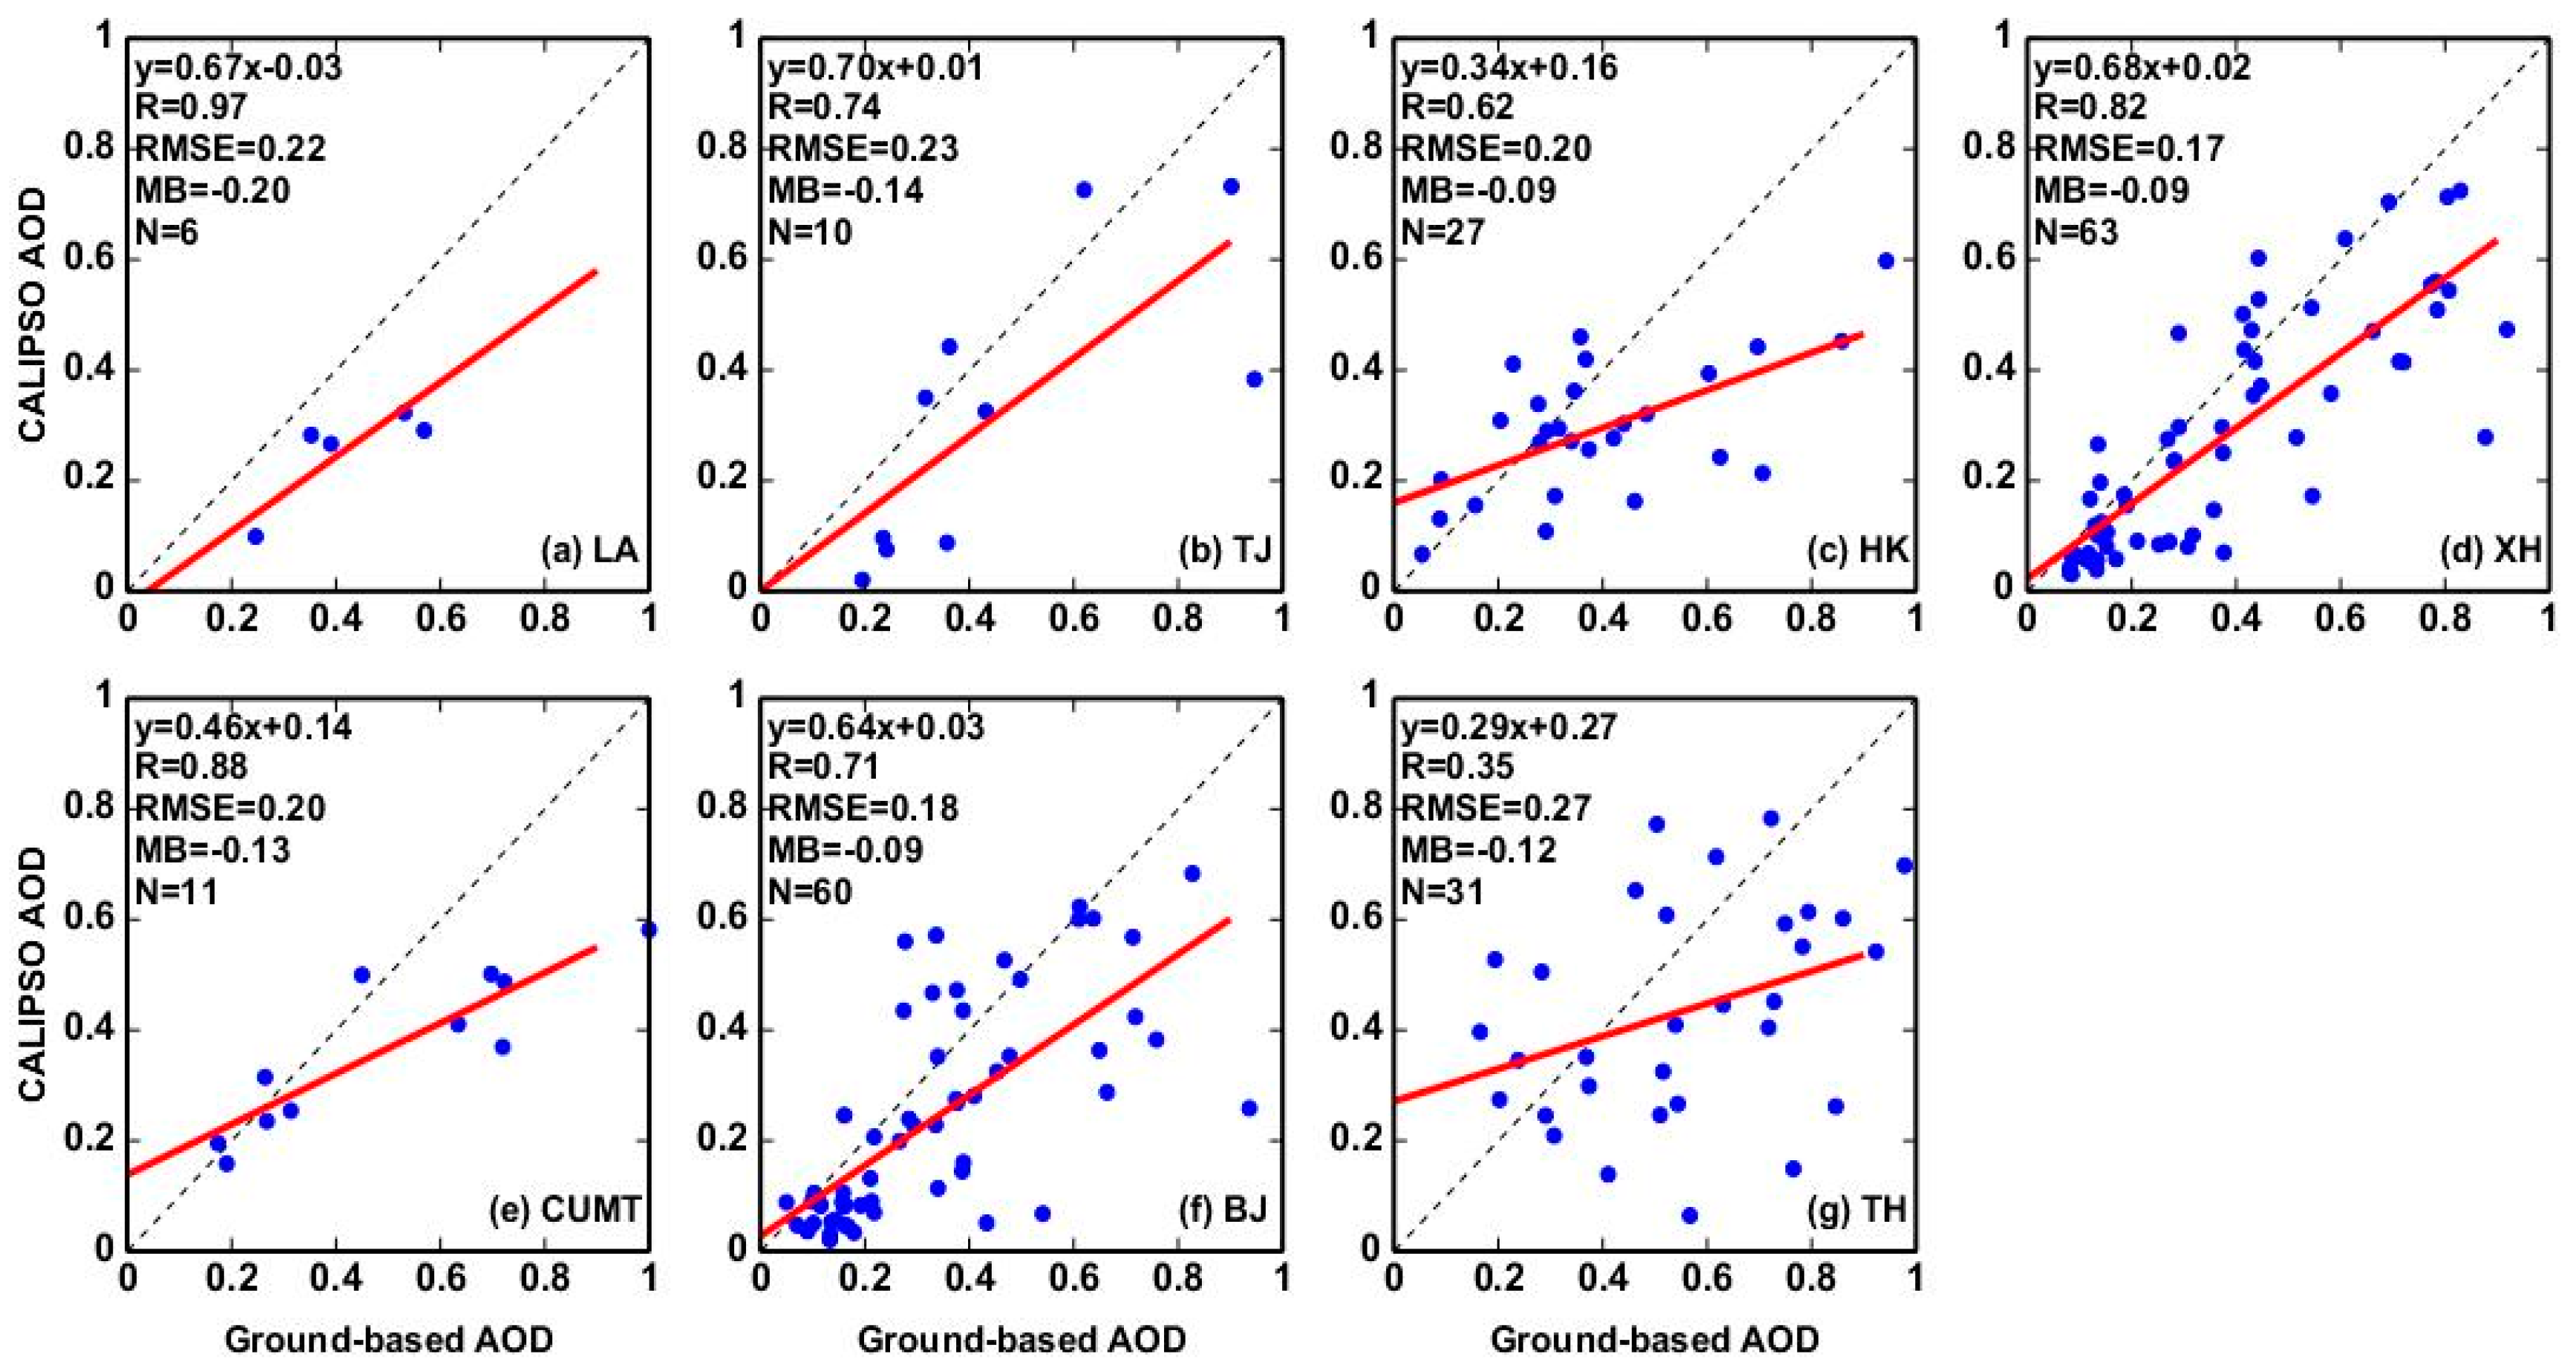
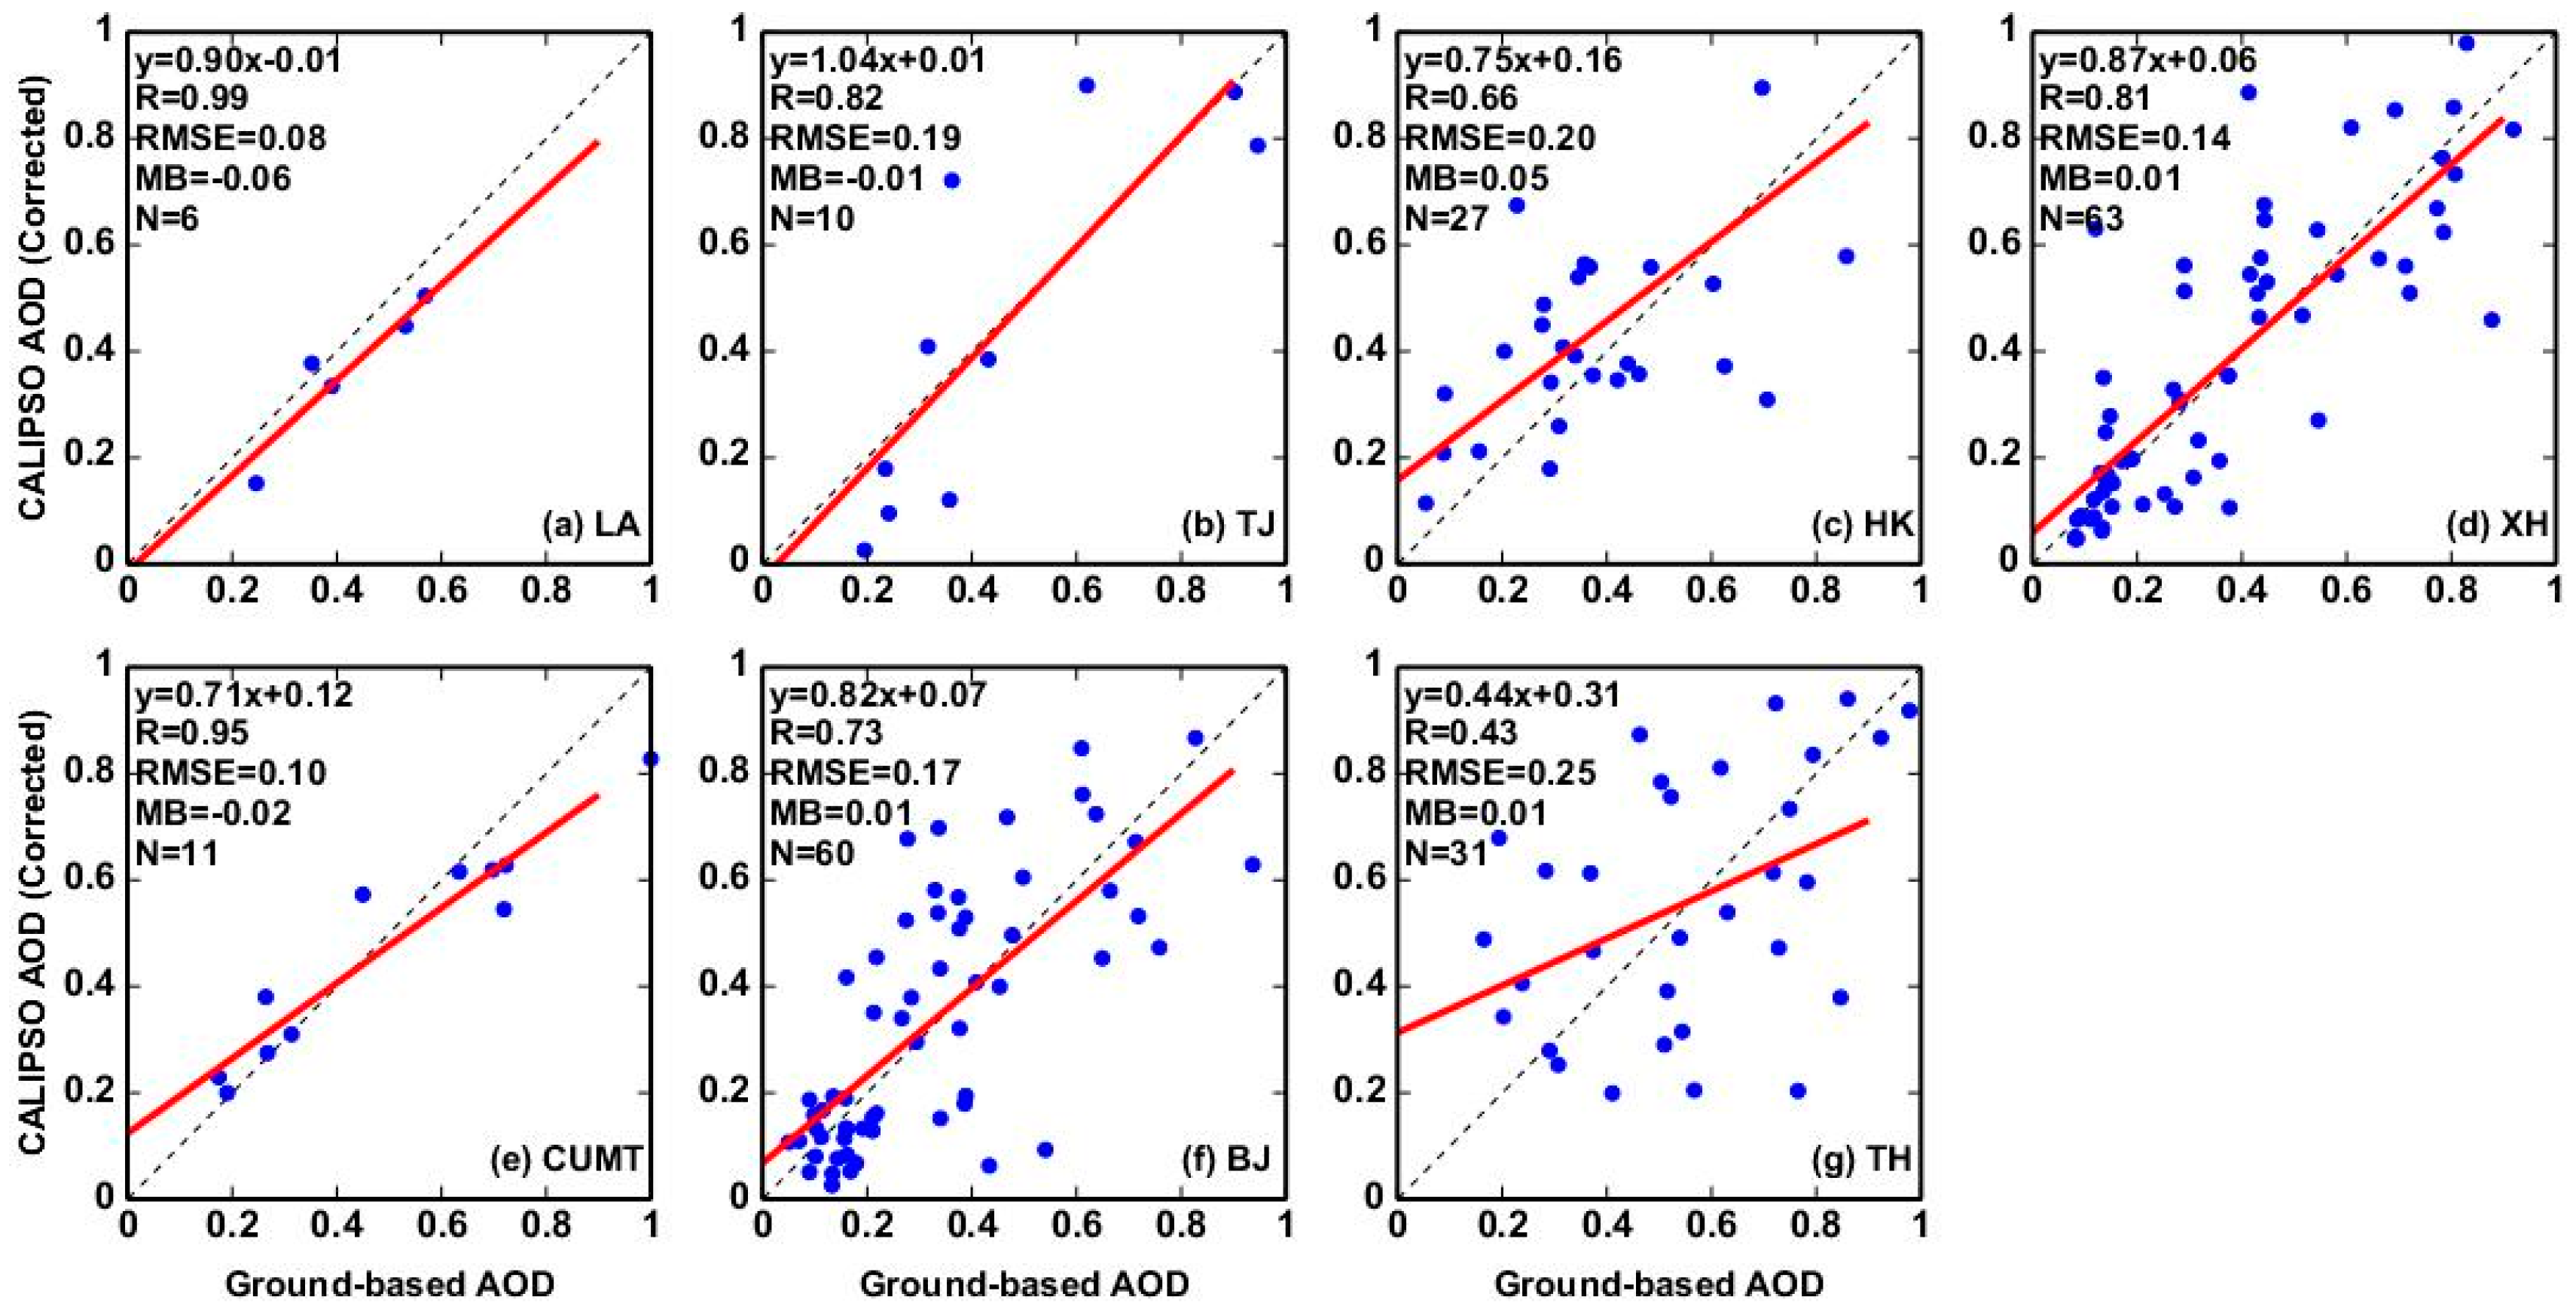
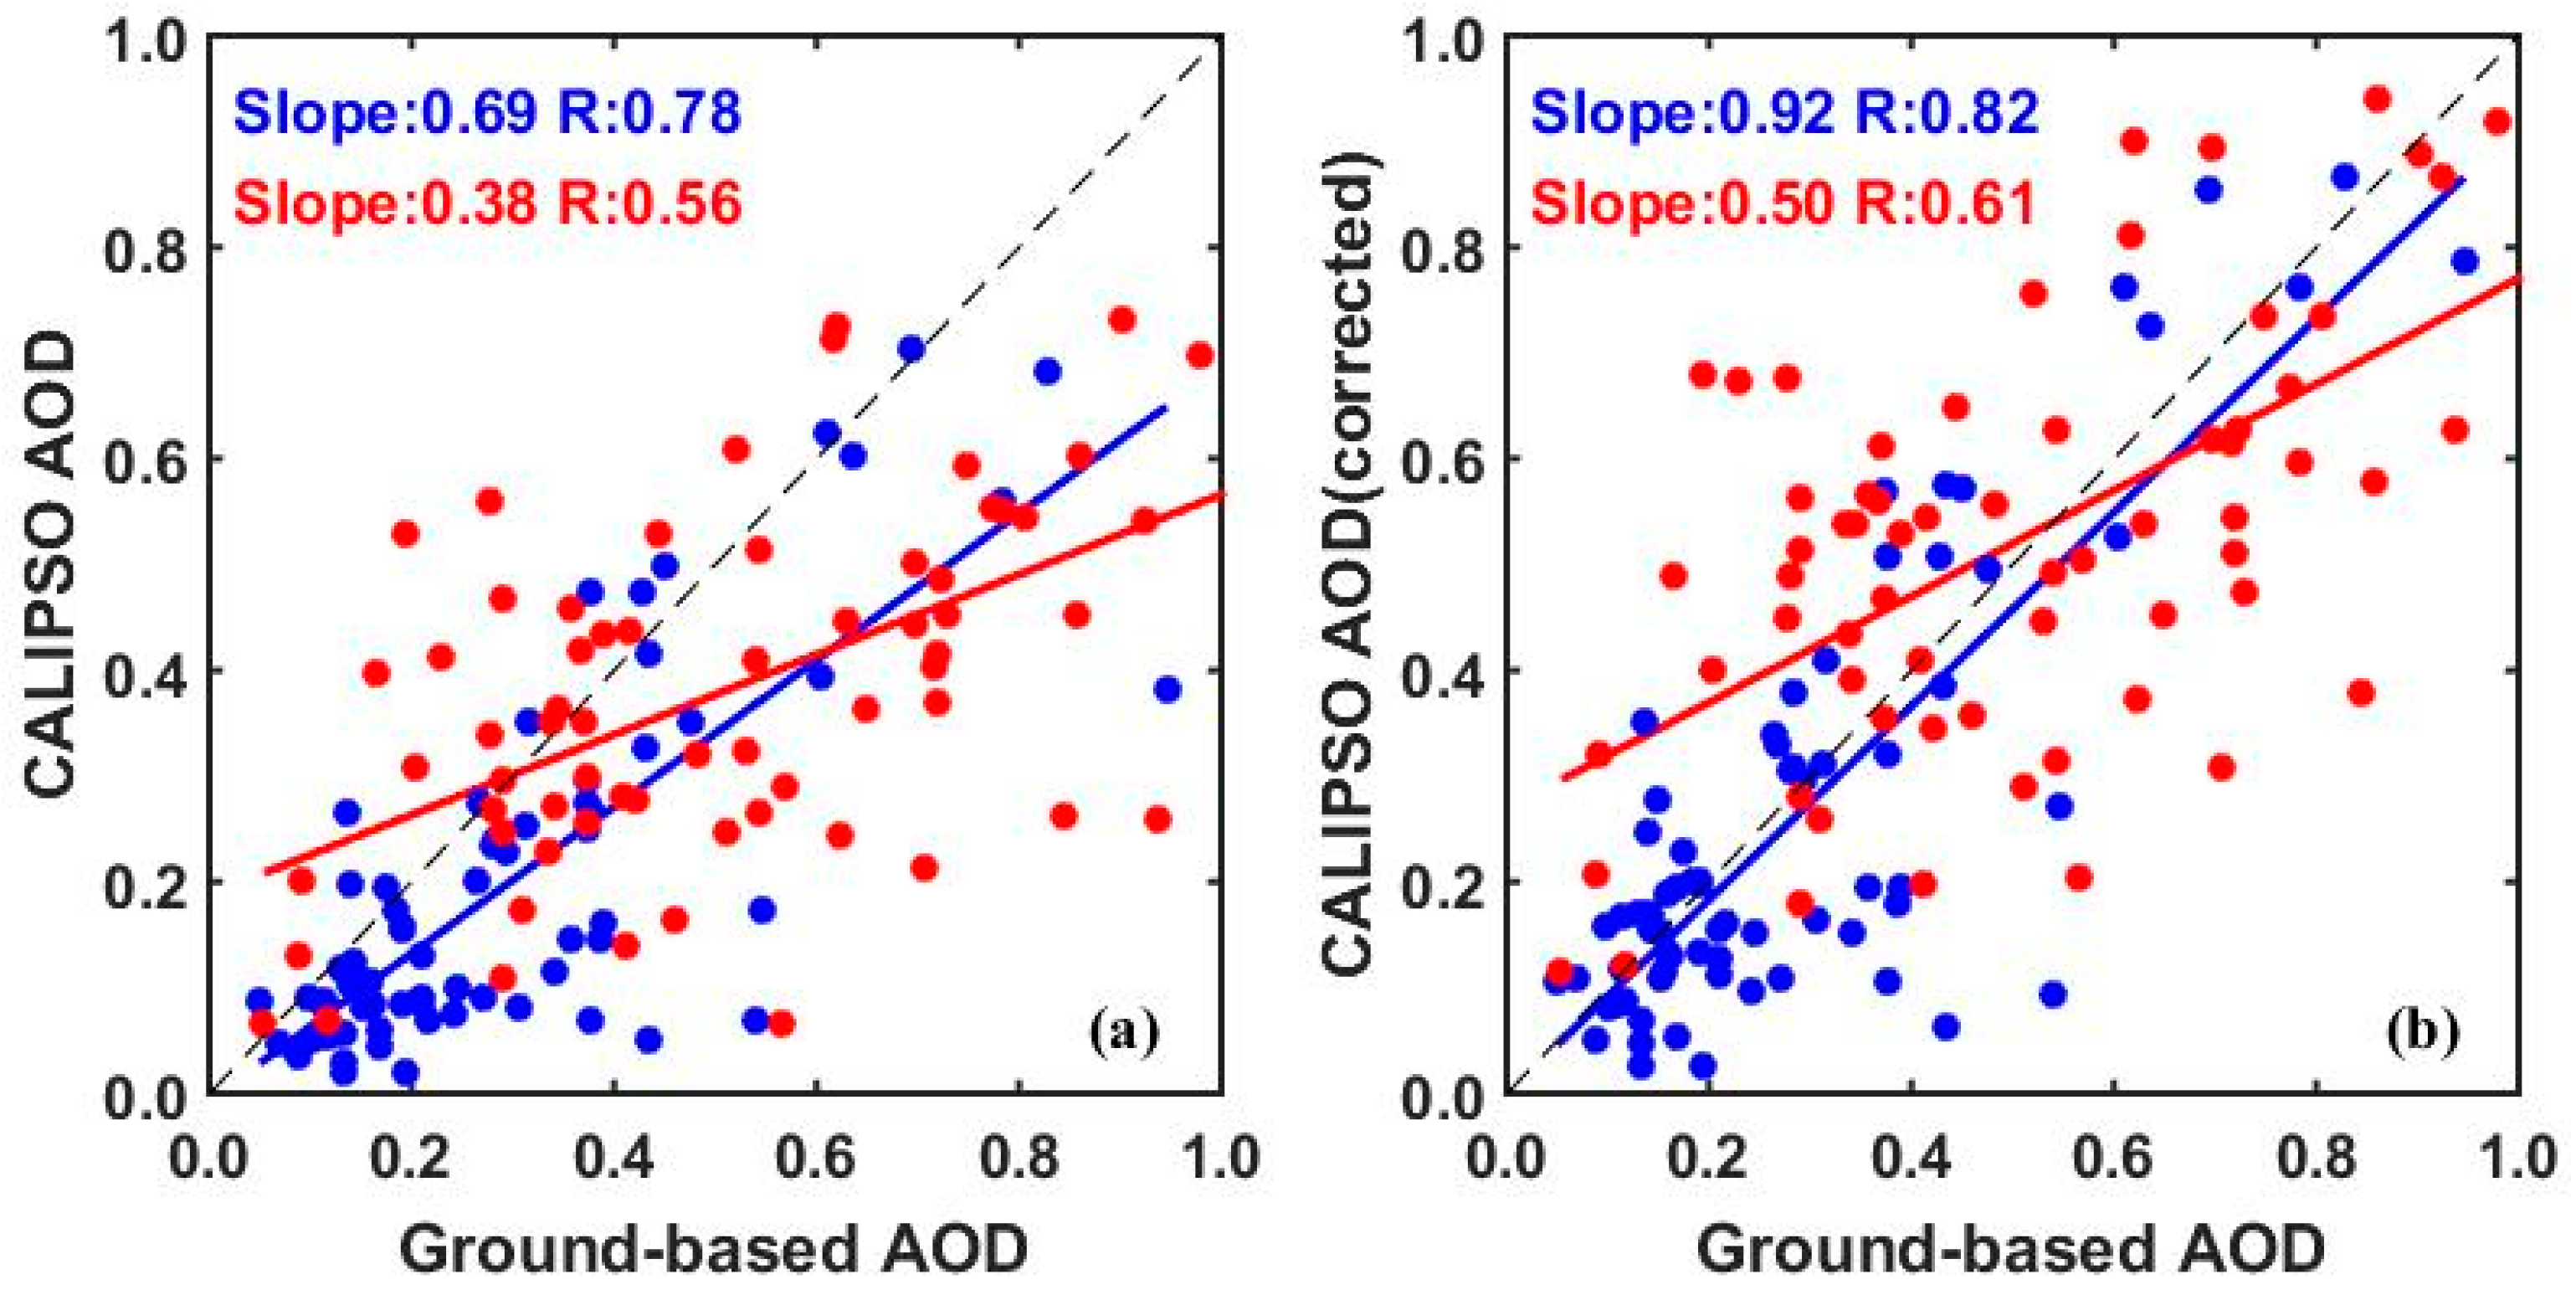
4.1. Intercomparisons of the CALIPSO AOD, CALIPSO AOD (Corrected) and Ground-Based AOD
4.2. Error Analysis
5. Discussion
6. Conclusions
Author Contributions
Funding
Data Availability Statement
Conflicts of Interest
Appendix A

| Station/Variable | LST | SP | RH | Tem | WS | Pre | AOD |
|---|---|---|---|---|---|---|---|
| LA | 18.94 | 1002.44 | 73.80 | 16.48 | 2.18 | 4.49 | 0.60 |
| TJ | 14.98 | 1016.61 | 52.30 | 13.74 | 1.56 | 1.49 | 0.55 |
| HK | 25.70 | 1005.38 | 71.81 | 23.13 | 2.23 | 5.38 | 0.45 |
| XH | 14.32 | 1015.57 | 55.87 | 12.86 | 1.56 | 1.52 | 0.62 |
| CUMT | 15.81 | 1011.93 | 65.32 | 15.05 | 1.87 | 2.21 | 0.68 |
| BJ | 13.79 | 1011.05 | 56.03 | 12.84 | 1.74 | 1.76 | 0.62 |
| TH | 18.79 | 1016.24 | 70.91 | 16.84 | 2.44 | 3.56 | 0.74 |
| Terminology | Definitions |
|---|---|
| CALIPSO | Cloud-Aerosol Lidar and Infrared Pathfinder Satellite Observations |
| AEC | Aerosol extinction coefficient |
| PBL | Planetary boundary layer |
| AOD | Aerosol optical depth |
| CALIOP | Cloud-Aerosol Lidar with Orthogonal Polarization |
| AERONET | Aerosol Robotic Network |
| CARSNET | China Aerosol Remote Sensing Network |
| BTH | Beijing–Tianjin–Hebei |
| YRD | Yangtze River Delta |
| PRD | Pearl River Delta |
| VFM | Vertical Feature Mask |
| CIMEL | Cimel Electronique Company, France |
| RH | Relative humidity |
| AVD | Atmospheric volume description |
| SNR | Signal-to-noise ratio |
| LST | Land surface temperature |
| SP | Surface press |
| Tem | Temperature |
| WS | Wind speed |
| Pre | Precipitation |
References
- Cohen, A.J.; Brauer, M.; Burnett, R.; Anderson, H.R.; Frostad, J.; Estep, K.; Balakrishnan, K.; Brunekreef, B.; Dandona, L.; Dandona, R.; et al. Estimates and 25-year trends of the global burden of disease attributable to ambient air pollution: An analysis of data from the Global Burden of Diseases Study 2015. Lancet 2017, 389, 1907–1918. [Google Scholar] [CrossRef] [Green Version]
- Yim, S.H.L.; Barrett, S.R.H. Public health impacts of combustion emissions in the United Kingdom. Environ. Sci. Technol. 2012, 46, 4291–4296. [Google Scholar] [CrossRef] [PubMed]
- Wang, H.; Gao, Z.; Ren, J.; Liu, Y.; Chang, L.T.C.; Cheung, K.; Feng, Y.; Li, Y. An urban-rural and sex differences in cancer incidence and mortality and the relationship with PM2.5 exposure: An ecological study in the southeastern side of Hu line. Chemosphere 2019, 216, 766–773. [Google Scholar] [CrossRef]
- Ackerman, A.S.; Toon, O.B.; Stevens, D.E.; Heymsfield, A.J.; Ramanathan, V.; Welton, E.J. Reduction of tropical cloudiness by soot. Science 2000, 288, 1042–1047. [Google Scholar] [CrossRef] [Green Version]
- Guo, J.; Jiang, J.H.; Liu, H.; Jiang, M.; He, J.; Min, M.; Rosenfeld, D.; Li, Z.; Zhai, P.; Chen, D.; et al. Aerosol-Induced changes in the vertical structure of precipitation: A perspective of TRMM precipitation radar. Atmos. Chem. Phys. 2018, 18, 13329–13343. [Google Scholar] [CrossRef] [Green Version]
- Lee, S.-S.; Ming, Y.; Qian, Y.; Xu, X.; Zhao, C.; Takemura, T.; Zhang, F.; Rosenfeld, D.; Li, Z.; Wang, K.; et al. Aerosol and monsoon climate interactions over Asia. Rev. Geophys. 2016, 54, 866–929. [Google Scholar]
- Liu, H.; Wu, Y.; Wang, F.; Xie, T.; Lou, M.; Huang, J.; Guo, J.; Zhaxi, Y.; Yung, Y.L.; Jiang, J.H.; et al. Three-dimensional structure of aerosol in China: A perspective from multi-satellite observations. Atmos. Res. 2016, 178, 580–589. [Google Scholar]
- Rosenfeld, D. Suppression of rain and snow by urban and industrial air pollution. Science 2000, 287, 1793–1796. [Google Scholar] [CrossRef]
- Huang, J.; Guo, J.; Wang, F.; Liu, Z.; Jeong, M.J.; Yu, H.; Zhang, Z. CALIPSO inferred most probable heights of global dust and smoke layers. J. Geophys. Res. 2015, 120, 5085–5100. [Google Scholar] [CrossRef]
- Liu, D.; Wang, Z.; Liu, Z.; Winker, D.; Trepte, C. A height resolved global view of dust aerosols from the first year CALIPSO lidar measurements. J. Geophys. Res. Atmos. 2008, 113. [Google Scholar] [CrossRef]
- Qin, K.; Teng, J.; Hu, M.; Yuan, L.; Wu, L.; Lang, H.; Xiao, X.; Sheng, S.; Letu, H.; Wong, M.S. Trans-boundary aerosol transport during a winter haze episode in China revealed by ground-based Lidar and CALIPSO satellite. Atmos. Environ. 2016, 141, 20–29. [Google Scholar] [CrossRef] [Green Version]
- Takemura, T.; Okamoto, H.; Maruyama, Y.; Numaguti, A.; Higurashi, A.; Nakajima, T. Global three-dimensional simulation of aerosol optical thickness distribution of various origins. J. Geophys. Res. Atmos. 2000, 105, 17853–17873. [Google Scholar] [CrossRef]
- Miao, Y.; Guo, J.; Liu, S.; Liu, H.; Zhang, G.; Yan, Y.; He, J. Relay transport of aerosols to Beijing-Tianjin-Hebei region by multi-scale atmospheric circulations. Atmos. Environ. 2017, 165, 35–45. [Google Scholar] [CrossRef]
- Randles, C.A.; da Silva, A.M.; Buchard, V.; Colarco, P.R.; Darmenov, A.; Govindaraju, R.; Smirnov, A.; Holben, B.; Ferrare, R.; Hair, J.; et al. The MERRA-2 aerosol reanalysis, 1980 onward. Part I: System description and data assimilation evaluation. J. Clim. 2017, 30, 6823–6850. [Google Scholar] [CrossRef] [PubMed]
- Wainker, D.M.; Tackett, J.L.; Getzewich, B.J.; Liu, Z.; Vaughan, M.A.; Rogers, R.R. The global 3-D distribution of tropospheric aerosols as characterized by CALIOP. Atmos. Chem. Phys. 2013, 13, 3345–3361. [Google Scholar] [CrossRef] [Green Version]
- Su, T.; Li, J.; Li, C.; Xiang, P.; Lau, A.K.H.; Guo, J.; Yang, D.; Miao, Y. An intercomparison of long-term planetary boundary layer heights retrieved from CALIPSO, ground-based lidar, and radiosonde measurements over Hong Kong. J. Geophys. Res. 2017, 122, 3929–3943. [Google Scholar] [CrossRef]
- Samset, B.H.; Myhre, G.; Schulz, M.; Balkanski, Y.; Bauer, S.; Berntsen, T.K.; Bian, H.; Bellouin, N.; Diehl, T.; Easter, R.C.; et al. Black carbon vertical profiles strongly affect its radiative forcing uncertainty. Atmos. Chem. Phys. 2013, 13, 2423–2434. [Google Scholar] [CrossRef] [Green Version]
- Young, S.A.; Vaughan, M.A. The retrieval of profiles of particulate extinction from cloud-aerosol lidar infrared pathfinder satellite observations (CALIPSO) data: Algorithm description. J. Atmos. Ocean. Technol. 2009, 26, 1105–1119. [Google Scholar] [CrossRef]
- Kacenelenbogen, M.; Vaughan, M.A.; Redemann, J.; Hoff, R.M.; Rogers, R.R.; Ferrare, R.A.; Russell, P.B.; Hostetler, C.A.; Hair, J.W.; Holben, B.N. An accuracy assessment of the CALIOP/CALIPSO version 2/version 3 daytime aerosol extinction product based on a detailed multi-sensor, multi-platform case study. Atmos. Chem. Phys. 2011, 11, 3981–4000. [Google Scholar] [CrossRef] [Green Version]
- Omar, A.; Vaughan, M.A.; Young, S.A.; Hunt, W.H.; Liu, Z.; Powell, K.A.; Winker, D.M.; Hu, Y. Overview of the CALIPSO Mission and CALIOP Data Processing Algorithms. J. Atmos. Ocean. Technol. 2009, 26, 2310–2323. [Google Scholar]
- Vaughan, M.A.; Powell, K.A.; Kuehn, R.E.; Young, S.A.; Winker, D.M.; Hostetler, C.A.; Hunt, W.H.; Liu, Z.; Mcgill, M.J.; Getzewich, B.J. Fully automated detection of cloud and aerosol layers in the CALIPSO lidar measurements. J. Atmos. Ocean. Technol. 2009, 26, 2034–2050. [Google Scholar] [CrossRef]
- Burton, S.P.; Rogers, R.R.; Hostetler, C.A.; Vaughan, M.A.; Hair, J.W.; Omar, A.H.; Ferrare, R.A. Aerosol classification from airborne HSRL and comparisons with the CALIPSO vertical feature mask. Atmos. Meas. Tech. 2013, 6, 1397–1412. [Google Scholar] [CrossRef] [Green Version]
- Oo, M.; Holz, R. Improving the CALIOP aerosol optical depth using combined MODIS-CALIOP observations and CALIOP integrated attenuated total color ratio. J. Geophys. Res. Atmos. 2011, 116. [Google Scholar] [CrossRef]
- Pappalardo, G.; Wandinger, U.; Mona, L.; Hiebsch, A.; Mattis, I.; Amodeo, A.; Ansmann, A.; Seifert, P.; Linné, H.; Apituley, A.; et al. EARLINET correlative measurements for CALIPSO: First intercomparison results. J. Geophys. Res. Atmos. 2010, 115. [Google Scholar] [CrossRef] [Green Version]
- Redemann, J.; Vaughan, M.A.; Zhang, Q.; Shinozuka, Y.; Russell, P.B.; Livingston, J.M.; Kacenelenbogen, M.; Remer, L.A. The comparison of MODIS-Aqua (C5) and CALIOP (V2 & V3) aerosol optical depth. Atmos. Chem. Phys. 2012, 12, 3025–3043. [Google Scholar]
- Schuster, G.L.; Vaughan, M.; MacDonnell, D.; Su, W.; Winker, D.; Dubovik, O.; Lapyonok, T.; Trepte, C. Comparison of CALIPSO aerosol optical depth retrievals to AERONET measurements, and a climatology for the lidar ratio of dust. Atmos. Chem. Phys. 2012, 12, 7431–7452. [Google Scholar] [CrossRef] [Green Version]
- Omar, A.H.; Kar, J.; Powell, K.A.; Winker, D.M.; Vaughan, M.A.; Trepte, C.R.; Liu, Z.; Tackett, J.L.; Giles, D.M. CALIOP and AERONET aerosol optical depth comparisons: One size fits none. J. Geophys. Res. Atmos. 2013, 118, 4748–4766. [Google Scholar] [CrossRef]
- Kim, M.H.; Kim, S.W.; Yoon, S.C.; Omar, A.H. Comparison of aerosol optical depth between CALIOP and MODIS-Aqua for CALIOP aerosol subtypes over the ocean. J. Geophys. Res. Atmos. 2013, 118, 13241–13252. [Google Scholar] [CrossRef]
- Vaughan, M.A.; Kuehn, R.E.; Tackett, J.L.; Rogers, R.R.; Liu, Z.; Omar, A.; Getzewich, B.J.; Powell, K.A.; Hu, Y.; Young, S.A.; et al. Strategies for Improved CALIPSO Aerosol Optical Depth Estimates. In Proceedings of the 25th International Laser Radar Conference, Saint Petersburg, Russia, 5–9 July 2010. [Google Scholar]
- Huang, L.; Jiang, J.H.; Tackett, J.L.; Su, H.; Fu, R. Seasonal and diurnal variations of aerosol extinction profile and type distribution from CALIPSO 5-year observations. J. Geophys. Res. Atmos. 2013, 118, 4572–4596. [Google Scholar] [CrossRef]
- Gui, K.; Che, H.; Wang, Y.; Wang, H.; Zhang, L.; Sun, T.; Zhang, X.; Zheng, Y. Satellite-derived PM2.5 concentration trends over Eastern China from 1998 to 2016: Relationships to emissions and meteorological parameters. Environ. Pollut. 2019, 247, 1125–1133. [Google Scholar] [CrossRef] [PubMed]
- Li, Z.; Guo, J.; Ding, A.; Liao, H.; Liu, J.; Sun, Y.; Wang, T.; Xue, H.; Zhang, H.; Zhu, B. Aerosol and boundary-layer interactions and impact on air quality. Natl. Sci. Rev. 2017, 4, 810–833. [Google Scholar] [CrossRef]
- Yang, Y.; Zheng, X.; Gao, Z.; Wang, H.; Wang, T.; Li, Y.; Lau, G.N.C.; Yim, S.H.L. Long-Term Trends of Persistent Synoptic Circulation Events in Planetary Boundary Layer and Their Relationships with Haze Pollution in Winter Half Year Over Eastern China. J. Geophys. Res. Atmos. 2018, 123, 10991–11007. [Google Scholar] [CrossRef]
- Yin, Z.; Wang, H. Role of atmospheric circulations in haze pollution in December 2016. Atmos. Chem. Phys. 2017, 17, 11673–11681. [Google Scholar] [CrossRef] [Green Version]
- Zhang, R.H.; Li, Q.; Zhang, R.N. Meteorological conditions for the persistent severe fog and haze event over eastern China in January 2013. Sci. China Earth Sci. 2014, 57, 26–35. [Google Scholar]
- Schwartz, C.S.; Liu, Z.; Lin, H.C.; Cetola, J.D. Assimilating aerosol observations with a “hybrid” variational-ensemble data assimilation system. J. Geophys. Res. 2014, 119, 4043–4069. [Google Scholar] [CrossRef]
- Ma, C.; Wang, T.; Jiang, Z.; Wu, H.; Zhao, M.; Zhuang, B.; Li, S.; Xie, M.; Li, M.; Liu, J.; et al. Importance of Bias Correction in Data Assimilation of Multiple Observations Over Eastern China Using WRF-Chem/DART. J. Geophys. Res. Atmos. 2020, 125, e2019JD031465. [Google Scholar] [CrossRef]
- Wang, F.; Guo, J.; Zhang, J.; Huang, J.; Min, M.; Chen, T.; Liu, H.; Deng, M.; Li, X. Multi-sensor quantification of aerosol-induced variability in warm clouds over eastern China. Atmos. Environ. 2015, 113, 1–9. [Google Scholar] [CrossRef]
- Holben, B.N.; Eck, T.F.; Slutsker, I.; Tanré, D.; Buis, J.P.; Setzer, A.; Vermote, E.; Reagan, J.A.; Kaufman, Y.J.; Nakajima, T.; et al. AERONET—A federated instrument network and data archive for aerosol characterization. Remote Sens. Environ. 1998, 66, 1–16. [Google Scholar] [CrossRef]
- Che, H.; Zhang, X.; Chen, H.; Damiri, B.; Goloub, P.; Li, Z.; Zhang, X.; Wei, Y.; Zhou, H.; Dong, F.; et al. Instrument calibration and aerosol optical depth validation of the China aerosol remote sensing network. J. Geophys. Res. Atmos. 2009, 114. [Google Scholar] [CrossRef]
- Dubovik, O.; Smirnov, A.; Holben, B.N.; King, M.D.; Kaufman, Y.J.; Eck, T.F.; Slutsker, I. Accuracy assessments of aerosol optical properties retrieved from Aerosol Robotic Network (AERONET) Sun and sky radiance measurements. J. Geophys. Res. Atmos. 2000, 105, 9791–9806. [Google Scholar] [CrossRef] [Green Version]
- Jeong, M.J.; Li, Z.; Andrews, E.; Tsay, S.C. Effect of aerosol humidification on the column aerosol optical thickness over the Atmospheric Radiation Measurement Southern Great Plains site. J. Geophys. Res. Atmos. 2007, 112. [Google Scholar] [CrossRef]
- Kaufman, Y.J.; Rudich, Y.; Koren, I.; Rosenfeld, D.; Remer, L.A. The effect of smoke, dust, and pollution aerosol on shallow cloud development over the Atlantic Ocean. Proc. Natl. Acad. Sci. USA 2005, 102, 11207–11212. [Google Scholar] [CrossRef] [Green Version]
- Loeb, N.G.; Schuster, G.L. An observational study of the relationship between cloud, aerosol and meteorology in broken low-level cloud conditions. J. Geophys. Res. Atmos. 2008, 113. [Google Scholar] [CrossRef] [Green Version]
- Young, S.A.; Vaughan, M.A.; Kuehn, R.E.; Winker, D.M. The retrieval of profiles of particulate extinction from Cloud-Aerosol Lidar and Infrared Pathfinder Satellite Observations (CALIPSO) data: Uncertainty and error sensitivity analyses. J. Atmos. Ocean. Technol. 2013, 30, 395–428. [Google Scholar] [CrossRef]
- Hostetler, C.; Liu, Z.; Kittaka, C.; Getzewich, B.; Trepte, C.; Vaughan, M.; Winker, D.; Omar, A.; Kuehn, R.; Powell, K. The CALIPSO Lidar Cloud and Aerosol Discrimination: Version 2 Algorithm and Initial Assessment of Performance. J. Atmos. Ocean. Technol. 2009, 26, 1198–1213. [Google Scholar]
- Young, S.A.; Liu, Z.; Hu, Y.; Omar, A.H.; Hostetler, C.A.; Vaughan, M.A.; Winker, D.M.; Powell, K.A. Fully automated analysis of space-based lidar data: An overview of the CALIPSO retrieval algorithms and data products. In Proceedings of the Laser Radar Techniques for Atmospheric Sensing, Maspalomas, Gran Canaria, Spain, 14–16 September 2004; Volume 5575, p. 16. [Google Scholar]
- Kittaka, C.; Hu, Y.; Omar, A.H.; Ferrare, R.A.; Vaughan, M.A.; Winker, D.M.; Trepte, C.R.; Rogers, R.R.; Hostetler, C.A.; Lee, K.-P.; et al. The CALIPSO Automated Aerosol Classification and Lidar Ratio Selection Algorithm. J. Atmos. Ocean. Technol. 2009, 26, 1994–2014. [Google Scholar]
- Toth, T.D.; Zhang, J.; Reid, J.S.; Vaughan, M.A. A bulk-mass-modeling-based method for retrieving particulate matter pollution using CALIOP observations. Atmos. Meas. Tech. 2019, 12, 1739–1754. [Google Scholar] [CrossRef] [Green Version]
- Liu, M.; Lin, J.; Boersma, F.K.; Pinardi, G.; Wang, Y.; Chimot, J.; Wagner, T.; Xie, P.; Eskes, H.; Van Roozendael, M.; et al. Improved aerosol correction for OMI tropospheric NO2 retrieval over East Asia: Constraint from CALIOP aerosol vertical profile. Atmos. Meas. Tech. 2019, 12, 1–21. [Google Scholar] [CrossRef] [Green Version]
- Zhang, W.; Guo, J.; Miao, Y.; Liu, H.; Zhang, Y.; Li, Z.; Zhai, P. Planetary boundary layer height from CALIOP compared to radiosonde over China. Atmos. Chem. Phys. 2016, 16, 9951–9963. [Google Scholar] [CrossRef] [Green Version]
- Huang, J.; Hsu, N.C.; Tsay, S.C.; Jeong, M.J.; Holben, B.N.; Berkoff, T.A.; Welton, E.J. Susceptibility of aerosol optical thickness retrievals to thin cirrus contamination during the BASE-ASIA campaign. J. Geophys. Res. Atmos. 2011, 116. [Google Scholar] [CrossRef]
- Lee, J.; Hsu, N.C.; Bettenhausen, C.; Sayer, A.M. Retrieval of aerosol optical depth under thin cirrus from MODIS: Application to an ocean algorithm. J. Geophys. Res. Atmos. 2013, 118, 10111–10124. [Google Scholar] [CrossRef] [Green Version]
- Che, H.; Gui, K.; Xia, X.; Wang, Y.; Holben, B.N.; Goloub, P.; Cuevas-Agulló, E.; Wang, H.; Zheng, Y.; Zhao, H.; et al. Large contribution of meteorological factors to inter-decadal changes in regional aerosol optical depth. Atmos. Chem. Phys. 2019, 19, 10497–10523. [Google Scholar] [CrossRef] [Green Version]
- Remer, L.A.; Kaufman, Y.J.; Tanré, D.; Mattoo, S.; Chu, D.A.; Martins, J.V.; Li, R.R.; Ichoku, C.; Levy, R.C.; Kleidman, R.G.; et al. The MODIS aerosol algorithm, products, and validation. J. Atmos. Sci. 2005, 62, 947–973. [Google Scholar] [CrossRef] [Green Version]
- Bilbao, J.; Román, R.; Yousif, C.; Mateos, D.; de Miguel, A. Total ozone column, water vapour and aerosol effects on erythemal and global solar irradiance in Marsaxlokk, Malta. Atmos. Environ. 2014, 99, 508–518. [Google Scholar] [CrossRef]
- Guo, J.; Xia, F.; Zhang, Y.; Liu, H.; Li, J.; Lou, M.; He, J.; Yan, Y.; Wang, F.; Min, M.; et al. Impact of diurnal variability and meteorological factors on the PM2.5-AOD relationship: Implications for PM2.5 remote sensing. Environ. Pollut. 2017, 221, 94–104. [Google Scholar] [CrossRef] [Green Version]
- Gui, K.; Che, H.; Chen, Q.; Zeng, Z.; Zheng, Y.; Long, Q.; Sun, T.; Liu, X.; Wang, Y.; Liao, T.; et al. Water vapor variation and the effect of aerosols in China. Atmos. Environ. 2017, 165, 322–335. [Google Scholar] [CrossRef]
- Naeger, A.R.; Christopher, S.A.; Ferrare, R.; Liu, Z. A new technique using infrared satellite measurements to improve the accuracy of the calipso cloud-aerosol discrimination method. IEEE Trans. Geosci. Remote Sens. 2013, 51, 642–653. [Google Scholar] [CrossRef]
- Groß, S.; Esselborn, M.; Weinzierl, B.; Wirth, M.; Fix, A.; Petzold, A. Aerosol classification by airborne high spectral resolution lidar observations. Atmos. Chem. Phys. 2013, 13, 2487–2505. [Google Scholar] [CrossRef] [Green Version]
- Liew, S.C.; Welton, E.J.; Reid, J.S.; Campbell, J.R.; Giles, D.M.; Chew, B.N.; Salinas, S.V. Tropical cirrus cloud contamination in sun photometer data. Atmos. Environ. 2011, 45, 6724–6731. [Google Scholar]
- Liu, B.; Ma, Y.; Gong, W.; Zhang, M.; Wang, W.; Shi, Y. Comparison of AOD from CALIPSO, MODIS, and Sun Photometer under Different Conditions over Central China. Sci. Rep. 2018, 8, 10066. [Google Scholar] [CrossRef] [PubMed] [Green Version]
- Zhang, Z.; Zhang, M.; Bilal, M.; Su, B.; Zhang, C.; Guo, L. Comparison of MODIS- and CALIPSO-Derived Temporal Aerosol Optical Depth over Yellow River Basin (China) from 2007 to 2015. Earth Syst. Environ. 2020, 4, 535–550. [Google Scholar] [CrossRef]
- Nelli, N.; Fissehaye, S.; Francis, D.; Fonseca, R.; Temimi, M.; Weston, M.; Abida, R.; Nesterov, O. Characteristics of Atmospheric Aerosols Over the UAE Inferred From CALIPSO and Sun Photometer Aerosol Optical Depth. Earth Sp. Sci. 2021, 8, e2020EA001360. [Google Scholar] [CrossRef]
- Zhang, M.; Su, B.; Bilal, M.; Atique, L.; Usman, M.; Qiu, Z.; Ali, M.A.; Han, G. An investigation of vertically distributed aerosol optical properties over Pakistan using CALIPSO Satellite Data. Remote Sens. 2020, 12, 2183. [Google Scholar] [CrossRef]
- Yang, Y.; Zheng, Z.; Yim, S.Y.L.; Roth, M.; Ren, G.; Gao, Z.; Wang, T.; Li, Q.; Shi, C.; Ning, G.; et al. PM2.5 Pollution Modulates Wintertime Urban Heat Island Intensity in the Beijing-Tianjin-Hebei Megalopolis, China. Geophys. Res. Lett. 2020, 47, e2019GL084288. [Google Scholar] [CrossRef] [Green Version]
- Zeng, Z.; Gui, K.; Wang, Z.; Luo, M.; Geng, H.; Ge, E.; An, J.; Song, X.; Ning, G.; Zhai, S.; et al. Estimating hourly surface PM2.5 concentrations across China from high-density meteorological observations by machine learning. Atmos. Res. 2021, 254, 105516. [Google Scholar] [CrossRef]
- Yang, Y.; Fan, S.; Wang, L.; Gao, Z.; Zhang, Y.; Zou, H.; Miao, S.; Li, Y.; Huang, M.; Yim, S.H.L.; et al. Diurnal evolution of the wintertime boundary layer in urban beijing, china: Insights from doppler lidar and a 325-m meteorological tower. Remote Sens. 2020, 12, 3935. [Google Scholar] [CrossRef]
- Chen, X.; de Leeuw, G.; Arola, A.; Liu, S.; Liu, Y.; Li, Z.; Zhang, K. Joint retrieval of the aerosol fine mode fraction and optical depth using MODIS spectral reflectance over northern and eastern China: Artificial neural network method. Remote Sens. Environ. 2020, 249, 112006. [Google Scholar] [CrossRef]
- Che, H.; Xia, X.; Zhao, H.; Dubovik, O.; Holben, B.N.; Goloub, P.; Cuevas-Agulló, E.; Estelles, V.; Wang, Y.; Zhu, J.; et al. Spatial distribution of aerosol microphysical and optical properties and direct radiative effect from the China Aerosol Remote Sensing Network. Atmos. Chem. Phys. 2019, 19, 11843–11864. [Google Scholar] [CrossRef] [Green Version]
| Station/Region | Lat. (°) | Lon. (°) | Alt. (m) | Site Type | Time Period | Min Distance (km) | Crossing Time (UTC) | CALIPSO Orbits | Matched Samples | Scenario Types |
|---|---|---|---|---|---|---|---|---|---|---|
| Lin’an (LA) */YRD | 30.30 | 119.73 | 138.6 | Forest | 2007, 2010 | 4 | 5:26 | 43 | 6 | 2 |
| Tianjin (TJ) */BTH | 39.10 | 117.17 | 3.3 | Urban | 2010 | 5 | 5:30 | 21 | 10 | 2 |
| Hong_Kong_PolyU (HK)/PRD | 22.30 | 114.18 | 30.0 | Urban | 2007.01–2014.01 | 23 | ~5:55 | 153 | 27 | 2 |
| Xianghe (XH) /BTH | 39.75 | 116.96 | 36.0 | Urban | 2007.01–2015.06 | 3 | ~5:30 | 173 | 63 | 2 |
| Xuzhou-CUMT (CUMT) /YRD | 34.22 | 117.14 | 59.0 | Urban | 2013.06–2015.12 | 6 | ~5:33 | 49 | 11 | 2 |
| Beijing (BJ)/BTH | 39.98 | 116.38 | 92.0 | Urban | 2007.01–2015.12 | 43 | ~5:29 | 181 | 60 | 3 |
| Taihu (TH) /YRD | 31.42 | 120.22 | 20.0 | Lake | 2007.01–2015.12 | 60 or 70 | ~5:20 or ~5:27 | 232 | 31 | 1 |
| Site | CALIPSO AOD | CALIPSO AOD (Corrected) | Difference | |||||
|---|---|---|---|---|---|---|---|---|
| Fitting Equation | R | P | Fitting Equation | R | P | Slope | R | |
| LA | y = 0.67x − 0.03 | 0.97 | 0.00 | y = 0.90x − 0.01 | 0.99 | 0.00 | 0.23 | 0.02 |
| TJ | y = 0.70x + 0.01 | 0.74 | 0.04 | y = 1.04x − 0.03 | 0.82 | 0.01 | 0.34 | 0.08 |
| HK | y = 0.34x + 0.16 | 0.62 | 0.00 | y = 0.75x + 0.16 | 0.66 | 0.00 | 0.41 | 0.04 |
| XH | y = 0.68x + 0.02 | 0.82 | 0.00 | y = 0.87x + 0.06 | 0.84 | 0.00 | 0.19 | 0.02 |
| CUMT | y = 0.46x + 0.14 | 0.88 | 0.00 | y = 0.71x + 0.12 | 0.95 | 0.00 | 0.25 | 0.07 |
| BJ | y = 0.64x + 0.03 | 0.71 | 0.00 | y = 0.82x + 0.07 | 0.73 | 0.00 | 0.18 | 0.02 |
| TH | y = 0.29x + 0.27 | 0.35 | 0.06 | y = 0.44x + 0.31 | 0.43 | 0.02 | 0.15 | 0.08 |
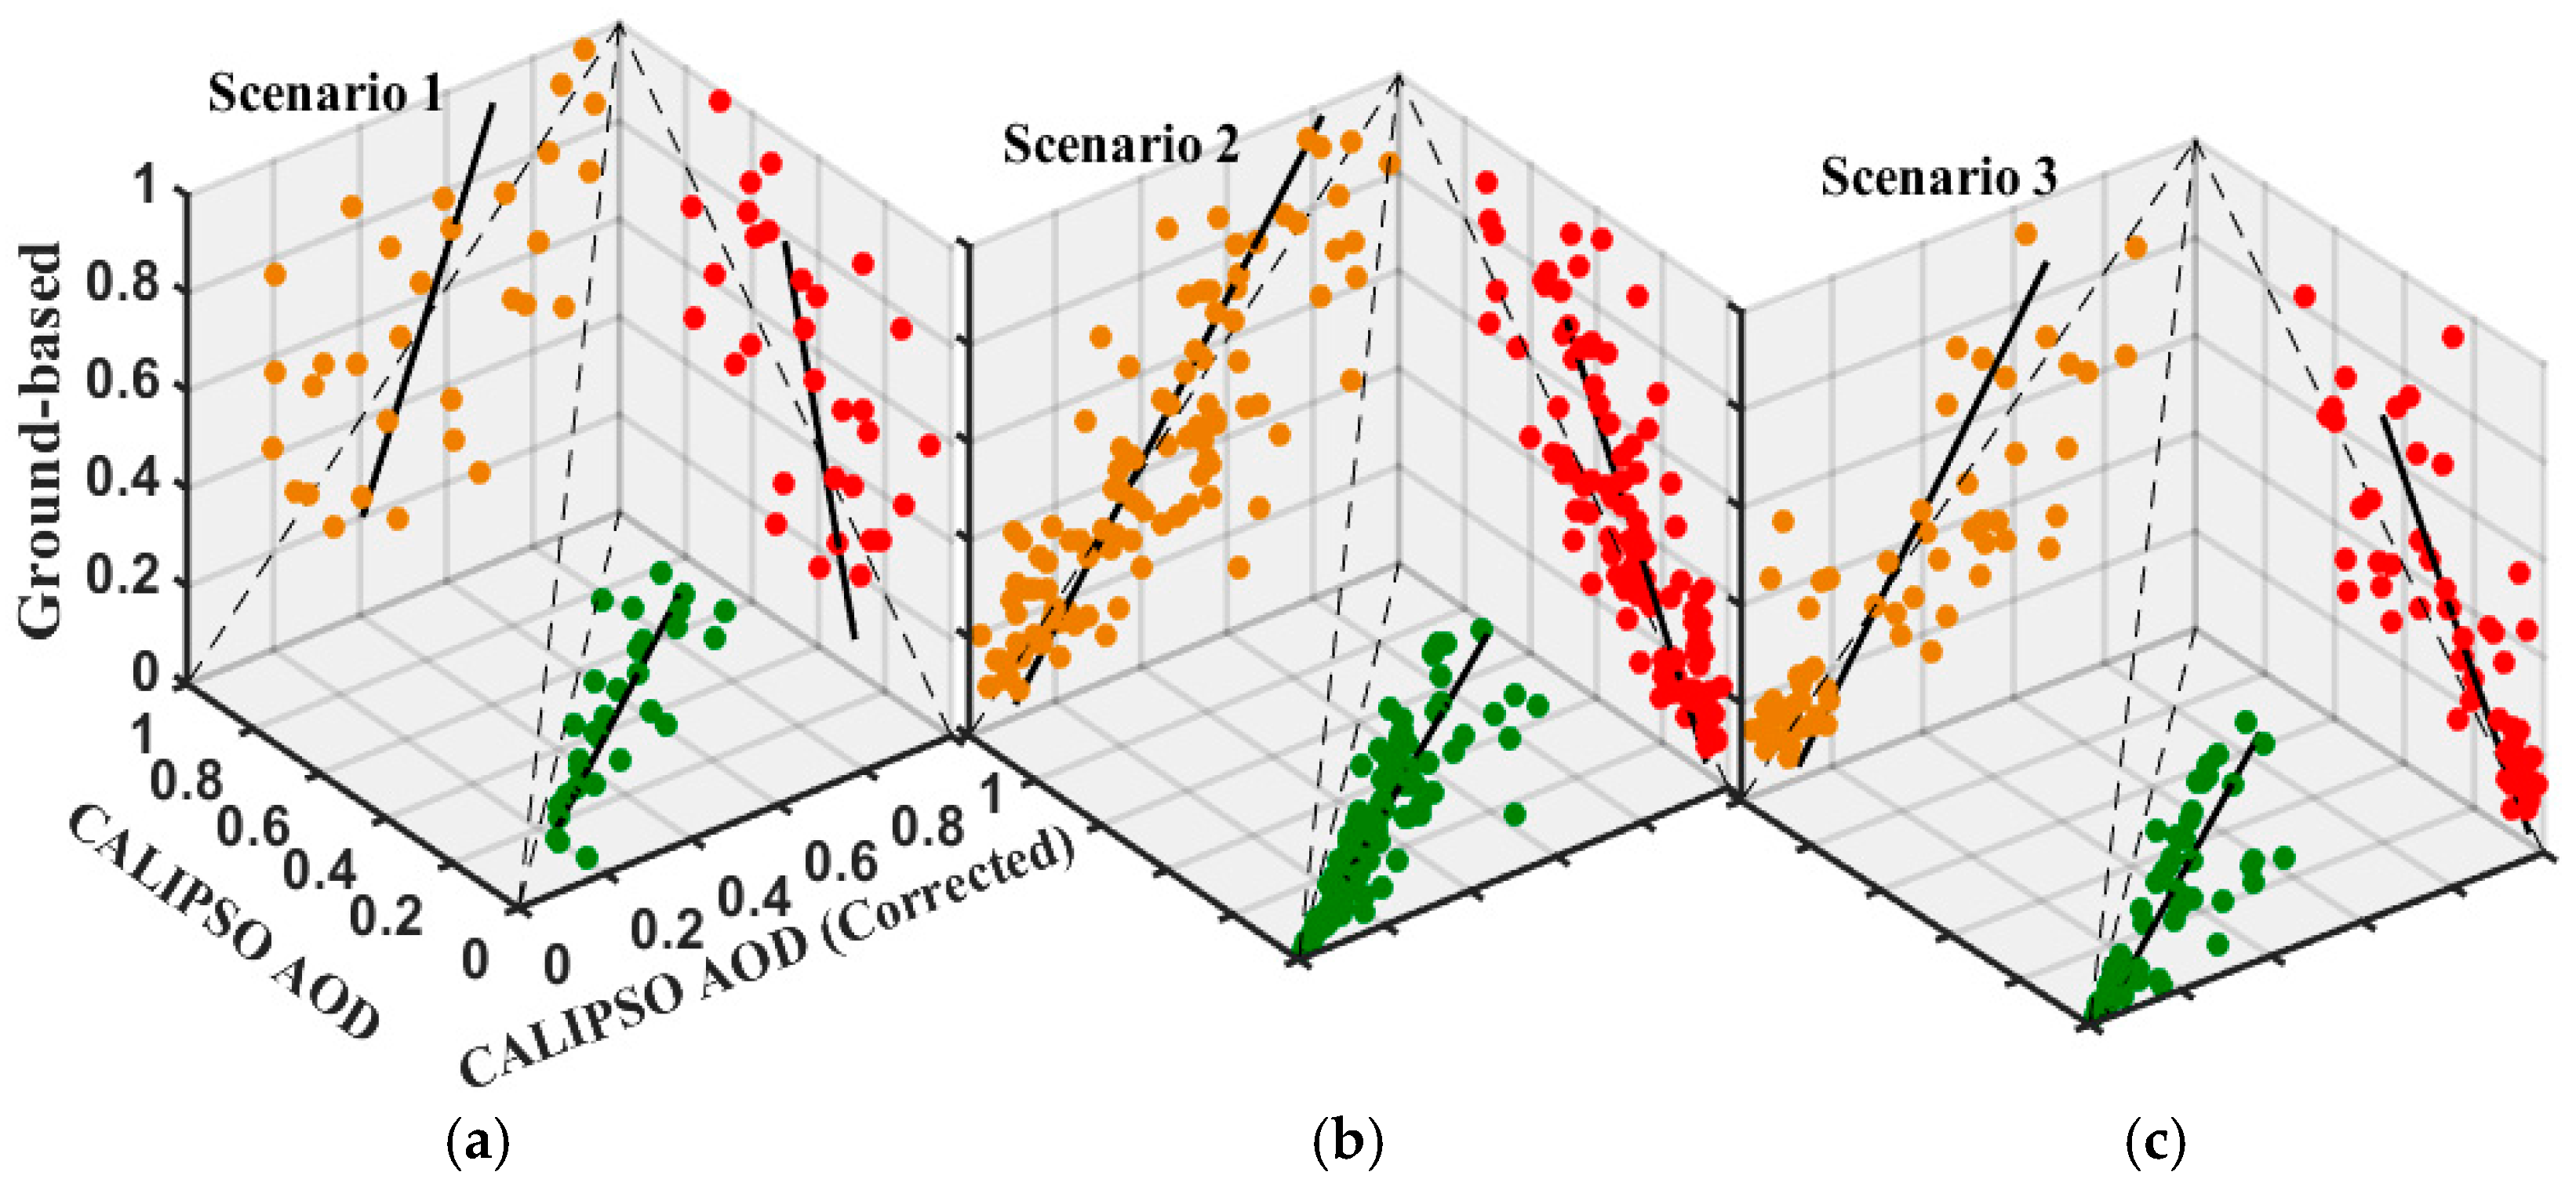
| Scenario | Ground-Based AOD vs. CALIPSO AOD | Ground-Based AOD vs. CALIPSO AOD (Corrected) | ||
|---|---|---|---|---|
| Slope | R | Slope | R | |
| 1 | 0.29 | 0.35 | 0.44 | 0.43 |
| 2 | 0.75 | 0.76 | 0.97 | 0.77 |
| 3 | 0.64 | 0.71 | 0.65 | 0.73 |
Publisher’s Note: MDPI stays neutral with regard to jurisdictional claims in published maps and institutional affiliations. |
© 2021 by the authors. Licensee MDPI, Basel, Switzerland. This article is an open access article distributed under the terms and conditions of the Creative Commons Attribution (CC BY) license (https://creativecommons.org/licenses/by/4.0/).
Share and Cite
Zeng, Z.; Wang, Z.; Zhang, B. An Adjustment Approach for Aerosol Optical Depth Inferred from CALIPSO. Remote Sens. 2021, 13, 3085. https://doi.org/10.3390/rs13163085
Zeng Z, Wang Z, Zhang B. An Adjustment Approach for Aerosol Optical Depth Inferred from CALIPSO. Remote Sensing. 2021; 13(16):3085. https://doi.org/10.3390/rs13163085
Chicago/Turabian StyleZeng, Zhaoliang, Zemin Wang, and Baojun Zhang. 2021. "An Adjustment Approach for Aerosol Optical Depth Inferred from CALIPSO" Remote Sensing 13, no. 16: 3085. https://doi.org/10.3390/rs13163085
APA StyleZeng, Z., Wang, Z., & Zhang, B. (2021). An Adjustment Approach for Aerosol Optical Depth Inferred from CALIPSO. Remote Sensing, 13(16), 3085. https://doi.org/10.3390/rs13163085