Article

Polarimetric Model-Based Decomposition with Refined Double-Bounce Orientation Angle and Scattering Model

State Key Laboratory of Complex Electromagnetic Environment Effects on Electronics and Information System, National University of Defense Technology, Changsha 410073, China
*
Author to whom correspondence should be addressed.
Remote Sens. 2021, 13(16), 3070; https://doi.org/10.3390/rs13163070
Submission received: 9 July 2021 / Revised: 26 July 2021 / Accepted: 27 July 2021 / Published: 4 August 2021

Abstract

:
Oriented manmade targets can produce significant cross-polarization power. The scattering mechanism interpretation of them is still challenging. Within the framework of traditional scattering models, the scattering mechanism of oriented manmade targets will be interpreted as volume scattering. Recently, many advanced approaches have been proposed to mitigate the cross-polarization terms of the coherency matrix or distribute the power of cross-polarization to new scattering models, such as orientation angle compensation and multiple scattering components decomposition. Among these methods, the general model-based decomposition with physically meaningful double-bounce and odd-bounce scattering models has been proposed by modeling their independent orientation angles and becomes a widely accepted method. However, the two vital parameters of generalized scattering models: double- and odd-bounce orientation angles are derived through nonlinear optimization procedure. These generalized models lead to a heavy computation burden for parameters inversion. In this paper, we disclose the latent relationship between the double-bounce orientation angle and polarization orientation angle by data fitting experiments. With this simplified relationship, a refined double-bounce scattering model is established. Then, the odd-bounce orientation angle can be derived through equations. In this way, the nonlinear optimization procedure can be converted to a linear solution. A fast generalized model-based decomposition is developed thereafter. The main contribution of this work is to inherit the generalized models while speeding up the parameter calculation procedure. The comparison studies are carried out with X-band airborne PiSAR, L-band spaceborne ALOS-2, and C-band spaceborne Radarsat-2 PolSAR datasets. Compared with the state-of-the-art approaches, the proposed decomposition achieves improved interpretation performance from both visual and quantitative investigations especially for oriented built-up areas.

Graphical Abstract

1. Introduction

Polarimetric target decomposition is a powerful tool for polarimetric synthetic aperture radar (PolSAR) data interpretation and achieves plenty of successful applications [1,2]. Among them, model-based decompositions, which can provide physically meaningful solutions have been widely used. The Freeman–Durden decomposition is one of the pioneer model-based decompositions [3]. From then on, many advances have been reported to overcome the negative power issues, volume-scattering overestimation, and scattering mechanism ambiguity [4]. Non-negative eigenvalue constrain was proposed to avoid the occurrence of negative power [5,6]. Meanwhile, the power of the volume-scattering component is primarily determined by the cross-polarization term within the scope of conventional scattering models [3,7]. In this vein, the orientation angle compensation (OAC), which aims at cross-polarization element minimization has been incorporated in model-based decomposition to alleviate volume-scattering overestimation [8,9]. Moreover, double unitary transformations have been included to further enhance the performance of model-based decomposition [10]. In addition, generalized volume-scattering models have been proposed to better fit forest canopy [11,12,13,14,15], including generalized volume-scattering model (GVSM) [13], simplified Neumann volume-scattering model (SNVSM) [14], and generalized volume-scattering model with vegetation index (GRVI) [15].
In principle, manmade targets such as oriented double-bounce and odd-bounce structures can also produce obvious cross-polarization power. An X-Bragg model has been developed to account for the cross-polarization term induced by oriented surfaces with an empirical fashion [16]. Similarly, other empirical double-bounce and odd-bounce scattering models fitting the cross-polarization term have been proposed [17]. Furthermore, with independent modeling of fundamental scattering structures’ orientation angles, physically sounded double-bounce and odd-bounce scattering models have been developed [18]. They can fit both cross-polarization and off-diagonal terms. In this vein, improved performance has been achieved especially over oriented built-up areas. Note that these generalized models make parameters’ inversion as a nonlinear optimization procedure.
According to the analysis of general model-based decomposition [18], the trigonometric functions of DBOA and OBOA are the mainly nonlinear terms during the derivation procedure. To simplify and accelerate the solution procedure of general model-based decomposition, this work aims at developing a fast model-based decomposition by converting the nonlinear model inversion to a linear solution. Polarization orientation angle (POA) describes the rotation of a coherency matrix along the sightline of radar. POA can be derived through the minimization of the cross-polarization term [9] or circular polarization method [19]. The estimated POA is a mixture among all the scattering mechanisms for a coherency matrix. While, the double-bounce orientation angle (DBOA) and odd-bounce orientation angle (OBOA) are proposed to describe the rotation of double-bounce and odd-bounce scattering separately. Theoretically, the rotation of double- or odd-bounce scattering will contribute to the POA. As is shown in [18], the DBOA and POA is highly correlated with each other. Therefore, the core idea of transforming the nonlinear model inversion is to excavate the latent relationship between POA and DBOA and develop a refined double-bounce scattering model through derived DBOA. With the derived DBOA, the OBOA can be easily derived through equations. Therefore, a fast general model-based decomposition is established. Finally, the performances are validated with different PolSAR datasets and compared with the state-of-the-art approaches.
This paper is organized as follows: In Section 2, the relationship between DBOA and POA is analyzed, and the refined double-bounce orientation angle and scattering model is introduced. Section 3 describes the procedure of the proposed model-based decomposition method. Then, in Section 4, the visual and quantitative analyses of decomposition results performed on different PolSAR datasets are demonstrated. Finally, conclusions of this work are drawn in Section 5.

2. Refined Double-Bounce Orientation Angle and Scattering Model

Incorporated with double-bounce orientation angle, the traditional double-bounce scattering model can be transformed into a generalized double-bounce scattering model [18], which can be represented as:
T dbl = f d [ | α | 2 α 0 α * 1 0 0 0 0 ] T dbl ( θ dbl ) = f d [ | α | 2 α cos 2 θ dbl α sin 2 θ dbl α * cos 2 θ dbl cos 2 2 θ dbl 1 2 sin 4 θ dbl α * sin 2 θ dbl 1 2 sin 4 θ dbl sin 2 2 θ dbl ]
where f d is the double-bounce scattering power coefficient, and θ dbl is the DBOA of scattering model. α is the model parameter.
In this way, the cross-polarization and off-diagonal term induced by oriented double-bounce structures will be reallocated to double-bounce scattering instead of volume scattering. In the former research of [18], double-bounce orientation angle is derived through the nonlinear least square optimization procedure as an unknown parameter. Experimental studies show that the DBOA is highly correlated with POA. A number of researchers have been devoted to exploring the relationship between polarization orientation angle and orientation angles of different scatterings [20,21,22]. However, POA describes the rotation of a coherency matrix and is a mixture orientation effect of separate scattering mechanisms. The oriented buildings will induce orientation of single-bounce and triple-bounce scattering components more than double-bounce scattering. In other words, the theoretical relationship between POA and DBOA is difficult to describe, even without existence.
Based on aforementioned facts, this work aims at disclosing their underlying statistics relationships and establishing a robust analytical expression through data fitting experiments on different PolSAR datasets such as X-band PiSAR, C-band Radarsat-2, and L-band ALOS-2 over oriented manmade areas. The experiment results of X-band PiSAR are shown below as an example.
The X-band Pi-SAR 8708 data were acquired on 12 February 2005, over Sendai, Japan, containing buildings with different orientation angles. The resolution is 2 m in the ground range direction at the scene center and 1.5 m in the azimuth direction. The full scene size is 5 km × 5 km. Three representative regions with variously oriented buildings of X-band PiSAR data are shown in Figure 1. The error bar plots are shown in Figure 2 with a POA interval of 5 degrees. The red dots indicate the mean values while the error bars represent the standard deviation. From Figure 2, it is observed that the error bar plots are rotational symmetry. Additionally, the relationship between DBOA and POA can be divided into 5 zones, as follows:
  • Zone A: Negative linear zone ( 15 ° P O A 15 ° ). According to the statistical distribution of POA and DBOA, the major part of the pixels are included in this interval. As shown in Figure 1(c1,d1), the relationship between POA and DBOA is approximate negative linear. As illustrated in [9], when the dominant polarization angle of a built-up area | D P O A | 22.5 ° , the overestimation of volume-scattering power after deorientationis not significant. In other words, when the POA is small, POA mainly describes the rotation of double-bounce scattering structure and is similar with DBOA. After statistics analysis of the negative linear interval, the boundary is finally set as [ 15 ° , 15 ° ] ;
  • Zone B1 and B2: Transition zone ( 25 ° P O A 15 ° or 15 ° P O A 25 ° ). As the POA increases, the negative linear relationship no longer holds. The probability density of these intervals is relatively high and the variance is large. The relationship of these two intervals is indistinct. Therefore, we design a linear function to concatenate Zone C and Zone A;
  • Zone C1 and C2: Saturation zone ( 45 ° P O A < 25 ° or 25 ° P O A 45 ° ). While the POA varies within this range, the DBOA has the trend of reaching the extreme value of ±45°.
In this vein, a piecewise linear function is proposed to fit the relationship between POA and derived θ ^ dbl , as follows:
θ ^ dbl = { 45 °   ( 45 °   θ < 25 °   ) 6 POA + 105 ° ( 25 °   θ < 15 °   )   POA ( 15 °   θ 15 °   ) 6 POA 105 ° ( 15 ° < θ 25 °   ) 45 ° ( 25 ° < θ 45 °   )  
Then, by putting θ ^ dbl into the model (1), a refined double-bounce scattering model T ^ dbl ( θ ^ dbl ) is developed, where the θ ^ dbl can be easily derived from POA with (2).

3. Proposed Decomposition Method

3.1. Model-Based Decomposition Framework

This section proposes a model-based decomposition framework. The main scheme is to convert the nonlinear model inversion as a linear solution with the proposed model and nonnegative eigenvalue constrain. Combined with the refined double-bounce scattering model, the framework of the fast model-based decomposition is
T = T vol + T ^ dbl ( θ ^ dbl ) + T o d d ( θ o d d ) + T hel + T res
where T vol , T ^ dbl ( θ ^ dbl ) , T o d d ( θ o d d ) , T hel represent the coherency matrixes of volume, refined double-bounce, generalized odd-bounce, and helix scattering models, and f v , f d , f s , f c are their scattering power coefficients separately. θ ^ o d d is the odd-bounce orientation angle. T res is the residual matrix. To maintain the generality of the volume scattering, the proposed method adopts 4 different volume-scattering models as the volume-scattering lookup table, which is similar with [18]. The optimal volume-scattering model parameters are determined by the residual matrix minimization.
min T res 2
The proposed model-based decomposition is shown in Figure 3.

3.1.1. Volume-Scattering Model

Volume scattering from vegetation is often described as randomly oriented dipoles with different probability density functions (pdf) p ( θ ) with respect to orientation angle and particle anisotropy [18]. The coherency matrix of the general volume-scattering model can be expressed as
T vol = 0 2 π T ( θ ) p ( θ ) d θ = f v [ a d e d * b f e * f * c ]
where the elements a , b , c are real-valued, while d , e , f are complex-valued. The volume-scattering model lookup table is shown as follows.
In the classic Freeman–Durden three-component decomposition, the pdf is considered as a uniform distribution (known as random dipoles model). The corresponding coherency matrix is
T v o l 1 = 1 4 [ 2 0 0 0 1 0 0 0 1 ]
Another two usual pdfs are sine and cosine distribution, proposed in the Yamaguchi four-component decomposition method, and are usually named as horizontal and vertical dipoles models.
T v o l 2 = 1 30 [ 15 5 0 5 7 0 0 0 8 ] , T v o l 3 = 1 30 [ 15 5 0 5 7 0 0 0 8 ]
There are also another representative models such as the highest entropy model.
T v o l 4 = 1 3 [ 1 0 0 0 1 0 0 0 1 ]

3.1.2. Odd-Bounce Scattering Model

The odd-bounce scattering model adopted by the vast majority of decomposition methods is the Bragg surface model, which is generated from Freeman–Durden decomposition [3,7]. The coherency matrix of odd-bounce scattering is
T o d d   = f s [ 1 β * 0 β | β | 2 0 0 0 0 ]
where β is the parameter of odd-bounce scattering model. Modeled with the odd-bounce orientation angle θodd, the generalized odd-bounce scattering model can describe polarization basis rotation and the cross-polarization induced by the terrain slopes.
T o d d   ( θ o d d   ) = R 3 ( θ o d d   ) T o d d   R 3 H ( θ o d d   ) = f s [ 1 β * cos 2 θ o d d   β * sin 2 θ o d d   β cos 2 θ o d d   | β | 2 cos 2 2 θ o d d   1 2 | β | 2 sin 4 θ o d d   β sin 2 θ o d d   1 2 | β | 2 sin 4 θ o d d   | β | 2 sin 2 2 θ o d d   ]

3.1.3. Double-Bounce Scattering Model

The double-bounce scattering is modeled by scattering from a dihedral corner reflector, including ground-wall backscatters, where the reflector surfaces are made of different dielectric materials. The corresponding coherency matrix is
T dbl = f d [ | α | 2 α 0 α * 1 0 0 0 0 ]
where α is double-bounce scattering model coefficiet. α is complex valued, and | α | < 1 .
As illustrated in Section 2, the coherency matrix of refined double-bounce scattering model T d b l ( θ ^ d b l ) is shown as (1).

3.1.4. Helix Scattering Model

The helix scattering model is proposed by Yamaguchi et al. to fit the reflection asymmetry condition [7]. The coherency matrix is
T hel = 1 2 f c [ 0 0 0 0 1 ± j 0 j 1 ]

3.2. Model Parameters Inversion

Traditionally, the helix scattering power is calculated from the imaginary part of T 23 as P c = 2 | Im ( T 23 ) | . However, the matrix T = T P c T hel after helix scattering components derived cannot always guarantee positive semidefinite, and negative scattering power will be introduced. According to the nonnegative eigenvalue constrain [5,6,23], the maximum possible power of helix scattering can be derived through
det ( T λ H T hel ) = 0
where det ( ) denotes the matrix determinant. Note that there is only one solution as (13) is a one-order equation. Thus, the helix scattering power P c can be obtained as
P c = { 2 | Im ( T 23 ) | , λ H 2 | Im ( T 23 ) | λ H , otherwise
Similarly, volume-scattering power P v is determined with the eigen equation
det ( T λ T vol ) = 0
The volume-scattering power Pv can be derived as
P v = min { λ 1 , λ 2 , λ 3 }
where λ 1 , λ 2 and λ3 are the eigenvalues of (15).
After subtracting the helix and volume-scattering components, the remainder matrix T is the summation of double-bounce and odd-bounce components
T = T T vol T hel = T dbl ( θ ^ dbl ) + T o d d ( θ o d d )
Then, we can get the following equations:
T 11 = f d | α | 2 + f s T 22 = f d cos 2 2 θ ^ d b l + f s | β | 2 cos 2 2 θ o d d T 33 = f d sin 2 2 θ ^ d b l + f s | β | 2 sin 2 2 θ o d d Re ( T 12 ) = f d Re ( α ) cos 2 θ ^ d b l + f s Re ( β ) cos 2 θ o d d Re ( T 13 ) = f d Re ( α ) sin 2 θ ^ d b l f s Re ( β ) sin 2 θ o d d Im ( T 12 ) = f d Im ( α ) cos 2 θ ^ d b l f s Im ( β ) cos 2 θ o d d Im ( T 13 ) = f d Im ( α ) sin 2 θ ^ d b l + f s Im ( β ) sin 2 θ o d d Re ( T 23 ) = 1 2 f d sin 4 θ ^ d b l 1 2 f s | β | 2 sin 4 θ o d d
where T m n is the m row, and n column element of the matrix T .
According to (18), we can derive following equations.
f d = T 33 cos 2 2 θ o d d T 22 sin 2 2 θ o d d cos 2 2 θ o d d sin 2 2 θ ^ d b l sin 2 2 θ o d d cos 2 2 θ ^ d b l f s β 2 = T 22 sin 2 2 θ ^ d b l T 33 cos 2 2 θ ^ d b l cos 2 2 θ o d d sin 2 2 θ ^ d b l sin 2 2 θ o d d cos 2 2 θ ^ d b l f d Re ( α ) = Re ( T 12 ) sin 2 θ o d d + Re ( T 13 ) cos 2 θ o d d sin ( 2 θ o d d 2 θ ^ d b l ) f s Re ( β ) = Re ( T 12 ) sin 2 θ ^ d b l + Re ( T 13 ) cos 2 θ ^ d b l sin ( 2 θ ^ d b l 2 θ o d d ) f d Im ( α ) = Im ( T 12 ) sin 2 θ o d d + Im ( T 13 ) cos 2 θ o d d sin ( 2 θ o d d 2 θ ^ d b l ) f s Im ( β ) = Im ( T 12 ) sin 2 θ ^ d b l + Im ( T 13 ) cos 2 θ ^ d b l sin ( 2 θ o d d 2 θ ^ d b l )
Considering the equation
| f d Re ( α ) | 2 + | f d Im ( α ) | 2 f d + | f s Re ( β ) | 2 + | f s Im ( β ) | 2 f s β 2 = T 11
Substitute f d Re ( α ) , f d Im ( α ) , f s Re ( β ) , f s Im ( β ) , f d , f s β 2 with (20), we can obtain an equation in terms of tanθodd.
a 1 tan 4 θ o d d + a 2 tan 3 θ o d d + a 3 tan 2 θ o d d + a 4 tan θ o d d + a 5 = 0
where the coefficients a 1 ~ a 5 can be derived through equation transformation.
a 1 = ( A T 22 | T 12 | 2 + T 22 T 11 ) cos 2 2 θ ^ d b l a 2 = 2 [ Re ( T 12 ) Re ( T 13 ) + Im ( T 12 ) Im ( T 13 ) ] cos 2 2 θ ^ d b l T 22 T 11 sin 4 θ ^ d b l a 3 = ( T 11 T 22 + | T 12 | 2 A T 22 ) sin 2 2 θ ^ d b l ( T 11 T 33 + | T 13 | 2 + A T 33 ) cos 2 2 θ ^ d b l a 4 = 2 [ Re ( T 12 ) Re ( T 13 ) + Im ( T 12 ) Im ( T 13 ) ] sin 2 2 θ ^ d b l + T 33 T 11 sin 4 θ ^ d b l a 5 = ( A T 33 + | T 13 | 2 T 33 T 11 ) sin 2 2 θ ^ d b l
As θ ^ d b l is derived, the intermediate quantity A is defined as
A = | Re ( T 12 ) sin 2 θ ^ d b l + Re ( T 13 ) cos 2 θ ^ d b l | 2 T 22 sin 2 2 θ ^ d b l T 33 cos 2 2 θ ^ d b l + | Im ( T 12 ) sin 2 θ ^ d b l + Im ( T 13 ) cos 2 θ ^ d b l | 2 T 22 sin 2 2 θ ^ d b l T 33 cos 2 2 θ ^ d b l
Note that there are four solutions for θ o d d . The appropriate solution is available with the following constrains.
{ θ o d d [ π 4 , π 4 ] f d 0 , f s 0
The branch condition used in [8] is adopted to determine the dominance of double-bounce and odd-bounce scattering mechanisms, such as
C 0 = T 11 T 22 T 33 + P c
If C 0 > 0 , the odd-bounce scattering mechanism is dominant, and parameter α is set to zero. Otherwise, the double-bounce scattering mechanism is dominant, and parameter β is set to zero. Once α or β is decided, their scattering power coefficients fd and fs can be derived and their scattering power are obtained as follows.
P d = f d ( 1 + | α | 2 ) , P s = f s ( 1 + | β | 2 )

4. Experiments Results

For comparison studies, the state-of-the-art model-based decompositions including Yamaguchi four-component decomposition method with OAC [8] (Y4D), general four-component decomposition method with unitary transformation [10] (G4U), general model-based decomposition [18] (GMD), and decomposition based on polarimetric symmetry [23] (PSD) are utilized. Meanwhile, different platforms and frequency bands PolSAR datasets from PiSAR, Radarsat-2, and ALOS-2 are applied for demonstration. The SimiTest approach is adopted for speckle filtering [24].

4.1. Comparison with X-Band Pi-SAR Data

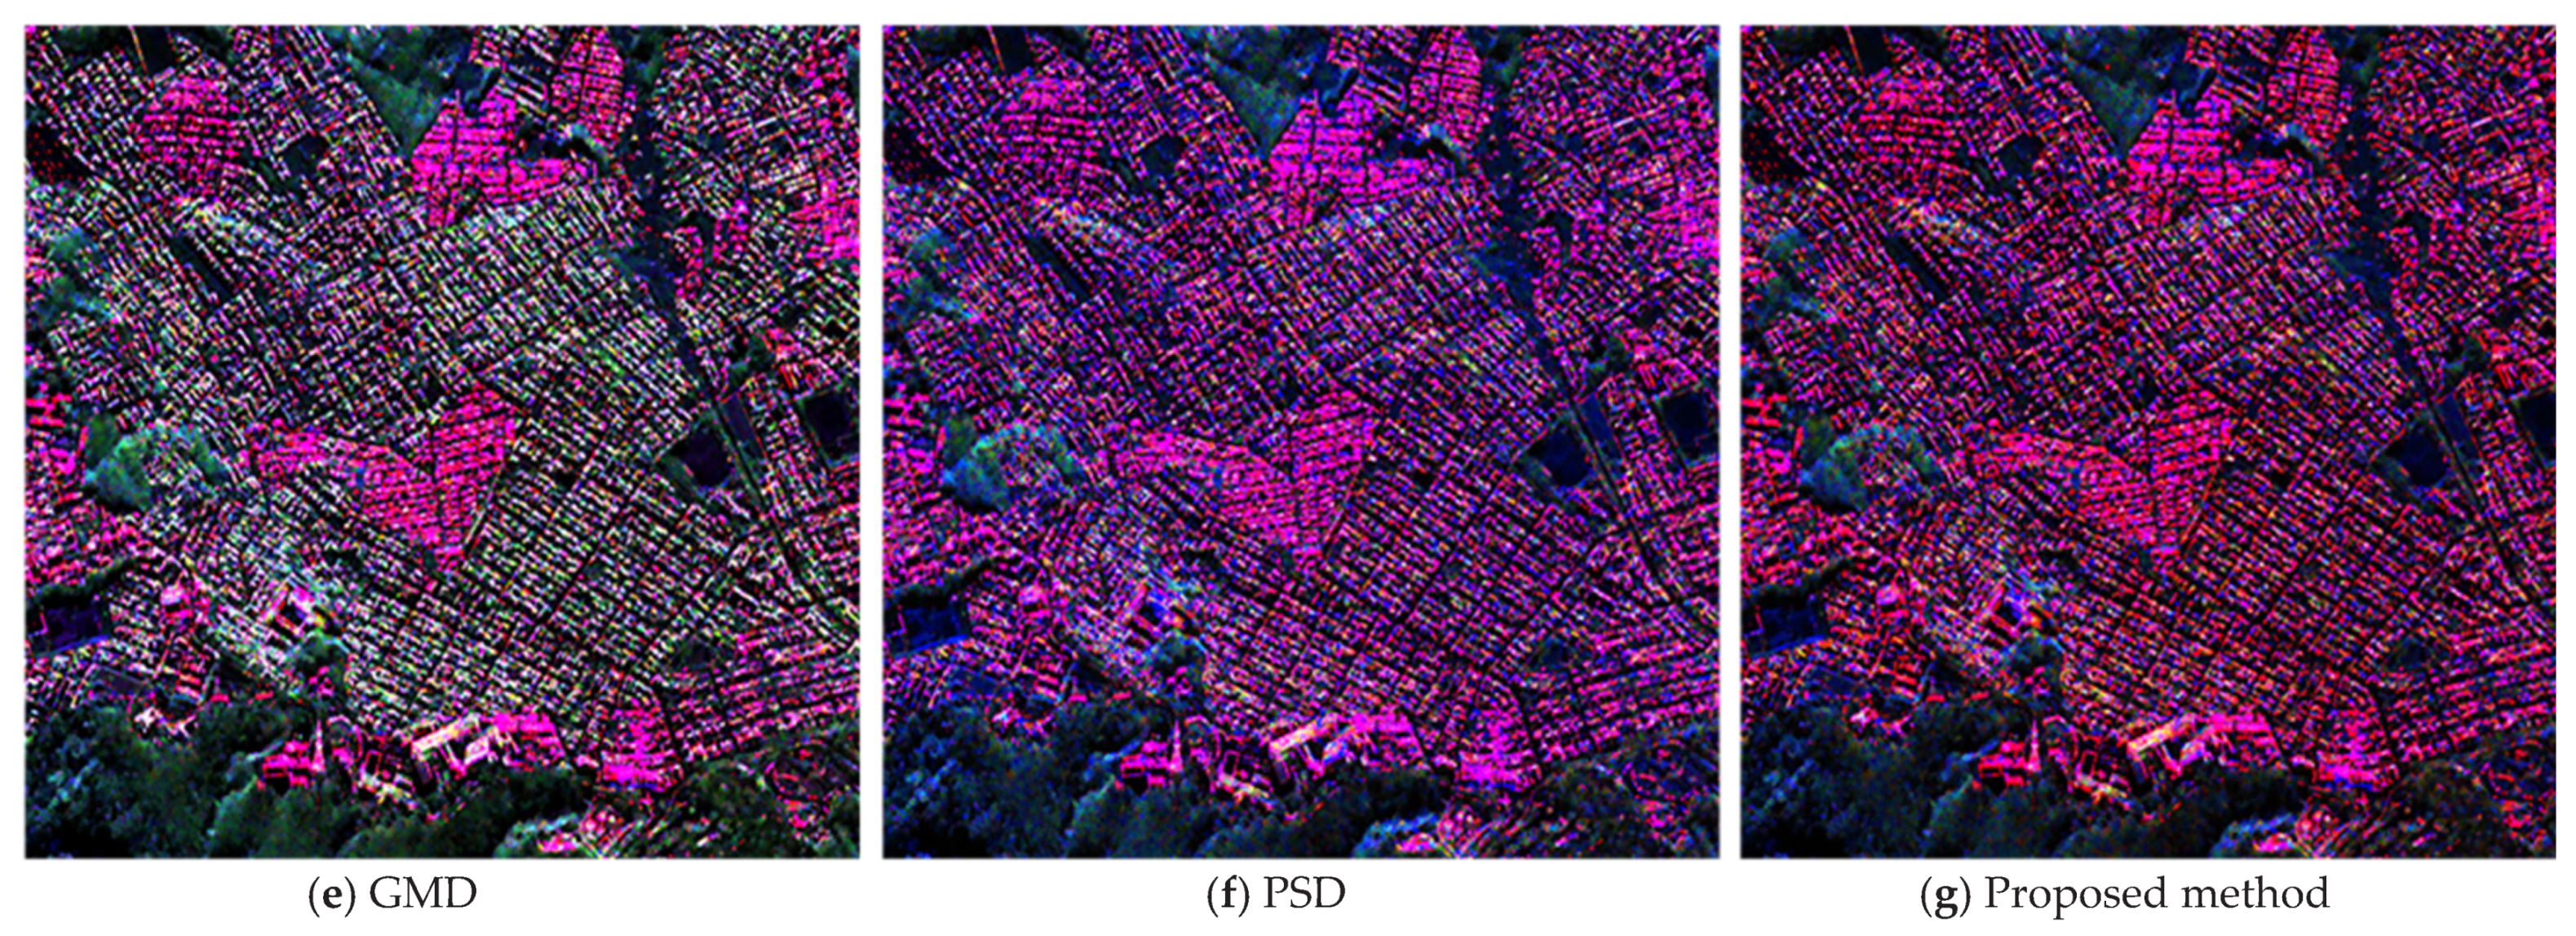
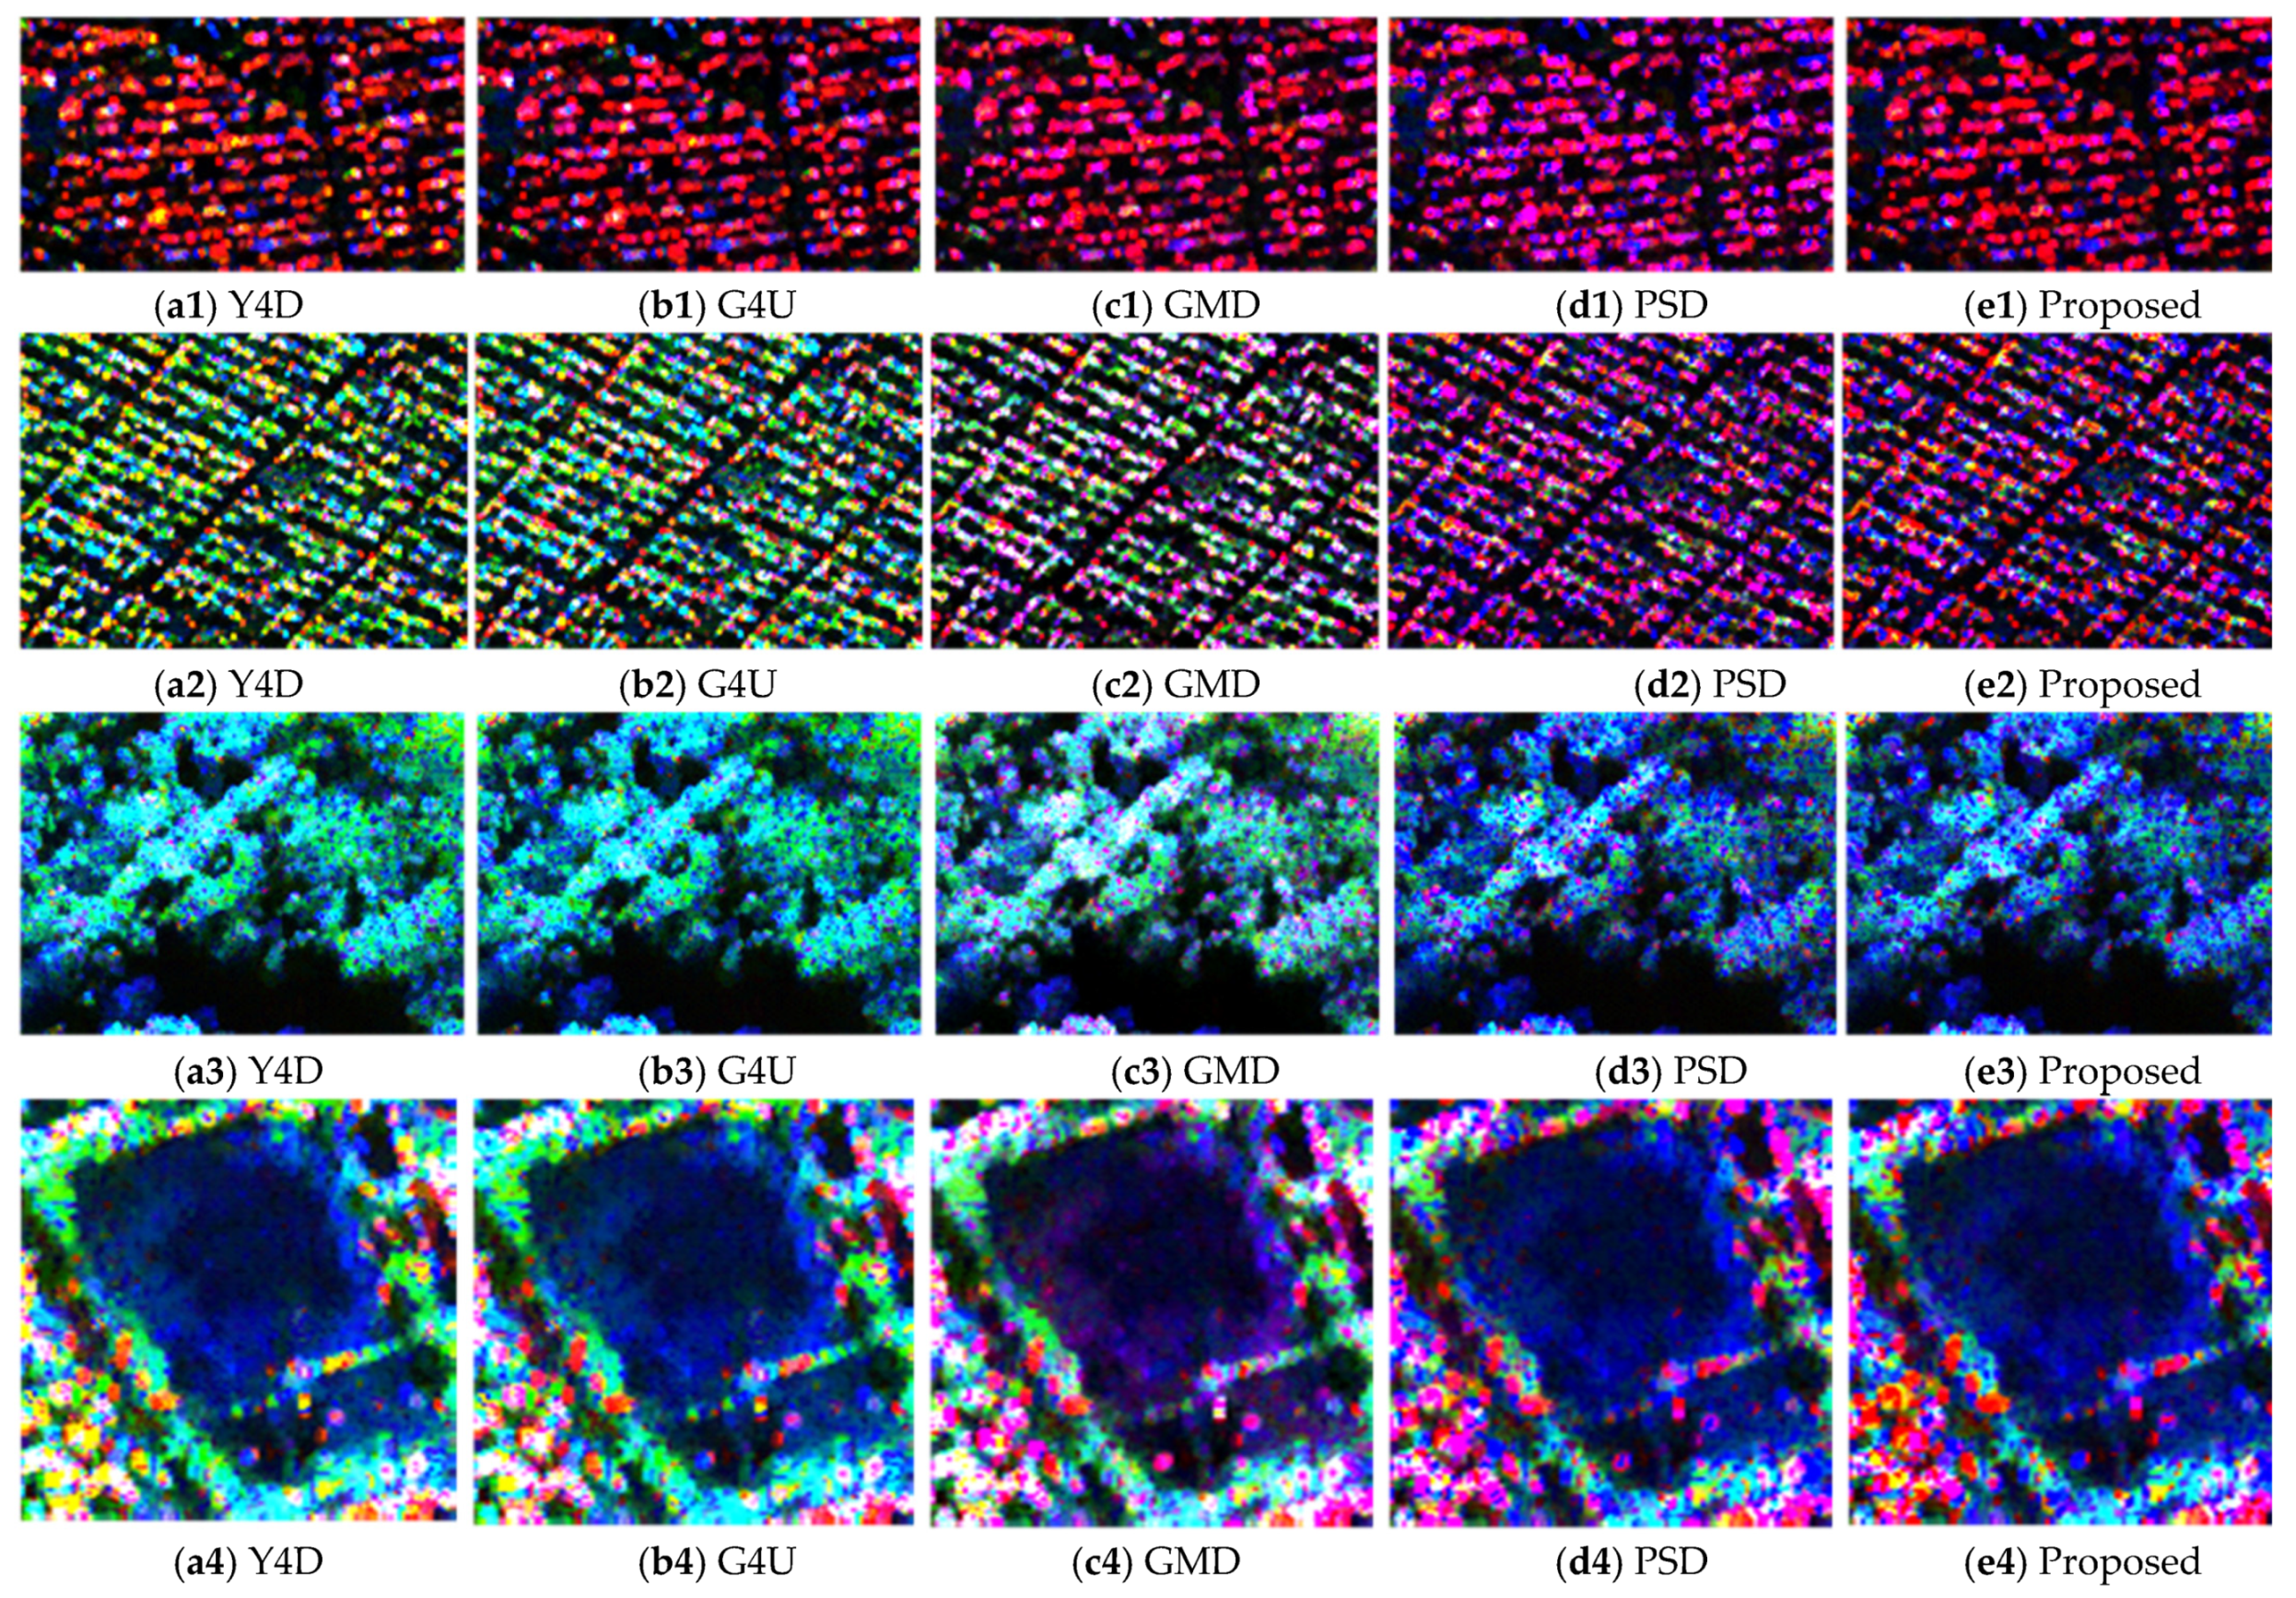
The decomposition results from X-band Pi-SAR data are shown in Figure 4. The major portion of the scene are buildings and city blocks. Four patches labeled A~D are selected for further comparison, and their enlarged decomposition results are shown in Figure 5. Patch A is an urban area with buildings parallel to the flight direction. Patch B is an oriented urban area, and the major orientation angle is around 45 degrees. Patch C is a forest area, and Patch D is a ground area. Quantitative analysis of dominant scattering components is demonstrated in Table 1.
For urban area, the dominant scattering mechanism is double bounce. Nevertheless, for oriented urban area, double-bounce scattering is interpreted as volume scattering in the results of Y4D and G4U. The volume-scattering overestimation is obvious. The GMD has an improved result, while the percentage of dominant volume scattering (36.26%) is still larger than that of dominant double-bounce scattering (23.37%). The PSD and proposed method reached the maximum percentage of dominant double-bounce scattering (40.26%, 42.88%). What is more, the proposed method has a minimum percentage of dominant volume scattering (11.11%) among five methods over both the urban area and oriented urban area. For the forests area, the percentage of dominant volume scattering of the proposed method is lower than that of dominant double-bounce. However, compared with the PSD method, its volume-scattering component is improved. As for patch D, for the major part of the ground area, the percentage of dominant odd-bounce scattering (92.52%) in the proposed method is the highest. From Figure 5(a4,d4), we can find that there are oriented buildings around the ground area. In the decomposition results of (a4) and (b4), the dominant scattering of the boundaries is volume scattering, while in the result of the proposed method, the boundaries are interpreted as double-bounce scattering.
In summary, the proposed decomposition method exhibits equivalent performance with the state-of-the-art methods over ground area and urban area with small orientation angles. Furthermore, the proposed method achieves improved performance over urban areas with large orientation angles, since the percentage of dominant double-bounce scattering increases, and the dominant volume scattering is the lowest.

4.2. Comparison with C-Band Radarsat-2 Data and L-Band ALOS-2 Data

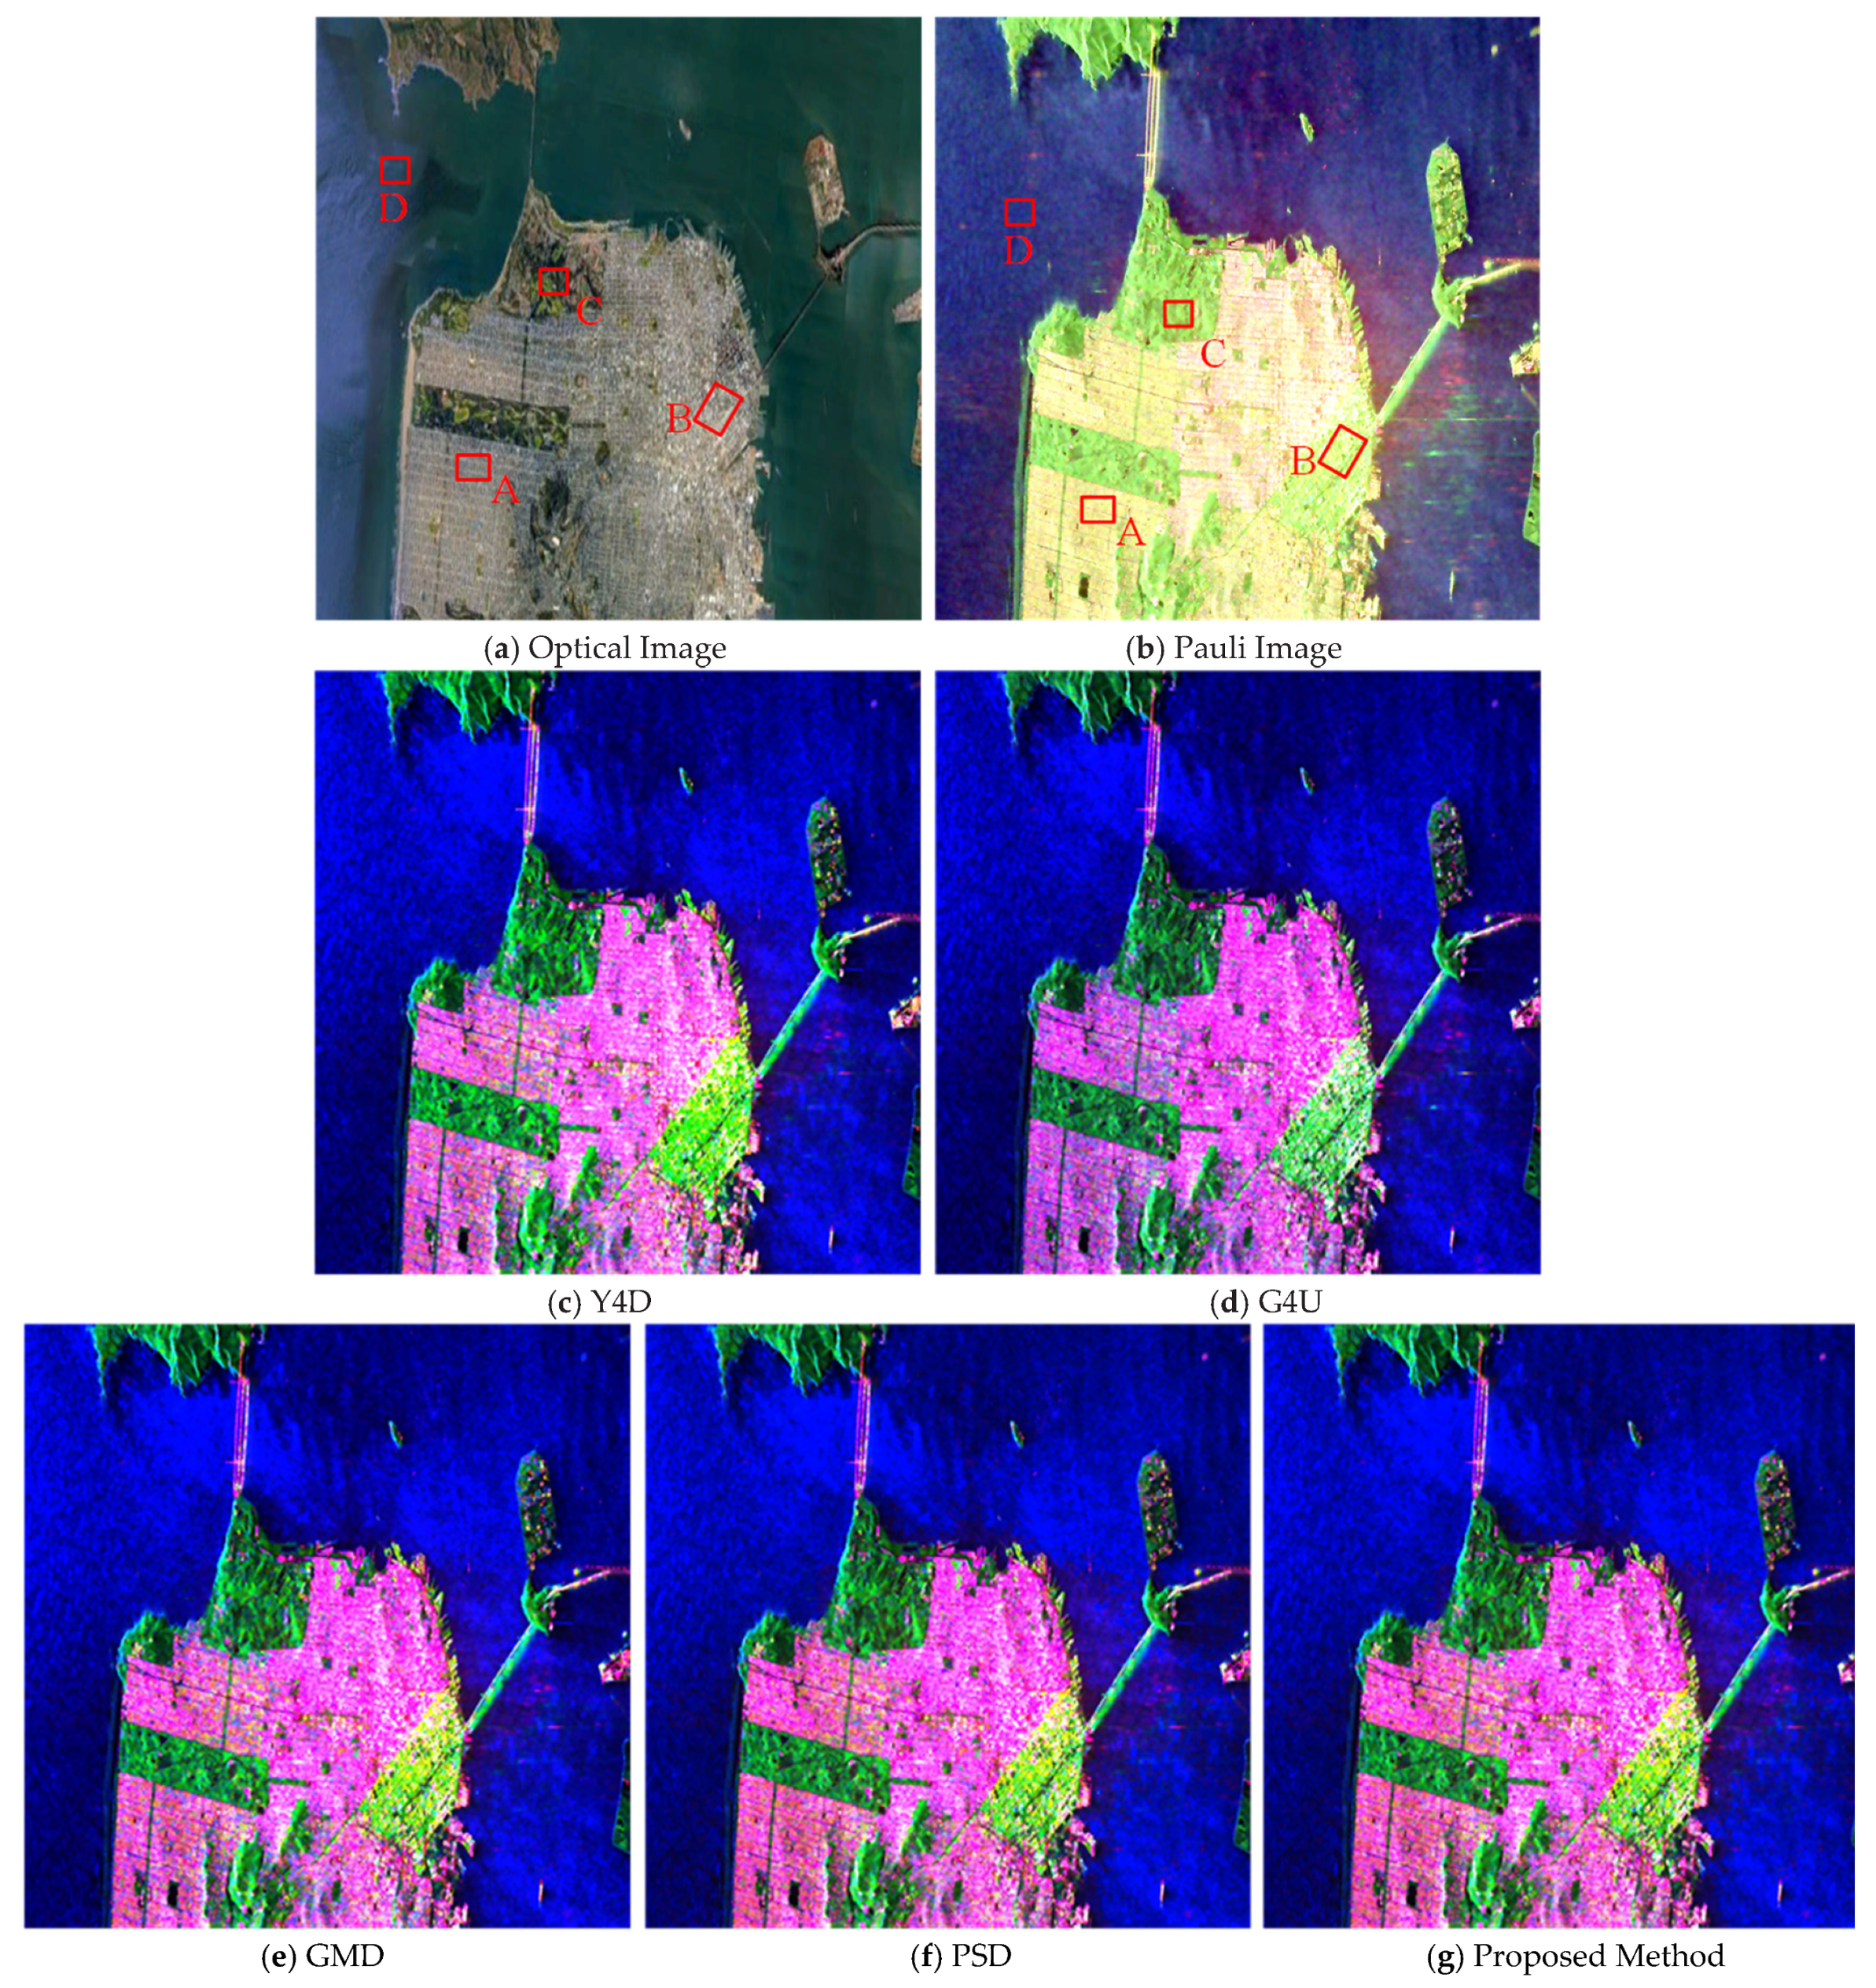
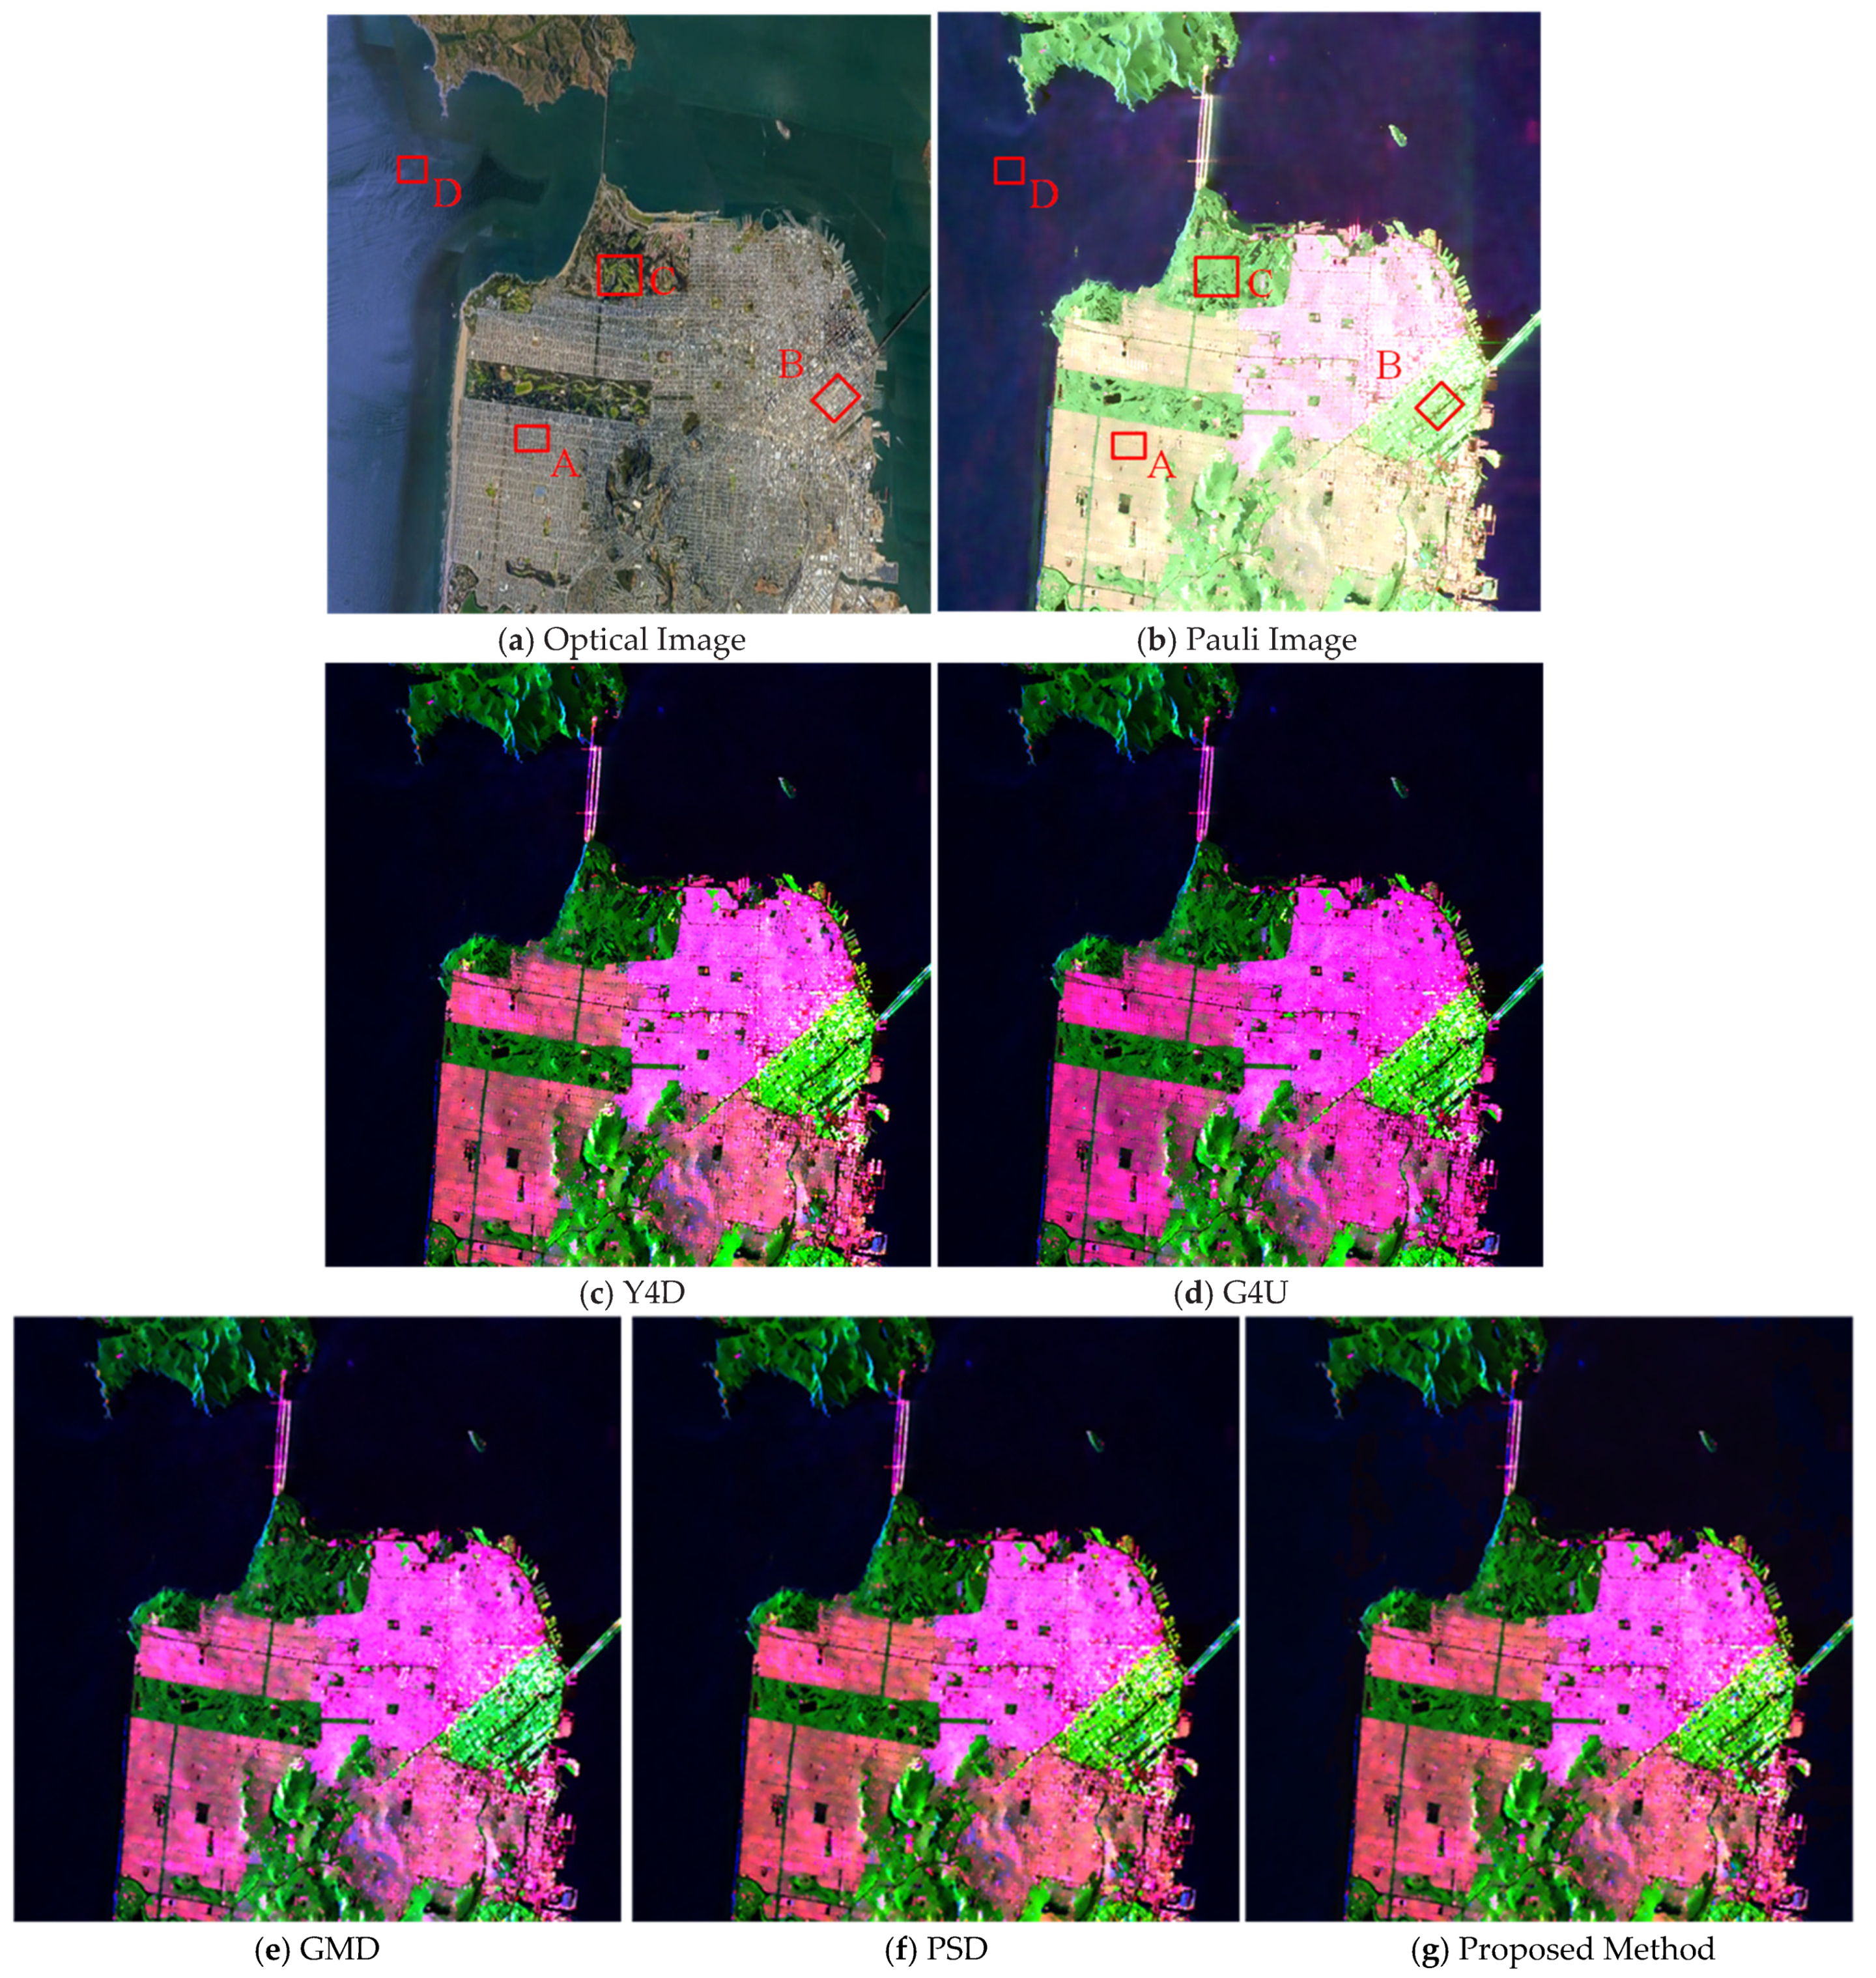
Spaceborne C-band Radarsat-2 and L-band ALOS-2 PolSAR datasets over the San Francisco area are employed for comparison. The Radarsat-2 data were acquired on 9 April 2008. The resolution is 4.73 m in the ground range direction at the scene center and 4.82 m in the azimuth direction. The full scene size is 2000 × 2000 pixels. The incidence angle at the image center is 28.92 degrees. The ALOS-2 data were acquired on 21 August 2018. The resolution is 2.86 m in the ground range direction and 3.21 m in the azimuth direction. The full image size is 3000 × 4000 pixels. The incidence angle at the image center is 33.87 degrees. Four patches including buildings (Patch A, B), forest (Patch C), and ocean (Patch D) are selected and marked with red boxes in optical and Pauli images, accordingly. The orientation angles of buildings in Patch B are around 45 degrees. The decomposition results are shown in Figure 6, Figure 7, Figure 8 and Figure 9. The enlarged decomposition results of selected patches are shown in Figure 7 and Figure 9. Quantitative analyses are demonstrated in Table 2 and Table 3.
From visual inspection, the percentage of dominant double-bounce scattering over the urban area in Figure 6f and Figure 8f is increased compared with other decompositions. For manmade areas such as urban areas, the proposed method shows further improved performance. According to the quantitative analysis, the decomposition results of oriented urban areas have the largest percentage of dominant double-bounce scattering and the smallest percentage of dominant volume scattering. Note that all these model-based decompositions exhibit scattering mechanism ambiguity over Patch B for both RadarSat-2 and ALOS-2 data, which require further efforts to mitigate. Over natural areas, the five methods have similar decomposition performance. The forest areas are entirely volume-scattering dominant, and ocean areas have 100% dominant surface scattering.
As a result, the decomposition performance of the proposed method is verified with different PolSAR datasets. In natural areas and urban areas of small orientation angles, the five methods have comparative decomposition performance. For oriented urban area, the proposed method achieves further improved performance.

4.3. Residual Examination

The proposed decomposition uses residual minimization as a measure to determine the optimal volume-scattering models. The minimized residuals are normalized by the corresponding measured coherency matrices for further examination
R min = T residual   2 / T 2
The histograms of the normalized minimum residuals Rmin for the GMD and proposed method used Pi-SAR, RadarSat-2, and ALOS-2 PolSAR datasets are shown in Figure 10. It is obvious that the residuals are relatively small. There is a long tail in the small value region. For the proposed method, the normalized residual corresponding to peak values of pixels numbers is 10−2, 10−4, and 10−4, respectively. However, for the GMD decomposition, they are 5 × 10⁻³, 10−3, and 3 × 10⁻³. The normalized residuals of the proposed method demonstrate a relatively low level compared with GMD. Theoretically, the major difference between the proposed method and GMD lies in the orientation angle derivation procedure. With refined double-bounce orientation angles and scattering models, the proposed method appears to perform well and can fit mixed scenes well. However, there are still high residuals for some pixels. The four volume-scattering models used here may not be sufficient for these pixels, producing high residuals. Therefore, further efforts are needed to include more representative volume-scattering models to the volume-scattering lookup table.

5. Conclusions

The scattering mechanism interpretation of oriented manmade targets, especially those with large POAs, is still a challenging task. The cross-polarization and off-diagonal terms induced by oriented double- and odd-bounce scattering are totally allocated to volume scattering in previous model-based decomposition. By modeling the double-bounce and odd-bounce structures with their independent orientation angles, general model-based decomposition mitigates this issue and achieves improved performance. However, the model inversion is a nonlinear optimization and is time consuming. To inherit the advantage of these generalized models while speeding up the decomposition parameters inversion, this paper proposed a refined double-bounce scattering model with simplified double-bounce orientation angle. The main breakthrough point lies in disclosing the latent relationship between the derived double-bounce orientation angle and the POA. However, there are difficulties in directly deriving the double-bounce scattering orientation angles from actual oriented buildings, and the theoretical relationship between DBOA and POA is not clear. Therefore, this paper proposed a piecewise linear function to approximately fit the relationship between DBOA and POA. Then, a refined double-bounce scattering model was developed. With the refined double-bounce scattering models, the proposed model-based decomposition derives the scattering power of four components with linear solutions. Comparison investigations have been carried out with three kinds of PolSAR datasets, including PiSAR, RadarSat-2, and ALOS-2. Compared with the state-of-the-art decomposition methods including the Y4D, G4U, GMD, and PSD, the proposed method achieves better performance especially for oriented urban areas. Future work will be focused on the volume-scattering components derivation procedure.

Author Contributions

S.C. and Y.L. conceived the study. G.W. designed the experiment and analyzed PolSAR datasets in consultation with S.C. and Y.L., S.C. and G.W. wrote the paper. All authors have read and agreed to the published version of the manuscript.

Funding

This research was funded in part by the National Natural Science Foundation of China under Grant 61771480, the Natural Science Foundation of Hunan Province under Grant 2020JJ2034, the Science and Technology Planning Project of Hunan Province under grant 2019RS2025.

Acknowledgments

The authors would like to thank the National Institute of Information and Communications Technology (NICT), Japan for providing the Pi-SAR datasets. The authors would also like to thank the editors and anonymous reviewers for their constructive suggestions, which greatly contributed to improving this paper.

Conflicts of Interest

The authors declare no conflict of interest.

References

  1. Lee, J.S.; Pottier, E. Polarimetric Radar Imaging From Basics to Applications; CRC Press: Boca Raton, FL, USA, 2009. [Google Scholar]
  2. Chen, S.; Wang, X.; Xiao, S.; Sato, M. Target Scattering Mechanism in Polarimetric Synthetic Aperture Radar-Interpretation and Application; Springer: Singapore, 2018. [Google Scholar]
  3. Freeman, A.; Durden, S.L. Three-component scattering model to describe polarimetric SAR data. IEEE Trans. Geosci. Remote Sens. 1998, 36, 963–973. [Google Scholar] [CrossRef] [Green Version]
  4. Chen, S.-W.; Li, Y.-Z.; Wang, X.-S.; Xiao, S.-P.; Sato, M. Modeling and Interpretation of Scattering Mechanisms in Polarimetric Synthetic Aperture Radar: Advances and perspectives. IEEE Signal Process. Mag. 2014, 31, 79–89. [Google Scholar] [CrossRef]
  5. Van Zyl, J.J.; Arii, M.; Kim, Y. Model-Based Decomposition of Polarimetric SAR Covariance Matrices Constrained for Nonnegative Eigenvalues. IEEE Trans. Geosci. Remote. Sens. 2011, 49, 3452–3459. [Google Scholar] [CrossRef]
  6. Cui, Y.; Yamaguchi, Y.; Yang, J.; Kobayashi, H.; Park, S.-E.; Singh, G. On Complete Model-Based Decomposition of Polarimetric SAR Coherency Matrix Data. IEEE Trans. Geosci. Remote. Sens. 2013, 52, 1991–2001. [Google Scholar] [CrossRef]
  7. Yamaguchi, Y.; Moriyama, T.; Ishido, M.; Yamada, H. Four-component scattering model for polarimetric SAR image decomposition. IEEE Trans. Geosci. Remote. Sens. 2005, 43, 1699–1706. [Google Scholar] [CrossRef]
  8. Yamaguchi, Y.; Sato, A.; Boerner, W.; Sato, R.; Yamada, H. Four-Component Scattering Power Decomposition with Rotation of Coherency Matrix. IEEE Trans. Geosci. Remote Sens. 2011, 49, 2251–2258. [Google Scholar] [CrossRef]
  9. Chen, S.-W.; Ohki, M.; Shimada, M.; Sato, M. Deorientation Effect Investigation for Model-Based Decomposition Over Oriented Built-Up Areas. IEEE Geosci. Remote. Sens. Lett. 2013, 10, 273–277. [Google Scholar] [CrossRef]
  10. Singh, G.; Yamaguchi, Y.; Park, S.-E. General Four-Component Scattering Power Decomposition with Unitary Transformation of Coherency Matrix. IEEE Trans. Geosci. Remote. Sens. 2013, 51, 3014–3022. [Google Scholar] [CrossRef]
  11. Arii, M.; Van Zyl, J.J.; Kim, Y. A General Characterization for Polarimetric Scattering from Vegetation Canopies. IEEE Trans. Geosci. Remote. Sens. 2010, 48, 3349–3357. [Google Scholar] [CrossRef]
  12. Neumann, M.; Ferro-Famil, L.; Reigber, A. Estimation of Forest Structure, Ground, and Canopy Layer Characteristics from Multibaseline Polarimetric Interferometric SAR Data. IEEE Trans. Geosci. Remote. Sens. 2009, 48, 1086–1104. [Google Scholar] [CrossRef] [Green Version]
  13. Antropov, O.; Rauste, Y.; Hame, T. Volume Scattering Modeling in PolSAR Decompositions: Study of ALOS PALSAR Data Over Boreal Forest. IEEE Trans. Geosci. Remote. Sens. 2011, 49, 3838–3848. [Google Scholar] [CrossRef]
  14. Xie, Q.; Zhu, J.; Lopez-Sanchez, J.M.; Wang, C.; Fu, H. A Modified General Polarimetric Model-Based Decomposition Method With the Simplified Neumann Volume Scattering Model. IEEE Geosci. Remote. Sens. Lett. 2018, 15, 1229–1233. [Google Scholar] [CrossRef] [Green Version]
  15. Ratha, D.; Mandal, D.; Kumar, V.; Mcnairn, H.; Bhattacharya, A.; Frery, A.C. A Generalized Volume Scattering Model-Based Vegetation Index From Polarimetric SAR Data. IEEE Geosci. Remote. Sens. Lett. 2019, 16, 1791–1795. [Google Scholar] [CrossRef]
  16. Hajnsek, I.; Jagdhuber, T.; Schon, H.; Papathanassiou, K.P. Potential of Estimating Soil Moisture under Vegetation Cover by Means of PolSAR. IEEE Trans. Geosci. Remote. Sens. 2009, 47, 442–454. [Google Scholar] [CrossRef] [Green Version]
  17. Lee, J.; Ainsworth, T.L.; Wang, Y. Generalized Polarimetric Model-Based Decompositions Using Incoherent Scattering Models. IEEE Trans. Geosci. Remote Sens. 2014, 52, 2474–2491. [Google Scholar] [CrossRef]
  18. Chen, S.-W.; Wang, X.-S.; Xiao, S.-P.; Sato, M. General Polarimetric Model-Based Decomposition for Coherency Matrix. IEEE Trans. Geosci. Remote. Sens. 2014, 52, 1843–1855. [Google Scholar] [CrossRef]
  19. Lee, J.-S.; Ainsworth, T.L. The Effect of Orientation Angle Compensation on Coherency Matrix and Polarimetric Target Decompositions. IEEE Trans. Geosci. Remote. Sens. 2011, 49, 53–64. [Google Scholar] [CrossRef]
  20. Lee, J.-S.; Schuler, D.; Ainsworth, T.; Krogager, E.; Kasilingam, D.; Boerner, W.-M. On the estimation of radar polarization orientation shifts induced by terrain slopes. IEEE Trans. Geosci. Remote. Sens. 2002, 40, 30–41. [Google Scholar] [CrossRef]
  21. Kimura, H. Radar Polarization Orientation Shifts in Built-Up Areas. IEEE Geosci. Remote. Sens. Lett. 2008, 5, 217–221. [Google Scholar] [CrossRef]
  22. Quan, S.; Xiong, B.; Xiang, D.; Kuang, G. Derivation of the Orientation Parameters in Built-Up Areas: With Application to Model-Based Decomposition. IEEE Trans. Geosci. Remote. Sens. 2018, 56, 4714–4730. [Google Scholar] [CrossRef]
  23. An, W.; Lin, M. An Incoherent Decomposition Algorithm Based on Polarimetric Symmetry for Multilook Polarimetric SAR Data. IEEE Trans. Geosci. Remote. Sens. 2019, 58, 2383–2397. [Google Scholar] [CrossRef]
  24. Chen, S.-W.; Wang, X.-S.; Sato, M. PolInSAR Complex Coherence Estimation Based on Covariance Matrix Similarity Test. IEEE Trans. Geosci. Remote. Sens. 2012, 50, 4699–4710. [Google Scholar] [CrossRef]
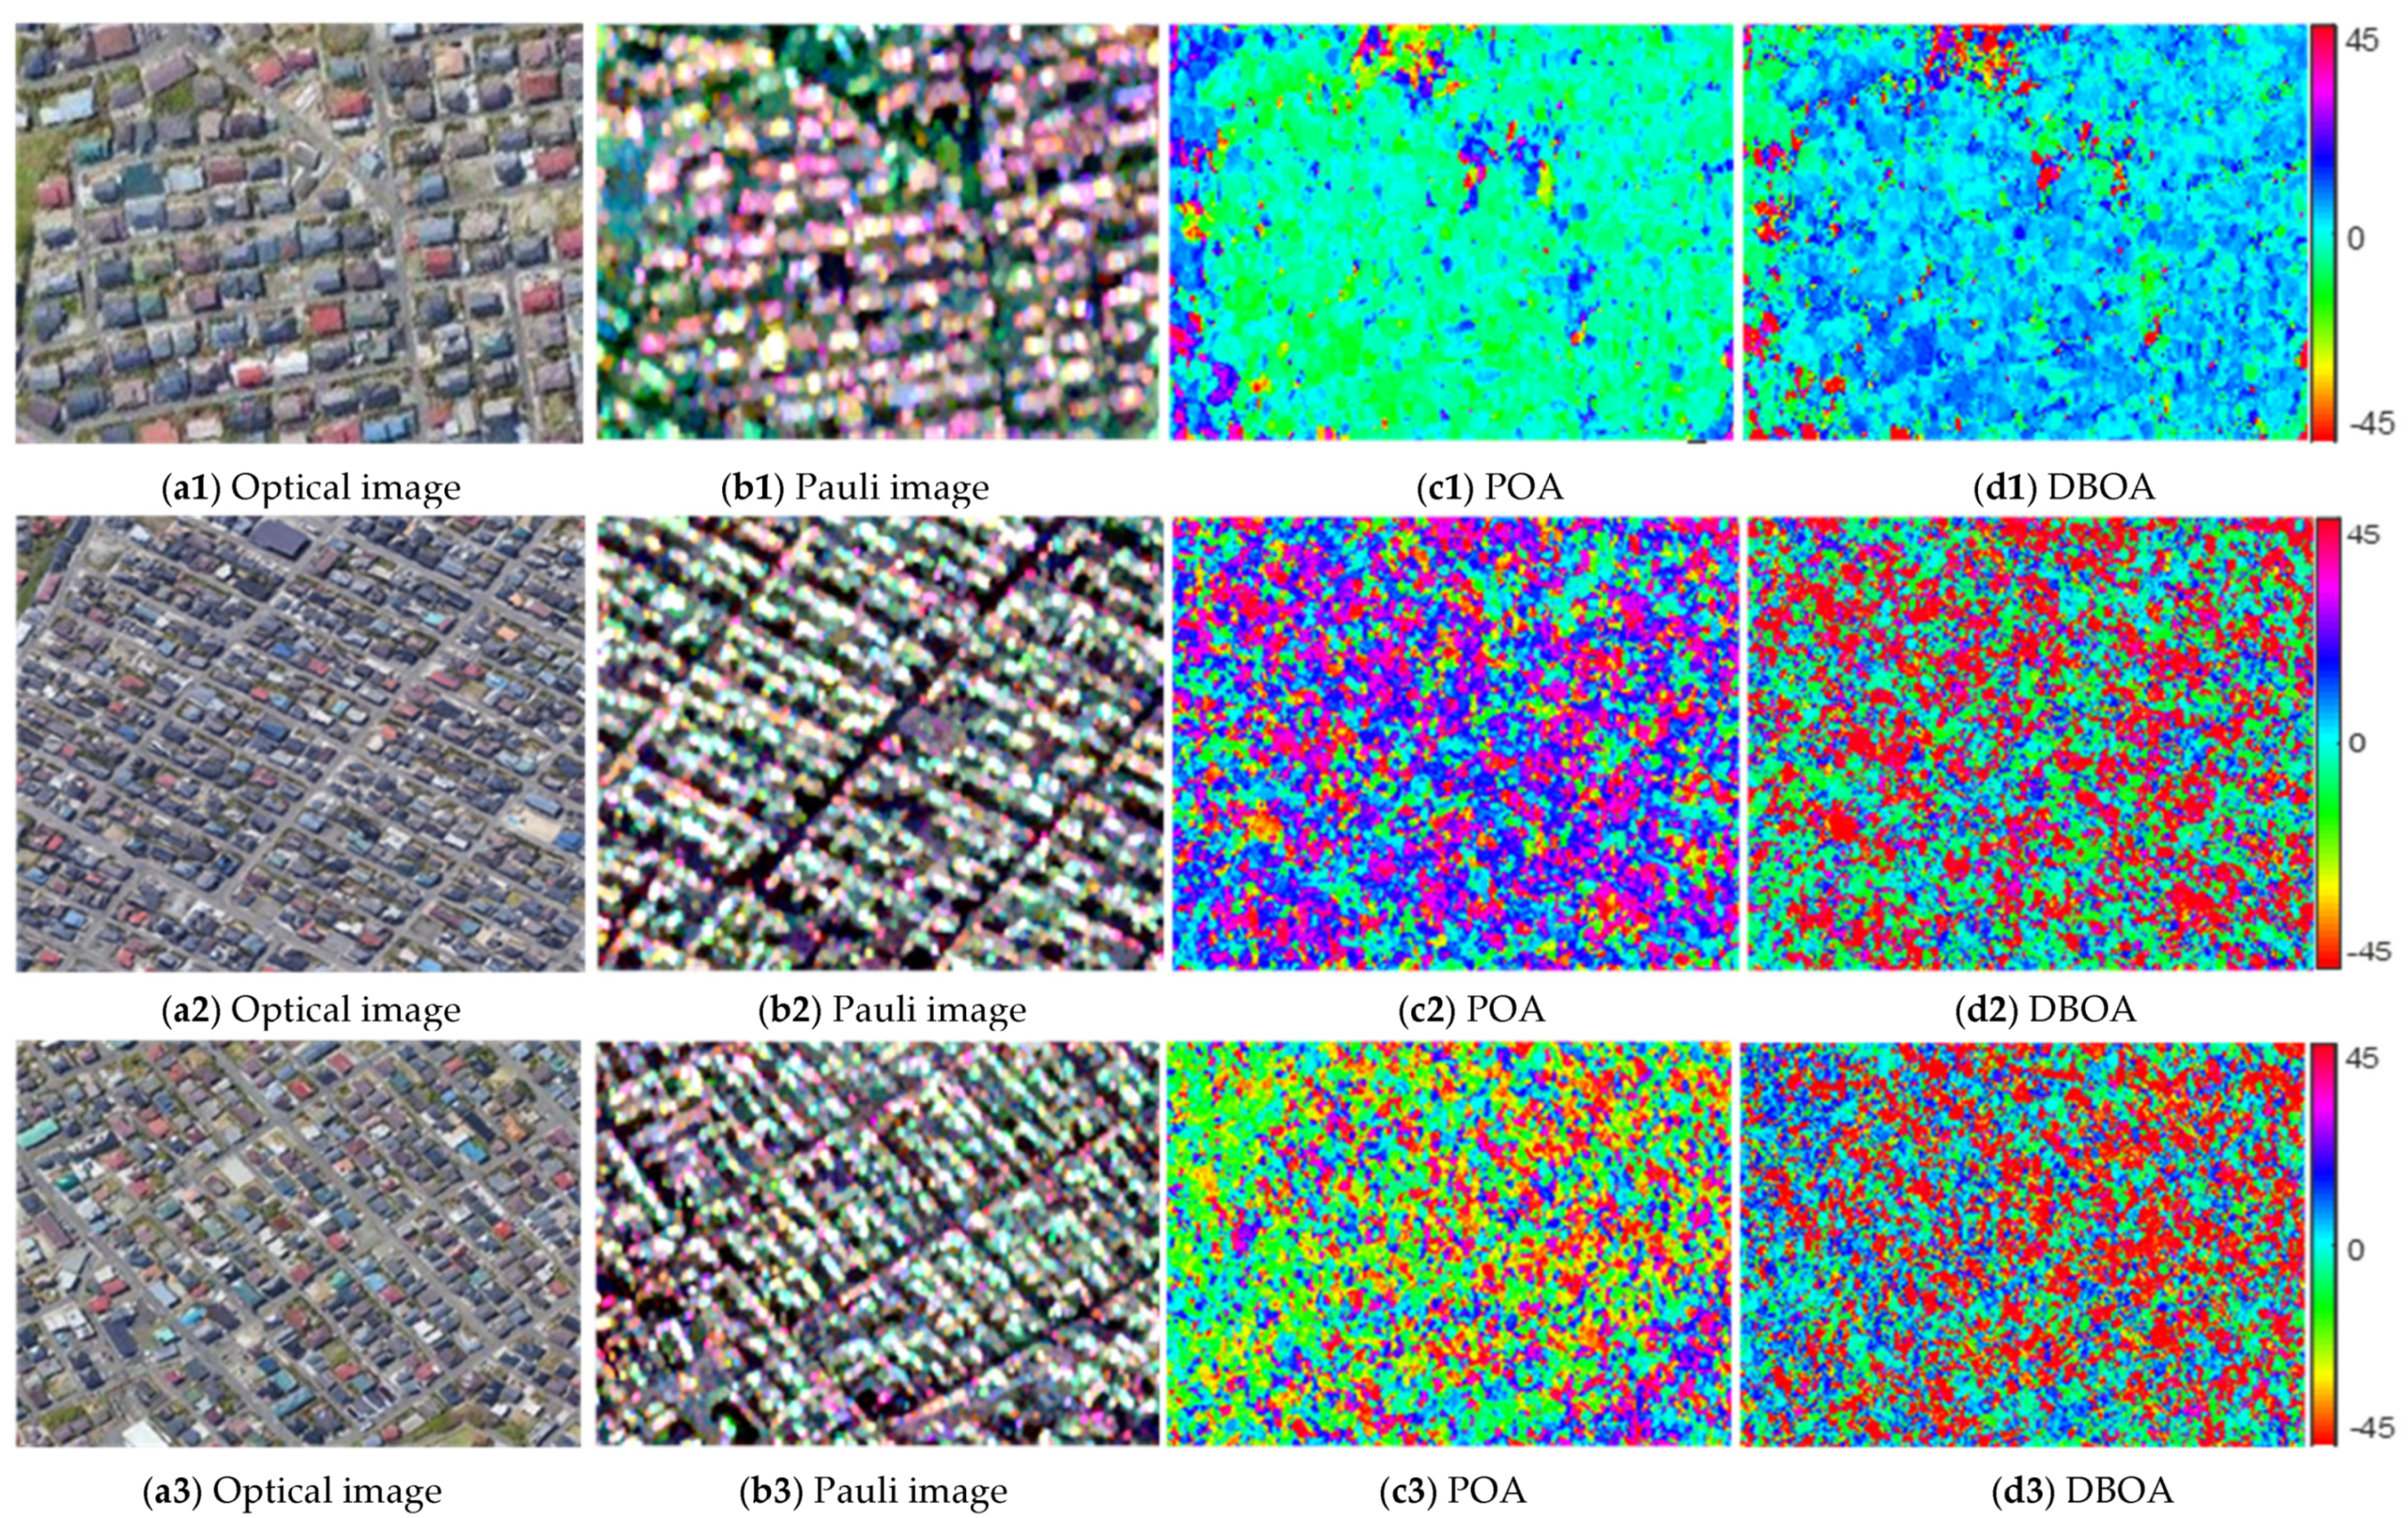
Figure 1. The optical images, Pauli images, polarization orientation angles, and double-bounce orientation angles of three patches selected from airborne X-band PiSAR data. Three patches of buildings are oriented in different directions. The orientation angle of (a1) is around 5 degree, (a2) is 35 degree, and (a3) is 45 degree. (a1a3) are the optical images of three different patches and (b1-b3) are the Pauli images. The POAs of three different patches are shown in (c1c3), while the DBOAs are shown in (d1d3).
Remotesensing 13 03070 g001
Figure 2. The histogram of POA and error bar plots of the relationship between POA and DBOA with airborne PiSAR data. (ac) are the statistical distribution of POA for three different patches. (df) are the error bars. The red dots and blue error bars represent mean value and stand deviation of θdbl. The green lines are the piecewise linear fitting results.
Remotesensing 13 03070 g002
Figure 3. Flowchart of the proposed decomposition.
Remotesensing 13 03070 g003
Figure 4. Decomposition results of PiSAR data. (a,b) are the optical image and Pauli image of the whole scene. The size is 1400 × 1400 pixels. (cg) are the results of Y4D, G4U, GMD, PSD, and the proposed method. The images are colored by Pd (red), Pv (green), and Ps (blue).
Remotesensing 13 03070 g004aRemotesensing 13 03070 g004b
Figure 5. Decomposition results over four different patches selected from PiSAR data. (a1e1) are the decomposition results over urban area (A). (a2e2) are the results of oriented urban area (B). (a3e3) are the results of forests area (C). (a4e4) are the results of ground area (D). The images are colored by Pd (red), Pv (green), and Ps (blue).
Remotesensing 13 03070 g005
Figure 6. Decomposition results of Radarsat-2 data. (a,b) are the optical image and Pauli image. (cg) are the decomposition result of different decomposition methods. The images are colored by Pd (red), Pv (green), and Ps (blue).
Remotesensing 13 03070 g006
Figure 7. Decomposition results of patches selected from spaceborne C-band RadarSat-2 data. (a1e1) are the decomposition results over urban area (A). (a2e2) are the results of oriented urban area (B). (a3e3) are the results of forests area (C). The images are colored by Pd ( red), Pv (green), and Ps (blue).
Remotesensing 13 03070 g007
Figure 8. Decomposition results of ALOS-2 data. (a,b) are the optical and Pauli image. (cg) are the decomposition result of different decomposition methods. The images are colored by Pd (red), Pv (green), and Ps (blue).
Remotesensing 13 03070 g008
Figure 9. Decomposition results of patches selected from spaceborne L-band ALOS-2 data. (a1e1) are the de-composition results over urban area (A). (a2e2) are the results of oriented urban area (B). (a3e3) are the results of forests area (C). The images are colored by Pd ( red), Pv (green), and Ps (blue).
Remotesensing 13 03070 g009aRemotesensing 13 03070 g009b
Figure 10. Histograms of the normalized residuals. (a) PiSAR data. (b) Radarcat-2 data. (c) ALOS-2 data.
Remotesensing 13 03070 g010
Table 1. The percentage of dominant scattering mechanism from the decomposition results of Pi-SAR data (%).
PatchMethodDblVolOddHelPatchMethodDblVolOddHel
Urban area
(Patch A)
Y4D59.398.9631.530.12Oriented urban area
(Patch B)
Y4D20.6742.1036.270.96
G4U60.677.3131.920.10G4U25.2936.9136.960.84
GMD62.636.3730.840.16GMD23.3736.2639.291.07
PSD61.293.3335.320.06PSD40.2614.1645.000.58
Proposed62.122.5635.300.03Proposed42.8811.1145.690.32
Forest area
(Patch C)
Y4D1.4863.6434.710.16Ground area
(Patch D)
Y4D2.416.5390.990.07
G4U1.8262.4335.590.16G4U2.556.1791.210.07
GMD3.6360.7735.550.05GMD5.175.3089.530.00
PSD6.9637.7955.050.20PSD5.172.3792.460.00
Proposed5.8638.2155.860.07Proposed5.312.1792.520.00
Table 2. The percentage of dominant scattering mechanism from the decomposition results of RadarSat-2 data (%).
PatchMethodDblVolOddHelPatchMethodDblVolOddHel
Urban area
(Patch A)
Y4D59.92 1.32 38.76 0.00 Oriented urban area
(Patch B)
Y4D6.84 88.00 5.10 0.06
G4U59.98 1.18 38.84 0.00 G4U10.09 84.60 5.26 0.05
GMD40.66 0.69 58.65 0.00 GMD6.26 84.97 8.66 0.11
PSD83.49 0.99 15.52 0.00 PSD12.76 82.32 4.86 0.06
Proposed84.06 0.41 15.53 0.00 Proposed14.95 77.63 7.41 0.01
Forest area
(Patch C)
Y4D0.64 91.70 7.66 0.00 Ocean area
(Patch D)
Y4D0.00 0.00 100.00 0.00
G4U0.65 91.57 7.78 0.00 G4U0.00 0.00 100.00 0.00
GMD0.92 87.65 11.44 0.00 GMD0.00 0.00 100.00 0.00
PSD2.15 91.91 5.94 0.01 PSD0.00 0.00 100.00 0.00
Proposed3.92 89.34 6.74 0.00 Proposed0.00 0.00 100.00 0.00
Table 3. The percentage of dominant scattering mechanism from the decomposition results of ALOS-2 data (%).
PatchMethodDblVolOddHelPatchMethodDblVolOddHel
Urban area
(Patch A)
Y4D99.210.53 0.26 0.00 Oriented urban area
(Patch B)
Y4D3.80 91.76 4.44 0.00
G4U99.210.52 0.27 0.00 G4U4.71 90.84 4.45 0.00
GMD99.170.44 0.39 0.00 GMD3.22 92.19 4.50 0.09
PSD99.400.55 0.05 0.00 PSD5.55 90.58 3.87 0.00
Proposed99.500.49 0.01 0.00 Proposed5.87 88.82 5.31 0.00
Forest area
(Patch C)
Y4D1.2298.24 0.54 0.00Ocean area
(Patch D)
Y4D0.00 0.00 100.00 0.00
G4U1.2298.22 0.56 0.00G4U0.00 0.00 100.00 0.00
GMD1.2896.20 2.52 0.00GMD0.00 0.00 100.00 0.00
PSD1.6297.96 0.42 0.00PSD0.00 0.00 100.00 0.00
Proposed1.2897.80 0.92 0.00Proposed0.00 0.00 100.00 0.00
Publisher’s Note: MDPI stays neutral with regard to jurisdictional claims in published maps and institutional affiliations.