Article

Understanding the Influence of Building Loads on Surface Settlement: A Case Study in the Central Business District of Beijing Combining Multi-Source Data

1
Key Laboratory of the Ministry of Education Land Subsidence Mechanism and Prevention, Capital Normal University, Beijing 100048, China
2
College of Resources Environment and Tourism, Capital Normal University, Beijing 100048, China
3
College of Geospatial Information Science and Technology, Capital Normal University, Beijing 100048, China
4
Observation and Research Station of Groundwater and Land Subsidence in Beijing-Tianjin-Hebei Plain, MNR, Beijing 100048, China
5
Beijing Laboratory of Water Resources Security, Capital Normal University, Beijing 100048, China
*
Author to whom correspondence should be addressed.
Remote Sens. 2021, 13(16), 3063; https://doi.org/10.3390/rs13163063
Submission received: 22 June 2021 / Revised: 30 July 2021 / Accepted: 30 July 2021 / Published: 4 August 2021

Abstract

:
In metropolitan areas, the static load of high-rise buildings may result in uneven settlement, which seriously threatens residents’ living safety. Studying the response relationship between the additional stress of high-rise buildings and foundation settlement plays an important role in ensuring the safe development of metropolitan cities. Firstly, based on Persistent Scatterers Interferometric Aperture Radar (PS-InSAR) technology, we used 68 descending TerraSAR-X images to obtain the surface settlement in the study area from April 2010 to October 2018, which were validated with leveling benchmark monitoring results. Secondly, we calculated the additional stress of the building loads to quantify its effect on the uneven settlement in the Central Business District (CBD) of Beijing. Finally, two sets of characteristic points were selected to analyze the response relationships between foundation settlement and additional stress generated by building loads. The findings show: (1) The surface settlement rate varied from −145.2 to 24 mm/year in the Beijing Plain. The InSAR results agree well with the monitoring results derived from the leveling benchmark; the Pearson correlation coefficients were 0.98 and 0.95 in 2011–2013 and 2015–2016, respectively. (2) The stress results show that the depth of the influence of the static load of high-rise buildings was 74.9 m underground in the CBD. (3) The spatial distribution pattern of the additional stress is consistent with the foundation settlement. A characteristic point with greater additional stress in the same group has a higher foundation settlement rate. This relationship has also been found between the uneven foundation settlement and additional stress gradients. These findings provide scientific support for mitigating economic losses due to foundation settlement caused by additional stresses derived from building loads.

Graphical Abstract

1. Introduction

Surface settlement threatens the safety of cities and damages infrastructure, through, for example, sinking foundations and rupturing underground pipelines. More than 150 countries on the Earth have experienced surface settlement to various degrees, including China [1], the USA [2], Italy [3], and Mexico [4]. The North China Plain has experienced the most serious settlement on the Chinese mainland [1].
Persistent Scatterers Interferometric Aperture Radar (PS-InSAR) technology can be used to determine the surface settlement information in urban areas with millimeter-scale accuracy [5]. Using ENVISAT and ERS data from 1992–2010 and COSMO-SkyMed and TerraSAR-X data from 2008–2011, Tosi, et al. [6] obtained the surface settlement in Venice. Chen, et al. [7] acquired surface settlement information around Beijing Subway Line 6 using Radarsat-2 data from 2010–2014. Based on ENVISAT SAR data from 2003–2010 and Sentinel-1A data from 2015–2016, Guan, et al. [8] assessed the evolution pattern of surface settlement in the Lanzhou New District. Yang, et al. [9] obtained surface settlement information in the eastern Beijing urban area based on ENVISAT data from 2003–2010 and TerraSAR-X data from 2010–2016. Jiao, et al. [10] acquired the surface settlement in a central business district (CBD) located in Beijing using TerraSAR-X data from 2010–2013.
Surface settlement (SS) is the sum of all components of land surface election change, including foundation settlement (FS), tectonic settlement (TS), settlement caused by aquifer system compaction owing to decline of groundwater levels (SDGL) [11,12]. The relationship between these can be expressed by Equation (1). Previous studies have shown that the crust in the Beijing Plain is relatively stable and that TS can be ignored when compared with FS and SDGL [7,10]. Thus, it is reasonable that TS was treated as 0 from 2010 to 2018.
S S = F S + T S + S D G L
Beijing, an international metropolis, is an international, innovative, cultural, and political center. With the acceleration of urbanization, a positive correlation was found between the surface settlement rate, building density, and floor area ratio in 2002 [13]. In 2007, Jie, et al. [14] found that a positive relationship exists between surface settlement and large-scale building loads and discussed the depth of the influence of building loads on urban construction. In 2008 and 2010, Tang, et al. [15] and Cui, et al. [16] demonstrated surface settlement caused by superimposed stress are derived from building loads by using soil mechanics models. In 2009, Gong, et al. [17] found that the building load contributes close to 30% of the surface settlement in Shanghai. In 2015, Chen, et al. [18] reported a positive correlation between urbanization and surface settlement in Beijing. In 2018, Yang, et al. [9] analyzed the relationship between surface settlement and buildings on multiple scales and found a positive correlation between the surface settlement rate and building volume. Parsons indicated that the settlement from building loads is at least 5–80 mm in the city of San Francisco and that the most extreme examples were for the Millennium Tower, which has settled over 400 mm during a decade [19].
With the expansion of the city, many skyscrapers have been built in Beijing. Analyzing the relationship between foundation settlement and building loads may provide scientific support for improving urban safety and reducing economic losses in the future. Additional stress produced by building loads will accelerate the consolidation process of the soil [15,16]. Previous studies have mainly focused on the statistical relationship between the load and foundation settlement; the index used to represent loads in those studies is unable to represent the superimposed characteristics of additional stress derived from building loads. Here, we innovatively calculated the additional stress of building loads to quantitate its effect on foundation settlement. We selected the CBD of Beijing in Chaoyang District as the study area, which has a high building density, and a large number of tall buildings were built there between 2001 and 2018. First, we present the geological settings of the study area in Section 2. The methodology is described in Section 3. Then, we present additional stress maps and a foundation settlement map in Section 4. In Section 5, we calculate the depth of the influence of additional stress generated by building loads and analyze the response relationship between foundation settlement and the additional stress generated by building loads. Finally, we summarize our conclusions in Section 6.

2. Study Area

Between 39°27′–41°04′ N and 115°24′–117°36′ E, Beijing is located on the northwest fringe of the North China Plain and is an international metropolis. With over 21 million inhabitants, Beijing covers an area of approximately 16,410 km2. Influenced by the typical continental monsoon climate, Beijing has an annual average temperature of 11.3 °C and an annual average precipitation of 598 mm, of which 70% falls from June to August [1]. Owing to the acceleration of urbanization, water consumption in this metropolis has increased dramatically [20]. Of the total water supply, 67% depends on groundwater, with an annual pumping capacity of approximately 250 million cubic meters recorded after 1990, which greatly exceeds the natural replenishment capacity [10,20]. Over-exploitation of groundwater has caused continuous decline of the groundwater levels in the east and northeast of the Beijing Plain and the consolidation of aquifer systems, resulting in severe surface settlement [21].
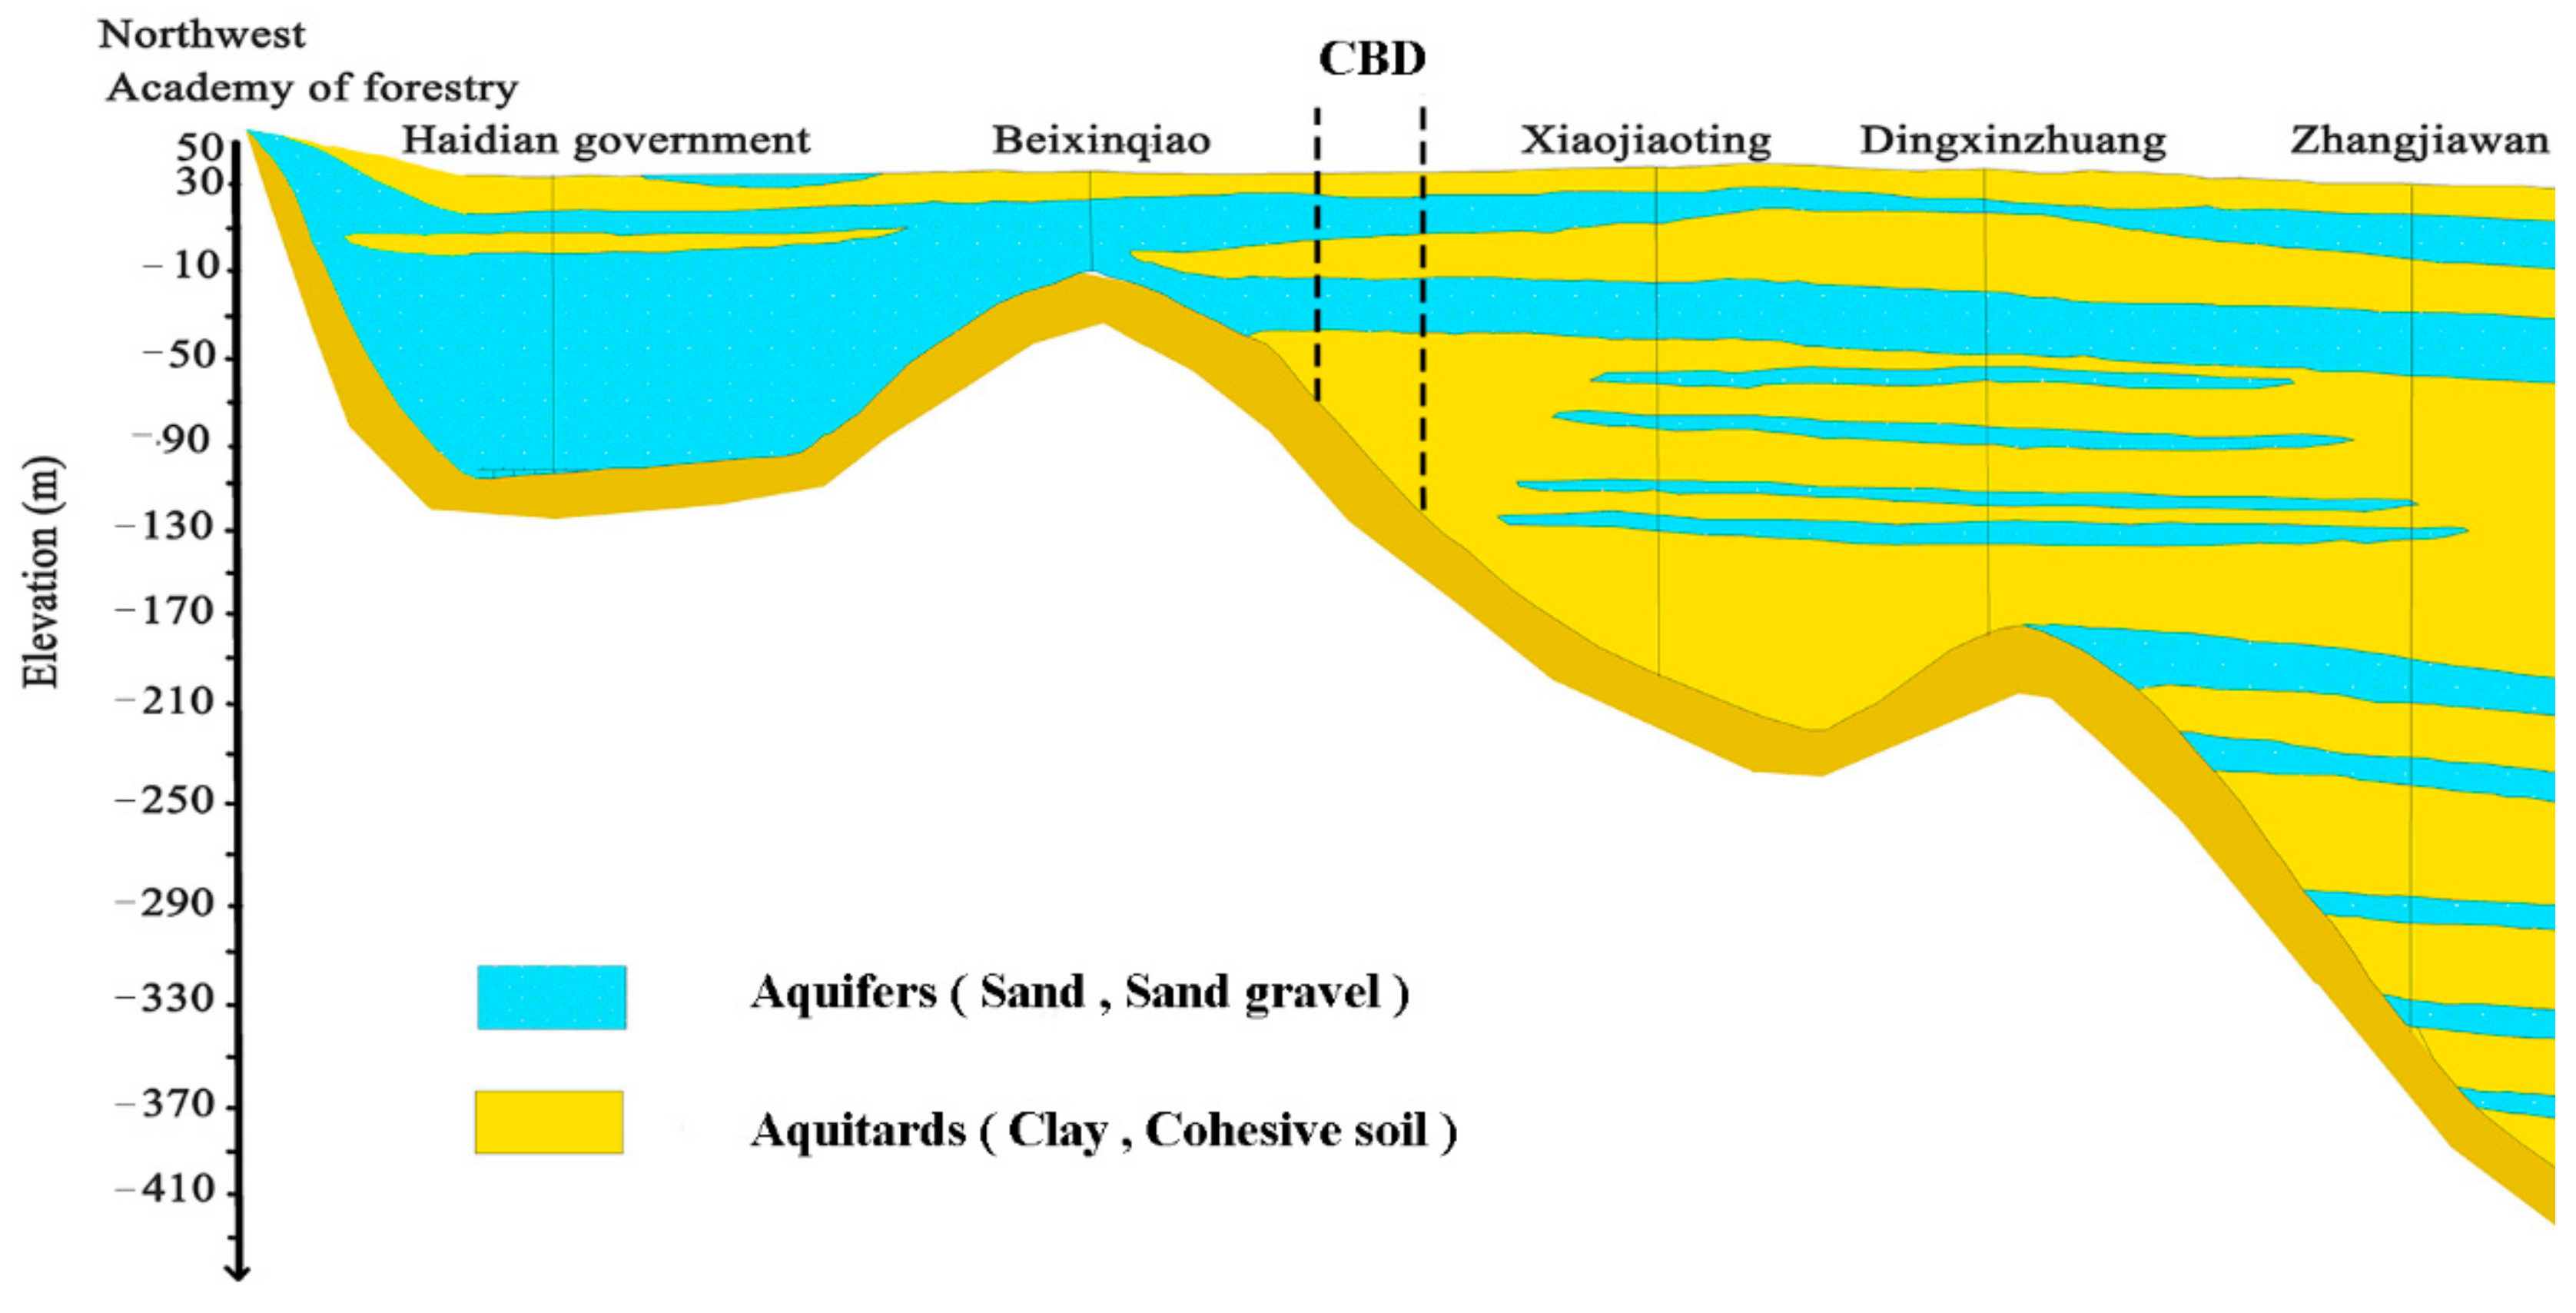
As a piedmont alluvial plain, Quaternary loose sediments are widely distributed in the Beijing Plain, although the thickness of compressible layers varies widely [1]. From the northwest to the southeast, the thickness of the sediments has gradually changed from thin to thick; the aquifers have changed from a single layer (sand gravel) to a multi-layer (sand and clay interbedded multi-layer) [22,23,24] (Figure 1 and Figure 2 [25]). As shown in Figure 1a, the Quaternary thickness of the compressible layer, ranging from 100 to 150 m, is relatively uniform in the CBD. According to the characteristics of Quaternary sediments, the aquifer system in the Beijing Plain is divided into four parts in the vertical direction, including a phreatic aquifer (depth of bottom 0~−50 m), a first confined aquifer (depth of bottom −50~−100 m), a second confined aquifer (depth of bottom −100~−180 m), and a third confined aquifer (depth of bottom −180~−300 m). The CBD, with the phreatic and the first confined aquifer, is located in the southeast of the Beijing plain. Figure 1a shows that the groundwater level of the phreatic and the first confined aquifer in the CBD was steady from 2003 to 2018. Jiao, et al. [10] indicated that the surface settlement caused by the decline of groundwater levels can be ignored in the study area. Based on the above description, we think that the surface settlement being equal to the foundation settlement in the study area would be a reasonable estimation.
Many skyscrapers were built in the middle and south part of the CBD from 2000 to 2018. This process dramatically increased the additional stress generated by the building loads and accelerated the consolidation process of the soil, resulting in foundation settlement. However, the buildings in the west part of the CBD are generally less than four floors, producing a relatively low additional stress value. We analyzed the effect of the additional stress generated by building loads on foundation settlement in different parts of the CBD. The findings can help mitigate the effect of the geological environment and strengthen the reliability of the response relationship between building loads and foundation settlement.

3. Methodology and Data

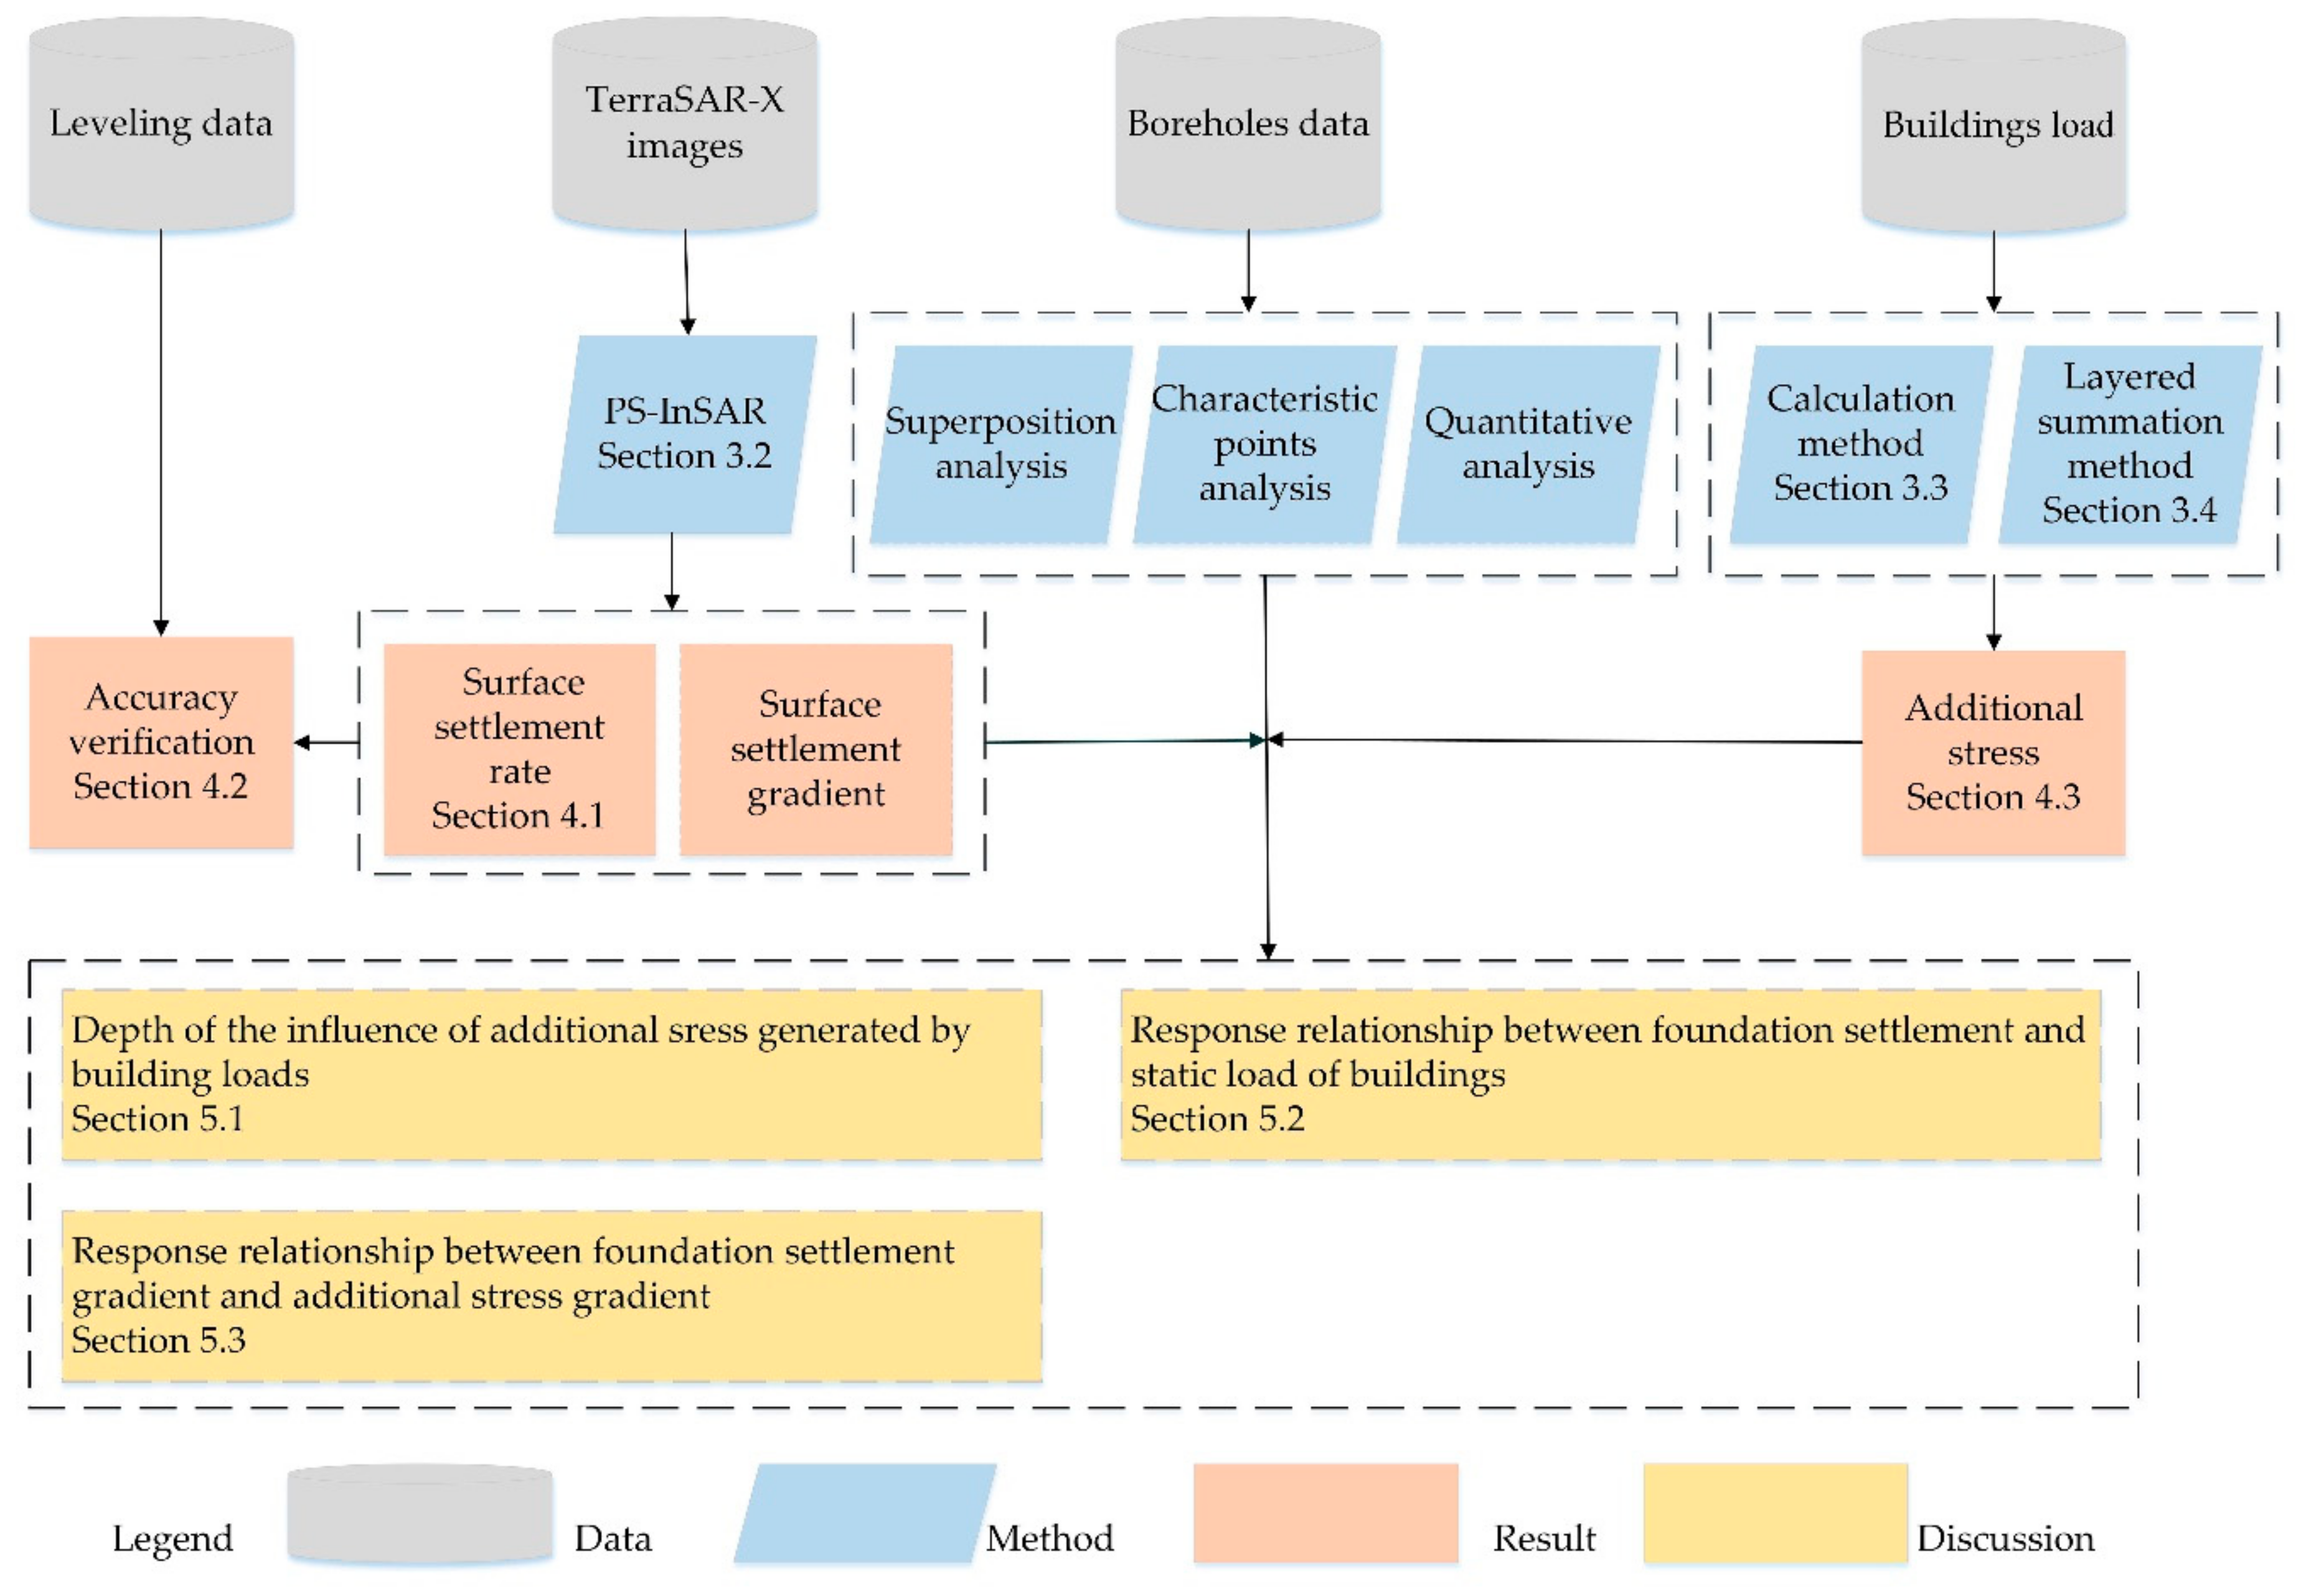
Figure 3 presents the flowchart followed in this study. Firstly, we applied the PS-InSAR method on 68 TerraSAR-X images to collect surface settlement information. Then, the accuracy of the results was validated using the leveling results. Secondly, the additional stress generated by the static load of the buildings was calculated. Finally, superposition and characteristic points analyses were applied to analyze the response relationship between additional stress and foundation settlement.

3.1. Data Source

Using 68 TerraSAR-X images collected from the descending orbit between April 2010 and October 2018, surface settlement information was obtained using the PS-InSAR technique. Covering an area of 838.4 km2, the green box in Figure 1 shows the coverage of the TerraSAR-X images. The TerraSAR-X radar satellite sensor was launched by the German Aerospace Center in June 2007. With a revisiting time of 11 days and a wavelength of 3.1 cm, the satellite works in HH polarization mode and X-band. The spatial resolution of TerraSAR-X images is up to 3 m when the radar satellite sensor operates in StripMap mode [10]. High-density persistent scatterer (PS) points can be identified in urban areas owing to the high resolution of TerraSAR-X images. The parameters of the selected TerraSAR-X images are shown in Table 1. The topographic phase was removed from the interferograms using Shuttle Radar Topography Mission digital elevation model (SRTM DEM) data with a 90 m resolution.
Eighteen leveling benchmarks—12 and 10 leveling benchmarks measuring precise ground deformation data during the 2011–2013 and 2015–2016 periods, respectively—were used to validate the reliability of the PS-InSAR results. Their locations are shown in Figure 1a. Geological data of two boreholes—named 61-D57 and 61-D65, respectively—were collected (more information is available at http://zk.cgsi.cn/ (1 April 2021)). Their locations are shown in Figure 1c. Considering that the geological structure is similar in a certain range, we think that the geological structure of group 1 and 2 characteristic points are the same as that of the boreholes of No. 61-D65 and No. 61-D57, respectively. Supplementary Tables S1 and S2 show the detailed soil structure and detail mechanical and physical parameters of the soil in the boreholes of No. 61-D65 and No. 61-D57, respectively. The main difference between the soil strata of the two borehole datasets is that the proportion of clayey silt accounts for a smaller proportion in the shallow soil layer in the borehole of No. 61-D57 than that of the borehole of No. 61-D65, especially within a depth of 10 m. The compressibility modulus of clayey silt is much smaller than that of other type soil.

3.2. SARPROZ Software Processing of the TerraSAR-X Dataset

The PS-InSAR technique was proposed by Ferretti [5]. This method detects points with stable and strong scattering characteristics as persistent scatterers (PSs). The phase caused by surface settlement can be obtained using the phase unwrapping method to remove the atmospheric, topographic, reference ellipsoid and residual phases (including thermal noise and orbital phase).This technique was implemented in SARPROZ to obtain surface settlement. First, we chose the image captured in April 2015 as the master image, and co-registered another 67 TerraSAR-X images to the master image with sub-pixel accuracy. Second, 67 interferograms were generated when the setting time baseline threshold was set to 300 days and the space baseline threshold was set to 300 m. Then, the terrain phase was removed with the aid of the SRTM DEM. Third, PSs whose amplitude stability index was greater than 0.75 were selected as persistent scatterer candidates (PSCs). Then, the Delaunay network and phase unwrapping were conducted to remove the atmospheric phase screen (APS). Afterward, PSs with a temporal coherence greater than 0.7 were selected. Lastly, the deformation time series of each PS along the line-of-sight (LOS) direction was obtained. As horizontal movement was negligible [1], the surface settlement rate was estimated using a simple trigonometric relation [1] with the aid of the LOS displacement rate.

3.3. Calculation of Additional Stress Generated by Building Loads

According to the information provided by the construction company, we found that buildings weigh approximately 1300 kg/m2 and bear 200 kg/m2 in the CBD, and soil weighs 1980~2230 kg/m3 within 100 m underground [26]. We calculated the weight of every building in the CBD by multiplying 1500 kg by the building area and subtracting the weight of soil displaced by the foundation of the building. To simplify this complicated calculation, we considered that the building loads act on the centroid of the building. We generated a set grid of points along the latitude, longitude, and vertical dimensions in 10 m intervals. The additional stress of different depths at each point in the generated grid was calculated by adding the additional stress generated by each building load in the CBD using Equation (2) [27]. Each parameter in Equation (2) is defined in Table 2.
σ = i = 1 n 3 P i 2 π ( Z Z i ) 3 ( X X i ) 2 + ( Y Y i ) 2 + ( Z Z i ) 2 5 / 2 P i = ( 1.5 A i H i 2.9 A i D i W s ) g

3.4. Calculating the Foundation Settlement Caused by Additional Stress Generated by Building Loads by Using Layered Summation Method

As an extension of the layered summation method, the foundation settlement of soil compression generated by additional stress caused by building loads can be calculated by using Equation (3):
S = i = 1 n P ( h i ) E ( h i ) h i
where S is the final cumulative foundation settlement of soil compression caused by additional stress, P ( h i ) is the additional stress at a depth of h meters, E ( h i ) is the compressibility modulus at a depth of h meters (we think that this parameter is a constant in each soil layer), n is the number of the soil layer and h i is the thickness of soil layer No. i .
The compression ratio of soil was calculated by using Equation (4) to represent the proportion of the soil compression process:
R = S t S f
where R is the compression ratio of the soil, S t is the cumulative foundation settlement, and S f is the final cumulative foundation settlement of the soil compression caused by additional stress.
Based on Equations (3) and (4), Equation (5) was derived to calculate the foundation settlement rate:
v = S f R 2 -   S f R 1 T 2 T 1
where S f is the final cumulative foundation settlement, T 1 and T 2 are two observation times, v is the average settlement during the two observation times, and R 1 and R 2 are the compression ratios of the soil at observation times T 1 and T 2 , respectively.
Based on Equations (3)–(5), we derived Equation (6) to calculate the foundation settlement rate gradient:
Δ S f = i = 1 n Δ P ( h i ) E ( h i ) h i G = Δ S f R 2 -   Δ S f R 1 T 2 T 1
where Δ S f is the final differential cumulative foundation settlement of soil compression caused by additional stress, Δ P ( h i ) is the differential additional stress at a depth of h meters, E ( h i ) is the compressibility modulus at a depth of h meters (we think that this parameter is a constant in each soil layer), n is the number of the soil layer and h i is the thickness of soil layer No. i . T 1 and T 2 are two observation times, G is the foundation settlement rate gradient during the two observation times, and R 1 and R 2 are the compression ratios of the soil at observation times T 1 and T 2 , respectively.

4. Results

4.1. Surface Settlement Measured by PS-InSAR

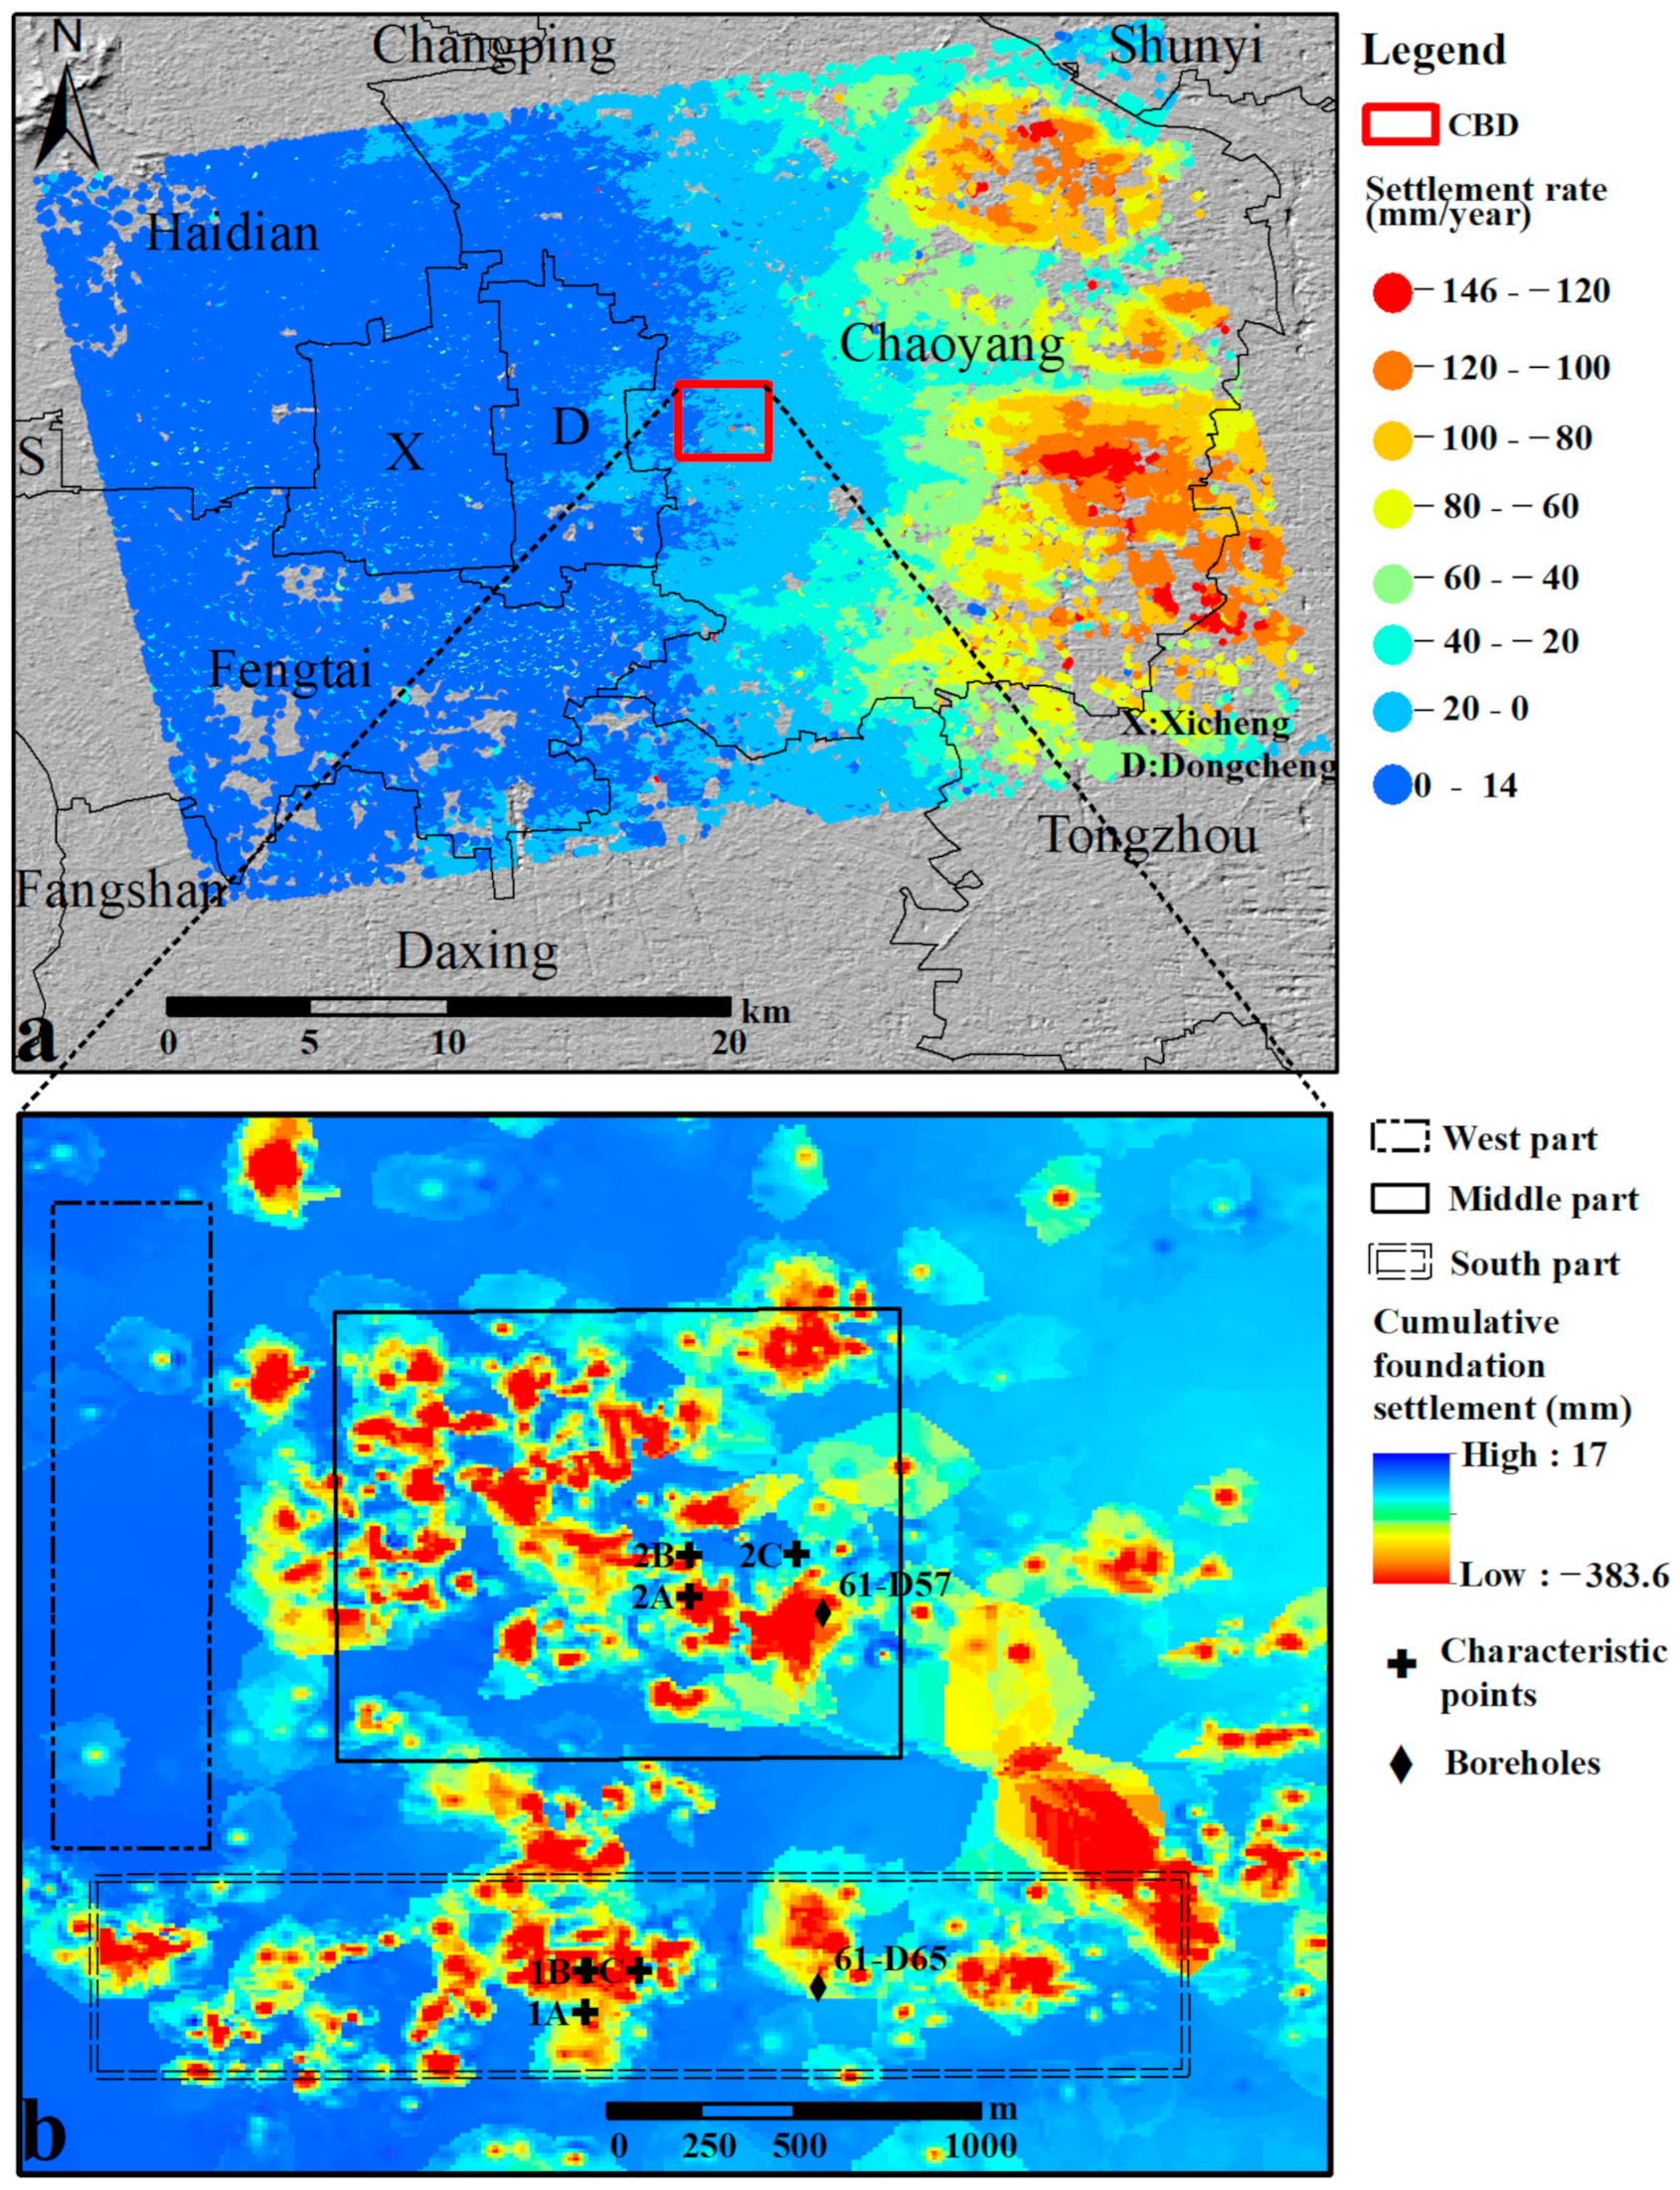
Based on the PS-InSAR technique, 395,778 pixels were selected as PS points during the observation periods between April 2010 and October 2018. Due to the high resolution of TerraSAR-X images, the density of the selected PS points was 472 pixels/km2. As the deformation along the horizontal direction in the Beijing Plain can be ignored, the surface settlement velocity was calculated using Equation (7) [1]:
V = V los cos φ
where V and Vlos represent the displacement rate along the vertical and LOS directions, respectively; φ is the incidence angle of the InSAR. Figure 4a shows that the average surface settlement rate varied from −145.2 to 24 mm/year and that surface settlement mainly occurs in Chaoyang and Tongzhou Districts, where groundwater has been excessively extracted in the past several decades. To produce a surface settlement rate map of the CBD, the kriging interpolation method was used at the PS points. Figure 4b shows that the cumulative foundation settlement varied from −383 to −5 mm in the middle and south of the CBD, where many skyscrapers are located, and that the cumulative foundation settlement varies from −52 to 17 mm in the west part of the CBD, where the buildings are generally less than four floors.

4.2. Accuracy Verification of PS-InSAR Results

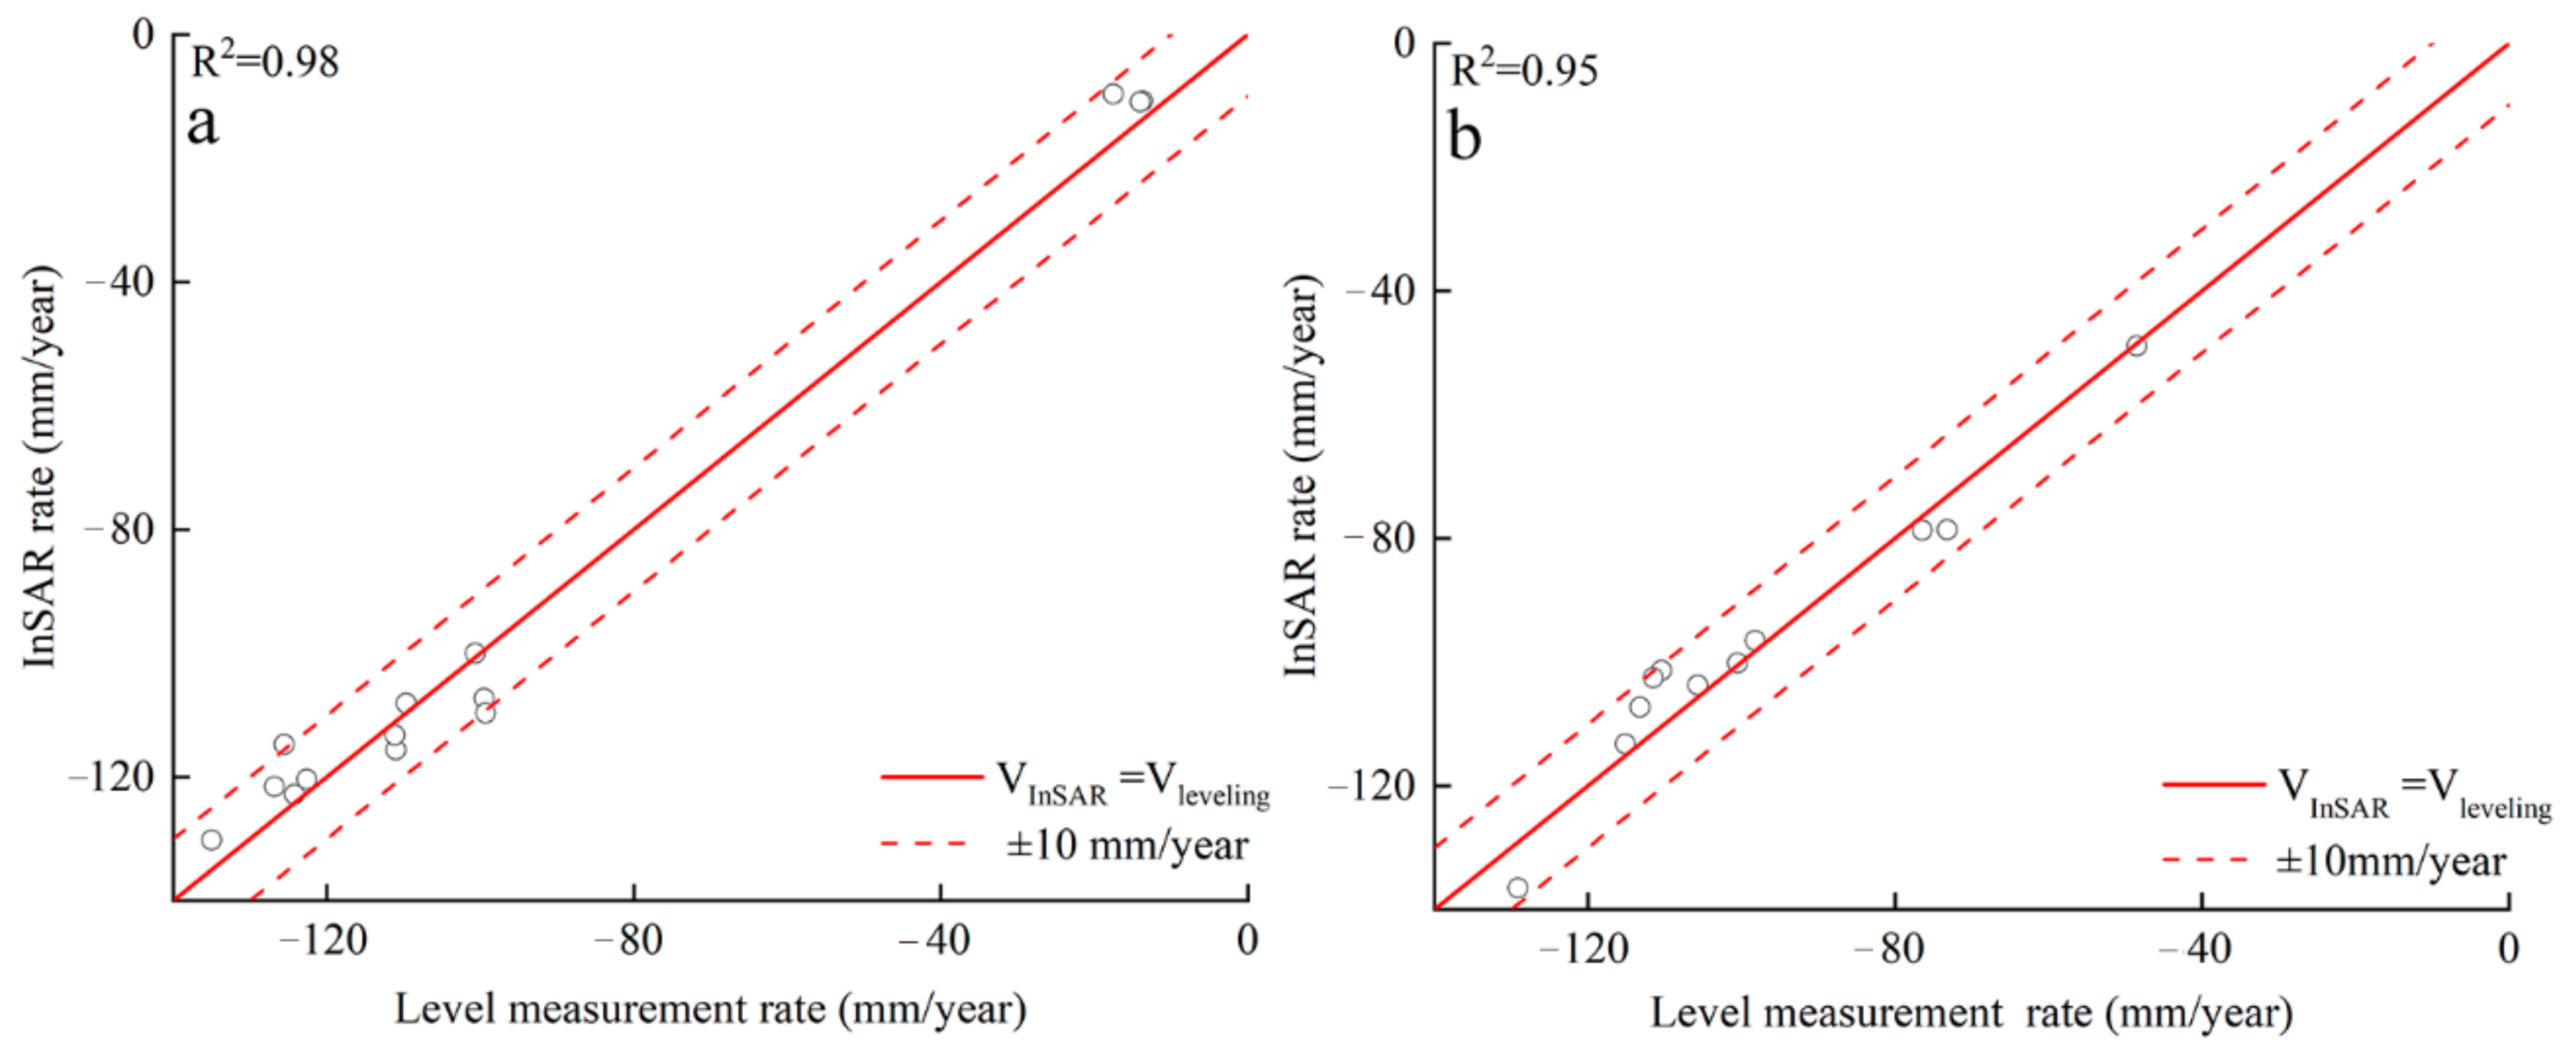
We selected 18 leveling benchmarks, which, as shown in Figure 1a, are distributed in the image coverage area, to verify the accuracy of the PS-InSAR results. Because there were no precise leveling measurement data available during the observation periods from 2011 to 2018, based on the PS-InSAR results, the average surface settlement velocity was calculated. The annual displacement rate of the selected leveling benchmark was compared with the average displacement rate of the PS points within 100 m of the leveling benchmark from 2011 to 2013 and 2015 to 2016. Figure 5 shows that the PS-InSAR monitoring results agree well with the monitoring results derived from the leveling benchmarks from 2011 to 2013 and 2015 to 2016, and the Pearson correlation coefficients were 0.98 and 0.95, respectively. With a root mean square error (RMSE) of 3.7 mm/year, the maximum, minimum, and mean deviations of the measurement results were 9.7, 0.2, and 3.8 mm/year for 2011 to 2013, respectively. With an RMSE of 3.9 mm/year, the maximum, minimum, and mean deviations of the measurement results were 9.4, 0.2, and 4.2 mm/year for 2015 to 2016, respectively. The comparison of the results indicated that the surface settlement results derived from PS-InSAR technology were highly accurate.

4.3. Additional Stresses Induced by Building Loads

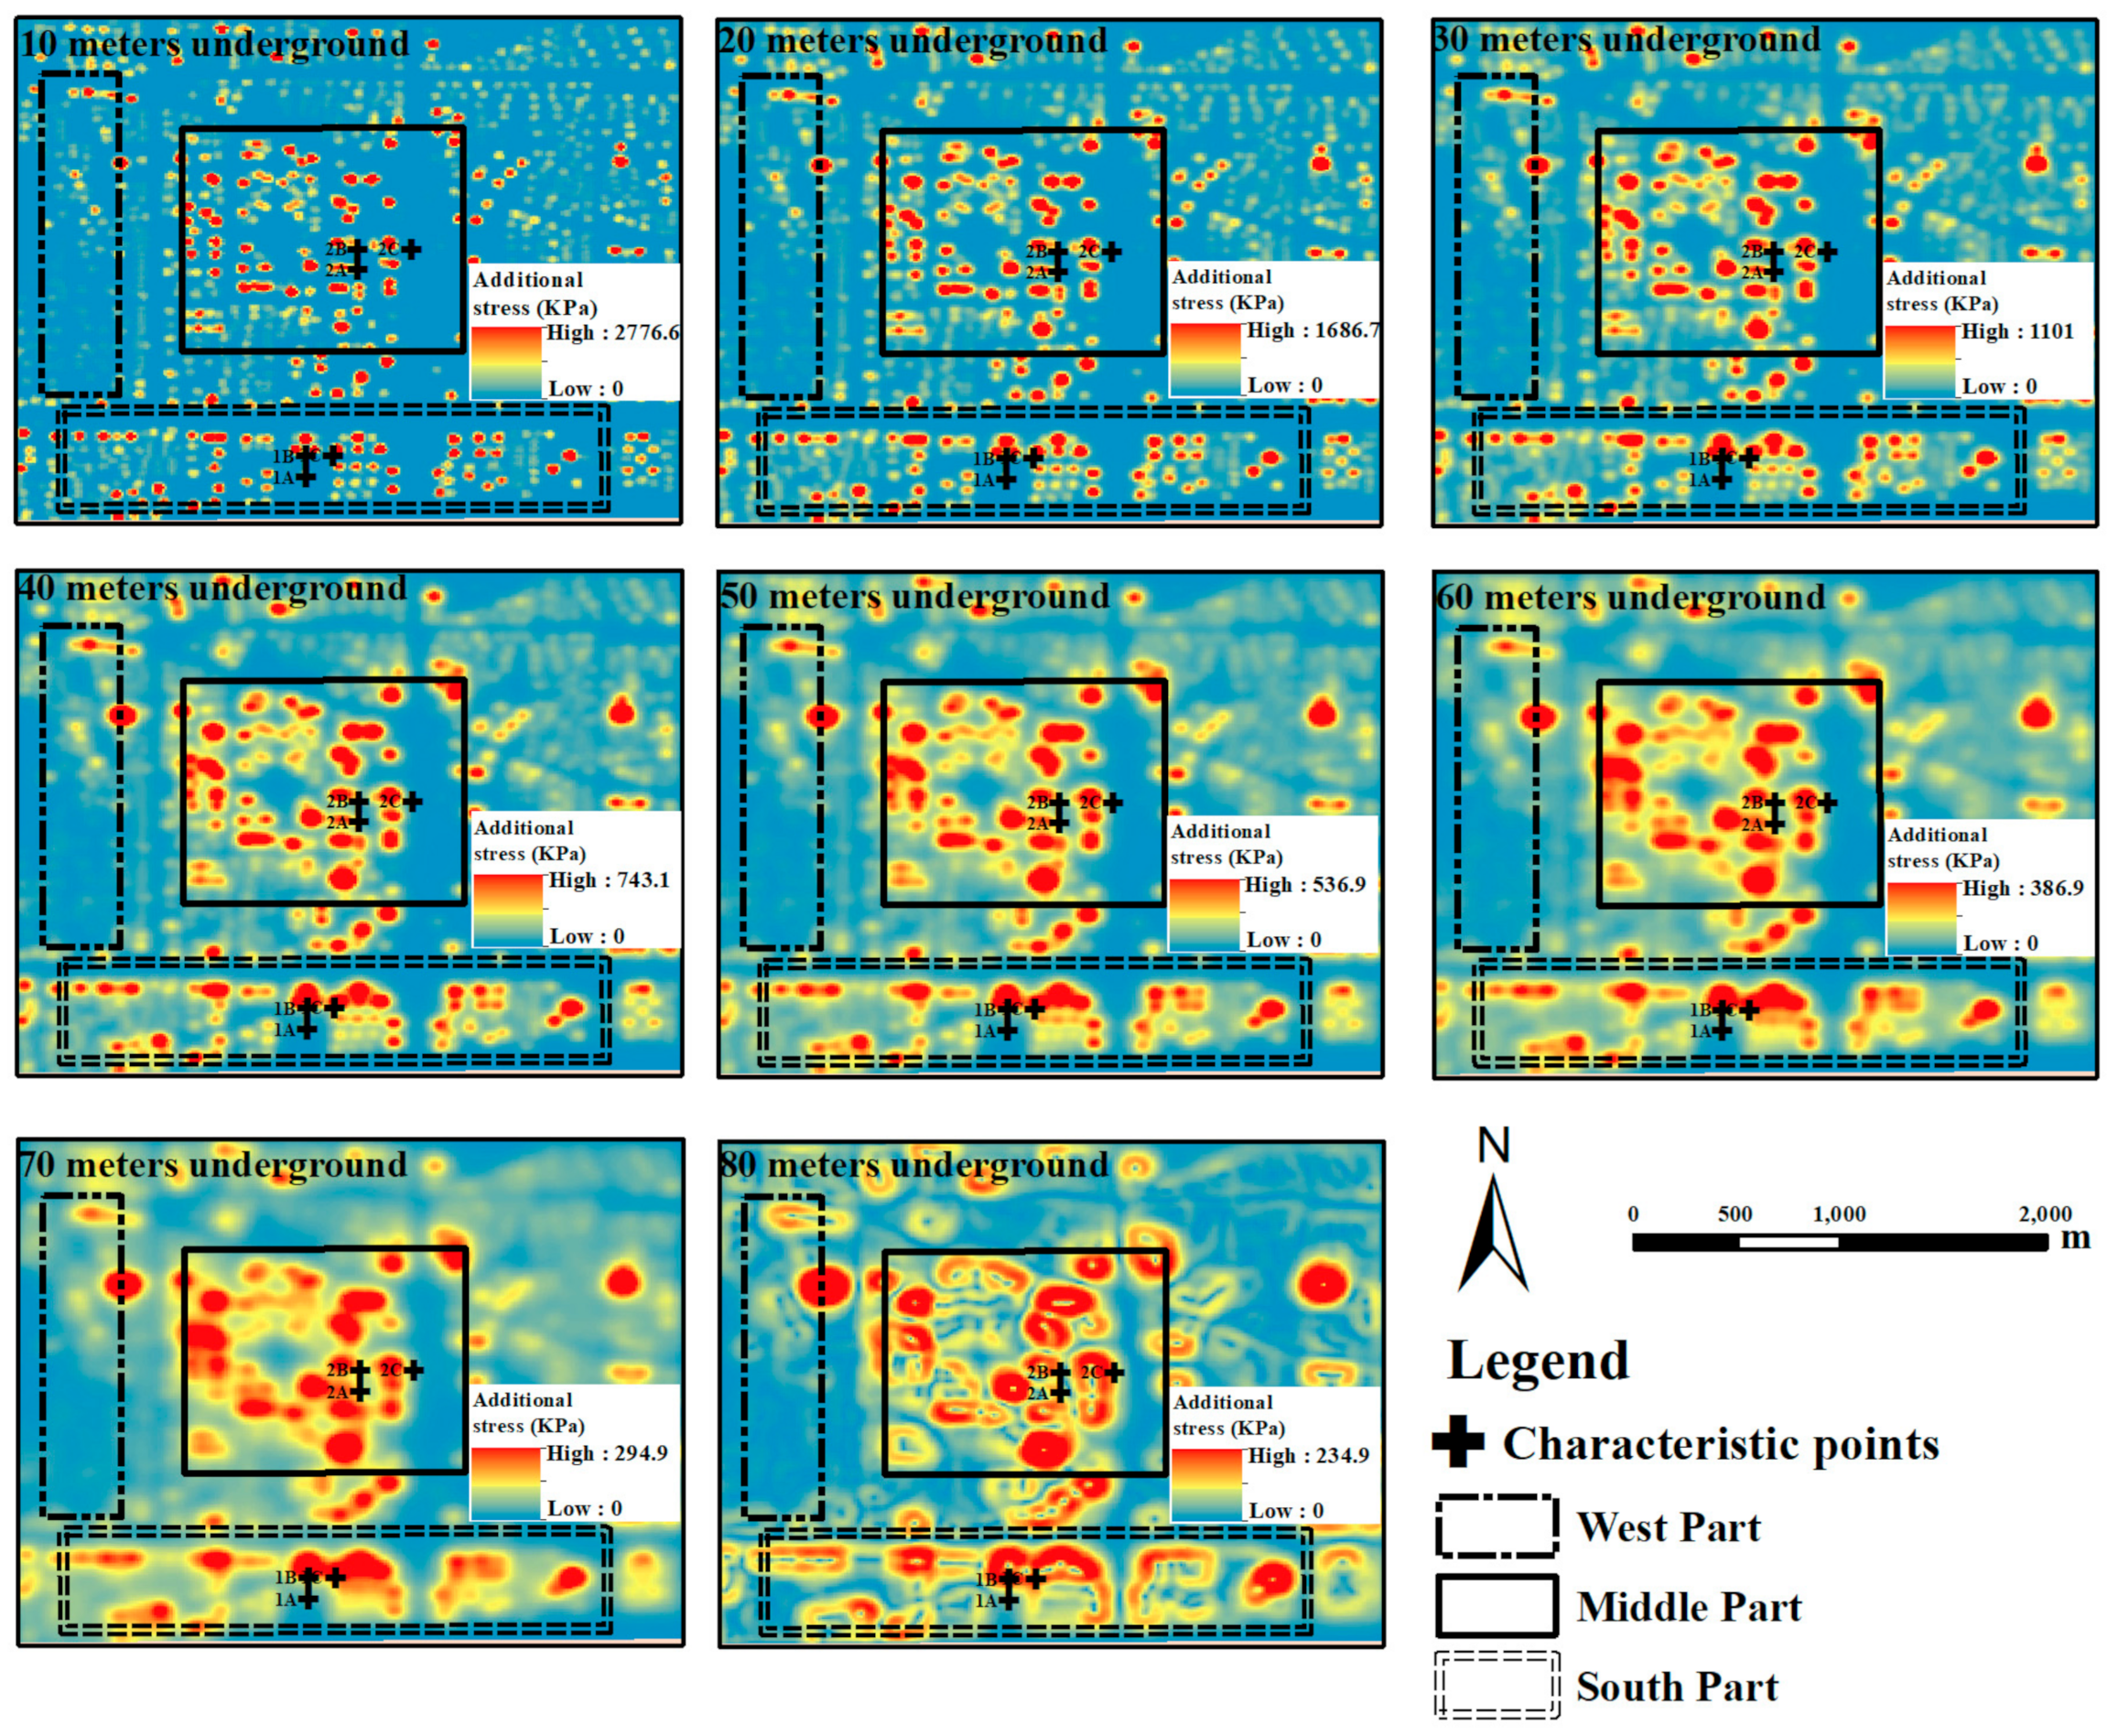
According to building information provided by the relevant departments, the weight of buildings in the CBD was calculated. Then, a set of grid points was generated along the longitude, latitude, and vertical dimensions in 10 m intervals. Using Equation (2), the additional stress of every point in the generated grid was calculated. We produced additional stress maps (Figure 6) at different depths in the CBD using a kriging interpolation tool.

5. Discussion

5.1. Depth of the Influence of Additional Stress Generated by Building Loads

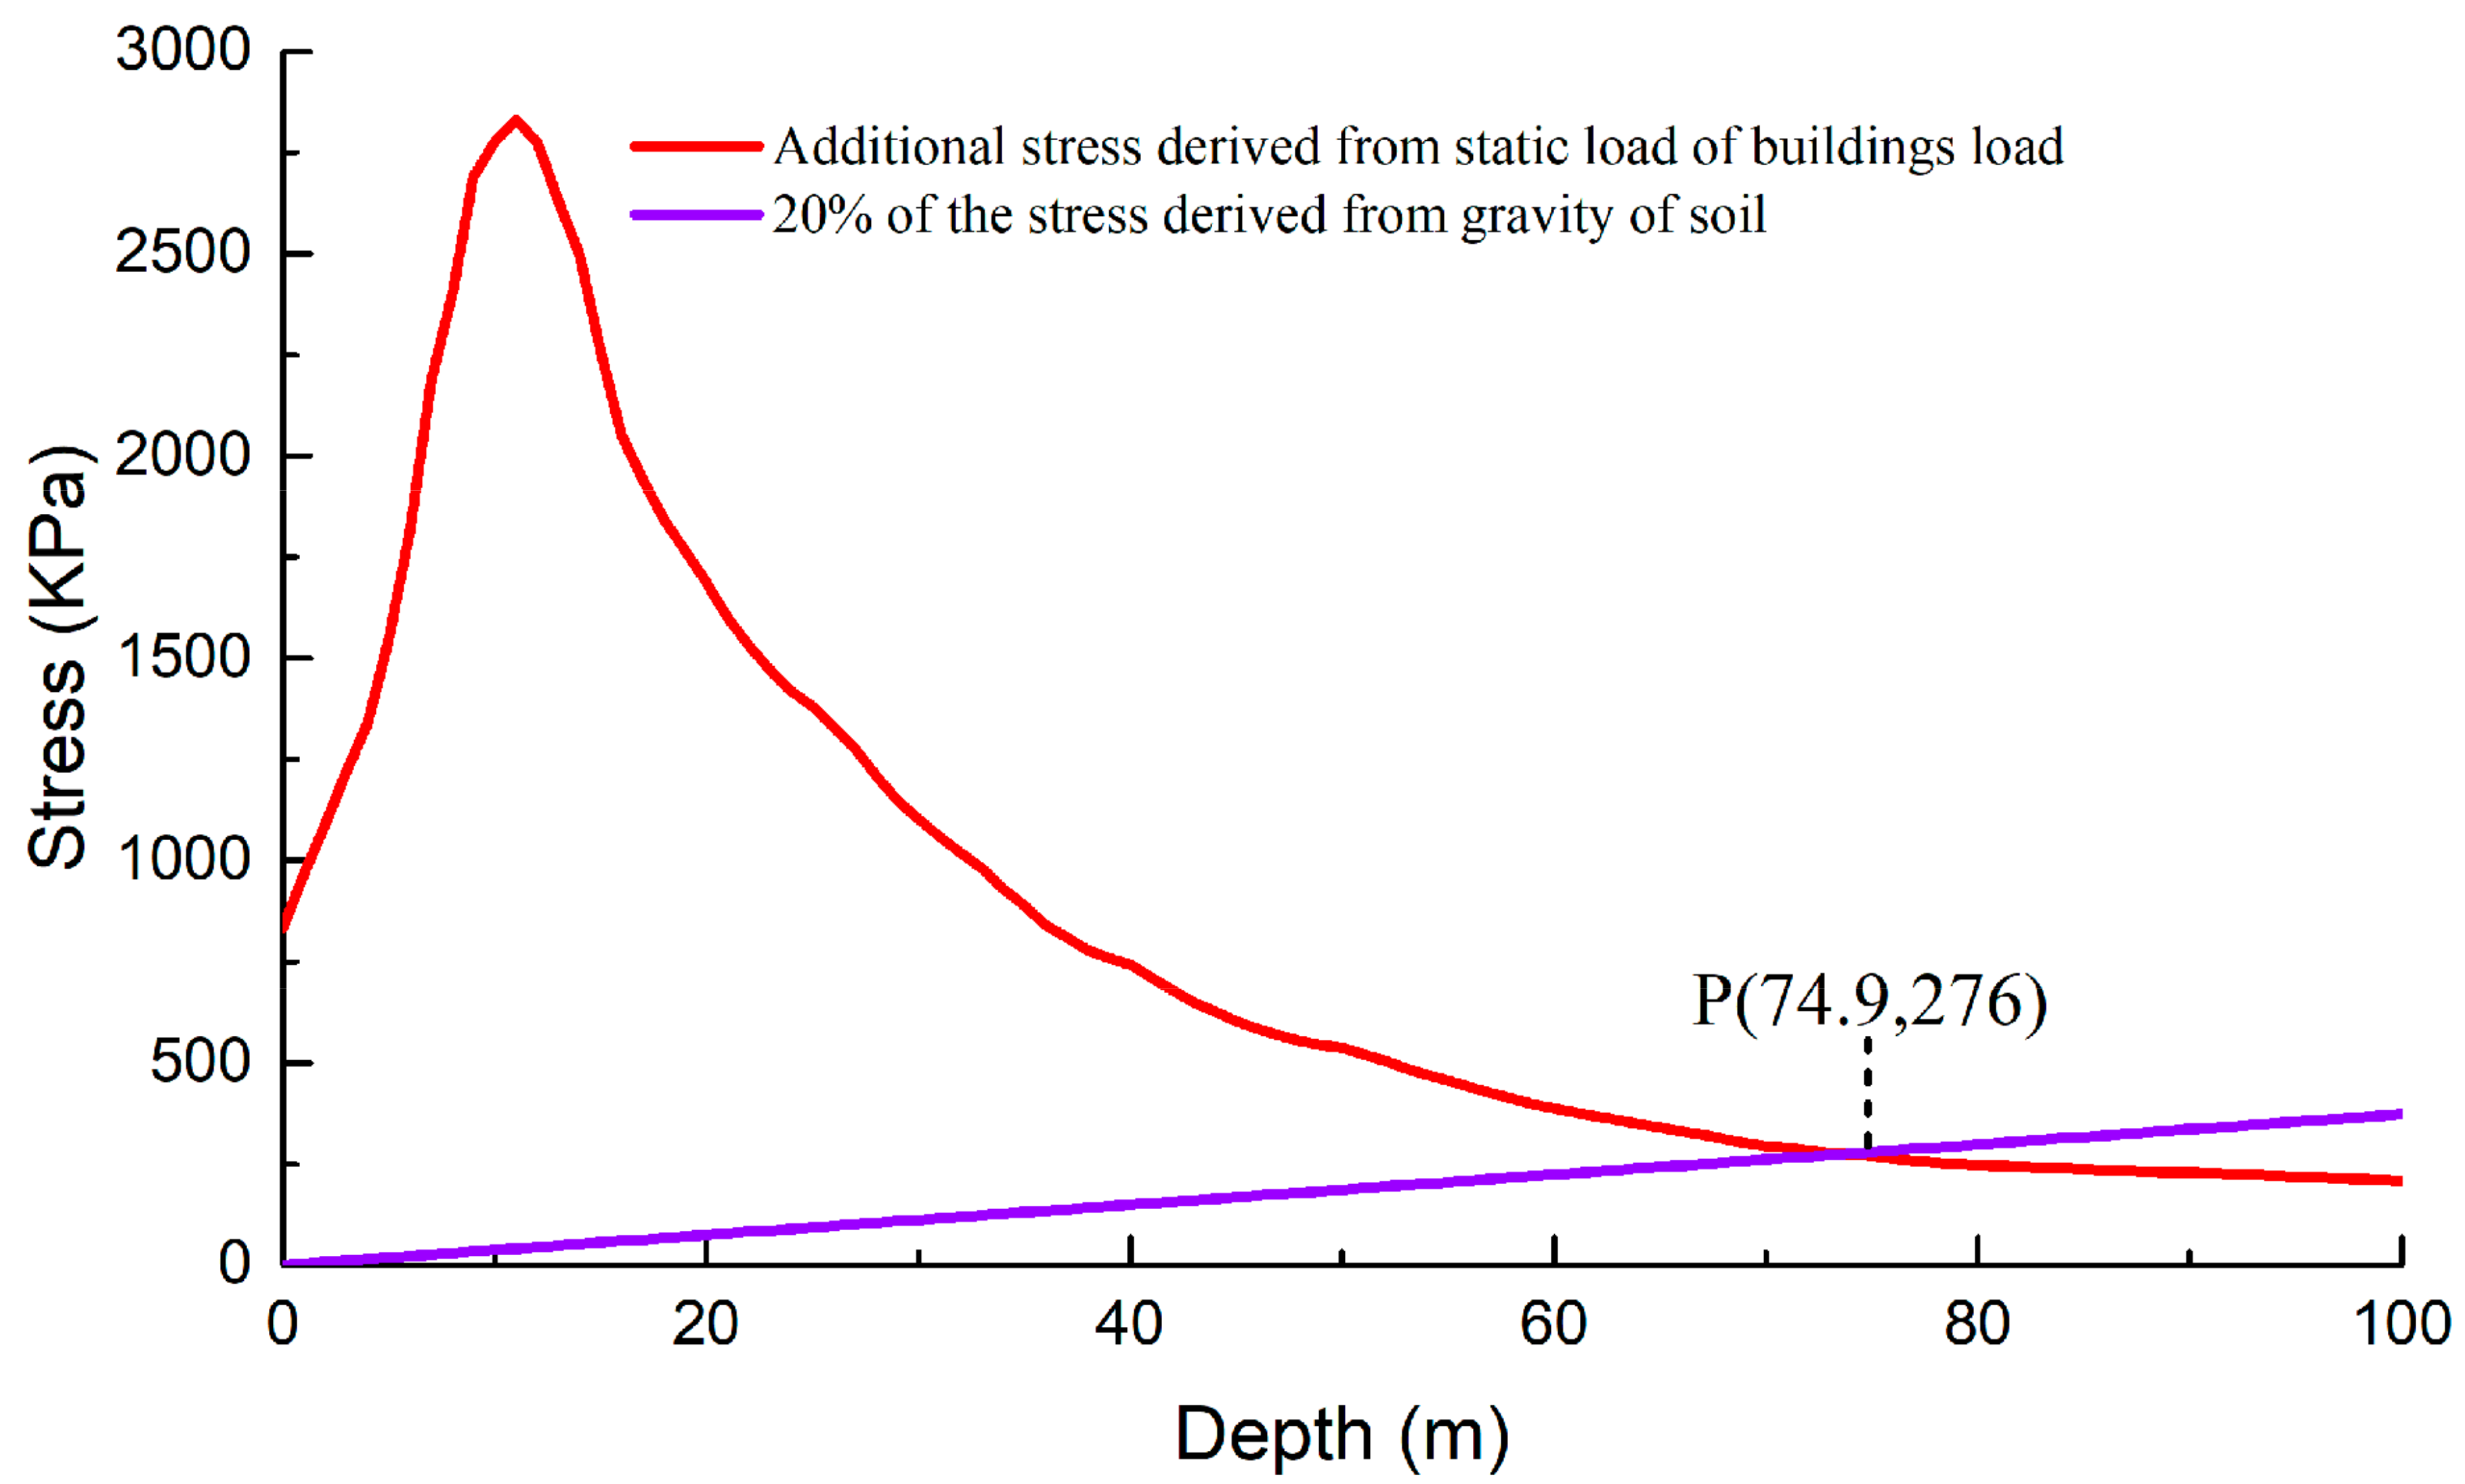
According to the corresponding engineering construction standards (Code for design of building foundations, namely GB 50007-2002), the additional stress generated by building loads cannot cause stratum deformation when the additional stress is less than 20% of the pressure generated by the gravity of the soil above this depth [1]. Figure 7 reveals that this condition can be satisfied when the stratum depth reaches 74.9 m underground, which indicates that the depth of the influence of additional stress generated by the static load of high-rise buildings is 74.9 m in the CBD. Supplementary Tables S1 and S2 list the detailed mechanical and physical parameters of the soil in the CBD.

5.2. Response Relationship between Foundation Settlement and Static Load of Buildings

5.2.1. Spatial Response Relationship between Foundation Settlement Rate and Static Load of Buildings

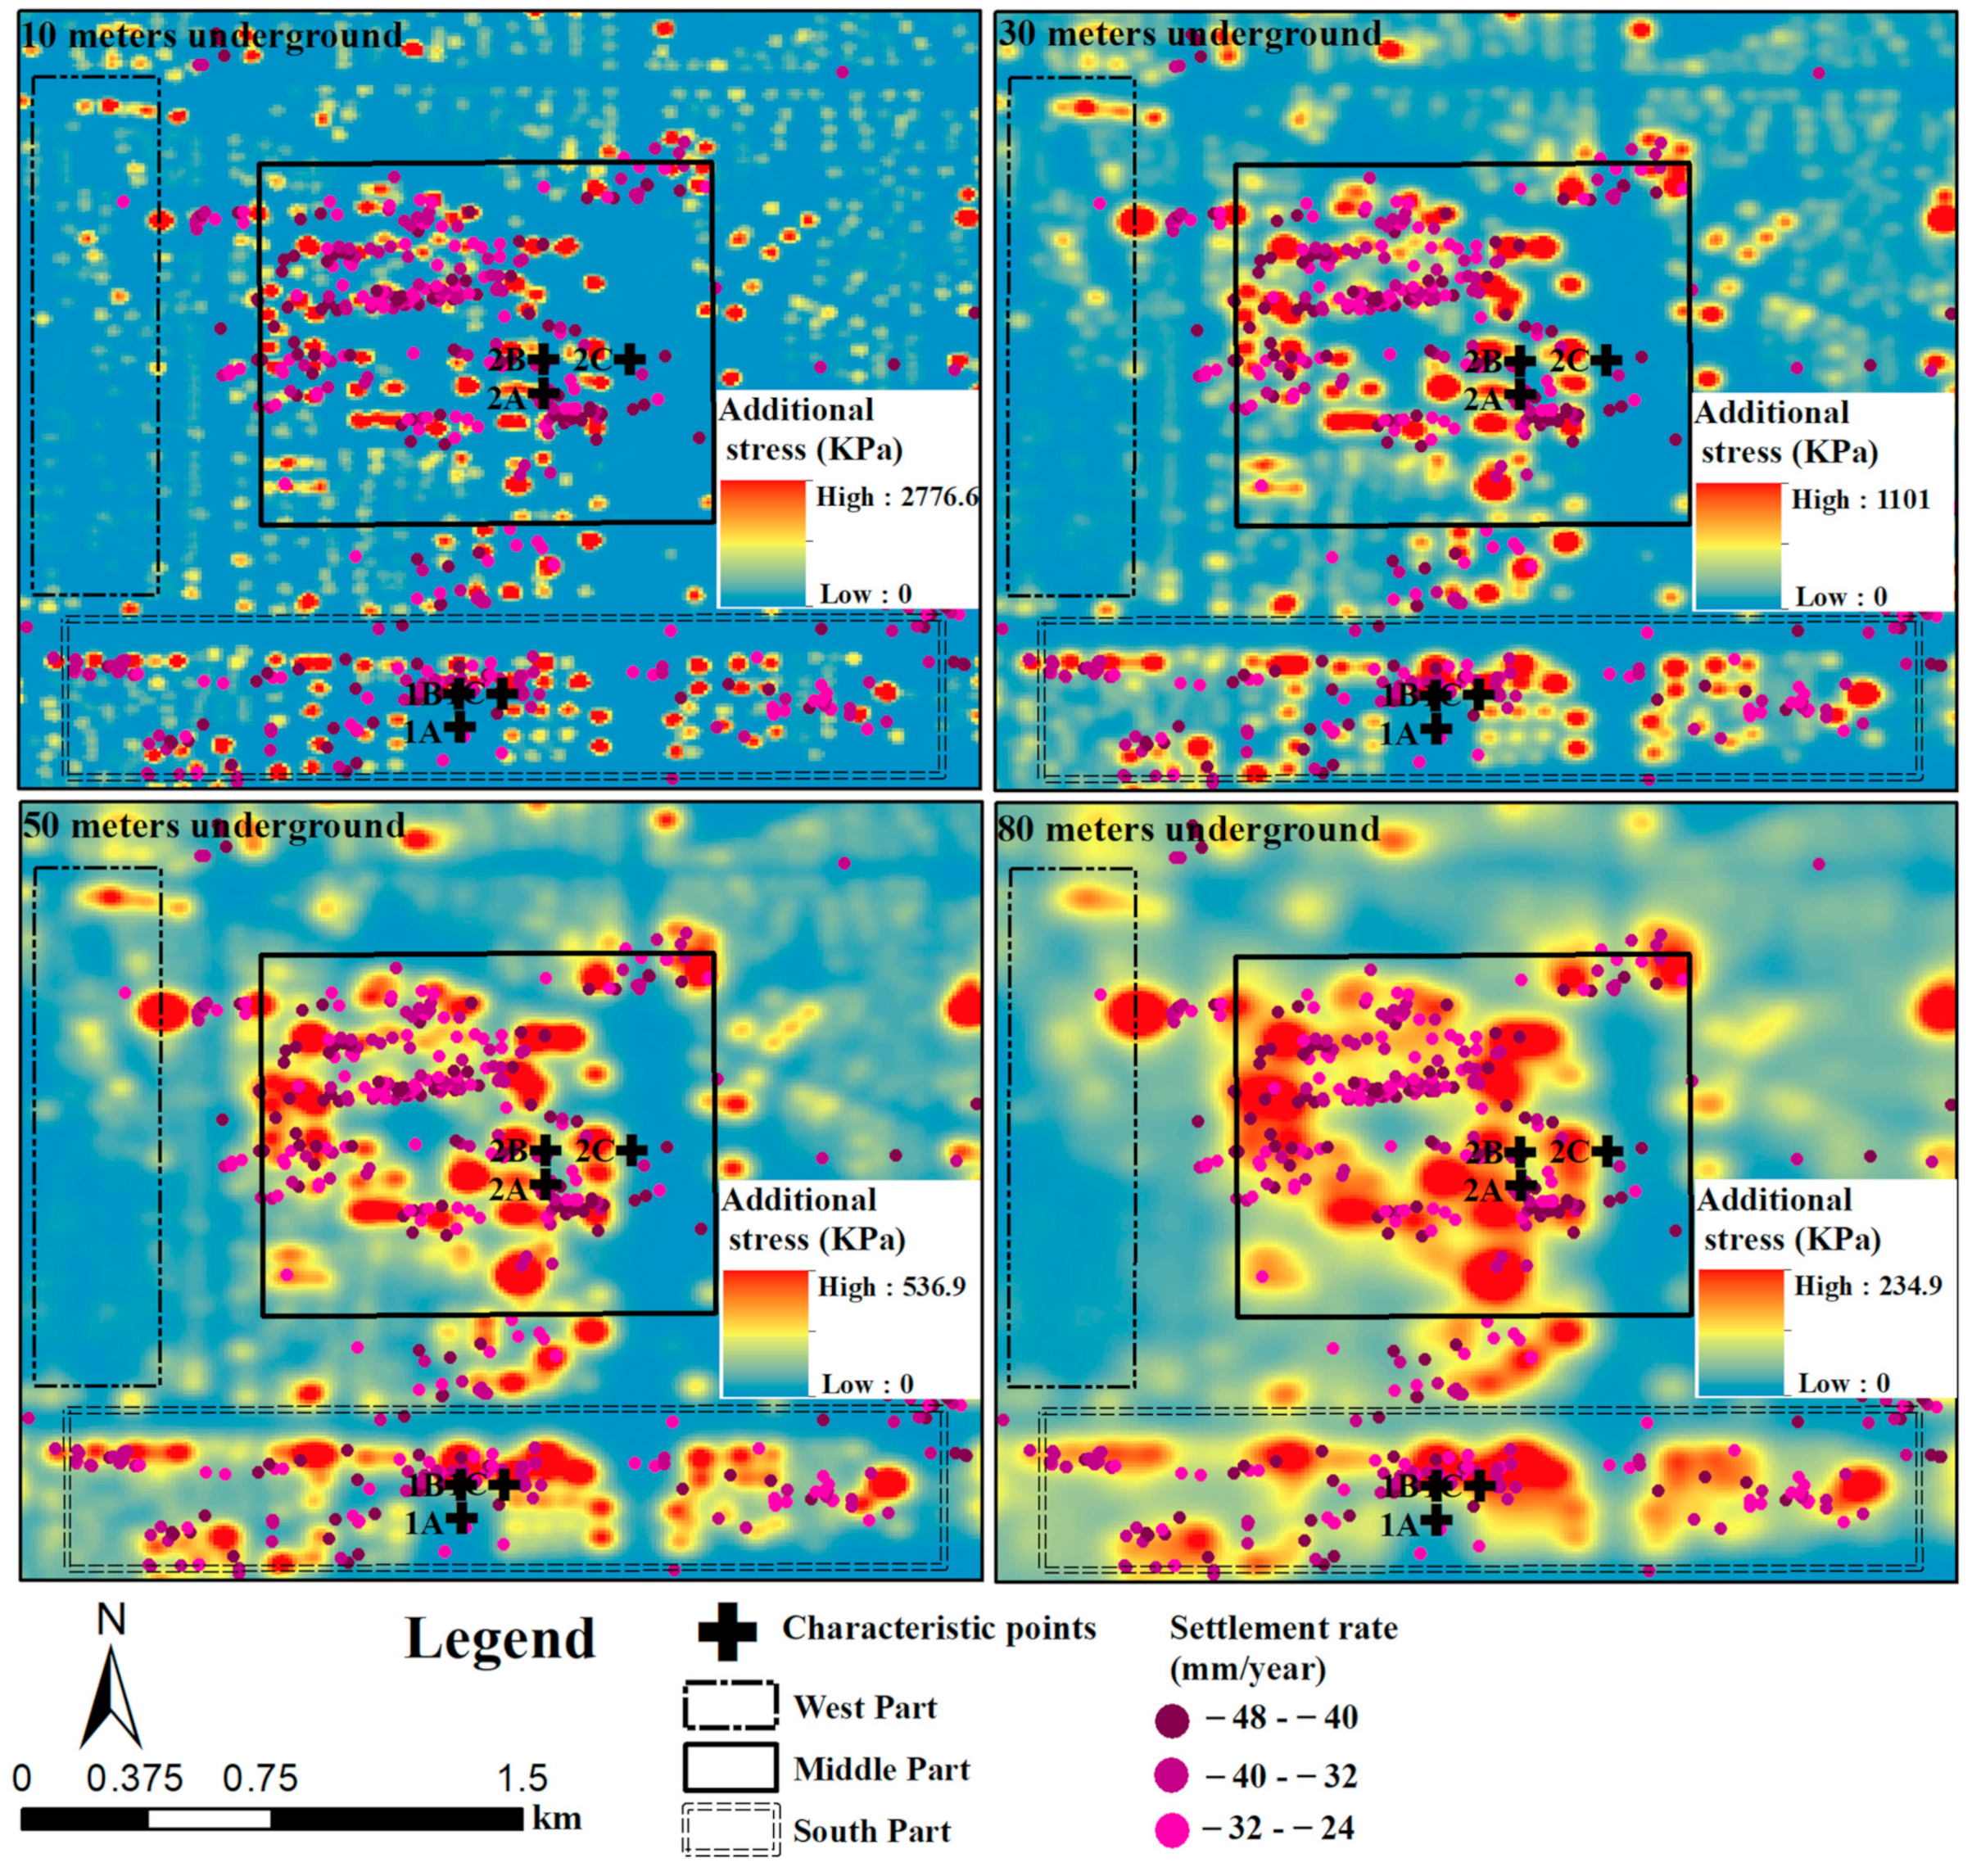
To explore the spatial response relationship between the foundation settlement rate and the static load of buildings, the foundation settlement rate map was overlaid on the additional stress maps at different depths. Figure 8 reveals that their spatial distribution is highly consistent. The additional stress in the western part of the study area is much smaller than in the south and middle parts of the study area at the same depth. We found that the foundation settlement rate range is −5.9 to 2 mm/year in the west part of study area, and −47.9 to −0.5 mm/year in the middle and south parts of study area. To present the spatial relationship between the foundation settlement rate and additional stress, Figure 8 only shows the PS points with a settlement rate greater than 24 mm/year.
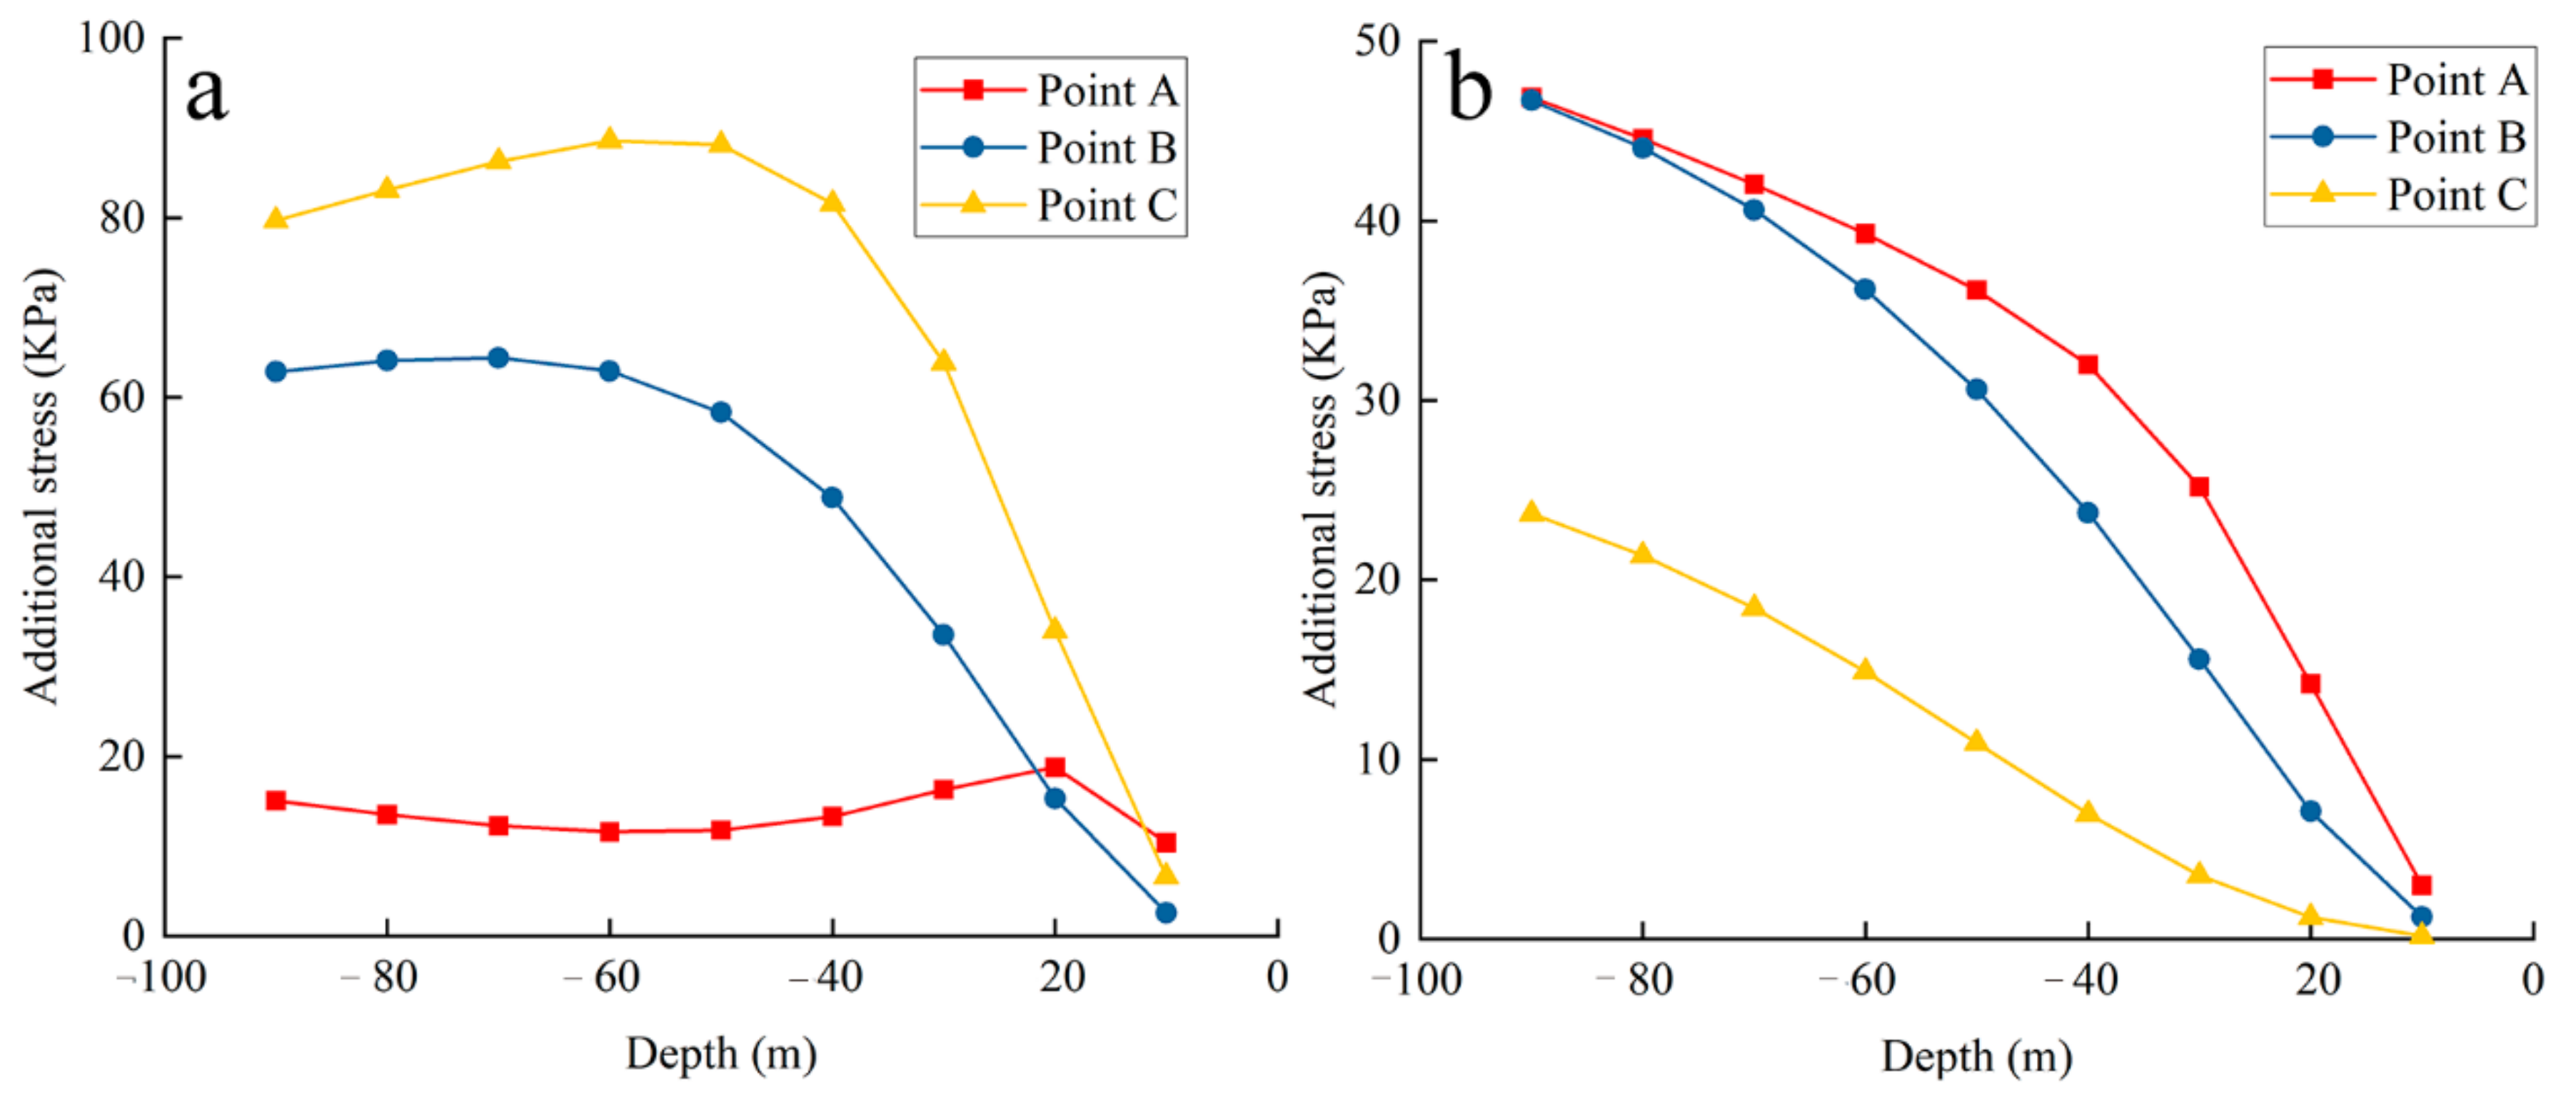
To better understand the response relationship, two sets of characteristic points, including groups 1 and 2 in different parts of the study area, were selected. Notably, the characteristic points in each group had similar geological environments. The additional stress generated by building loads at different depths for the two sets of characteristic points are displayed in Figure 9. We found that the foundation settlement rates at points A, B, and C in group 1 were −3.5, −13.7, and −22.7 mm/year, respectively. Figure 9a shows that the additional stress of Point C is greater than that of Point B at the same depth and that the additional stress of Point B is greater than that of Point A at the same depth. We found that a characteristic point with greater additional stress generally has a larger settlement rate. This phenomenon is also found at characteristic points in group 2.

5.2.2. Quantitative Response Relationship between Foundation Settlement Rate and Static Load of Buildings

We calculated the final cumulative foundation settlement at the characteristic points by using Equation (3). For the characteristic points in group 1, we found that the final cumulative foundation settlement at points A, B, and C were 40.8, 152.2, and 250.3 mm, respectively. For the characteristic points in group 2, we found that the final cumulative foundation settlement at points A, B, and C were 471.6, 272.2, and 44.2 mm, respectively. Figure 10 shows the time series settlement of the characteristic points. For the characteristic points in group 1, the cumulative foundation settlement from April 2010 to October 2018 at points A, B, and C were 29.5, 116.5 and 193.3 mm, respectively. For the characteristic points in group 2, the cumulative foundation settlement from April 2010 to October 2018 at points A, B, and C were 287.5, 155.5, and 22.3 mm, respectively.
We calculated the compression ratio of the two sets’ characteristic points and found that the compression ratio of the characteristic points A, B, and C in group 1 were 72.3%, 76.5%, and 77.2%, respectively, and that of the characteristic points A, B, and C in group 2 were 61%, 57.1%, and 50.5%, respectively. The compression ratio of the characteristic points in group 2 was significantly smaller than that of the characteristic points in group 1 from April 2010 to October 2018, indicating that the characteristic points in group 2 will take more time to complete the consolidation process. We found that a characteristic point in the same group with greater additional stress had a higher compression ratio, which indicates that a characteristic point with greater additional stress will require less time to complete the consolidation process and has a higher settlement rate.
Figure 10a shows that the settlement rate of the characteristic points in group 1 decreases with time. This phenomenon was not found for the characteristic points in group 2. This phenomenon should be attributed to the proportion of clayey silt in shallow soil strata.

5.3. Response Relationship between Foundation Settlement Gradient and Additional Stress Gradient

5.3.1. Spatial Response Relationship between Foundation Settlement Rate Gradient and Additional Stress Gradient

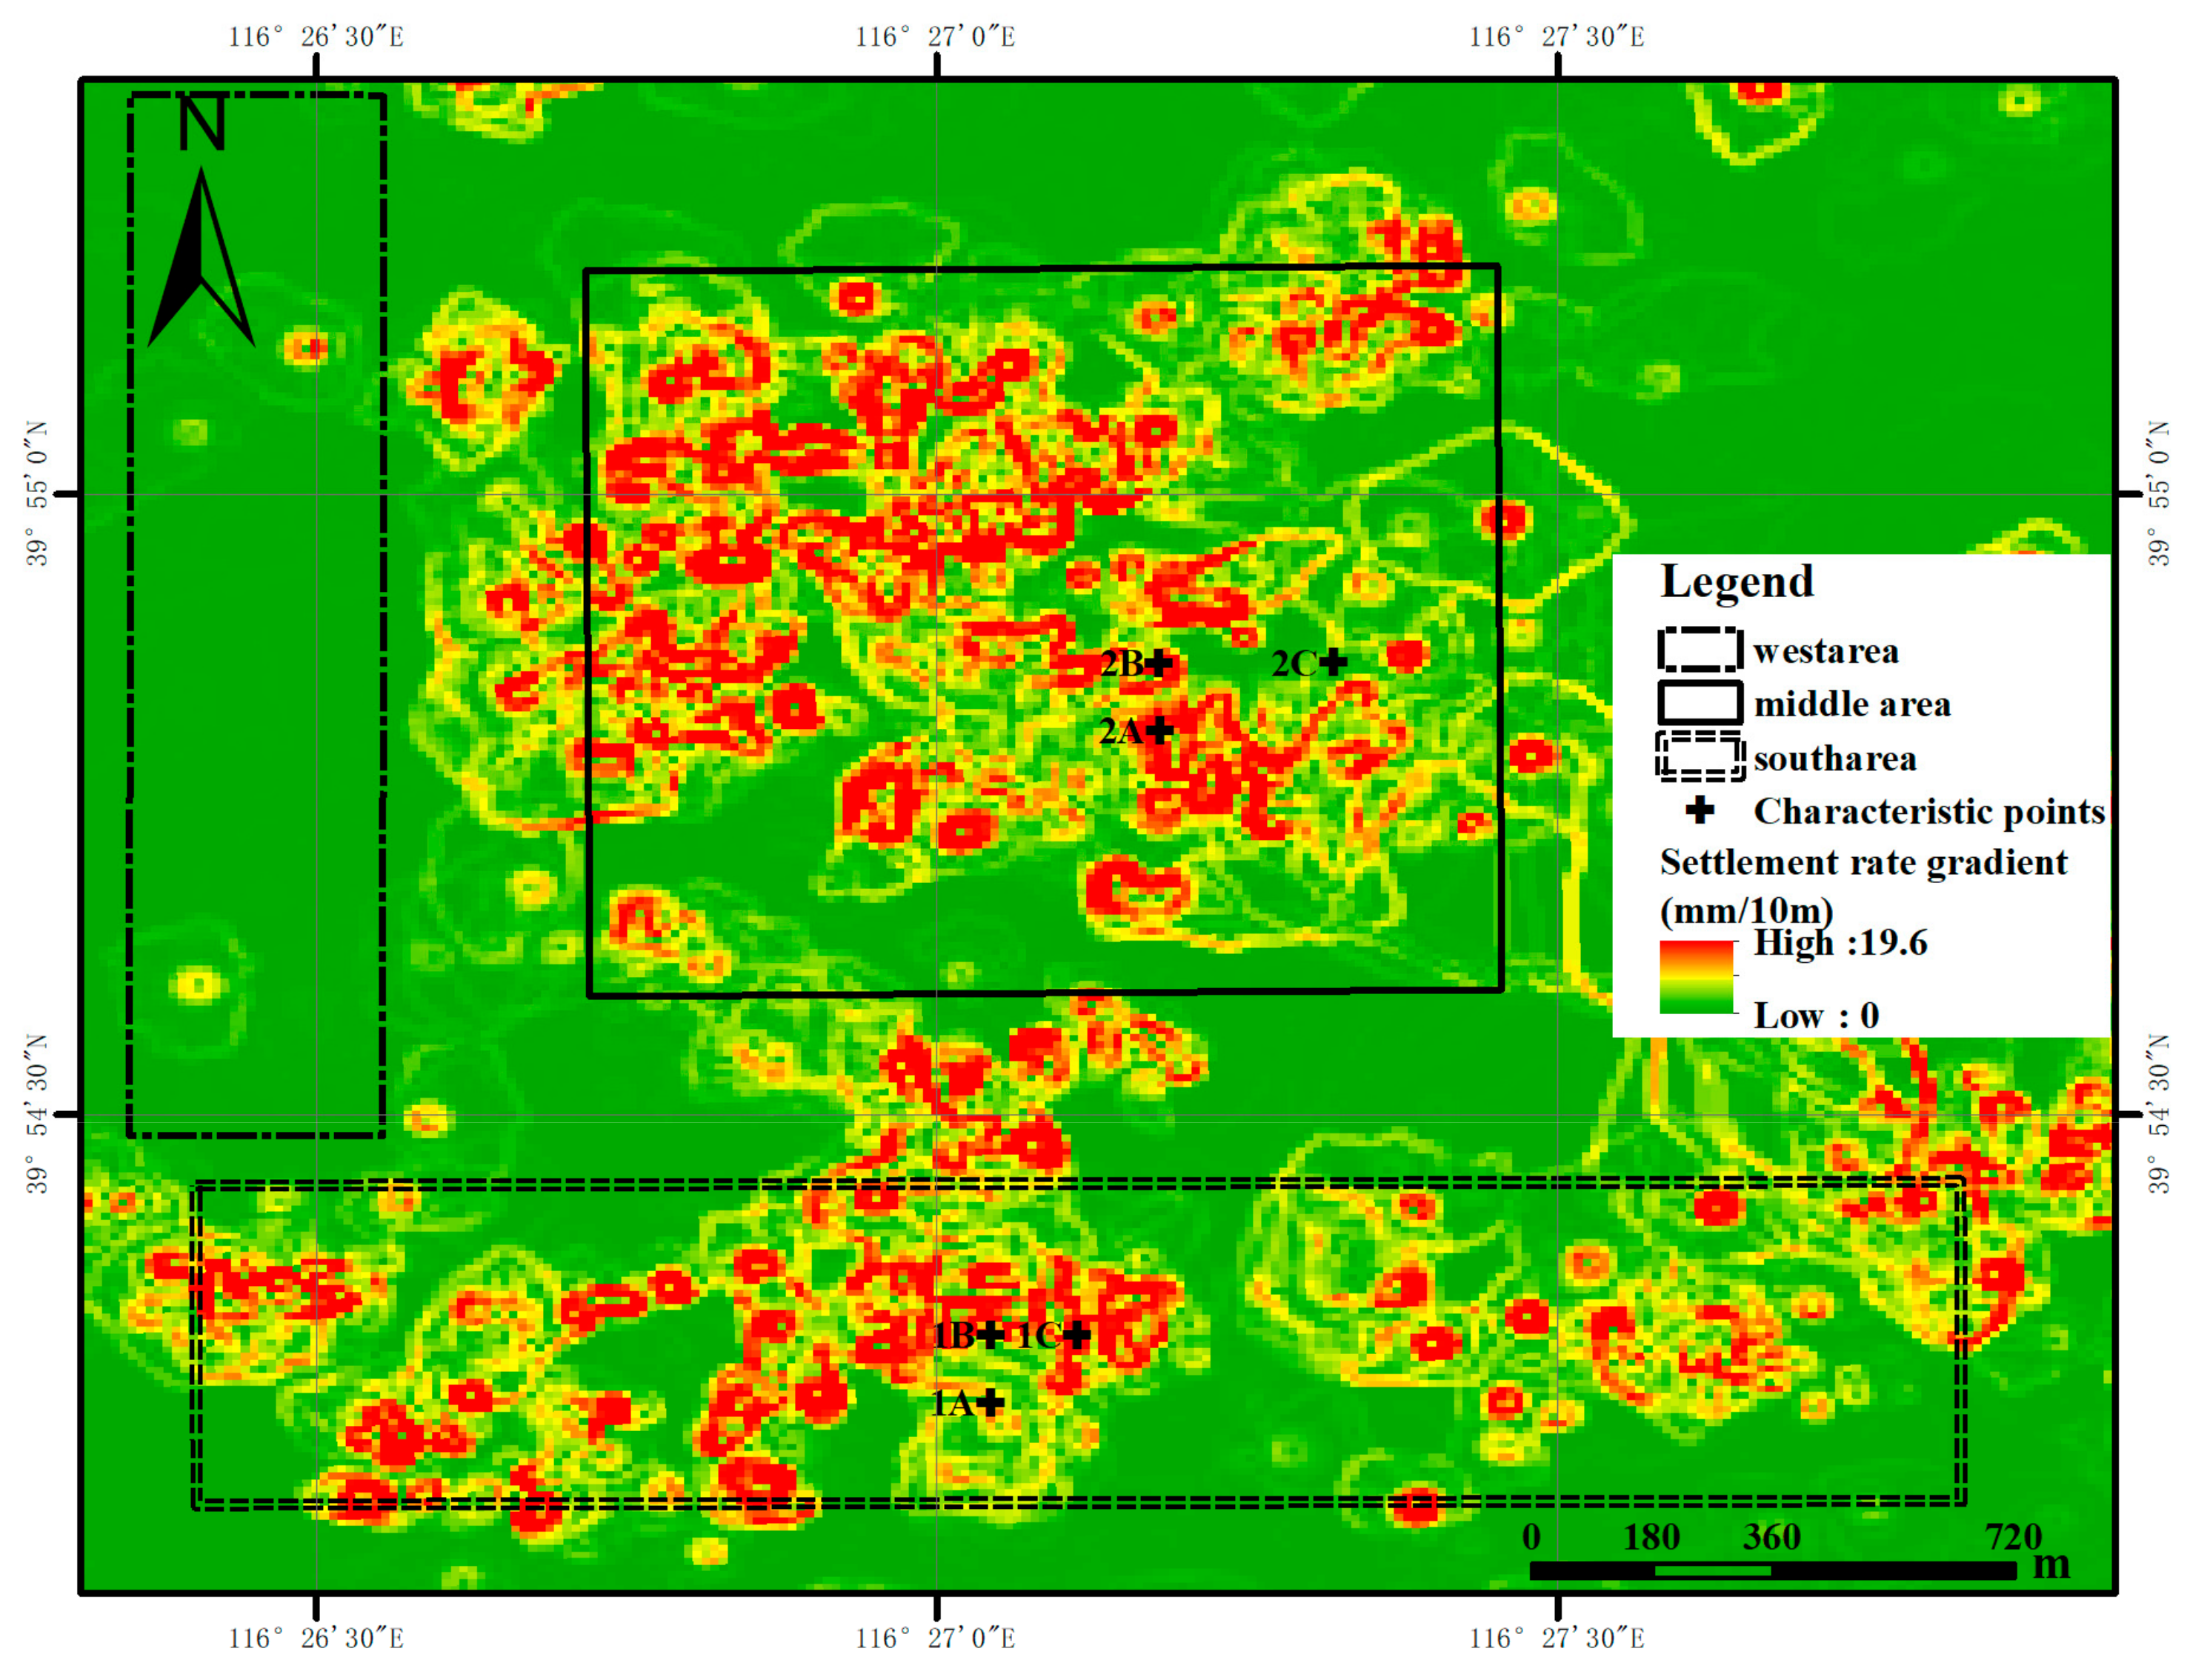
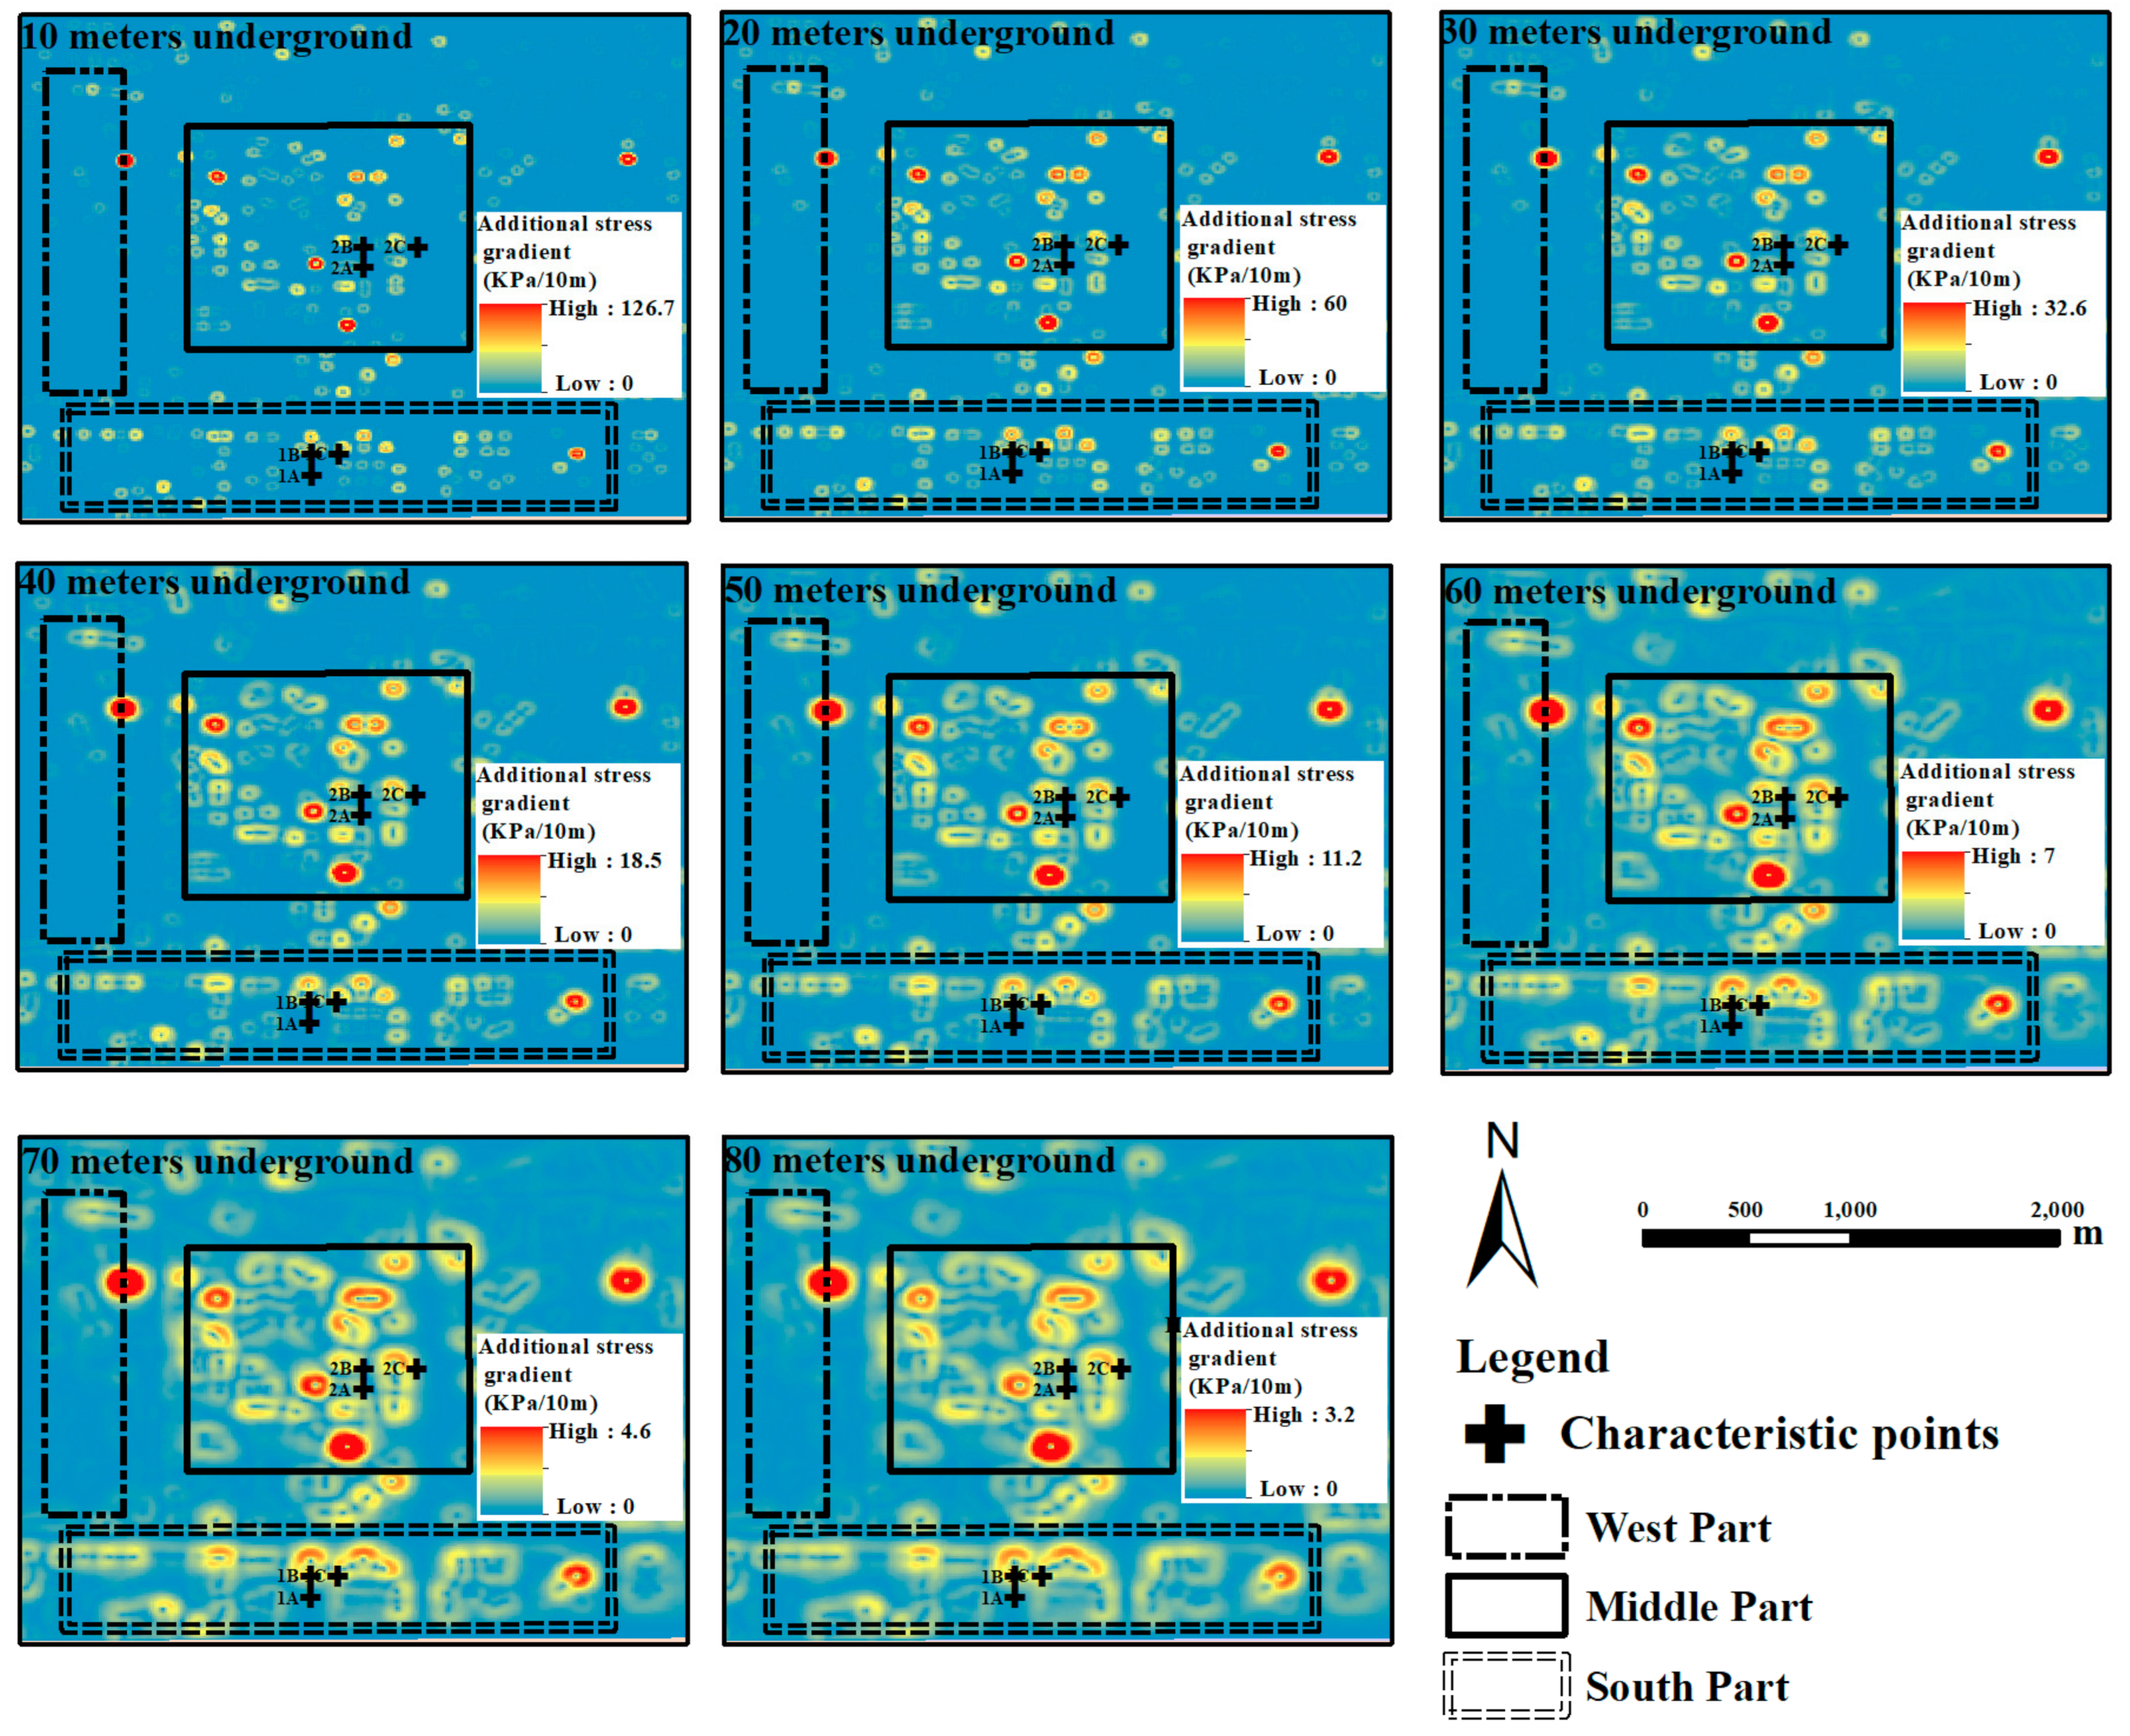
Uneven foundation settlement may cause pipeline ruptures and wall cracking, resulting in huge economic losses. Additional stress derived from building loads may play a key role in affecting the spatial distribution of uneven settlement in the Beijing CBD. Figure 11 and Figure 12 present the foundation settlement rate gradient map and the additional stress gradient maps, respectively, at different depths in the CBD. We found that the spatial distributions of these two phenomena agree well. Figure 12 shows that the additional stress gradient in the western part of the study area is much smaller than in the south and middle parts of the study area at the same depth. We found that the foundation settlement rate gradient ranged from 0–2.4 mm/10 m in the west part of the study area, and 0.1–19.6 mm/10 m in the middle and south parts.
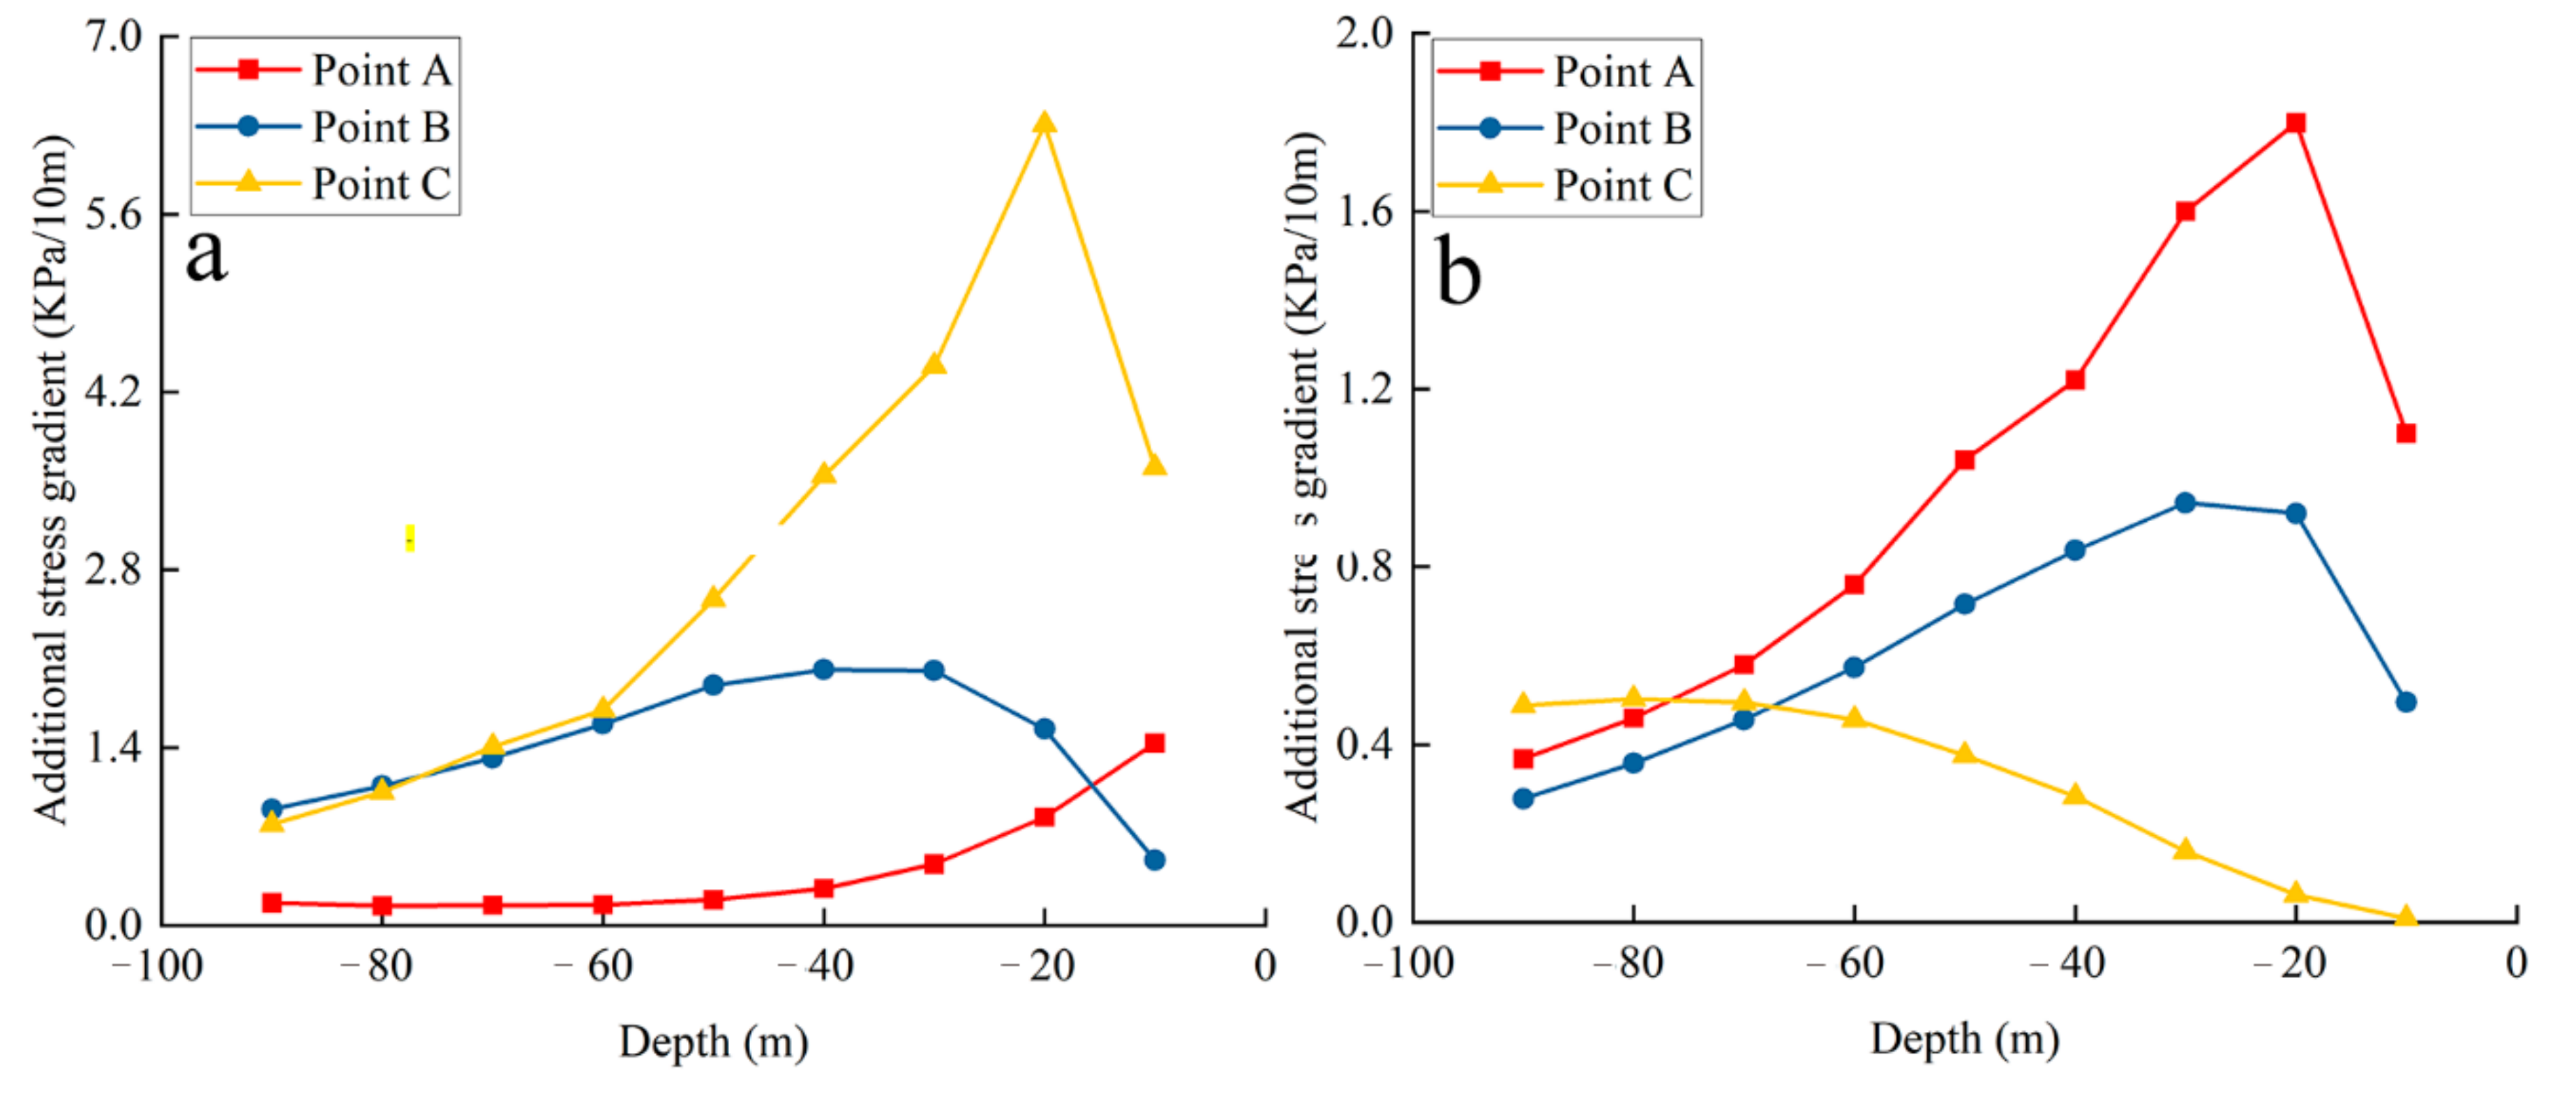
Figure 13 depicts additional stress gradients at different depths of the characteristic points. Figure 13a shows that the additional stress gradient of Point C is greater than that of Point B at the same depth, and that the additional stress gradient of Point B is greater than that of Point A at the same depth. As shown in Figure 11, the foundation settlement rate gradients at points A, B, and C in group 1 were 2.9, 6.6, and 14.2 mm/10 m, respectively. This phenomenon is also found at the characteristic points in group 2. Based on the above findings, we conclude that a positive correlation exists between the additional stress gradient and uneven foundation settlement.

5.3.2. Quantitative Response Relationship between Foundation Settlement Rate Gradient and Additional Stress Gradient

We calculated the final differential cumulative foundation settlement at the characteristic points using Equation (6). For the characteristic points in group 1, we found that the final differential cumulative foundation settlement at points A, B, and C were 3.2, 15.6 and 34.3 mm, respectively. For the characteristic points in group 2, we found that the final differential cumulative foundation settlement at points A, B, and C were 60.3, 31.6, and 4.6 mm, respectively. Combining these findings with Figure 13, we found that a characteristic point with a greater additional stress gradient generally has a larger settlement rate gradient. Figure 14 shows the time series foundation settlement rate gradients of the two sets’ characteristic points.

6. Conclusions

Using PS-InSAR technology and 68 TerraSAR-X images, we determined the surface settlement from April 2010 to October 2018 in the Beijing CBD. The additional stress generated by the static load of buildings was calculated. Based on the research results, the depth of the influence of the additional stress generated by building loads was analyzed. The response relationship between the foundation settlement rate and the additional stress generated by building loads, and the response relationship between uneven foundation settlement and additional stress gradients were analyzed in the CBD of Beijing. The main findings are as follows:
(1)
The PS-InSAR results showed that the average surface settlement rate varied from −47.9 to −0.5 mm/year in the middle and south of the CBD and that the average foundation settlement rate varied from −5.9 to 2 mm/year in the west part during the observation periods. The deformation rates derived by the PS-InSAR technology agreed well with those of the leveling benchmarks, and the correlation coefficient and mean deviation were 0.98 and 3.8 mm/year for 2011 to 2013, and 0.95 and 4.2 mm/year for 2013 to 2015, respectively.
(2)
Comparing the corresponding conditions, we found that the influence depth of the additional stresses generated by building loads on foundation settlement was 74.9 m in the CBD.
(3)
By comparing the spatial distribution of the additional stress generated by building loads and that of the foundation settlement rate, we found a positive response relationship between them. By analyzing two sets of characteristic points, we found that a characteristic point with greater additional stress generally has a larger settlement rate. We used the same method to explore the response relationship between uneven foundation settlement and additional stress gradients and also found a positive correlation between them.
In summary, the additional stresses derived from building loads may play an important role in controlling the distribution of foundation settlement, especially for uneven foundation settlements in the CBD of Beijing.

Supplementary Materials

The following are available online at https://www.mdpi.com/article/10.3390/rs13163063/s1, Table S1: Detailed mechanical and physical parameters of the soil in the borehole of No. 61-D65, Table S2: Detailed mechanical and physical parameters of the soil in the borehole of No. 61-D57.

Author Contributions

F.L. completed the experiments, constructed the algorithm, and wrote the original paper. H.G. and B.C. provided vital guidance and support. M.G. provided crucial support. C.Z. and L.G. provided critical suggestions for the writing of this paper. All authors have read and agreed to the published version of the manuscript.

Funding

This research was funded by The National Natural Science Foundation of China (No. 41930109/D010702, 41771455/D010702), Beijing Outstanding Young Scientist Program (No. BJJWZYJH01201910028032), Natural Science Foundation of Beijing Municipality (No. 8182013), and Beijing Youth Top Talent Project, a program of Beijing Scholars and National “Double-Class” Construction of University Projects.

Institutional Review Board Statement

Not applicable.

Informed Consent Statement

Not applicable.

Data Availability Statement

Not applicable.

Acknowledgments

We thank the German Aerospace Center (DLR) for their efforts in developing and distributing the remotely sensed SAR data. We thank the manufacturers of the software package SarProz.

Conflicts of Interest

The authors declare no conflict of interest.

References

  1. Li, F.; Gong, H.; Chen, B.; Zhou, C.; Guo, L. Analysis of the contribution rate of the influencing factors to land subsidence in the Eastern Beijing Plain, China based on extremely randomized trees (ERT) method. Remote Sens. 2020, 12, 2963. [Google Scholar] [CrossRef]
  2. Buckley, S.; Rosen, P.; Hensley, S.; Byron, D. Land subsidence in Houston, Texas, measured by radar interferometry and constrained by extensometers. J. Geophys. Res. Solid Earth 2003, 108, 243–251. [Google Scholar] [CrossRef]
  3. Solari, L.; Ciampalini, A.; Raspini, F.; Bianchini, S.; Moretti, S. PSInSAR analysis in the Pisa urban area (Italy): A case study of subsidence related to stratigraphical factors and urbanization. Remote Sens. 2016, 8, 120. [Google Scholar] [CrossRef] [Green Version]
  4. Ortega-Guerrero, A.; Rudolph, D.L.; Cherry, J.A. Analysis of long-term land subsidence near Mexico City: Field investigations and predictive modeling. Water Resour. Res. 1999, 35, 3327–3341. [Google Scholar] [CrossRef]
  5. Ferretti, A. Permanent scatterers in SAR interferometry. IEEE Trans. Geosci. Remote Sens. 2001, 39, 8–20. [Google Scholar] [CrossRef]
  6. Tosi, L.; Teatini, P.; Strozzi, T. Natural versus anthropogenic subsidence of Venice. Sci. Rep. 2013, 3, 2710. [Google Scholar] [CrossRef] [Green Version]
  7. Chen, W.; Gong, H.; Chen, B.; Liu, K.; Gao, M.; Zhou, C. Spatiotemporal evolution of land subsidence around a subway using InSAR time-series and the entropy method. GISci. Remote Sens. 2017, 54, 78–94. [Google Scholar] [CrossRef]
  8. Guan, C.; Yi, Z.; Runqiang, Z.; Yang, Z.; Chen, X.; Zhao, F.; Meng, X. Detection of land subsidence associated with land creation and rapid urbanization in the chinese loess plateau using time series InSAR: A case study of Lanzhou new district. Remote Sens. 2018, 10, 270. [Google Scholar]
  9. Yang, Q.; Ke, Y.; Zhang, D.; Zhang, D.; Chen, B.; Gong, H.; Lv, M.; Zhu, L.; Li, X. Multi-scale analysis of the relationship between land subsidence and buildings: A case study in an Eastern Beijing urban area using the PS-InSAR technique. Remote Sens. 2018, 10, 1006. [Google Scholar] [CrossRef] [Green Version]
  10. Jiao, S.; Yu, J.; Simic, M.A.; Li, X.; Liu, L. Assessing the impact of building volume on land subsidence in the central business district of Beijing with SAR tomography. Can. J. Remote Sens. 2017, 43, 177–193. [Google Scholar] [CrossRef]
  11. Liu, Y.; Li, J.; Fasullo, J.; Galloway, D.L. Land subsidence contributions to relative sea level rise at tide gauge Galveston Pier 21, Texas. Sci. Rep. 2020, 10, 17905. [Google Scholar] [CrossRef]
  12. Galloway, D.; Jones, D.R.; Ingebritsen, S.E. Land Subsidence in the United States. US Geological Survey Circular; USGS Publications: Washington, DC, USA, 1999; p. 1182. [Google Scholar]
  13. Yan, X.; Gong, S.; Zeng, Z. Relationship between building density and land subsidence in Shanghai urban zone. Hydrogeol. Eng. Geol. 2002, 29, 21–25. (In Chinese) [Google Scholar]
  14. Jie, Y.; Gao, Y.; Li, G.; Liu, Y.; Sun, T. Discussion on influence depth of large-scale load in urban construction. Ind. Construct. 2007, 37, 57–62. (In Chinese) [Google Scholar]
  15. Tang, Y.; Cui, Z.; Wang, J.; Lu, C.; Yan, X. Model test study of land subsidence caused by high-rise building group in Shanghai. Bull. Eng. Geol. Environ. 2008, 67, 173–179. [Google Scholar] [CrossRef]
  16. Cui, Z.; Tang, Y.; Yan, X. Centrifuge modeling of land subsidence caused by the high-rise building group in the soft soil area. Environ. Earth Sci. 2010, 59, 1819–1826. [Google Scholar] [CrossRef]
  17. Gong, S.; Li, C.; Yang, S. The microscopic characteristics of Shanghai soft clay and its effect on soil body deformation and land subsidence. Environ. Geol. 2009, 56, 1051–1056. [Google Scholar] [CrossRef]
  18. Chen, B.; Gong, H.; Li, X.; Lei, K.; Ke, Y.; Duan, G.; Zhou, C. Spatial correlation between land subsidence and urbanization in Beijing, China. Nat. Hazards 2015, 75, 2637–2652. [Google Scholar] [CrossRef]
  19. Parsons, T. The Weight of cities: Urbanization effects on earth’s subsurface. AGU Adv. 2021, 2, 1–15. [Google Scholar] [CrossRef]
  20. Zhu, L.; Gong, H.; Li, X.; Wang, R.; Chen, B.; Dai, Z.; Teatini, P. Land subsidence due to groundwater withdrawal in the northern Beijing plain, China. Eng. Geol. 2015, 193, 243–255. [Google Scholar] [CrossRef]
  21. Galloway, D.; Hudnut, K.; Ingebritsen, S.; Phillips, S.; Peltzer, G.; Rogez, F.; Rosen, P. Detection of aquifer system compaction and land subsidence using interferometric synthetic aperture radar, Antelope Valley, Mojave Desert, California. Water Resour. Res. 1998, 34, 2573–2585. [Google Scholar] [CrossRef]
  22. Chen, B.; Gong, H.; Chen, Y.; Li, X.; Zhou, C.; Lei, K.; Zhu, L.; Duan, L.; Zhao, X. Land subsidence and its relation with groundwater aquifers in Beijing Plain of China. Sci. Total Environ. 2020, 735, 139111. [Google Scholar] [CrossRef]
  23. Chen, B.; Gong, H.; Lei, K.; Li, J.; Zhou, C.; Gao, M.; Guan, H.; Lv, W. Land subsidence lagging quantification in the main exploration aquifer layers in Beijing plain, China. Int. J. Appl. Earth Obs. Geoinform. 2019, 75, 54–67. [Google Scholar] [CrossRef]
  24. Luo, Y.; Hu, R.; Ye, C.; Lei, K.; Tian, F.; Cui, W.; Wang, R.; Zhao, L.; Wang, X. The study of preliminary division of land subsidence units. J. Eng. Geol. 2017, 25, 95–107. [Google Scholar]
  25. Zhao, X.; Chen, B.; Gong, H.; Zhou, C.; Li, X.; Lei, K.; Ke, Y. Land subsidence along the Beijing–Tianjin Intercity Railway during the period of the South-to-North Water Diversion Project. Int. J. Remote Sens. 2020, 41, 4447–4469. [Google Scholar] [CrossRef]
  26. Zhang, W. Deformation of and numerical analysis on foundation of Wangjingxi Station on Line 13 of Beijing metro caused by shield tunneling below. Tunnel Construct. 2014, 3, 67–78. (In Chinese) [Google Scholar]
  27. Boussinesq, J. Application des Potentiels a l’Etude de l’Equilibre et du Movement des Elastique; Guthier Villard: Paris, France, 1885. [Google Scholar]
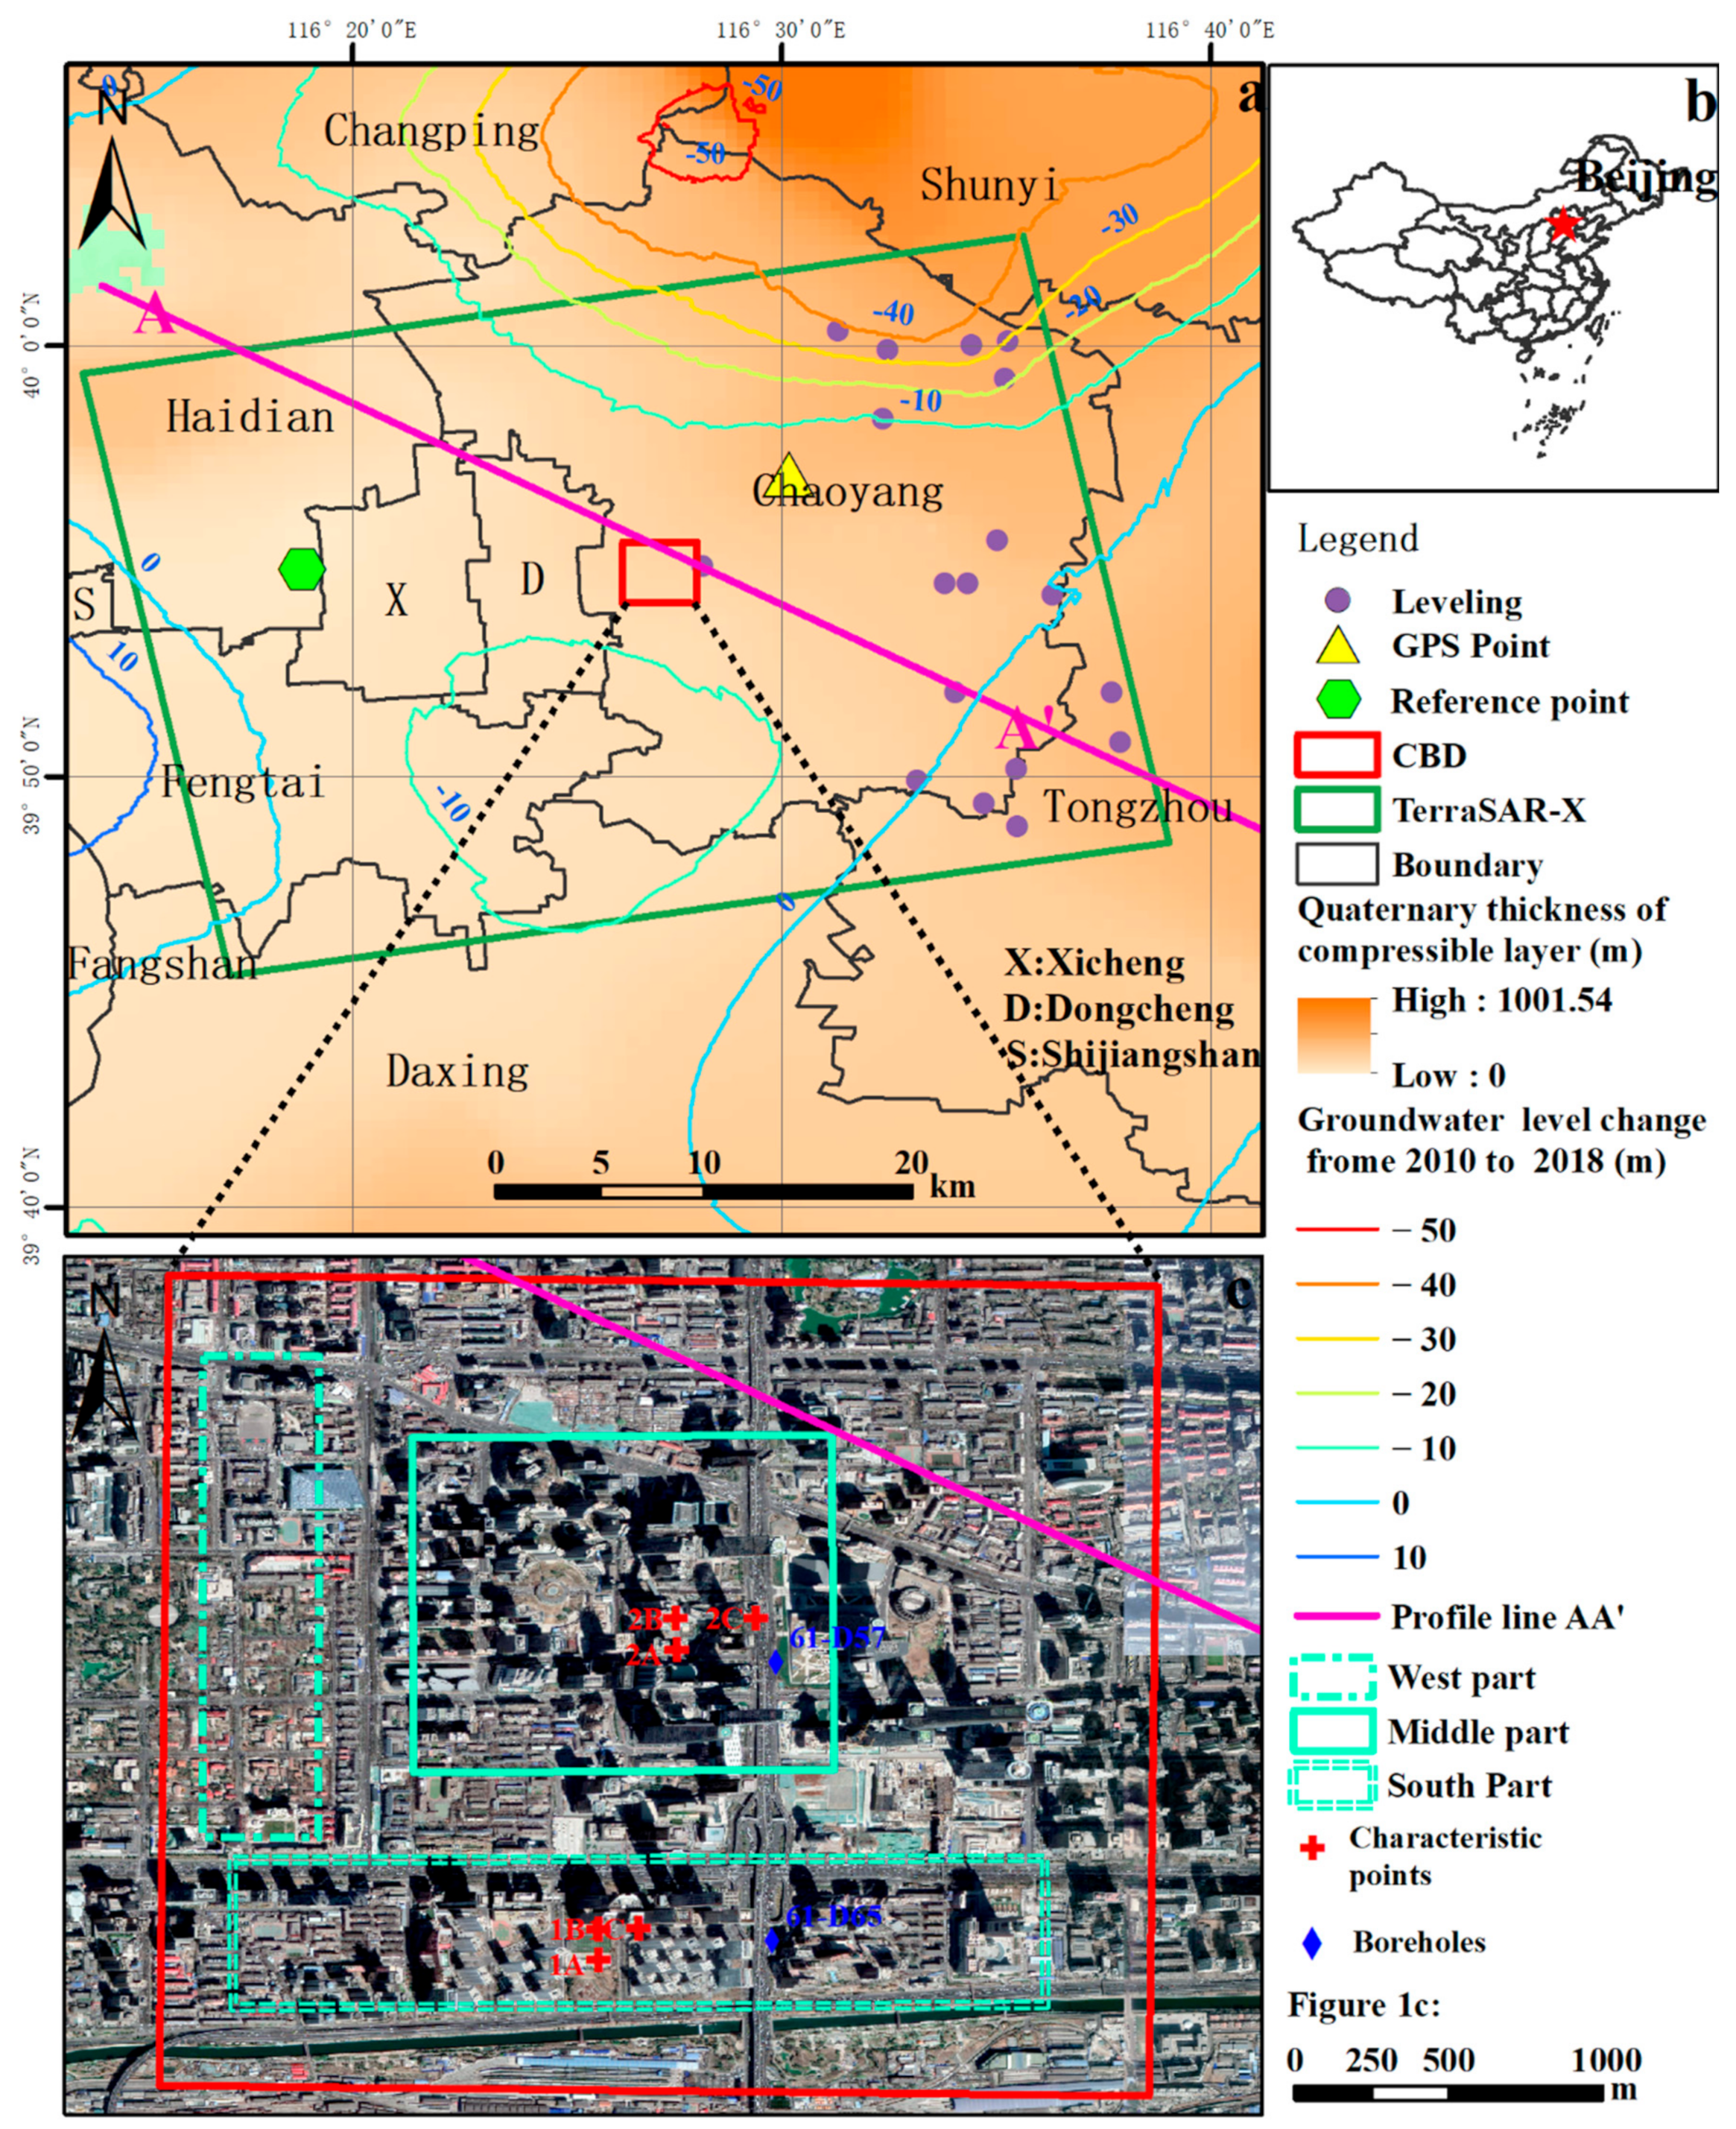
Figure 1. (a):The red rectangle indicates the location of the central business district (CBD), superimposed on the Quaternary thickness of the compressible layer. The green line represents coverage of TerraSAR-X images. (b): Location of Beijing in China. (c): Optical Google Earth image of the CBD.
Remotesensing 13 03063 g001
Figure 2. Hydrogeological profile A–A′ (Figure 1 shows the location).
Remotesensing 13 03063 g002
Figure 3. The flowchart of this study.
Remotesensing 13 03063 g003
Figure 4. Surface settlement rate maps during observation periods between April 2010 and October 2018. (a): Coverage of the selected TerraSAR-X images and the red rectangle shows the boundary of the CBD. (b): Cumulative settlement in the CBD.
Remotesensing 13 03063 g004
Figure 5. Comparisons of surface settlement rates derived from the PS-InSAR technique and leveling measurement rates. The accuracy verification from (a): 2011 to 2013 and (b): 2015 to 2016.
Remotesensing 13 03063 g005
Figure 6. Additional stress maps at different depths in the CBD.
Remotesensing 13 03063 g006
Figure 7. The depth of the influence of the static load of building loads in the CBD.
Remotesensing 13 03063 g007
Figure 8. Foundation settlement rate map and additional stress maps at different depths in the Beijing CBD.
Remotesensing 13 03063 g008
Figure 9. Additional stress generated by building loads at different depths. Characteristic points in (a): group 1 and (b): group 2.
Remotesensing 13 03063 g009
Figure 10. Time series settlement of characteristic points. (a): shows characteristic points in group 1. (b): shows characteristic points in group 2.
Remotesensing 13 03063 g010
Figure 11. Foundation settlement rate gradient map in the Beijing CBD. The black polygons represent the building outlines.
Remotesensing 13 03063 g011
Figure 12. Additional stress gradient maps at different depths in the CBD.
Remotesensing 13 03063 g012
Figure 13. Additional stress gradients at different depths. Characteristic points in (a): group 1 and (b): group 2.
Remotesensing 13 03063 g013
Figure 14. Time series foundation settlement rate gradients of characteristic points in groups (a): 1. and (b): 2.
Remotesensing 13 03063 g014
Table 1. Detail parameters of selected TerraSAR-X images.
ParameterValue
Orbit directionDescending
PolarizationHH
Spatial resolution (m)3
BandX
Numbers of images68
Wavelength (cm)3.1
Incidence angle (°)33.1–33.2
Track No.8
Repeat observation period (day)11
Date rangeApril 2010–October 2018
Table 2. Parameters in Equation (2).
ParameterDefinition
σAdditional stress of different depths at each point in generated grid
nTotal number of the buildings in the CBD
PiGravity of building i in the CBD
XLongitude of a point in the generated grid in UTM projection coordinates
YLatitude of a point in the generated grid in UTM projection coordinates
ZDepth of a point in generated grid in UTM projection coordinates
XiLongitude of building i in UTM projection coordinates
YiLatitude of building i in UTM projection coordinates
ZiFoundation depth of building i in UTM projection coordinates
AiArea of building i
HiHeight of building i
2.9Floor height of building (Unit is m)
1.5Weight per square meter (Unit is t)
DiFoundation depth of building i
WsDensity of soil displaced by the foundation of the building
gLocal acceleration of gravity (g = 9.81 m/s2).
UTM, Universal Transverse Mercator.
Publisher’s Note: MDPI stays neutral with regard to jurisdictional claims in published maps and institutional affiliations.