Article

Combined Block Adjustment for Optical Satellite Stereo Imagery Assisted by Spaceborne SAR and Laser Altimetry Data

1
State Key Laboratory of Information Engineering in Surveying, Mapping and Remote Sensing, Wuhan University, Wuhan 430079, China
2
School of Remote Sensing and Information Engineering, Wuhan University, Wuhan 430079, China
3
Faculty of Geosciences and Environmental Engineering, Southwest Jiaotong University, Chengdu 610031, China
*
Author to whom correspondence should be addressed.
Remote Sens. 2021, 13(16), 3062; https://doi.org/10.3390/rs13163062
Submission received: 30 June 2021 / Revised: 19 July 2021 / Accepted: 27 July 2021 / Published: 4 August 2021

Abstract

:
To ensure the accuracy of large-scale optical stereo image bundle block adjustment, it is necessary to provide well-distributed ground control points (GCPs) with high accuracy. However, it is difficult to acquire control points through field measurements outside the country. Considering the high planimetric accuracy of spaceborne synthetic aperture radar (SAR) images and the high elevation accuracy of satellite-based laser altimetry data, this paper proposes an adjustment method that combines both as control sources, which can be independent from GCPs. Firstly, the SAR digital orthophoto map (DOM)-based planar control points (PCPs) acquisition is realized by multimodal matching, then the laser altimetry data are filtered to obtain laser altimetry points (LAPs), and finally the optical stereo images’ combined adjustment is conducted. The experimental results of Ziyuan-3 (ZY-3) images prove that this method can achieve an accuracy of 7 m in plane and 3 m in elevation after adjustment without relying on GCPs, which lays the technical foundation for a global-scale satellite image process.

Graphical Abstract

1. Introduction

Satellite image mapping plays an important role in many fields such as social economy and national defense. Remote sensing images acquired by satellites can achieve rapid update of geographic information data in large areas around the world, providing a rich source of geographic information data for decision-making and applications in related fields. In the application of satellite remote sensing images, the geometric positioning accuracy of images is the key indicator for measuring the availability of remote sensing satellite data, which has a great impact on the subsequent processing of remote sensing images and their application in large areas. To obtain high-precision satellite remote sensing images and improve the geometric positioning accuracy of images, a great deal of relevant research has been conducted in this field worldwide.
The geometric positioning accuracy of satellite images is mainly affected by the orbital attitude error on the satellite. To eliminate the influence of the system error and achieve high-accuracy geometric positioning of satellite images, the image positioning error can usually be eliminated by using a large number of ground control points (GCPs) through bundle block adjustment [1,2]. With the development of bundle block adjustment technology under sparse control conditions, the GCP-dependent adjustment method no longer requires control points for each image in the area, reducing the need for the number of control points [3]. However, this adjustment method does not completely eliminate the reliance on GCPs, and the quality and quantity of ground control points are still crucial to ensure the positioning accuracy of the images after adjustment in a large-scale area [4]. The time consumption and cost required to maintain and collect these GCPs are also important factors to be considered when using GCP-based block bundle adjustment. In addition, there will inevitably be a large number of areas with no or sparse control points such as areas with plateaus, canyons, and desert terrain, which poses a great challenge to realizing image processing on a global scale. Therefore, the processing of an adjustment method without GCPs is beginning to receive widespread attention because of its advantage of not relying on GCPs.
A satellite images process without GCPs usually refers to improving the relative consistency of the geometric positioning accuracy of satellite images without relying on GCPs measured by filed measurement, and to improving the absolute accuracy of ground positioning as much as possible. In recent years, with an increasing variety in available public geographic data and the improvement of positioning accuracy, the use of geographic data in block adjustment has become an effective method. These geographic information data include other aerospace/aerial images, digital orthophoto map (DOM), and digital elevation maps (DEMs), which have high positioning accuracy compared with the original images. At the same time, as the sources of publicly released geospatial data around the world are enriched, such as Shuttle Radar Topography Mission (SRTM) DEM, Advanced Spaceborne Thermal Emission (ASTER) DEM, Advanced Land Observation Satellite World 3D (AW3D) DEM and other data, Google Earth and other image data are gradually becoming optional ways of block adjustment without GCPs. By using these data as the control source, the image positioning accuracy can be greatly improved even without using GCPs.
For example, Wang et al. used a small number of ground control points and a variety of grid-size DEMs as control data to conduct a planar adjustment experiment with Ziyuan-3 (ZY-3) nadir-view (NAD) images in several regions, in which the accuracy of the checkpoints after adjustment was better than 7 m in an experiment with 139 images [5]. Zhang et al. investigated the process of determining ground point coordinates using DEM data as an elevation constraint, the priori weight of each observation was discussed, and a more robust adjustment strategy was proposed. The experimental results using ZY-3 images show that when the intersection angle between images is large, the accuracy of DEM and the density of tie points have obvious effects on the improvement of results [6]. In the process of block adjustment of Luojia-1 nighttime light remote sensing images, Li Xin et al. used 30 m grid SRTM DEM as auxiliary data to complete the adjustment of nighttime light images covering the whole of China, 25 control points were selected from the Google Earth map to participate in the adjustment, and the positioning accuracy of the adjusted images was better than 1.5 pixels [7]. Cao et al. proposed an adjustment method based on equivalent geometric sensor model (EGSM) that can make full use of the terrain information provided by DEM to improve the planimetric and elevation accuracy simultaneously. Based on a block adjustment test with 143 stereo images of ZY-3, the planimetric and elevation accuracies of the images after adjustment were improved from the original 17.3 m and 2.6 m to 2.5 m and 1.5 m respectively, and the results showed that the elevation accuracy achieved by AW3D as control data was basically comparable to the results using a small number of control points [8].
In addition, the laser altimetry data provided by laser rangefinders are also an effective source in adjustment without GCPs. Laser rangefinders can provide highly accurate range information by recording the interval between the transmitted and received laser beams with the laser measurement payload carried on board. At present, the major international on-board laser systems include the Near Earth Asteroid Rendezvous (NEAR) Laser Rangefinder (NLR) system [9], the measuring accuracy of which is better than 6 m; the Mars Orbiter Laser Altimeter (MOLA) [10], which is used to monitor small celestial bodies and has a measuring accuracy of approximately 37.5 cm; and the Chang’e-1 program [11], which is used by China for lunar exploration and the laser altimeter onboard has an accuracy of 1 m; and the Ice, Cloud, and Land Elevation Satellite (ICESat) with the Geoscience Laser Altimeter System (GLAS) system [12] with a measuring accuracy of 15 cm and its successor, ICESat-2 with the ATLAS system [13], which has a higher measuring accuracy better than 0.1 m.
The laser data provided by these satellite laser systems can provide detailed surface information and play a great value in remote sensing monitoring of the planets and the Earth. In addition to the fields of glacier monitoring [14], lake height variation monitoring [15], and vegetation inversion [16], laser altimetry data can be used for accuracy checking of DEM data [17,18] and assisting satellite images’ precise positioning.
Wu et al. used the triple linear array cameras (TLCs) and the laser altimetry system carried by the Chang’e-1 satellite to perform the joint process of laser points and optical images by using local surface constraints to obtain a 3D digital model of the lunar surface, which provided a basis for the lunar surface landing site selection of the subsequent lunar exploration mission [19]. Li et al. used both a rational function model (RFM) and rigorous model for joint adjustment with laser points as elevation constraints to verify the feasibility of laser altimetry points (LAP) in block adjustment, and the results showed that both methods could achieve a positioning accuracy better than 3 m after adjustment [20]. Wang et al. proposed an effective laser altimetry point selection, registration, and adjustment method, and conducted experiments using mapping satellite-1 China Guangdong province data, and improved the elevation accuracy from 5.88 m to 2.51 m after using 1839 automatically extracted laser control points. It is concluded that elevation accuracy can be effectively improved by using LAPs, while plane accuracy remains unchanged [21]. Zhang et al. proposed an adjustment method based on a rigorous geometric model for using the laser system carried by the ZY3-02 satellite. The method combines the orientation parameters of the image and the ranging information of the laser data to establish a joint adjustment model, which can improve the elevation accuracy by eliminating the positioning consistency error between the image and the laser points [22].
In summary, the introduction of readily available public geographic data in the optical satellite stereo image block adjustment can improve the geometric positioning accuracy of images without GCPs, which is of great significance for realizing satellite mapping in large areas. Considering the high planimetric position accuracy of spaceborne SAR images and the high elevation accuracy of satellite-based laser altimetry data, this paper proposes a method combining the two types of data to assist the block adjustment of optical stereo images. The method first obtains the planar control points (PCP) by obtaining the tie points of optical images and SAR images through multimodal image registration, then obtains reliable LAPs by constructing a selection mechanism for a set of effective laser points, and finally introduces two kinds of control data in the block adjustment process, so as to achieve accuracy improvement in both plane and elevation directions. The method proposed in this paper is validated through experimental implementation in several regions and discussed based on the experimental results.

2. Materials and Methods

This paper presents a joint optical satellite stereo images block adjustment method using the DOM generated from a SAR image and the LAPs as the control source. The method first uses the registration method based on the similarity measure to achieve the tie point extraction between the optical stereo image and SAR DOM, then uses the LAPs selection method to select the LAPs and then project the LAPs into the stereo image. Finally, the observation equation of image point coordinates is established separately, the constraint of plane direction and elevation direction is realized by combining SAR DOM-based PCPs and LAPs, respectively, and finally the image orientation correction parameters are obtained by solving the equation to improve the plane and elevation geometric accuracy of the stereo image. The flow chart is shown in Figure 1.

2.1. Automatic Acquisition of PCPs

Currently, the commonly used similarity metrics such as normalized cross correlation and mutual information mainly use the intensity information between images to match homonymous points, and their registration performance decreases sharply when there are significant nonlinear radiometric differences between images. However, compared with grayscale information, the geometric structural features of images are less affected by nonlinear radiometric differences, so using geometric structural features to construct similarity measures can break through the deficiency that traditional similarity measures are mainly matched by grayscale information and are more sensitive to nonlinear radiometric differences, thus enhancing the robustness of image registration and providing the basic theory and technical support.
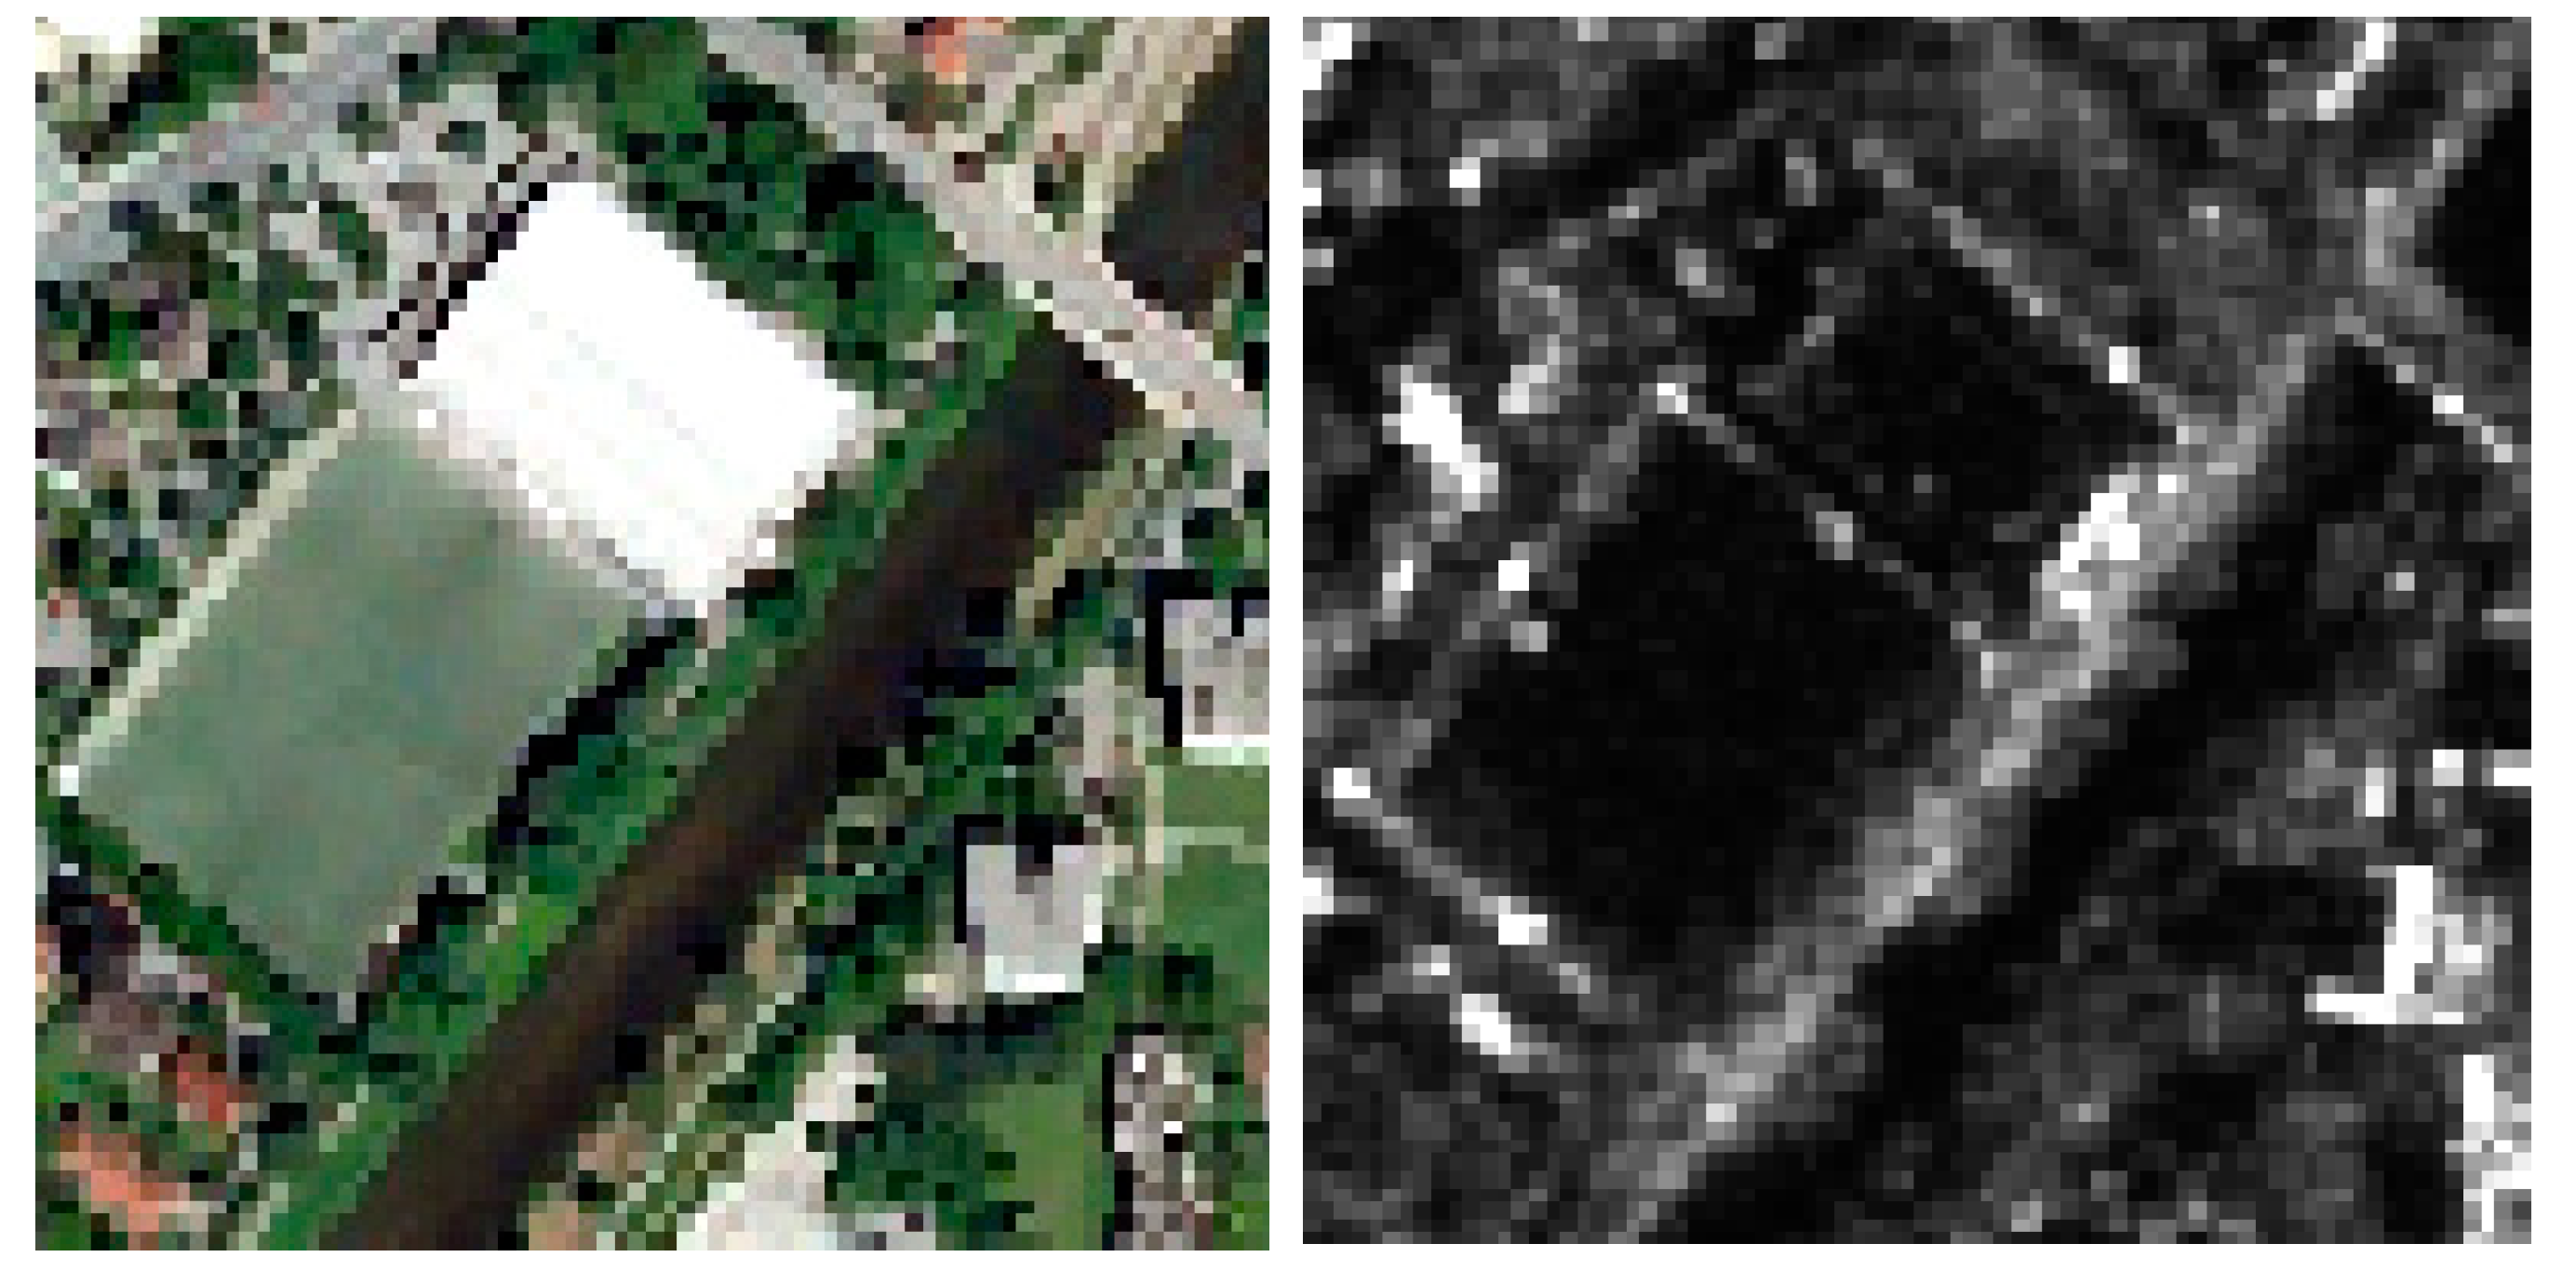
Figure 2 shows a pair of optical and SAR remote sensing images, and it can be found that although the nonlinear radiometric differences between the images are large, the geometric structural features between the images have high similarity. Considering this feature, with the idea of histogram of oriented gradient used in the field of target recognition to represent the shape and structural features of images, the magnitude and orientation of structure representation for consistency judgment are established, the feature descriptor named the histogram of orientated phase congruency (HOPC) for geometric structure similarity between images is realized on this basis, and the similarity measure for image registration is established on this basis.
The phase-congruency-based registration method mainly uses the spatial structure of the same feature between heterogeneous images to construct a HOPC descriptor, which can reflect the similarity of spatial structure. The established descriptors can calculate the similarity between heterogeneous images and finally achieve accurate registration between heterogeneous images of different sources.
The specific implementation usually adopts a coarse-to-fine registration scheme; firstly, a coarsely geometric correction is performed by using orbital attitude parameters or rational polynomial parameters from satellite images, which can eliminate the rotation and scale differences between images. Then, the registration metric is built based on geometric structure similarity to achieve tie point matching and mismatches are eliminated, and the obtained homonyms are used to correct the initial orbital attitude parameters or rational polynomial coefficient (RPC) parameters to finally realize the fine registration of images.
The process of constructing similarity descriptors for spatial geometric structures is shown in Figure 3. Firstly, a template window with a certain size is selected and then the phase congruency amplitude and orientation for each pixel in the template window are computed. Then, the template window is divided into overlapping blocks, which are called “cells”, and each cell contains multiple units. Finally, a local histogram of phase congruency orientations is accumulated over all the pixels within the cells of each block, and collects all the blocks in the template window into a combined HOPC feature vector, a process similar to the SIFT [23].
The HOPC descriptor captures the structure properties of images; the correlation coefficient between HOPC descriptors is used here as the similarity measure for image matching, and the corresponding fine registration scheme is designed based on this basis, which proceeds as follows:
  • using classical feature point detection operators (e.g., Harris, Forstner, etc.) to extract a large number of evenly distributed feature points as key points with a block strategy in the images.
  • using HOPC as a similarity measure and a template matching strategy to obtain homonymous points between images.
  • acquiring sub-pixel accuracy by a local extreme fitting technique and eliminating the mismatch points.
  • using the acquired homonymous points to correct the orbital attitude parameters or RPC parameters of the images to obtain the exact geometric transformation relationship between image coordinates and geographic coordinates, and to fine-correct the images to finally achieve exact registration between images.

2.2. Automatic Acquisition of LAPs

According to public information, the footprint diameter of a GLAS laser beam on the ground is about 70 m, and its plane accuracy is better than 15 m. If the positioning accuracy of the satellite image and the plane positioning accuracy of the laser point are the same, the relative error between the laser point and the image can be considered small, and the laser point can be introduced into the block adjustment process as an elevation constraint to improve the elevation accuracy after the block adjustment. GLAS laser altimetry data only records the coordinates of the laser point in latitude and longitude, the elevation value, and some auxiliary data. Although the nominal accuracy of GLAS data is 15 cm, in the actual measurement process the laser will be scattered and refracted by the atmosphere after emission, and the topographic changes on the surface and forward scattering of clouds will also cause oversaturation of the laser echo signal, which will lead to the degradation of the laser ranging accuracy. Therefore, before using the laser altimetry data, it is necessary to selection the laser points first. The selection of laser points is mainly divided into two ways: one is to combine the DEM data for laser echo signal simulation, because there is a certain correlation between the echo signal and the terrain features, so by selecting the laser points corresponding to the appropriate echo signal, the accuracy of the selected laser points can be guaranteed [20]. The other is to directly use the DEM for laser point selection; by setting certain selection conditions, the laser points that do not meet the conditions are eliminated, and then the remaining laser points can ensure their positioning accuracy [21].
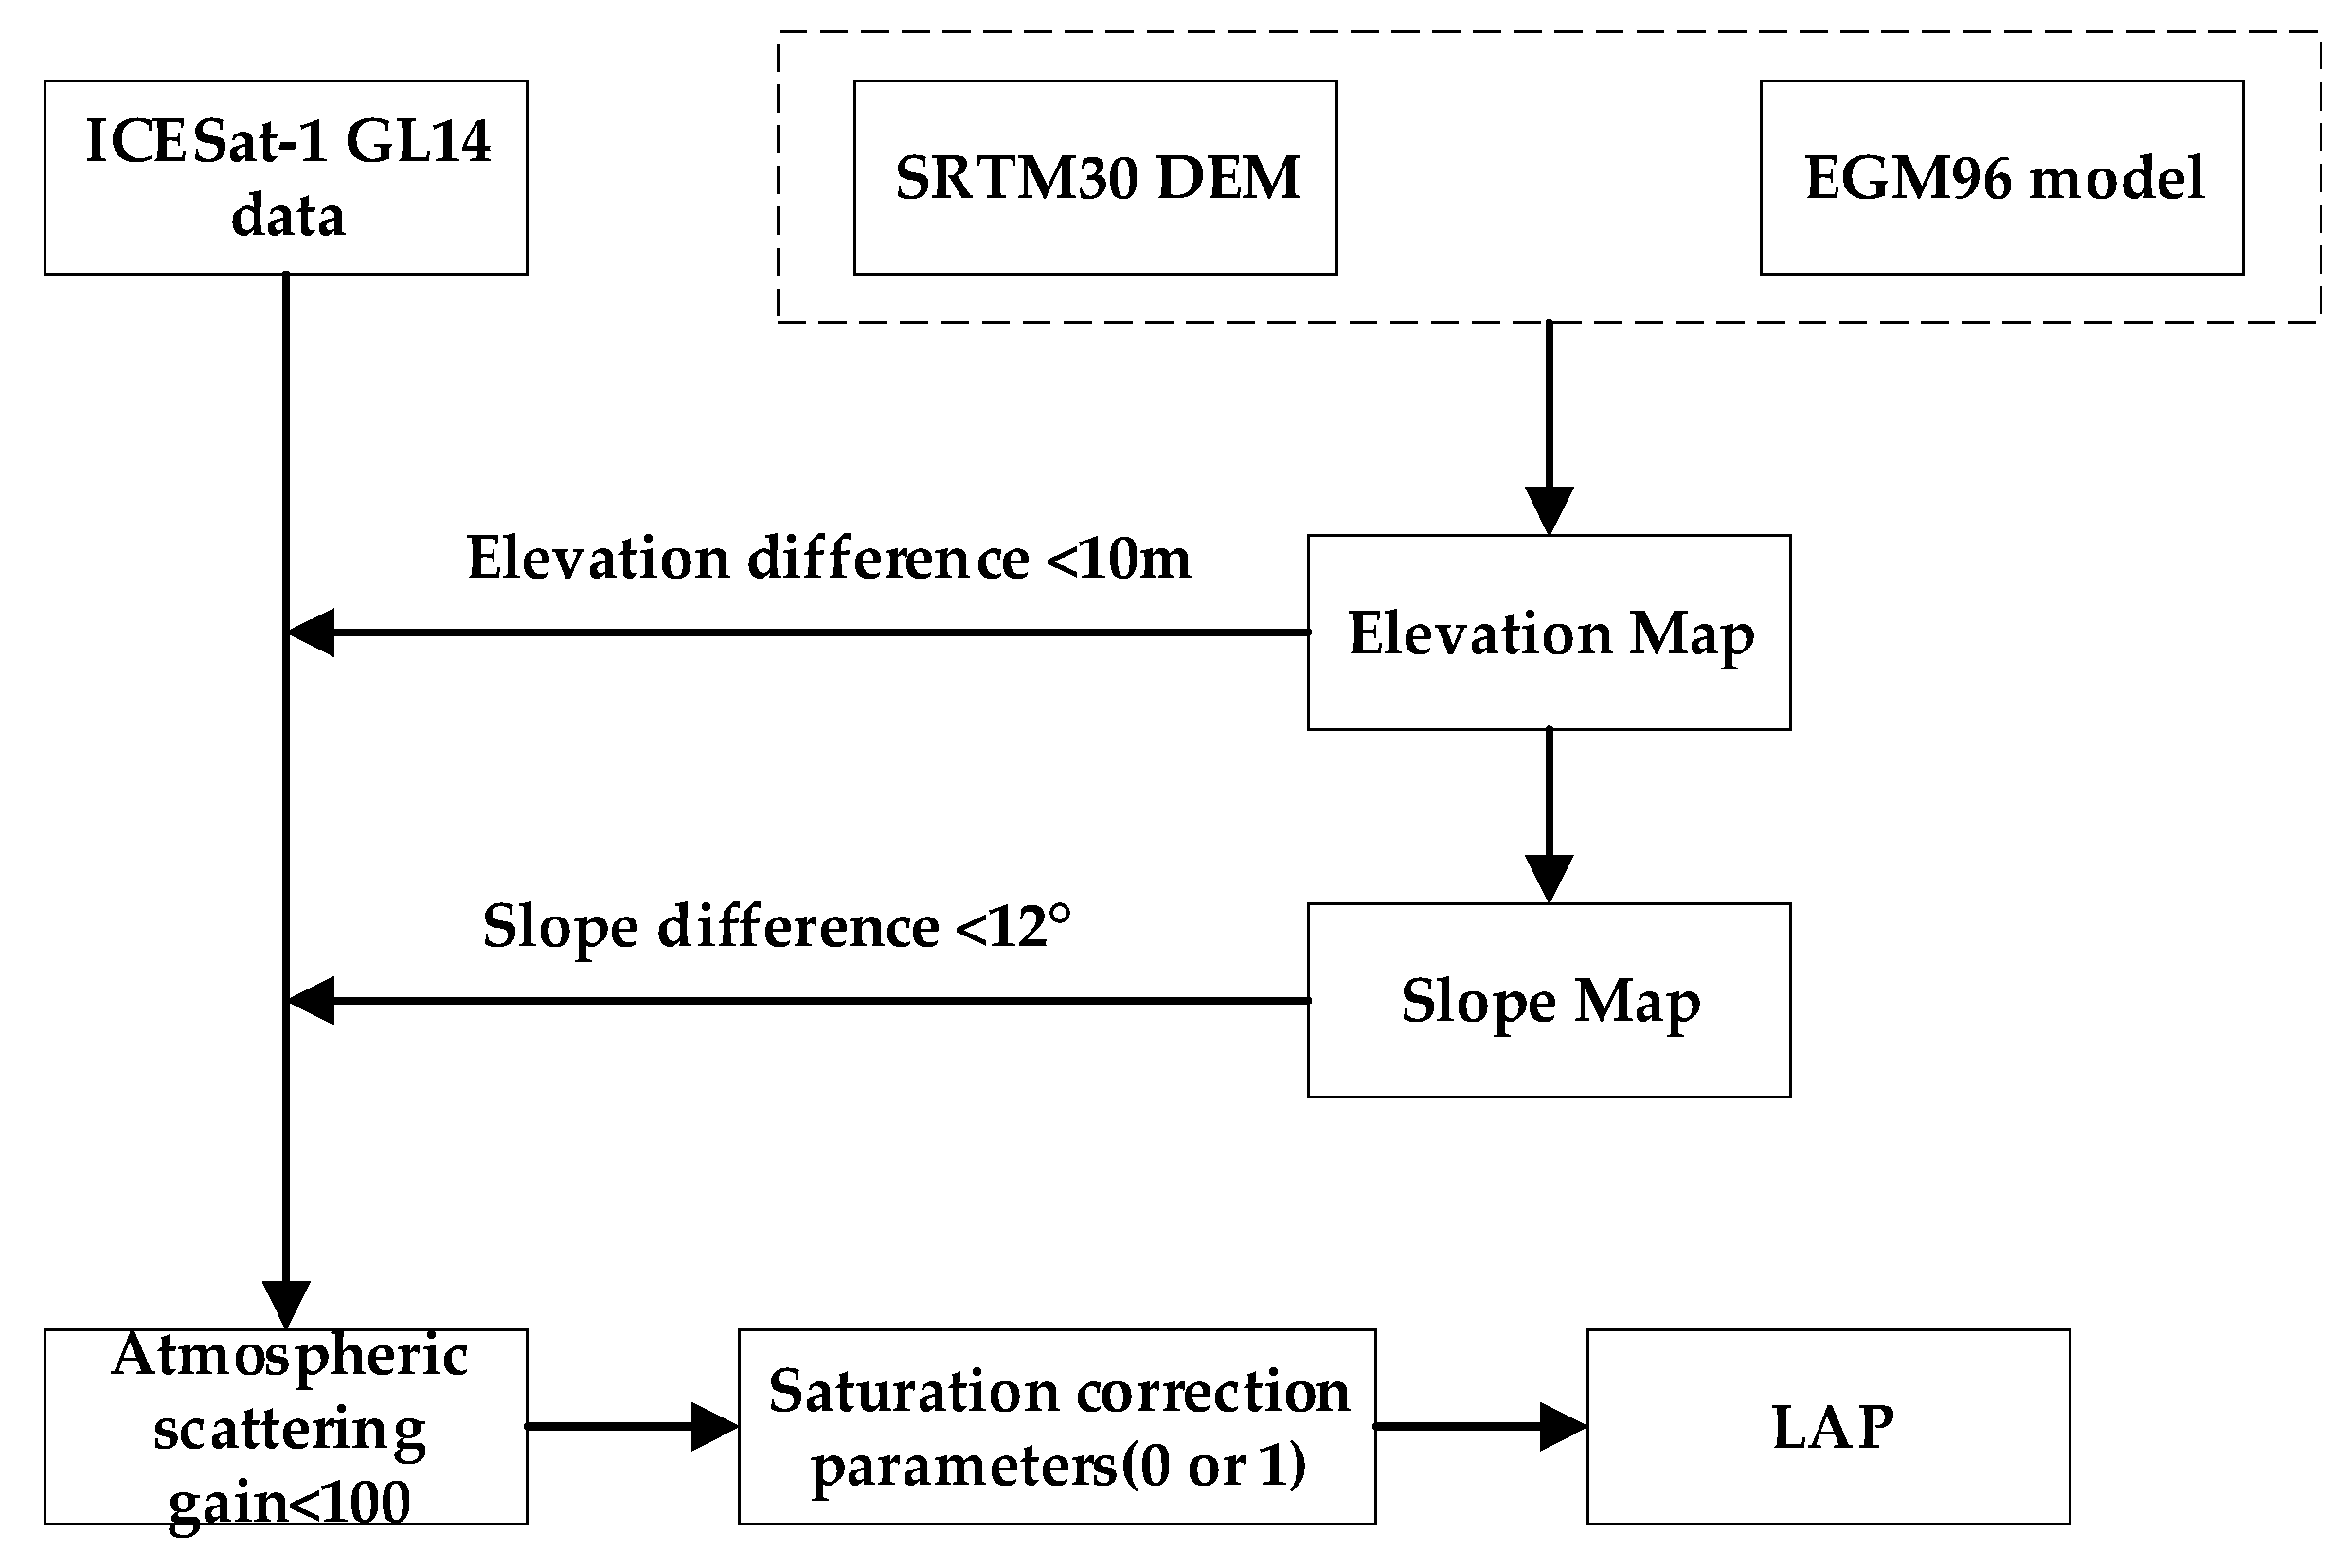
In this paper, we choose to use the DEM-based selection method, and considering that the diameter of laser spot is around 70 m, the data of 30 m-grid SRTM can be used to effectively extract the elevation variation within the laser spot range, and it can also be combined with the quality evaluation parameters recorded by laser data to assist the selection process. The laser point selection process based on SRTM 30 m DEM can be divided into the following steps, and Figure 4 shows a schematic diagram of the process.
(1)
In the process of laser measurement, if there are thick clouds over the surface, the laser points may be reflected directly on the clouds, and at this time the laser signal recorded by the laser rangefinder is actually the elevation value of the clouds, so it is first necessary to use the DEM data to remove the laser points with large differences between the elevation value and the actual surface elevation value, and this process can be carried out by setting the threshold value of elevation difference.
(2)
If the slope of the terrain within the laser spot changes greatly, the increase of the slope will lead to the pulse broadening of the received laser signal. Since the laser spot diameter is 70 m and the positioning accuracy is about 15 m, if the slope within the spot range causes the elevation change of the ground surface to exceed the high accuracy of the laser spot, the error of plane positioning will cause the actual accuracy of the laser spot to decrease and affect the use of the laser spot. In order to reduce the influence of surface deformation on the laser point, the DEM can be used to estimate the change of slope within the laser spot range, and when the change of slope causes the laser height measurement error to exceed the laser point’s high accuracy threshold, the laser point that exceeds the threshold will be rejected to ensure that the selected laser point’s high accuracy meets the use requirements.
(3)
After selection of the two types of elevation anomalies of laser points using DEM, the remaining laser points can be further selected by using the quality evaluation parameters of the laser points themselves; mainly, the laser points whose atmospheric scattering gain and saturation correction parameters do not meet the requirements can be eliminated, and at this time the remaining laser points can ensure their measurement accuracy and can be extracted for LAPs.
After finishing the selection of each laser point, in order to use the laser control point in the adjustment, it is necessary to extract the coordinates of the corresponding image point of the laser control point on the optical image. Since the laser point spot diameter is about 70 m and its plane positioning accuracy is 10 ± 4.5 m, when the plane positioning accuracy of the satellite image is high (less than 15 m), it can be considered that the collocation error between the laser point and the plane position of the image in the region is small at this time, and the ground coordinates of the laser point can be used to obtain the image coordinates of the laser point on the reference image by projection directly using the RFM [24].
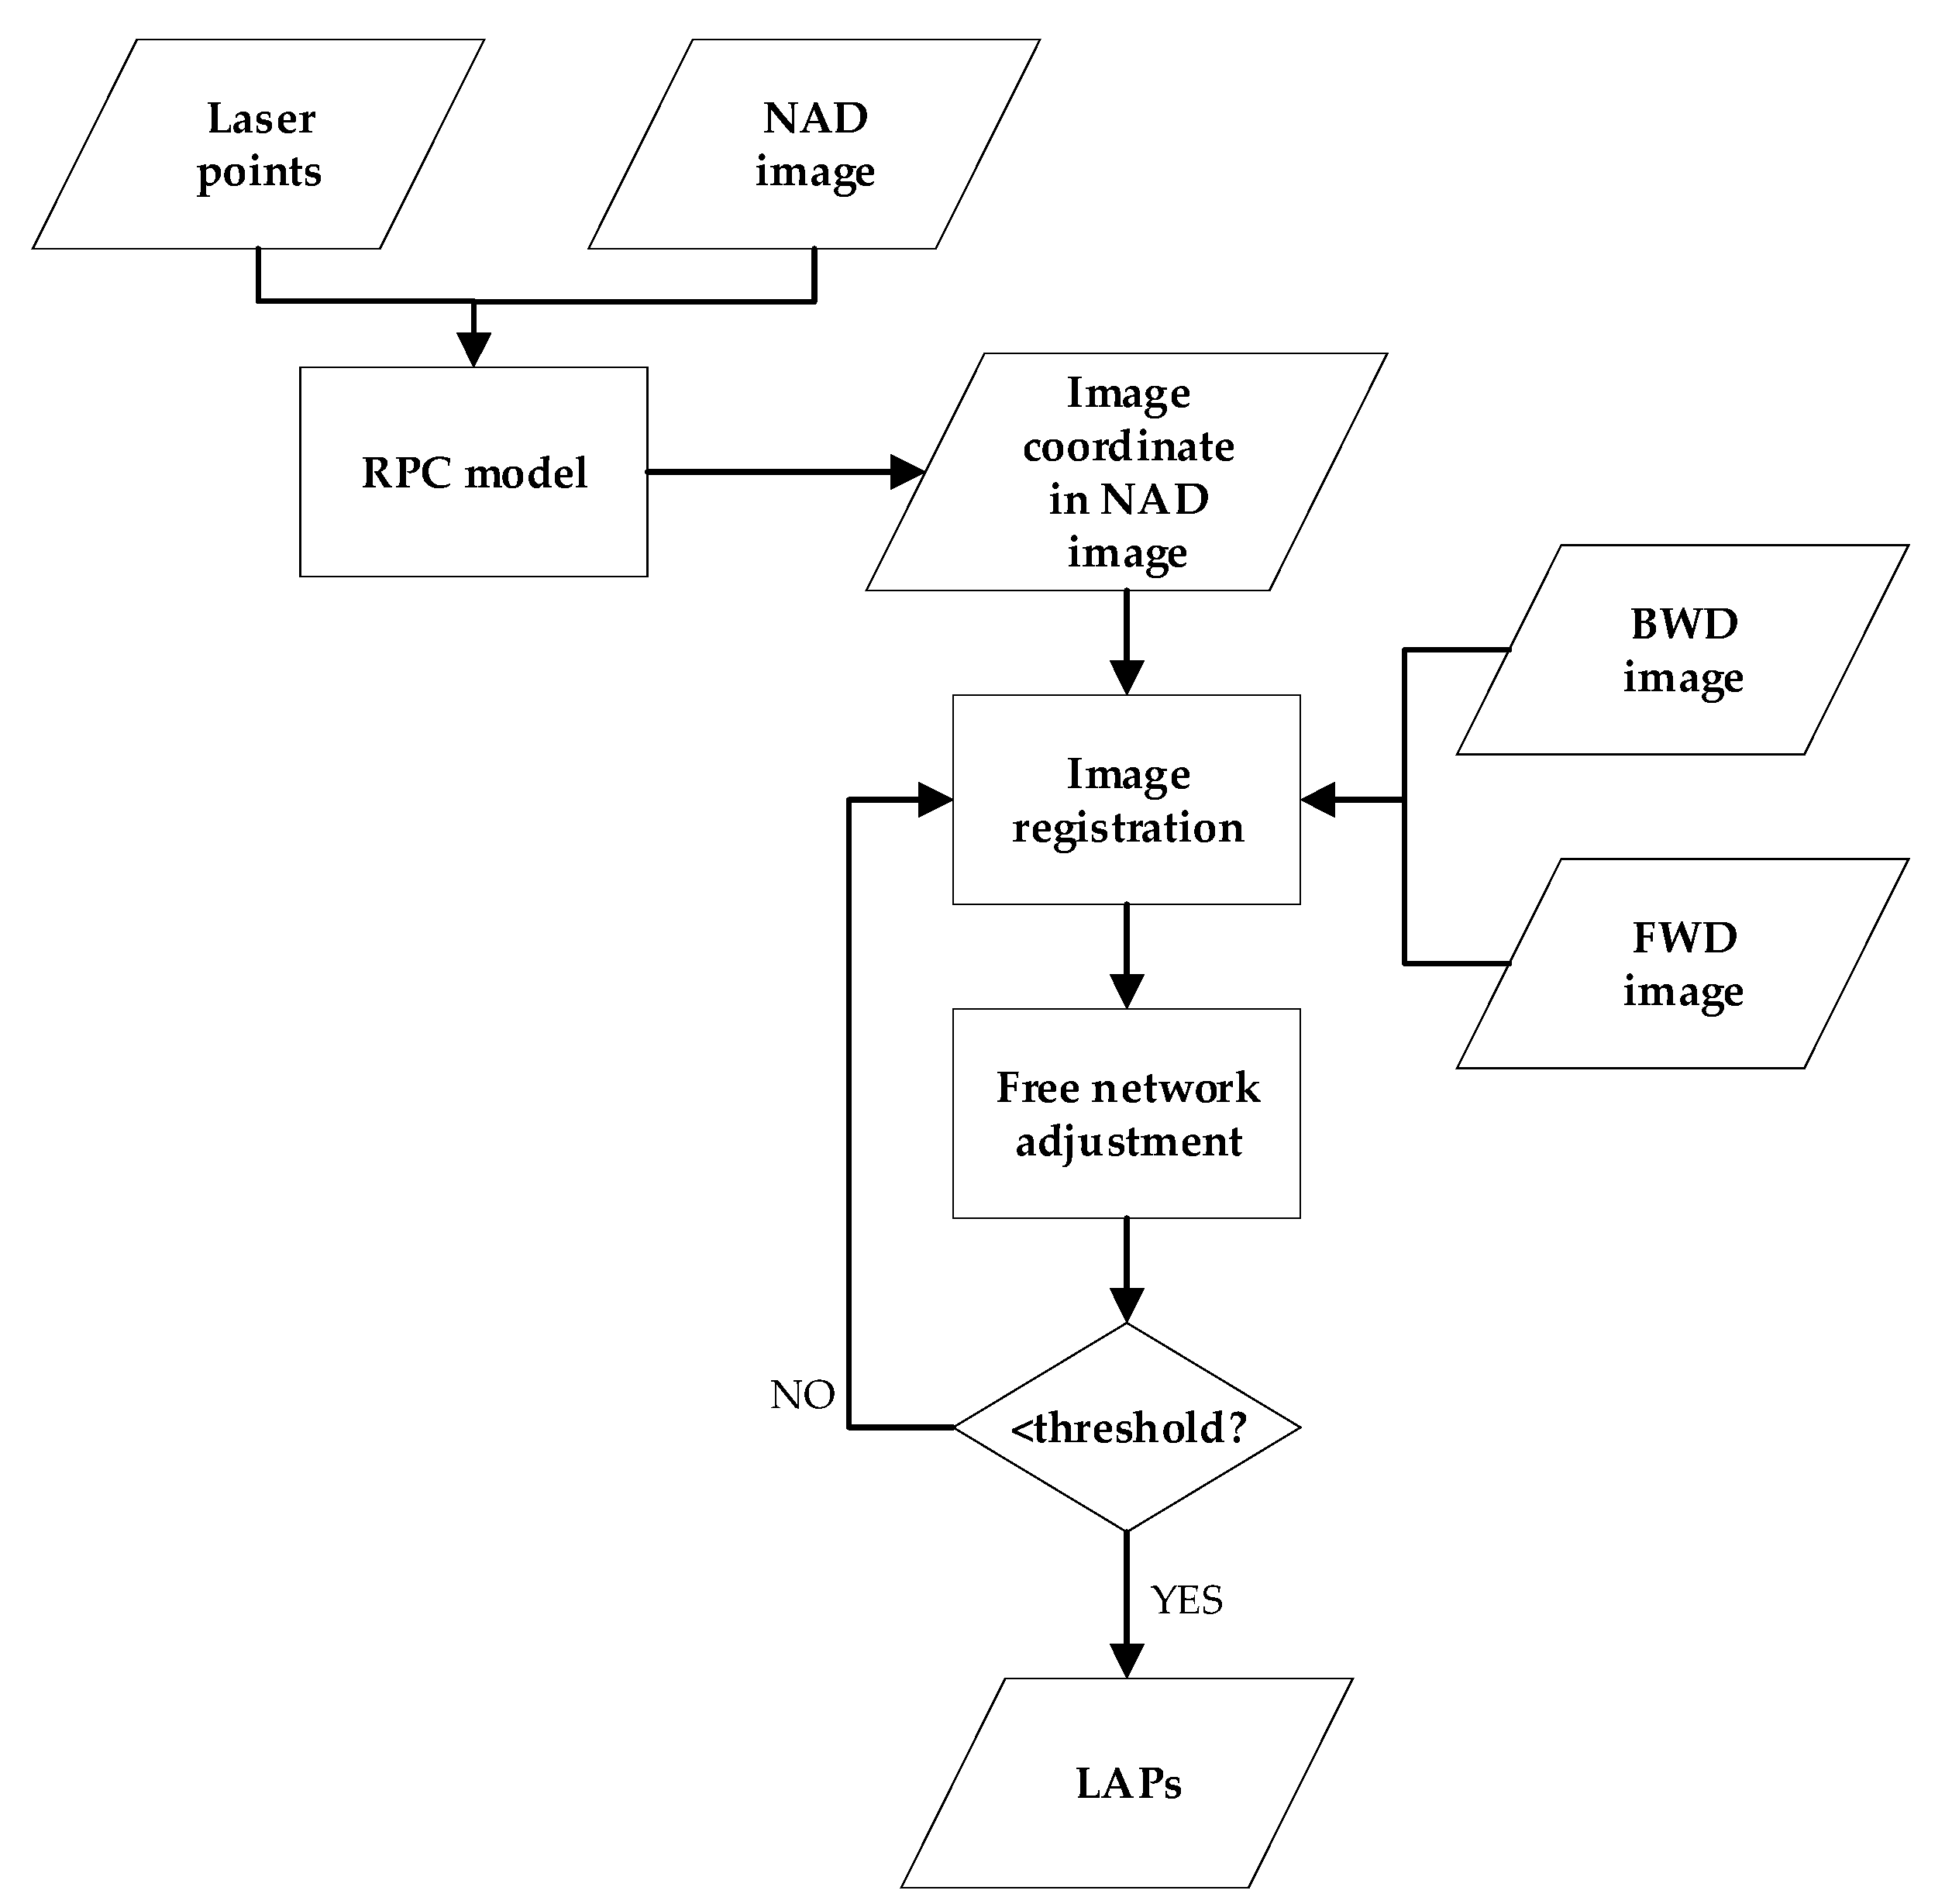
The extraction process of LAPs is mainly divided into three parts, Figure 5 shows the main process diagram.
(1)
Firstly, the geographic coordinates of the LAPs can be obtained by using the latitude, longitude and elevation information of the LAPs itself, and after the conversion of the coordinate system, calculate the ground coordinates of LAPs and obtain the corresponding image coordinates in NAD images by back-projection.
(2)
Then, by using the laser points projected on the NAD camera image as references, obtain the LAPs on the backward-view (BWD) and forward-view (FWD) camera images by registration.
(3)
After obtaining the LAP’s image coordinates on the NAD, BWD, and FWD images, in order to eliminate the mis-registration points, the LAPs can be regarded as the tie points to perform free network adjustment among the stereo images, and the tie points with errors larger than the threshold are eliminated until the error of all the points meets the requirements. At this time, the image coordinates and the corresponding object square coordinates of LAPs are obtained.

2.3. Combined Adjustment Model

At present, mainstream optical satellites are equipped with line array pushbroom sensors, and in order to avoid the problems of difficult to obtain the initial values of the parameters of the block adjustment solution based on the rigorous geometric model, strong parameter correlation, and unstable solution, considering the characteristics of near-parallel projection caused by the long focal length and narrow field-of-view angle of satellite photography, the RFM is generally used at present [25].
The RFM model establishes the transformation relationship between the ground coordinate ( l a t , l o n , h ) and the corresponding image coordinate ( x , y ) in the general form of [26].
{ R n = P 1 ( X n , Y n , Z n ) P 2 ( X n , Y n , Z n ) C n = P 3 ( X n , Y n , Z n ) P 4 ( X n , Y n , Z n )
Among them, ( X , Y , Z ) is the ground point object coordinates after regularization, ( R , C ) is the corresponding image point coordinates on the image after regularization, P 1 ( X , Y , Z ) , P 2 ( X , Y , Z ) , P 3 ( X , Y , Z ) , P 4 ( X , Y , Z ) is a cubic polynomial function containing the ground point coordinates ( X , Y , Z ) , the function X, Y, Z three coordinate components of the respective powers and their powers of the sum of the maximum does not exceed 3.
There are many error compensation models for RPC parameter systems based on the image object, the most commonly used of which is the affine transformation model with six affine change parameters, which can absorb translation, rotation, and scale errors in the error well [5], in the following form.
{ Δ R = e 0 + e 1 R + e 2 C Δ C = f 0 + f 1 R + f 2 C
In Equation (3), x and y are the ground point coordinates calculated from the RFM model to the image coordinates. e 0 , e 1 , e 2 and ( f 0 , f 1 , f 2 ) are the affine transformation parameters and ( Δ R , Δ C ) is the correction parameters.
The affine transformation model is introduced into the RFM, and the affine transformation parameters and the ground point coordinate correction parameters are solved to obtain the form of the matrix of the block adjustment [27,28].
V = A s + B t l ,   P
where V = [ v x v y ] T , s = [ Δ e 0 Δ e 1 Δ e 2 Δ f 0 Δ f 1 Δ f 2 ] T , t = [ Δ l a t Δ l o n Δ h ] T , A = [ x e 0 x e 1 x e 2 0 0 0 0 0 0 y f 0 y f 1 y f 2 ] , B = [ x l a t x l o n x h y l a t y l o n y h ] , l = [ Δ x Δ y ] T , P is the weight matrix.
In order to introduce LAPs and PCPs in the adjustment process, the observation equations of the two control points need to be filled separately, and at this time the filling terms are calculated according to the following two categories.
(1) Observation equation based on LAPs: Since direct free network adjustment does not significantly improve the positioning accuracy of all images after adjustment, the positioning accuracy of images after free network adjustment can be improved by introducing the ranging information of free network adjustment into the adjustment process and establishing an adjustment scheme with elevation constraints. The main difference lies in the fact that the plane coordinates of the object coordinates of the laser points are calculated by stereo intersection with the stereo image, while the elevation values of the intersection coordinates are calculated by using the elevation values of the LAPs. In this paper, the object coordinates of the laser point itself are corrected according to the adjustment results during each iteration, at which time the original error equation (Equation (3)) is modified, and the error equation of the modified laser control point, A = [ x e 0 x e 1 x e 2 0 0 0 0 0 0 y f 0 y f 1 y f 2 ] , B = [ x l a t x l o n 0 y l a t y l o n 0 ] , and its observation equation takes the following form:
{ F x = Δ x + x e 0 Δ e 0 + x e 1 Δ e 1 + x e 2 Δ e 2 + x l a t Δ l a t + x l o n Δ l o n = 0 F y = Δ y + y f 0 Δ f 0 + y f 1 Δ f 1 + y f 2 Δ f 2 + y l a t Δ l a t + y l o n Δ l o n = 0
In the above equation, since only the elevation direction of the LAPs is utilized as the control point and its plane direction is the geographic coordinate acquired by the forward intersection, the error in its plane direction also needs to be added to the error equation.
However, in order to ensure that the elevation accuracy of the LAPs will not exceed the accuracy requirement after updating the correction parameters of the affine transformation, the elevation value h corr calculated after each iteration of the LAPs should comply with the following formula:
h i n i t σ L i dar h corr h i n i t + σ L i d a r
In the above equation, h init is the initial elevation value obtained from laser altimetry data and σ L i d a r is the known accuracy of the laser altimetry data used.
The adjustment iteration process is performed to correct the affine transformation parameters and update the ground point object coordinates, and then the iteration is repeated until it converges. In this process, the elevation coordinates are replaced by the elevation values of the LAPs themselves, and the plane coordinates are the plane coordinates obtained from the forward intersection. The elevation accuracy of the block adjustment based on LAPs is constrained by the elevation value of the laser points, so the elevation positioning accuracy of each image after adjustment depends mainly on the elevation accuracy of the laser control points used.
(2) Observation equation based on PCPs: Since the imaging method of satellite optical images is mainly line array pushbroom imaging, their positioning accuracy mainly depends on the measurement accuracy of on-board attitude orbit sensors. Compared with the optical image, the satellite SAR image is based on the Range-Doppler model, and the error affecting its positioning accuracy is mainly manifested as translation error on the ground, so the system error can be compensated by the on-orbit calibration method using the ground angular reflector, and the compensated image can achieve higher planar positioning accuracy [29,30,31]. Therefore, it can be considered to use the calibrated SAR image as the plane control source, and the plane direction can be constrained in the optical image block adjustment by extracting the control points between the SAR image and the optical image, so as to improve the plane positioning accuracy. Meanwhile, the object coordinates of the PCPs themselves are not modified in the adjustment process.
By using the PCPs extracted from SAR images as plane constraints, the adjustment scheme of PCPs is established. In the process of forward intersection to obtain ground point coordinates, their elevation coordinates are the elevation values obtained from direct image intersection, while their plane coordinates are replaced by the plane coordinates of the PCPs themselves. For the introduced PCPs, a suitable error equation needs to be established. Since its plane coordinates are regarded as the true value in the adjustment without correction, the difference is mainly for the partial derivative of the elevation term compared with the ordinary adjustment control point, at which time the PCPs corresponds to the error equation A = [ x e 0 x e 1 x e 2 0 0 0 0 0 0 y f 0 y f 1 y f 2 ] , B = [ 0 0 x h 0 0 y h ] , and its observation equation is of the following form:
{ F x = Δ x + x e 0 Δ e 0 + x e 1 Δ e 1 + x e 2 Δ e 2 + x h Δ h = 0 F y = Δ y + y f 0 Δ f 0 + y f 1 Δ f 1 + y f 2 Δ f 2 + y h Δ h = 0
In addition, in order to ensure that the plane accuracy of the PCPs will not exceed the accuracy requirement after updating the affine transformation correction parameters during the adjustment solution iteration, the plane coordinates ( x , y ) corr should meet the following requirements in each iteration:
( x , y ) i n i t σ S A R ( x , y ) corr ( x , y ) i n i t + σ S A R
In the above equation, ( x , y ) init is the planar coordinate of the PCPs itself, and σ S A R is the known accuracy of the SAR DOM data used. The method requires that the plane coordinates of the PCPs in each adjustment iteration do not exceed the accuracy range to ensure the accuracy of the adjustment results.
After listing the observation equations of the tie points, PCPs, and LAPs, the adjustment model in matrix form is obtained. In order to solve the compensation parameters of the image, the equation needs to be solved, and Equation (3) is usually transformed into the normal equation according to the least squares principle:
[ A T P A A T P B B T P A B T P A ] [ s t ] = [ A T P l B T P l ]
where the P refers to weight matrix. Rewrite Equation (8) in the following form:
[ U W W T V ] [ s t ] = [ l u l v ]
When solving, when the number of ground points is large, the number of unknowns t will be much larger than s. Therefore, in order to reduce the number of unknowns to be solved, generally only the correction parameters of the affine coefficient of change of the image are solved, and the ground point unknowns can be solved in a modified way to eliminate the term, which can greatly improve the speed of solving, at which time we can obtain:
( U W V 1 W T ) s = l u W V 1 l v
The ground point coordinates can be updated by correcting the affine transformation coefficients after solving s by Equation (10), and then using the corrected parameters ahead of the rendezvous. When solving Equation (10), a variety of equation solving methods including the conjugate gradient method can be used for fast solution. In order to ensure the reliability of the adjustment, the adjustment results are usually optimized by multiple iterations. The results are updated by repeated iterations in the adjustment solution process until the change in two iterations is less than the set threshold, then the iteration is terminated and the adjustment results are output.

2.4. Experimental Data and Test Area

In order to verify the effectiveness of the proposed adjustment method, a total of 255 scenes of ZY-3 images of Jiangxi region, China, containing 86 stereo models, were collected from 24 December 2012 to 11 January 2014. In order to verify the positioning accuracy of the images in this region, a total of 134 ground points were collected by using Real-Time Kinematic Global Positioning System (RTK-GPS) measurements, which can ensure an accuracy better than 0.1 m and can therefore be used as independent check points (ICPs).
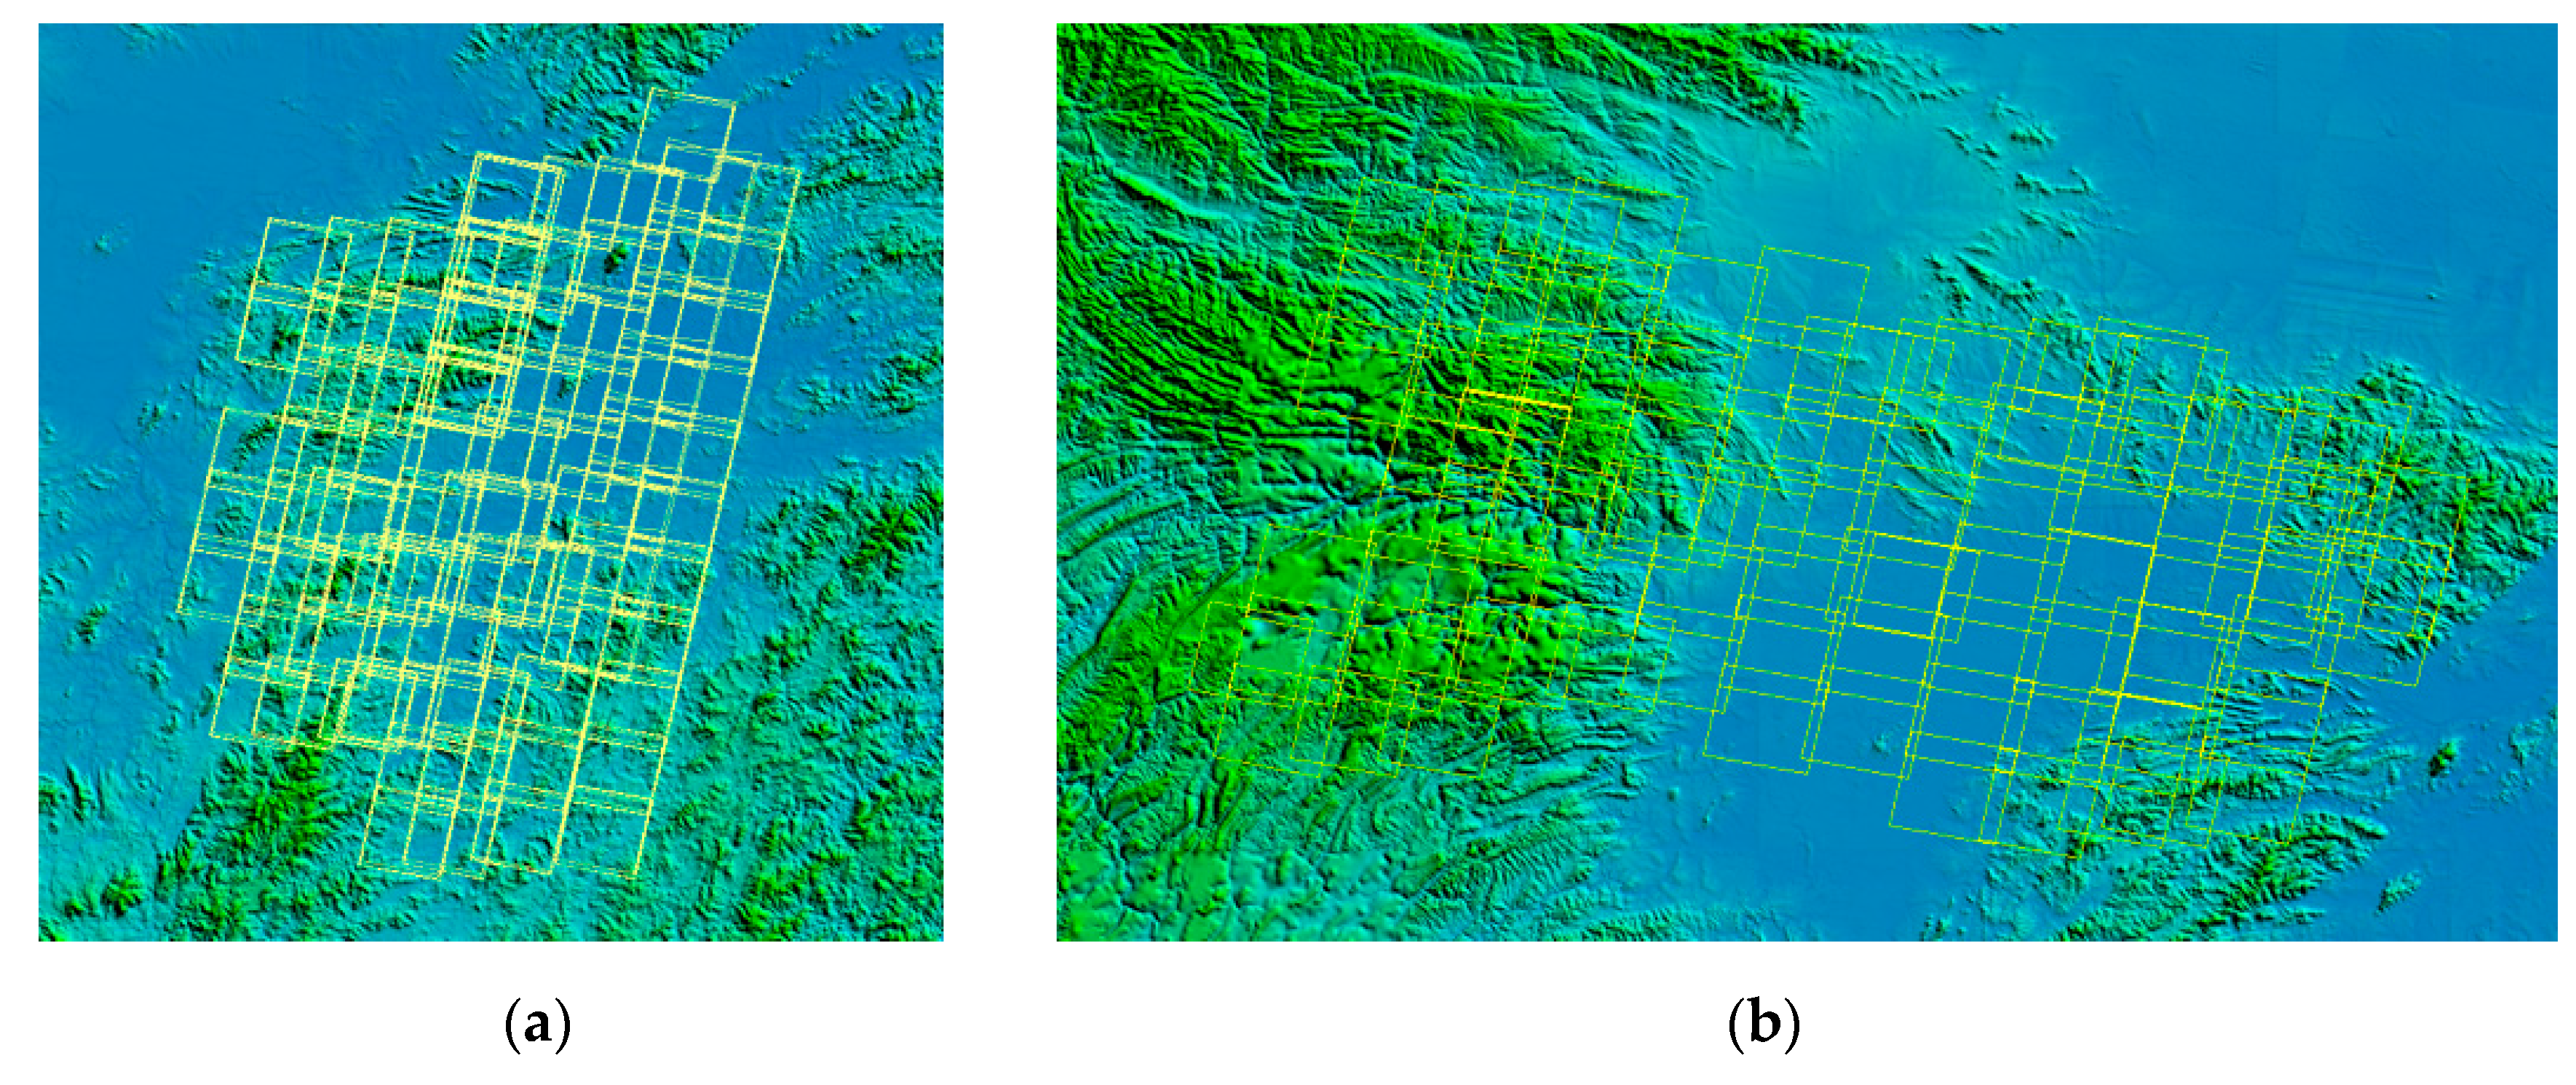
A total of 297 scenes of mapping satellite images of Hubei region, China within the time range of 27 April 2012 to 29 February 2018 were also collected, divided into 99 stereo models covering the whole province of Hubei, while a total of 134 ICPs were collected within the region for accuracy check, with a positioning accuracy better than 0.1 m. Figure 6 shows the image distribution in the two areas, and the detailed information of the two test areas is shown in Table 1. The topography in the Jiangxi test area is mainly plain, while hills and mountains exist in some areas with large elevation changes. The eastern part of the test area in Hubei Province is mainly plain terrain with a small amount of hills, while the western part is mainly covered with mountainous terrain, resulting in a large variation of topography in this test area.
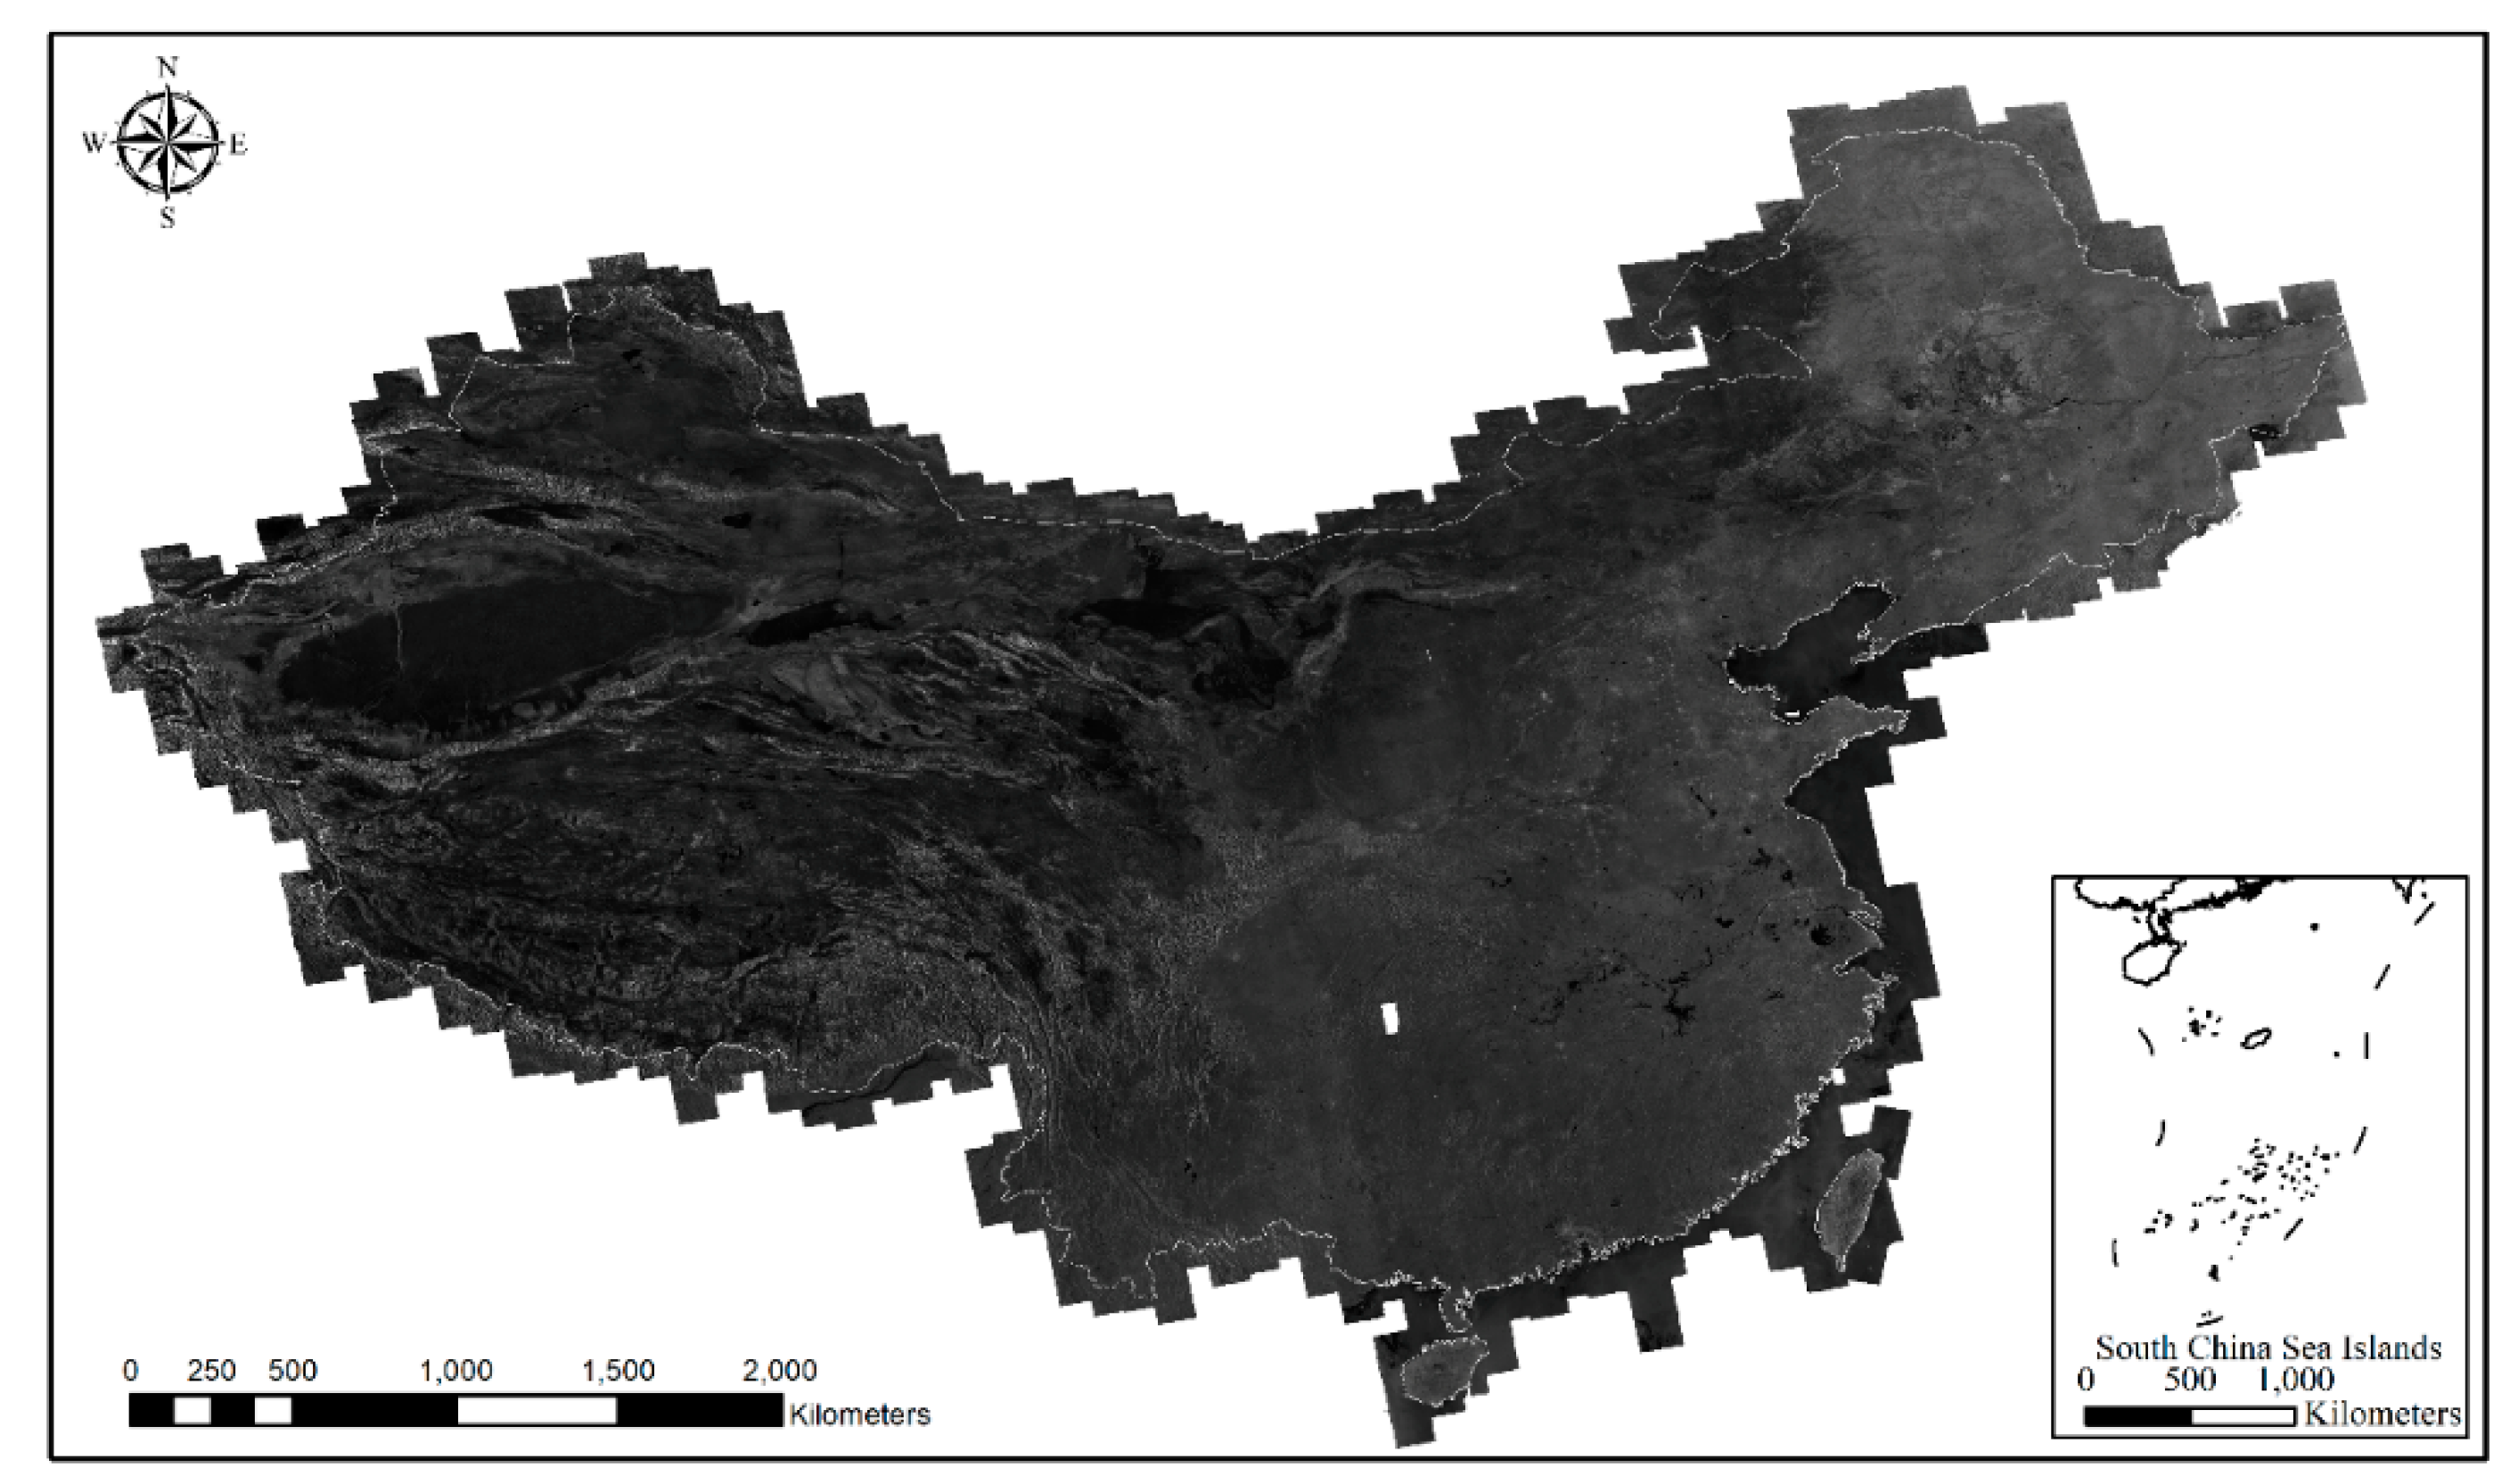
The SAR DOM used is a regional orthophoto of China was generated from Gaofen-3 (GF-3) image with FS2 mode, and the approximate range of this DOM is shown in Figure 7. Its ground sampling interval is about 5 m, and its positioning accuracy can be guaranteed within 7 m after verification, which can be used as control data to collect PCPs through HOPC matching and enhance the planar positioning accuracy of the image after joint adjustment. The laser data used is the L14 level product of GLAS, which mainly records more than 80 parameters such as laser footprint 3D coordinates, laser echo saturation correction, and gain value. Considering the diameter of laser spot is around 70 m, the data of 30 m-grid SRTM is used for elevation extract in the DEM-based LAP election method.

3. Results

3.1. Combined Block Adjustment Test for ZY-3 Images

In this section, firstly, the registration test between ZY-3 and SAR DOM was carried out using the HOPC method. From the results, it can be seen that although the texture and radiation characteristics of SAR and optical images are different, the distribution of features actually has certain similarity in spatial scale, so that high accuracy tie points can be obtained in the case of features similar to houses as well as farmland. As shown in Figure 8, the registration between farmland and buildings can obtain good results, from which the pixel correspondence between optical images and SAR DOM can be effectively obtained, so that the latitude and longitude coordinates of the corresponding points can be read from the DOM, and finally used as PCPs to improve the planimetric positioning accuracy of the optical images after adjustment. At the same time, after selection and projection of the laser data, 9074 LAPs were obtained in the area of Jiangxi, and their distribution is shown in Figure 9a. The LAPs obtained after selection covers most of the image area and can provide enough LAPs as elevation control reference.
After obtaining PCPs and LAPs as control points, in order to verify the effectiveness of adding LAPs and PCPs as control conditions to the adjustment and analyze the influence of the inconsistency of the object-image coordinates on the adjustment results, tests were conducted according to the following scheme. In addition, to study the influence of the plane position accuracy on the effect of the extracted LAPs, there are two options for acquiring the plane coordinate of the LAPs, namely, conducting adjustment with PCPs to enhance the plane positioning accuracy of the image before acquiring the LAPs and not using the PCPs before acquiring the LAPs.
Plan A: free network adjustment without PCPs or LAPs.
Plan B: block adjustment with 14287 PCPs.
Plan C: block adjustment with 9074 LAPs which were collected before adjustment with PCPs.
Plan D: block adjustment with 9074 LAPs which were collected after adjustment with PCPs.
Plan E: block adjustment with both 9074 LAPs and 14287 PCPs.
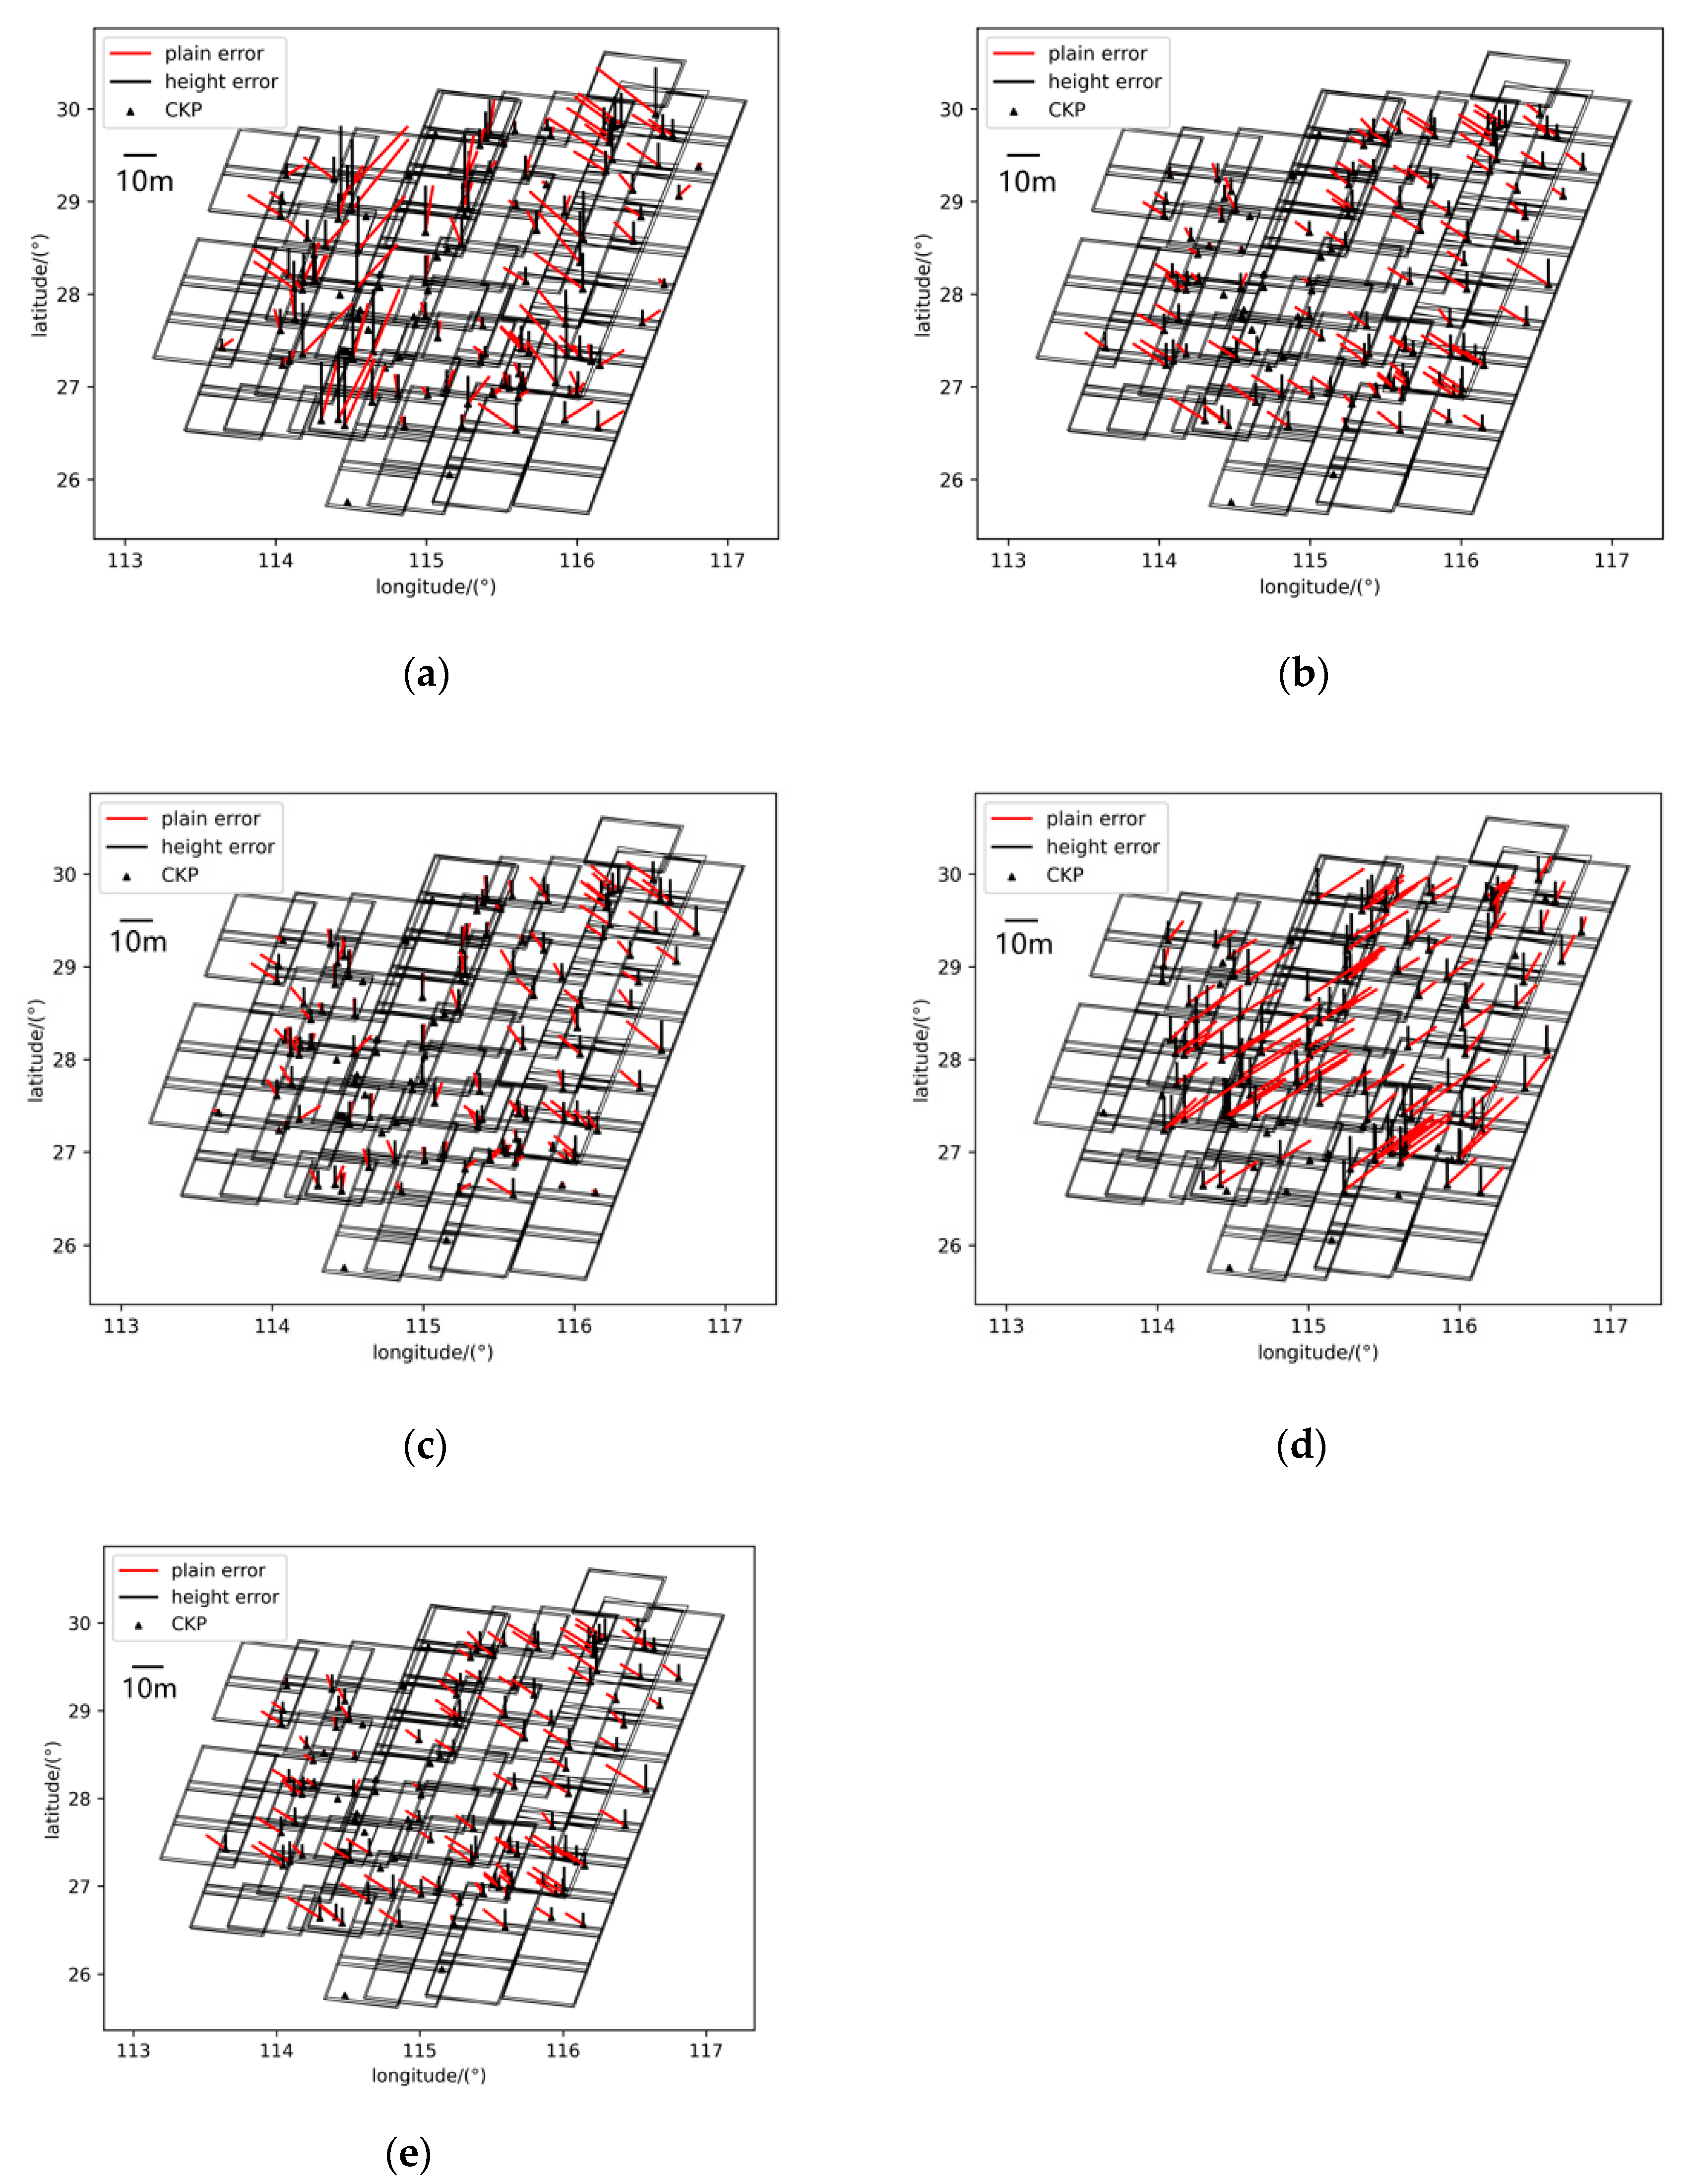
After conducting the test according to the designed test scheme, the accuracy of the ICPs is shown as in Table 2, while the distribution of the residuals of the results is shown in Figure 10. When the free network adjustment is performed without using any control points, the root mean square error (RMSE) in the east, north, plane, and elevation directions are 12.47 m, 7.64 m, 14.62 m, and 15.30 m, respectively. After adding the PCPs, the east, north, plain, and height accuracies change to 3.37 m, 6.28 m, 7.13 m, and 22.38 m, respectively. The plain accuracy is increased from 14.66 m to 7.13 m, an improvement of 51.2%, which indicates that the object coordinates of the PCPs are made to approximate their true planar positions in the adjustment iteration, and the PCPs can effectively improve the planar positioning accuracy after adjustment.
Firstly, it can be seen that the elevation accuracy can be improved with the introduction of LAPs, regardless of whether the plane coordinates were corrected by adjustment with PCPs, from the original 15.30 m to 4.24 m without corrected plane accuracy and 3.09 m after correction, respectively, with 72.2% and 79.8% improvement. When LAPs collected before adjustment using PCPs are introduced as elevation control, the accuracies of the east, north, plane, and elevation directions are 7.31 m, 11.82 m, 13.90 m, and 4.24 m, respectively, while the adjustment results using LAPs collected after adjustment using PCPs are 6.85 m, 4.19 m, 9.02 m, and 3.09 m. It can also be found that, compared with the elevation accuracy after uncorrected plane coordinates, the introduction of LAPs as elevation control after corrected plane accuracy can reduce the actual elevation accuracy decrease caused by plane position error, and improve by 27.2% compared with the uncorrected before. Therefore, before the step of laser point introduction, it is recommended to use other control data to improve image plane positioning accuracy, which can effectively improve the improvement effect of laser point in elevation.
The adjustment results after using both LAPs and PCPs are 3.38 m, 6.30 m, 7.15 m, and 2.29 m in the east, north, plane, and elevation directions, respectively, which are comparable to the accuracy of 7.13 m obtained by using PCPs alone in plain, while the elevation accuracy is slightly improved compared to 3.09 m obtained by using LAPs alone. This indicates that the simultaneous use of elevation and plane control points can improve the accuracy in both plane and elevation directions, and can also maximize the use of control information provided by multi-source control data.

3.2. Combined Block Adjustment Test for Mapping Satellite-1 Images

To further validate the method proposed in this paper, the Mapping Satellite-1 image test was conducted according to the same scheme in the Section 3.2, and a total of 13,213 qualified LAPs were obtained after laser point selection in the Hubei region, and their distribution is shown in Figure 9b. Using the extracted LAPs and PCPs, the block adjustment was performed, and the results of the ICPs after adjustment are shown in Table 3, while the distribution of the residual maps is shown in Figure 11.
From the results above, it can be seen that the accuracies of block adjustment without LAPs and PCPs are 5.94 m, 9.68 m, 11.35 m, and 8.37 m in east, north, plane, and elevation directions, respectively, and after introducing PCPs into adjustment first, the accuracies are 5.46 m, 7.14 m, 9.00 m, and 5.91 m in the east, north, plane, and elevation directions, respectively. Compared with the completely free network adjustment, the plane direction is improved from 11.35 m to 9.00 m, increased by 20.7%, and the result is the same as the result of ZY-3, which indicates that the plane control point can effectively improve the positioning accuracy in the plane direction. Meanwhile, the elevation accuracy is basically unchanged because the elevation direction is not constrained during the adjustment, and the elevation results of the intersection after each iteration are retained.
The elevation accuracy was improved from 8.37 m to 3.56 m in case of using LAPs before adjustment with PCPs and to 3.51 m after adjustment with PCPs, which improved 57.3% and 58.1%, respectively. Whether the plane accuracy is improved or not before introduction of LAPs does not have much effect on the elevation accuracy improvement of Mapping Satellite-1 image after adjustment, probably because the resolution of Mapping Satellite-1 image is lower compared with that of ZY-3, so the improvement of plane positioning accuracy does not have a significant effect on the elevation accuracy improvement. At the same time, the planimetric accuracy is partially improved compared with the free network adjustment, which reveals that the elevation accuracy can help improve the planimetric accuracy and make the ground point coordinates obtained by the stereo intersection model closer to the real ground point coordinates when the forward intersection is performed.
After using both LAPs and PCPs, the geometric positioning accuracies were improved to 5.45 m, 7.12 m, 9.00 m, and 3.51 m in east, north, planar, and elevation directions, which is basically the sum of the effects of using LAPs and PCPs separately, proving that using both control points can effectively improve the positioning accuracy of images after adjustment. The results are consistent with the conclusions drawn from the test results of ZY-3.

4. Discussion

From the experimental results, the following summary can be obtained.
(1)
Using LAPs as elevation control can effectively improve the elevation positioning accuracy of the image after adjustment, and at the same time, if the accuracy of the plane position is firstly improved before introducing LAPs, then the plane error of the laser control points can be partially eliminated, thus further improving the results of its elevation positioning accuracy. The results of ZY-3 show that after adding LAPs, the elevation accuracy is improved from the original 15.30 m to 4.24 m without corrected plane accuracy and 3.09 m after corrected plane accuracy, which is 72.2% and 79.8% respectively, while the accuracy after corrected plane position is 27.2% higher than that without correction, which indicates that corrected plane positioning accuracy is effective for improving elevation accuracy.
(2)
The PCPs obtained by using SAR registration can effectively improve the planar positioning accuracy of the image after adjustment, but the accuracy depends on the sampling interval of the SAR DOM and the positioning accuracy, and if the resolution of the optical image is high and the resolution of the SAR DOM is enough high, taking the HOPC registration accuracy of 1.5 pixels as an example, a SAR DOM with a sampling interval of 5 m can provide a maximum positioning accuracy of 7.25 m for the optical image, which can effectively ensure the planar positioning accuracy for areas lacking GPCs in the global mapping process. However, for higher accuracy positioning requirements, it is necessary to provide a higher resolution and higher accuracy SAR DOM to meet the accuracy needs.
(3)
ZY-3 experiments using both LAPs and PCPs can guarantee a plane accuracy of 7.15 m and an elevation accuracy of 2.29 m, which is better than the elevation accuracy of 22.38 m when using PCPs alone and plain accuracy of 9.02 m when using LAPs alone. This result shows that the combination of plan and elevation control points provides the best plain and elevation positioning accuracy.

5. Conclusions

This paper proposes a combined optical satellite stereo image adjustment method using spaceborne SAR image and laser altimetry data assistance, which first extracts the PCP by optical stereo image and SAR-DOM registration, and selection the LAPs from original laser points. Then, the observation equations of LAPs, PCPs, and tie points are established, respectively, and finally the orientation correction parameters of optical stereo images are obtained by iterative solution to improve the plane and elevation accuracy. The results of ZY3 using both LAPs and PCPs are 51.1% and 85.1% higher than those of free network adjustment in planar and elevation directions, respectively, reaching 7.15 m and 2.29 m, which can provide technical guarantee for stereo mapping of global large-scale satellite images without GCPs.

Author Contributions

Conceptualization, G.Z.; Data curation, B.J. and X.L.; Investigation, B.J.; Methodology, B.J.; Project administration, T.W.; Software, B.J. and Y.Y.; Writing—original draft, B.J. All authors have read and agreed to the published version of the manuscript.

Funding

This work was supported by the Key Research and Development Program of the Ministry of Science and Technology under Grant 2018YFB0504905, Civil Aerospace Technology pre research project D040107.

Institutional Review Board Statement

Not applicable.

Informed Consent Statement

Not applicable.

Data Availability Statement

Not applicable.

Acknowledgments

The authors would like to thank the reviewers for their helpful comments.

Conflicts of Interest

The authors declare no conflict of interest.

References

  1. Zhang, L.; Zhang, J.; Chen, X.; Hong, A.N. Block-Adjustment with SPOT-5 Imagery and Sparse GCPs Based on RFM. Acta Geod. Cartogr. Sin. 2009, 38, 302–310. [Google Scholar]
  2. Bouillon, A.; Breton, E.; De Lussy, F.; Gachet, R. SPOT5 geometric image quality. In Proceedings of the IGARSS 2003. 2003 IEEE International Geoscience and Remote Sensing Symposium, Proceedings (IEEE Cat. No.03CH37477), Toulouse, France, 21–25 July 2003; pp. 303–305. [Google Scholar]
  3. Pan, H.B.; Zou, Z.R.; Zhang, G.; Zhu, X.Y.; Tang, X.M. A Penalized Spline-Based Attitude Model for High-Resolution Satellite Imagery. IEEE Trans. Geosci. Remote Sens. 2016, 54, 1849–1859. [Google Scholar] [CrossRef]
  4. Rottensteiner, F.; Weser, T.; Lewis, A.; Fraser, C.S. A Strip Adjustment Approach for Precise Georeferencing of ALOS Optical Imagery. IEEE Trans. Geosci. Remote Sens. 2009, 47, 4083–4091. [Google Scholar] [CrossRef]
  5. Wang, T.Y.; Zhang, G.; Li, D.R.; Tang, X.M.; Jiang, Y.H.; Pan, H.B.; Zhu, X.Y. Planar Block Adjustment and Orthorectification of ZY-3 Satellite Images. Photogramm. Eng. Remote Sens. 2014, 80, 559–570. [Google Scholar] [CrossRef]
  6. Zhang, Y.J.; Wan, Y.; Huang, X.H.; Ling, X. DEM-Assisted RFM Block Adjustment of Pushbroom Nadir Viewing HRS Imagery. IEEE Trans. Geosci. Remote Sens. 2016, 54, 1025–1034. [Google Scholar] [CrossRef]
  7. Li, X.; Wang, T.; Zhang, G.; Jiang, B.; Zhao, Y. Planar Block Adjustment for China’s Land Regions with LuoJia1-01 Nighttime Light Imagery. Remote Sens. 2019, 11, 2097. [Google Scholar] [CrossRef] [Green Version]
  8. Cao, H.; Tao, P.J.; Li, H.H.; Shi, J. Bundle adjustment of satellite images based on an equivalent geometric sensor model with digital elevation model. ISPRS J. Photogramm. Remote Sens. 2019, 156, 169–183. [Google Scholar] [CrossRef]
  9. Cheng, A.F.; Cole, T.D.; Zuber, M.T.; Smith, D.E.; Guo, Y.P.; Davidson, F. In-flight calibration of the Near Earth Asteroid Rendezvous laser rangefinder. Icarus 2000, 148, 572–586. [Google Scholar] [CrossRef] [Green Version]
  10. Shan, J.; Yoon, J.S.; Lee, D.S.; Kirk, R.L.; Neumann, G.A.; Acton, C.H. Photogrammetric analysis of the Mars Global Surveyor mapping data. Photogramm. Eng. Remote Sens. 2005, 71, 97–108. [Google Scholar] [CrossRef]
  11. Ouyang, Z.; Jiang, J.; Li, C.; Sun, H.; Zou, Y.; Liu, J.; Liu, J.; Zhao, B.; Ren, X.; Yang, J.; et al. Preliminary Scientific Results of Chang’E-1 Lunar Orbiter:Based on Payloads Detection Data in the First Phase. Chin. J. Space Sci. 2008, 28, 361–369. [Google Scholar]
  12. Abshire, J.B.; Sun, X.L.; Riris, H.; Sirota, M.; McGarry, J.; Palm, S.; Ketchum, E.A.; Follas, R.B. Geoscience laser altimeter system (GLAS) on the ICESat mission: Pre-launch and on-orbit measurement performance. Geophys. Res. Lett. 2003, 32, 1534–1536. [Google Scholar] [CrossRef] [Green Version]
  13. Markus, T.; Neumann, T.; Martino, A.; Abdalati, W.; Brunt, K.; Csatho, B.; Farrell, S.; Fricker, H.; Gardner, A.; Harding, D.; et al. The Ice, Cloud, and land Elevation Satellite-2 (ICESat-2): Science requirements, concept, and implementation. Remote Sens. Environ. 2017, 190, 260–273. [Google Scholar] [CrossRef]
  14. Walker, C.C.; Gardner, A.S. Evolution of ice shelf rifts: Implications for formation mechanics and morphological controls. Earth Planet. Sci. Lett. 2019, 526, 115764. [Google Scholar] [CrossRef]
  15. Zhang, G.; Chen, W.; Xie, H. Tibetan Plateau’s Lake Level and Volume Changes from NASA’s ICESat/ICESat-2 and Landsat Missions. Geophys. Res. Lett. 2019, 46, 13107–13118. [Google Scholar] [CrossRef]
  16. Lin, C.S. Improved derivation of forest stand canopy height structure using harmonized metrics of full-waveform data. Remote Sens. Environ. 2019, 235, 111436. [Google Scholar] [CrossRef]
  17. Huang, X.D.; Xie, H.J.; Liang, T.G.; Yi, D.H. Estimating vertical error of SRTM and map-based DEMs using ICESat altimetry data in the eastern Tibetan Plateau. Int. J. Remote Sens. 2011, 32, 5177–5196. [Google Scholar] [CrossRef]
  18. Rizzoli, P.; Martone, M.; Gonzalez, C.; Wecklich, C.; Tridon, D.B.; Brautigam, B.; Bachmann, M.; Schulze, D.; Fritz, T.; Huber, M.; et al. Generation and performance assessment of the global TanDEM-X digital elevation model. Isprs J. Photogramm. 2017, 132, 119–139. [Google Scholar] [CrossRef] [Green Version]
  19. Wu, B.; Guo, J.; Hu, H.; Li, Z.; Chen, Y. Co-registration of lunar topographic models derived from Chang’E-1, SELENE, and LRO laser altimeter data based on a novel surface matchingmethod. Earth Planet. Sci. Lett. 2013, 364, 68–84. [Google Scholar] [CrossRef]
  20. Li, G.Y.; Tang, X.M.; Gao, X.M.; Wang, H.B.; Wang, Y. ZY-3 Block adjustment supported by glas laser altimetry data. Photogramm. Rec. 2016, 31, 88–107. [Google Scholar] [CrossRef]
  21. Jin, W.; Yong, Z.; Zuxun, Z.; Xiao, L.; Pengjie, T.; Mengxiao, S. ICESat laser points assisted block adjustment for Mapping Satellite-1 stereo imagery. Acta Geod. Cartogr. Sin. 2018, 47, 359. [Google Scholar]
  22. Zhang, G.; Xu, K.; Jia, P.; Hao, X.Y.; Li, D.R. Integrating Stereo Images and Laser Altimeter Data of the ZY3-02 Satellite for Improved Earth Topographic Modeling. Remote Sens. 2019, 11, 2453. [Google Scholar] [CrossRef] [Green Version]
  23. Ye, Y.X.; Bruzzone, L.; Shan, J.; Bovolo, F.; Zhu, Q. Fast and Robust Matching for Multimodal Remote Sensing Image Registration. IEEE Trans. Geosci. Remote Sens. 2019, 57, 9059–9070. [Google Scholar] [CrossRef] [Green Version]
  24. Magruder, L.A.; Webb, C.E.; Urban, T.J.; Silverberg, E.C.; Schutz, B.E. ICESat altimetry data product verification at White Sands Space Harbor. IEEE Trans. Geosci. Remote Sens. 2007, 45, 147–155. [Google Scholar] [CrossRef]
  25. Zhang, G.; Fei, W.B.; Li, Z.; Zhu, X.Y.; Li, D.R. Evaluation of the RPC Model for Spaceborne SAR Imagery. Photogramm. Eng. Remote Sens. 2010, 76, 727–733. [Google Scholar] [CrossRef]
  26. Tao, C.V.; Hu, Y. A comprehensive study of the rational function model for photogrammetric processing. Photogramm. Eng. Remote Sens. 2001, 67, 1347–1357. [Google Scholar]
  27. Grodecki, J.; Dial, G. Block adjustment of high-resolution satellite images described by rational polynomials. Photogramm. Eng. Remote Sens. 2003, 69, 59–68. [Google Scholar] [CrossRef]
  28. Dial, G.; Grodecki, J. Block adjustment with rational polynomial camera models. In Proceedings of the ASCM-ASPRS Annual Conventions, Washington, DC, USA, 29 April 2002. [Google Scholar]
  29. Zhang, G.; Wu, Q.W.; Wang, T.Y.; Zhao, R.S.; Deng, M.J.; Jiang, B.Y.; Li, X.; Wang, H.B.; Zhu, Y.; Li, F.T. Block Adjustment without GCPs for Chinese Spaceborne SAR GF-3 Imagery. Sensors 2018, 18, 4023. [Google Scholar] [CrossRef] [Green Version]
  30. Zhao, R.S.; Zhang, G.; Deng, M.J.; Xu, K.; Guo, F.C. Geometric Calibration and Accuracy Verification of the GF-3 Satellite. Sensors 2017, 17, 1977. [Google Scholar] [CrossRef] [Green Version]
  31. Deng, M.J.; Zhang, G.; Zhao, R.S.; Li, S.N.; Li, J.S. Improvement of Gaofen-3 Absolute Positioning Accuracy Based on Cross-Calibration. Sensors 2017, 17, 2903. [Google Scholar] [CrossRef] [Green Version]
Figure 1. Flow chart of method.
Remotesensing 13 03062 g001
Figure 2. Examples of nonlinear intensity differences between multimodal images. (Left) Visible and (Right) synthetic aperture radar (SAR) images.
Remotesensing 13 03062 g002
Figure 3. Construction process of histogram of orientated phase congruency (HOPC).
Remotesensing 13 03062 g003
Figure 4. Geoscience Laser Altimeter System (GLAS) L14 Product laser altimetry points (LAPs) Selection Method.
Remotesensing 13 03062 g004
Figure 5. LAPs Extraction Flow.
Remotesensing 13 03062 g005
Figure 6. Distribution of Images in Test Area. (a) Ziyuan-3 (ZY-3) in Jiangxi Area, (b) Mapping Satellite-1 in Hubei Area.
Remotesensing 13 03062 g006
Figure 7. Gaofen-3 (GF-3) SAR digital orthophoto map (DOM) of China.
Remotesensing 13 03062 g007
Figure 8. Points in optical and SAR image. (a) point a, (b) point b.
Remotesensing 13 03062 g008
Figure 9. Distribution of LAPs. (a) ZY-3 in Jiangxi Area, (b) Mapping Satellite-1 in Hubei Area.
Remotesensing 13 03062 g009
Figure 10. ZY-3 block adjustment each plan residuals distribution. (a) plan a, (b) plan b, (c) plan c, (d) plan d and (e) plan e.
Remotesensing 13 03062 g010
Figure 11. Mapping Satellite-1 block adjustment each plan residuals distribution. (a) plan a, (b) plan b, (c) plan c, (d) plan d and (e) plan e.
Remotesensing 13 03062 g011
Table 1. Basic parameters of test area.
ItemTest Area
ZY-3Mapping Satellite-1
Acquisition Date11.1.2012–24.12.202127.4.2012–29.2.2018
Test AreaJiangxiHubei
Elevation Range (m)(6.107, 1335.71)(3.58, 2572.21)
Latitude Range25.61°N–30.62°N29.00°N–32.90°N
Longitude Range113.20°E–117.12°E108.81°E–116.10°E
Image Num255297
Cover Range50 km × 50 km60 km × 60 km
Image resolutionNAD-2.1 m
BWD/FWD-3.5 m
5 m
Table 2. Total Adjustment Results of ZY-3 Stereo Images.
PlanLAP NumPCP NumMaximum Error (m)Mean Difference (m)RMSE (m)
EastNorthPlainHeightEastNorthPlainHeightEastNorthPlainHeight
Plan A0044.6821.9938.00−40.677.76−1.1011.796.9612.477.6414.6215.30
Plan B014,2877.52−13.3313.3948.971.51−5.516.6814.423.376.287.1322.38
Plan C9074013.53−11.3215.10−10.265.92−2.247.48−0.246.854.199.023.09
Plan D83480−15.3721.3323.40−9.86−4.5410.8213.38−0.067.3111.8213.904.24
Plan E834814,2877.43−13.5713.58−10.241.60−5.546.70−0.213.386.3077.152.29
Table 3. Total Adjustment Results of Mapping Satellite-1 Stereo Images.
PlanLAP NumPCP NumMaximum Error (m)Mean Difference (m)RMSE (m)
EastNorthPlainHeightEastNorthPlainHeightEastNorthPlainHeight
Plan A00−19.24−23.3025.36−31.65−2.31−6.999.62−1.115.949.6811.358.37
Plan B035,82521.32−17.3422.75−16.953.61−5.218.090.395.467.119.005.91
Plan C13,213017.56−16.6618.659.47−1.72−5.707.89−0.155.137.368.973.56
Plan D14,005017.91−16.5519.009.37−1.73−5.657.80−0.105.177.318.953.51
Plan E14,00535,82521.31−17.3322.759.103.59−5.248.09−0.165.457.128.973.51
Publisher’s Note: MDPI stays neutral with regard to jurisdictional claims in published maps and institutional affiliations.