
Space-Time Machine Learning Models to Analyze COVID-19 Pandemic Lockdown Effects on Aerosol Optical Depth over Europe


Abstract
:1. Introduction
2. Material and Data
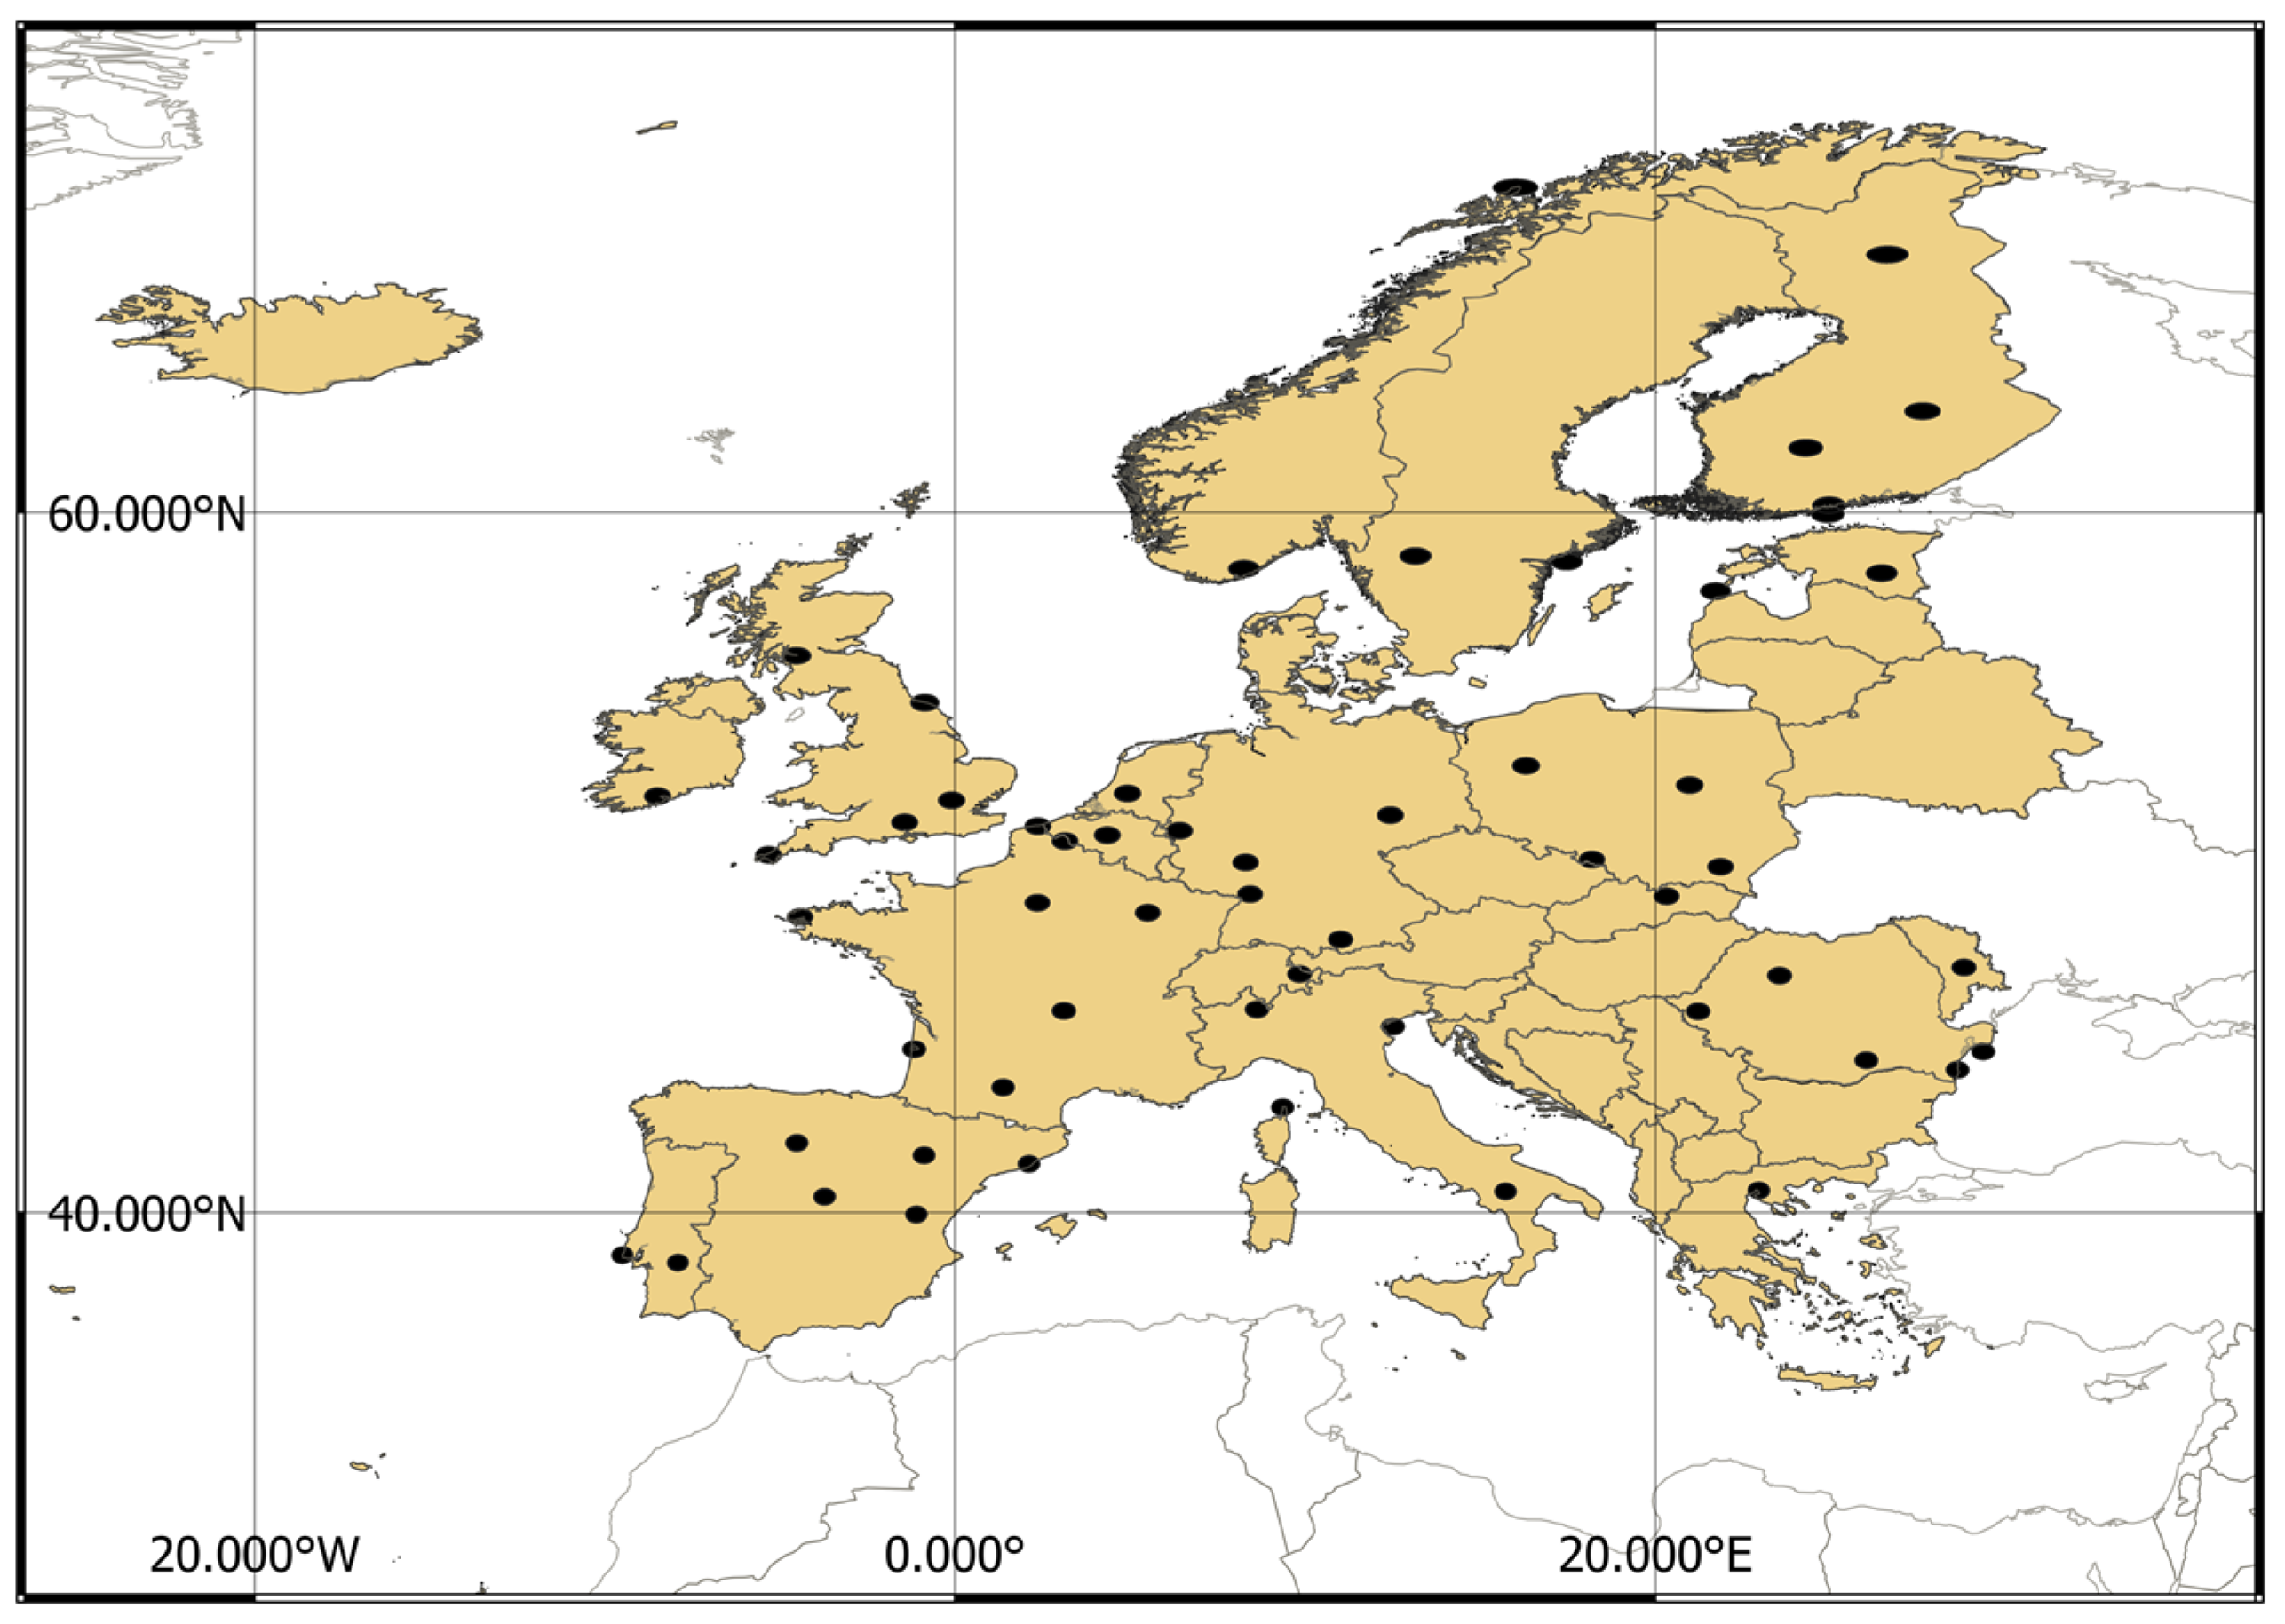
2.1. Study Area and Period
2.2. Data
2.2.1. MODIS Data
2.2.2. Copernicus Atmosphere Monitoring Service (CAMS) Data
2.2.3. Digital Elevation Model
2.2.4. Ground-Based AOD Data
2.2.5. European Centre for Medium-Range Weather Forecasts reanalysis (ECMWF)
3. Methodology
4. Space-Time Models
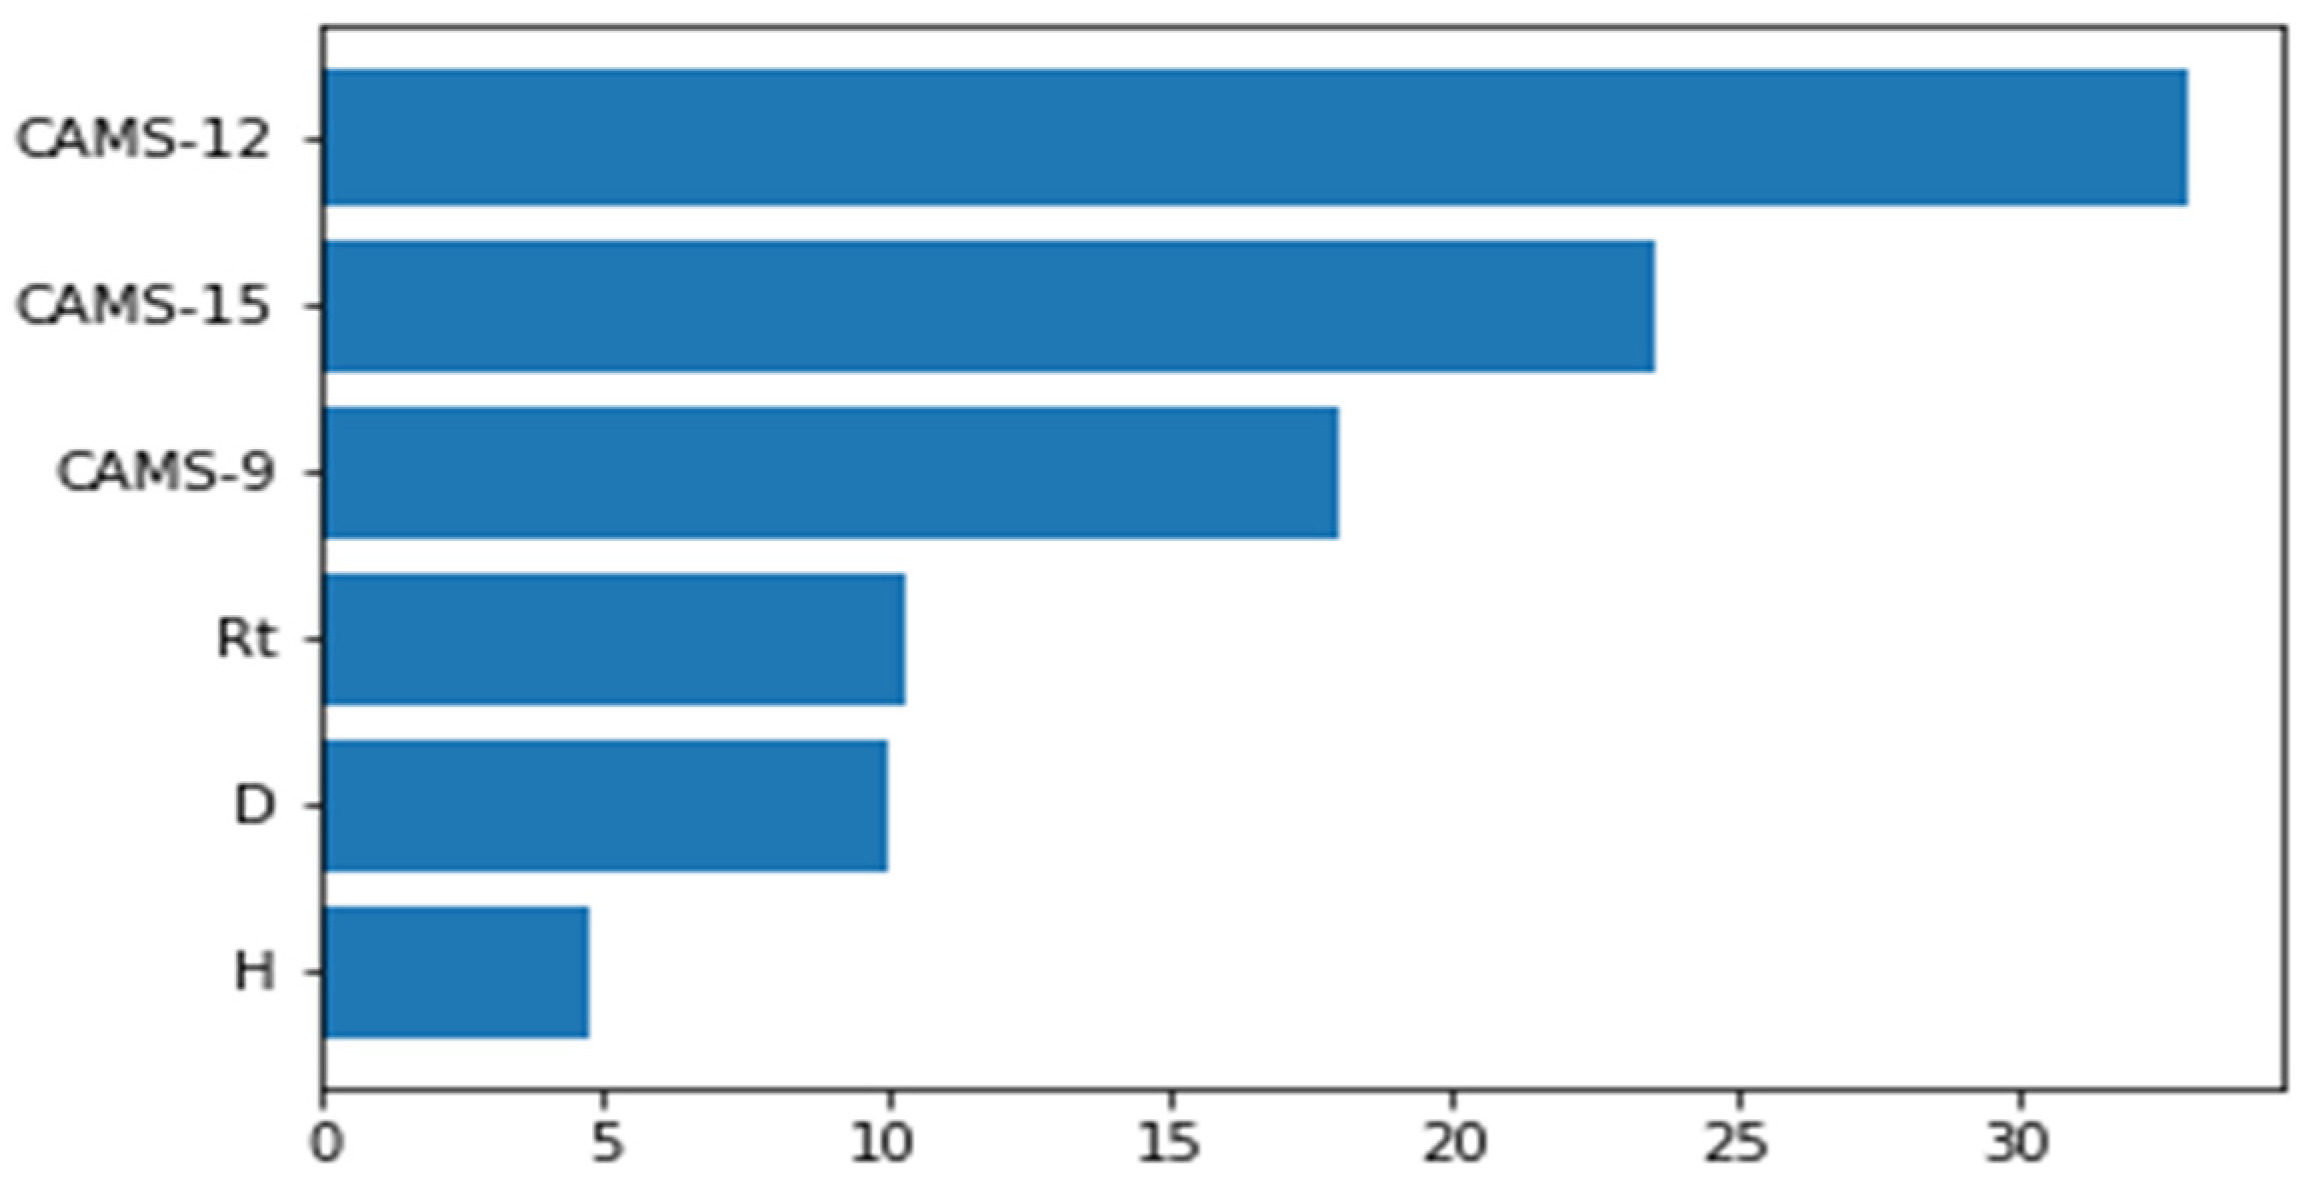
4.1. Extra Trees Algorithm
4.2. Improved Spatiotemporal Information
5. Results
5.1. Models
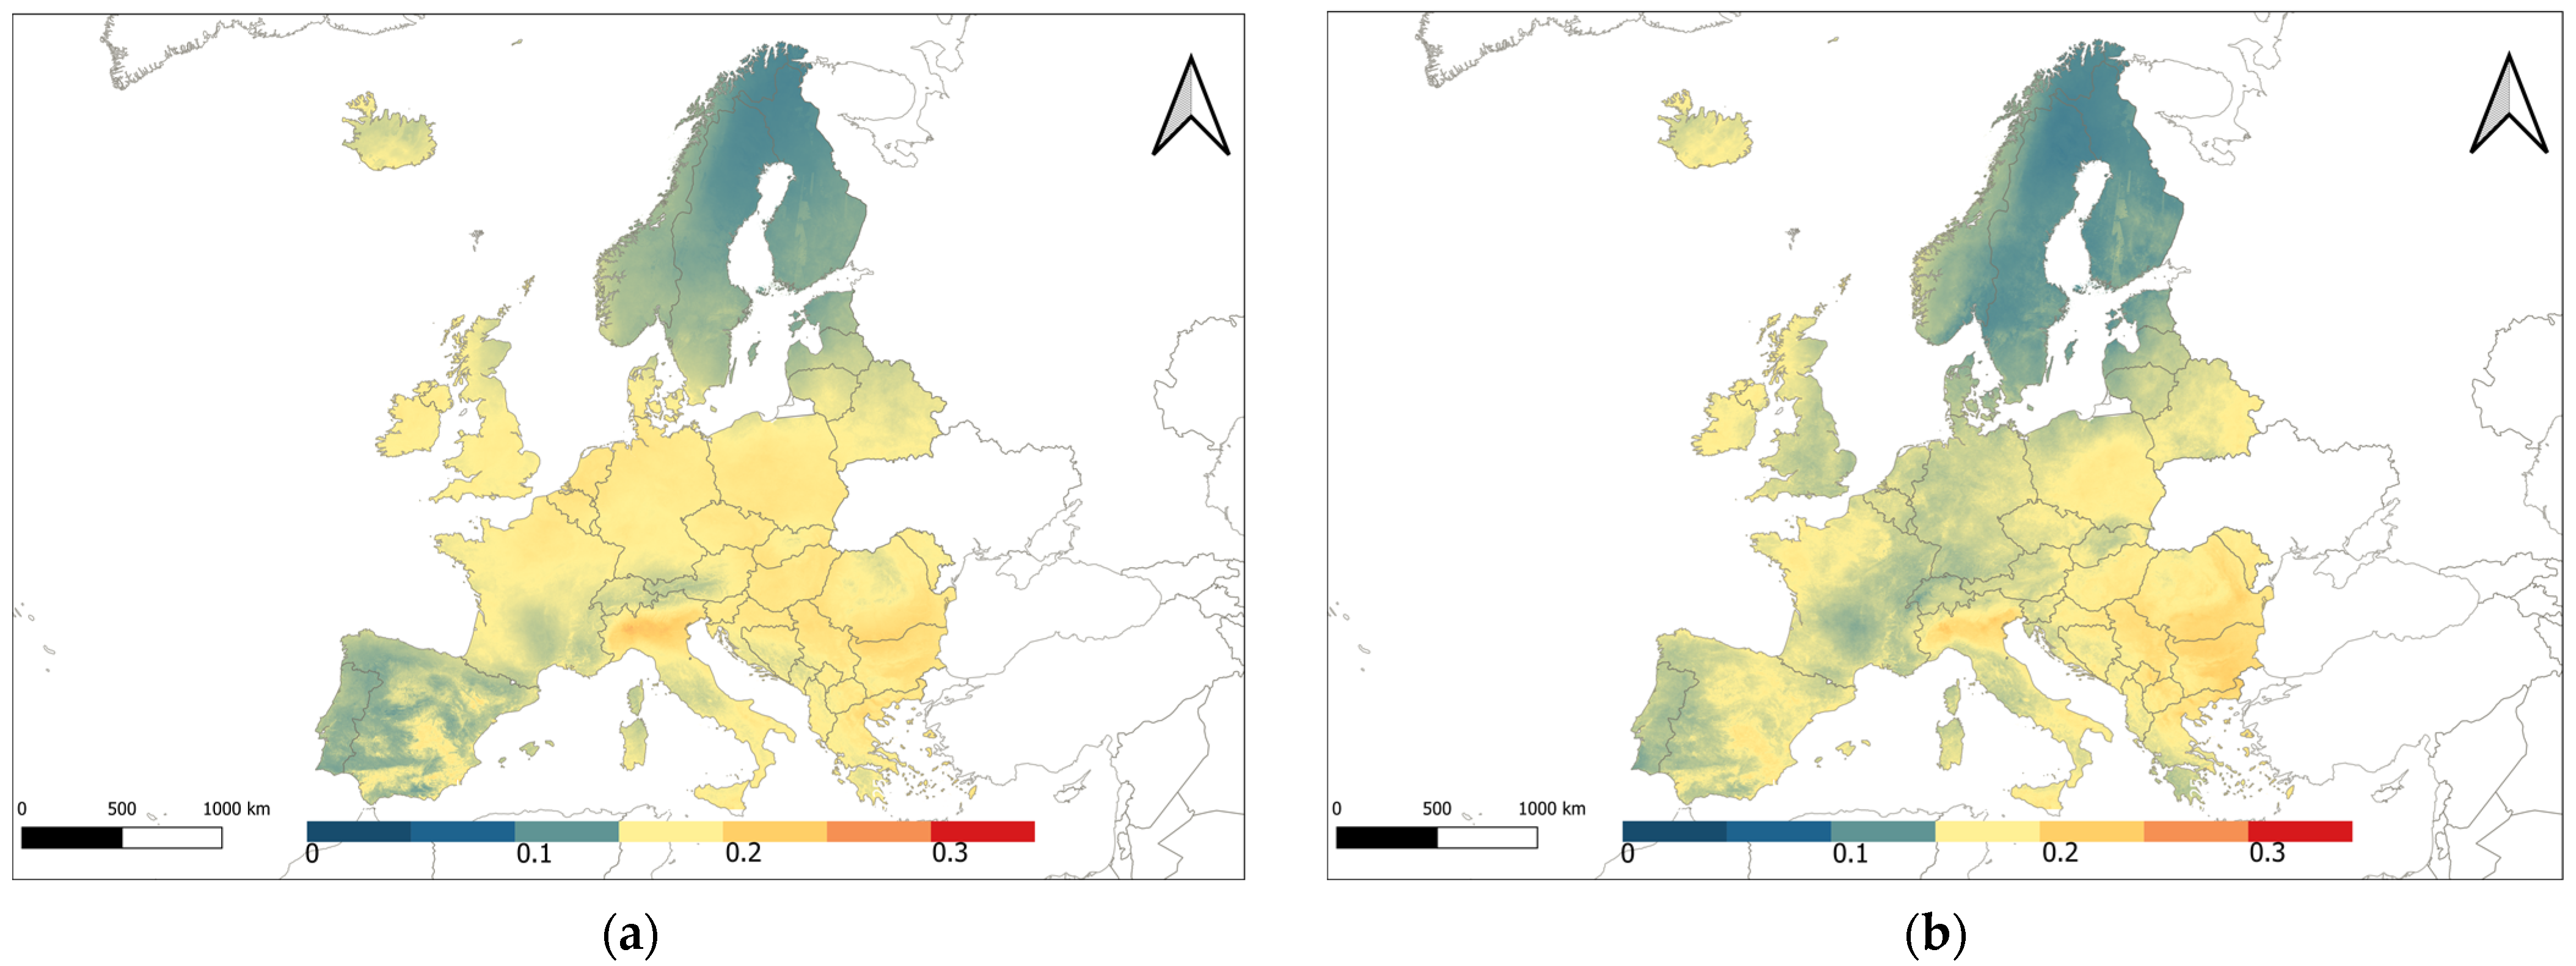
5.2. AOD Maps
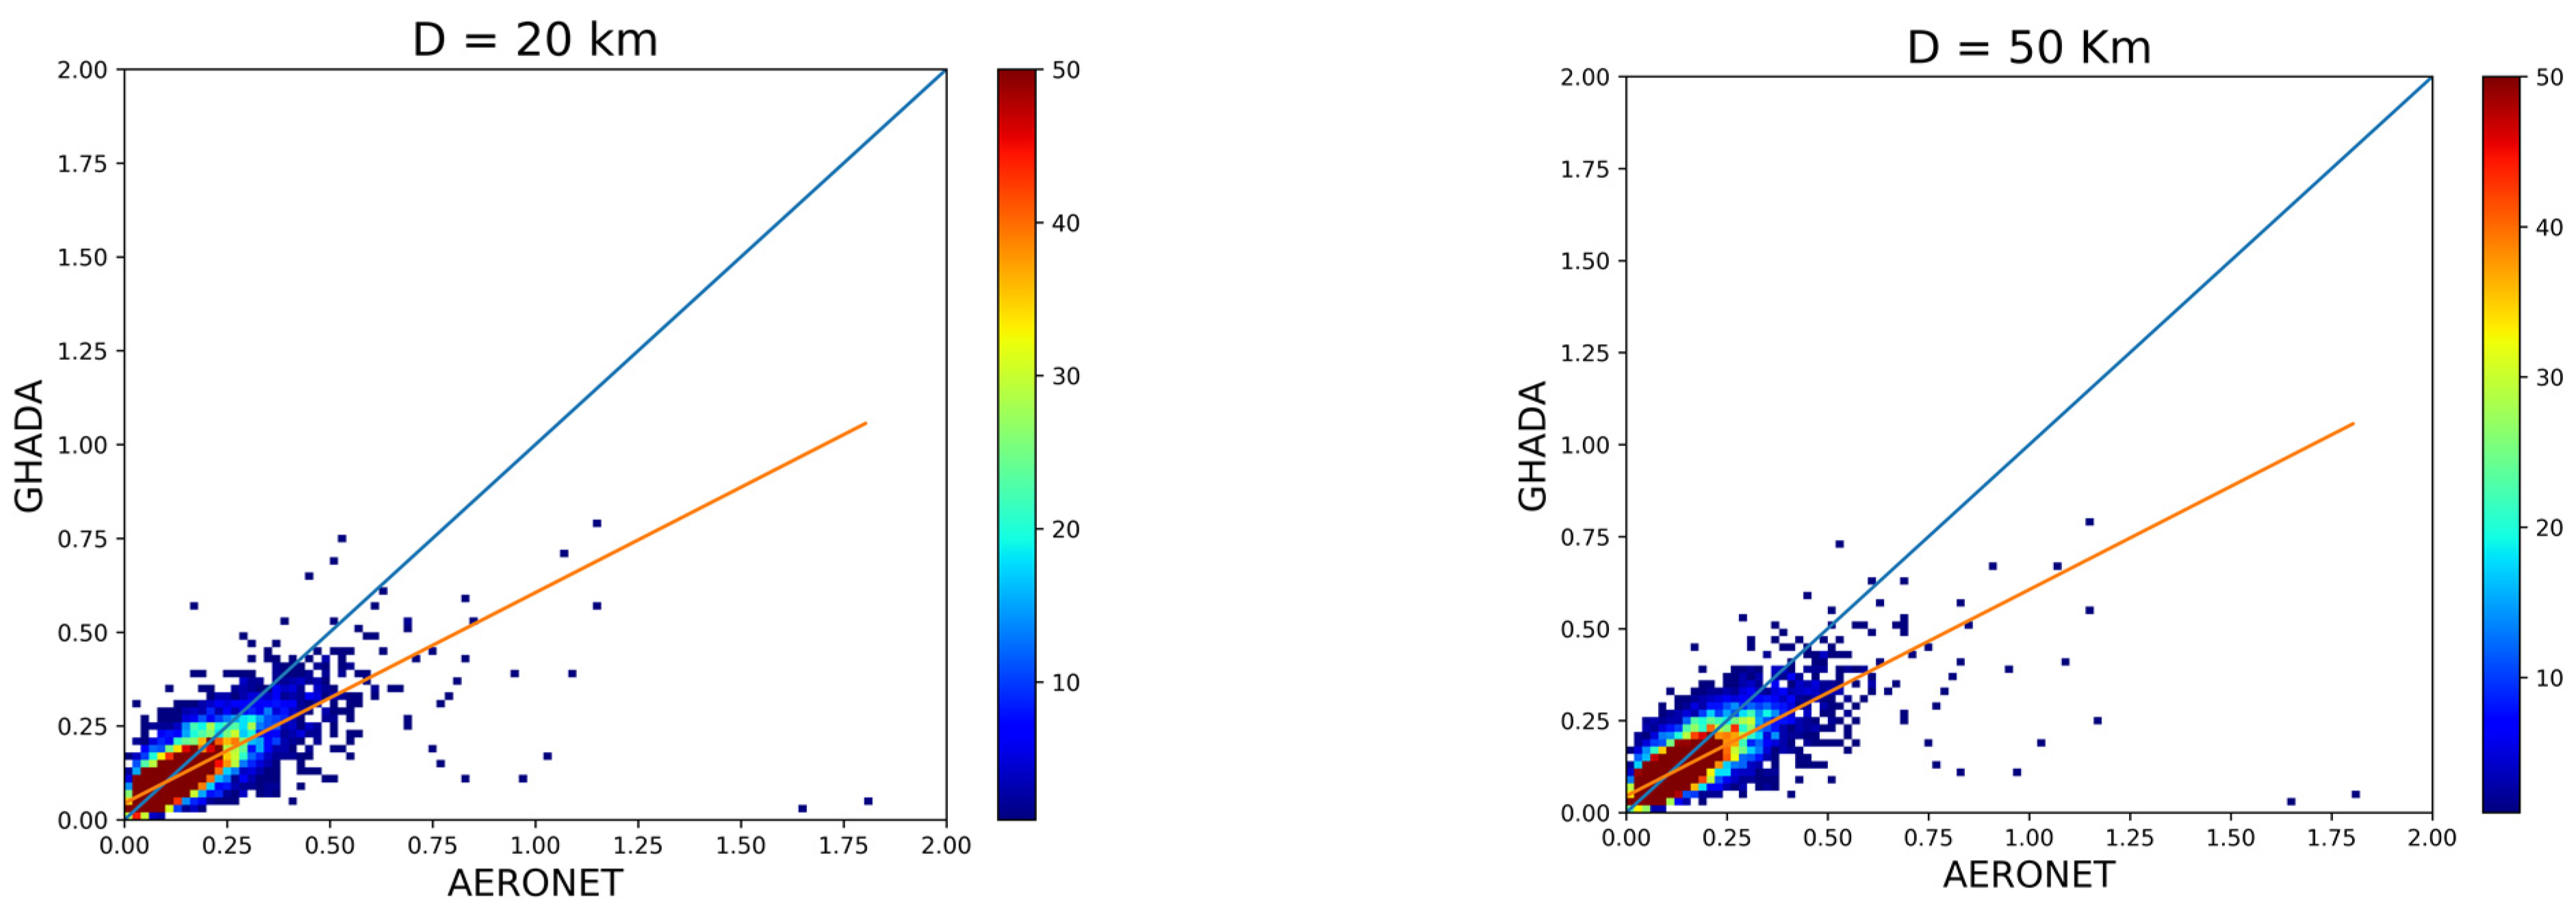
5.3. Validation with AERONET
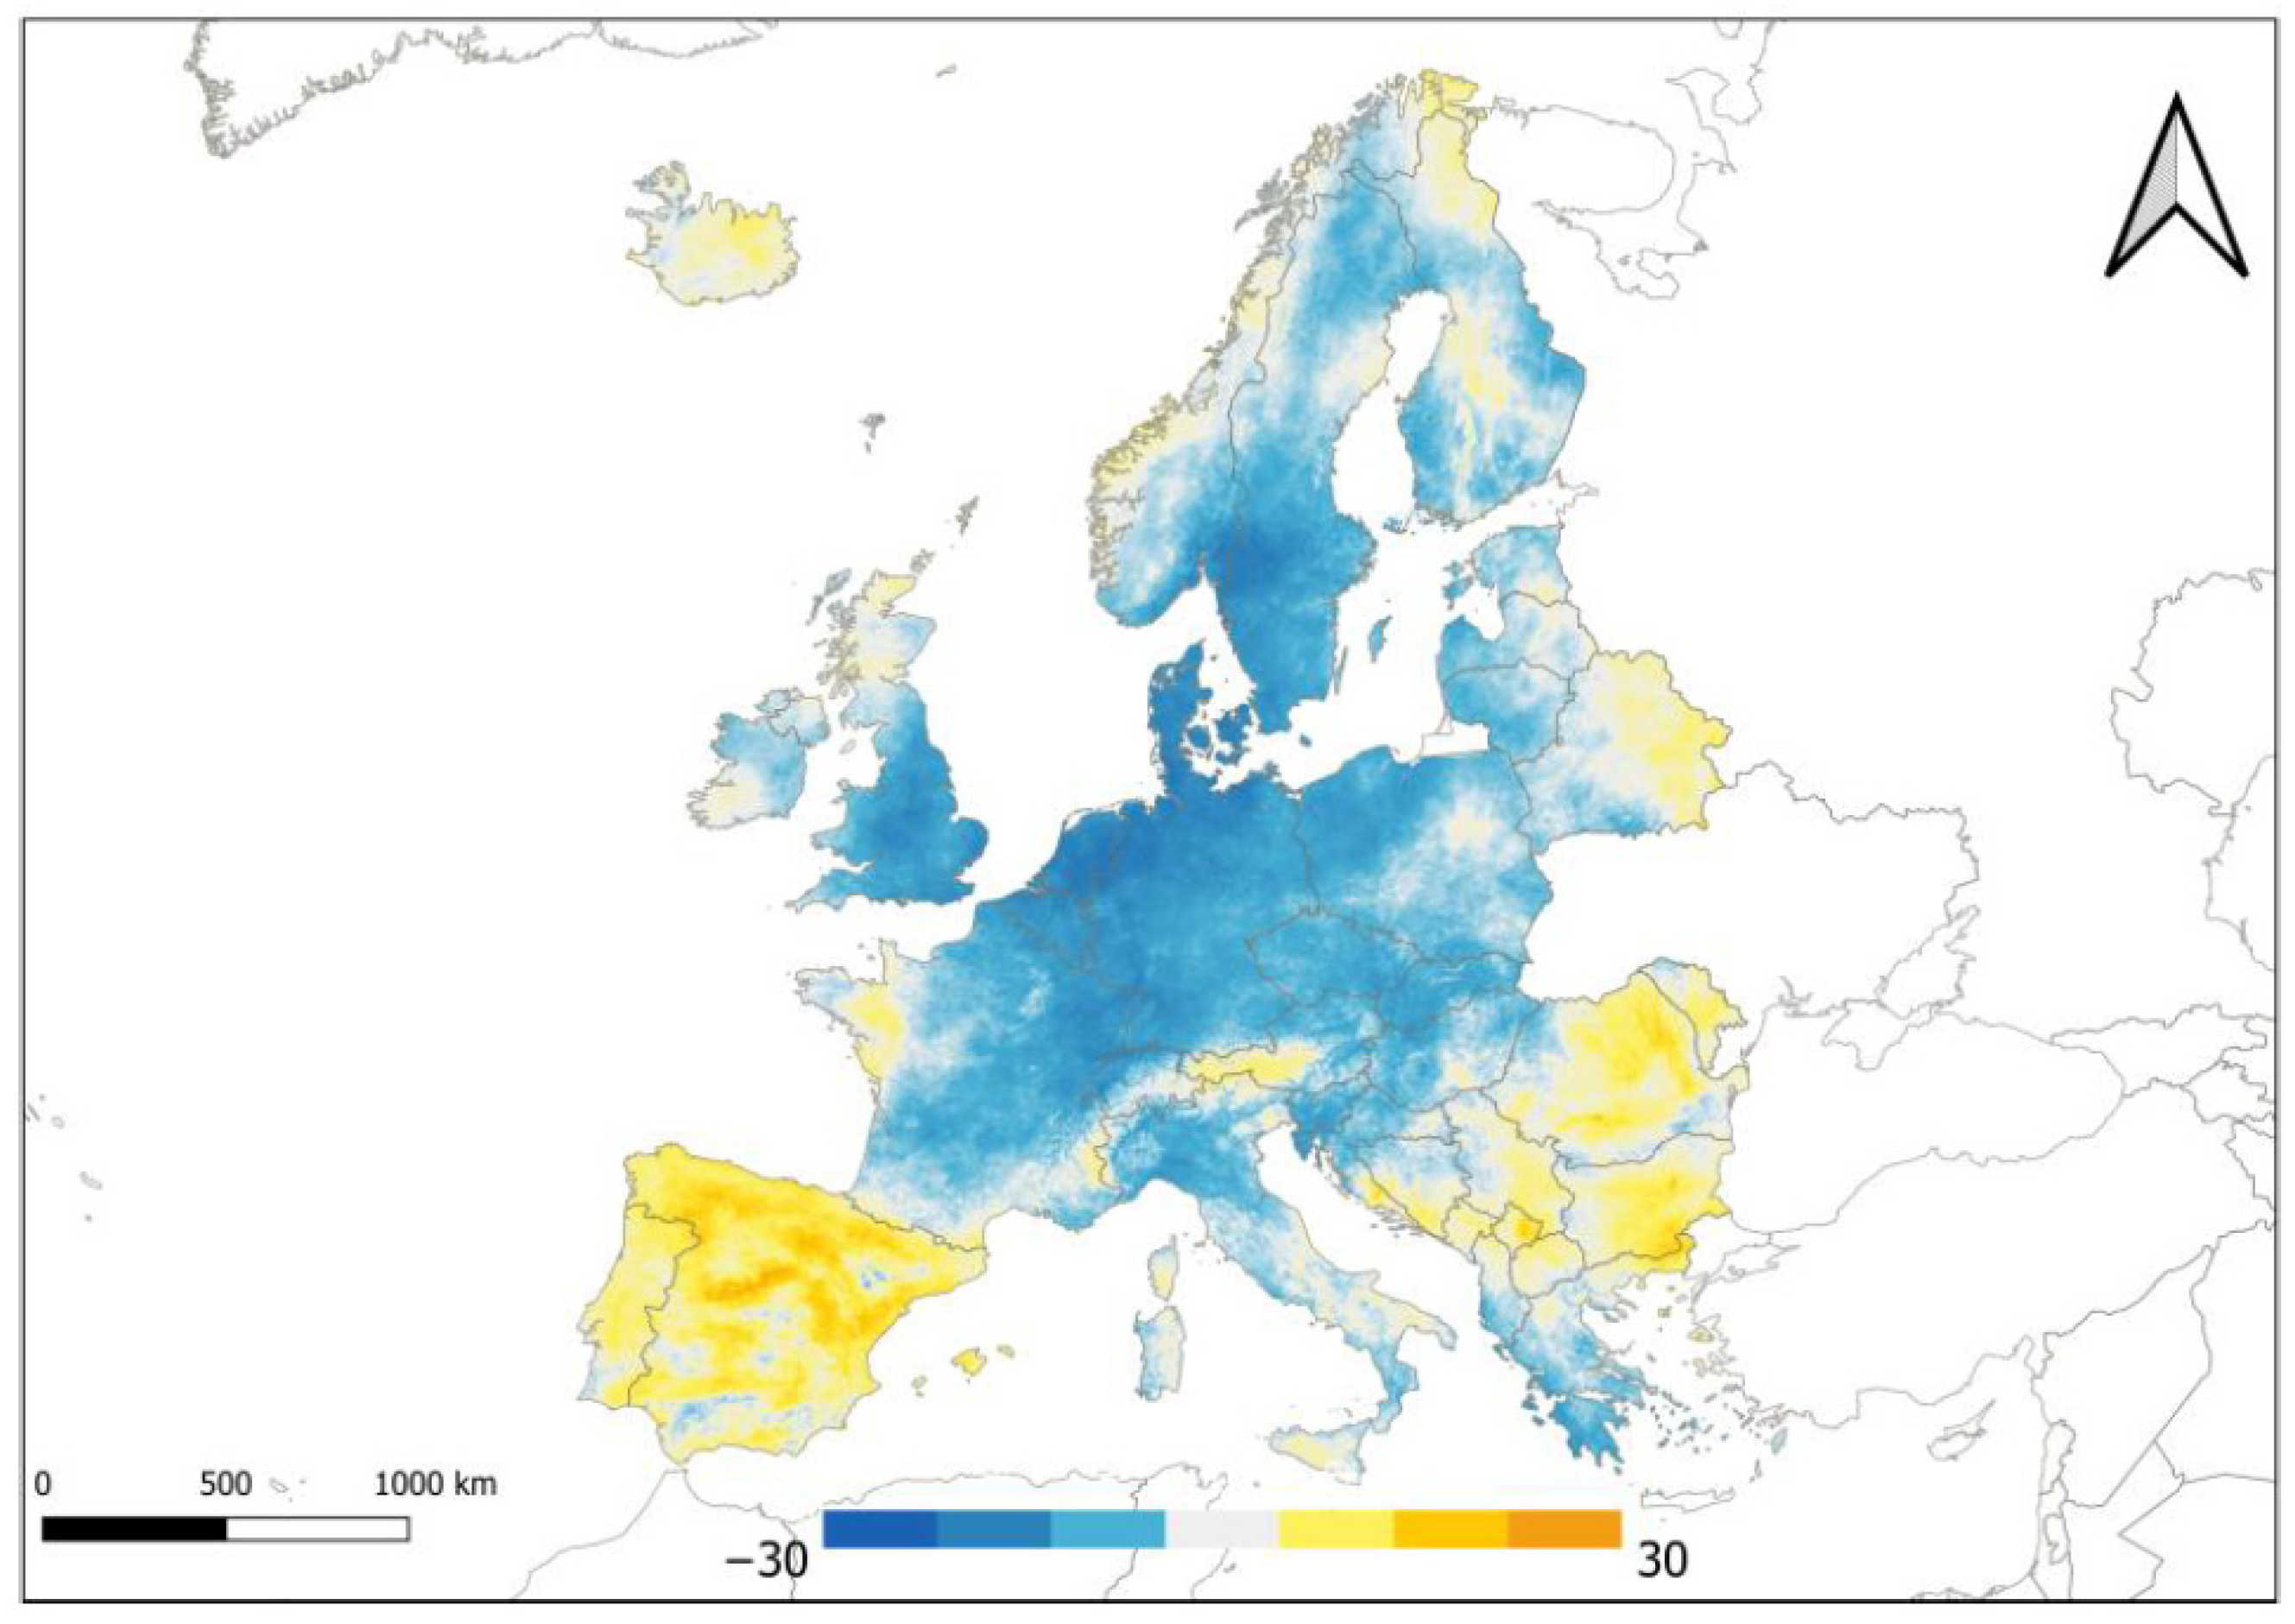
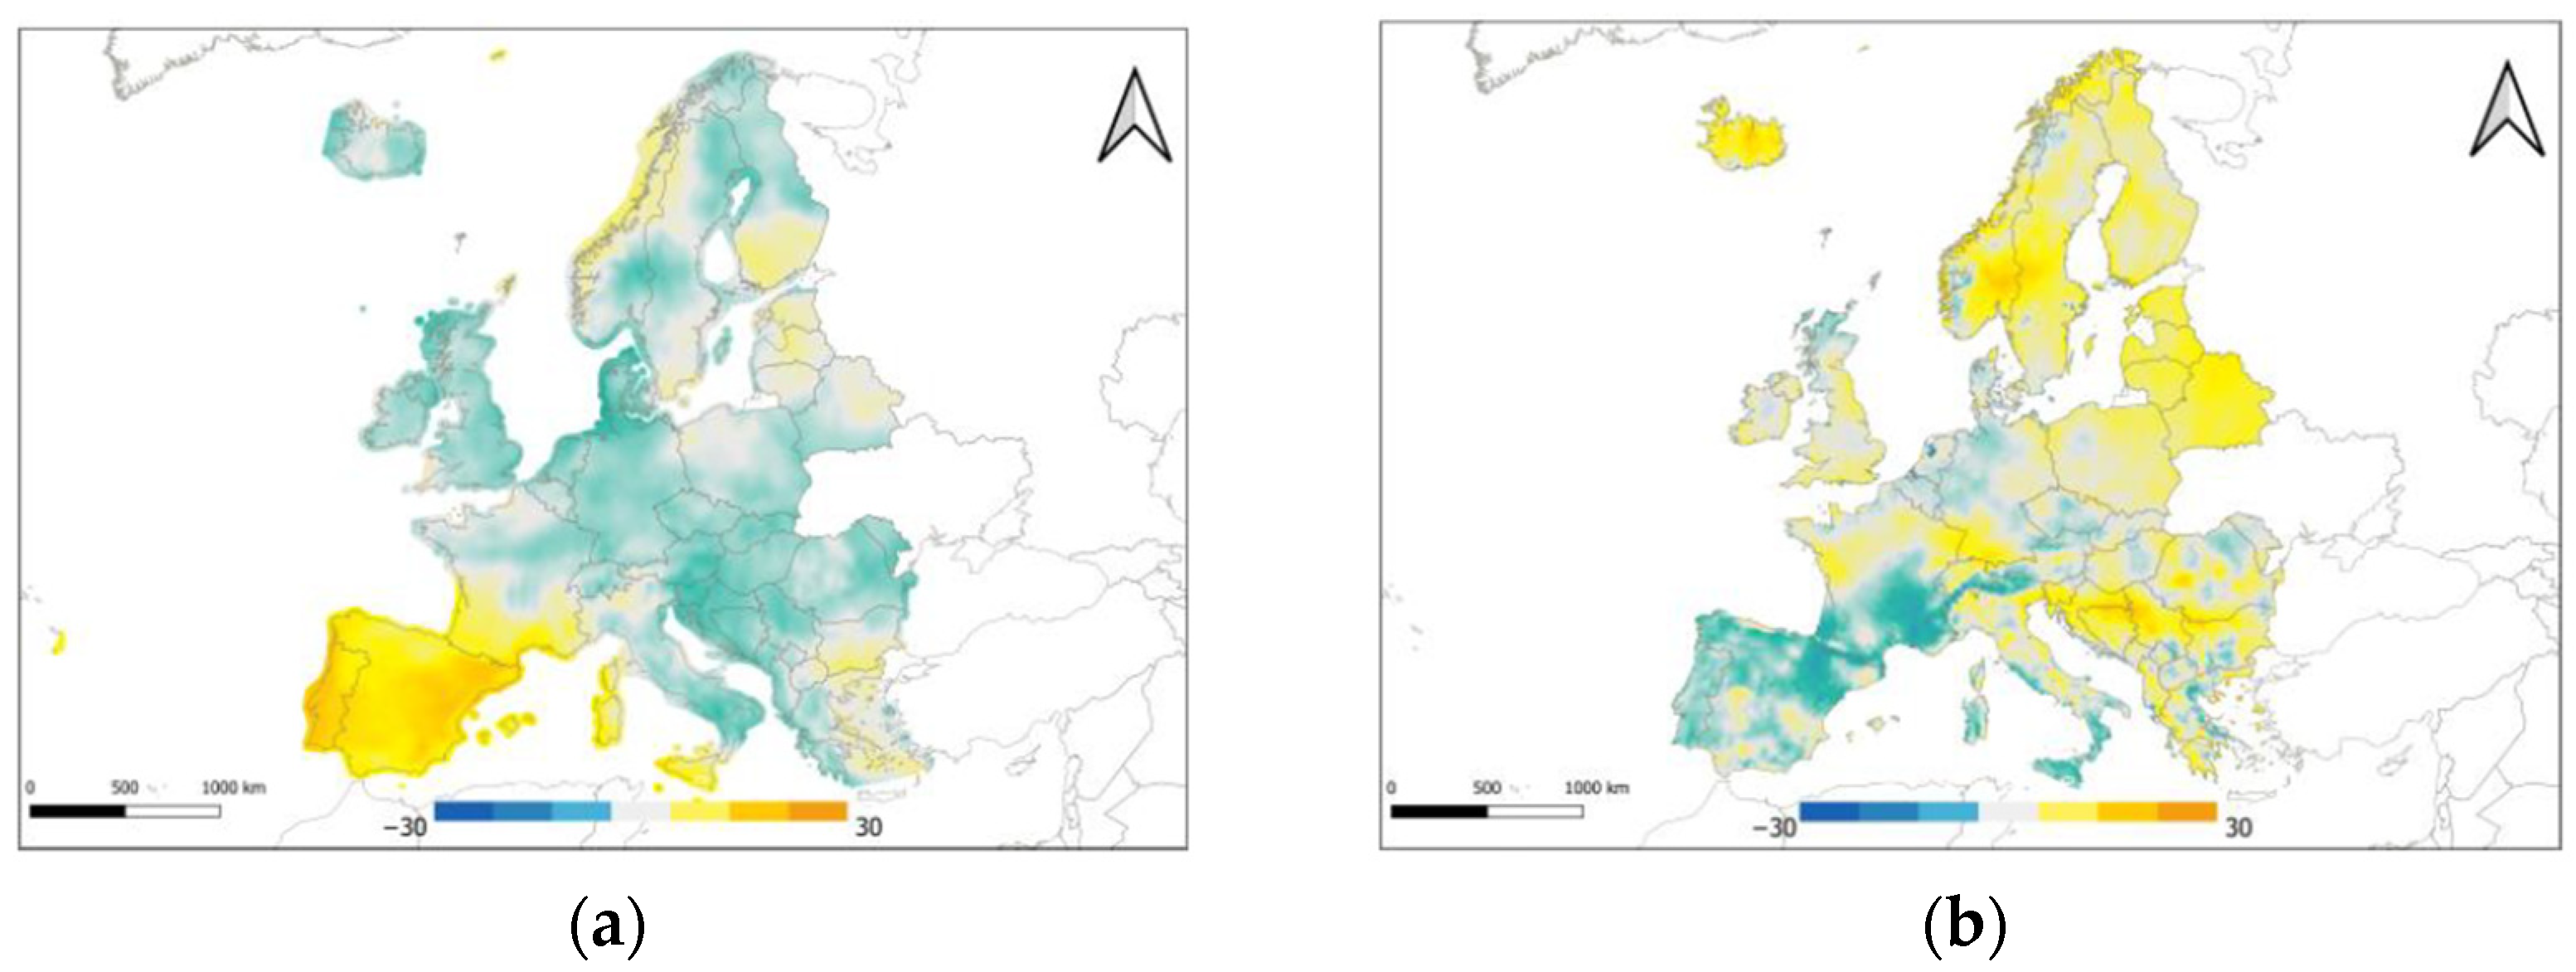
5.4. AOD Relative Percentage Difference
6. Discussion
7. Conclusions
Author Contributions
Funding
Institutional Review Board Statement
Informed Consent Statement
Data Availability Statement
Acknowledgments
Conflicts of Interest
References
- Boffey, D. US Visitors Set to Remain Banned from Entering EU. Guardian 2020. Available online: https://www.theguardian.com/world/2020/jun/29/us-visitors-set-to-remain-banned-from-entering-eu (accessed on 1 May 2021).
- Henley, J.; Oltermann, P. More Than 250 m People Now in Lockdown in EU as Germany and Belgium Adopt Measures. Guardian 2020. Available online: https://www.theguardian.com/world/2020/mar/18/coronavirus-lockdown-eu-belgium-germany-adopt-measures (accessed on 1 May 2021).
- Tobias, A.; Carnerero, C.; Reche, C.; Massague, J.; Via, M.; Minguillon, M.C.; Alastuey, A.; Querol, X. Changes in air quality during the lockdown in Barcelona (Spain) one month into the SARS-CoV-2 epidemic. Sci. Total Environ. 2020, 726, 138540. [Google Scholar] [CrossRef]
- Muhammad, S.; Long, X.; Salman, M. COVID-19 pandemic and environmental pollution: A blessing in disguise? Sci. Total Environ. 2020, 728, 138820. [Google Scholar] [CrossRef]
- Filonchyk, M.; Hurynovich, V.; Yan, H. Impact of COVID-19 lockdown on air quality in the Poland, Eastern Europe. Environ. Res. 2021, 198, 110454. [Google Scholar] [CrossRef] [PubMed]
- Soni, M.; Verma, S.; Jethava, H.; Payra, S.; Lamsal, L.; Gupta, P.; Singh, J. Impact of COVID-19 on the Air Quality over China and India Using Long-term (2009–2020) Multi-satellite Data. Aerosol Air Qual. Res. 2020, 21, e200295. [Google Scholar] [CrossRef]
- Filonchyk, M.; Hurynovich, V.; Yan, H.; Gusev, A.; Shpilevskaya, N. Impact Assessment of COVID-19 on Variations of SO2, NO2, CO and AOD over East China. Aerosol Air Qual. Res. 2020, 20, 1530–1540. [Google Scholar] [CrossRef]
- Ranjan, A.K.; Patra, A.K.; Gorai, A.K. Effect of lockdown due to SARS COVID-19 on aerosol optical depth (AOD) over urban and mining regions in India. Sci. Total Environ. 2020, 745, e141024. [Google Scholar] [CrossRef] [PubMed]
- Kalluri, R.O.R.; Gugamsetty, B.; Tandule, C.R.; Kotalo, R.G.; Thotli, L.R.; Rajuru, R.R.; Palle, S.N.R. Impact of aerosols on surface ozone during COVID-19 pandemic in southern India: A multi-instrumental approach from ground and satellite observations, and model simulations. J. Atmos. Sol. Terr. Phys. 2021, 212, 105491. [Google Scholar] [CrossRef]
- Liu, Y.; Sarnat, J.A.; Coull, B.A.; Koutrakis, P.; Jacob, D.J. Validation of Multiangle Imaging Spectroradiometer (MISR) aerosol optical thickness measurements using Aerosol Robotic Network (AERONET) observations over the contiguous United States. J. Geophys. Res. 2004, 109. [Google Scholar] [CrossRef]
- Shen, H.; Li, T.; Yuan, Q.; Zhang, H. Estimating Regional Ground-Level PM2.5 Directly from Satellite Top-of-Atmosphere Reflectance Using Deep Belief Networks. J. Geophys. Res. Atmos. 2018, 123, 13875–13886. [Google Scholar] [CrossRef] [Green Version]
- Yang, Q.; Yuan, Q.; Yue, L.; Li, T.; Shen, H.; Zhang, L. The relationships between PM2.5 and aerosol optical depth (AOD) in mainland China: About and behind the spatio-temporal variations. Environ. Pollut. 2019, 248, 526–535. [Google Scholar] [CrossRef]
- Zhang, H.; Hoff, R.M.; Engel-Cox, J.A. The relation between Moderate Resolution Imaging Spectroradiometer (MODIS) aerosol optical depth and PM2.5 over the United States: A geographical comparison by U.S. Environmental Protection Agency regions. J. Air Waste Manag. Assoc. 2009, 59, 1358–1369. [Google Scholar] [CrossRef] [Green Version]
- Ajtai, N.; Mereuta, A.; Stefanie, H.; Radovici, A.; Botezan, C.; Zawadzka-Manko, O.; Stachlewska, I.S.; Stebel, K.; Zehner, C. SEVIRI Aerosol Optical Depth Validation Using AERONET and Intercomparison with MODIS in Central and Eastern Europe. Remote Sens. 2021, 13, 844. [Google Scholar] [CrossRef]
- Torres, O.; Bhartia, P.K.; Sinyuk, A.; Welton, E.J.; Holben, B.N. Total Ozone Mapping Spectrometer measurements of aerosolabsorption from space: Comparison to SAFARI 2000 ground-based observations. J. Geophys. Res. 2005, 110. [Google Scholar] [CrossRef] [Green Version]
- Torres, O.; Tanskanen, A.; Veihelmann, B.; Ahn, C.; Braak, R.; Bhartia, P.K.; Veefkind, P.; Levelt, P. Aerosols and surface UV products from Ozone Monitoring Instrument observations: An overview. J. Geophys. Res. 2007, 112. [Google Scholar] [CrossRef] [Green Version]
- Sayer, A.M.; Hsu, N.C.; Bettenhausen, C.; Ahmad, Z.; Holben, B.N.; Smirnov, A.; Thomas, G.E.; Zhang, H. SeaWiFS Ocean Aerosol Retrieval (SOAR): Algorithm, validation, and comparison with other data sets. J. Geophys. Res. 2012, 117. [Google Scholar] [CrossRef]
- Knapp, K.R.; Frouin, R.; Kondragunta, S.; Prados, A. Toward aerosol optical depth retrievals over land from GOES visible radiances: Determining surface reflectance. Int. J. Remote Sens. 2005, 26. [Google Scholar] [CrossRef]
- Lim, H.; Choi, M.; Kim, J.; Kasai, Y.; Chan, P.W. AHI/Himawari-8 Yonsei Aerosol Retrieval (YAER): Algorithm, Validation and Merged Products. Remote Sens. 2018, 10, e699. [Google Scholar] [CrossRef] [Green Version]
- Kahn, R.A.; Gaitley, B.J.; Garay, M.J.; Diner, D.J.; Eck, T.F.; Smirnov, A.; Holben, B.N. Multiangle Imaging SpectroRadiometer global aerosol product assessment by comparison with the Aerosol Robotic Network. J. Geophys. Res. 2010, 115. [Google Scholar] [CrossRef]
- Sun, L.; Wei, J.; Bilal, M.; Tian, X.; Jia, C.; Guo, Y.; Mi, X. Aerosol Optical Depth Retrieval over Bright Areas Using Landsat 8 OLI Images. Remote Sens. 2016, 8, 23. [Google Scholar] [CrossRef] [Green Version]
- Levy, R.C.; Mattoo, S.; Munchak, L.A.; Remer, L.A.; Sayer, A.M.; Patadia, F.; Hsu, N.C. The Collection 6 MODIS aerosol products over land and ocean. Atmos. Meas. Tech. 2013, 6, 2989–3034. [Google Scholar] [CrossRef] [Green Version]
- Remer, L.A.; Kaufman, Y.J.; Tanré, D.; Mattoo, S.; Chu, D.A.; Martins, J.V.; Li, R.-R.; Ichoku, C.; Levy, R.C.; Kleidman, R.G.; et al. The MODIS Aerosol Algorithm, Products, and Validation. J. Atmos. Sci. 2005, 62, 947–973. [Google Scholar] [CrossRef] [Green Version]
- Hsu, N.C.; Jeong, M.J.; Bettenhausen, C.; Sayer, A.M.; Hansell, R.; Seftor, C.S.; Huang, J.; Tsay, S.C. Enhanced Deep Blue aerosol retrieval algorithm:The second generation. J. Geophys. Res. 2013, 118, 9296–9315. [Google Scholar] [CrossRef]
- Hsu, N.C.; Tsay, S.; King, M.D.; Herman, J.R. Aerosol Properties Over Bright-Reflecting Source Regions. IEEE Trans. Geosci. Remote Sens. 2004, 42, 557–569. [Google Scholar] [CrossRef]
- Lyapustin, A.; Wang, Y.; Laszlo, I.; Kahn, R.; Korkin, S.; Remer, L.A.; Levy, R.; Reid, J.S. Multiangle implementation of atmospheric correction (MAIAC): 2. Aerosol algorithm. J. Geophys. Res. 2011, 116. [Google Scholar] [CrossRef]
- King, M.D.; Platnick, S.; Menzel, W.P.; Ackerman, S.A.; Hubanks, P.A. Spatial and Temporal Distribution of Clouds Observed by MODIS Onboard the Terra and Aqua Satellites. IEEE Trans. Geosci. Remote Sens. 2013, 51, 3826–3852. [Google Scholar] [CrossRef]
- Meraner, A.; Ebel, P.; Zhu, X.X.; Schmitt, M. Cloud removal in Sentinel-2 imagery using a deep residual neural network and SAR-optical data fusion. ISPRS J. Photogramm. Remote Sens. 2020, 166, 333–346. [Google Scholar] [CrossRef]
- Yang, J.; Hu, M. Filling the missing data gaps of daily MODIS AOD using spatiotemporal interpolation. Sci. Total Environ. 2018, 633, 677–683. [Google Scholar] [CrossRef]
- Schneider, R.; Vicedo-Cabrera, A.M.; Sera, F.; Masselot, P.; Stafoggia, M.; de Hoogh, K.; Kloog, I.; Reis, S.; Vieno, M.; Gasparrini, A. A Satellite-Based Spatio-Temporal Machine Learning Model to Reconstruct Daily PM2.5 Concentrations across Great Britain. Remote Sens. 2020, 12, 3803. [Google Scholar] [CrossRef]
- Open Data Science Europe. Geo-Harmonizer Project Implementation Plan 2020–2022; Open Data Science Europe: Wageningen, The Netherlands, 2020. [Google Scholar]
- Lyapustin, A.; Wang, Y.; Korkin, S.; Huang, W. MODIS Collection 6 MAIAC algorithm. Atmos. Meas. Tech. 2018, 11, 5741–5765. [Google Scholar] [CrossRef] [Green Version]
- Lyapustin, A.; Wang, Y.; Laszlo, I.; Korkin, S. Improved cloud and snow screening in MAIAC aerosol retrievals using spectral and spatial analysis. Atmos. Meas. Tech. 2012, 5, 843–850. [Google Scholar] [CrossRef] [Green Version]
- Inness, A.; Ades, M.; Agustí-Panareda, A.; Barré, J.; Benedictow, A.; Blechschmidt, A.; Dominguez, J.J.; Engelen, R.; Eskes, H.; Flemming, J.; et al. The CAMS reanalysis of atmospheric composition. Atmos. Chem. Phys. 2019, 19, 3515–3556. [Google Scholar] [CrossRef] [Green Version]
- Tadono, T.; Ishida, H.; Oda, F.; Naito, S.; Minakawa, K.; Iwamoto, H. Precise Global DEM Generation by Alos Prism. ISPRS Ann. Photogramm. Remote Sens. Spat. Inf. Sci. 2014, 2, 71. [Google Scholar] [CrossRef] [Green Version]
- Holben, B.N.; Eck, T.F.; Slutsker, I.; Tanré, D.; Buis, J.P.; Setzer, A.; Vermote, E.; Reagan, J.A.; Kaufman, Y.J.; Nakajima, T.; et al. AERONET—A Federated Instrument Network and Data Archive for Aerosol Characterization. Remote Sens. Environ. 1998, 66, 1–16. [Google Scholar] [CrossRef]
- Holben, B.N.; Tanre, D.; Smirnov, A.; Eck, T.F.; Slutsker, I.; Abuhassan, N.; Newcomb, W.W.; Schafer, J.S.; Chatenet, B.; Lavenu, F.; et al. An emerging ground-based aerosol climatology: Aerosol optical depth from AERONET. J. Geophys. Res. 2001, 106, 12067–12097. [Google Scholar] [CrossRef]
- Ångström, A. The parameters of atmospheric turbidity. Tellus 1964, 16, 64–75. [Google Scholar] [CrossRef] [Green Version]
- Geurts, P.; Ernst, D.; Wehenkel, L. Extremely randomized trees. Mach. Learn. 2006, 63, 3–42. [Google Scholar] [CrossRef] [Green Version]
- Wei, J.; Li, Z.; Cribb, M.; Huang, W.; Xue, W.; Sun, L.; Guo, J.; Peng, Y.; Li, J.; Lyapustin, A.; et al. Improved 1 km resolution PM2.5 estimates across China using enhanced space-time extremely randomized trees. Atmos. Chem. Phys. 2020, 20, 3273–3289. [Google Scholar] [CrossRef] [Green Version]
- Anderson, T.L.; Charlson, R.J.; Winker, D.M.; Ogren, J.A.; Holmén, K. Mesoscale Variations of Tropospheric Aerosols. J. Atmos. Sci. 2003, 60, 119–136. [Google Scholar] [CrossRef]
- Martins, V.S.; Lyapustin, A.; de Carvalho, L.A.S.; Barbosa, C.C.F.; Novo, E.M.L.M. Validation of high-resolution MAIAC aerosol product over South America. J. Geophys. Res. Atmos. 2017, 122. [Google Scholar] [CrossRef]
- Levy, R.C.; Remer, L.A.; Kleidman, R.G.; Mattoo, S.; Ichoku, C.; Kahn, R.; Eck, T.F. Global evaluation of the Collection 5 MODIS dark-target aerosol products over land. Atmos. Chem. Phys. 2010, 10, 10399–10420. [Google Scholar] [CrossRef] [Green Version]
- Acharya, P.; Barik, G.; Gayen, B.K.; Bar, S.; Maiti, A.; Sarkar, A.; Ghosh, S.; De, S.K.; Sreekesh, S. Revisiting the levels of Aerosol Optical Depth in south-southeast Asia, Europe and USA amid the COVID-19 pandemic using satellite observations. Environ. Res. 2021, 193, 110514. [Google Scholar] [CrossRef] [PubMed]


| Product | Spatial Resolution | Temporal Resolution | Layer |
|---|---|---|---|
| MODIS MCD19A2 | 1 km | Daily | AOD-055 Quality Assurance (QA) |
| CAMS | 80 km | 3 h | Total aerosol optical depth at 550 nm |
| ALOS DSM | 30 m | - | Elevations |
| AERONET | - | ~15 min | Level 2.0 |
| ECMWF ERA-5 | 0.1° | Hourly | Wind U and V components Total precipitation 2 m surface temperature |
| ECMWF ERA-5 | 0.25° | Monthly | Relative humidity |
| Year | R-Squared (%) | RMSE | MAE |
|---|---|---|---|
| 2015 | 95 | 0.017 | 0.011 |
| 2016 | 94.3 | 0.018 | 0.011 |
| 2017 | 93.8 | 0.018 | 0.011 |
| 2018 | 92.5 | 0.02 | 0.012 |
| 2019 | 92.9 | 0.019 | 0.012 |
| 2020 | 94.1 | 0.016 | 0.010 |
| D (Km) | N | R | MAE | RMSE | Bias | EE(%) |
|---|---|---|---|---|---|---|
| 20 | 10916 | 0.762 | 0.043 | 0.067 | −0.014 | 83.7 |
| 50 | 12212 | 0.767 | 0.043 | 0.066 | −0.014 | 83.7 |
Publisher’s Note: MDPI stays neutral with regard to jurisdictional claims in published maps and institutional affiliations. |
© 2021 by the authors. Licensee MDPI, Basel, Switzerland. This article is an open access article distributed under the terms and conditions of the Creative Commons Attribution (CC BY) license (https://creativecommons.org/licenses/by/4.0/).
Share and Cite
Ibrahim, S.; Landa, M.; Pešek, O.; Pavelka, K.; Halounova, L. Space-Time Machine Learning Models to Analyze COVID-19 Pandemic Lockdown Effects on Aerosol Optical Depth over Europe. Remote Sens. 2021, 13, 3027. https://doi.org/10.3390/rs13153027
Ibrahim S, Landa M, Pešek O, Pavelka K, Halounova L. Space-Time Machine Learning Models to Analyze COVID-19 Pandemic Lockdown Effects on Aerosol Optical Depth over Europe. Remote Sensing. 2021; 13(15):3027. https://doi.org/10.3390/rs13153027
Chicago/Turabian StyleIbrahim, Saleem, Martin Landa, Ondřej Pešek, Karel Pavelka, and Lena Halounova. 2021. "Space-Time Machine Learning Models to Analyze COVID-19 Pandemic Lockdown Effects on Aerosol Optical Depth over Europe" Remote Sensing 13, no. 15: 3027. https://doi.org/10.3390/rs13153027
APA StyleIbrahim, S., Landa, M., Pešek, O., Pavelka, K., & Halounova, L. (2021). Space-Time Machine Learning Models to Analyze COVID-19 Pandemic Lockdown Effects on Aerosol Optical Depth over Europe. Remote Sensing, 13(15), 3027. https://doi.org/10.3390/rs13153027