Article

Effect Analysis of the Digital Spectrometer FFT Algorithm on THz Atmospheric Limb Sounder (TALIS) System Sensitivity

1
Key Laboratory of Microwave Remote Sensing, National Space Science Center, Chinese Academy of Sciences, Beijing 100190, China
2
University of Chinese Academy of Sciences, Beijing 100049, China
*
Author to whom correspondence should be addressed.
Remote Sens. 2021, 13(15), 2921; https://doi.org/10.3390/rs13152921
Submission received: 17 June 2021 / Revised: 19 July 2021 / Accepted: 21 July 2021 / Published: 25 July 2021

Abstract

:
THz Atmospheric Limb Sounder (TALIS) is a microwave radiometer designed by the National Space Science Center of the Chinese Academy of Sciences (NSSC, CAS) for measuring the vertical distribution of temperature and chemical constituents in the middle and upper atmosphere. The digital spectrometer is an important part of TALIS’ back end, which mainly realizes the function of spectral analysis. The radix 16 real-time complex fast Fourier transform (FFT) algorithm used in the digital spectrometer was obtained by improving and combining the parallel processing and complex processing of the FFT algorithm. In this study, the digital spectrometer parameter selection is systematically presented, and the effect of the digital spectrometer FFT algorithm on the TALIS system sensitivity is analyzed based on the TALIS system simulation model we established in the previous stage of this research. The results show that the actual full-band sensitivity obtained after using the FFT algorithm is consistent with the ideal full-band sensitivity of TALIS for different integration time, spectral resolutions, and quantization bits. However, the results of the comparison of the actual sub-band sensitivity after using the FFT algorithm with the ideal sub-band sensitivity show that the deterioration of the sub-band sensitivity will be caused by the FFT algorithm. The mean value of the deterioration ratio was found to be approximately 18%, and the maximum value of the deterioration ratio was approximately 33%.

1. Introduction

The conventional microwave radiometer mainly observes the average brightness temperature of targets within the bandwidth. For some specific applications, it is necessary to observe the corresponding brightness temperature within a wideband range for different frequency channels. At the same time, the radiation spectrum of the corresponding gas is formed due to the gas molecular transition in the atmosphere. Therefore, high-resolution spectral analysis needs to be conducted, due to the narrow spectral lines of some specific gases; for example, when sounding the water vapor in the isothermal layer of the atmosphere in limb sounding. Thus, the need for microwave spectral analysis radiometers arises [1].
Microwave limb sounding is a way of observing Earth’s atmosphere to obtain the trace gas composition. It mainly measures the thermal emission of atmospheric millimeter and submillimeter waves as the antenna scans vertically from the bottom of the sky upward to the atmospheric limbic tangent point [2]. One example of a microwave limb sounder is the hyperspectral microwave radiometer, a microwave remote sensing system capable of acquiring a large number of narrowband spectrum channels continuously. The back-end component of the hyperspectral microwave radiometer is a spectrometer, which primarily realizes the function of spectral analysis, and fine delineation of the radiometer spectral channels can be accomplished by using the spectrometer.
The Upper Atmosphere Research Satellite (UARS) was launched by the United States in 1991, and the microwave limb sounder (MLS) on board was the first satellite experiment using limb sounding techniques at microwave frequencies. The filter bank spectrometer (FBS) is used as the back end of UARS-MLS with the bandwidth of 510 MHz and the spectral resolution of 2–128 MHz. The FBS consists of a power divider that splits the intermediate frequency (IF) signals from the front end into many channels, each with an analog bandpass filter and an analog detector. The output of each detector is treated as a spectral channel [3,4,5]. Sweden and several other countries jointly launched the Odin satellite in 2001, which contains the sub-millimeter and millimeter radiometer (SMR) as the main payload. The back-end spectrometers of Odin-SMR consist of two digital auto-correlation spectrometers (DACSs) and one acousto-optical spectrometer (AOS), where the maximum bandwidth is 1.2 GHz and the spectral resolution is 0.15–1 MHz. The DACSs are relatively simple digital circuits that realize the delayed correlation operation and integrate the correlation results in the time domain to achieve wideband spectral analysis. The AOS uses a piezoelectric transducer to couple the high-frequency input signals into the Bragg cell. When a monochromatic light source is shone onto the Bragg cell, the beam is diffracted and then imaged onto the charge-coupled device (CCD) line detector, after which the analog signals generated by the CCD are read out in the electronics unit and converted to digital signals [6,7,8]. The Aura satellite launched by the United States in 2004 is an atmospheric composition and environmental monitoring satellite of the Earth Observing System (EOS). The back-end spectrometers of EOS-MLS include FBS as well as DACS, where the maximum bandwidth is 1.3 GHz and the spectral resolution is 0.1–500 MHz [9,10,11]. The Superconducting Submillimeter-Wave Limb-Emission Sounder (SMILES) on the Japanese Experiment Module (JEM) of the International Space Station (ISS) was launched successfully at the end of 2009. Two AOSs form the back end of JEM/SMILES, each with the bandwidth of 1.3 GHz and the spectral resolution of 1.4 MHz [12,13,14].
In addition to the aforementioned spectrometers at the back end of MLSs, commonly used spectrometers also include the Chirp transform spectrometer (CTS) and the analog auto-correlation spectrometer (AACS). CTS is based on the Chirp transform and uses the analog method to achieve spectral analysis by means of surface acoustic wave (SAW) filters [15]. AACS is an analog correlator consisting of microstrip lines, commercial transistors, and diodes, and it uses a high-speed transistor circuit to complete signal multiplication and microstrip transmission lines to realize delayed operation [16]. The limitations of each of the above spectrometers are listed in Table 1 [17,18].
The THz Atmospheric Limb Sounder (TALIS), the first terahertz radiometer for atmospheric limb sounding in China, was designed and developed by the National Space Science Center, Chinese Academy of Sciences (NSSC, CAS). The operating bands of TALIS include 118, 190, 240, and 640 GHz. The latest fast Fourier transform spectrometer (FFTS) [19], one type of digital spectrometer, is adopted as the back end of TALIS with the bandwidth of 2 GHz and the spectral resolution of 2.3 MHz [20]. The main feature of the digital spectrometer is the use of ultra-large-scale integrated circuits to achieve parallel processing of wideband signals, and the digital spectrometer also has the advantages of strong anti-interference capability, high stability, small size, and good flexibility [21,22,23]. Compared with DACS (another type of digital spectrometer), FFTS has greater advantages in the manner of implementation, which can reduce system complexity and save hardware resources [24,25]. The parameter comparison of FFTS in TALIS with the spectrometers in other MLSs is shown in Table 2.
In this study, we performed quantitative effect analysis of the digital spectrometer FFT algorithm on TALIS’ system sensitivity. The contents of this paper are summarized as follows: the TALIS system design is presented in Section 2, which includes an overview of TALIS and the digital spectrometer parameter selection; Section 3 describes in detail the effect of the FFT algorithm on system sensitivity; the complementary analysis is provided in terms of integration time, spectral resolution, and quantization bits in Section 4; and finally, Section 5 concludes the paper.

2. Materials and Methods

2.1. TALIS Overview

A schematic diagram of limb sounding with TALIS is shown in Figure 1, and the parameters are shown in Table 3. TALIS is designed to work in a sun-synchronous orbit at an altitude of 600 km. The offset parabolic antenna of TALIS is composed of a single projected reflector of 1.6 m aperture combined with four independent feeds. This layout has a simple system design, low complexity, and high measurement accuracy compared with the quasi-optical separation layout of EOS-MLS, but there will be position differences in the observation area. The radiation signals received from the main reflecting surface of the antenna enter the front end of the receiver with the frequencies of 118, 190, 240, and 640 GHz. After that, the feeders of different frequencies are connected to the receiver to complete the mixing and amplification of the radiometer front-end signals. The IF signals are amplified and further downconverted by four discrete components. Different local oscillator (LO) frequencies are used in the second stage IF down-converter module to transform the frequencies to suitable bandwidths for the operation of the back-end spectrometers. The transformed IF signals are then fed to the back-end digital spectrometers for spectral analysis [26,27]. Finally, the functions of bus control and scientific data transfer are performed by the system and data management unit.

2.2. Digital Spectrometer Parameter Selection

The spectral resolution Δf is defined as shown in Equation (1):
Δ f = f S K ,
where fs represents the sampling frequency and K represents the number of sampling points. The spectral resolution is the fixed frequency interval between each set of two channels of the digital spectrometer, and it is an important parameter to measure the performance of the digital spectrometer, which will directly affect the detection accuracy of the spectral lines, and thus the final retrieval results.
We calculate the noise equivalent temperature difference (NEDT) [28,29] according to Equation (2):
N E D T = T s y s Δ f d τ ,
where Tsys indicates the system temperature of the radiometer, and indicates the integration time of a single measurement.
Considering only the spectral resolution, it is desirable for the spectral resolution to be high so that the absorption peaks with smaller bandwidths can be taken into account in the detection target selection, and the retrieval accuracy can also be improved. However, according to Equation (2), the higher the spectral resolution, the worse the system sensitivity will be, so it is only meaningful to increase the spectral resolution while maintaining sufficient sensitivity. According to the Nyquist sampling theorem, the system sampling frequency needs to be at least twice the bandwidth. According to the nature of the FFT algorithm, the results are centrosymmetric after the FFT operation, so the actual number of effective points obtained is half of the number of sampling points, which is defined as the number of channels. Therefore, the results of spectral resolution are directly related to the parameter settings of bandwidth and the number of channels [30].

2.2.1. Bandwidth and the Number of Channels

Four heterodyne radiometers operating at room temperature with center frequencies of 118, 190, 240, and 640 GHz were designed in TALIS, and the instrument temperature onboard the satellite was approximately 285 K. In the selection process of bandwidth, firstly, the location and intensity of the spectral lines of each target should be fully understood, and as many absorption spectral lines of other trace gases as possible should be included in addition to the primary detection targets. Secondly, because of the use of a double-sideband (DSB) receiver, the signal strength after the mixing of the two sidebands should also be fully demonstrated. Thirdly, it is necessary to combine the engineering implementation of the hardware, such as considering the chip selection and operating reliability, so as to select the appropriate bandwidth. In this study, the 240-GHz band is used as an example to illustrate the reasonableness of the 2-GHz bandwidth selection [31]. The contributions of the main chemical species to the brightness temperature spectrum of near 240 GHz, simulated by atmospheric radiative transfer simulator (ARTS)—version 2.4 [32] at the tangent height of 30 km, are shown in Figure 2.
It can be seen in the brightness temperature simulated by ARTS in Figure 2 that the detectable targets, such as O3 (e.g., 244.2 GHz), O2 (233.9 GHz), CO (230.5 GHz), and HNO3 (244.2 GHz), are included near the 240-GHz band, and the absorption peaks of the targets can be better contained in the 2-GHz bandwidth [33]. From the hardware implementation point of view, the 2-GHz bandwidth requires an analog to digital converter (ADC) with a sampling rate of at least 4 GHz [34]. Therefore, it is reasonable to set the bandwidth to 2 GHz by combining the factors such as wideband ADC, aerospace-grade application, and working stability.
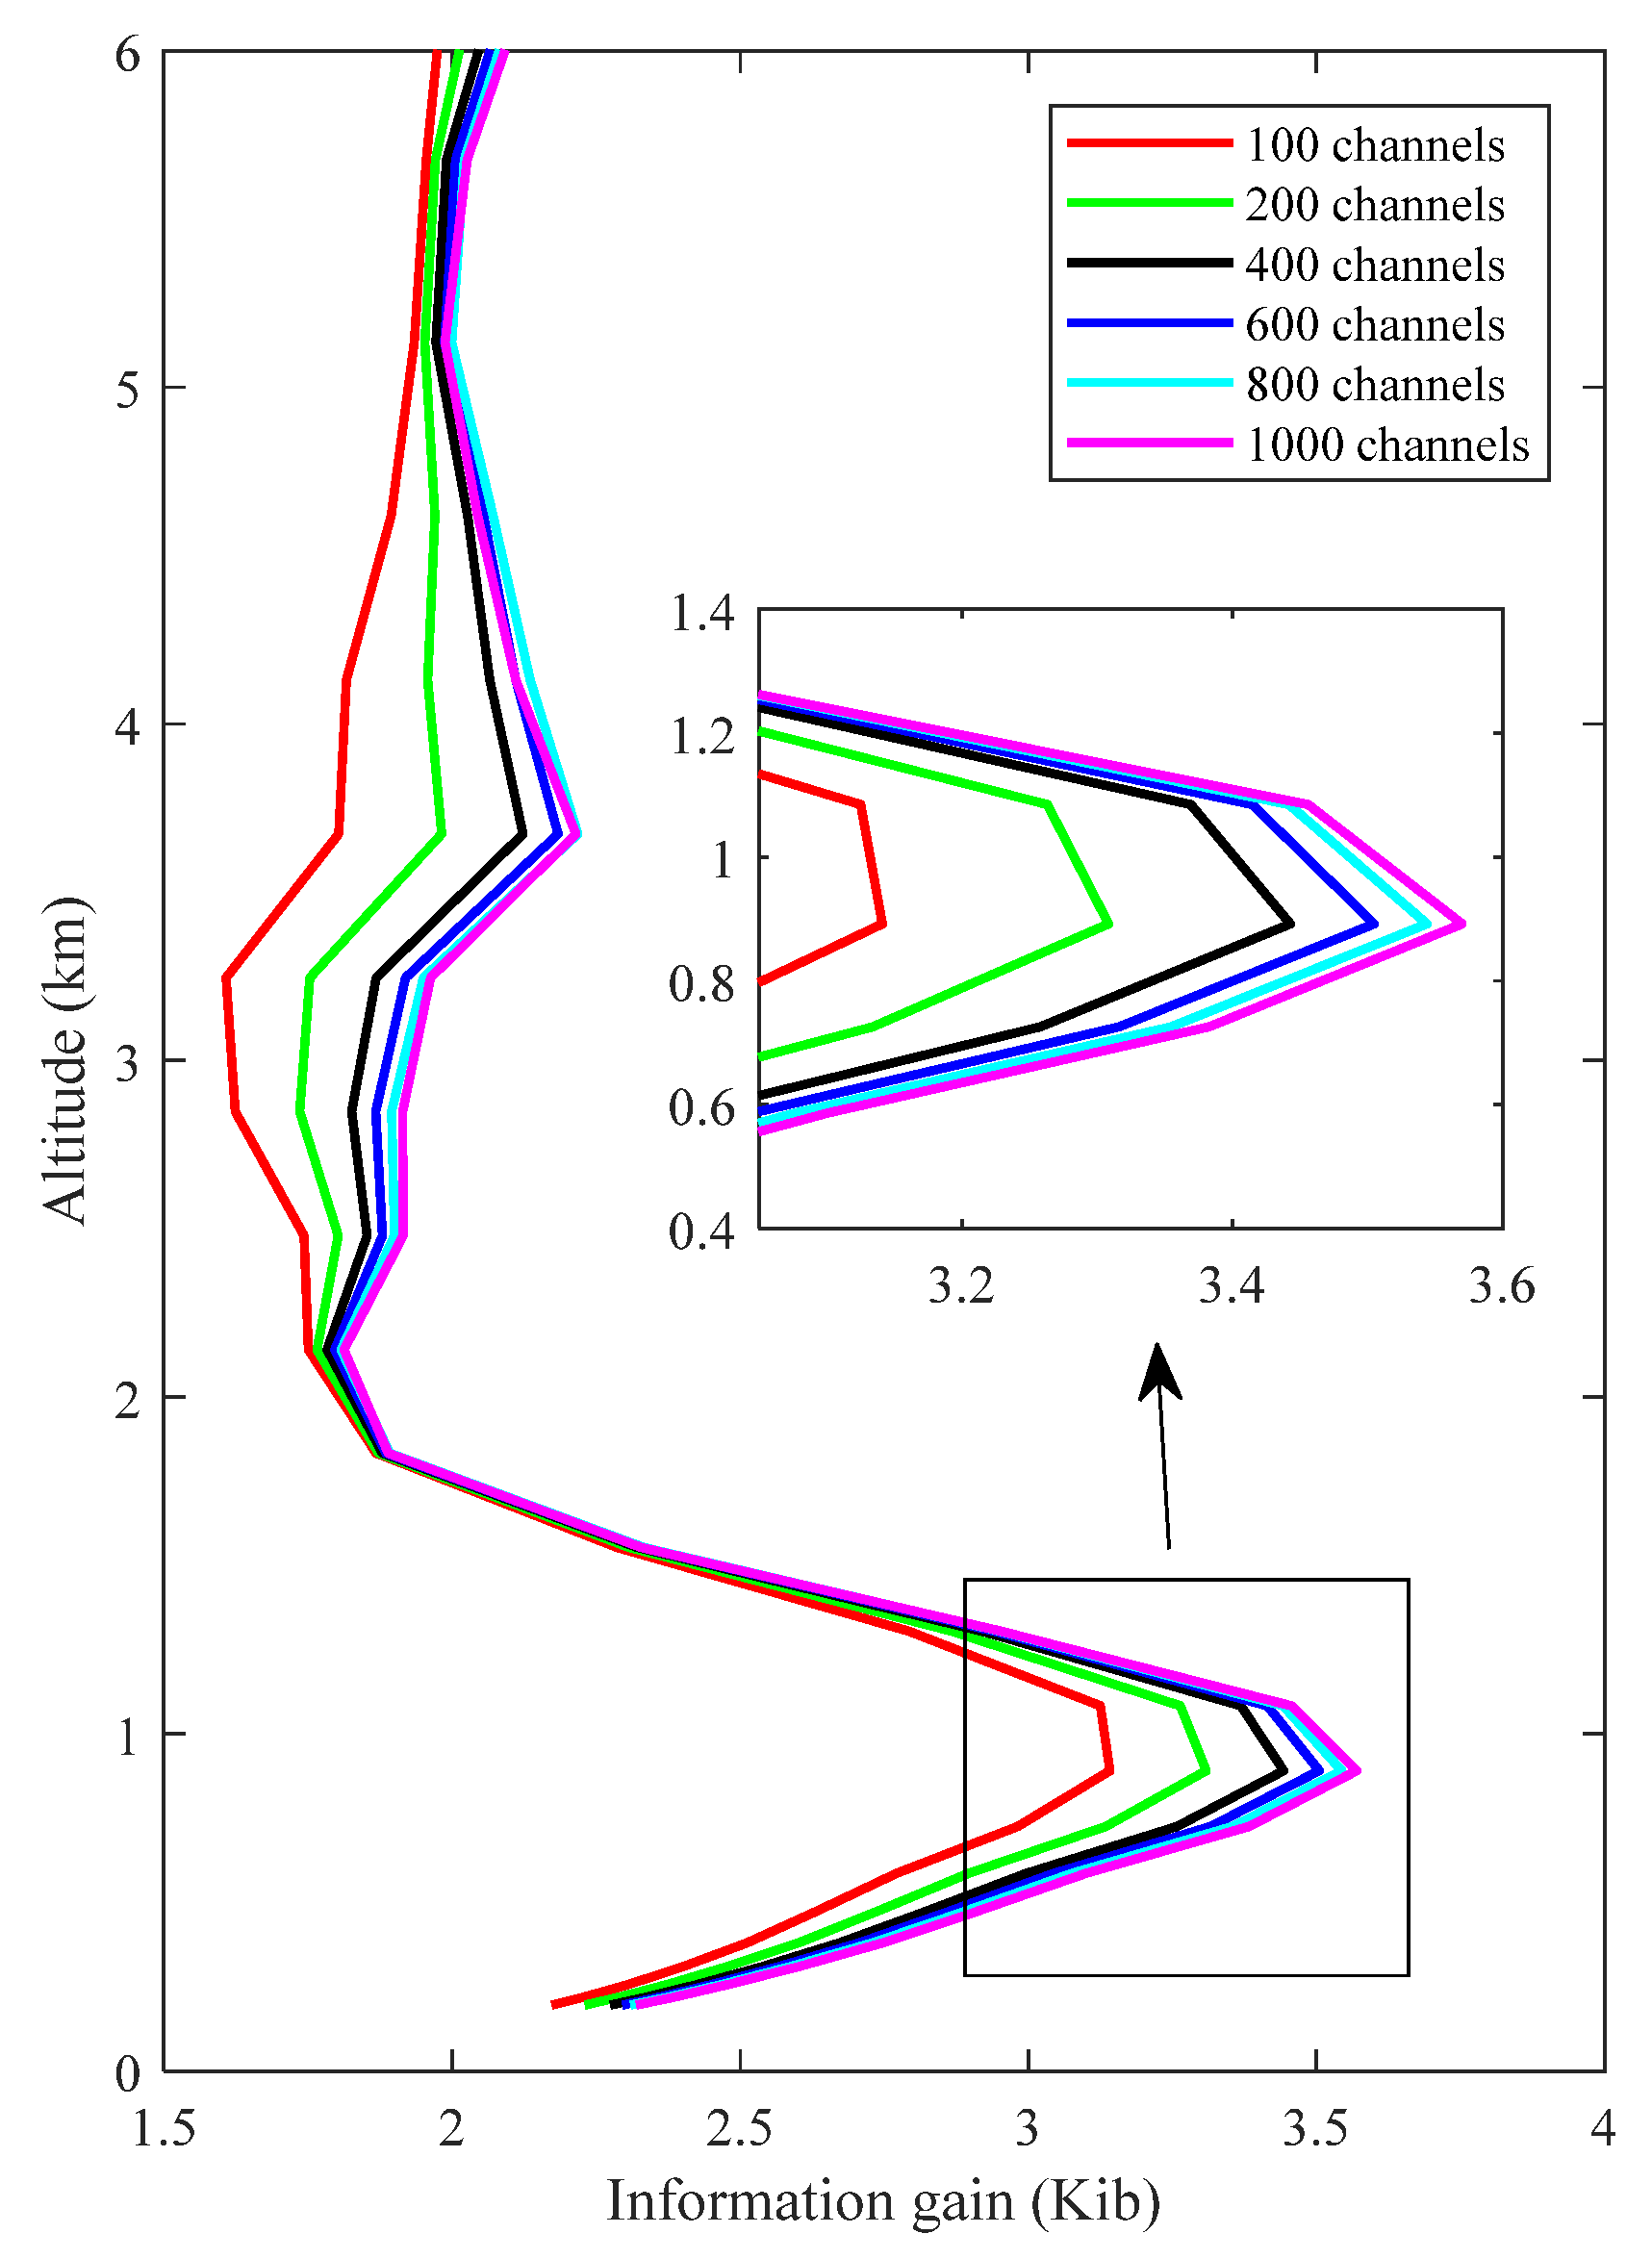
The radix 16 real-time complex FFT algorithm is the core algorithm of the digital spectrometer, so the final number of channels is half of the number of sampling points [35]. The variation of the amount of information in the atmospheric spectrum corresponding to different numbers of channels at different altitudes is expressed by the Shannon information gain. The simulation analysis of the number of channels and information gain performed by the ground-based radiometer is shown in Figure 3, from which it can be seen that, when increasing from 100 to 1000 channels, the greater the number of channels at the vertical height, the greater the information gain obtained. However, the information gain of increasing from 800 to 1000 channels is smaller than that of increasing from 100 to 200 channels, which means that after reaching 1000 channels, the increase of information gain is not significant due to the excessive number of channels. Therefore, it is reasonable to choose approximately 1000 channels.

2.2.2. Parameter Analysis

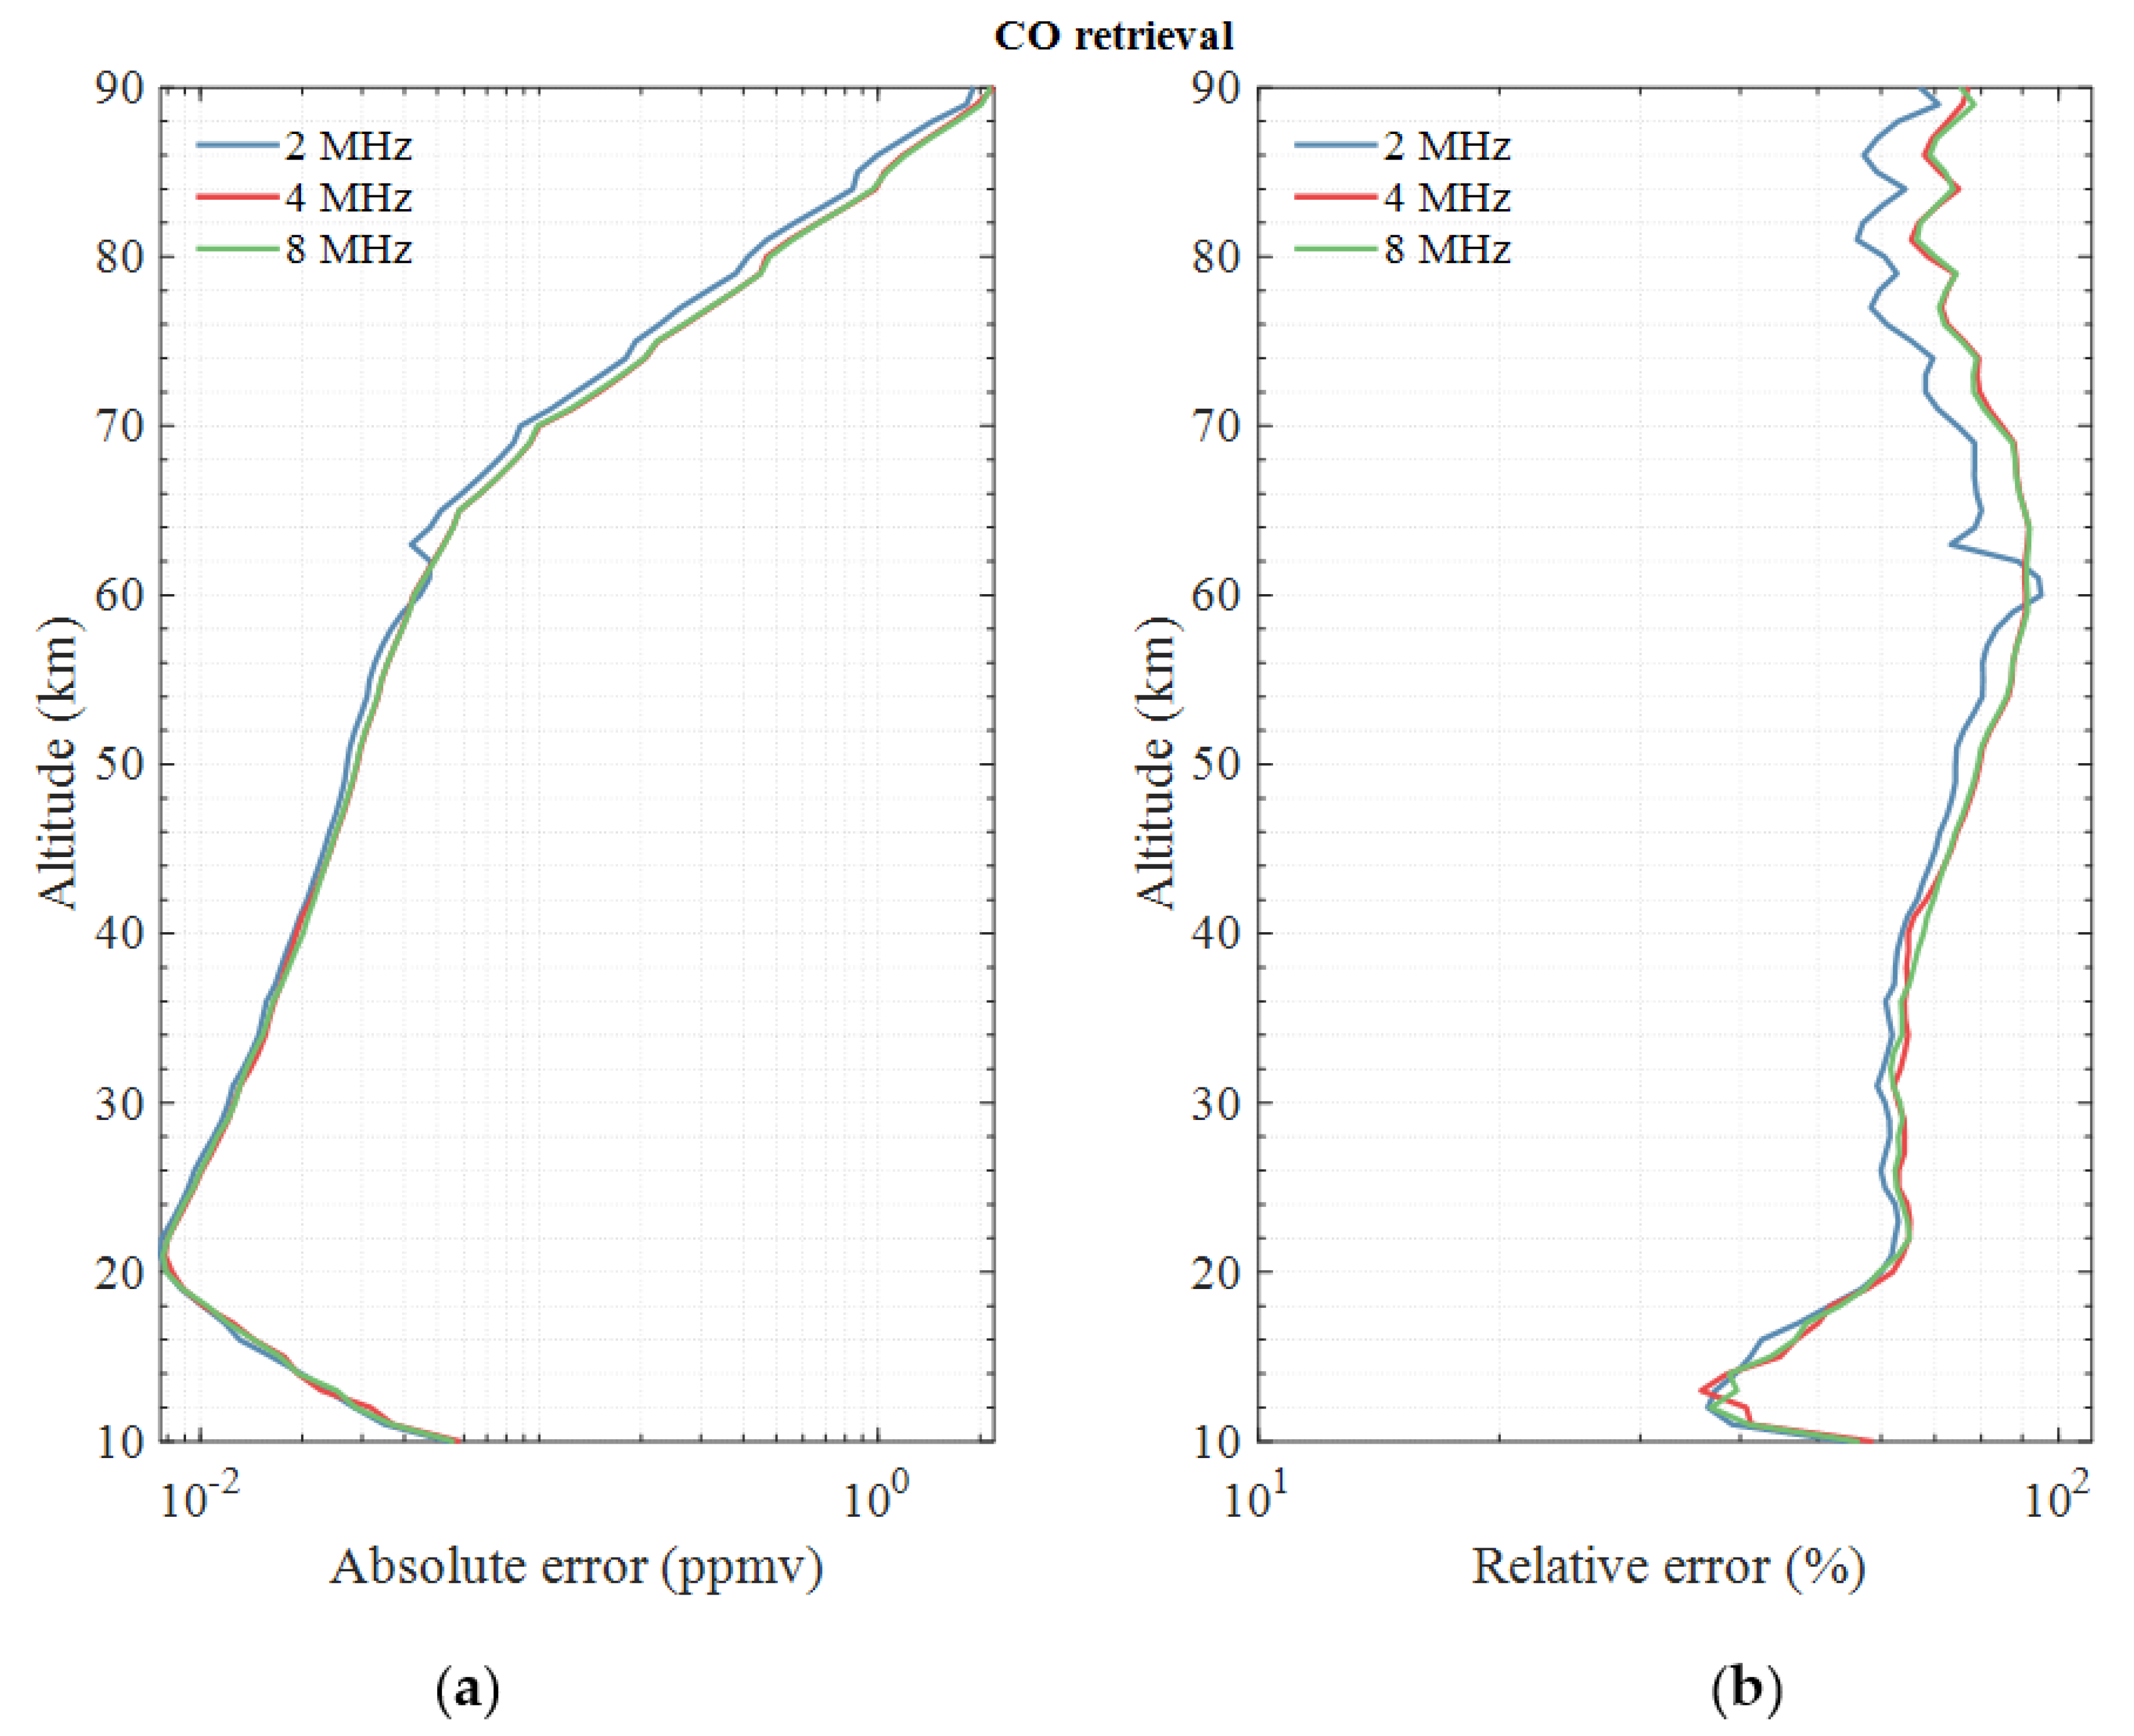
According to the design of the bandwidth and the number of channels, the corresponding sampling rate and the number of sampling points can be obtained. We analyzed the effect of different spectral resolutions on the retrieval results and verified whether the demand for spectral line detection in the middle and upper atmosphere can be satisfied by the spectral resolution of the digital spectrometer [36]. To facilitate retrieval, when the sensitivity of the radiometers will be increased from the designed 2.2 K, 2.2 K, 2.2 K, 5.1 K to 1.6 K, 1.6 K, 1.6 K, 3.6 K and 1.1 K, 1.1 K, 1.1 K, 2.6 K, the spectral resolution of 2 MHz can be reduced to 4 MHz and 8 MHz, respectively, for retrieval analysis.
The retrieval results of TALIS for CO at spectral resolutions of 2 MHz, 4 MHz, and 8 MHz are shown in Figure 4. In general, although the system sensitivity is effectively enhanced by reducing the spectral resolution, the effect on the retrieval results is not significant with this enhancement. In terms of local profiles, in the regions of strong measurement response in the middle and lower atmosphere (<50 km), the retrieval results are not affected by reducing the spectral resolution, because the bandwidths of the absorption peaks in the spectrum are relatively wide. However, in the middle and upper atmosphere, reducing the spectral resolution will reduce the retrieval accuracy to some extent, because the width of the gas spectral line decreases with the decrease of atmospheric pressure. The gas absorption peaks in the upper atmosphere cannot be identified because of the lower spectral resolution, and the information on other trace gases with weaker absorption may be lost due to the lower spectral resolution. Therefore, it is reasonable and meaningful for TALIS to use a digital spectrometer with a higher spectral resolution of approximately 2 MHz [37].

3. Results

3.1. Effect of the Digital Spectrometer FFT Algorithm

The radix 16 real-time complex FFT algorithm is the core algorithm for realizing the function of the digital spectrometer, which was obtained by the improvement and combination of parallel processing and complex processing on the basis of the discrete Fourier transform (DFT) [38]. Parallel processing increases the speed of FFT calculation, while reducing the complexity and improving the efficiency of the operation. Complex processing is more applicable to the hardware implementation, as it can save hardware resources and increase the operation speed. Based on the digital spectrometer parameter selection in Section 2.2, the effect of the FFT algorithm on the TALIS system sensitivity under this parameter will be evaluated in this section.

3.2. Simulation Process

During the design of TALIS, the TALIS system simulation model was developed to better understand the performance of TALIS and provide a more detailed reference for instrumental design. The working process and characteristics of TALIS can be simulated by the TALIS system simulation model, and subsequently the TALIS system sensitivity can be quantitatively analyzed by using the system calibration process so that the instrument performance can be initially evaluated. In order to visualize the power spectrum and sensitivity obtained from the TALIS system simulation model, the brightness temperature spectrum of 640 GHz S10 was used as the input, and the frequency bands represented by S10 are shown in Table 3. The system noise temperature of 2000 K, integration time of 5 ms, and spectral resolution of 2 MHz were used as the simulation conditions in this section.
It should be noted that, in order to facilitate the use of ARTS to simulate the brightness temperature spectrum, we set the spectral resolution to 2 MHz for analysis, which corresponds to the number of channels being 1000. However, in the actual FFT algorithm implementation, the number of channels we need must be in the form of integer powers of 2, so the number of channels was selected as 1 k (1024). This corresponds to a spectral resolution of 2.3 MHz when the ADC sampling rate is 4.8 GHz. In the research described in this paper, however, we carried out simulation analysis according to the number of channels of 1000 and the spectral resolution of 2 MHz.
ARTS was used to simulate the top-of-atmosphere brightness temperature at the nadir angle of TALIS, and the brightness temperature spectrum was used as the input of the TALIS system simulation model. According to the spectral bands divided in Table 3, the simulated brightness temperature was generated by ARTS for a total of 11 spectral bands of four radiometers at the tangent height of 30 km. The simulated brightness temperature spectrums of the upper and lower sidebands for 640 GHz S10 are shown in Figure 5.
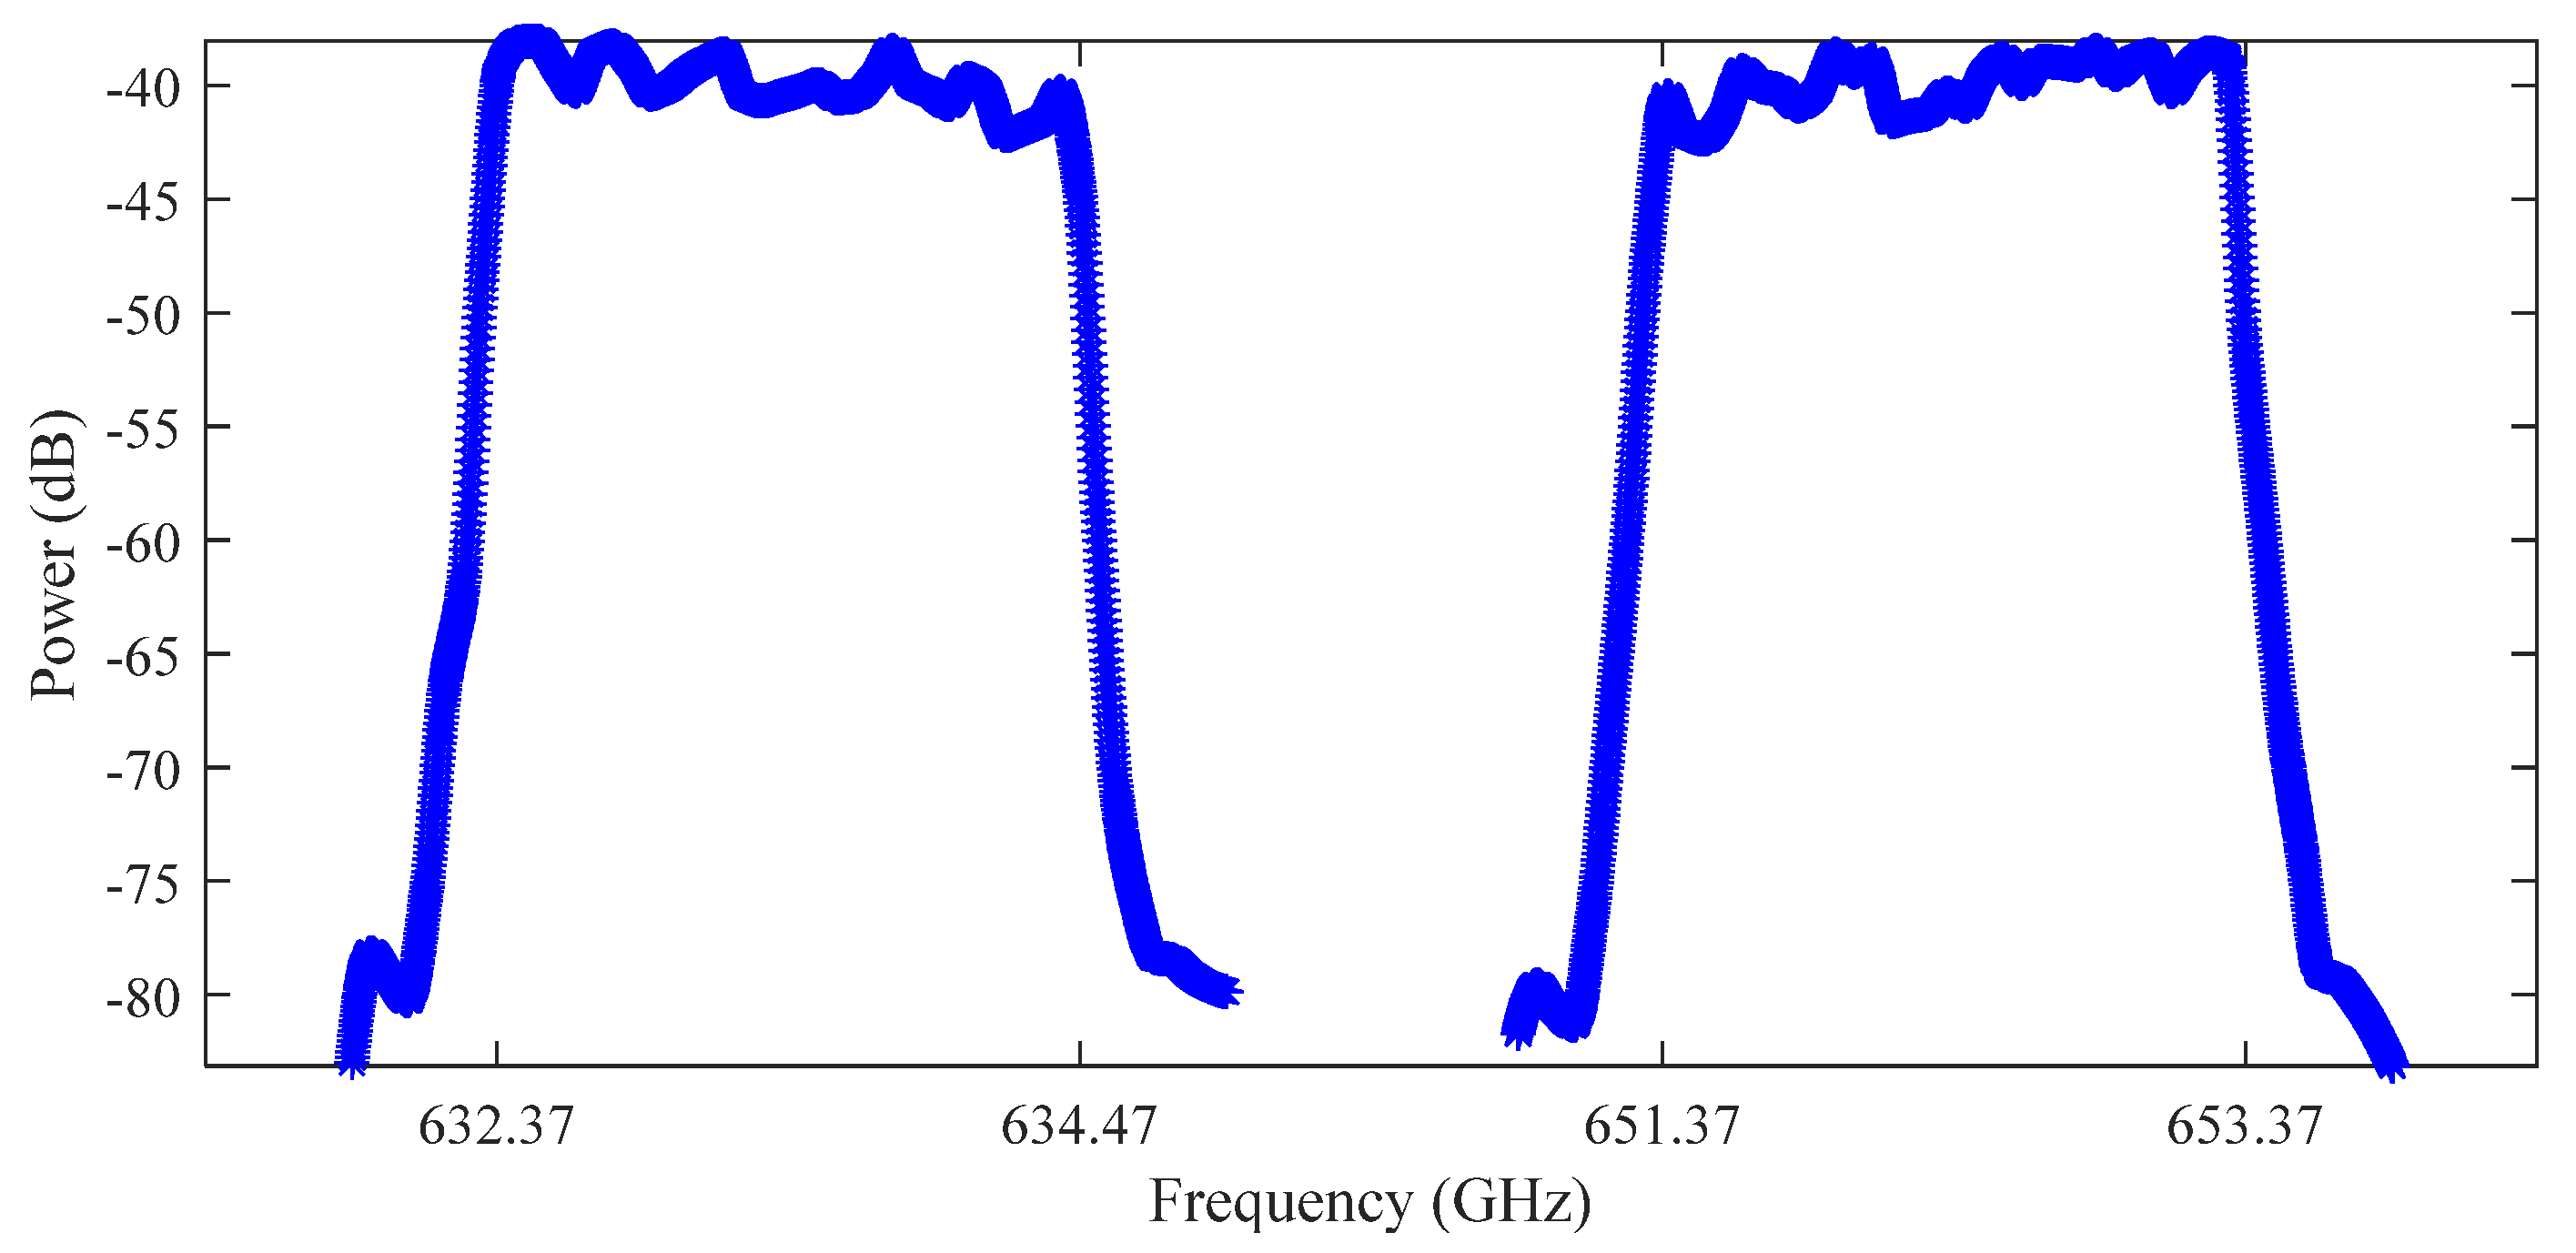
The TALIS system simulation model mainly includes the thermal radiation noise signal model, radiometer radio frequency (RF) front-end model, and radiometer digital back-end model. The TALIS system simulation model was introduced in our previous study and will not be expanded in detail here [39]. The conversion of the brightness temperature generated by ARTS into thermal noise entering the radiometer is completed in the thermal radiation noise signal model. The channel spectral response function (SRF) is commonly used in the radiometer RF front-end model to describe the frequency response characteristics of the passband. Due to the DSB type of the receiver, the SRF spectrums of the upper and lower sidebands are needed to establish the model. According to the SRF spectrums and the input brightness temperature spectrums, the spectral characteristics of the front-end output signals can be obtained. The simulated SRF spectrums of one of the groups with 3 dB in-band fluctuations of two sidebands are shown in Figure 6.
The back end of TALIS consists of 11 digital spectrometers, which are mainly used to calculate the power spectrum of the front-end output signals. The working process of the digital spectrometer is simulated in the radiometer digital back-end model, which mainly involves the data sampling, data quantization, FFT operation, power spectrum density (PSD) calculation, and accumulation of the front-end output signals. In the digital back-end model, the output analog signals of the front end are quantized by 8-bit and then turned into digital signals. Subsequently, the FFT operation is performed to obtain the amplitude spectrum, which is then squared to obtain the PSD. According to the given integration time, the corresponding power spectrum will be acquired after accumulating a certain number of times.
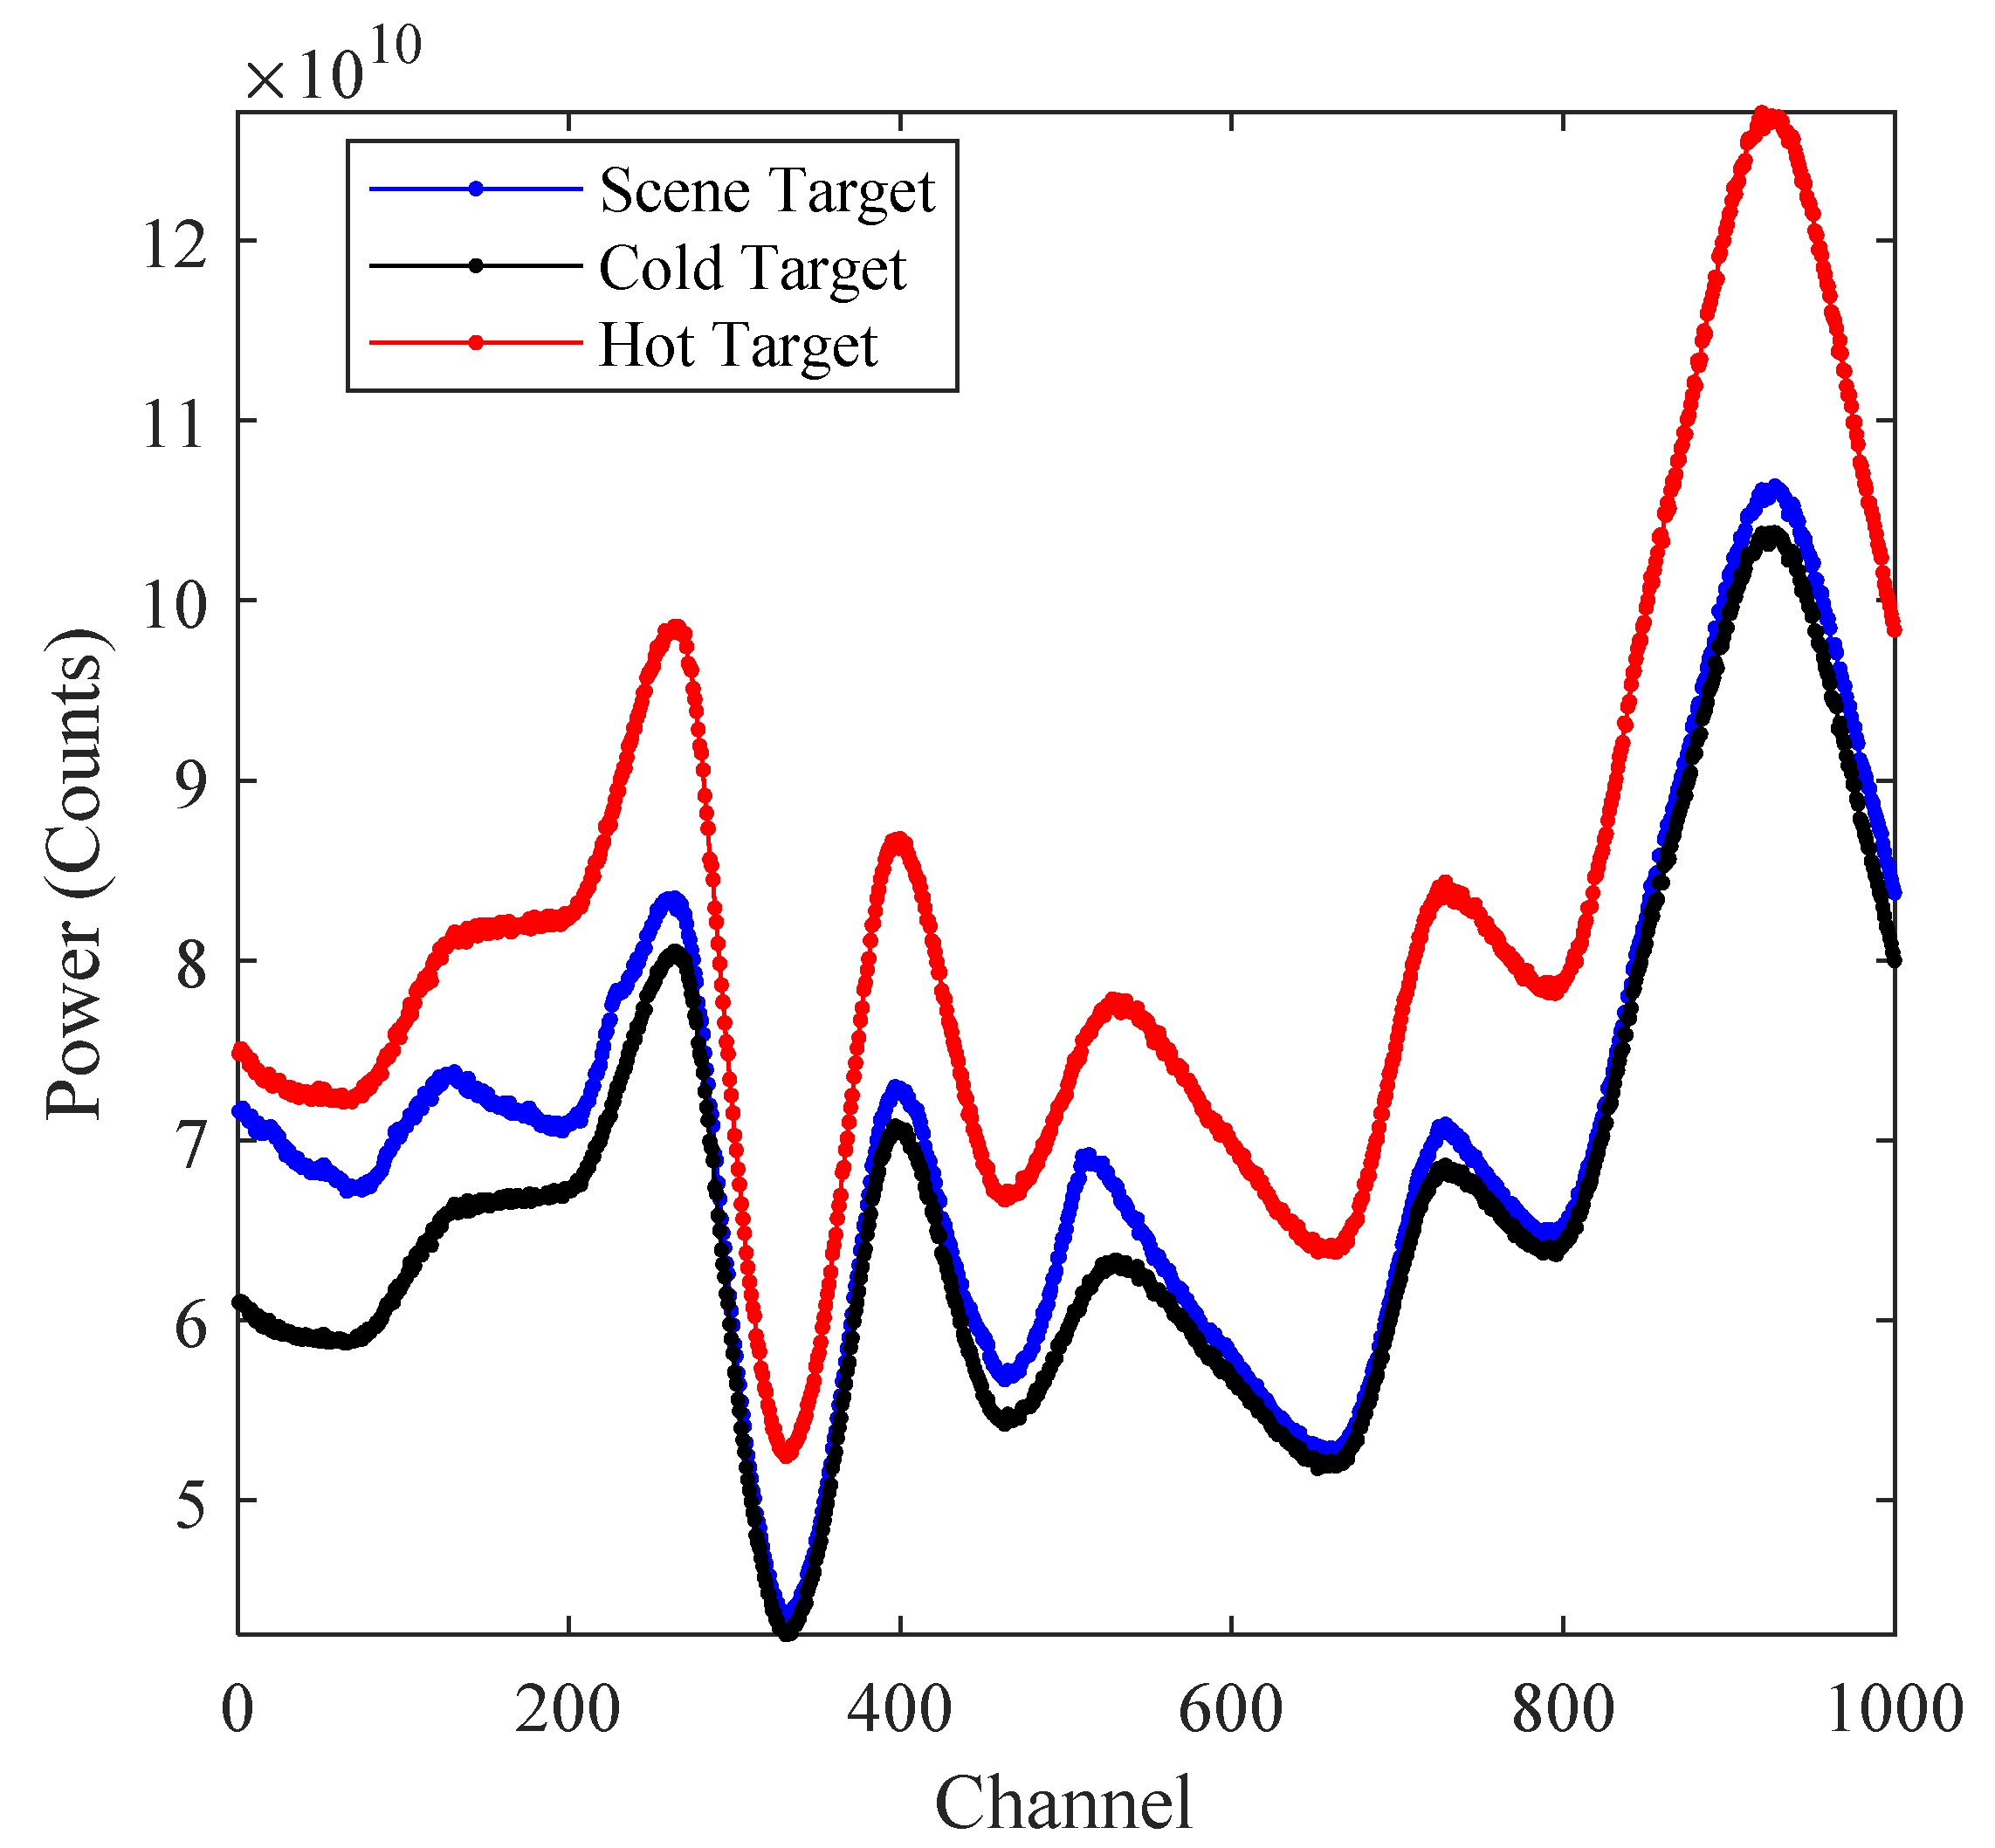
The radiometer receives the thermal noise of the targets, and the amount of radiation is a measure of the energy magnitude of the thermal noise. In the simulation process, we used the brightness temperature spectrum obtained from ARTS as the scene target, and we set up the hot and cold targets with uniform brightness temperature. In general, we use Gaussian white noise to represent thermal noise, which can be modeled for both hot and cold targets with uniform brightness temperature. According to the noise spectrum per unit radiation amount, we can get the input noise signal of the scene target, hot target, and cold target. The power spectrum obtained was not accurate because the influence of SRF is superimposed in the RF front-end model. The power spectrum after the integration time of 5 ms is shown in Figure 7.
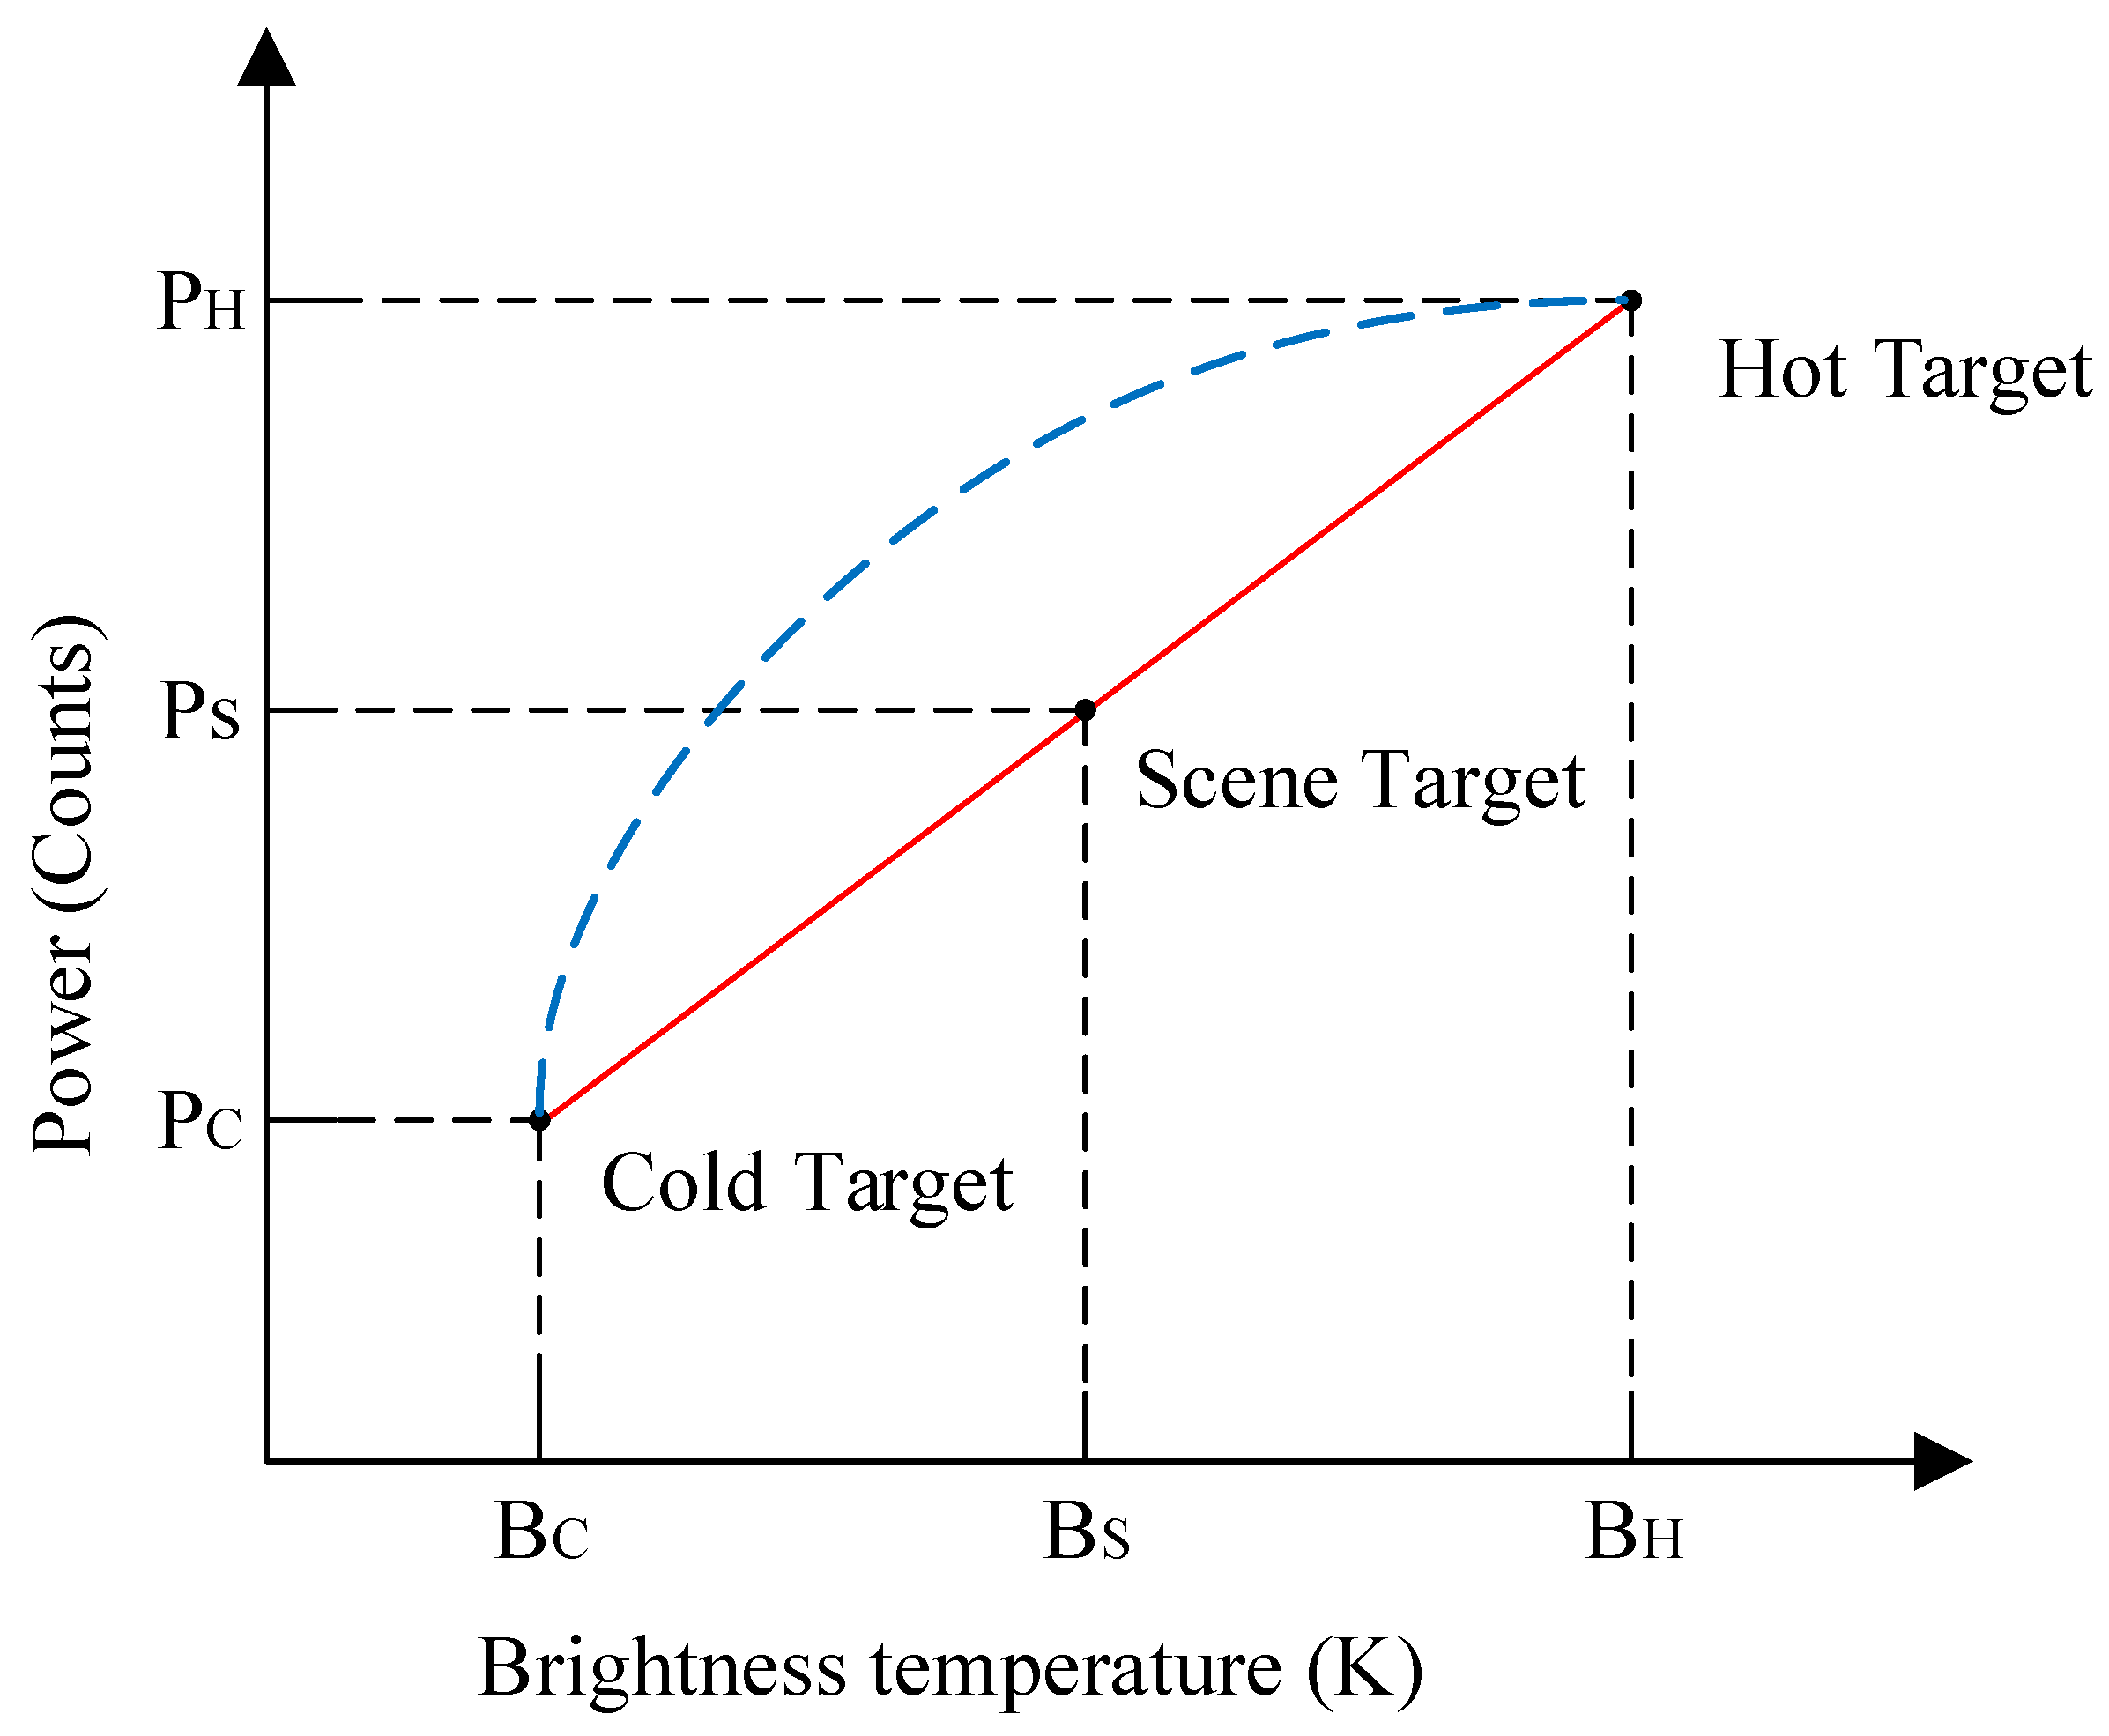
According to the power spectrum obtained, two-point calibration is needed to get the real brightness temperature distribution of the scene target. Two-point calibration means that the observations of both hot and cold targets and scene target are completed in each scan cycle [40]. Here we consider the radiometer as a linear system, so the linear equation can be established with the cold and hot target count values (PC, PH) and the brightness temperature values (BC, BH) observed by the instrument to obtain the brightness temperature of the scene target, as shown by the red line in Figure 8. The relationship between the real brightness temperature and power is shown in the blue line in Figure 8. The specific brightness temperature bias is required to be calibrated and corrected according to the observed data of the instrument, which is not repeated here.
The two-point calibration equation is constructed as shown in Equation (3):
P S = M B S + N ,
where M and N are shown in Equations (4) and (5), respectively:
M = ( P H P C ) / ( B H B C ) ,
N = ( B H P C B C P H ) / ( B H B C ) ,
where PC, PH, and PS indicate the count values of the cold target, hot target, and scene target, respectively. BC, BH, and BS represent the brightness temperature values of the cold target, hot target, and scene target, respectively.
The two-point calibration method is used to determine the radiation of the targets in a conventional full-power radiometer. The calibration principle of TALIS is similar, except that it requires a two-point calibration for each channel to obtain the radiation for the channel. The radiation spectrum is obtained by joining the radiation of all channels [41]. The output brightness temperature spectrum after system calibration in this study is shown in Figure 9.
As can be seen in Figure 9, since the receiver was the DSB type, we chose the brightness temperature spectrum of the two sidebands as the input. The final output was the scene target brightness spectrum of the 2-GHz bandwidth of the digital spectrometer, which included the targets NO and N2O we wanted to detect. Since the number of channels selected in the simulation was 1000, the interval between each set of two channels, i.e., the spectral resolution, was constant at 2 MHz.

3.3. Sensitivity Analysis

Relying on the digital back-end model, the sensitivity obtained by different methods in the TALIS system can be simulated so that the effect of the digital spectrometer FFT algorithm on system sensitivity can be analyzed. For each packet of data processed differently, four methods of calculating sensitivity can be defined as follows.
  • Full-band auto-correlation (abbreviated as F-AC) method: After the quantization process of the TALIS system simulation model, the value in each channel is subtracted from the mean value and then squared to obtain the sub-band auto-correlation result of the channel for each packet of data. Then the results of all the sub-band channels are summed to the full band to obtain the value of this packet.
  • Full-band FFT (abbreviated as F-FFT) method: After the quantization process of the TALIS system simulation model, the FFT algorithm is performed for the results of all channels to obtain the amplitude spectrum, after which the amplitude spectrum is squared to obtain the results of the PSD for each packet of data. The results of PSD for all sub-band channels are summed to the full band to obtain the value of this packet.
  • Sub-band ideal (abbreviated as S-Ideal) method: According to Equation (2), the ideal sub-band sensitivity and ideal full-band sensitivity should be related by C times, under the condition of constant system noise temperature, integration time, spectral resolution, and so on, where C denotes the number of channels, so the ideal sub-band sensitivity can be obtained based on the ideal full-band sensitivity.
  • Sub-band FFT (abbreviated as S-FFT) method, which includes two calculation ways, the sub-band FFT calculated value (abbreviated as S-FFT-C) method and the sub-band FFT real value (abbreviated as S-FFT-R) method.
    • S-FFT-C method: After the quantization process of the TALIS system simulation model, FFT algorithm is performed for the results of all channels to obtain the amplitude spectrum, after which the amplitude spectrum is squared to obtain the results of the PSD for each packet of data. Unlike the F-FFT method, the calculation of sub-band sensitivity no longer involves the accumulation of power values of all channels within each packet of data but instead directly corresponds to the accumulation of each packet of data for each channel.
    • S-FFT-R method: The previous process is the same as S-FFT-C, and the cumulative value corresponding to each packet of data for each channel is obtained. After that, the cumulative value of each sub-band channel needs to be summed again to the full-band value. The cumulative value of each sub-band channel is divided by this full-band value and multiplied by the final value of the F-AC method obtained in method (1).
The sensitivity obtained by the F-AC method was considered to be the ideal full-band sensitivity, the sensitivity obtained by the F-FFT method was considered to be the actual full-band sensitivity, the sensitivity obtained by the S-Ideal method was considered to be the ideal sub-band sensitivity, and the sensitivity obtained by the S-FFT method was considered to be the actual sub-band sensitivity.
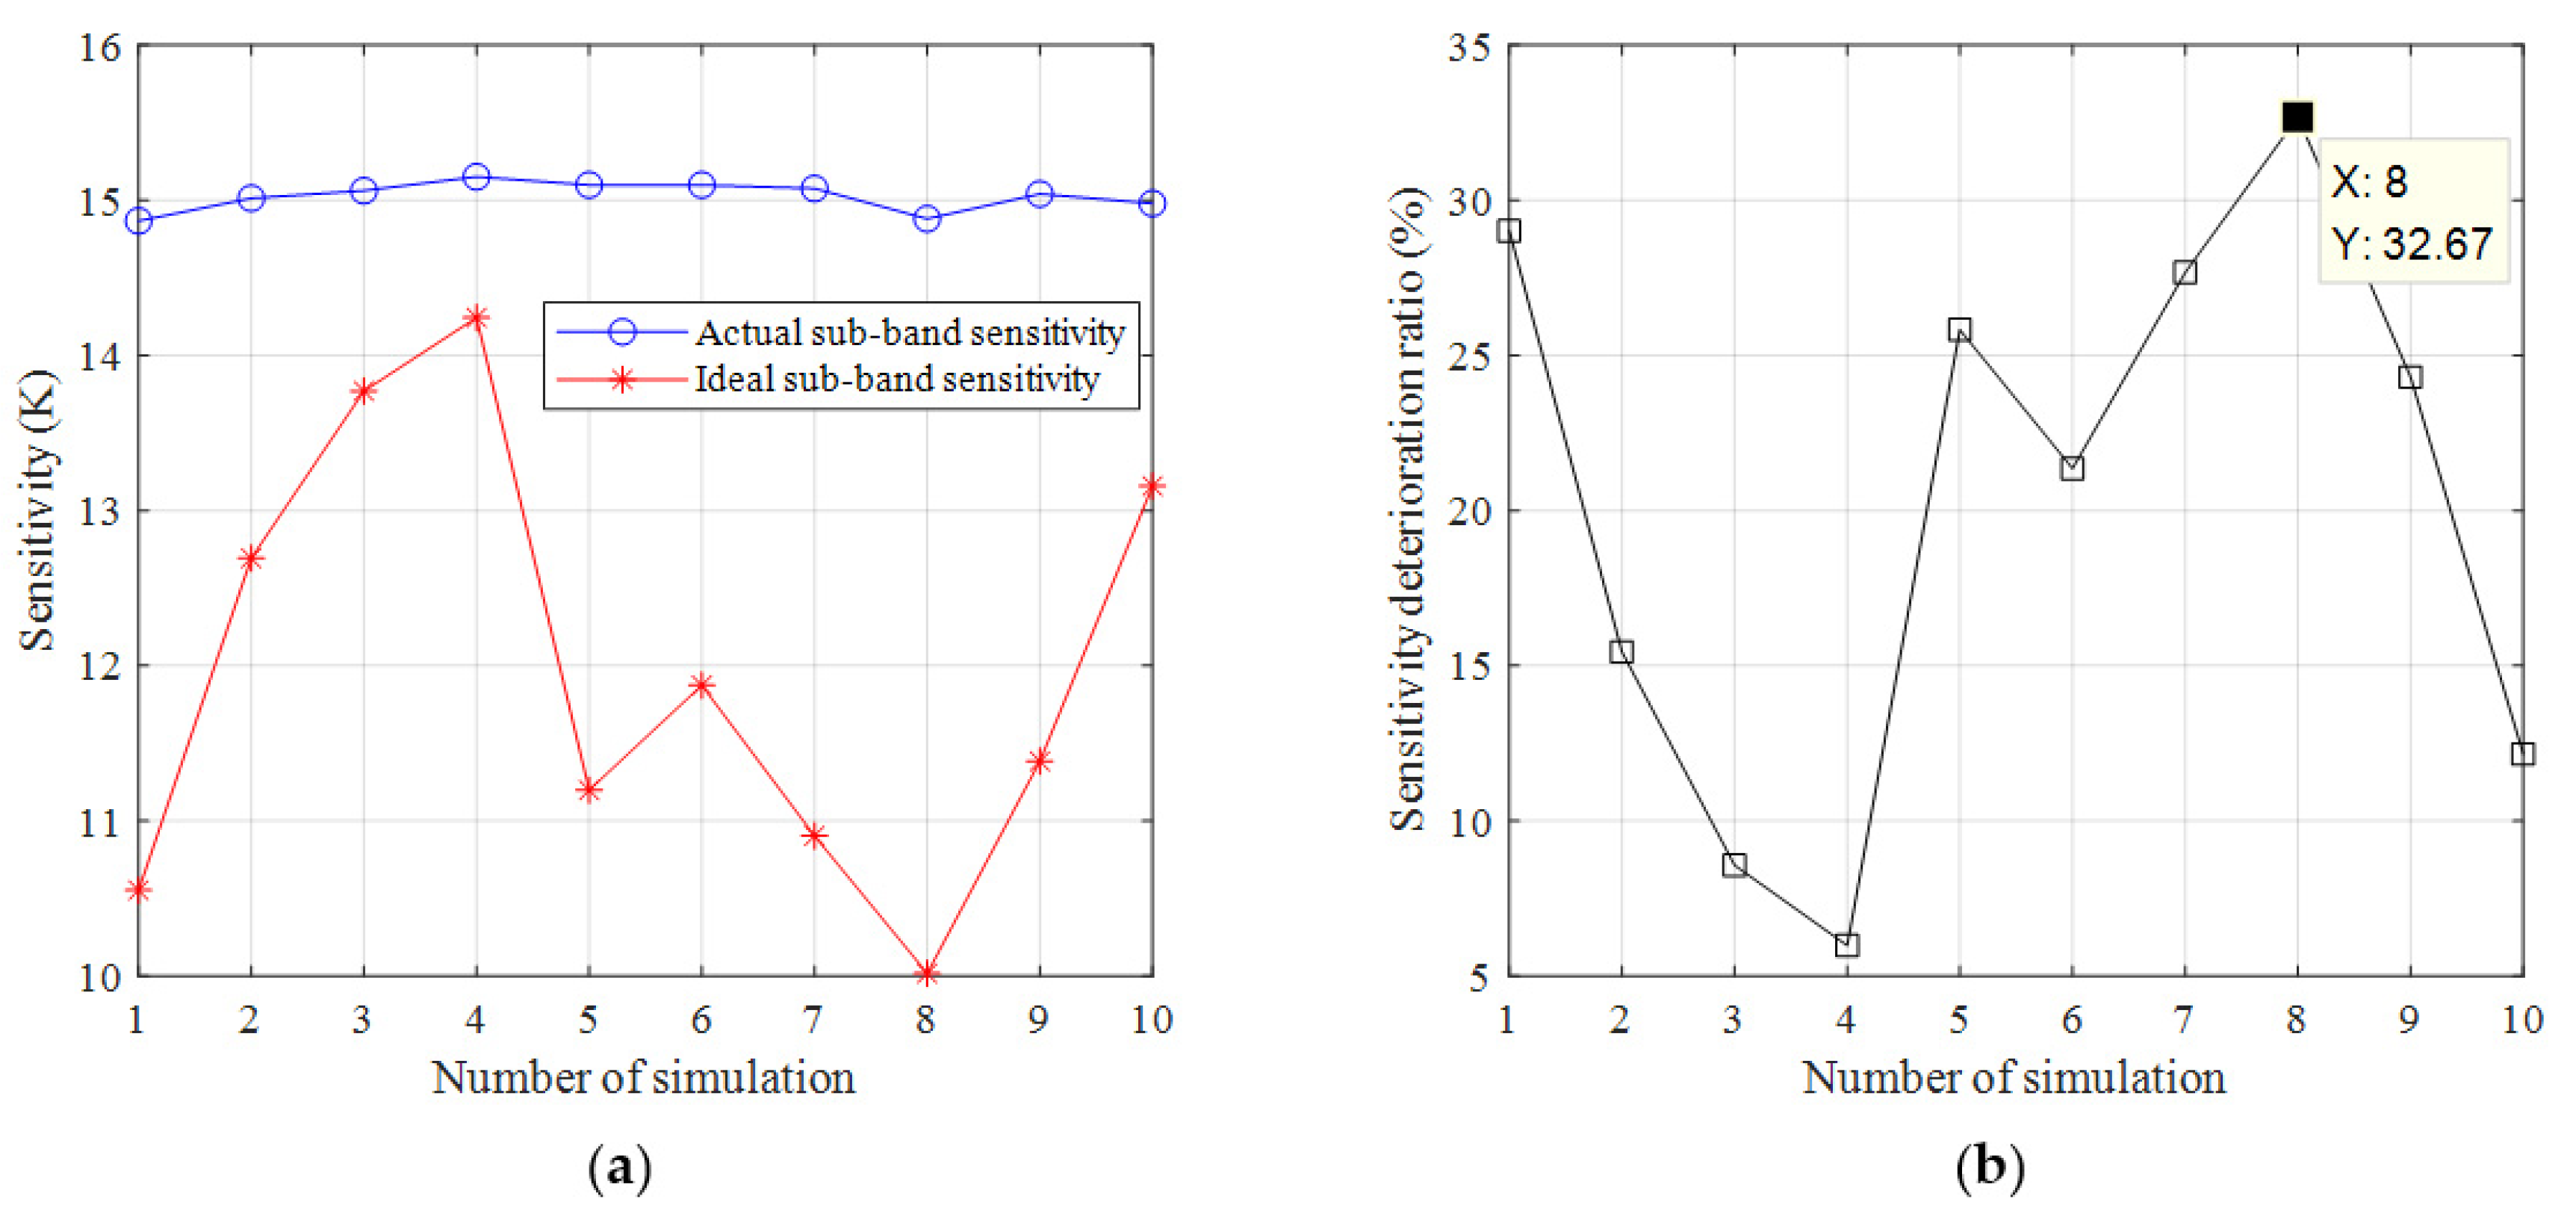
According to the aforementioned four methods, multiple simulations were performed, and the sensitivity was obtained for the different methods. Because of the commonality of the results, only the sensitivity results obtained for 10 of the simulations are listed in the paper, as shown in Table 4. The average row in Table 4 represents the average of the sensitivity results for each sensitivity method after 10 simulations. For the sub-band sensitivity, the mean value of each channel for each time is used as an illustration. The sensitivity obtained by the S-FFT-C method and the S-FFT-R method after one of the simulations is shown in Figure 10a,b, respectively. The difference in sensitivity between the two methods for each channel is shown in Figure 10c.
In the simulation results shown Table 4 it can be seen that for the full-band the sensitivity obtained by the F-AC method and the F-FFT method was the same in the distinguishable range of the brightness temperature, regardless of the single value or the average value. Therefore, the actual full-band sensitivity obtained after using the FFT algorithm in the digital spectrometer was consistent with the ideal full-band sensitivity of the TALIS system.
As can be seen in Table 4, the mean value of the sub-band sensitivity obtained using the S-FFT-C method and the S-FFT-R method is exactly the same. As can be seen in Figure 10a,b, the sensitivity distribution is also basically the same for each channel. The magnitude of the difference in sensitivity for each channel is 10−3, as shown in Figure 10c, so the sub-band sensitivity biases of the two methods are negligible. Therefore, either one of them can be considered as the actual sub-band sensitivity after using the FFT algorithm. The comparison of the actual sub-band sensitivity and the ideal sub-band sensitivity is shown in Figure 11a, and the deterioration of the sub-band sensitivity is shown in Figure 11b.
As can be seen in Figure 11, the calculated ideal sub-band sensitivity presents a large fluctuation due to the difference of ideal full-band sensitivity. Comparing the actual sub-band sensitivity with the ideal sub-band sensitivity, the results show that the deterioration of the actual sub-band sensitivity is caused by the digital spectrometer FFT algorithm. Overall, there is no significant pattern in the distribution of the deterioration ratio of the sub-band sensitivity when using the single values for simulation, but the maximum value of the deterioration ratio calculated using the single values is approximately 33% (Figure 11b).

4. Discussion

Based on the conclusions obtained from the simulations in Section 3, further complementary analysis was carried out on the effect of the digital spectrometer FFT algorithm on the TALIS sensitivity under different parameters of integration time, spectral resolution, and quantization bits [42]. It should be noted that during the simulations described in this section, only the average values of the sensitivity for the four methods (abbreviated as F-AC-AVR method, F-FFT-AVR method, S-Ideal-AVR method, and S-FFT-AVR method) are listed in the paper as an illustration due to the commonality of the results after a large number of simulations, where the S-FFT-AVR method is still represented by two versions: the S-FFT-C-AVR method and the S-FFT-R-AVR method. For the sub-band sensitivity, the mean value of each channel for each time was used as an illustration. Moreover, for different parameters, multiple simulations were performed separately under the parameter. Therefore, the results of the longitudinal comparison are convincing under a certain parameter.
(1)
For different integration time, we chose 0.5–80 ms and the intermediate 1 ms, 5 ms, 10 ms, 20 ms, and 50 ms as the simulation conditions, limited by the computer memory. The spectral resolution of 2 MHz and the quantization bits of 8-bit were kept constant at the same time. The simulation results are shown in Table 5 and Figure 12.
(2)
For different spectral resolutions, we chose 0.25–16 MHz and the intermediate 0.5 MHz, 1 MHz, 2 MHz, 4 MHz, and 8 MHz as the simulation conditions. The corresponding numbers of channels were set to 8000, 4000, 2000, 1000, 500, 250, and 125. The integration time of 5 ms and the quantization bits of 8-bit were kept constant at the same time. The simulation results are shown in Table 6 and Figure 13.
(3)
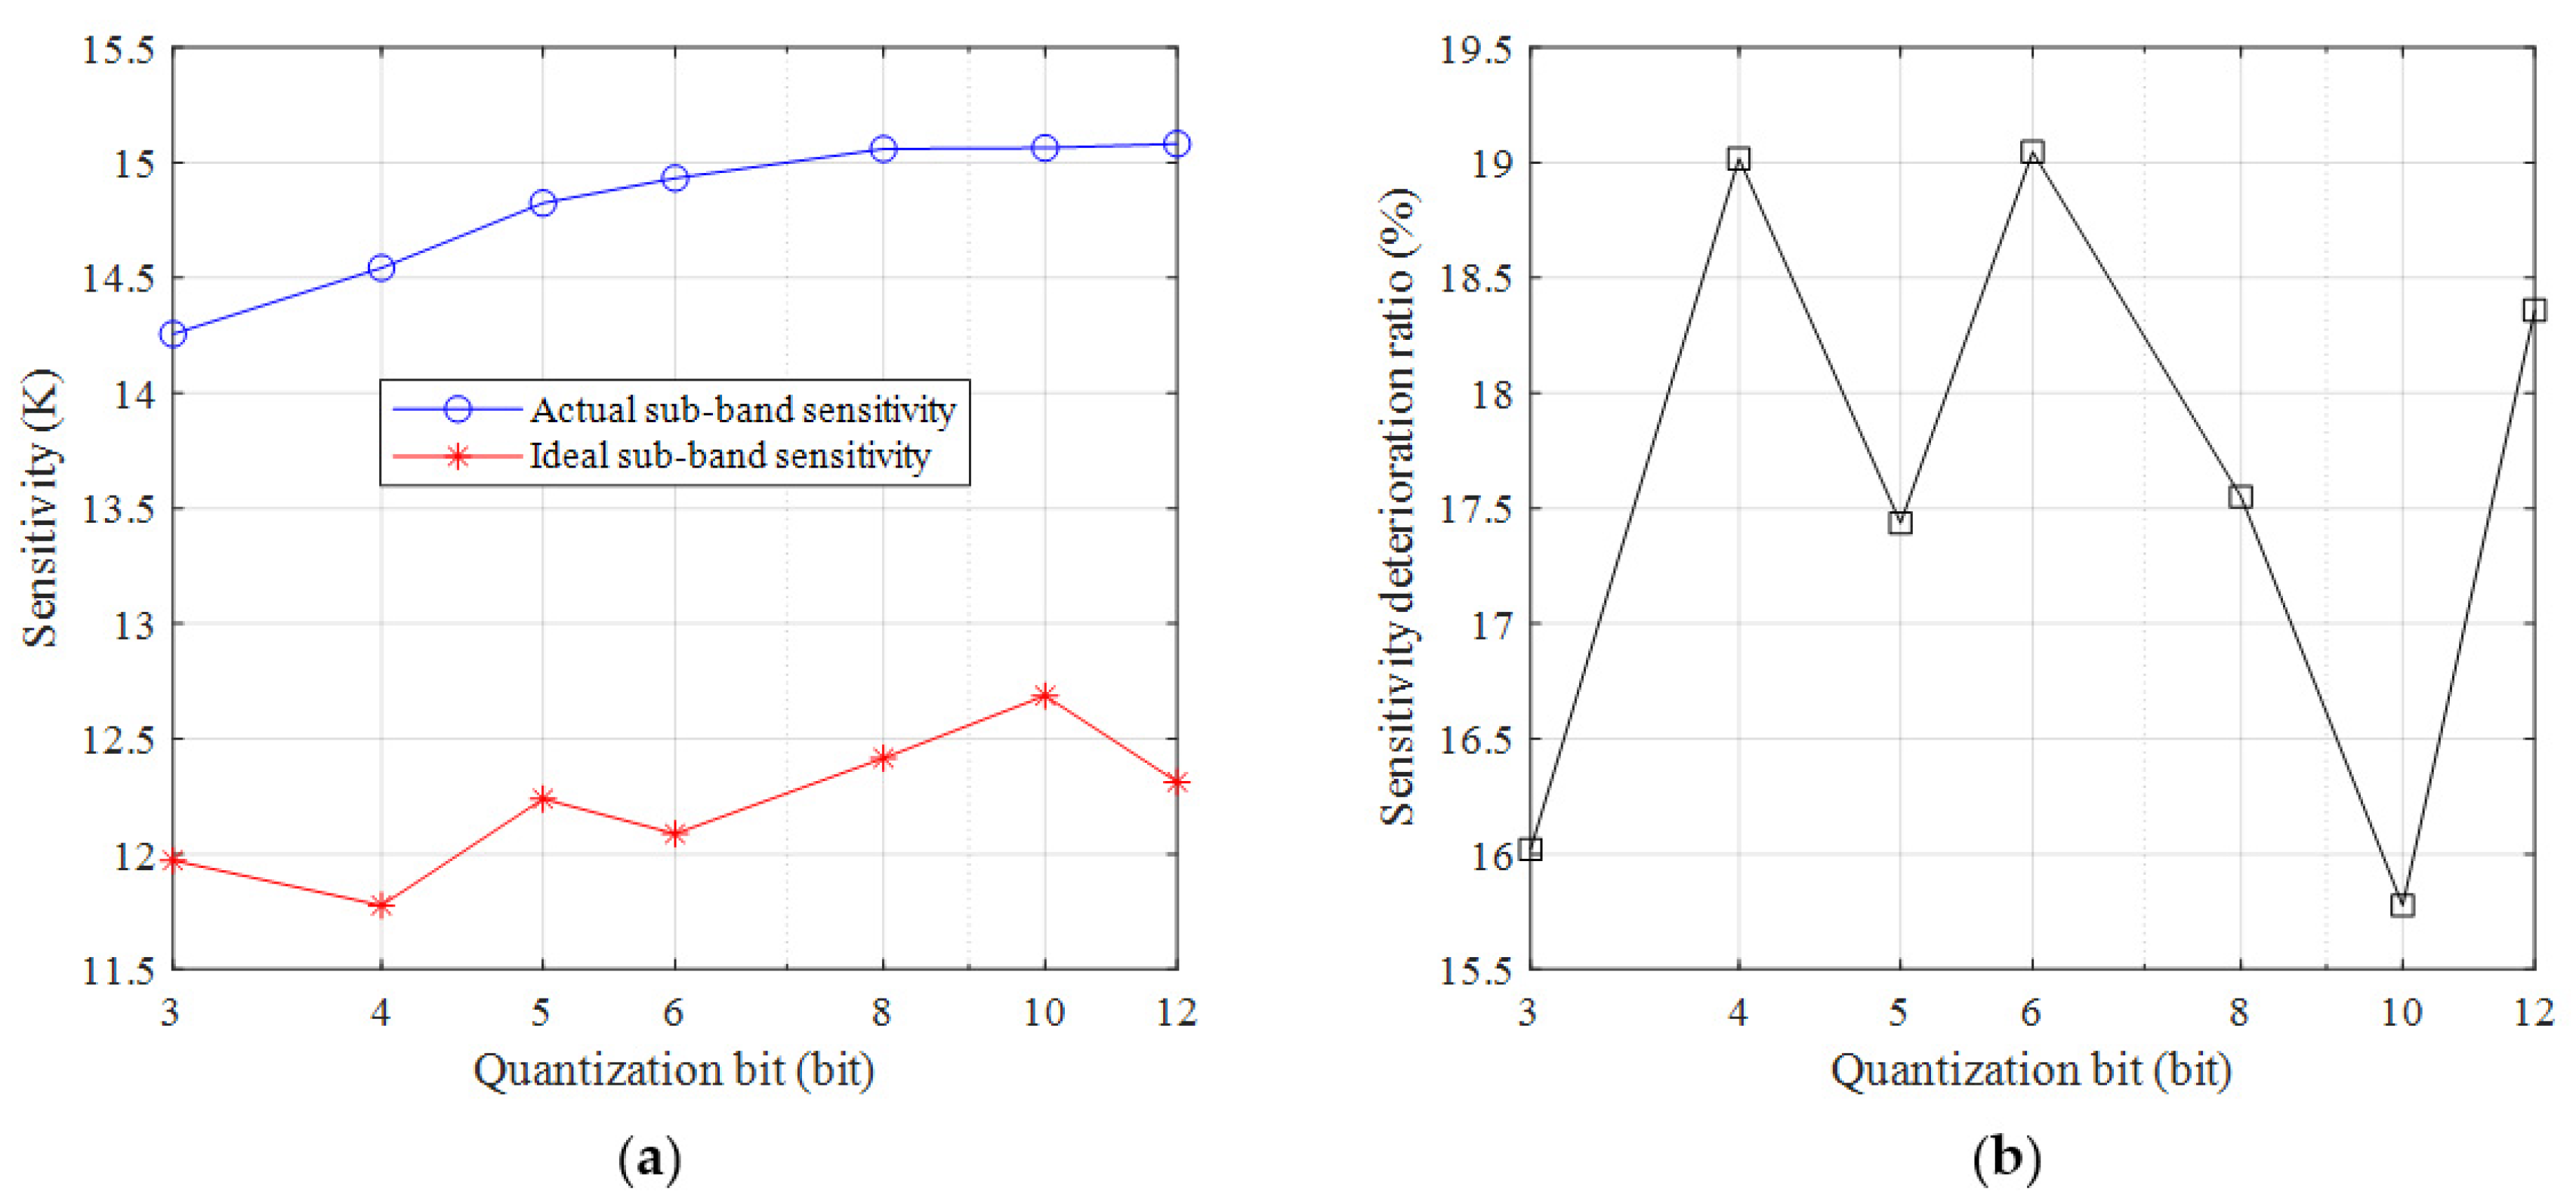
For different quantization bits, we chose 12-bit to 3-bit and the intermediate 10-bit, 8-bit, 6-bit, 5-bit, and 4-bit as the simulation conditions. The integration time of 5 ms and the spectral resolution of 2 MHz were kept constant at the same time. The simulation results are shown in Table 7 and Figure 14.
As can be seen in Table 5, Table 6 and Table 7, in the case of different integration time, spectral resolutions, and quantization bits, for the full-band, the sensitivity values obtained by the F-AC-AVR method and the F-FFT-AVR method were almost the same. The only exception is a slight difference of the sensitivity between the F-AC-AVR method (0.56 K) and the F-FFT-AVR method (0.55 K) at 4 MHz, which is due to the number of digits retained in the rounding process (0.5570 K for the F-AC-AVR method and 0.5549 K for the F-FFT-AVR method). Therefore, the actual full-band sensitivity obtained after using the FFT algorithm is consistent with the ideal full-band sensitivity within the range, where the brightness temperature can be discriminated.
For the analysis of the sub-band, all of the mean values of the sensitivity shown in the study are the same for the S-FFT-C method and the S-FFT-R method. In addition, they are also consistent with the sensitivity results obtained by both methods for a particular channel in the brightness temperature distinguishable range (Figures S1–S9).
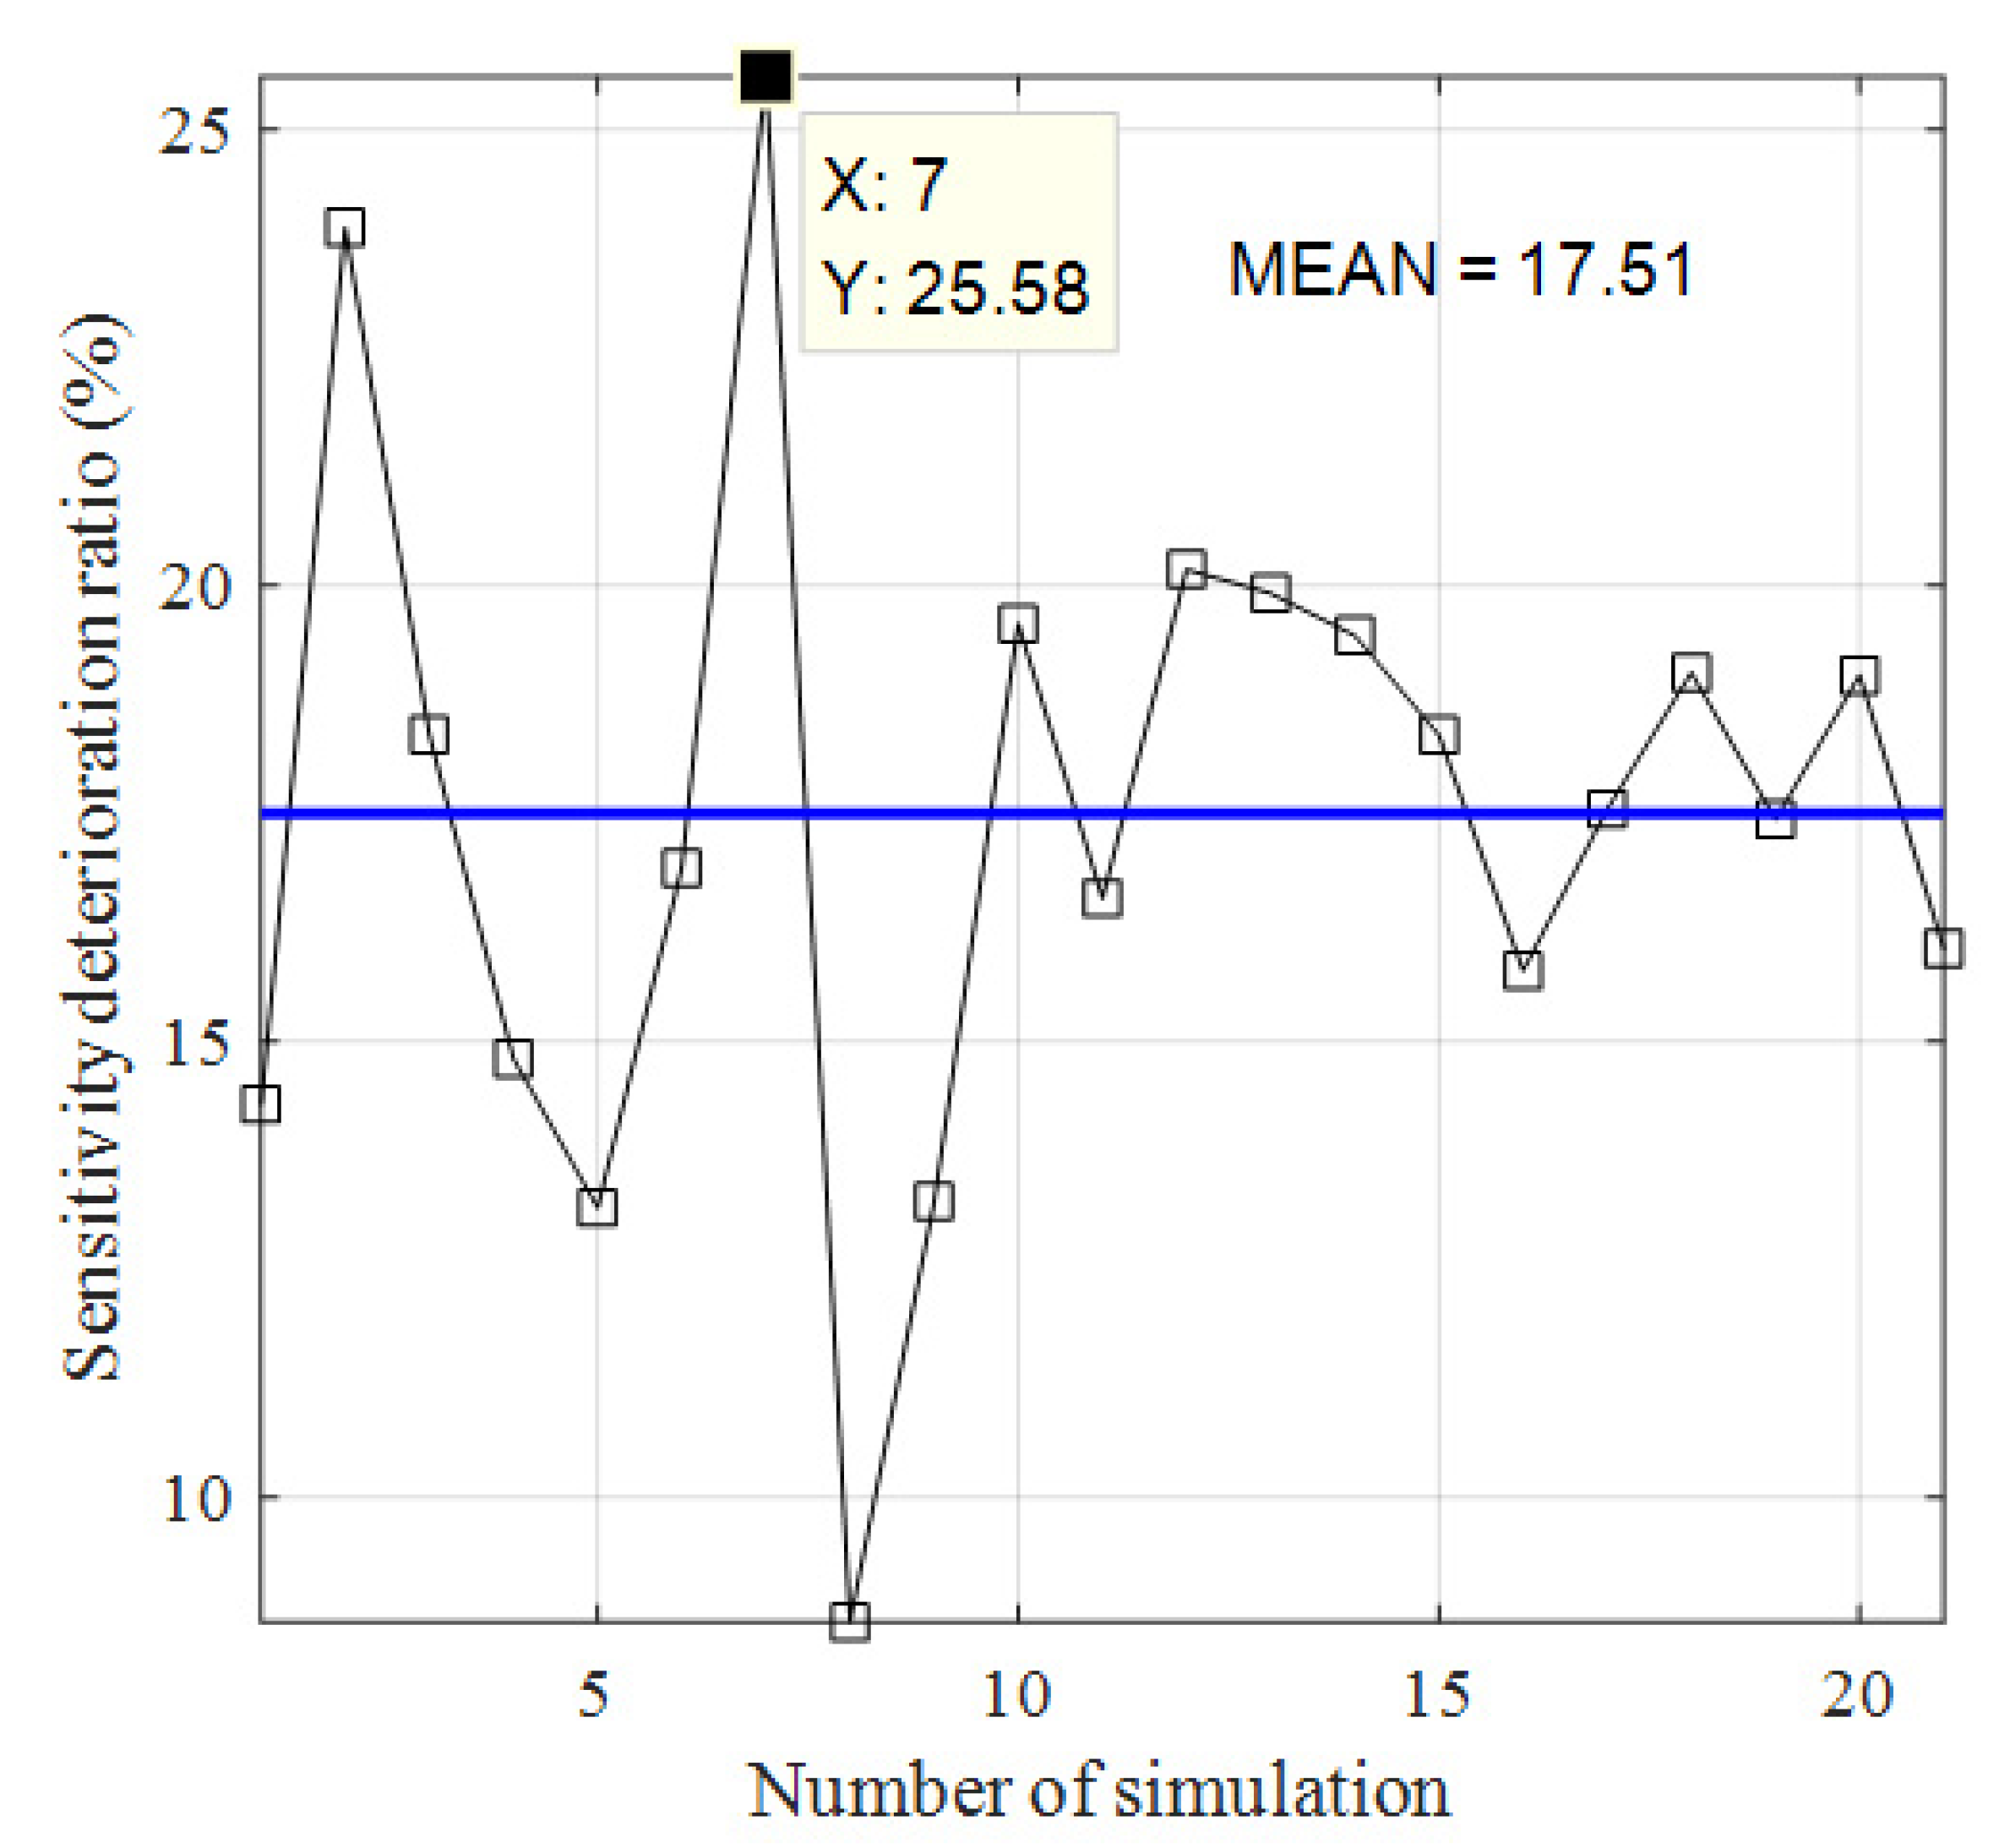
For different integration times, spectral resolutions, and quantization bits, the comparisons of the results of the actual sub-band sensitivity and the ideal sub-band sensitivity are visualized in Figure 12a, Figure 13a, and Figure 14a, respectively, from which the deterioration ratio of the sub-band sensitivity can be calculated as shown in Figure 12b, Figure 13b, and Figure 14b, respectively. Each sensitivity deterioration ratio for each parameter can be considered an independent simulation result. The sensitivity deterioration ratios obtained under all parameters were combined, as shown in Figure 15, which can be considered as the results of the sensitivity deterioration ratio obtained using the average values.
As can be seen in Figure 15, there was still no significant pattern in the deterioration ratio of the sub-band sensitivity when using the average values for simulation. Since the average value is a multiple averaging of the single values, the maximum sub-band sensitivity deterioration ratio (approximately 26% in Figure 15) obtained from the simulation using the average values was smaller than that (approximately 33% in Figure 11b) using the single values. This was because the averaging eliminates the influence of some chance factors. By averaging the 21 results in Figure 15, the mean value of the sub-band sensitivity deterioration was found to be approximately 18%.
It should be noted that the purpose of this study was to investigate the effect of the FFT algorithm on the system sensitivity by different methods. We only identified the results obtained by different methods as ideal or actual values to facilitate comparison and calculation, so it is reasonable that the results obtained after using different methods are slightly different. Considering the real sensitivity of the instrument, the sensitivity bias (e.g., 0.01 K in Table 4 or Table 6) in this research was of no effect.

5. Conclusions

TALIS is the first radiometer for limb sounding in China. The back end of TALIS consists of 11 digital spectrometers, and the core algorithm of the digital spectrometer is the radix 16 real-time complex FFT algorithm. In the system design process, the quantitative analysis of the factors affecting the TALIS system sensitivity is essential, which will have a very important reference value for the selection of system parameters.
In this paper, the digital back-end model is extended based on the TALIS system simulation model we established in the previous stage of this research. The sensitivity was obtained using the four different methods. Thus, the effect of the digital spectrometer FFT algorithm on the TALIS system sensitivity was demonstrated. In addition, the complementary analysis of the FFT algorithm on the system sensitivity was developed in terms of integration time, spectral resolution, and quantization bits for different parameters of the digital spectrometer.
ARTS was used to simulate the top-of-atmosphere brightness temperature at the nadir angle of TALIS, and it was used as the input of the TALIS system simulation model. The results of the power spectrum were obtained by sequentially going through the thermal radiation noise signal model, radiometer RF front-end model, and the radiometer digital back-end model. In the digital back-end model, the four methods of calculating sensitivity were defined as F-AC, F-FFT, S-Ideal, and S-FFT. The simulation results under the specific parameters of the digital spectrometer show that for the full-band, the sensitivity obtained by the F-AC method and the F-FFT method is the same in the distinguishable range of the brightness temperature. Therefore, the actual full-band sensitivity obtained after using the FFT algorithm in the digital spectrometer is consistent with the ideal full-band sensitivity of the TALIS system. For the sub-band, the digital spectrometer FFT algorithm lead to a deterioration of the actual sub-band sensitivity with a maximum value of approximately 33% after using the single values. The complementary analysis with different parameters shows that the ideal full-band sensitivity and the actual full-band sensitivity remained consistent, and the mean value of the deterioration ratio after using average values was found to be approximately 18%.
The study herein contributes to the pre-evaluation of the system design for TALIS. For the digital spectrometer, the preliminary effect analysis of the digital spectrometer FFT algorithm on the TALIS system sensitivity is also necessary. The TALIS system simulation model we established is still a model in its early stages. Although the digital back-end model has been enriched and extended in this paper, there are still many factors to be considered, such as the influence of antenna, gain fluctuation, etc. In the future, the TALIS system simulation model will be improved, and the reasons for the sub-band sensitivity deterioration caused by the digital spectrometer FFT algorithm will be analyzed.

Supplementary Materials

The following are available online at https://www.mdpi.com/article/10.3390/rs13152921/s1. Figures S1–S9 show the sensitivity obtained by the S-FFT-C method and the S-FFT-R method after one of the simulations for different integration time (0.5 ms, 10 ms, and 80 ms for Figures S1–S3, respectively), spectral resolutions (0.25 MHz, 2 MHz, and 16 MHz for Figure S4, Figure S5, Figure S6, respectively), and quantization bits (3-bit, 6-bit, and 12-bit for Figure S7, Figure S8, Figure S9, respectively).

Author Contributions

Conceptualization, Z.W. and H.L.; methodology, H.X.; software, W.W.; validation, H.X. and H.L.; writing—original draft preparation, H.X.; writing—review and editing, H.X., H.L., Z.W., and W.H. All authors have read and agreed to the published version of the manuscript.

Funding

This research was funded by the General Program of National Natural Science Foundation of China under grant number 4177012050.

Institutional Review Board Statement

Not applicable.

Informed Consent Statement

Not applicable.

Data Availability Statement

Not applicable.

Acknowledgments

The authors would like to thank the ARTS development teams for assistance configuring and running the model. ARTS can be downloaded at https://www.radiativetransfer.org/getarts/ (accessed date: 17 October 2020).

Conflicts of Interest

The authors declare no conflict of interest.

References

  1. Zhang, J.M.; Zhang, S.W. Scheme design of the K band spectrum analysis microwave radiometer. J. Terahertz Sci. Electron. Inf. Technol. 2013, 11, 747–752. [Google Scholar] [CrossRef]
  2. Zhao, Y.F.; Li, J. Development of Microwave Limb Sounder. Adv. Mater. Microw. Opt. 2012, 500, 204–211. [Google Scholar] [CrossRef]
  3. Wu, D.L.; Read, W.G.; Shippony, Z.; Leblanc, T.; Duck, T.J.; Ortland, D.A.; Sica, R.J.; Argall, P.S.; Oberheide, J.; Hauchecorne, A.; et al. Mesospheric temperature from UARS MLS: Retrieval and validation. J. Atmos. Sol. Terr. Phys. 2003, 65, 245–267. [Google Scholar] [CrossRef]
  4. Waters, J.W.; Read, W.G.; Froidevaux, L.; Jarnot, R.F.; Cofield, R.E.; Flower, D.A.; Lau, G.K.K.; Pickett, H.M.; Santee, M.L.; Wu, D.L.; et al. The UARS and EOS microwave limb sounder (MLS) experiments. J. Atmos. Sci. 1999, 56, 194–218. [Google Scholar] [CrossRef] [Green Version]
  5. Barath, F.T.; Chavez, M.C.; Cofield, R.E.; Flower, D.A.; Frerking, M.A.; Gram, M.B.; Harris, W.M.; Holden, J.R.; Jarnot, R.F.; Kloezeman, W.G.; et al. The Upper-Atmosphere Research Satellite Microwave Limb Sounder Instrument. J. Geophys. Res. Atmos. 1993, 98, 751–762. [Google Scholar] [CrossRef]
  6. Murtagh, D.; Frisk, U.; Merino, F.; Ridal, M.; Jonsson, A.; Stegman, J.; Witt, G.; Eriksson, P.; Jimenez, C.; Megie, G.; et al. An overview of the Odin atmospheric mission. Can. J. Phys. 2002, 80, 309–319. [Google Scholar] [CrossRef] [Green Version]
  7. Frisk, U.; Hagström, M.; Ala-Laurinaho, J.; Andersson, S.; Berges, J.-C.; Chabaud, J.-P.; Dahlgren, M.; Emrich, A.; Florén, H.-G.; Florin, G.; et al. The Odin satellite-I. Radiometer design and test. Astron. Astrophys. 2003, 402, L27–L34. [Google Scholar] [CrossRef] [Green Version]
  8. Olberg, M.; Frisk, U.; Lecacheux, A.; Olofsson, A.O.H.; Baron, P.; Bergman, P.; Florin, G.; Hjalmarson, A.; Larsson, B.; Murtagh, D.; et al. The Odin satellite-II. Radiometer data processing and calibration. Astron. Astrophys. 2003, 402, L35–L38. [Google Scholar] [CrossRef] [Green Version]
  9. Pickett, H.M. Microwave Limb Sounder THz module on Aura. IEEE Trans. Geosci. Remote Sens. 2006, 44, 1122–1130. [Google Scholar] [CrossRef]
  10. Jarnot, R.F.; Perun, V.S.; Schwartz, M.J. Radiometric and spectral performance and calibration of the GHz bands of EOS MLS. IEEE Trans. Geosci. Remote Sens. 2006, 44, 1131–1143. [Google Scholar] [CrossRef]
  11. Waters, J.W.; Froidevaux, L.; Harwood, R.S.; Jarnot, R.F.; Pickett, H.M.; Read, W.G.; Siegel, P.H.; Cofield, R.E.; Filipiak, M.J.; Flower, D.A.; et al. The Earth Observing System Microwave Limb Sounder (EOS MLS) on the Aura satellite. IEEE Trans. Geosci. Remote Sens. 2006, 44, 1075–1092. [Google Scholar] [CrossRef]
  12. Ochiai, S.; Kikuchi, K.-i.; Nishibori, T.; Manabe, T. Gain Nonlinearity Calibration of Submillimeter Radiometer for JEM/SMILES. IEEE J. Sel. Top. Appl. Earth Obs. Remote Sens. 2012, 5, 962–969. [Google Scholar] [CrossRef]
  13. Kikuchi, K.; Nishibori, T.; Ochiai, S.; Ozeki, H.; Irimajiri, Y.; Kasai, Y.; Koike, M.; Manabe, T.; Mizukoshi, K.; Murayama, Y.; et al. Overview and early results of the Superconducting Submillimeter-Wave Limb-Emission Sounder (SMILES). J. Geophys. Res. Atmos. 2010, 115, D23306. [Google Scholar] [CrossRef]
  14. Imai, K.; Manago, N.; Mitsuda, C.; Naito, Y.; Nishimoto, E.; Sakazaki, T.; Fujiwara, M.; Froidevaux, L.; von Clarmann, T.; Stiller, G.P.; et al. Validation of ozone data from the Superconducting Submillimeter-Wave Limb-Emission Sounder (SMILES). J. Geophys. Res. Atmos. 2013, 118, 5750–5769. [Google Scholar] [CrossRef] [Green Version]
  15. Villanueva, G.; Hartogh, P. The High Resolution Chirp Transform Spectrometer for the Sofia-Great Instrument. Exp. Astron. 2006, 18, 77–91. [Google Scholar] [CrossRef]
  16. Pointon, L. The Jodrell Bank 1024-channel digital autocorrelation spectrometer. J. Phys. E Sci. Instrum. 1977, 10, 833–837. [Google Scholar] [CrossRef]
  17. Muller, S.C.; Murk, A.; Monstein, C.; Kampfer, N. Intercomparison of Digital Fast Fourier Transform and Acoustooptical Spectrometers for Microwave Radiometry of the Atmosphere. IEEE Trans. Geosci. Remote Sens. 2009, 47, 2233–2239. [Google Scholar] [CrossRef]
  18. Zeng, C.; Han, Y.; Liu, B.; Sun, P.; Li, X.; Chen, P. Optical design of a high-resolution spectrometer with a wide field of view. Opt. Lasers Eng. 2021, 140. [Google Scholar] [CrossRef]
  19. De Miguel-Hernandez, J.; Hoyland, R.J.; Gomez Renasco, M.F.; Rubino-Martin, J.A.; Viera-Curbelo, T.A. A High-Sensitivity Fourier Transform Spectrometer for Cosmic Microwave Background Observations. IEEE Trans. Instrum. Meas. 2020, 69, 4516–4523. [Google Scholar] [CrossRef] [Green Version]
  20. Wang, W.Y.; Wang, Z.Z.; Duan, Y.Q. Preliminary Evaluation of the Error Budgets in the TALIS Measurements and Their Impact on the Retrievals. Remote Sens. 2020, 12, 468. [Google Scholar] [CrossRef] [Green Version]
  21. Benz, A.O.; Grigis, P.C.; Hungerbuhler, V.; Meyer, H.; Monstein, C.; Stuber, B.; Zardet, D. A broadband FFT spectrometer for radio and millimeter astronomy. Astron. Astrophys. 2005, 442, 767–773. [Google Scholar] [CrossRef] [Green Version]
  22. Stanko, S.; Klein, B.; Kerp, J. A field programmable gate array spectrometer for radio astronomy. Astron. Astrophys. 2005, 436, 391–395. [Google Scholar] [CrossRef] [Green Version]
  23. Iwai, K.; Kubo, Y.; Ishibashi, H.; Naoi, T.; Harada, K.; Ema, K.; Hayashi, Y.; Chikahiro, Y. OCTAD-S: Digital fast Fourier transform spectrometers by FPGA. Earth Planets Space 2017, 69, 95. [Google Scholar] [CrossRef] [Green Version]
  24. Emrich, A.; Andersson, S. Autocorrelation spectrometers for space borne (sub)millimetre spectroscopy. In Proceedings of the Submillimetre Far-infrared Space Instrumentation, Noordwijk, The Netherlands, 24–26 September 1996; pp. 257–260. [Google Scholar]
  25. Klein, B.; Philipp, S.D.; Krämer, I.; Kasemann, C.; Güsten, R.; Menten, K.M. The APEX digital fast Fourier transform spectrometer. Astron. Astrophys. 2006, 454, L29–L32. [Google Scholar] [CrossRef] [Green Version]
  26. Jiang, H.M.; Liu, H.; Guzzino, K.; Kubo, D.; Li, C.T.; Chang, R.; Chen, M.T. A 5 Giga Samples Per Second 8-Bit Analog to Digital Printed Circuit Board for Radio Astronomy. Publ. Astron. Soc. Pac. 2014, 126, 761–768. [Google Scholar] [CrossRef]
  27. Ebenezer, E.; Ramesh, R.; Subramanian, K.R.; SundaraRajan, M.S.; Sastry, C.V. A new digital spectrograph for observations of radio burst emission from the Sun. Astrophys 2001, 367, 1112–1116. [Google Scholar] [CrossRef]
  28. Duan, Y.; Wang, Z.; Xiao, Y.; Wang, W. Simulating Radiometric Resolution of Microwave Humidity and Temperature Sounder Onboard the FY-3D Satellite. IEEE Trans. Instrum. Meas. 2020, 69, 6582–6594. [Google Scholar] [CrossRef]
  29. Tian, M.; Zou, X.L.; Weng, F.Z. Use of Allan Deviation for Characterizing Satellite Microwave Sounder Noise Equivalent Differential Temperature (NEDT). IEEE Geosci. Remote Sens. Lett. 2015, 12, 2477–2480. [Google Scholar] [CrossRef]
  30. Klein, B.; Hochgurtel, S.; Kramer, I.; Bell, A.; Meyer, K.; Gusten, R. High-resolution wide-band fast Fourier transform spectrometers. Astron. Astrophys. 2012, 542, 1075. [Google Scholar] [CrossRef] [Green Version]
  31. Hagen, J.; Luder, A.; Murk, A.; Kampfer, N. Frequency-Agile FFT Spectrometer for Microwave Remote Sensing Applications. Atmosphere 2020, 11, 490. [Google Scholar] [CrossRef]
  32. Buehler, S.A.; Mendrok, J.; Eriksson, P.; Perrin, A.; Larsson, R.; Lemke, O. ARTS, the Atmospheric Radiative Transfer Simulator–version 2.2, the planetary toolbox edition. Geosci. Model Dev. 2018, 11, 1537–1556. [Google Scholar] [CrossRef] [Green Version]
  33. Wang, W.Y.; Wang, Z.Z.; Duan, Y.Q. Performance evaluation of THz Atmospheric Limb Sounder (TALIS) of China. Atmos. Meas. Tech. 2020, 13, 13–38. [Google Scholar] [CrossRef] [Green Version]
  34. Jordanov, V.T.; Knoll, G.F. Digital Synthesis of Pulse Shapes in Real-Time for High-Resolution Radiation Spectroscopy. Nucl. Instrum. Methods A 1994, 345, 337–345. [Google Scholar] [CrossRef] [Green Version]
  35. Shiunn-Jang, C.; Kuo-Jiann, C. An enhanced Fourier transform spectrometer with a search algorithm. IEEE Trans. Instrum. Meas. 1996, 45, 127–135. [Google Scholar] [CrossRef]
  36. Li, J.; Lu, D.-F.; Qi, Z.-M. A Modified Equation for the Spectral Resolution of Fourier Transform Spectrometers. J. Lightwave Technol. 2015, 33, 19–24. [Google Scholar] [CrossRef]
  37. Wang, W.Y. Simulation Study on Application for THz Atmospheric Limb Sounder. Ph.D. Thesis, University of Chinese Academy of Sciences, Beijing, China, 2020. [Google Scholar]
  38. Soref, R.A.; De Leonardis, F.; Passaro, V.M.N.; Fainman, Y. On-Chip Digital Fourier-Transform Spectrometer Using a Thermo-Optical Michelson Grating Interferometer. J. Lightwave Technol. 2018, 36, 5160–5167. [Google Scholar] [CrossRef]
  39. Duan, Y.; Wang, Z.; Xu, H.; Wang, W. Simulation of the Spectrum Response for the THz Atmosphere Limb Sounder (TALIS). Sensors 2020, 20, 498. [Google Scholar] [CrossRef] [PubMed] [Green Version]
  40. Jiang, H.; Yu, C.Y.; Kubo, D.; Chen, M.T.; Guzzino, K. A Low-cost 4 Bit, 10 Giga-samples-per-second Analog-to-digital Converter Printed Circuit Board Assembly for FPGA-based Backends. Publ. Astron. Soc. Pac. 2016, 128, 115002. [Google Scholar] [CrossRef]
  41. Yiu, P.; Iturbe, X.; Keymeulen, D.; Berisford, D.; Hand, K.; Carlson, R.; Wadsworth, W.; Dybwad, J.P.; Levy, R. Adaptive Controller for a Fourier Transform Spectrometer with Space Applications. In Proceedings of the 2015 IEEE Aerospace Conference, Big Sky, MT, USA, 7–14 March 2015. [Google Scholar]
  42. Teng, H.F.; Zhang, U.H.; Chiueh, T.H.; Wong, S.K.; Li, H.H.; Chen, Y.L. Ultrawideband 1-b Digital Spectrometer. IEEE Trans. Instrum. Meas. 2015, 64, 299–307. [Google Scholar] [CrossRef]
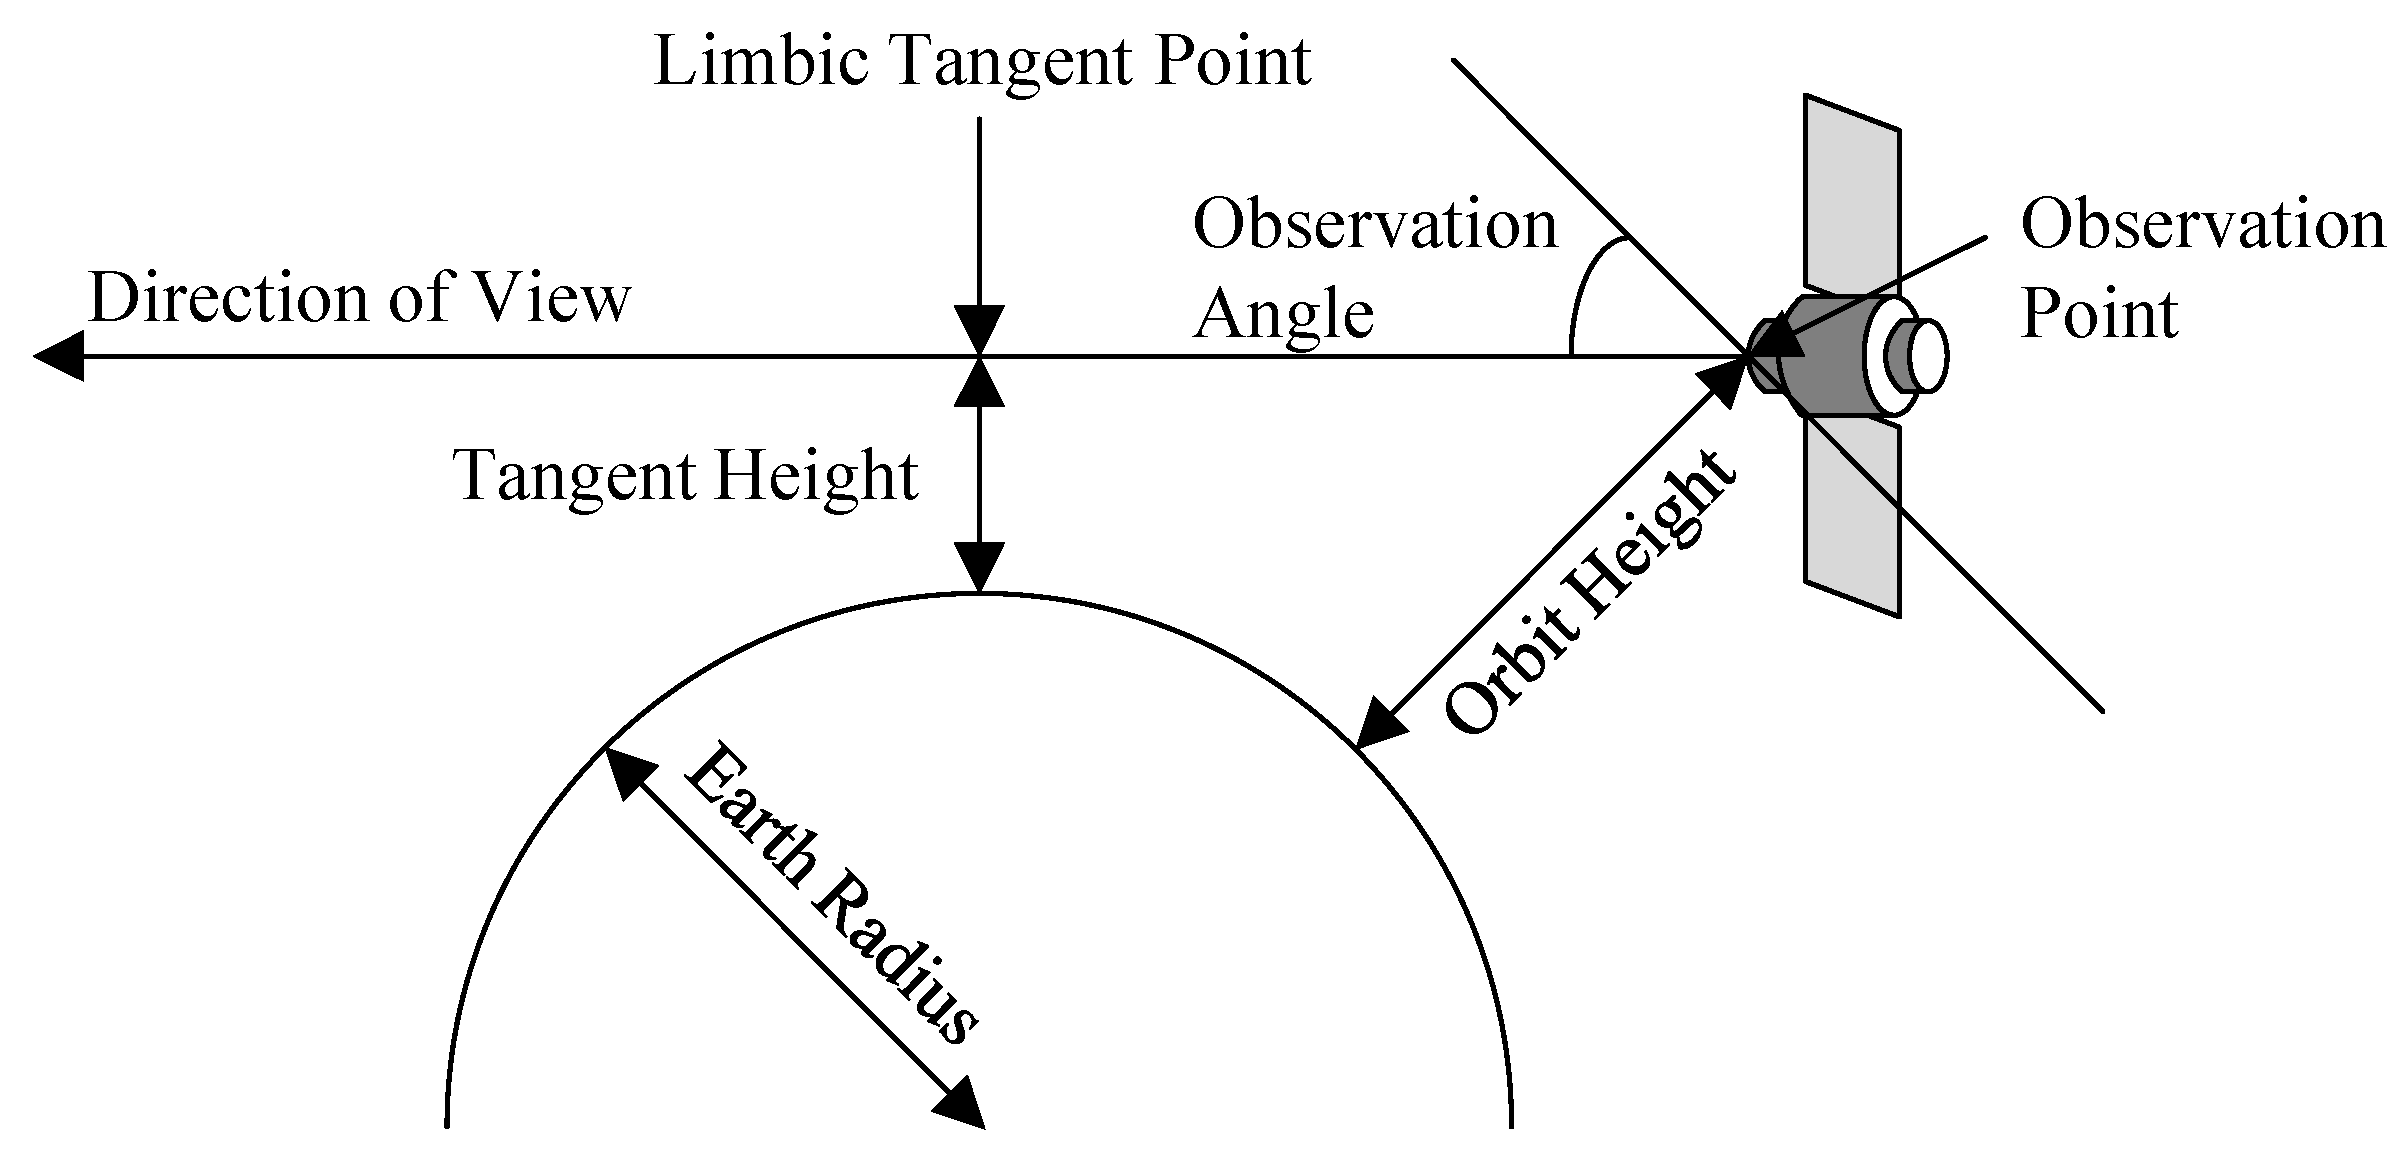
Figure 1. Schematic diagram of limb sounding with TALIS.
Remotesensing 13 02921 g001
Figure 2. The contributions of the main chemical species to the brightness temperature spectrum of near the 240-GHz band at the tangent height of 30 km.
Remotesensing 13 02921 g002
Figure 3. The simulation results of the number of channels and the information gain. The unit of information gain is expressed as “Kibibit,” abbreviated as “Kib,” and 1 Kib = 1024 bit. The larger the value of information gain, the larger the amount of information contained in the atmospheric spectrum.
Remotesensing 13 02921 g003
Figure 4. Simulated retrieval results of TALIS for CO with different spectral resolutions: (a) the absolute error of CO mixing ratio retrieval at spectral resolutions of 2 MHz, 4 MHz, and 8 MHz; (b) the relative error of CO mixing ratio retrieval at spectral resolutions of 2 MHz, 4 MHz, and 8 MHz. In the middle and upper atmosphere, the errors caused by the 2 MHz spectral resolution are smaller than those caused by the 4 MHz and 8 MHz spectral resolutions.
Remotesensing 13 02921 g004
Figure 5. The simulated brightness temperature spectrums of 640 GHz S10 for both sidebands at the tangent height of 30 km.
Remotesensing 13 02921 g005
Figure 6. The simulated SRF spectrums with 3 dB in-band fluctuations for both sidebands.
Remotesensing 13 02921 g006
Figure 7. The power spectrum after the integration time of 5 ms.
Remotesensing 13 02921 g007
Figure 8. Schematic diagram of two-point calibration.
Remotesensing 13 02921 g008
Figure 9. Output brightness temperature spectrum after system calibration.
Remotesensing 13 02921 g009
Figure 10. The sensitivity obtained by the S-FFT-C method and the S-FFT-R method after one of the simulations: (a) S-FFT-C method; (b) S-FFT-R method; (c) difference of sensitivity between the two methods for each channel.
Remotesensing 13 02921 g010
Figure 11. The sub-band sensitivity comparison and deterioration obtained by multiple simulations: (a) actual sub-band sensitivity and ideal sub-band sensitivity; (b) sub-band sensitivity deterioration ratio.
Remotesensing 13 02921 g011
Figure 12. The sub-band sensitivity comparison and deterioration obtained by different integration time: (a) actual sub-band sensitivity and ideal sub-band sensitivity; (b) sub-band sensitivity deterioration ratio.
Remotesensing 13 02921 g012
Figure 13. The sub-band sensitivity comparison and deterioration obtained by different spectral resolutions: (a) actual sub-band sensitivity and ideal sub-band sensitivity; (b) sub-band sensitivity deterioration ratio.
Remotesensing 13 02921 g013
Figure 14. The sub-band sensitivity comparison and deterioration obtained by different quantization bits: (a) actual sub-band sensitivity and ideal sub-band sensitivity; (b) sub-band sensitivity deterioration ratio.
Remotesensing 13 02921 g014
Figure 15. The sensitivity deterioration ratio obtained from varying the parameters of integration time, spectral resolution, and quantization bits. According to Figure 12b, Figure 13b, and Figure 14b, we considered the 7 different sensitivity deterioration results under each parameter as 7 complete simulation results. We combined the three parameters for a total of 21 different cases to obtain the 21 simulations in Figure 15.
Remotesensing 13 02921 g015
Table 1. Limitations of the spectrometers used in MLSs.
Spectrometer TypeLimitation
FBSPoor channel consistency and frequency crosstalk
DACSConsumes large amounts of digital resources
AOSLarge size, complex structure, not easy to integrate
CTSNarrow bandwidth
AACSLow system stability and few channels
Table 2. The parameter comparison of FFTS in TALIS with the spectrometers in other MLSs.
PayloadSpectrometer TypeMaximum BandwidthSpectral Resolution
UARS-MLSFBS510 MHz2–128 MHz
Odin-SMRDACS, AOS1.2 GHz0.15–1 MHz
EOS-MLSFBS, DACS1.3 GHz0.1–500 MHz
JEM/SMILESAOS1.3 GHz1.4 MHz
TALISFFTS2 GHz2.3 MHz
Table 3. The parameters of TALIS.
Radiometer (GHz)System Noise Temperature (K)Spectral Band (GHz)
1181000S1: 115.35–117.35, 117.75–119.75
1901000S2: 175.50–177.50, 202.70–204.70
S3: 178.90–180.90, 199.30–201.30
S4: 183.00–185.00, 195.20–197.20
2401000S5: 229.66–231.66, 247.66–249.66
S6: 232.16–234.16, 245.16–247.16
S7: 234.66–236.66, 242.66–244.66
6402300S8: 624.47–626.47, 659.27–661.27
S9: 627.37–629.37, 656.37–658.37
S10: 632.37–634.37, 651.37–653.37
S11: 634.87–636.87, 648.87–650.87
Table 4. The sensitivity of the four methods obtained from simulations.
Number of SimulationF-AC Method (K)F-FFT Method (K)S-Ideal Method (K)S-FFT Method
S-FFT-C Method (K)S-FFT-R Method (K)
10.330.3410.5514.8714.87
20.400.4012.6915.0115.01
30.440.4313.7715.0615.06
40.450.4514.2415.1515.15
50.360.3511.2015.1015.10
60.380.3811.8715.1015.10
70.340.3410.9015.0715.07
80.320.3110.0214.8814.88
90.360.3611.3915.0415.04
100.420.4113.1614.9814.98
Average0.380.3811.9815.0315.03
Table 5. The average values of the sensitivity obtained by different integration time.
Sensitivity MethodSensitivity TypeSensitivity under Different Integration Time (K)
0.5 ms1 ms5 ms10 ms20 ms50 ms80 ms
F-AC-AVRIdeal full-band1.290.810.390.290.210.120.09
F-FFT-AVRActual full-band1.290.810.390.290.210.120.09
S-Ideal-AVRIdeal sub-band40.7525.5912.249.066.533.952.79
S-FFT-C-AVR
S-FFT-R-AVR
Actual sub-band47.5633.6414.9910.647.524.753.75
47.5633.6414.9910.647.524.753.75
Table 6. The average values of the sensitivity obtained by different spectral resolutions.
Sensitivity MethodSensitivity TypeSensitivity under Different Spectral Resolutions (K)
0.25 MHz0.5 MHz1 MHz2 MHz4 MHz8 MHz16 MHz
F-AC-AVRIdeal full-band0.160.210.280.410.560.781.12
F-FFT-AVRActual full-band0.160.210.280.410.550.781.12
S-Ideal-AVRIdeal sub-band14.1513.4612.4912.9712.4512.3912.57
S-FFT-C-AVR
S-FFT-R-AVR
Actual sub-band15.4915.5215.5315.5515.6015.4715.60
15.4915.5215.5315.5515.6015.4715.60
Table 7. The average values of the sensitivity obtained by different quantization bits.
Sensitivity MethodSensitivity TypeSensitivity under Different Quantization Bits (K)
3-bit4-bit5-bit6-bit8-bit10-bit12-bit
F-AC-AVRIdeal full-band0.380.370.390.380.390.400.39
F-FFT-AVRActual full-band0.380.370.390.380.390.400.39
S-Ideal-AVRIdeal sub-band11.9711.7812.2412.0912.4212.6912.31
S-FFT-C-AVR
S-FFT-R-AVR
Actual sub-band14.2614.5414.8214.9315.0615.0615.08
14.2614.5414.8214.9315.0615.0615.08
Publisher’s Note: MDPI stays neutral with regard to jurisdictional claims in published maps and institutional affiliations.