Article

Unoccupied Aircraft Systems (UASs) Reveal the Morphological Changes at Stromboli Volcano (Italy) before, between, and after the 3 July and 28 August 2019 Paroxysmal Eruptions

1
Istituto Nazionale di Geofisica e Vulcanologia, Sezione Roma 1, 00143 Roma, Italy
2
Istituto Nazionale di Geofisica e Vulcanologia, Sezione di Catania-Osservatorio Etneo, 95125 Catania, Italy
3
Lamont-Doherty Earth Observatory, Columbia University, New York, NY 10964, USA
4
Department of Geosciences, Boise State University, Boise, ID 83706, USA
5
Department of Earth and Environmental Sciences, Ludwig-Maximilians-Universität (LMU), 80333 Munich, Germany
6
GEOMAR Helmholtz Centre for Ocean Research, 24148 Kiel, Germany
*
Author to whom correspondence should be addressed.
Now at: United States Geological Survey, Hawaiian Volcano Observatory, Hilo, HI 96720, USA.
Now at: Soft Strategy Bit Group S.p.A., 00154 Rome, Italy.
Remote Sens. 2021, 13(15), 2870; https://doi.org/10.3390/rs13152870
Submission received: 31 May 2021 / Revised: 17 July 2021 / Accepted: 19 July 2021 / Published: 22 July 2021

Abstract

:
In July and August 2019, two paroxysmal eruptions dramatically changed the morphology of the crater terrace that hosts the active vents of Stromboli volcano (Italy). Here, we document these morphological changes, by using 2259 UAS-derived photographs from eight surveys and Structure-from-Motion (SfM) photogrammetric techniques, resulting in 3D point clouds, orthomosaics, and digital surface models (DSMs) with resolution ranging from 8.1 to 12.4 cm/pixel. We focus on the morphological evolution of volcanic features and volume changes in the crater terrace and the upper part of the underlying slope (Sciara del Fuoco). We identify both crater terrace and lava field variations, with vents shifting up to 47 m and the accumulation of tephra deposits. The maximum elevation changes related to the two paroxysmal eruptions (in between May and September 2019) range from +41.4 to −26.4 m at the lava field and N crater area, respectively. Throughout September 2018–June 2020, the total volume change in the surveyed area was +447,335 m3. Despite Stromboli being one of the best-studied volcanoes worldwide, the UAS-based photogrammetry products of this study provide unprecedented high spatiotemporal resolution observations of its entire summit area, in a period when volcanic activity made the classic field inspections and helicopter overflights too risky. Routinely applied UAS operations represent an effective and evolving tool for volcanic hazard assessment and to support decision-makers involved in volcanic surveillance and civil protection operations.

Graphical Abstract

1. Introduction

Volcanoes are highly dynamic geomorphological features that shape the landscape through eruptions and erosional processes, both on a short- and long-term time scale (hours to tens of thousands of years). The topography of active volcanic areas represents the direct (lava flows, fallout deposits, pyroclastic density currents) or indirect (lahar, landslides, collapses) expression of eruptive activity. For this reason, observing volcanic activity and resolving morphological changes on active volcanoes through time is key to understanding active volcanic processes.
The latter are monitored and quantified with a variety of techniques, including ground-based surveys and imagery collected by satellites and crewed aerial platforms e.g., [1,2,3,4,5,6,7,8,9,10]. The last ten years have seen a very rapid increase in the application and use of Unoccupied Aircraft Systems (UASs) as a platform for aerial observation and data acquisition [11,12]. Moreover, advances in the field of computer vision have also yielded software capable of extracting 3D topography from multiple 2D images in a process called Structure-from-Motion (SfM), e.g., [13].
When coupled with SfM, UASs provide several advantages over ground-based, satellite, and crewed aircraft surveys. These advantages include the following: (1) limited operating costs and rapid deployment allowing frequent, repeated surveys; (2) low altitude flight operations for acquiring data at centimeter-scale resolutions and allowing for a close and detailed observation of the volcanic activity up to the eruptive vents; (3) automated mission planning and flight operation for consistent datasets; and (4) remote measurements of hazardous environments with personnel able to remain at safe locations (or at least at a greater distance compared to classic routine field inspections for hazard assessment).
The joint UAS–photogrammetry approach has been successfully applied for topographic imaging of volcanic areas in several studies e.g., ([14,15,16,17]; for an extensive review see [12]). Darmawan et al. [18] investigated the topographic and structural changes (growth of fracture networks and excavated volume associated with phreatic explosions) at the Merapi lava dome (Indonesia) by comparing the close-range photogrammetric data obtained before and after the 2012–2014 eruptions. An interesting study by Carr et al. [1] shows how the SfM photogrammetry allows for the calculation of the lava flow volume and long-term average effusion rate, as well as documenting the changes in flow morphology and monitoring the development of gravitational instabilities in Sinabung volcano (Indonesia). Recently, Zorn et al. [19] presented the results of repeated UAS–SfM photogrammetry survey flights with both optical and thermal cameras at the Caliente lava dome (part of the Santiaguito complex at Santa Maria volcano, Guatemala) to create topography data and orthophotos of the lava dome. This enabled the authors to remotely assess and characterize a lava dome and lava flow, gaining insight on flow velocities, extrusion rates, surface strain, lava viscosity, and temperature anomalies over different time periods. Moreover, Andaru et al. [20] shows the essential role of multi-temporal unmanned aerial vehicle (UAV) images in the monitoring of Mt. Agung’s lava dome, and in determining the areas of potential lahar hazards during the crisis between 2017 and 2019. The authors combined image enhancement, machine learning, and photogrammetry to improve the image quality, remove point cloud outliers, and generate digital terrain models (DTMs) and orthoimages. The obtained qualitative and quantitative data highlight the changes inside the crater and on the surrounding slopes of the volcano.
Stromboli volcano in Italy is one of the most active volcanoes in the world, characterized by the persistence of impulsive, low-to-moderate energy explosions occurring at the minutes-to-hours scale at a crater terrace (750 m a.s.l.), sometimes interrupted by high energy explosions occurring at the year-to-decade scale e.g., [21] and references therein. Depending on the size of the explosion, the location, shape, and number of active vents inside the crater terrace can vary strongly, or the entire morphology of the crater terrace can be affected. Episodically, lava flows descend from the summit or fissures that open in the Sciara del Fuoco (hereafter SdF), a depression that occupies the N steep side of the volcano extending from the crater terrace itself to approximately 2000 m below sea level, also continuously affected by the fallout of explosive products.
On 3 July and 28 August 2019, two paroxysms occurred and disrupted the entire island, heavily changing the morphology of the crater terrace (Figure 1). Recently, Schmid et al. [22] analyzed the topographic changes that occurred within the crater terrace of Stromboli between May 2019 and January 2020, focusing on vent geometries and their control on the directionality of explosions, ultimately contributing to dynamically defining risk areas at Stromboli’s summit.
Here, based on the high-resolution SfM topographic models extracted from UAS imagery collected prior, during, and after the paroxysmal eruptions, we present high spatial and temporal resolution variations of the summit area morphology of Stromboli and estimate the volume changes for the investigated period. Volume change estimation and elevation difference maps permitted the identification of changes in terms of the distribution and shifting of the vents within the crater terrace and toward the SdF, as well as the accumulation of material in the upper SdF. The above-mentioned factors are very relevant on steep-slope volcanoes and have significant implications for hazard assessment.

2. Approaches and Methods

2.1. Volcanic Activity and the 2019 Paroxysmal Eruptions

Stromboli volcano, the easternmost island of the Aeolian Islands in southern Italy, is well known for its Strombolian, persistent low-energy, and short-lived explosive activity occurring with a time interval ranging from seconds to minutes from multiple vents located within the summit crater terrace [23,24,25]. This characteristic activity is accompanied by lava flows at intervals of a few weeks (lava overflows) to a few years and, occasionally, is interrupted by discrete, more violent explosive events. The violent explosions are classified as major explosions and paroxysms, or called small-scale and large-scale paroxysms, respectively [26,27,28]. Small-scale paroxysms usually eject decimeter-sized blocks and bombs in the upper part of the volcano for a few minutes, associated with moderate ash and lapilli fallout at greater distances, e.g., [26]. Conversely, the large-scale paroxysms last up to several minutes, feeding vertical columns of gas, scoriae, lithics, and pumices that rise up to 10 km and launch meter-sized ballistics up to 2–3 km from the vent e.g., [21,23,29].
The main morphological changes currently affecting Stromboli are confined to the crater terrace and the SdF. Both regions are the expression of a structural instability linked to volcano-tectonic seismicity. Here, oversteepening and displacement due to dyke intrusions are common, as is erosion due to both climatic and sea effects [30]. Moreover, the persistent volcanic activity of Stromboli produces highly dynamic and rapid morphological changes that involve the emplacement and possibly partial erosion of fall, lava flow, and pyroclastic density current deposits, the building or collapse of craters, hornitos, and the onset of sector collapses or landslides [31,32].
From September 2018 to mid-January 2019, the volcanic activity was characterized by Strombolian explosions with the daily average hourly explosive frequency (HEF) ranging between 10 and 30, but it was usually higher than 15 explosions/h. This frequency corresponds to “medium to very high”, according to the INGV-OE current classification of the explosive activity at Stromboli (weekly reports at https://www.ct.ingv.it/index.php/monitoraggio-e-sorveglianza/prodotti-del-monitoraggio/bollettini-settimanali-multidisciplinari, accessed on 20 July 2021). In the following months, the frequency values dropped on average to medium-high and reached a low HEF in early June 2019. During our surveys, in particular, the activity was characterized by high frequency but medium intensity in September 2018, and both frequency and intensity in the medium ranges in May 2019. On 9 June 2019, a more sustained activity resumed with a high HEF, and explosions characterized by a high to very high intensity. This more energetic activity culminated, on 25 June, with a major explosion that involved the central area [33,34].
The activity maintained very high frequency and intensity levels until, a few days later, the first paroxysm (3 July 2019) deeply disrupted the crater terrace and part of the upper portion of the SdF (Figure 1). This event involved both the north (hereafter N) and the central-south (hereafter CS) crater areas [27,34,35,36,37,38,39]. The paroxysmal eruption generated an eruptive plume rising 6–8 km above the island’s summit (924 m a.s.l., Vancori peak) [34,38], while the incandescent pyroclasts set fire to vegetation on the flanks of the volcano, resulting in a fire-damaged area of 39% of the total area of the island [40] and about 70% of the vegetated areas. Volcanic products from the laterally directed explosions and the collapse of the external crater terrace generated two pyroclastic currents that travelled down the SdF and then advanced on the sea for about 1 km from the coastline, generating a tsunami with a maximum wave height of ~40 cm [41].
The 3 July paroxysm caused the destruction of all the monitoring instruments located in the summit area, including the cameras on Pizzo, representing the only site from where the observation of the crater terrace can be directly performed. Therefore, after the first paroxysm, a visual observation of the crater terrace has only been provided by volcanologists and volcanological guides in the form of ground-acquired photos and videos, by volcanologists during sporadic helicopter overflights and by UASs.
Between 3 July and 30 August, the eruptive activity was characterized by lava flows that extended down the southern sector of the SdF and reached between 500 and 200 m a.s.l. [42] and by very strong and frequent Strombolian activity at a set of small scoria cones, particularly in the N crater area. In addition, gravel flows were continuously generated in the southern and lower sector of the steep-sided SdF by the accumulation of material coming from rockfalls at the lava flow front.
On 28 August 2019, the second paroxysmal eruption occurred, again modifying the morphology of the summit area and producing an eruptive column estimated up to 6 km above the summit [27,38,39,43,44,45]. Pyroclasts from the eruption and debris from the collapsed rim of the CS area contributed to the generation of a pyroclastic current that again travelled down the SdF and out to sea.
In the following days, the explosions were still very frequent and energetic, producing rapid, significant changes within the crater terrace, and emplacing a continuous accumulation of volcanic products (tephra and lavas). However, while the effusive activity stopped after two days, the explosive activity remained high to very high up to mid-September, and then started to gradually decline. Afterward, the eruptive activity evolved toward low-medium level Strombolian explosions, interrupted on 18 January and 3 February 2020 by lava overflows within the SdF from the N sector of the crater terrace and between 28 March and 1 April 2020, when lava overflows, originating in the same sector, triggered pyroclastic density currents down the SdF [46].

2.2. Data Collection and Processing

To document morphological changes in the summit area before and after the paroxysmal eruptions, we conducted eight photographic survey campaigns (Figure 2 and Table 1) between 12 September 2018 and 20 June 2020, collecting multiple sets of UAS-based images to build photogrammetric models of the crater terrace and its surroundings. We collected over 2200 aerial images using a DJI Mavic 2 Pro UAS with a 1″ CMOS 20MP sensor and a 28-mm (35-mm equivalent) focal length lens, with the exception of the September 2018 survey, where the data were collected with a DJI M210-X4S (Table 1).
With respect to other terrains, several additional difficulties characterize aerial photographic survey campaigns at Stromboli. The summit area has a highly irregular topography, characterized by notched craters and slopes, hosting several open or (partially) clogged vents of variable shape and aspect ratio. In addition, viewing conditions at Stromboli are often limited by the presence of vapor/gas/ash plumes, and, at times, by atmospheric haze and clouds. Furthermore, the persistent ordinary volcanic activity ejects very frequently (at the minute scale) and almost unpredictably, lapilli to bomb-sized pyroclasts to a height of up to 200 m, making the flight of the UAS itself unsafe.
Due to both volcanic activity and visibility conditions, we conducted predefined flight missions only in May 2019 and June 2020, whereas for the remaining missions we conducted manual flight operations to be able to avoid gas or ash plumes as well as pyroclastic ejecta from explosions. The September 2018, May 2019, and June 2020 surveys started from Pizzo (918 m a.s.l.), the June and November 2019 and January 2020 surveys started from the shelters of Roccette (780 m a.s.l.), whereas the August and September 2019 surveys started at 400 and 300 m a.s.l., respectively, due to safety reasons and to the restrictions issued by local and National Civil Protection authorities because of the volcanic activity.
During the August and November 2019 surveys, active vents and fumaroles constantly emitted plumes of ash, gas, and vapor, limiting the detail captured in the photographs and precluding conventional nadir-viewing aerial surveys as well as views from multiple angles. Moreover, in August 2019, the ash plume generated by gravel flows and rockfalls along the SdF, originated by the lava flows in the upper SdF, further prevented ideal conditions for image acquisition. As a result, the August 2019 survey lacks some portions of the crater terrace, and the November 2019 survey is restricted to the lava field area.
Following image collection, we culled the photoset, removing images dominated by the presence of the plume and ash from explosions, as well as dark and/or blurry photos. We then processed the acquired georeferenced images using the Agisoft Metashape® software package (version 1.5.1–1.6.3) based on the Structure-from-Motion and multi-view stereo photogrammetry algorithm (SfM–MVS) [13]. The workflow of our photogrammetric analysis included the following: (1) manual image masking for areas with strong degassing, areas covered by ash from explosions and/or unnecessary background; (2) camera triangulation with image position and orientation and generation of sparse point cloud; (3) filtering of the sparse point cloud to remove points with bad geometry, large pixel matching errors, and large pixel residual errors; (4) generation of dense points clouds; (5) point clouds alignment; and (6) generation of orthomosaics and DSMs. We set each survey’s processing parameters in Agisoft Metashape® to high for photo alignment accuracy and high quality and aggressive depth filtering for dense point cloud quality (see also Table S1). In the case of the 4–5 August 2019 survey, poor visibility prevented complete alignment of the photos. The 3D point clouds were manually cleaned by removing anomalous floating points caused by the presence of the volcanic plume.
Accurately measured control points to scale and georeference the SfM point clouds and the derived DSMs are not available in the Stromboli crater terrace area due to the persistent, and sometimes violent, volcanic activity. Therefore, the surveys were initially scaled and georeferenced using GNSS information embedded in the image metadata. As it was not possible to acquire GCPs for absolute positioning in the Stromboli crater terrace, we further improved the spatial accuracy of our georeferenced 3D point clouds using the Cloud Compare open-source software (http://www.danielgm.net/cc/, accessed on 20 July 2021). In Cloud Compare, using 12 visually identifiable control points located in unchanged areas of the volcano (Figure S1), we selected the “align” tool to perform a rigid-body transformation and align the unchanged portions of the point cloud derived from the September 2018 survey to a point cloud derived from a 2012 0.5-m LiDAR digital elevation model (DEM) of Stromboli [48]. Subsequently, we aligned all the remaining point clouds to the September 2018 point cloud. This method is useful in aligning point clouds quite precisely and proved to be a superior method with respect to a global alignment using the iterative closest point (ICP) method [49], especially if the clouds to be aligned have great differences over large extents. The root mean square (RMS) error for each model alignment ranged from 0.17 to 0.77 m (see Supplementary Table S2).
Following processing and registration of the dataset, we converted our point clouds into DSMs using the DEM generation tool in Agisoft Metashape® (inverse-distance weighting method). In total, we generated 7 DSMs and 6 orthomosaics of the crater terrace along with 1 DSM and 1 orthomosaics of the lava flow area (Figure 3, Figure S2 and Table 1). We generated the DSMs with the default recommended resolution, which varies between 0.08 and 0.12 m, whereas the orthomosaics were generated with a resolution of 0.05 m. We then exported our DSMs to a 0.15-m pixel size and imported the DSMs and orthomosaics of each of the surveys into ArcGIS Pro to identify, map, and measure the crater terrace morphological features.
Errors in our point clouds and DSMs result from a complex interplay of factors such as camera shutter speed and exposure settings, lens specifications, camera calibrations applied, flight design (e.g., flight-line geometry and altitude), ground sample distance, photograph overlap, and disturbances from volcanic activity. We therefore applied several strategies to mitigate errors, among which the most important were the following: (1) the use of fast (>1/400 s) camera shutter speeds (i.e., exposure times) whenever possible, (2) the variation of flight altitudes and camera orientation, (3) the application of best practices for processing in Agisoft Metashape, e.g., [13,50], and (4) the removal of sparse cloud points with large uncertainty via Photoscan’s gradual selection tools.
We observed some systematic errors when comparing models of September 2019 with both May 2019 and August 2019. These errors are probably related to some general limitations of the SfM reconstruction on the margins of the September 2019 photogrammetric model (e.g., the negative elevation difference values to the south of the lava field in Figure 4c and the diffuse negative elevation difference values in the SdF sector—Figure 4d), where a lesser degree of image overlap decreases the accuracy of the model. Nevertheless, the central part of the model, our area of interest common to all surveys (dashed and dotted polygons in Figure 5), is practically unaffected by this error.
We use the residual elevation differences with respect to the DSM of 12 September 2018 extracted at 6 checkpoints placed in the unchanged regions of our DSMs as the indication of the vertical error, which ranges from 0.19 and 0.96 m, with an average value of 0.53 m (Table S5 and Figure S1). Our models are, thus, sufficiently precise for the scale of changes measured in this study.

2.3. DEMs of Difference and Volume Calculations

The SfM–MVS-derived DSMs obtained before and after the two paroxysms were used to investigate changes in topography at the summit areas of Stromboli volcano. By subtracting the pre-eruption DSM from our DSMs in the crater terrace, we provide quantitative information about changes in height and volumetric losses or gains. We used the freely available Geomorphic Change Detection (GCD) plugin for ArcGIS (see http://gcd.riverscapes.xyz/, accessed on 20 July 2021) to create the DEMs of Difference (DoD) and calculate height and volumetric change results.
The 11 May 2019 DSM was used as pre-paroxysm surface, whereas the 4–5 August 2019 DSMs and 23 September 2019 DSMs were used as post-eruption surfaces for the 3 July and 28 August paroxysms, respectively. The 20 June 2019 DSM represents the most recent pre-paroxysm surface, but it was not used in the DoD calculation due to its smaller extent in comparison with the other DSMs.
We exported all DSMs to a 0.25-m pixel size and then defined an Area of Interest (AOI) for each time interval, to control the regions within our data that are considered during change detection analyses. Taking into account the average vertical error of 0.53 m for our models, we set the threshold elevation change (minimum level of detection or minimum elevation change that can confidently be considered a true change) to 0.5 m.
The GCD plugin produced data output files containing topographic change information, including thresholded and non-thresholded areas and volumetric changes, as well as estimated errors for each calculation (Tables S3 and S4). Presented volume estimates have an average error of, e.g., +/− 10%.

3. Results

The availability of multitemporal SfM-derived DSMs allowed us to monitor the topographic and morphological changes before, between, and after the paroxysms. The morphology of the crater terrace area is well represented by all the datasets and the comparison between the multitemporal DSMs reflects new changes caused by the volcanic activity.

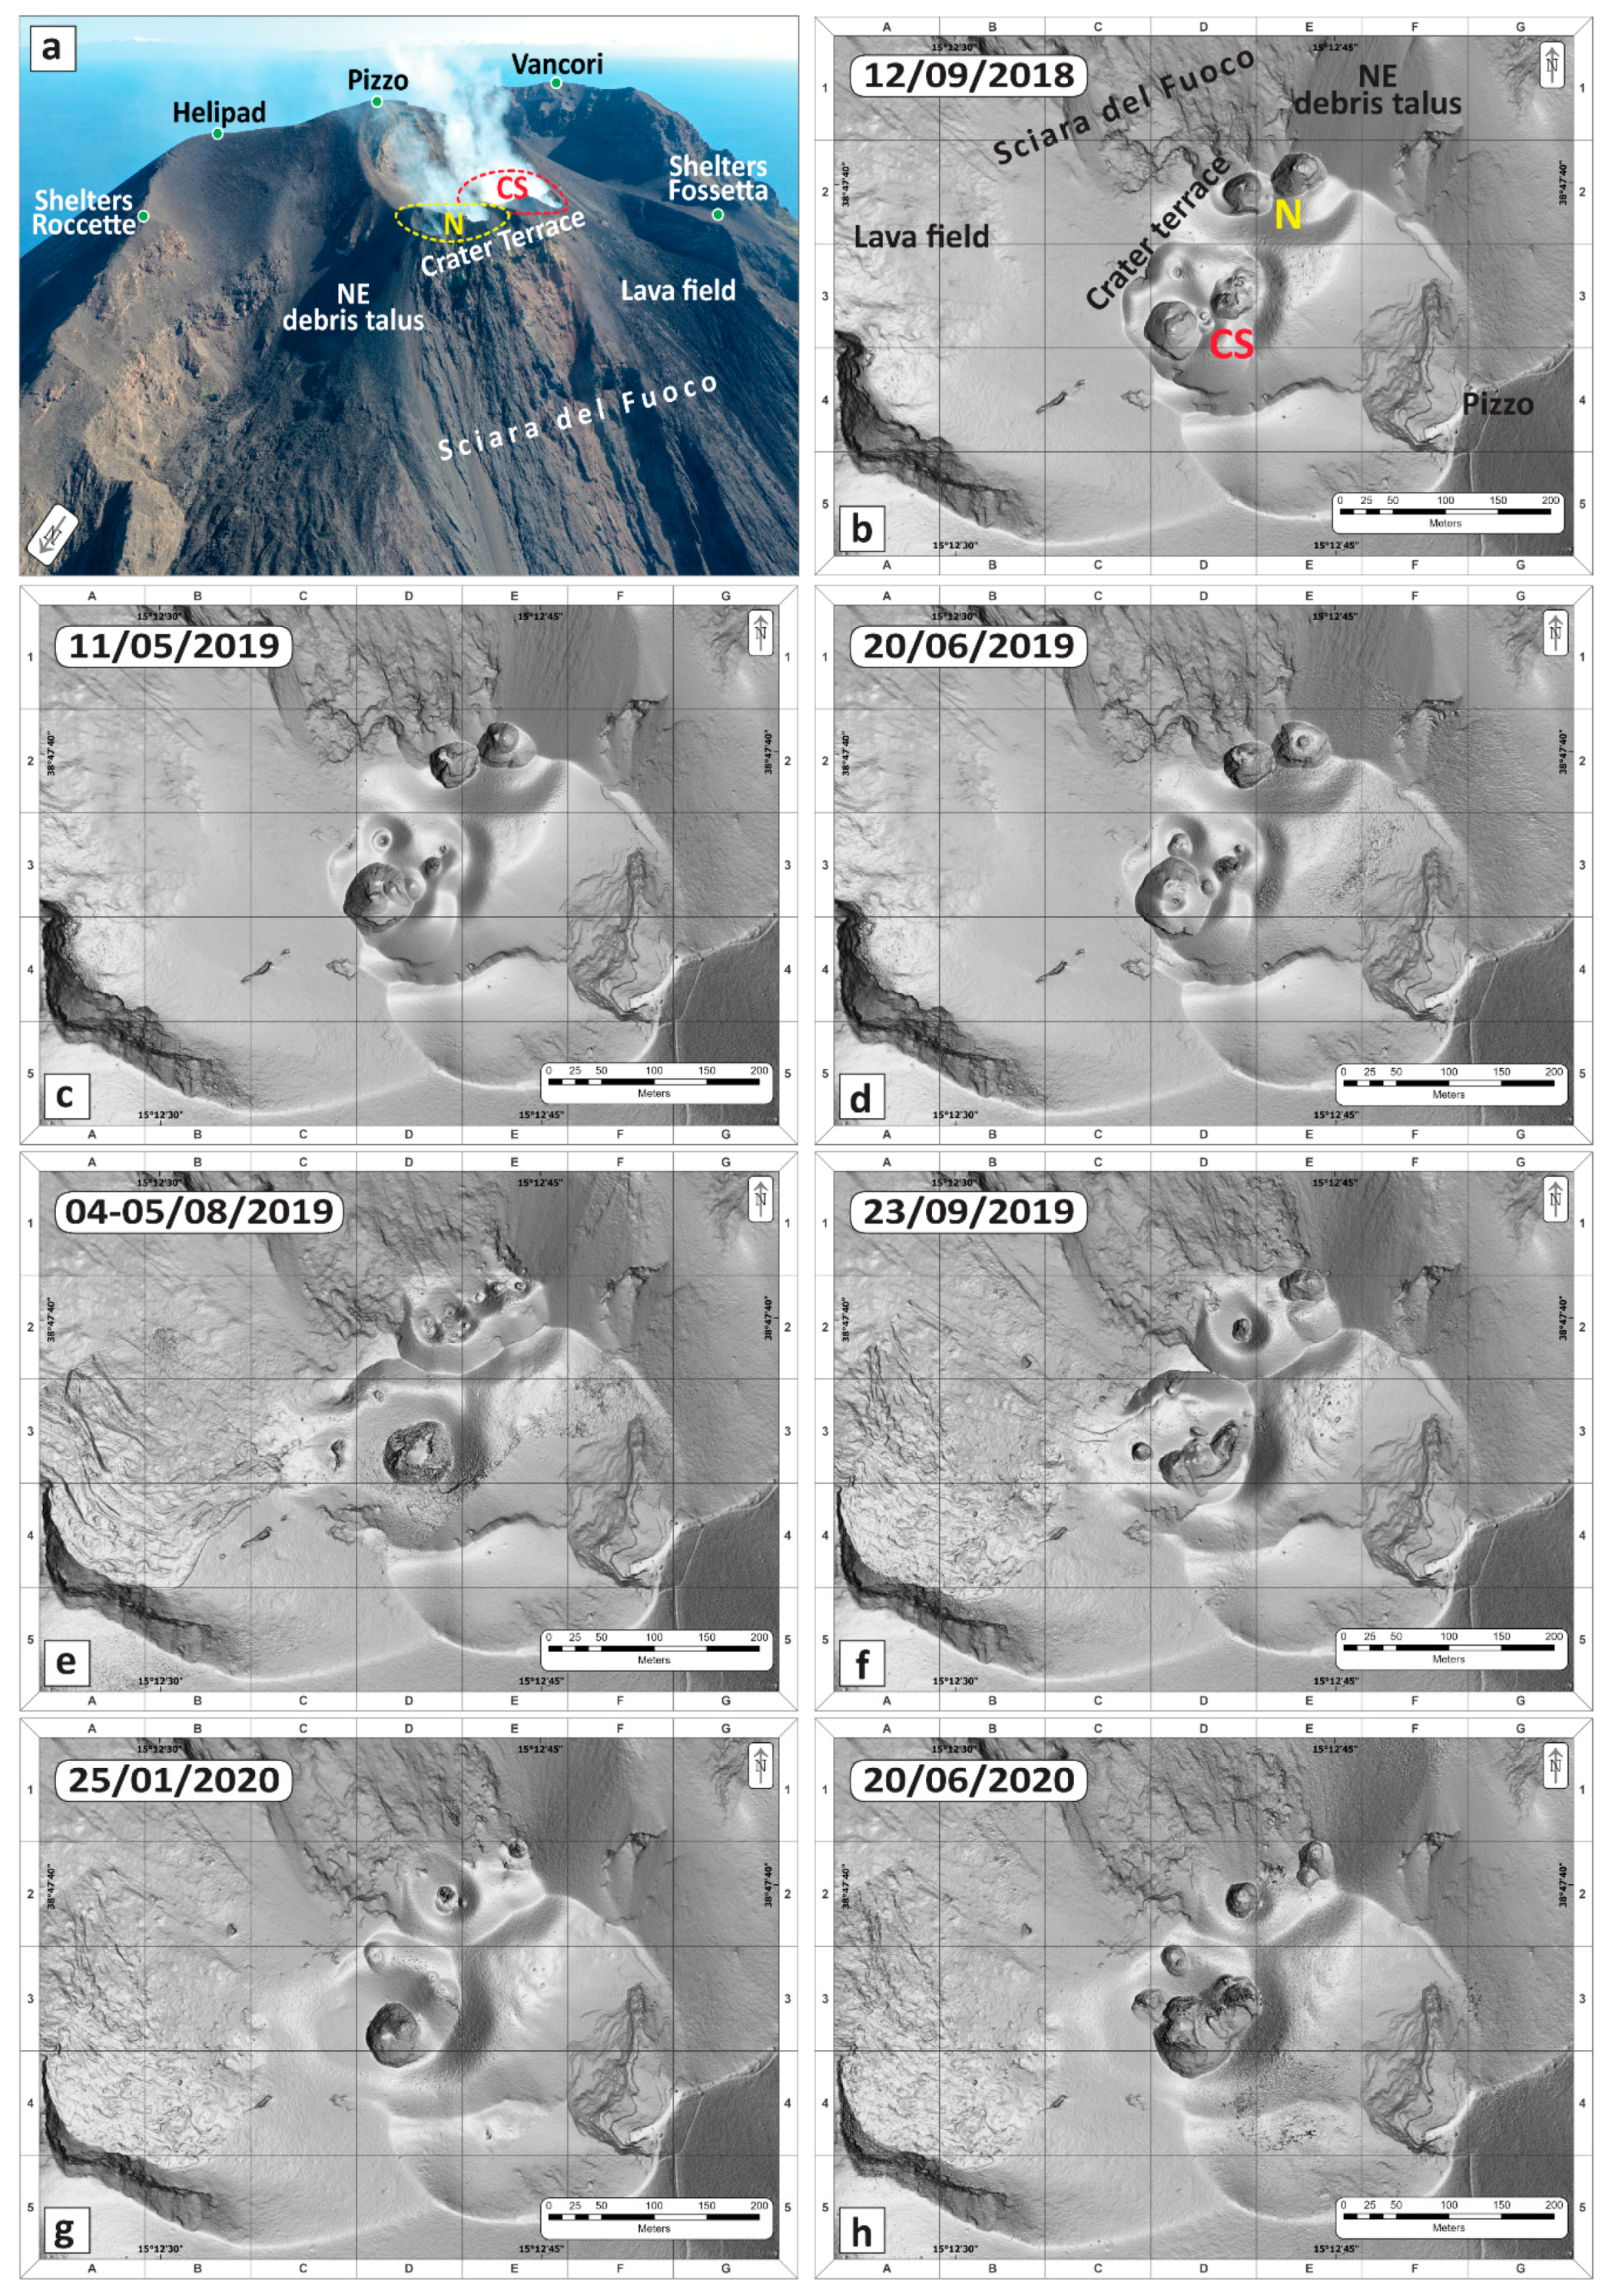
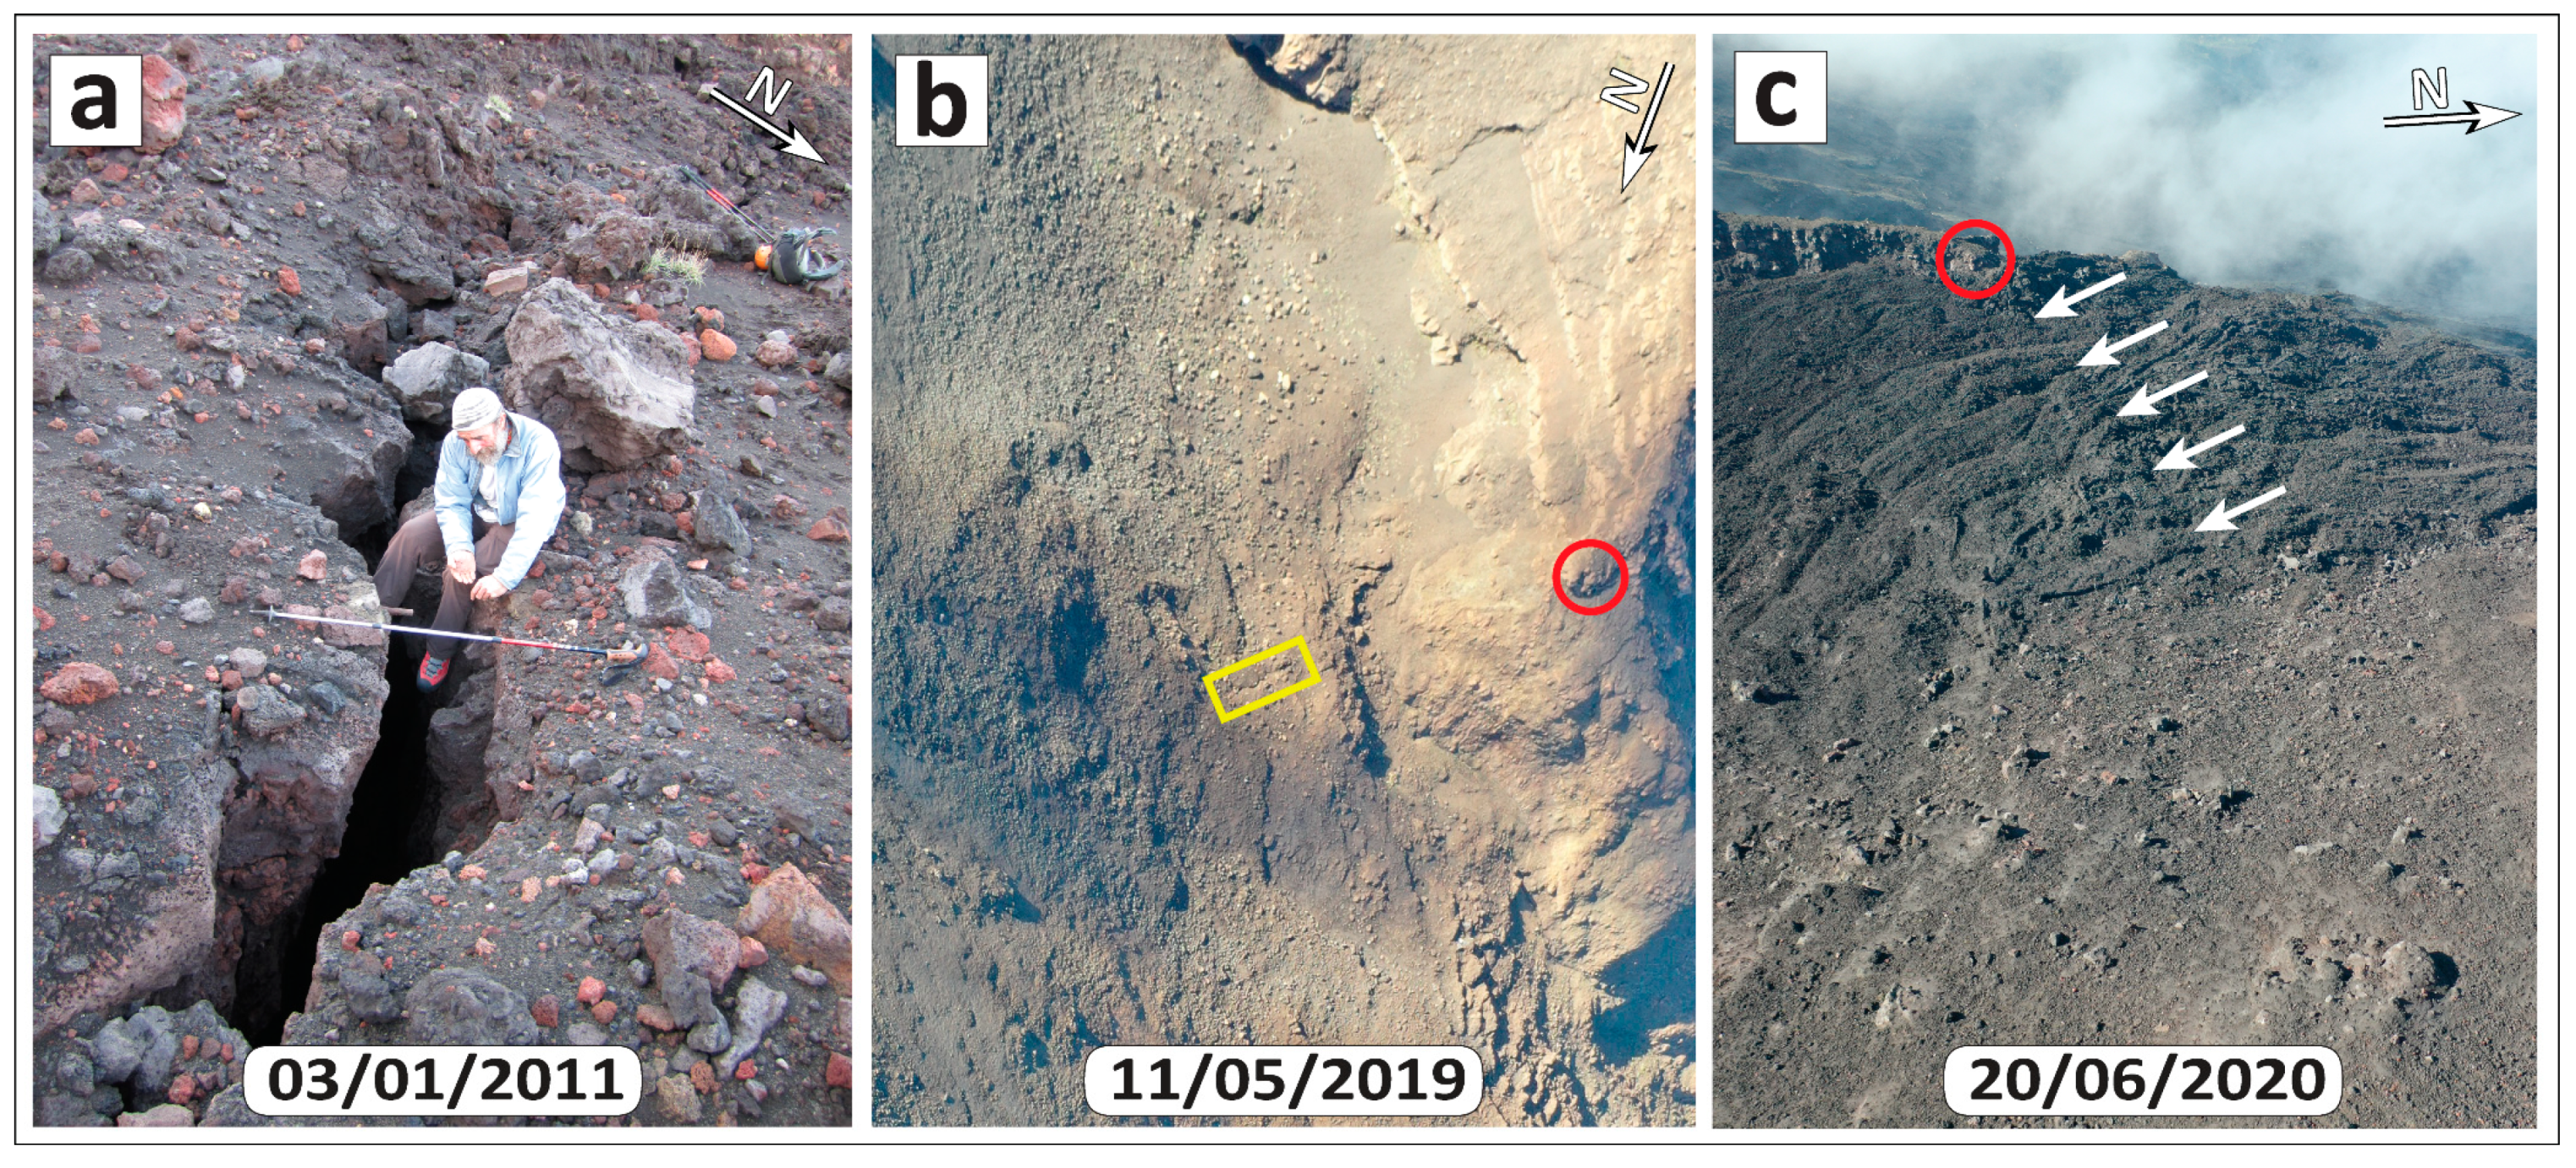
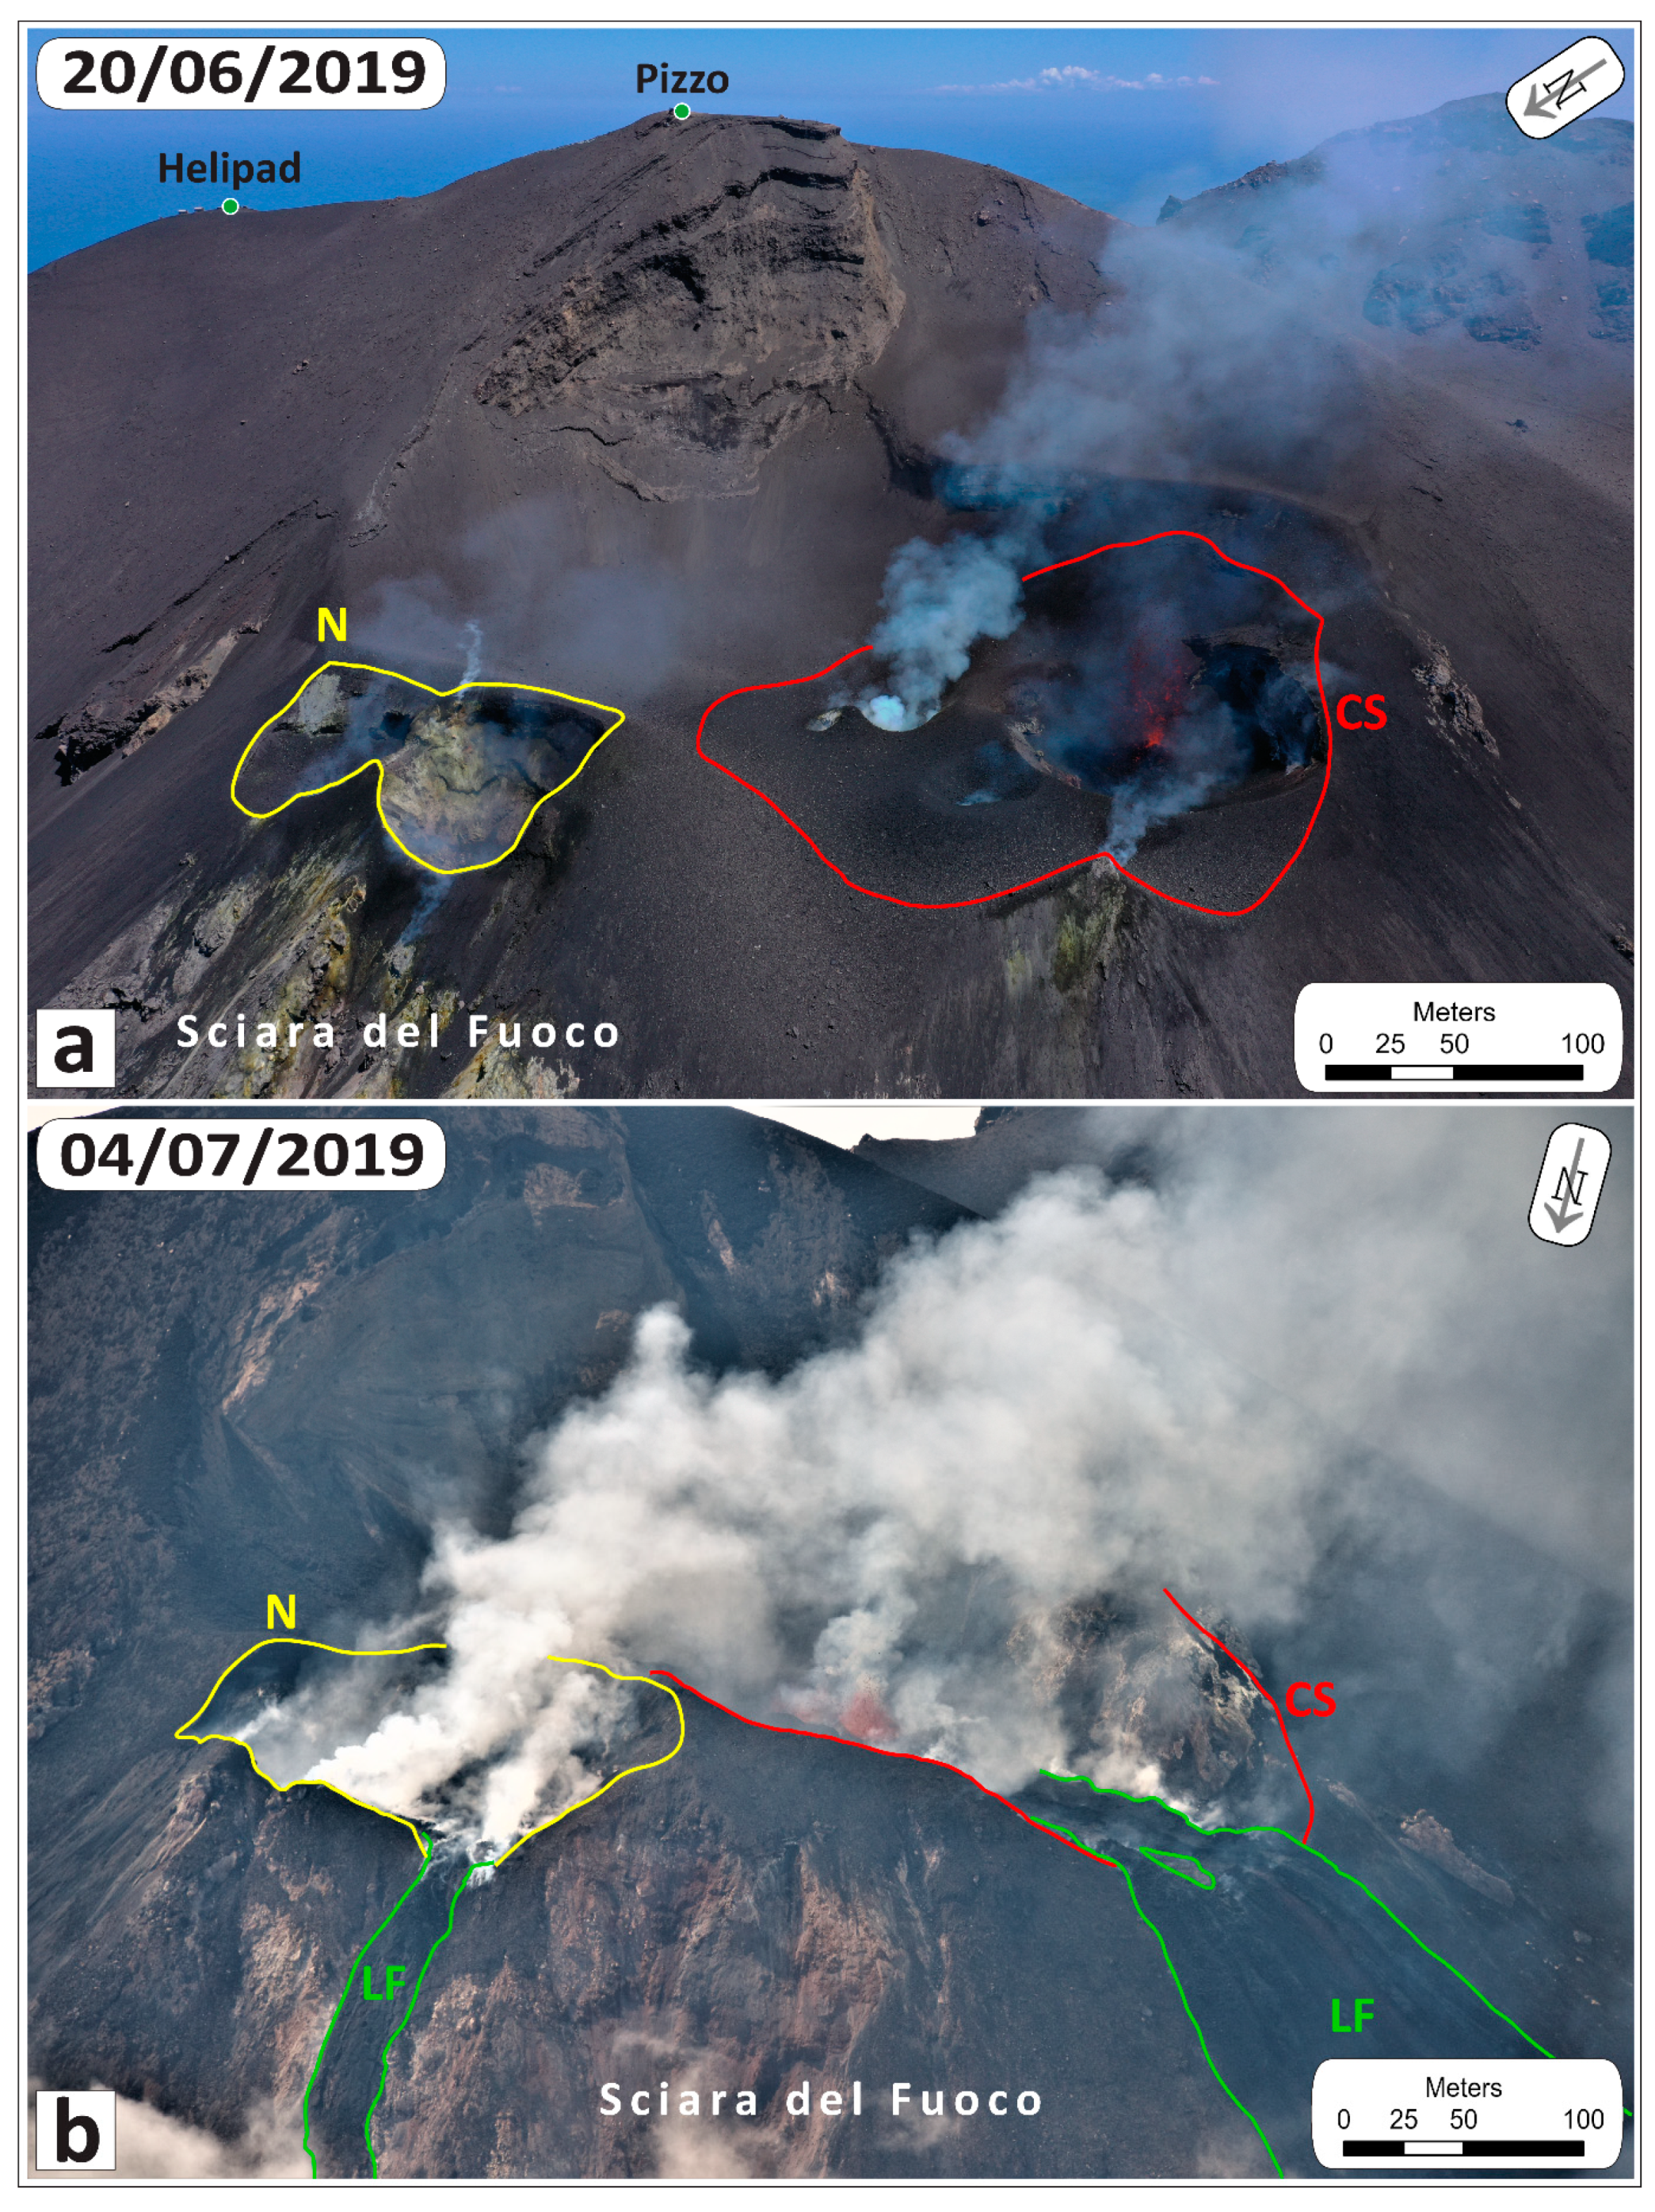
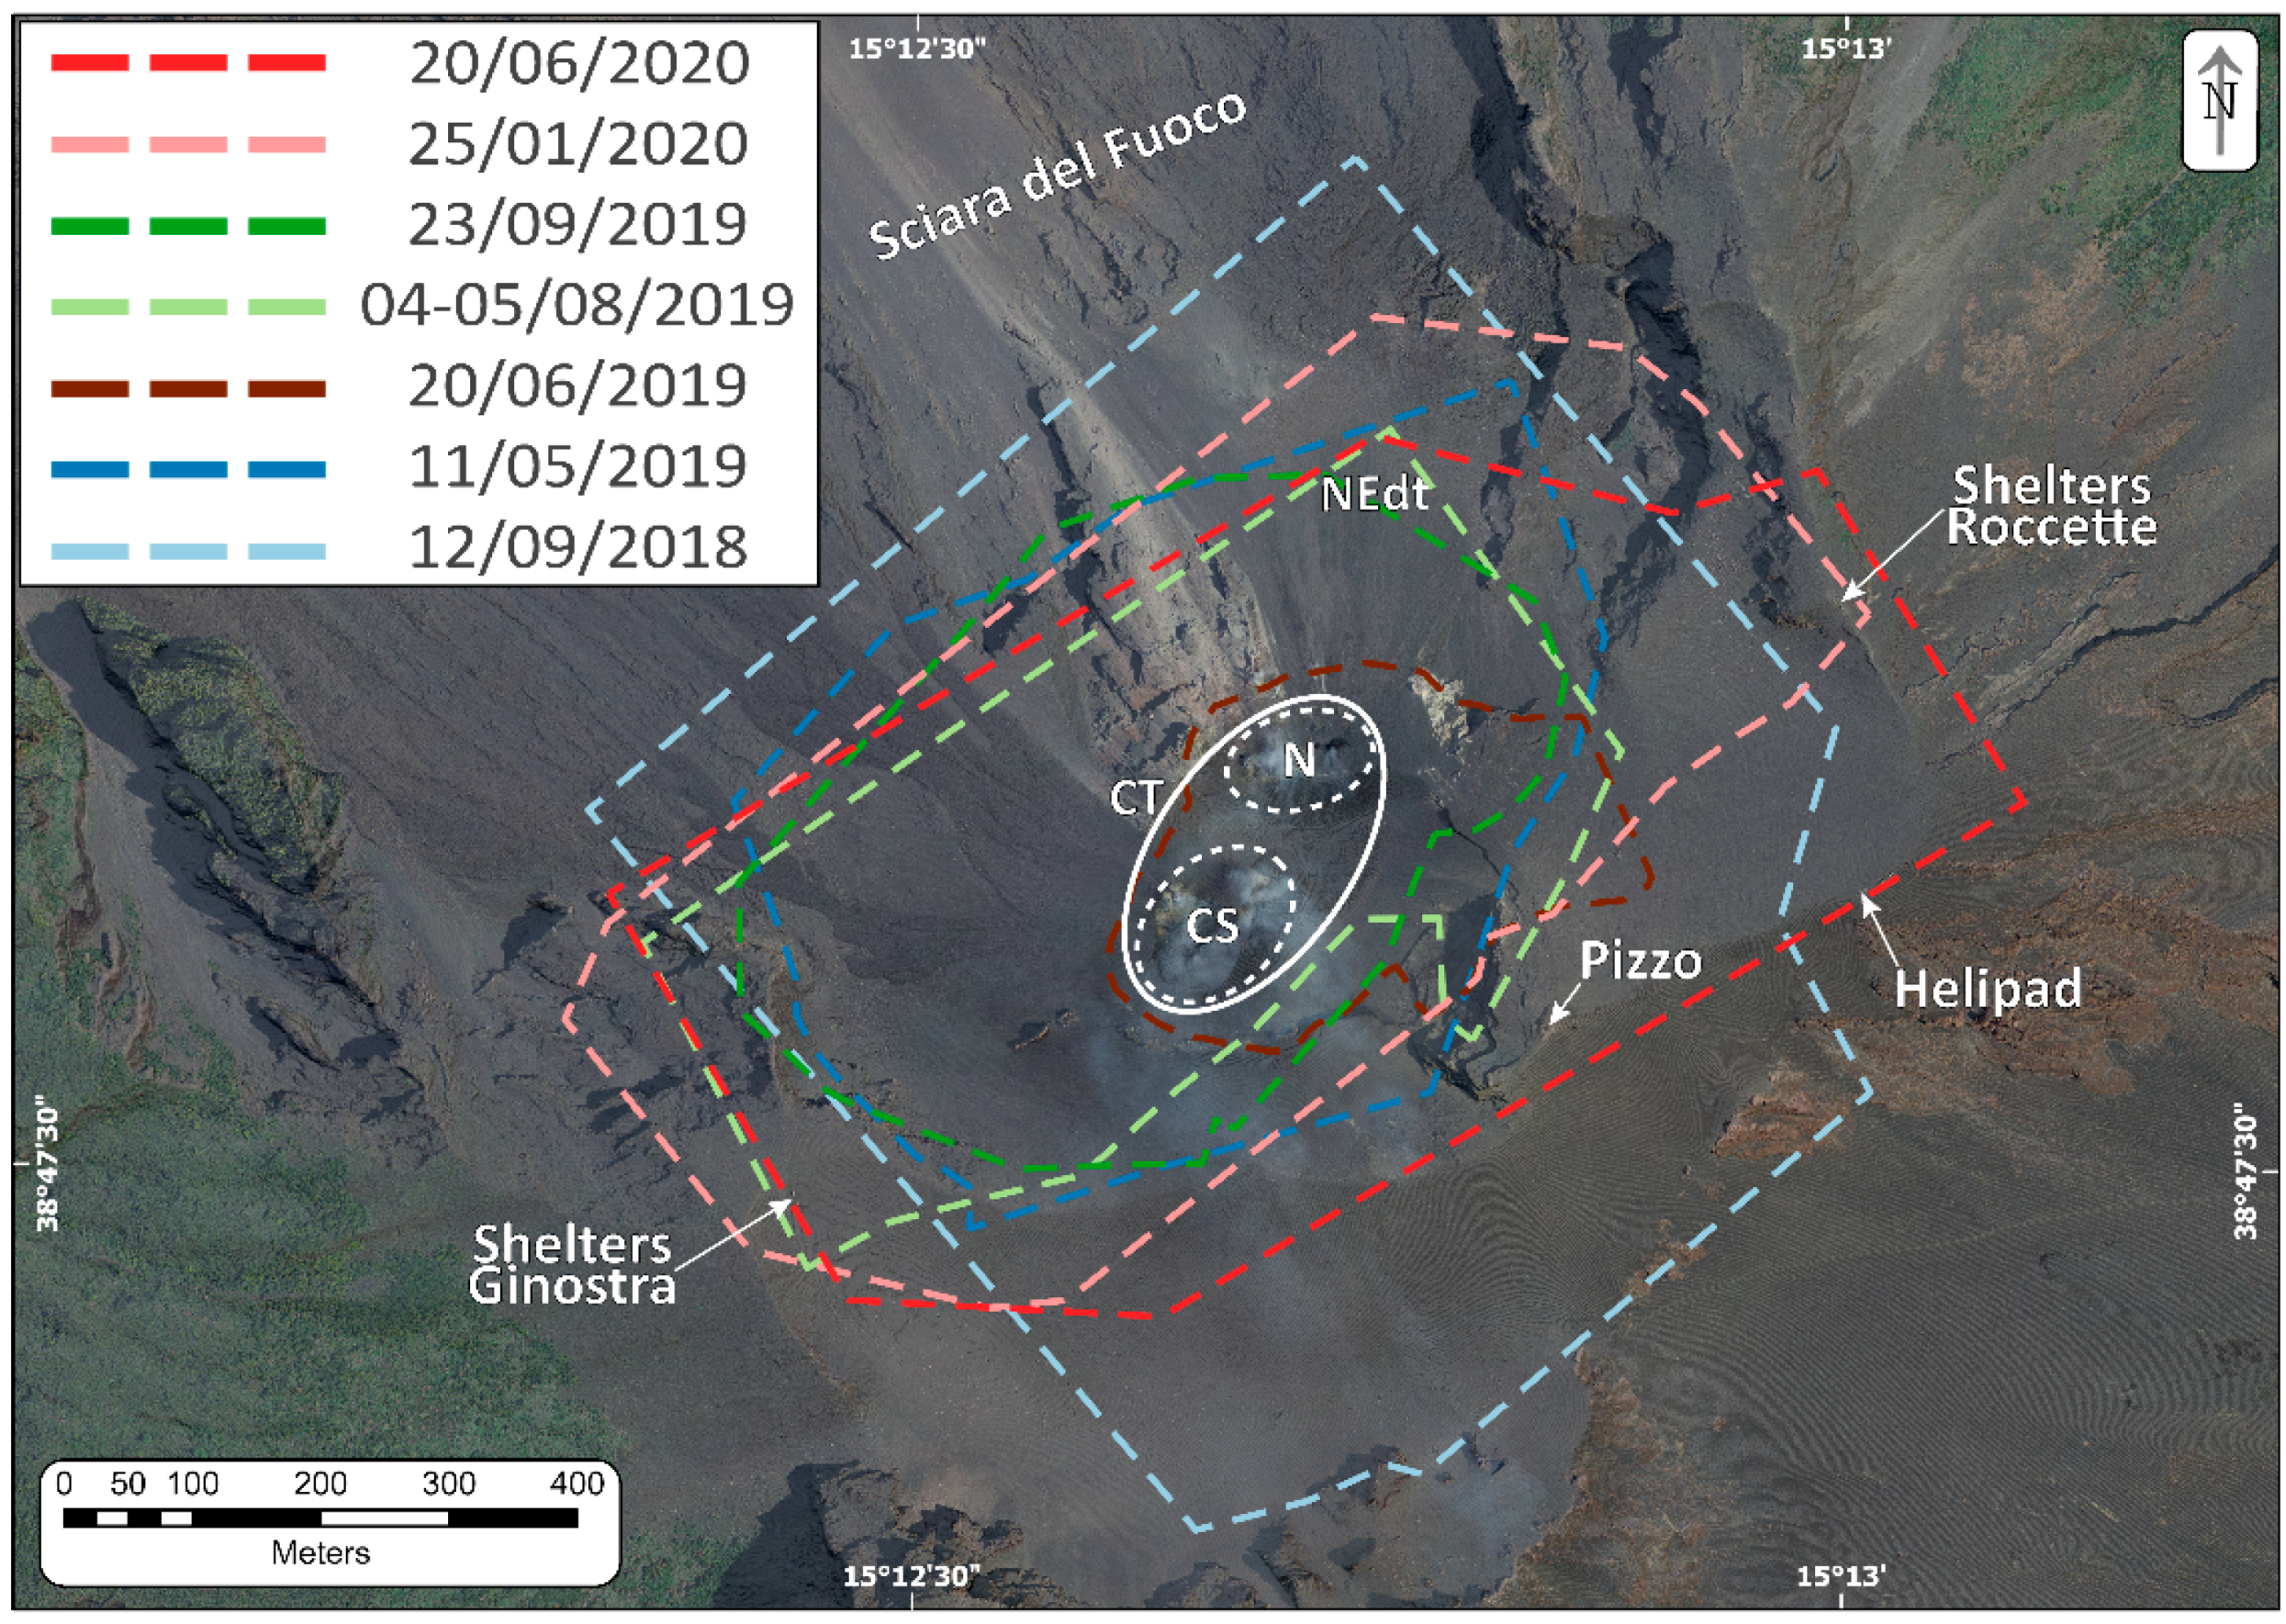
3.1. Chronological Evolution of the Crater Area Morphology

Seven multidirectional hillshades of the DSMs were produced for the period spanning from September 2018 to June 2020, covering the crater terrace and the upper SdF (Figure 3). To locate the features in Figure 3 we refer to a grid made using A–G and 1–5 quadrants. Each DSM represents a snapshot of the crater terrace morphology at the time of the different surveys, implying that the detected changes between two consecutive surveys could have resulted from multiple disruptive and constructive episodes, with some of these episodes being partially or totally obliterated. Here, we highlight the usefulness of UAS studies to quantitatively constrain topographic changes due to (1) ordinary eruptive as well as paroxysmal activity with related deposition and excavation, (2) gravitational instability as well as subsidence, and (3) lava effusion. The presented dimensions of the active vents (Figure 3) are reliable (few decimeter precision) and concur with Schmid et al. [22]. The volumetric changes are visualized using plain-view maps (Figure 4 and Figure 5) and highlighted along profiles (Figure 6 and Figure 7).
During the pre-paroxysm interval, i.e., September 2018 to June 2019 (Figure 3b–d), few major changes can be evidenced. In the CS crater area: (i) a small cone (hornito) grows and successively dismantles (upper left D3); (ii) the main crater gradually enlarges (from 58 to 73 m in diameter, lower left D3) by subsidence, causing the coalescence of the different active vents and the formation of a hornito; (iii) the central area has been filled by the accumulation of pyroclastic material (middle right of D3). In the N crater area: (i) the right crater (E2) shows a progressive accumulation of material and a reduction in the number of vents to a single one; (ii) the left crater (D2 and left E2) hosts multiple vents and shows a process of gradual enlargement (from 38 to 48 m), craterization and the generation and dismantling/burial of septa between the different active vents.
The 3 July 2019 paroxysmal explosion involved mainly the CS sector but produced profound morphological changes affecting the whole crater terrace and the upper SdF, as is evident from the 4–5 August survey (Figure 3e). In the CS area, a single main crater appears (diameter 67 m, lower half of D3) and is shifted by 47 m to the east, while two minor vents are present (upper left D3 and lower right C3). The destruction of a 110-m-long portion of the crater terrace rim is evident (C3). Furthermore, the emplacement of a 195-m-wide articulated lava field is visible west of the CS area onto the Sciara del Fuoco (A–B2,3,4). In the N crater area (D–E2), a peculiar 105-m-long, SW–NE trending alignment of seven active hornitos has now formed (Figure S3) and is shifted by up to 23 m toward the SdF with respect to the alignment of the two previously existing craters.
The 28 August 2019 paroxysm again produced important morphological variations (Figure 3f). In the N area, the morphology is restored to the pre-paroxysms period with two craters in place of the aligned vents. The northward migration of the easternmost vent position (E2) continues, while the westernmost vent moves south (approximately 18 m) to its pre-paroxysm location, in the middle-left of D2, exhibiting the formation of a cone. In the CS area, a main 95-m-long crater depression hosting multiple vents appears in lower D3 and a new pit crater appears in the center of D3. The vent located in the upper left of D3 remains unaltered, while the vent in the lower right of C3 deepened. All over the surveyed area, particularly in its eastern sector (E3) and in the upper lava field (B2,3,4), the presence of volcanic blocks up to 13.4 m in size is evident (lower right B2 in Figure 3f–h; Figure S4). These were ejected during the explosive phase of the 28 August eruption and derived from the destruction of pre-existing volcanic structures. Moreover, in the lava field area, the morphology of the cooled lava flows, well evident in August, is masked by the volcanic debris cover produced by the paroxysm.
In the period following the paroxysmal explosions, between January and June 2020, two more surveys were performed (Figure 3g,h). In January 2020, a general reduction in the diameter of the craters (54 m for the CS) can be observed in parallel with the growth of the cones in both the CS and N crater areas. In the former one, the disappearance of a vent in lower right C3 is visible. In June 2020 (Figure 3h), a clear process of craterization affects all the active vents of the crater terrace, with the formation of a large, multiple-vent, 115-m-long crater depression in the CS area, the reappearance of the vent in middle right C3, and the widening of the vents in the N area.

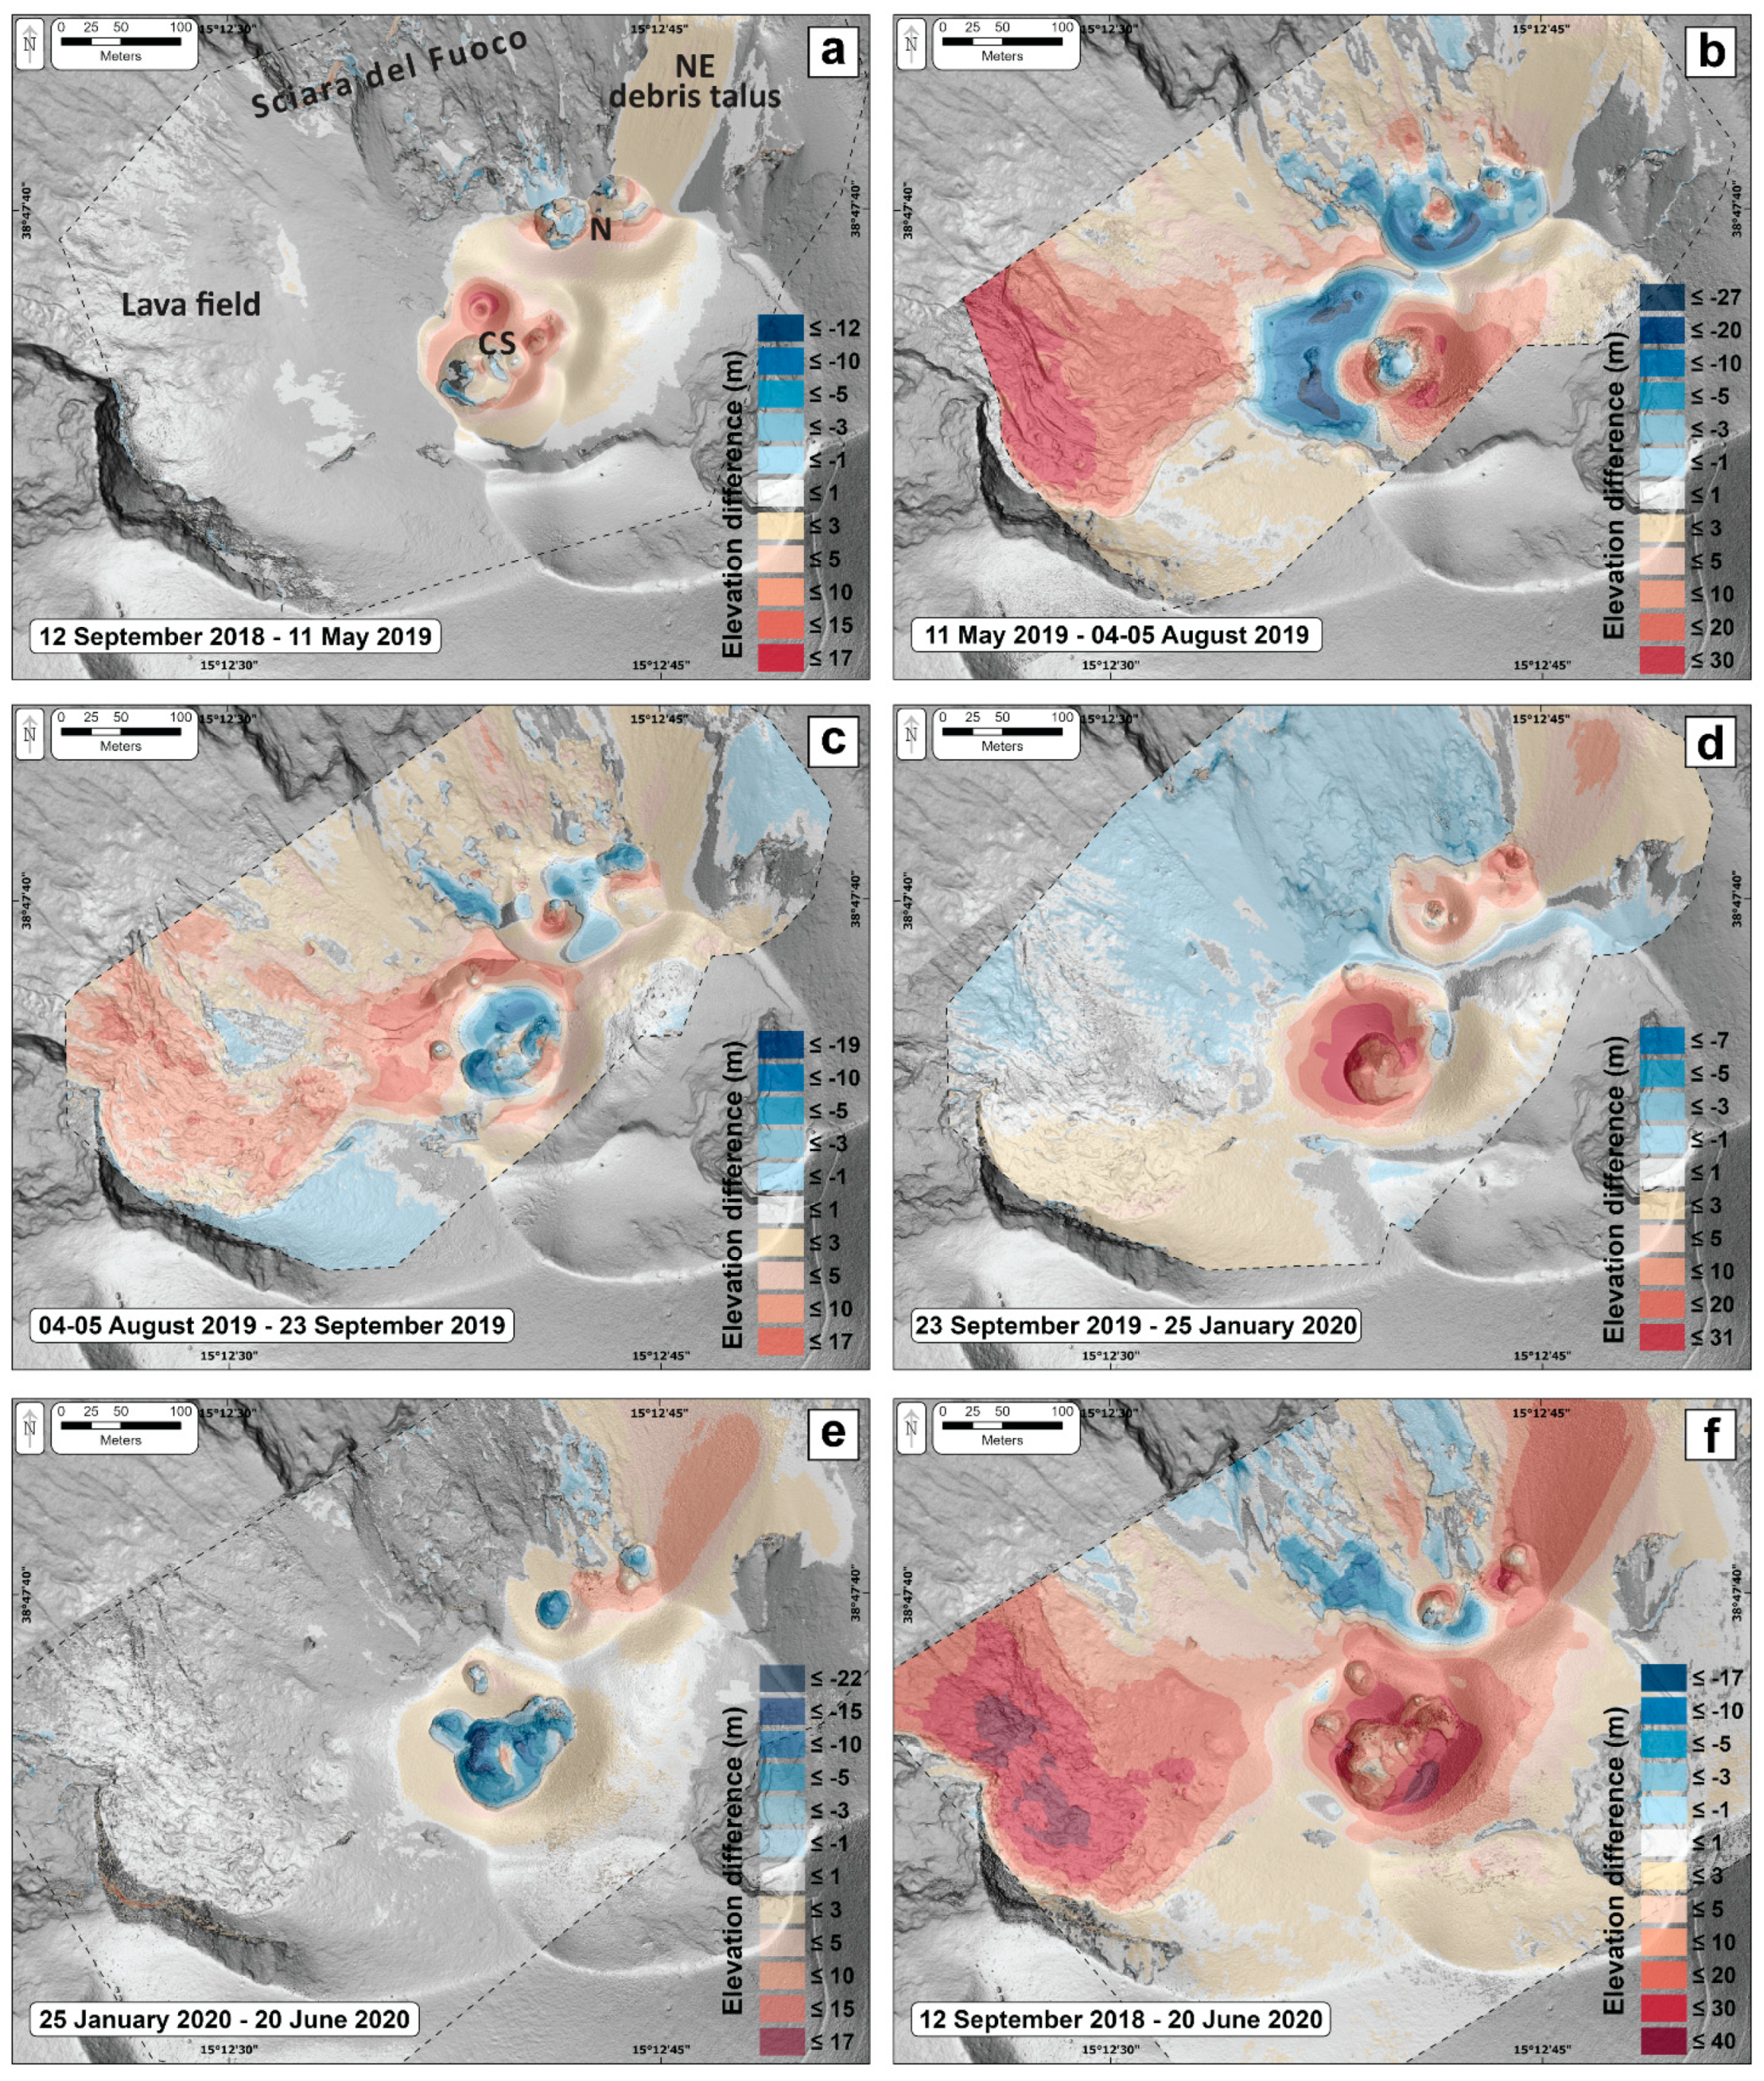
3.2. Volume Change Estimation

Figure 4 shows the areas that have been modified by the removal or addition of surface material for the period September 2018–June 2020 in the crater terrace and lava field areas. The volume difference is provided for the following two common Areas of Interest: that of only the crater terrace, hereafter CT-AOI, and that of the crater terrace and upper Sciara del Fuoco, hereafter SFCT-AOI (Figure 5). These two areas have been affected by important changes, with the CS and N craters, the lava flow area, and the upper SdF sector exhibiting the largest changes between the DSMs.
The main changes between the two datasets preceding the July–August paroxysms (i.e., September 2018 and May 2019, Figure 4a) are limited to the SW and NE crater areas, and to the NE debris talus. In particular, the strongest morphological change that occurred within the crater terrace was localized north of the main S crater where a hornito grew, resulting in a predominant positive elevation difference (up to 17 m). In the NE debris talus sector, the maximum accumulation of material from both volcanic activity and gravel flows in the period considered is 3.3 m. In the other sectors of the SdF slope, the vast majority of the analyzed area shows an elevation difference below the minimum level of detection (0.5 m, see Section 2.3). The net volume difference calculated over the crater terrace (CT-AOI) (see Figure 5) is 118,120 m3 (±18,385 m3; error 15.5%).
A significant modification of the morphology of the crater terrace area occurred as a result of the first paroxysm in July 2019. Figure 4b shows the DoD between the May 2019 and August 2019 datasets: the most significant topographic features after the 3 July paroxysm are the dismantling of both the CS and N crater rims toward the SdF, with surface lowering up to −27 m (CS crater area) and the accumulation of material around the main S crater with a maximum thickness on its southeastern sector of 27 m. The accumulation of this material results not only from the pyroclastic deposit of the paroxysmal eruption of 3 July but also from the previous and subsequent extremely high Strombolian activity. The net volume difference calculated over the CT-AOI is −27,848 m3 (±1749 m3; error 6.3%), while it corresponds to 657,548 m3 (±68,475 m3; error 10.4%) for the SFCT-AOI in Figure 5. Outside of the crater terrace, the prominent changes are due to the accumulation of material in the southern sector of the SdF, with a maximum thickness of 29 m. It is worth noting that this value includes an unknown amount of material deposited in that area as a result of the 3 July paroxysmal blast, which was then covered by the lava flows in the following days and weeks. The total volume accumulated in that sector corresponds to 597,445 m3 (±23,194 m3) over a surveyed area of 48,010 m2.
The morphological changes that occurred after the second paroxysm in August 2019 can be seen in Figure 4c, showing the DoD between the August 2019 and September 2019 datasets: in this case the changes related to accumulation of material are in the lava field area (west of the crater terrace; 13 m), around the CS sector (17 m) and south of N craters (17 m). The removal of material mainly occurred, instead, within the CS crater (−19 m) and in the SdF sector of the N crater area and, to a minor extent, on the external SW and NE slopes of the crater terrace. The net volume difference calculated over the CT-AOI is 97,330 m3 (±16,742 m3; error 17.2%), while it corresponds to 405,528 m3 (±65,723 m3; error 16.2%) for the SFCT-AOI, and of which 234,838 m3 (±21,696 m3) pertain to the lava field over a surveyed area of 51,487 m2.
The DoD between September 2019 and January 2020 (Figure 4d), a period comprising rather stable Strombolian activity, is characterized by the refilling of the vent areas evidenced by the fact that the accumulation of material takes place mainly within the CS (31 m) and N (18 m) craters. As the new vents of the N crater are closer to the SdF, a maximum accumulation (7 m) of the material deriving from the explosive activity is visible at the foot of the NE debris talus. Interestingly, the diffuse erosion of all the upper slope of the SdF is evident, while diffuse accumulation characterizes the areas to the NE and SW of the crater terrace. The net volume difference calculated over the crater terrace is 237,410 m3 (±16,874 m3; error 7.1%), while only minor changes occur in the other sectors of the SFCT-AOI.
The changes that occurred between January and June 2020 (Figure 4e), another period characterized by stable Strombolian activity, are the deepening of the CS crater floor (−22 m) and the accumulation of material in the central sector of the N area (17 m) and along the NE debris talus (7 m). The net volume difference calculated over the crater terrace is 21,424 m3 (±3664 m3; error 17.1%), with changes in the other sectors of SFCT-AOI only pertaining to the NE debris talus.
Figure 4f shows the overall profound topographic changes that occurred during the studied period, from September 2018 to June 2020. The DoD highlights a widespread accumulation of material in most parts of the crater terrace and its surroundings with the related maximum in the lava field area (39 m), in the CS sector (40 m), around the vents of the N crater area (28 m), and in the upper portion of the NE debris talus sector (18 m). The only sector where a negative elevation difference can be seen is in the western sector of the N crater area pertaining to the SdF. The loss of material due to the two paroxysms is concentrated in this sector, which corresponds to the starting area of a deep incision. The net volume difference calculated over the crater terrace is 447,335 m3 (±20,758 m3; error 4.6%). This latter value, representing the tephra volume deposited in the CT-AOI throughout the entire period, is consistent with the sum of single intervals for which the five different DODs were calculated (which gives an overall volume gain of 446,436 m3 and a difference of −899 m3 that corresponds to 0.2%, with respect to the DoD September 2018–June 2020). The net volume difference for the entire SFCT-AOI, throughout the entire time period considered in this study, is 1,537,852 m3 (±80,093 m3; error 5.2%), of which 991,940 m3 (±30,305 m3) pertain to the lava field over a surveyed area of 60,300 m2.
Figure 5 shows the DoD between May 2019 and September 2019, covering the two paroxysmal explosions with the pre- and post-eruption surfaces. The maximum material losses occurred at the N crater, with maximum elevation differences of −26.4 m in its central portion, and in the southern sector of the CS crater area with maximum elevation differences of −22 m. In contrast, the maximum material gain occurred in the upper part of the SdF depression, southwest of the crater terrace, where lava flows active between 3 July and 28 August [43] and on 30 August [51] created a lava field with a maximum thickness of 41.4 m. It is worth noting that the amount of pyroclastic product emplaced in the lava field area by the two paroxysmal explosions is unknown. The net volume difference calculated over the crater terrace is 69,600 m3 (±4497 m3; error 6.4%). In the crater terrace area, the maximum gain corresponds to the region east of the CS crater with an elevation difference of 27 m derived from the accumulation of material that originated from the two paroxysms and the intense Strombolian activity during the period considered. Considering the entire SFCT-AOI throughout the time span, which includes the two paroxysmal eruptions, the net volume difference is 1,065,537 m3 (±69,807 m3; error 6.5%), of which 823,823 m3 (±22,807 m3) pertain to the lava field over a surveyed area of 48,010 m2.

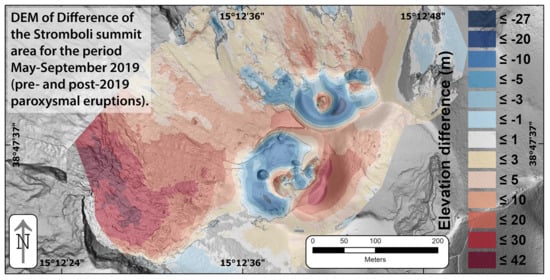
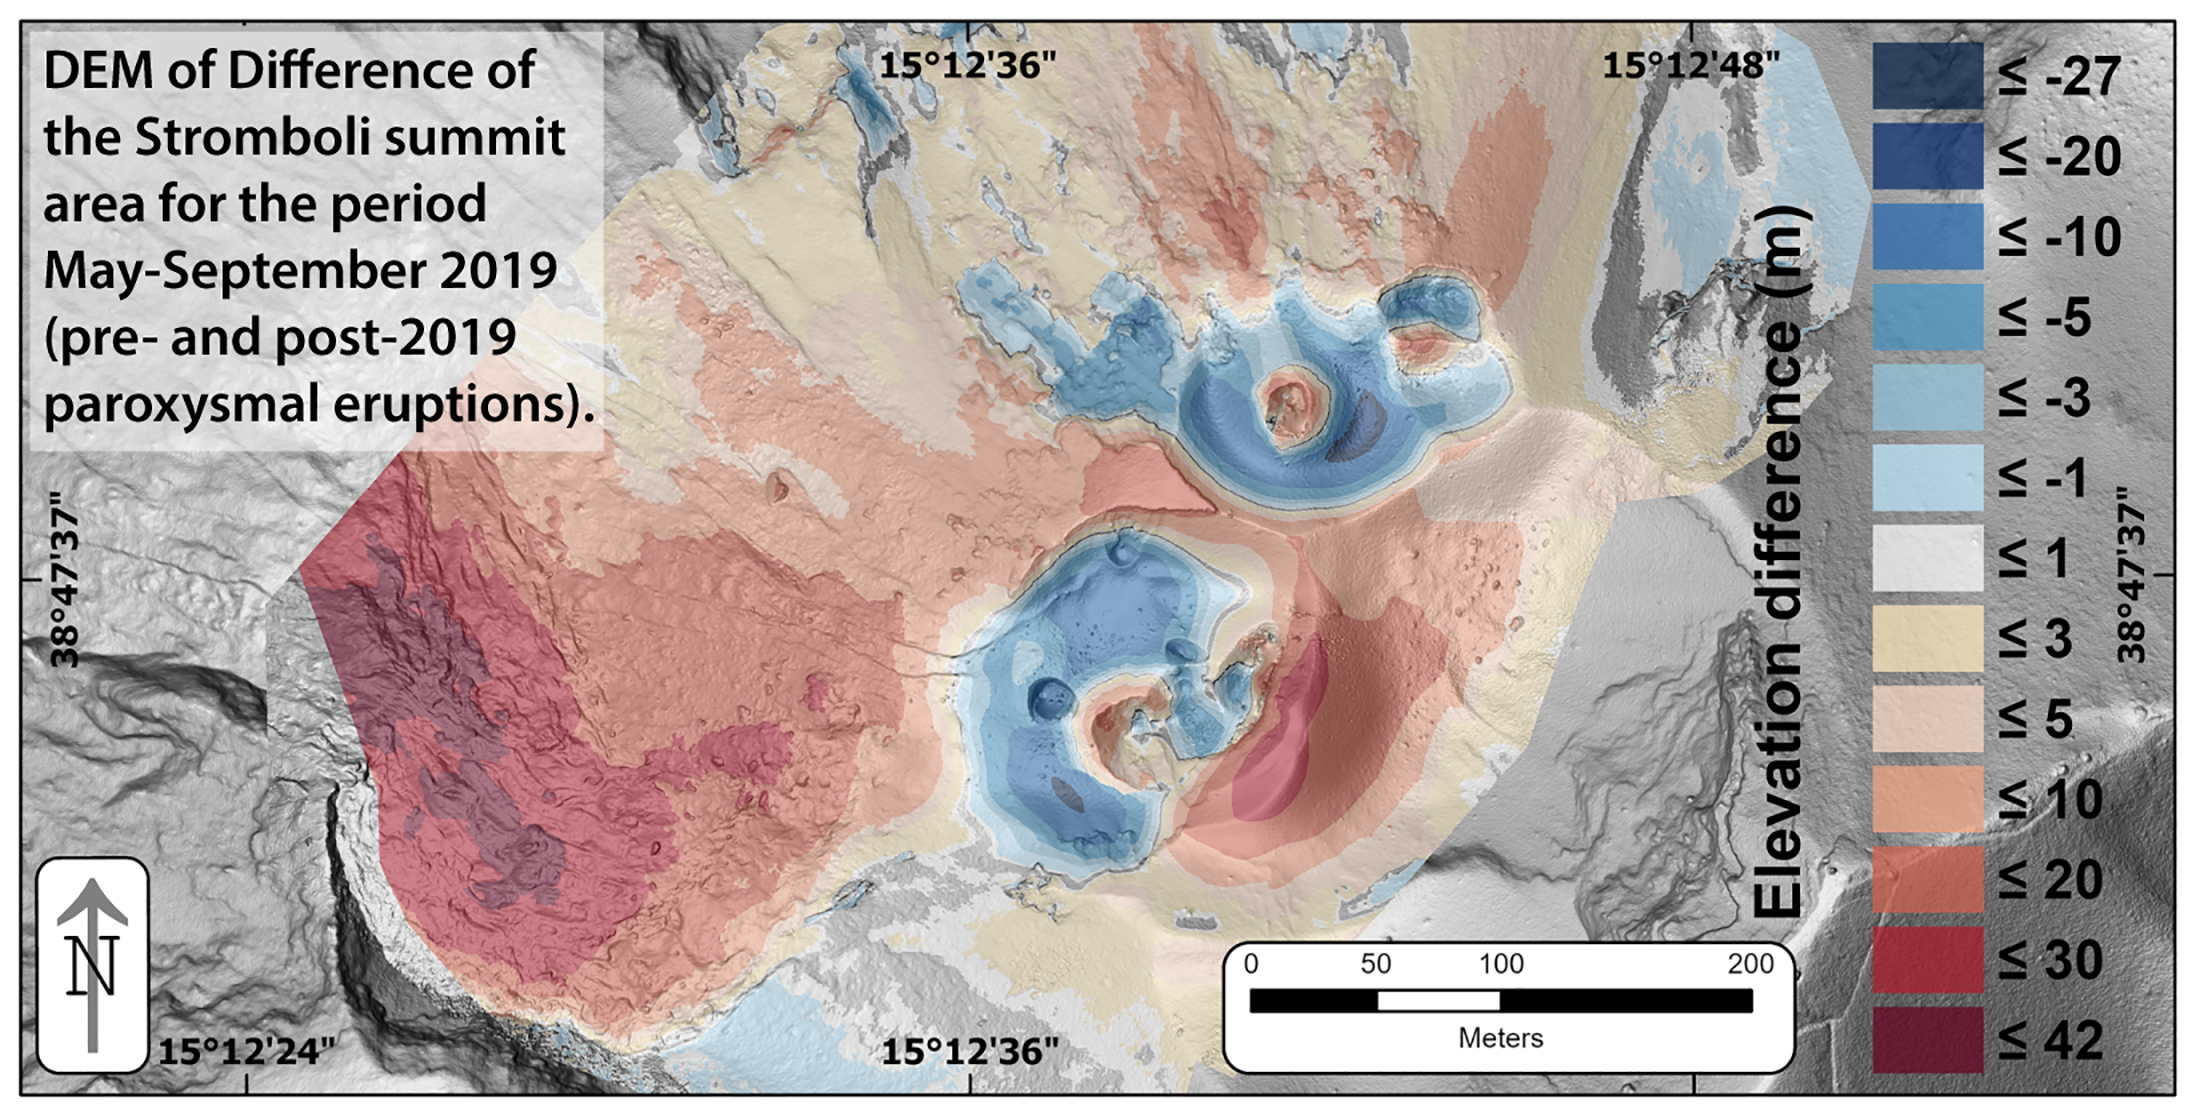
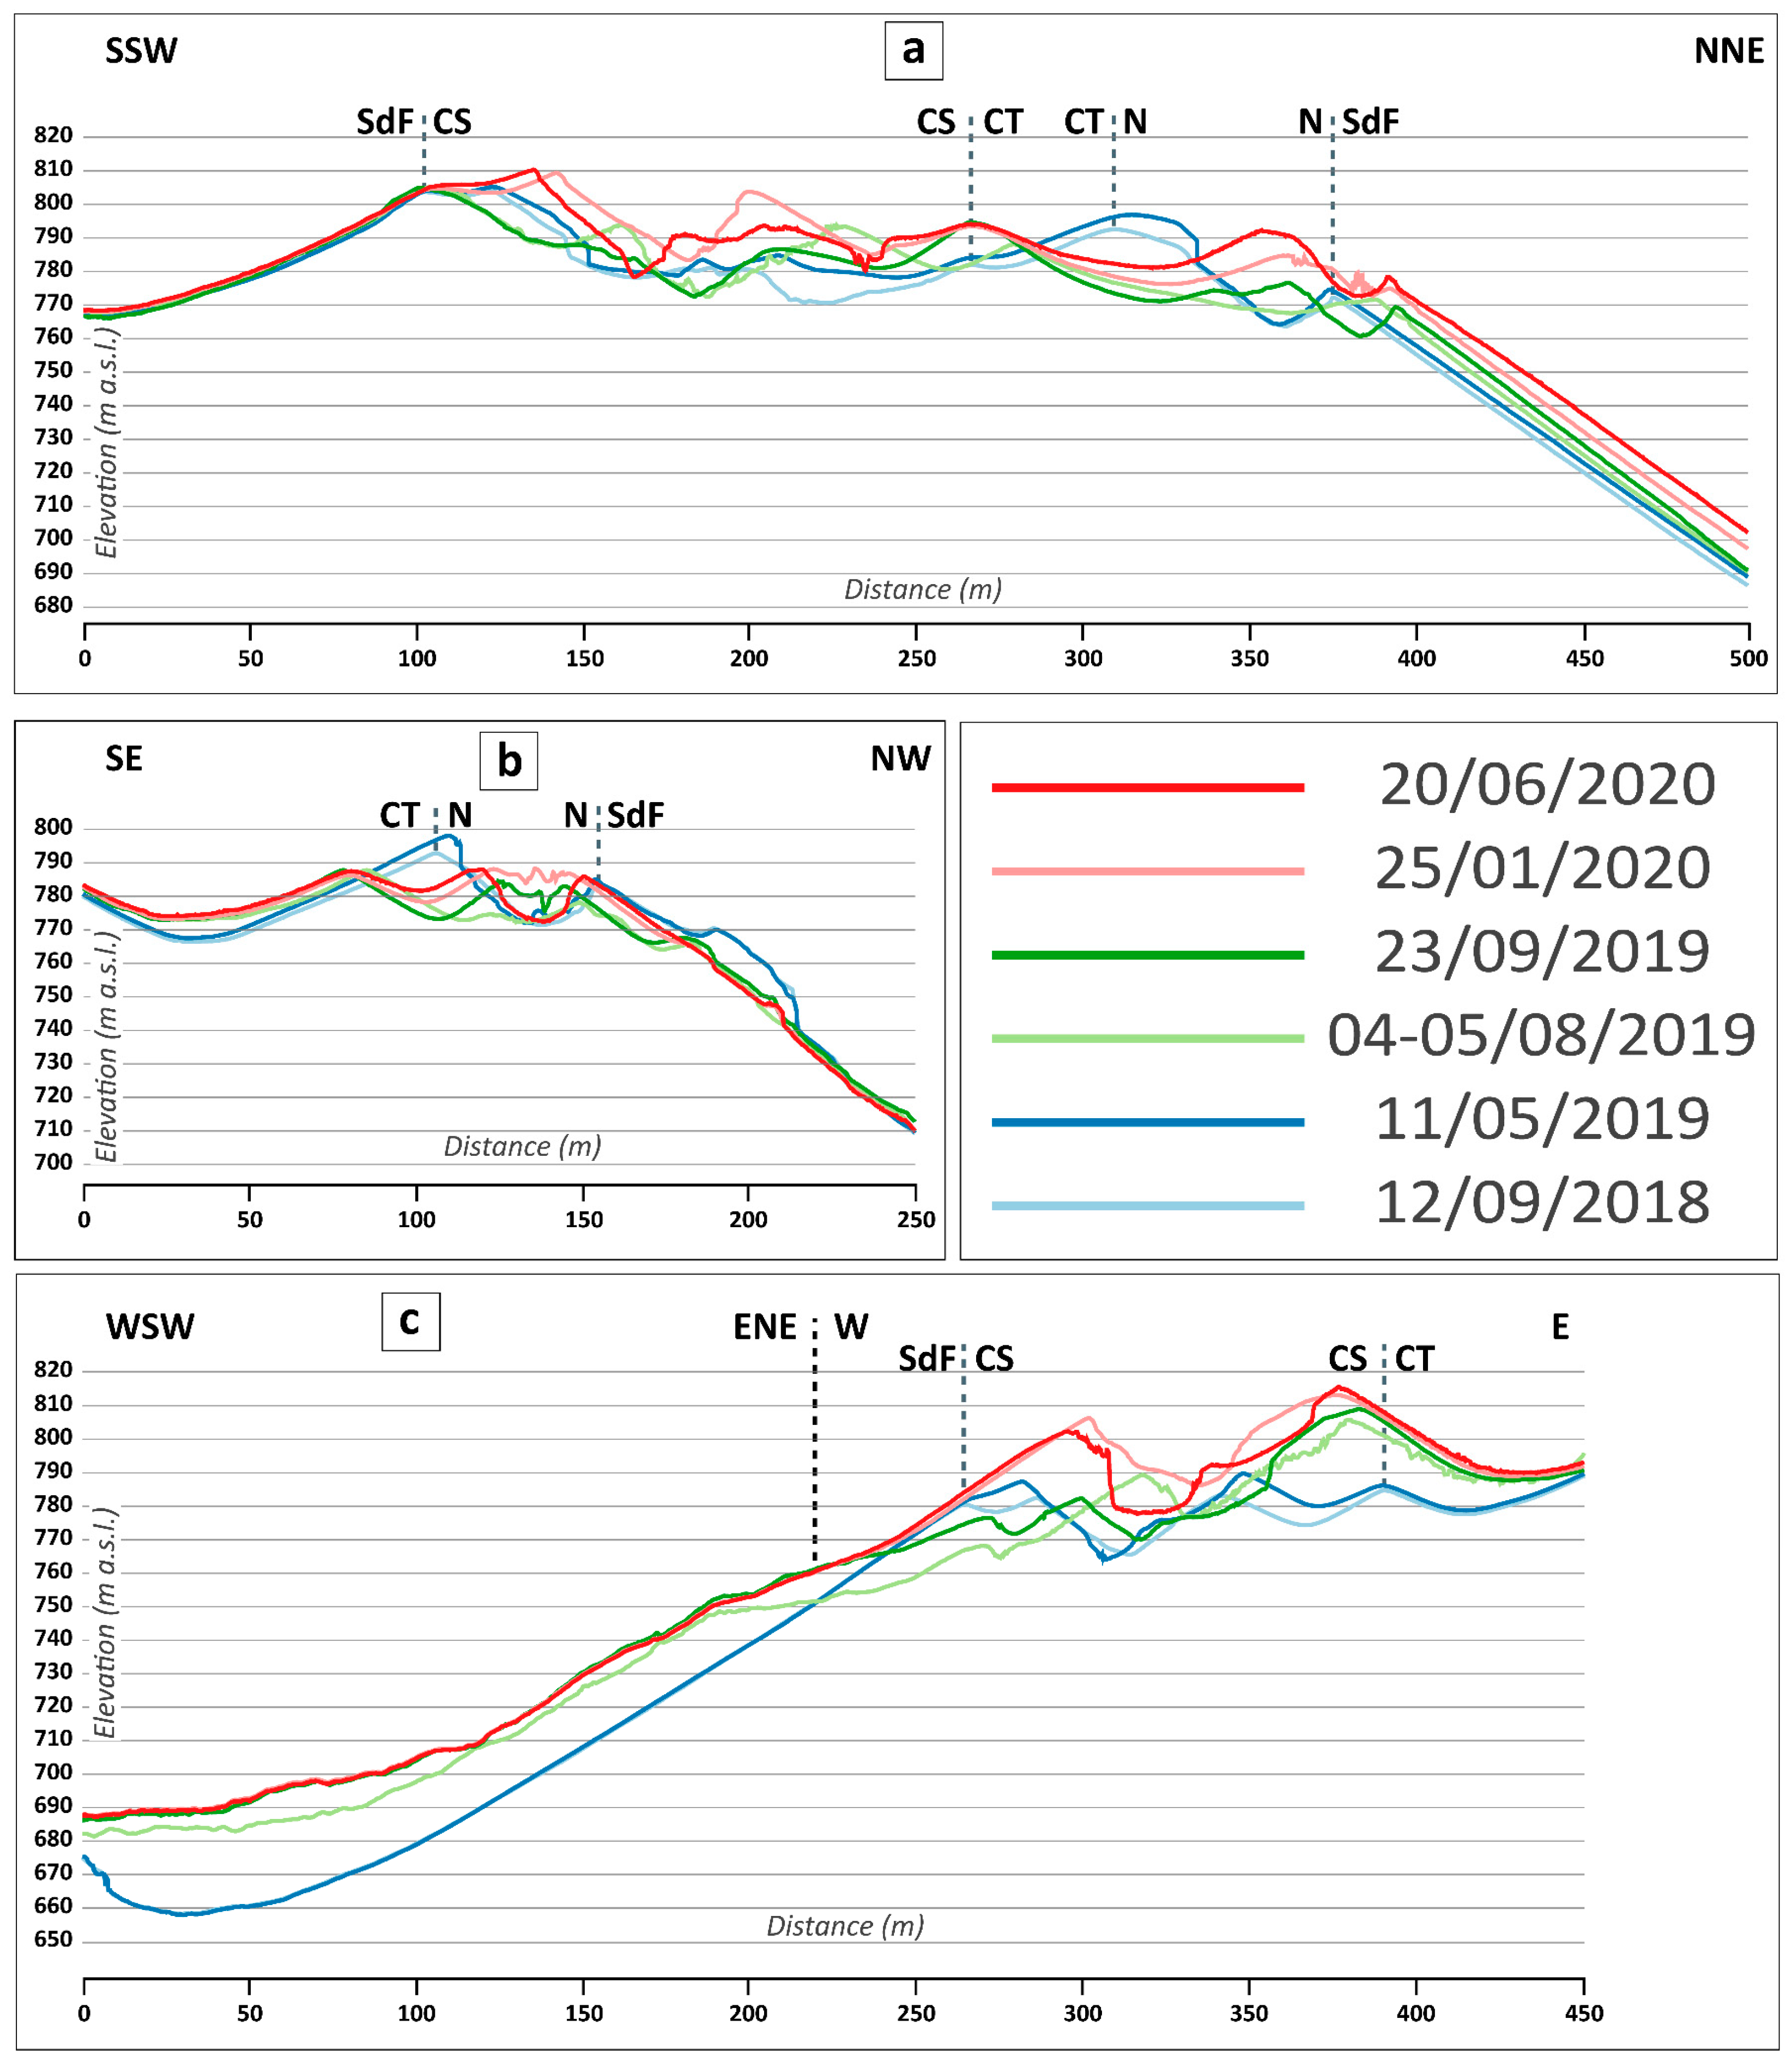
3.3. Topographic Variations

The cross-sections in Figure 6 show the shape of three topographic profiles across the crater terrace area and the upper SdF (location of profiles in Figure 4) during the considered period.
Profile one (Figure 6a and Figure S5) shows only minor changes between September 2018 and May 2019. The elevation difference is always positive along the entire profile with a maximum thickness gain of 12 m. Between May and August 2019 the variation produced by the first paroxysm is highlighted by the removal and addition of material in the CS crater area, a maximum thickness gain of 13 m, and marked in the N one by a maximum thickness loss along the profile of 22 m in correspondence with the SSW rim. The comparison of the cross-sections of August and September 2019, which includes the changes due to the 28 August paroxysm, highlights minor changes with respect to the first paroxysm, with a maximum positive elevation difference of 13 m, located on the rim between CS and N crater areas, and a minimum of 11 m in the NNE sector of the CS area. Between September 2019 and January 2020, only positive elevation variations are observed along the profile. The maximum positive elevation difference of 21 m is located in the CS area. Finally, the changes that occurred between January and June 2020 are both positive and negative in the CS sector, where the material loss (maximum negative elevation difference of 14 m) prevails over the accumulation and is only positive in the N crater area (maximum positive elevation difference of 10 m). Considering the entire period, September 2018–June 2020, a profile comparison highlights a general diffuse accumulation of material between the SSW rim of the CS area and the NE debris talus included. This latter one gradually increases in elevation during the observation periods with a total thickness gain of 17 m. The maximum accumulation is located in the N crater area (28 m).
As in profile one, profile two (Figure 6b and Figure S6) shows only minor morphological changes between September 2018 and May 2019 in the N sector. In this period, the only accumulation of material occurs in correspondence with the SE rim of the N crater area with a gain of 7 m. Between May and August 2019, the variation due to the 3 July paroxysm is highlighted by significant material loss on both the SE and NW rims, including the upper sector of the SdF, with a maximum negative elevation difference of 20 m on the former one and an accumulation of material in the SE sector of the crater terrace of 6 m. Between August and September 2019, a period that includes the second paroxysm, the morphological variations are mainly limited to the central sector of the N crater area with maximum gain and loss of 10 and 5 m, respectively. The comparison of the cross-sections of September 2019 and January 2020 highlights an accumulation of material all along the N crater area (maximum gain of 7 m) and a minor diffuse erosion along the SdF slope (1–3 m). For this latter feature, it has to be considered what is stated in Section 2.2. Between January and June 2020, the main morphological variation is due to the craterization processes deepening the N crater area crossed by profile two, with a maximum elevation loss of 15 m, while a minor accumulation of material occurs in the SE sector of the N crater area (4 m). A comparison of the profile along the entire period, September 2018–June 2020, highlights the accumulation of material to the SE of the N crater area (maximum gain of 9 m) and a minor one in correspondence with its northwestern rim. The maximum loss of material occurs instead in the upper SdF (13 m) and to a lesser extent in correspondence with the N southeastern rim.
Profile three (Figure 6c and Figure S7) crosses the crater terrace in its CS sector and the lava field on its western slope and, compared to profiles one and two, shows the largest morphology variations. The cross-sections of September 2018 and May 2019 highlight only minor positive elevation variations confined on the two rims of the CS area with a maximum gain of 8 m. The 3 July paroxysm, contrarily to what happens in profiles one and two, produced a prevalent elevation gain evident in the central and eastern CS area (maximum gain of 23 m) and at the bottom of the SW slope, where lava accumulates to a maximum of 26 m. The only sector where erosion is evident is the SW rim of CS crater area (−20 m), completely dismantled by the explosive eruption and by the opening of the effusive vent. Between August and September 2019, the second paroxysm produced limited but diffuse changes characterized by positive elevation differences (maximum 11 m) along the first two thirds of the profile, while a loss of material is present only at the center of the CS area (−19 m) due to the craterization occurring in lower right C3 (Figure 3f). The comparison of cross-sections of September 2019 and January 2020 highlights a stationary situation along the SdF and in the easternmost sector of the crater terrace with the accumulation of material confined in the CS area (maximum gain of 26 m). In the following period, January to June 2020, the main morphological variation is due to the craterization processes deepening the CS crater area crossed by profile three, with a maximum elevation loss of 19 m in its center. A comparison of the profile along the entire period considered highlights profound morphological changes characterized only by positive elevation variations along all the trace with maximum accumulations of 34 m in the lava field and 38 m in the CS crater area. Remarkable observations include (1) how the minimum elevation for the base of the main craters both in the CS and N areas seems quite stable over the entire period, mostly for the N area, and (2) the stability of the limits of the crater terrace except for the SdF side and the NE debris talus.
Figure 7 shows the comparison of the cross-sections before and after the two paroxysmal explosions. The three profiles differ in terms of the prevailing gain or loss of material. In fact, while profiles one and two are characterized by material loss (−25 and 24 m, respectively; Figure 7a,b), profile three (Figure 7c) exhibits a predominant accumulation of volcanic products (maximum 26 m in the CS area and 33 m in the lava field area).

4. Discussion and Conclusions

4.1. UAS Volcanology: Limitations and Advantages

Our datasets of repeated, high temporal resolution UAS surveys provide unprecedented spatiotemporal detail of the morphological changes at Stromboli’s summit area. The survey flights allowed the generation of eight DSMs and seven orthomosaics of the Stromboli’s summit with resolutions of 0.15 and 0.05 m, respectively. These datasets provide a reconstruction of the crater terrace and upper Sciara del Fuoco areas, allowing us to identify and quantify morphological and volumetric changes. Here, we expand on an earlier study [22] that focused on the immediate vicinity of the active vents and the interdependence of morphology evolution and eruptive activity.
These results highlight the utility of UASs for volcano monitoring in providing cost-effective and responsive data acquisition. Our decimetric-resolution DSMs of Stromboli’s summit have more than one order of magnitude better resolution than other widely available satellite-based products. For instance, although capable of capturing large areas with a snapshot of their sensors, Pleiades-derived tri-stereo DEMs have a 1-m spatial resolution e.g., [52,53] and are often affected by low visibility in the crater terrace due to the presence of plume or clouds, whereas classical airborne LiDAR-derived DSMs can have sub-metric spatial resolution, but at much higher costs.
Although performing UAS surveys of Stromboli’s summit area is challenging due to its rugged terrain, steep slopes, the nature of the deposits, the frequent bad weather in wintertime, as well as the unavailability of GCPs, regular UAS surveys coupled with SfM remain the most responsive means to increase the frequency of detailed time-series topography datasets and to track geomorphic changes, especially when these take place in difficult or hazardous areas.
Our photogrammetric models reconstructed the crater terrace and upper Sciara del Fuoco areas with varying degrees of completeness depending mainly on volcanic activity, visibility conditions, the predefined or manual flight path, and the survey starting location. As shown in James and Robson [13], with the use of consumer-grade cameras, and in the absence of GCPs, SfM-derived datasets are able to provide topographic data with an overall precision of ~1/1000 of the viewing distance. Given our viewing distances of ~150–400 m, the 0.19 to 0.96 m distances between models are in line with this rule of thumb. The systematic use of a fixed flight path in future surveys, including convergent imagery and terrain following mode, will likely reduce the errors in photogrammetric reconstruction when GCPs cannot be incorporated into the photogrammetric processing [4,54].
The lack of GCPs on 3D model uncertainties could be also mitigated by the use of GNSS-RTK-enabled survey devices. Moreover, as successfully demonstrated by Thiele et al. [5], thermal images could be used in an SfM workflow to mitigate the adverse effects of degassing and poor visibility and provide more continuous time-series data than the visible-light equivalents.
Taking into account the above-mentioned limitations, the developed workflow proves to be adequate for acquiring multi-temporal high-resolution topography datasets from SfM in a complex environment such as Stromboli’s summit. These datasets, in particular the volume change estimation and the elevation difference maps, permitted to identify the changes in terms of the distribution and shifting of the vents within the crater terrace, the dismantling of both the CS and N crater rims toward the SdF, following the two paroxysmal eruptions, and the accumulation of material in the upper SdF. All the above-mentioned factors are very relevant on steep-sloped volcanoes in terms of hazard assessment for potential tsunamigenic landslides. In fact, in landslide-prone slopes as the SdF, the identification of the areas characterized by conditions of instability (e.g., N crater area after the 3 July 2019) or piled up materials with different geotechnical properties (e.g., in the upper SdF lava field) plays a crucial role for hazard assessment and risk mitigation strategies.
Unfortunately, despite the high temporal resolution of our surveys, the single visit between the two paroxysmal eruptions (4–5 August 2019) does not allow us to extrapolate the volumes of material removed and emplaced immediately after the two most energetic events. It is, thus, fundamental, for the future development of this research, to plan more frequent surveys, with rapid UAS deployment at the earliest signs of unrest as well as immediately after effusive, major, and paroxysmal eruptions.
Moreover, UAS-derived topographic datasets can be easily combined with other monitoring tools such as thermal infrared mapping, high-speed cameras, and field-based measurements and observations.

4.2. Processes Controlling the Morphology Changes

Between September 2018 and June 2020, the occurrence of regular but variably intense Strombolian activity, two paroxysmal explosions, and lava effusion produced different magnitudes and rates of morphological changes at the crater terrace and in the SdF throughout the studied period. Despite the important destructive processes generated by the two paroxysmal explosions, the overall accumulation processes prevailed in characterizing the dynamics in the crater terrace and upper SdF. Here, we analyze in detail the main constructive and destructive processes affecting the crater terrace and upper SdF in the studied period. By comparing our results with those of Schmid et al. [22], we observe a general agreement in elevation changes, with measured values that differ by 10% or less.

4.2.1. Constructive Processes

The most important constructive processes are lava flows and overflows, and the building up of cones, hornitos, and volcanic features due to Strombolian, major, and paroxysmal explosive activity.
Lava field area. Within the lava field area, we observed the accumulation of both lava flows and tephra deposits for a total of ~992,000 m3, corresponding to 2/3 of the entire volume emplaced in the surveyed area during the studied period (~1,538,000 m3; Figure 2, Figure 3, Figure 5 and Figure 7c and Figure S2) and to approximately 1/6 of the total erupted lava volume, quantified as 6.33 × 10⁶ m3 [42]. The tephra deposit, smaller than the lavas in terms of volume, originated from the two paroxysmal eruptions. The 3 July tephra deposits have been partly buried and partly pushed down on the SdF by the lava flows, while the deposit of 28 August is visible in Figure S2e,f on top of the cooling and inactive lava field. The lava field at the beginning of August 2019 consisted of multiple overlapping and well developed braided flows, characterized by lava tubes, skylights, and ephemeral vents (Figures S2c,d and S8), with backward erosion at the upper effusive vent and shifting southward of this latter one (from upper left to middle left in Figure S2c). Downslope, NW of the field of view of Figure S2, the emplacement of lava flows on the SdF steep slope produced a flow field characterized by continuous flow front failing and an accumulation of debris on the shoreline and below sea level through the generation of gravel flows (Figure S9). The maximum thickness of the deposit in the surveyed lava field area is 41.4 m (Figure 5) and is localized in the proximity of a slope break on the SdF, where a gentler slope favored the flows to slow down and pile up. A > 30-m-thick deposit is emplaced SSE from the aforementioned maximum, where a sub-vertical 60-m-high cliff acted as a levee favoring the accumulation of lavas. This cliff was generated in late medieval times and corresponds to the latest major sector collapse that occurred at Stromboli and the one leading to the development of the present SdF morphology (lower left in Figure 5; collapse “sc7b” in Francalanci et al. [55] and De Astis et al. [56].
The accumulation of lavas and tephra in the 2019 lava field sector has important implications in terms of slope stability. In fact, it occurred in a sector where instability has been highlighted since 2000. Here, a fissure swarm striking N30° toward the crater terrace, the so-called “fratture Tibaldi” (~650 m a.s.l.; FT in Figure 5) [57,58], appeared between autumn 1999 and May 2000. Between 2000 and 2006, a cumulative offset (at all fractures) of 1 m was recorded and the dilation kept on increasing in the following years. The rate of offset increase recorded at the main fracture was constant with values of ~7.5 cm in September 2000, ~22 cm in January 2006 [58], and 31 cm in January 2011 (Figure 8a), when it was measured for the last time by one of the authors (T.R.). The main fissure was still visible in May 2019 (Figure 8b), while its surface expression is presently recognizable in the aerial images (Figure 8c), orthomosaics (e.g., Figure S2f), and DSMs on top of the lava and tephra deposit (between 25 and 30 m above the pre-eruption surface) after the 2019 eruptive period.
Crater terrace. A widespread accumulation is evident within the crater terrace, mainly due to the two paroxysms but also to the Strombolian activity. The SE rim of the CS crater area (lower D3 in Figure 3e–h) is characterized by the maximum accumulated thickness of 40 m throughout the entire period, 27 of which derive from the 3 July eruption and the subsequent intense Strombolian activity (Figure 4b). This place and, to a minor extent, the ridge between the CS and N crater areas (lower D2 in Figure 3e–h) are the only stable and non-eroded sectors where the pyroclastic material has apparently not fallen back into the transient crater linked to the 3 July eruption. On the contrary, the second paroxysm of 28 August deposited more pyroclastic material on the ridge separating the CS and N crater areas (>10 m; Figure 4c). The intense Strombolian activity following 28 August caused both localized deposition and proximal accumulation that led to the generation of cones. In addition to the CS crater southeastern rim and the ridge between the CS and N crater areas, the sectors where a prominent accumulation is evident are (i) the CS western rim, involved in the collapses accompanying the two paroxysms, and (ii) E and NE of the CS area (Figure 3 and E3 and lower E2 in Figure 4), where the crater terrace is protected by gravitational erosive processes.
NE debris talus. Despite its average slope acclivity of 32–39°, the NEdt represents a site of accumulation of the products mainly deriving from the Strombolian activity and where gravel flows and rockfalls tend to regularly redistribute the material along this slope. The NEdt is characterized by a maximum thickness gain of 17 m. This is due to the fact that the NEdt is sustained at its foot by the remnants of the 2007 and 2014 lava field deposits. It is worth noting that the maximum accumulation of 3.3 m of material from both volcanic activity and gravel flows along the NEdt, is in agreement with the results reported in Di Traglia et al. [53] from a Pleiades DEMs comparison for the period May 2017–June 2019. Moreover, until May–June 2019 the morphological variations outside the crater terrace area affected only the NEdt (Figure 4a; Figure 4c in Di Traglia et al. [53]).

4.2.2. Destructive Processes

During the considered period, the most relevant factors of erosion were represented by (i) the dismantling of volcanic structures mainly due to paroxysmal eruptions, (ii) the oversteepening of newly formed volcanic structures, (iii) the collapses inside single funnel-shaped craters due to both gravitational processes and craterization during ordinary Strombolian activity, (iv) gravel flows due to the accumulation of material, and (v) the erosive gravitational processes on the SdF.
Crater terrace. The 3 July and, to a minor extent, the 28 August paroxysmal eruptions left large and deep (up to 27 m; Figure 4b and Figure 5) circular collapse crater zones in the CS area, while, in the N crater area, a deep collapse of the crater bottom only occurred on the 3 July. These areas are mainly characterized by loose material (Figure 3 in [32]) that is usually removed also during ordinary Strombolian activity (e.g., blue areas in Figure 4e). Similarly, the collapse along the western and northern crater terrace rim associated with both paroxysmal eruptions produced evident scars that participated in generating the pyroclastic density currents that occurred immediately after the two paroxysmal explosions (Figure 1a). Another noticeable instability during the investigated period is the N sector of the crater terrace where, after the first paroxysmal eruption of 3 July 2019, the vents shifted >20 m toward the SdF, generating an oversteepening that probably represented the main external factor in generating the pyroclastic density currents that occurred in March–April 2020 due to lava overflows [46].
At Stromboli, the position of individual vents migrates at a time scale of months to years concomitant to changes in eruptive activity [25], while the position of the crater areas within the crater terrace tends to be stable throughout time [25] and is mainly controlled by volcanotectonic weaknesses [31,32]. In the last tens of years, major and paroxysmal eruptions did not deeply affect crater areas limits; differently, the 3 July event partly dismantled the crater terrace NE rim, generating a new area of weakness controlling the opening position of new vents toward the SdF.
Sciara del Fuoco and slopes surrounding the crater terrace. Gravity-induced gravel flows characterized the external SW and NE slopes of the crater terrace immediately after the 3 July eruption (Figure S10), as a result of the accumulation of abundant juvenile and reworked material deriving from the 3 July eruption on steep slopes. A similar phenomenon occurred on the slope of the Rina Grande collapse depression where the sudden accumulation in the Pizzo area generated a gravel flow that reached 600 m a.s.l. (Figure S10; see also text and supplementary material in Andronico et al. [34]). Outside of the studied area, a similar phenomenon occurred throughout the effusive phase on the western sector of the SdF and up to the shoreline, in this case with a different origin: the accumulation of material originating from rockfalls at the lava flow front (Figure S9). NW of the crater terrace rim, in the central upper sector of the SdF, other less impulsive erosive gravitational processes are evident in the period September 2019–January 2020 (light blue in Figure 4d). In that area, despite an average slope acclivity of 30–35°, less steep in comparison to the NEdt, the erosion of the material accumulated during the two paroxysmal eruptions is facilitated by a smooth and compact ground surface.

4.3. Comparison of 2019 and Previous Effusive Eruptions

In the last 35 years, the following four major effusive eruptions occurred at Stromboli (lava volumes ranging 106–107 m3): December 1985–April 1986 [23], December 2002–July 2003 [59], February–April 2007 [60,61], and June–November 2014 [52,62]. The 2019 effusive eruptions differ from the major effusive eruptions in (i) the location of the site where the effusive vents opened, (ii) the elevation of the effusive vents on the SdF, (iii) the onset dynamics of the eruption, (iv) the Strombolian activity at the summit vents, and (v) the effusion rate.
Indeed, the 2019 effusive vent was localized in the CS crater area, while the previous four major effusive events originated on the SdF from a lateral vent at the base of the N crater area. It is worth noting that in all the aforementioned eruptions, the magma reached the surface along the same NE-trending weakness zone governed by the local tectonic field and crossing Stromboli’s crater terrace [57]. In 2019, the opening of the effusive vent was facilitated by the destruction of the western rim of the CS crater area that occurred in the first phase of the paroxysmal eruption of 3 July, favoring the emission of lava from a weakened structure characterized by the presence of previous feeder dykes (e.g., middle left C4 in Figure 3 and lower right in Figure S2), and then resulting in a continuous supply during the 2019 eruption. The last effusive eruption along the SdF involving the CS crater area occurred on 12 December 2010 [32,63], when a minor lava overflow emitted from an overhanging hornito, in a position equivalent to the upper right C3 of Figure 3, flowed down the SdF partly burying the “fratture Tibaldi” fissure swarm. Since 1950, only two other effusive eruptions occurred from the CS area, in February 1958 and August 1959 [64]. Thus, the 2019 effusive eruption represents the effusive event emitted by the CS crater area with the longest duration over the last 70 years.
Concerning the elevation, the 2019 effusive vents were localized between 750 and 770 m a.s.l., roughly at the elevation of the crater terrace floor, while the vents of the other major eruptions were located between 400 and 680 m a.s.l. and represented the result of the dyke propagation from the central conduits toward the Sciara del Fuoco [65,66].
In addition, contrary to the 2002–2003 and 2007 eruptions, when the paroxysmal explosions (5 April 2003 and 15 March 2007, respectively) occurred weeks to months after the onset of the effusive activity, the 2019 eruption started with the 3 July paroxysmal eruption and ended with the 28 August one.
Finally, an intense Strombolian activity preceded all five major effusive eruptions in the period 1985–2019. However, only in 2019 did the ordinary activity continue at the summit vents during the effusive phase of the eruption, sustained by the higher level of magma within the central conduits, while it stopped during the other four major effusive eruptions. This was possibly due to the fact that the 2019 effusive eruption was not characterized by the opening of effusive vents at lower elevations on the SdF, draining the shallower magma present beneath the crater terrace and, thus, triggering the collapse of the crater terrace floor, as in the previous eruptions.
Comparing the effusion rates and volumes characterizing the recent effusive eruptions, while the average rate for the 2019 eruption, as well as its volume (1.26 m3/s, Plank et al. [42]), is comparable with the ones between 1985 and 2014 (1985–1986—0.45 m3/s, 5.5 × 10⁶ m3; 2002–2003—0.61 m3/s, 10.8 × 10⁶ m3; 2007—3.16 m3/s, 9.5 × 10⁶ m3; 2014—0.60 m3/s, 5.5 × 10⁶ m3; Ripepe et al. [62] and reference therein), a substantial difference can be evidenced in its variation with time. In fact, during the previous eruptions, the effusion rates decreased rapidly and almost exponentially within the first five days from the effusive onset, while in 2019 it remained apparently more stable during the eruption [42].
A further comparison with the previous eruptive periods can be conducted concerning the evolution of the crater terrace after the 2002–2003 and 2007 eruptions. Calvari et al. [61] estimated a mean fill rate for the crater terrace of ca. 0.01 m3/s (approximately 864 m3/day) for the inter-eruptive period between July 2003 and February 2007. This value is higher than our calculated mean fill rate of ca. 0.009 m3/s (749 m3/day) for the inter-eruptive periods of September 2018–May 2019 and September 2019–January 2020. The difference is probably due to the different crater terrace morphology characterizing the 2003–2007 and the 2007–2019 periods, when a 50–70-m deep and vast crater terrace morphology was present (Figure 6 in Proietti et al. [67]; Figure 3 in Calvari et al. [32]), evolving into a platform where the most part of the erupted tephra could be hosted, whereas after the two paroxysmal eruptions of July and August 2019, the N and CS crater areas were affected by a lower degree of deepening, maintaining a septum between the two crater areas (lower D2 in Figure 3e), and leaving the other sectors of the crater terrace unaltered. In fact, the crater terrace floor did not collapse in 2019 as it happened in 2002–2003 and 2007.
The differences mentioned above could be the results of structural changes that occurred in the shallower portion of the central conduits after the 2007 eruption [32]. However, analyzing the magmatic and structural processes involved in the 2019 eruptions and leading to further interpretations is beyond the scope of this paper and the reader is referred to the recent literature for additional details [27,34,38,39,68,69].

4.4. Conclusive Remarks

Routinely used UAS monitoring flights can be very helpful to observe eruptive activity from safer locations, assess eruptive dynamics, and integrate datasets deriving from various monitoring networks. Crater, vent, and lava field locations, morphologies and their evolution are key parameters to understanding eruption style and assessing volcanic hazards and the related impact. The data collected during our surveys and the subsequent analysis permit us to locate and characterize the morphological changes of the vents in detail, reducing the uncertainty in the explosion source and providing constraints to the geophysical model inputs for seismic and acoustic arrays and camera-derived observations of explosive dynamics. In particular, morphological data and eruption parameters can be used for 3D numerical models on the dispersion of ballistic bombs and blocks with important implications for the hazard assessment posed by ballistic ejecta during explosive eruptions.
Further studies should be performed to evaluate the potential hazard posed by the overload on the unstable “fratture Tibaldi” area and the prompt identification of new fractures, and related dynamics, appearing in the lava field. Moreover, future studies combining the relation between morphology and volcanic activity changes could contribute to further characterize the eruptive dynamics and the shift of activity from one vent to another one, or the type of Strombolian explosion (see Gaudin et al. [70] for a comprehensive description of explosion types for normal explosions at Stromboli). Finally, a regularly updated topography quantifying the morphological changes of the upper SdF and crater terrace could be of great value for the civil protection authorities and, more in general, for the volcanological community.

Supplementary Materials

The following are available online at https://www.mdpi.com/article/10.3390/rs13152870/s1. Table S1: processing parameters used in Agisoft Metashape. Table S2: Model alignments and associated rms errors reported in Cloud Compare software. Table S3: Change detection results for the period May 2019-September 2019 calculated over the Crater Terrace Area of Interest (CT-AOI). Table S4: Change detection results for the period September 2018-June 2020 calculated over the Crater Terrace Area of Interest (CT-AOI). Table S5: Elevation values (in m) extracted at 5 checkpoints placed in the unchanged regions of our DSMs. Figure S1: features located in unchanged areas of the volcano used for the alignment of the models. Figure S2: DSMs and orthomosaics of the lava field area. Figure S3: Alignment of hornitos in the N crater area and plume rising from two vents located in the CS crater area (in the upper right background). Figure S4: Block deposited on the SdF on 28 August 2019 and the crater terrace rim. Figure S5: Cross-sections of the crater terrace through time (12 September 2018 to 20 June 2020) along profile 1 in Figure 5. Figure S6: Cross-sections of the SW crater area and upper SdF through time (12 September 2018 to 20 June 2020) along profile 2 in Figure 5. Figure S7: Cross-sections of the lava field and CS crater area through time (12 September 2018 to 20 June 2020) along profile 3 in Figure 5. Figure S8: Lava field and active lava flows in the upper SdF on 4 August 2019. Figure S9: Characteristic morphology of gravel flow deposits at the foot of the SdF slope and an active gravel flow descending it (5 August 2019). Figure S10: Gravel flows descending from the Pizzo area within Rina Grande and towards the NEdt sector.

Author Contributions

R.C. and T.R. conceptualized the study; T.R., R.C., P.S., J.T. and U.K. organized the field activities; R.C. elaborated all photogrammetric data; R.C. and T.R. wrote the original draft; P.S., D.A., M.C., E.D.B. (Emanuela De Beni), E.D.B. (Elisabetta Del Bello), L.P., M.S., K.S. and J.T. supported the study and provided suggestions for its improvement. All authors have read and agreed to the published version of the manuscript.

Funding

This study has benefited from funding provided by the MIUR Premiale Project 2012 NORTh (New hORizons of the Technology applied to experimental researches and geophysical and volcanological monitoring) and INGV Departmental Strategic Project UNO (UNderstanding the Ordinary to forecast the extraordinary: An integrated approach for studying and interpreting the explosive activity at Stromboli volcano; https://progetti.ingv.it/it/progetti-dipartimentali/vulcani/uno, accessed on 20 July 2021). Author B.C. was supported by a National Science Foundation (USA) Postdoctoral Fellowship (Award EAR-1725768).

Data Availability Statement

The January 2020 aerial image dataset is publicly available at GFZ Data Repository (https://doi.org/10.5880/fidgeo.2021.015, accessed on 20 July 2021) and is shared with the paper Schmid et al. [22]. The September 2018 point cloud is publicly available in OpenTopography Repository at https://doi.org/10.5069/G9R49NXH (accessed on 20 July 2021). The 0.25-m DSMs used for volume change estimations are publicly available in the OpenTopography Repository at https://doi.org/10.5069/G95M63WV (accessed on 20 July 2021). All the other data (aerial images and point clouds) are available upon request to the corresponding author.

Acknowledgments

We are indebted to Dipartimento della Protezione Civile—Presidenza del Consiglio dei Ministri for providing the LiDAR data used as a reference for aligning the point cloud derived from the September 2018 survey and the orthorectified image used as the background of Figure 2 and Figure S1, to Stefano Branca (INGV-OE Director), who kindly provided the photographs of the summit craters taken on 4 July 2019, to the “2nd Coast Guard Air Unit of Catania”, organizing that helicopter overflight, to the Laboratorio di Geologia e Geotecnologie of INGV for providing the hardware and software resources for data analysis, and to the Broadband ACquisition and Imaging Operation (BACIO) workshops (Taddeucci et al. [10]) participants for the invaluable discussions. The contents of this article represent the authors’ ideas and do not necessarily correspond to the official opinion and policies of the Dipartimento della Protezione Civile—Presidenza del Consiglio dei Ministri. We thank the Editor and three anonymous reviewers for the editorial handling and for the constructive comments provided.

Conflicts of Interest

The authors declare no conflict of interest.

References

  1. Carr, B.B.; Clarke, A.; Arrowsmith, J.R.; Vanderkluysen, L.; Dhanu, B.E. The emplacement of the active lava flow at Sinabung Volcano, Sumatra, Indonesia, documented by Structure-from-Motion photogrammetry. J. Volcanol. Geotherm. Res. 2019, 382, 164–172. [Google Scholar] [CrossRef]
  2. Favalli, M.; Fornaciai, A.; Mazzarini, F.; Harris, A.; Neri, M.; Behncke, B.; Pareschi, M.T.; Tarquini, S.; Boschi, E. Evolution of an active lava flow field using a multitemporal LIDAR acquisition. J. Geophys. Res. Space Phys. 2010, 115, 11203. [Google Scholar] [CrossRef] [Green Version]
  3. James, M.R.; Pinkerton, H.; Applegarth, L.J. Detecting the development of active lava flow fields with a very-long-range terrestrial laser scanner and thermal imagery. Geophys. Res. Lett. 2009, 36, 22305. [Google Scholar] [CrossRef]
  4. James, M.; Robson, S. Sequential digital elevation models of active lava flows from ground-based stereo time-lapse imagery. ISPRS J. Photogramm. Remote Sens. 2014, 97, 160–170. [Google Scholar] [CrossRef]
  5. Thiele, S.; Varley, N.; James, M. Thermal photogrammetric imaging: A new technique for monitoring dome eruptions. J. Volcanol. Geotherm. Res. 2017, 337, 140–145. [Google Scholar] [CrossRef] [Green Version]
  6. Pallister, J.; Wessels, R.; Griswold, J.; McCausland, W.; Kartadinata, N.; Gunawan, H.; Budianto, A.; Primulyana, S. Monitoring, forecasting collapse events, and mapping pyroclastic deposits at Sinabung volcano with satellite imagery. J. Volcanol. Geotherm. Res. 2019, 382, 149–163. [Google Scholar] [CrossRef]
  7. Bisson, M.; Spinetti, C.; Andronico, D.; Palaseanu-Lovejoy, M.; Buongiorno, M.F.; Alexandrov, O.; Cecere, T. Ten years of volcanic activity at Mt Etna: High-resolution mapping and accurate quantification of the morphological changes by Pleiades and Lidar data. Int. J. Appl. Earth Obs. Geoinf. 2021, 102, 102369. [Google Scholar] [CrossRef]
  8. Fornaciai, A.; Andronico, D.; Favalli, M.; Spampinato, L.; Branca, S.; Lodato, L.; Bonforte, A.; Nannipieri, L. The 2004–2005 Mt. Etna Compound Lava Flow Field: A Retrospective Analysis by Combining Remote and Field Methods. J. Geophys. Res. Solid Earth 2021, 126, 020499. [Google Scholar] [CrossRef]
  9. Di Traglia, F.; De Luca, C.; Manzo, M.; Nolesini, T.; Casagli, N.; Lanari, R.; Casu, F. Joint exploitation of space-borne and ground-based multitemporal InSAR measurements for volcano monitoring: The Stromboli volcano case study. Remote Sens. Environ. 2021, 260, 112441. [Google Scholar] [CrossRef]
  10. Taddeucci, J.; Scarlato, P.; Del Bello, E.; Spina, L.; Ricci, T.; Gaudin, D.; Tournigand, P.-Y. The dynamics of explosive mafic eruptions: New insights from multiparametric observations. In Forecasting and Planning for Volcanic Hazards, Risks, and Disasters; Elsevier BV: Amsterdam, The Netherlands, 2021; Volume 2, pp. 379–411. [Google Scholar]
  11. Jordan, B.R. Collecting field data in volcanic landscapes using small UAS (sUAS)/drones. J. Volcanol. Geotherm. Res. 2019, 385, 231–241. [Google Scholar] [CrossRef]
  12. James, M.R.; Carr, B.; D’Arcy, F.; Diefenbach, A.; Dietterich, H.; Fornaciai, A.; Lev, E.; Liu, E.; Pieri, D.; Rodgers, M.; et al. Volcanological applications of unoccupied aircraft systems (UAS): Developments, strategies, and future challenges. Volcanica 2020, 3, 67–114. [Google Scholar] [CrossRef] [Green Version]
  13. James, M.; Robson, S. Straightforward reconstruction of 3D surfaces and topography with a camera: Accuracy and geoscience application. J. Geophys. Res. Space Phys. 2012, 117, 03017. [Google Scholar] [CrossRef] [Green Version]
  14. Nakano, T.; Kamiya, I.; Tobita, M.; Iwahashi, J.; Nakajima, H. Landform monitoring in active volcano by UAV and SfM-MVS technique. ISPRS—Int. Arch. Photogramm. Remote. Sens. Spat. Inf. Sci. 2014, XL-8, 71–75. [Google Scholar] [CrossRef] [Green Version]
  15. Turner, N.; Houghton, B.; Taddeucci, J.; von der Lieth, J.; Kueppers, U.; Gaudin, D.; Ricci, T.; Kim, K.; Scalato, P. Drone Peers into Open Volcanic Vents. Eos 2017. [Google Scholar] [CrossRef]
  16. De Beni, E.; Cantarero, M.; Messina, A. UAVs for volcano monitoring: A new approach applied on an active lava flow on Mt. Etna (Italy), during the 27 February–2 March 2017 eruption. J. Volcanol. Geotherm. Res. 2019, 369, 250–262. [Google Scholar] [CrossRef]
  17. Leggett, T.N.; Befus, K.S.; Kenderes, S. Rhyolite lava emplacement dynamics inferred from surface morphology. J. Volcanol. Geotherm. Res. 2020, 395, 106850. [Google Scholar] [CrossRef]
  18. Darmawan, H.; Walter, T.R.; Brotopuspito, K.S.; Subandriyo; Nandaka, I.G.M.A. Morphological and structural changes at the Merapi lava dome monitored in 2012–15 using unmanned aerial vehicles (UAVs). J. Volcanol. Geotherm. Res. 2018, 349, 256–267. [Google Scholar] [CrossRef]
  19. Zorn, E.; Walter, T.R.; Johnson, J.B.; Mania, R. UAS-based tracking of the Santiaguito Lava Dome, Guatemala. Sci. Rep. 2020, 10, 1–13. [Google Scholar] [CrossRef] [PubMed]
  20. Andaru, R.; Rau, J.-Y.; Syahbana, D.K.; Prayoga, A.S.; Purnamasari, H.D. The use of UAV remote sensing for observing lava dome emplacement and areas of potential lahar hazards: An example from the 2017–2019 eruption crisis at Mount Agung in Bali. J. Volcanol. Geotherm. Res. 2021, 415, 107255. [Google Scholar] [CrossRef]
  21. Rosi, M.; Pistolesi, M.; Bertagnini, A.; Landi, P.; Pompilio, M.; Di Roberto, A. Chapter 14 Stromboli volcano, Aeolian Islands (Italy): Present eruptive activity and hazards. Geol. Soc. Lond. Mem. 2013, 37, 473–490. [Google Scholar] [CrossRef]
  22. Schmid, M.; Kueppers, U.; Civico, R.; Ricci, T.; Taddeucci, J.; Dingwell, D.B. Characterising vent and crater shape changes at Stromboli: Implications for risk areas. Volcanica 2021, 4, 87–105. [Google Scholar] [CrossRef]
  23. Barberi, F.; Rosi, M.; Sodi, A. Volcanic hazard assessment at Stromboli based on review of historical data. Acta Vulcanol. 1993, 3, 173–187. [Google Scholar]
  24. Andronico, D.; Corsaro, R.; Cristaldi, A.; Polacci, M. Characterizing high energy explosive eruptions at Stromboli volcano using multidisciplinary data: An example from the 9 January 2005 explosion. J. Volcanol. Geotherm. Res. 2008, 176, 541–550. [Google Scholar] [CrossRef]
  25. Salvatore, V.; Silleni, A.; Corneli, D.; Taddeucci, J.; Palladino, D.M.; Sottili, G.; Bernini, D.; Andronico, D.; Cristaldi, A. Parameterizing multi-vent activity at Stromboli Volcano (Aeolian Islands, Italy). Bull. Volcanol. 2018, 80, 64. [Google Scholar] [CrossRef]
  26. Bertagnini, A.; Métrich, N.; Francalanci, L.; Landi, P.; Tommasini, S.; Conticelli, S. Volcanology and magma geochemistry of the present-day activity: Constraints on the feeding system. In Learning from Stromboli; Calvari, S.S., Inguaggiato, G., Puglisi, M.R., Rosi, M., Eds.; AGU: Washington, DC, USA, 2008; pp. 19–37. [Google Scholar]
  27. Métrich, N.; Bertagnini, A.; Pistolesi, M. Paroxysms at Stromboli Volcano (Italy): Source, Genesis and Dynamics. Front. Earth Sci. 2021, 9. [Google Scholar] [CrossRef]
  28. Andronico, D.; Pistolesi, M. The November 2009 paroxysmal explosions at Stromboli. J. Volcanol. Geotherm. Res. 2010, 196, 120–125. [Google Scholar] [CrossRef]
  29. Andronico, D.; Taddeucci, J.; Cristaldi, A.; Miraglia, L.; Scarlato, P.; Gaeta, M. The 15 March 2007 paroxysm of Stromboli: Video-image analysis, and textural and compositional features of the erupted deposit. Bull. Volcanol. 2013, 75, 1–19. [Google Scholar] [CrossRef]
  30. Tibaldi, A.; Corazzato, C.; Apuani, T.; Pasquarè, F.A.; Vezzoli, L.; Calvari, S.; Inguaggiato, S.; Puglisi, G.; Ripepe, M.; Rosi, M. Geological-Structural Framework of Stromboli Volcano, Past Collapses, and the Possible Influence on the Events of the 2002–2003 Crisis. In Large Igneous Provinces; American Geophysical Union (AGU): Washington, DC, USA, 2013; pp. 5–17. [Google Scholar]
  31. Tibaldi, A. Multiple sector collapses at Stromboli volcano, Italy: How they work. Bull. Volcanol. 2001, 63, 112–125. [Google Scholar] [CrossRef]
  32. Calvari, S.; Bonaccorso, A.; Madonia, P.; Neri, M.; Liuzzo, M.; Salerno, G.G.; Behncke, B.; Caltabiano, T.; Cristaldi, A.; Giuffrida, G.; et al. Major eruptive style changes induced by structural modifications of a shallow conduit system: The 2007–2012 Stromboli case. Bull. Volcanol. 2014, 76, 1–15. [Google Scholar] [CrossRef]
  33. INGV (2019). Stromboli, Rep. N° 27/2019. Bollettino Settimanale, 24–30 June 2019. Available online: https://www.ct.ingv.it/index.php/monitoraggio-e-sorveglianza/prodotti-del-monitoraggio/bollettini-settimanali-multidisciplinari/83-bollettino-settimanale-sul-monitoraggio-vulcanico-geochimico-e-sismico-del-vulcano-stromboli-del-02-07-2019/file (accessed on 17 July 2021).
  34. Andronico, D.; Del Bello, E.; D’Oriano, C.; Landi, P.; Pardini, F.; Scarlato, P.; Vitturi, M.D.M.; Taddeucci, J.; Cristaldi, A.; Ciancitto, F.; et al. Uncovering the eruptive patterns of the 2019 double paroxysm eruption crisis of Stromboli volcano. Nat. Commun. 2021, 12, 4213. [Google Scholar] [CrossRef]
  35. INGVvulcani. The 3 July 2019 Paroxysm of Stromboli and Its Activity during the Following Days. 2019. Available online: https://ingvvulcani.com/2019/07/15/the-3-july-2019-paroxysm-of-stromboli-and-its-activity-during-the-following-days/ (accessed on 17 July 2021).
  36. LGS_UNIFI. Esplosione parossistica del vulcano Stromboli del 03_07_2019. 2019. Available online: http://lgs.geo.unifi.it/index.php/stromboli-events?view=document&id=7:esplosione-parossistica-03-07-2019&catid=14 (accessed on 17 July 2021).
  37. Inguaggiato, S.; Vita, F.; Cangemi, M.; Calderone, L. Changes in CO2 Soil Degassing Style as a Possible Precursor to Volcanic Activity: The 2019 Case of Stromboli Paroxysmal Eruptions. Appl. Sci. 2020, 10, 4757. [Google Scholar] [CrossRef]
  38. Giordano, G.; De Astis, G. The summer 2019 basaltic Vulcanian eruptions (paroxysms) of Stromboli. Bull. Volcanol. 2021, 83, 1–27. [Google Scholar] [CrossRef]
  39. Viccaro, M.; Cannata, A.; Cannavò, F.; De Rosa, R.; Giuffrida, M.; Nicotra, E.; Petrelli, M.; Sacco, G. Shallow conduit dynamics fuel the unexpected paroxysms of Stromboli volcano during the summer 2019. Sci. Rep. 2021, 11, 1–15. [Google Scholar] [CrossRef] [PubMed]
  40. Turchi, A.; Di Traglia, F.; Luti, T.; Olori, D.; Zetti, I.; Fanti, R. Environmental Aftermath of the 2019 Stromboli Eruption. Remote Sens. 2020, 12, 994. [Google Scholar] [CrossRef] [Green Version]
  41. ISPRA. Nota tecnica—Il maremoto del 28 Agosto 2019 a Stromboli. Istituto Superiore per la Protezione e la Ricerca Ambientale, GEO-RIS & CN-COS, 7p. 2019. Available online: https://www.snpambiente.it/wp-content/uploads/2019/08/report_maremoto_28_agosto_2019.pdf (accessed on 17 July 2021).
  42. Plank, S.; Marchese, F.; Filizzola, C.; Pergola, N.; Neri, M.; Nolde, M.; Martinis, S. The July/August 2019 Lava Flows at the Sciara del Fuoco, Stromboli–Analysis from Multi-Sensor Infrared Satellite Imagery. Remote Sens. 2019, 11, 2879. [Google Scholar] [CrossRef] [Green Version]
  43. INGV-OE. Comunicato straordinario Stromboli del 28/08/2019. Aggiornamento vulcanologico sul fenomeno in corso. Confidential Report for Civil Protection authorities. 2019. [Google Scholar]
  44. INGVvulcani. Nuovo Parossismo a Stromboli, 28 Agosto 2019. 2019. Available online: https://ingvvulcani.com/2019/08/30/nuovo-parossismo-a-stromboli-28-agosto-2019/ (accessed on 17 July 2021).
  45. LGS_UNIFI. Esplosione Parossistica del Vulcano Stromboli del 28_08_2019. 2019. Available online: http://lgs.geo.unifi.it/index.php/stromboli-events?view=document&id=8:esplosione-parossistica-28-08-2019&catid=14 (accessed on 17 July 2021).
  46. Calvari, S.; Di Traglia, F.; Ganci, G.; Giudicepietro, F.; Macedonio, G.; Cappello, A.; Nolesini, T.; Pecora, E.; Bilotta, G.; Centorrino, V.; et al. Overflows and Pyroclastic Density Currents in March-April 2020 at Stromboli Volcano Detected by Remote Sensing and Seismic Monitoring Data. Remote Sens. 2020, 12, 3010. [Google Scholar] [CrossRef]
  47. Carr, B.B. Stromboli Volcano (Vent area only): Italy. 12 September 2018. Distributed by OpenTopography. 2019. Available online: https://doi.org/10.5069/G9R49NXH (accessed on 17 July 2021).
  48. Salvatici, T.; Di Roberto, A.; Di Traglia, F.; Bisson, M.; Morelli, S.; Fidolini, F.; Bertagnini, A.; Pompilio, M.; Hungr, O.; Casagli, N. From hot rocks to glowing avalanches: Numerical modelling of gravity-induced pyroclastic density currents and hazard maps at the Stromboli volcano (Italy). Geomorphology 2016, 273, 93–106. [Google Scholar] [CrossRef] [Green Version]
  49. Besl, P.J.; McKay, N.D. Method for registration of 3-D shapes. In Proceedings of the Sensor Fusion IV: Control Paradigms and Data Structures, Boston, MA, USA, 14–15 November 1991; pp. 586–606. [Google Scholar]
  50. USGS. USGS National UAS Project Office. Unmanned Aircraft Systems Data Post-Processing: Structure-from-Motion Photogrammetry. 2017. Available online: https://uas.usgs.gov/nupo/pdf/USGSAgisoftPhotoScanWorkflow.pdf (accessed on 17 July 2021).
  51. INGV-OE. Comunicato Stromboli Aggiornamento n. 33 del 30/08/2019. Confidential Report for Civil Protection authorities. 2019. [Google Scholar]
  52. Di Traglia, F.; Calvari, S.; D’Auria, L.; Nolesini, T.; Bonaccorso, A.; Fornaciai, A.; Esposito, A.; Cristaldi, A.; Favalli, M.; Casagli, N. The 2014 Effusive Eruption at Stromboli: New Insights from In Situ and Remote-Sensing Measurements. Remote Sens. 2018, 10, 2035. [Google Scholar] [CrossRef] [Green Version]
  53. Di Traglia, F.; Fornaciai, A.; Favalli, M.; Nolesini, T.; Casagli, N. Catching Geomorphological Response to Volcanic Activity on Steep Slope Volcanoes Using Multi-Platform Remote Sensing. Remote Sens. 2020, 12, 438. [Google Scholar] [CrossRef] [Green Version]
  54. Wackrow, R.; Chandler, J. A convergent image configuration for DEM extraction that minimises the systematic effects caused by an inaccurate lens model. Photogramm. Rec. 2008, 23, 6–18. [Google Scholar] [CrossRef] [Green Version]
  55. Francalanci, L.; Lucchi, F.; Keller, J.; De Astis, G.; Tranne, C.A. Eruptive, volcano–tectonic and magmatic history of the Stromboli volcano (north–eastern Aeolian archipelago). Geol. Soc. Lond. Mem. 2013, 37, 397–471. [Google Scholar] [CrossRef]
  56. De Astis, G.; Lucchi, F.; Dellino, P.; La Volpe, L.; Tranne, C.A.; Frezzotti, M.L.; Peccerillo, A. Geology, volcanic history and petrology of Vulcano (central Aeolian archipelago). Geol. Soc. Lond. Mem. 2013, 37, 281–349. [Google Scholar] [CrossRef]
  57. Tibaldi, A.; Corazzato, C.; Apuani, T.; Cancelli, A. Deformation at Stromboli volcano (Italy) revealed by rock mechanics and structural geology. Tectonophysics 2003, 361, 187–204. [Google Scholar] [CrossRef]
  58. Casagli, N.; Tibaldi, A.; Merri, A.; Del Ventisette, C.; Apuani, T.; Guerri, L.; Fortuny-Guasch, J.; Tarchi, D. Deformation of Stromboli Volcano (Italy) during the 2007 eruption revealed by radar interferometry, numerical modelling and structural geological field data. J. Volcanol. Geotherm. Res. 2009, 182, 182–200. [Google Scholar] [CrossRef]
  59. Calvari, S.; Inguaggiato, S.; Puglisi, G.; Ripepe, M.; Rosi, M. The Stromboli Volcano: An Integrated Study of the 2002–2003 Eruption-Introduction. In The Stromboli Volcano: An Integrated Study of the 2002–2003 Eruption; Calvari, S., Inguaggiato, S., Puglisi, G., Ripepe, M., Rosi, M., Eds.; American Geophysical Union (AGU): Washington, DC, USA, 2008; pp. 1–3. [Google Scholar]
  60. Barberi, F.; Civetta, L.; Rosi, M.; Scandone, R. Chronology of the 2007 eruption of Stromboli and the activity of the Scientific Synthesis Group. J. Volcanol. Geotherm. Res. 2009, 182, 123–130. [Google Scholar] [CrossRef]
  61. Calvari, S.; Lodato, L.; Steffke, A.; Cristaldi, A.; Harris, A.J.L.; Spampinato, L.; Boschi, E. The 2007 Stromboli eruption: Event chronology and effusion rates using thermal infrared data. J. Geophys. Res. Space Phys. 2010, 115. [Google Scholar] [CrossRef] [Green Version]
  62. Ripepe, M.; Pistolesi, M.; Coppola, D.; Donne, D.D.; Genco, R.; Lacanna, G.; Laiolo, M.; Marchetti, E.; Ulivieri, G.; Valade, S. Forecasting Effusive Dynamics and Decompression Rates by Magmastatic Model at Open-vent Volcanoes. Sci. Rep. 2017, 7, 3885. [Google Scholar] [CrossRef]
  63. Coppola, D.; Piscopo, D.; Laiolo, M.; Cigolini, C.; Donne, D.D.; Ripepe, M. Radiative heat power at Stromboli volcano during 2000–2011: Twelve years of MODIS observations. J. Volcanol. Geotherm. Res. 2012, 215–216, 48–60. [Google Scholar] [CrossRef] [Green Version]
  64. Marsella, M.; Baldi, P.; Coltelli, M.; Fabris, M. The morphological evolution of the Sciara del Fuoco since 1868: Reconstructing the effusive activity at Stromboli volcano. Bull. Volcanol. 2011, 74, 231–248. [Google Scholar] [CrossRef]
  65. Neri, M.; Lanzafame, G.; Acocella, V. Dyke emplacement and related hazard in volcanoes with sector collapse: The 2007 Stromboli (Italy) eruption. J. Geol. Soc. 2008, 165, 883–886. [Google Scholar] [CrossRef]
  66. Verrucci, L.; Tommasi, P.; Boldini, D.; Graziani, A.; Rotonda, T. Modelling the instability phenomena on the NW flank of Stromboli Volcano (Italy) due to lateral dyke intrusion. J. Volcanol. Geotherm. Res. 2019, 371, 245–262. [Google Scholar] [CrossRef]
  67. Proietti, C.; Coltelli, M.; Marsella, M.; Sonnessa, A.; Bernardo, E. Photogrammetric and LIDAR surveys on the Sciara del Fuoco to monitor the 2007 Stromboli eruption. In Proceedings of the 2008 Second Workshop on Use of Remote Sensing Techniques for Monitoring Volcanoes and Seismogenic Areas, Napoli, Italy, 11–14 November 2008; pp. 1–6. [Google Scholar] [CrossRef]
  68. Calvari, S.; Giudicepietro, F.; Di Traglia, F.; Bonaccorso, A.; Macedonio, G.; Casagli, N. Variable Magnitude and Intensity of Strombolian Explosions: Focus on the Eruptive Processes for a First Classification Scheme for Stromboli Volcano (Italy). Remote Sens. 2021, 13, 944. [Google Scholar] [CrossRef]
  69. Giudicepietro, F.; López, C.; Macedonio, G.; Alparone, S.; Bianco, F.; Calvari, S.; De Cesare, W.; Donne, D.D.; Di Lieto, B.; Esposito, A.M.; et al. Geophysical precursors of the July-August 2019 paroxysmal eruptive phase and their implications for Stromboli volcano (Italy) monitoring. Sci. Rep. 2020, 10, 10296. [Google Scholar] [CrossRef] [PubMed]
  70. Gaudin, D.; Taddeucci, J.; Scarlato, P.; Bello, E.; Ricci, T.; Orr, T.; Houghton, B.; Harris, A.; Rao, S.; Bucci, A. Integrating puffing and explosions in a general scheme for Strombolian-style activity. J. Geophys. Res. Solid Earth 2017, 122, 1860–1875. [Google Scholar] [CrossRef]
Figure 1. Aerial images of Stromboli’s crater terrace taken before (a) and after (b) the 3 July 2019 paroxysmal eruption (photos by S. Branca, INGV-OE). N, CS, and LF stand for north crater area, central-south crater area, and lava flows, respectively. Note that the metric scales are approximated and are computed at the center of the scenes.
Remotesensing 13 02870 g001
Figure 2. Map of Stromboli summit area showing the extent of the photogrammetric surveys of the crater terrace carried out in this work. CT, CS, N, and NEdt stand for crater terrace, central-south crater area, north crater area and north-east debris talus, respectively.
Remotesensing 13 02870 g002
Figure 3. (a) Location map; (bh) Multidirectional hillshades of the Digital Surface Models of Stromboli’s summit, in chronological order. Description in Section 3.1.
Remotesensing 13 02870 g003
Figure 4. (af) Elevation difference maps highlighting changes in the Stromboli summit area for the period September 2018–June 2020. Blue areas indicate material loss, whereas yellow/red areas indicate material gain. The black dashed lines enclose the Area of Interest (AOI) for each time interval. Description in Section 3.2.
Remotesensing 13 02870 g004
Figure 5. DEM of Difference (DoD) of the Stromboli summit area for the period May–September 2019 (pre- and post-2019 paroxysms). Black lines show the traces of the topographic profiles shown in Figure 6. Blue areas indicate material loss, whereas yellow/red areas indicate material gain. The black dots pinpoint the locus of maximum material gain and maximum material loss; the black dashed line encloses the common Area Of Interest of all surveys for the crater terrace (CT-AOI); the black dotted line encloses the common Area Of Interest of three surveys (May, August, and September 2019) for the crater terrace and upper SdF (SFCT-AOI); FT stands for “fratture Tibaldi” fissure swarm (white lines, see Discussion and Conclusions Section).
Remotesensing 13 02870 g005
Figure 6. (a) Cross-sections of the crater terrace through time (12 September 2018 to 20 June 2020) along profile 1 in Figure 5. (b) Cross-sections of the SW crater area and upper SdF through time (12 September 2018 to 20 June 2020) along profile 2 in Figure 5. (c) Cross-sections of the lava field and SW crater area through time (12 September 2018 to 20 June 2020) along profile 3 in Figure 5.
Remotesensing 13 02870 g006
Figure 7. Comparison of cross-sections before and after the two paroxysmal events (topographic profiles of 11 May and 23 September 2019). (a) Cross-sections of the crater terrace along profile 1 in Figure 5. (b) Cross-sections of the SW crater area and upper SdF along profile 2 in Figure 5. (c) Cross-sections of the lava field and SW crater area along profile 3 in Figure 5.
Remotesensing 13 02870 g007
Figure 8. Recent evolution of the main N30° fissure belonging to the “fratture Tibaldi” fissure swarm. (a) Close-up view of the fissure. (b) Pre-eruption aerial image of the SW sector of SdF and the fissure shown in (a) (yellow rectangle). (c) Post-eruption aerial image of the SW sector of SdF and the new surface expression of the N30° fissure (white arrows). Red circles identify common areas in (b,c).
Remotesensing 13 02870 g008
Table 1. Details of the photogrammetric surveys; * Point cloud from Carr [47].
Survey Date12 September 2018 *11 May 201920 June 20194–5 August 201923 Sebtember 201926 November 2019 (Lava Field Only)25 January 202020 June 2020
UAS/CameraDJI M210, Zenmuse X4SDJI Mavic 2 Pro, L1D-20cDJI Mavic 2 Pro, L1D-20cDJI Mavic 2 Pro, L1D-20cDJI Mavic 2 Pro, L1D-20cDJI Mavic 2 Pro, L1D-20cDJI Mavic 2 Pro, L1D-20cDJI Mavic 2 Pro, L1D-20c
WeatherClearClearClearClearClearCloudyClearClear
Flight pathManualPredefinedManualManualManualManualManualPredefined
# of images37927947230175150353646
Point density (pts/m2)72.915614381.51218213134.9
Dense cloud points73,083,40577,568,53421,873,83154,126,73765,780,21549,330,560103,116,00179,998,808
DSM resolution (cm/pixel)10.28.018.079.529.08118.7512.4
DSM area (m2)604,228283,21882,994242,273229,748315,752412,707444,710
Publisher’s Note: MDPI stays neutral with regard to jurisdictional claims in published maps and institutional affiliations.

