Article

Parallel Point Clouds: Hybrid Point Cloud Generation and 3D Model Enhancement via Virtual–Real Integration

1
Department of Automation, University of Science and Technology of China, Hefei 230027, China
2
State Key Laboratory of Management and Control for Complex Systems, Institute of Automation, Chinese Academy of Sciences, Beijing 100190, China
3
Qingdao Academy of Intelligent Industries, Qingdao 266000, China
4
School of Artificial Intelligence, University of Chinese Academy of Sciences, Beijing 100091, China
*
Author to whom correspondence should be addressed.
Remote Sens. 2021, 13(15), 2868; https://doi.org/10.3390/rs13152868
Submission received: 21 May 2021 / Revised: 15 July 2021 / Accepted: 16 July 2021 / Published: 22 July 2021

Abstract

:
Three-dimensional information perception from point clouds is of vital importance for improving the ability of machines to understand the world, especially for autonomous driving and unmanned aerial vehicles. Data annotation for point clouds is one of the most challenging and costly tasks. In this paper, we propose a closed-loop and virtual–real interactive point cloud generation and model-upgrading framework called Parallel Point Clouds (PPCs). To our best knowledge, this is the first time that the training model has been changed from an open-loop to a closed-loop mechanism. The feedback from the evaluation results is used to update the training dataset, benefiting from the flexibility of artificial scenes. Under the framework, a point-based LiDAR simulation model is proposed, which greatly simplifies the scanning operation. Besides, a group-based placing method is put forward to integrate hybrid point clouds, via locating candidate positions for virtual objects in real scenes. Taking advantage of the CAD models and mobile LiDAR devices, two hybrid point cloud datasets, i.e., ShapeKITTI and MobilePointClouds, are built for 3D detection tasks. With almost zero labor cost on data annotation for newly added objects, the models (PointPillars) trained with ShapeKITTI and MobilePointClouds achieved 78.6% and 60.0% of the average precision of the model trained with real data on 3D detection, respectively.

1. Introduction

With the rapid development of deep learning, computer vision technology has achieved competitive results on many tasks compared to humans, such as image classification [1,2], object detection [3,4], medical imaging [5,6], and object tracking [7]. However, challenges still exist, especially in 3D perception tasks [8], due to the increase of the data dimension. Precise 3D information understanding is indispensable in applications with high safety requirements such as autonomous driving and unmanned aerial vehicles, and point clouds are one of the commonly used data formats in such scenarios [9,10]. However, the annotation of point clouds generated by active sensors such as Light Detection and Ranging (LiDAR) is time consuming. Taking the LiDAR used in autonomous driving as an example, due to the sparsity and incompleteness of the point clouds generated by LiDAR, annotators need to refer to images or other inputs to precisely label the whole point cloud. This greatly increases the difficulty and time for point cloud annotation.
One of the popular ways to reduce data labeling is using the virtual data from [11]. However, although simulated data are becoming more and more visually realistic, they still suffer from the domain difference from real scenes [12]. To mitigate the gap between virtual and real scenes, we propose a new point cloud generation method that integrates real environmental contexts and virtual or scanned object information. Our method can maintain the layout of real scenes, thus reducing the difference between synthetic data and real data. Besides, the proposed point-based representation and LiDAR simulation greatly simplify the process of collision detection and make it easy to plug into existing data processing pipelines.
Deep learning methods greatly rely on the training dataset. In most scenarios of training deep learning models, researchers focus more on the upgrading of models and algorithms than the updating of the dataset [13]. One of the main reasons is that the updating of the dataset in real scenes is inconvenient and sometimes unaffordable (e.g., expensive LiDAR sensors and high annotation cost) for most researchers. Wang [14] proposed the Artificial societies, Computational experiments, and Parallel execution (ACP) methodology for the management and control of complex systems. Inspired by the ACP method, we integrate the model enhancement and point cloud generation into a closed-loop framework. Our virtual–real interaction data generation method enables us to adjust the point clouds flexibly at a very low cost. Therefore, we can use the evaluation results of the current model to guide the generation of point clouds. By iteratively updating both point clouds and model parameters, the performance of the model can be continuously promoted.
In conclusion, our contributions can be summarized as follows:
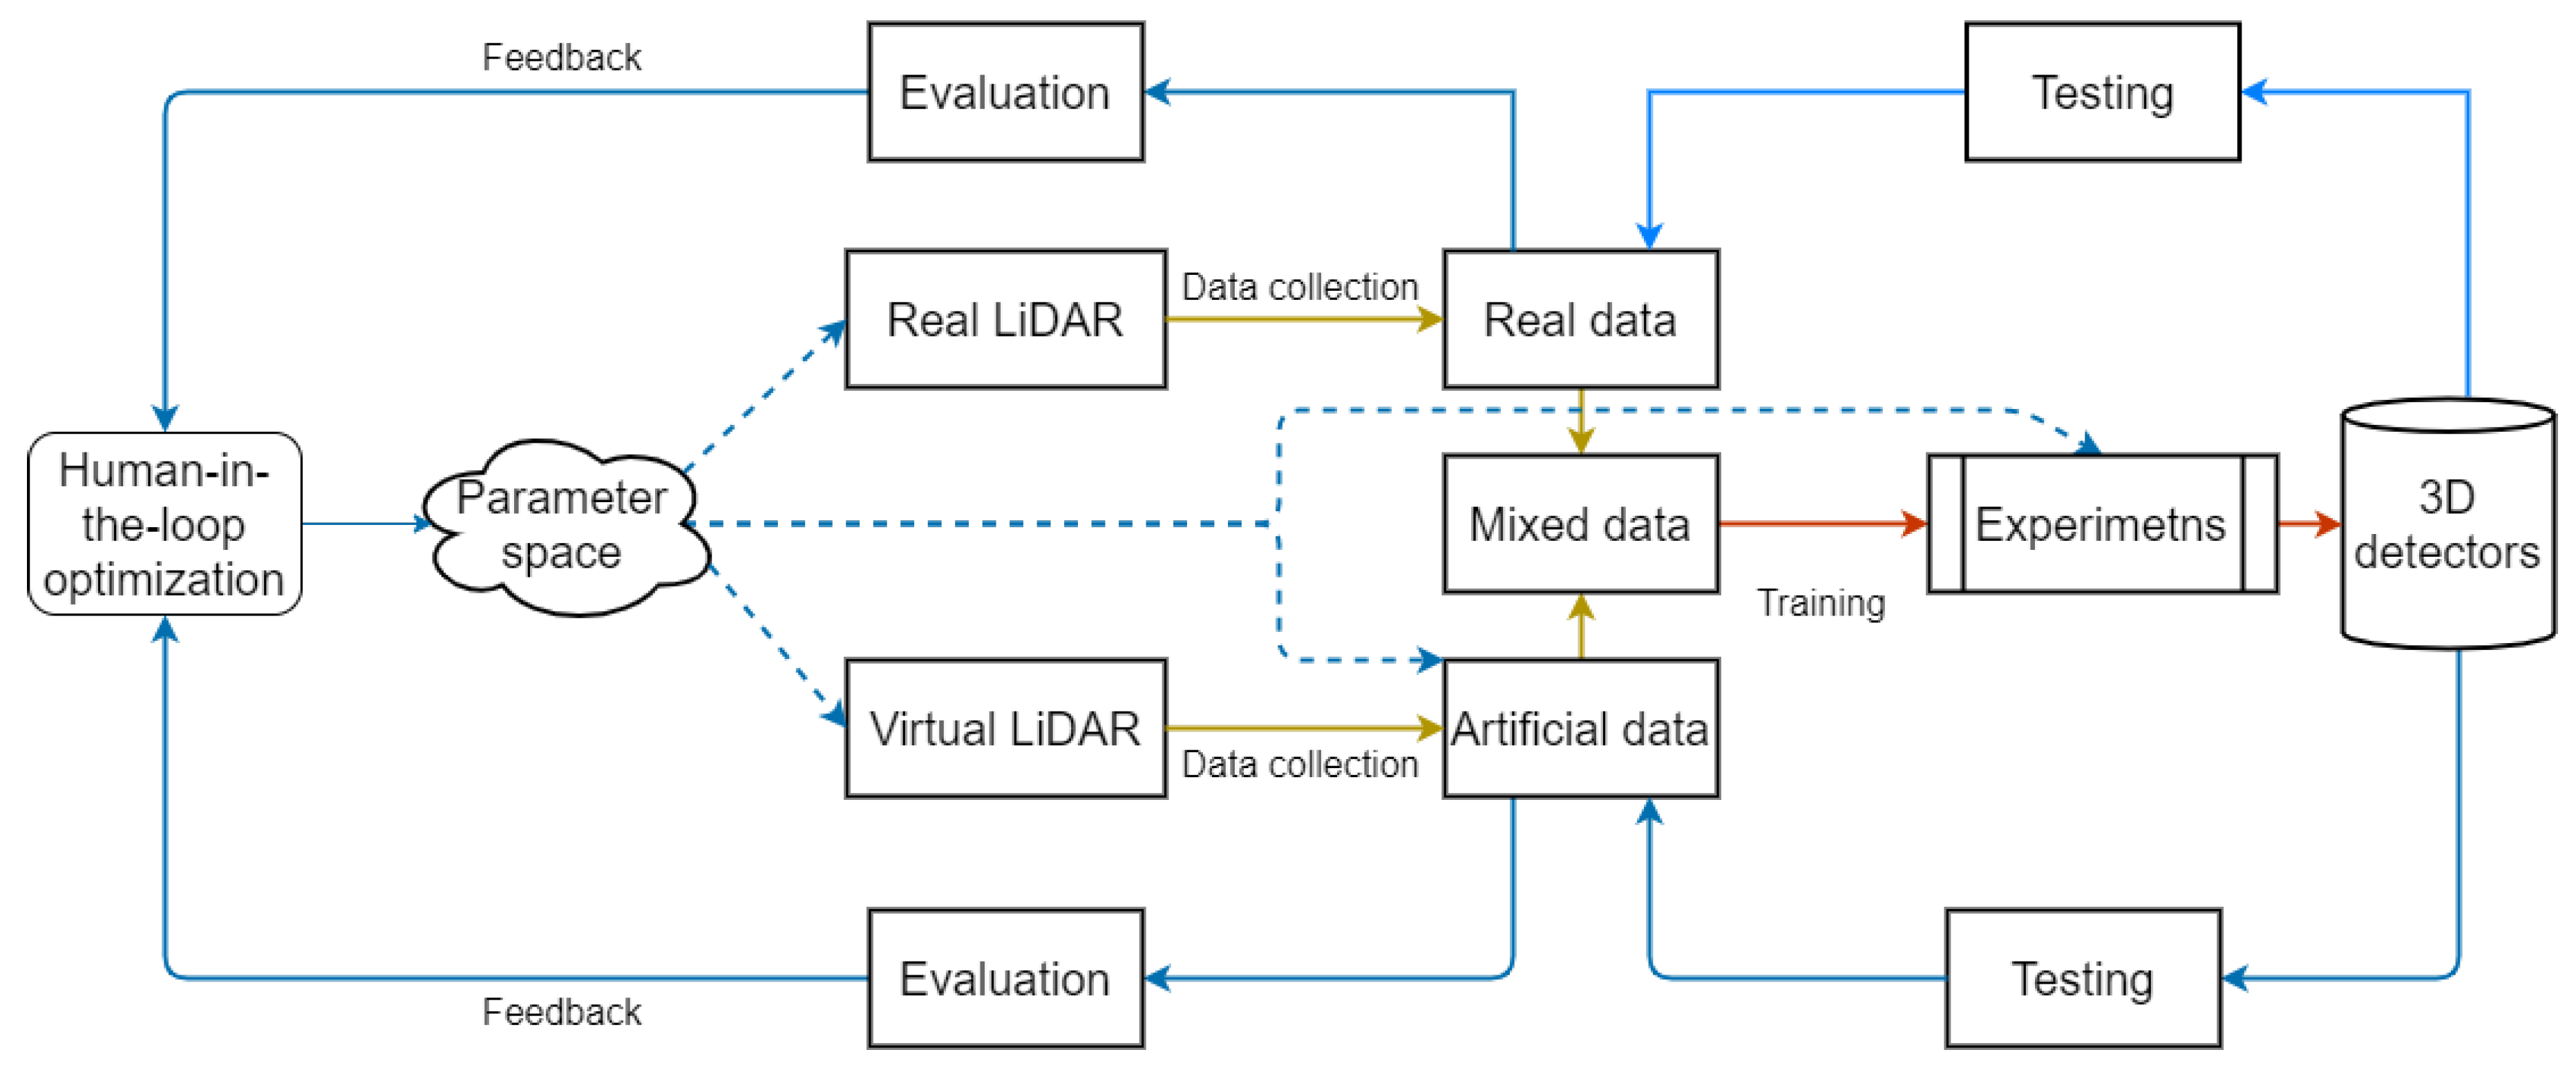
  • We design a unified framework to integrate the point cloud generation and model enhancement, which changes the training of the model from an open-loop to a closed-loop mechanism. In this manner, both the performance of the models and the quality of point clouds are iteratively improved;
  • The complexity of the collision computation between laser beams and meshes on objects can be totally avoided by our modeling of LiDAR sensors. In addition, a group-based placing method is put forward to solve the virtual object placing problem in real scenes;
  • We build a hybrid point cloud dataset called ShapeKITTI with real point scenes and virtual objects and evaluate our method on 3D detection tasks. With almost zero annotation cost for newly added objects, we achieved 78.5% of the 3D performance of the model trained with the real KITTI dataset.
On the one hand, the parallel point cloud framework proposes to use software-defined and auto-labeled point clouds to train and evaluate 3D models. This greatly reduce the cost of data annotation. On the other hand, the parallel point cloud framework integrates both point cloud generation and model updating. This speeds up the enhancement of 3D models and can promote the development of intelligent industries such as autonomous driving, intelligent robots, and logistics.

2. Related Works

In this section, we mainly discuss the related works on the ACP method, synthetic datasets, and 3D detection methods. The ACP method inspired us to propose the framework of parallel point clouds. We built two hybrid point cloud datasets and conducted experiments on 3D detection to validate the effectiveness of our approach.

2.1. ACP Methodology

ACP theory was proposed by Wang et al. [14] for the modeling and control of complex systems. It includes three parts, i.e., artificial societies, computational experiments, and parallel execution. Recently, ACP theory has been extended to many areas such as computer vision [15], image generation [16], machine learning [17], autonomous driving [18], intelligent transportation [19], control theory [20], and so on. For computer vision tasks, artificial societies are used to model the real world and generate large-scale visual data with automatic annotation. Computational experiments are used to train and evaluate visual models for different vision tasks. Parallel execution feeds back the evaluation results to the construction of artificial scenes. The ACP method inspired us to rethink the relation of the data and model. Most of the deep learning methods use data to update the parameters of models in an open-loop manner. The evaluation of the model cannot be used to update the data due to the difficulty of changing real data.

2.2. Synthetic Datasets

With the rapid development and wide application of deep learning methods [21], effective and inexpensive generation and labeling of large-scale data are becoming an urgent problem to solve. To avoid the high cost of data generation in the real world, Many researchers turn to the virtual world for the solution. Predinger et al. [22] built a laboratory in a virtual city to analyze driving and travel behaviors. They built the environment of the virtual city using OpenStreetMap and CityEngine. Then, they added cars and transportation facilities in Unity and simulated the actions of cars and the interactions between cars and road networks. Ros et al. [23] constructed virtual traffic scenes and generated the depth and semantic labels with Unity and Computer-Aided Design (CAD) models. To improve the diversity of the dataset, they rendered different weather for the scenes. Gaidon et al. [24] imitated the real KITTI [25] dataset and constructed corresponding virtual KITTI sequences. The data in virtual KITTI had a similar structure and visual effect as real KITTI. Diverse annotations can be automatically generated for multiple vision tasks including object detection, segmentation, tracking, depth estimation, and so on. The ParallelEye [26] dataset was built based on the map information from the real world and helps to improve the performance of detection models [27]. The above methods generate virtual dataset by constructing virtual scenes from scratch. This is flexible, but increases the workload. Johnson-Roberson proposed to take advantage of existing video games such as Grand Theft Auto V (GTA V) to collect virtual image data and annotations. This further reduces the cost of constructing virtual scenes and improves the realness of synthetic data.
Different from the generation of image data, LiDAR point clouds are sparse and contain 3D information, which makes it hard to effectively process them using existing CNNs. Yue et al. [28] simulated LiDAR in GTA V and collected many point cloud data. They used virtual point clouds to train the segmentation model mixed with real data and improved the performance of the segmentation model. Fang et al. [29] combined real background points and virtual foreground points in the same scenes. The mixed data reduced the domain gap between real point clouds and synthetic point clouds. Our work in this paper adopted the idea of using hybrid point clouds to train the 3D models to reduce human annotation cost, but simplified the point cloud generation process.

2.3. Three-Dimensional Object Detection with Point Clouds

According to the data format used in the network of point clouds, most 3D detection models can be roughly categorized into point-based methods, voxel-based methods, and range-view-based methods.
Point-based methods [8] extract features from the original format of point clouds. PointNet is a pioneer work to learn 3D information from points. It uses one-dimensional convolution to encode each point and applies a max-pooling layer to aggregate global features. Such a design achieves the permutation invariance of unordered point clouds and helps to extract spatial and structural features. F-PointNet [30] extracts the local points at the second stage and uses an extended PointNet to predict positive points. VoteNet [31] generates proposals from point clouds using Hough voting. It uses seed points to help the regression of final 3D objectives. In voxel-based methods, sparse point clouds are first transformed into regular 2D or 3D grids [32,33] by voxelization. The new data format has a similar organization as image data; thus, it can be processed with traditional Convolutional Neural Networks (CNNs). VoxelNet [32] divides the point clouds into 3D cells and uses 3D CNNs to extract 3D features. PointPillars [34] ignores the vertical dimension in voxelization and uses the 2D CNN to accelerate the processing speed of feature extraction. Range-view-based methods project point clouds to the front view, which maintains the 3D information and can be processed effectively using CNNs. LaserNet [35] directly regresses the 3D bounding box form the range view inputs and adopts adaptive NMS to generate the final results. RCD [36] proposes a learnable dilation convolution to handle the size variation.
Three-dimensional detection was used as the example of 3D tasks to validate the effectiveness of our parallel point cloud framework.

3. Method

The framework of our method is shown in Figure 1. It comprises three parts, which are shown in different colors. Lines in yellow show the generation of hybrid point clouds, which includes the simulation of the LiDAR sensor and the combination of hybrid point clouds. They are illustrated in Section 3.1 and Section 3.2, respectively. Lines in red show the computational experiments on 3D models such as 3D object detection. Lines in blue illustrate our human-in-the-loop optimization of the data generation and the training process, which are discussed in Section 3.3.

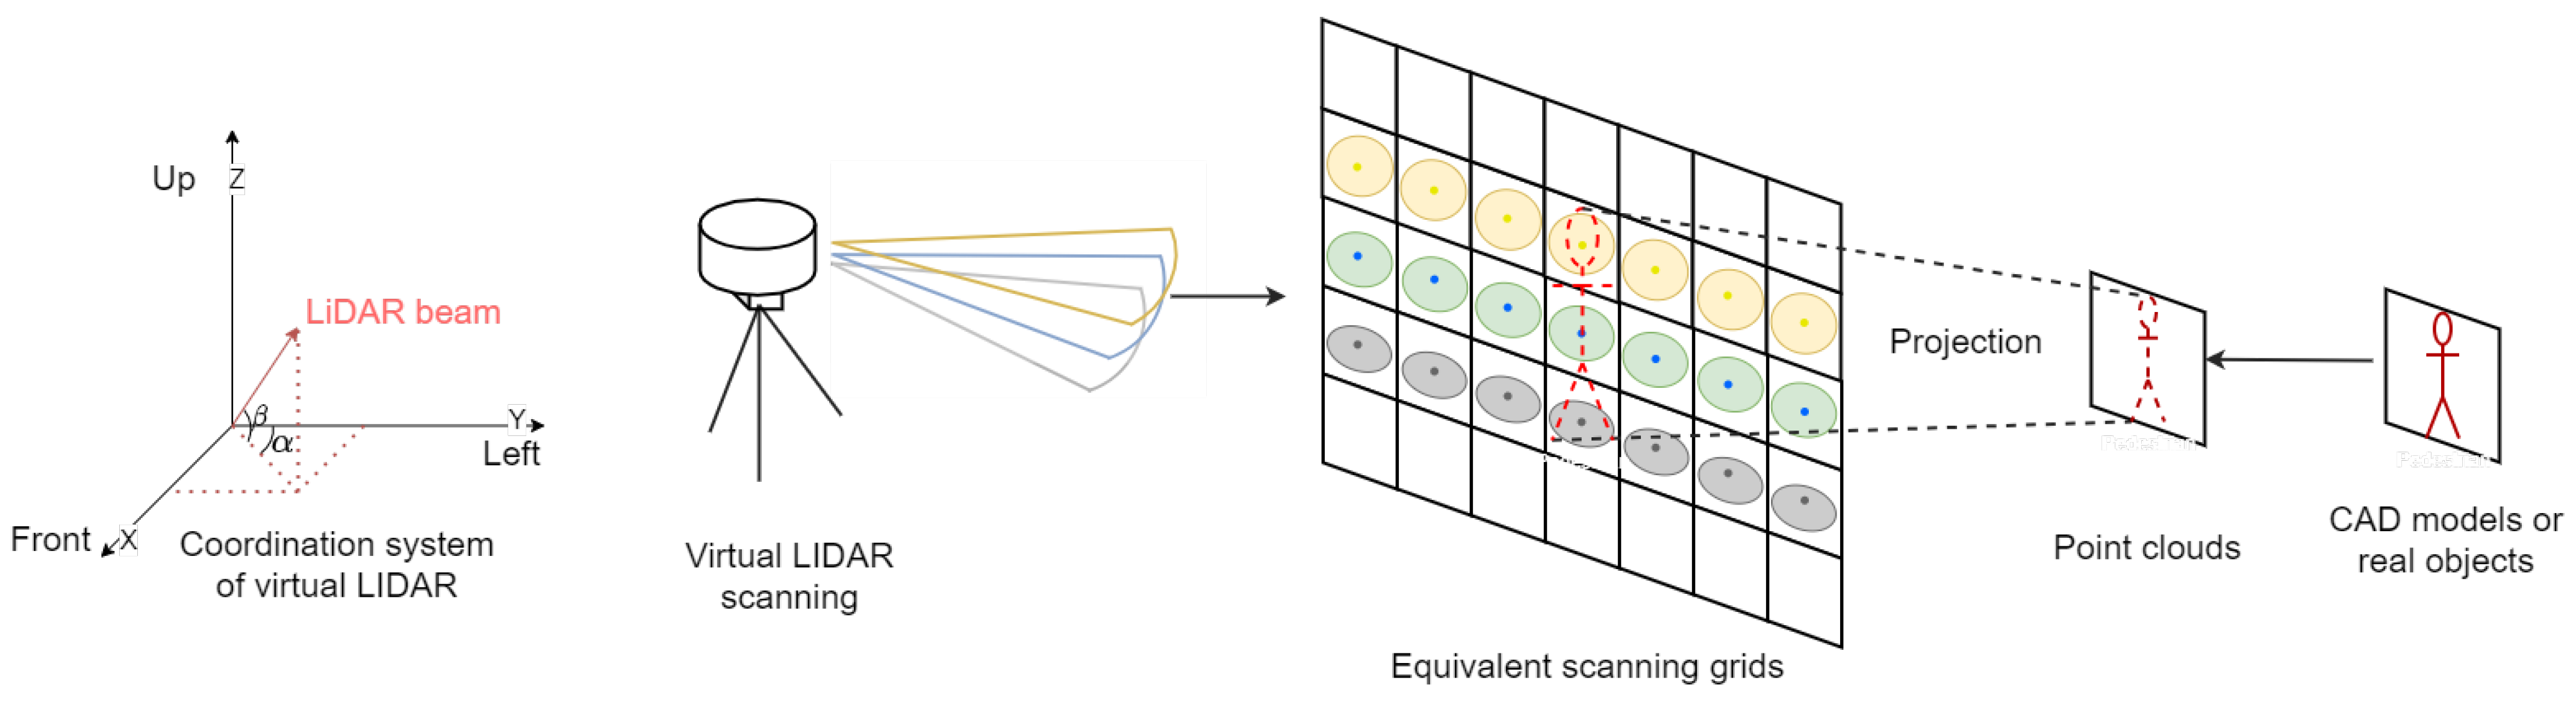
3.1. Point-Based LiDAR Simulation

In this part, we discuss how to simulate the effects of LiDAR scanning for real or virtual objects with our virtual LiDAR. A point-based method was adopted to avoid the tedious computation of the collision between LiDAR beams and meshes of objects. The simulation of the LiDAR sensor is illustrated in Figure 2. By imitating the mechanism of real LiDAR, a virtual LiDAR was built that had similar horizon and vertical resolutions. For objects to be scanned, the original mesh models were first transformed into point clouds. Finally, equivalent scanning grids were proposed to simulate the scanning of the LiDAR sensor and generate the point clouds.
The beams of LiDAR can be encoded by a two-dimensional index [ i , j ] , where i is the id of the beam in the vertical dimension and j is the id of the beam in the horizontal dimension. The coordination system of virtual LiDAR is illustrated in the left of Figure 2. By only considering the range of scanning within the Field of View (FoV) of the camera, we denote the minimum angle in the vertical and horizontal directions as α 0 and β 0 , respectively. The resolution of virtual LiDAR is denoted as r v and r h in the vertical and horizontal directions. Then, we have:
α i , j = α 0 + i × r v , β i , j = β 0 + j × r h ,
where α and β are the angle of the LiDAR beam in the vertical and horizontal directions. To calculate the projection of the beam with the index of [ i , j ] onto the image plane, we assumed the distance of a point on the beam to the LiDAR sensor is l 0 . Then, the coordinates of the point P i , j = [ x i , j , y i , j , z i , j , 1 ] are:
x i , j = l 0 × c o s ( β i , j ) × s i n ( α i , j ) , y i , j = l 0 × c o s ( β i , j ) × c o s ( α i , j ) , z i , j = l 0 × s i n ( β i , j ) .
Assuming the LiDAR sensor has no relative rotation with respect to the camera, the rotation matrix can be ignored in the calculation of the extrinsic parameters of the camera. Let us denote the translation matrix as C w , which is defined as:
C w = 1 0 0 x 0 0 1 0 y 0 0 0 1 z 0 0 0 0 1 ,
where [ x 0 , y 0 , z 0 ] is the translation between the LiDAR coordinates and the camera coordinates. The intrinsic matrix K can be denoted as:
K = f x s p x 0 0 f y p y 0 0 0 1 0 ,
where [ f x , f y ] are the focus-related parameters, [ p x , p y ] is the offset, and s is the shear parameter. Then, we can project the 3D point P i , j onto the image plane. The projected point P i , j ^ = [ x i , j ^ , y i , j ^ , z i , j ^ ] can be calculated as:
P i , j ^ = K C w P i , j T
Then, for each beam, their projected position on the image plane is calculated to generate the equivalent scanning grids. For each point on the grids, the mean distance d i , j to all its neighbors can be calculated. A receptive range s i , j is assigned for point P i , j ^ as follows:
s i , j = γ × d i , j / 2
where γ is used to adjust the receptive range, and it is within the range [ 0 , 1 ] . The points from the virtual object will be kept if they are within the range of s i , j from P i , j ^ . If there is more than one point assigned to the same grid, we randomly keep one of them. With such a design, we can project the point clouds onto the image plane and compare them with the equivalent grids to see if they can be scanned by the virtual LiDAR. To simulate the reflectance of the LiDAR scan, we used the distance of the point and a random function as the inputs. Then, the reflectance r is:
r = m a x ( m i n ( ( 0.7 λ × l ) + r a n d ( 0 , 0.3 ) , 1 ) , 0 ) ,
where λ is used to adjust the reflectance strength, l is the distance of the point to the LiDAR sensor, and r a n d ( ) is the random function used to generate a random value within [0,0.3]. The m i n and m a x function are used to restrict the value of the reflectance within [ 0 , 1 ] .

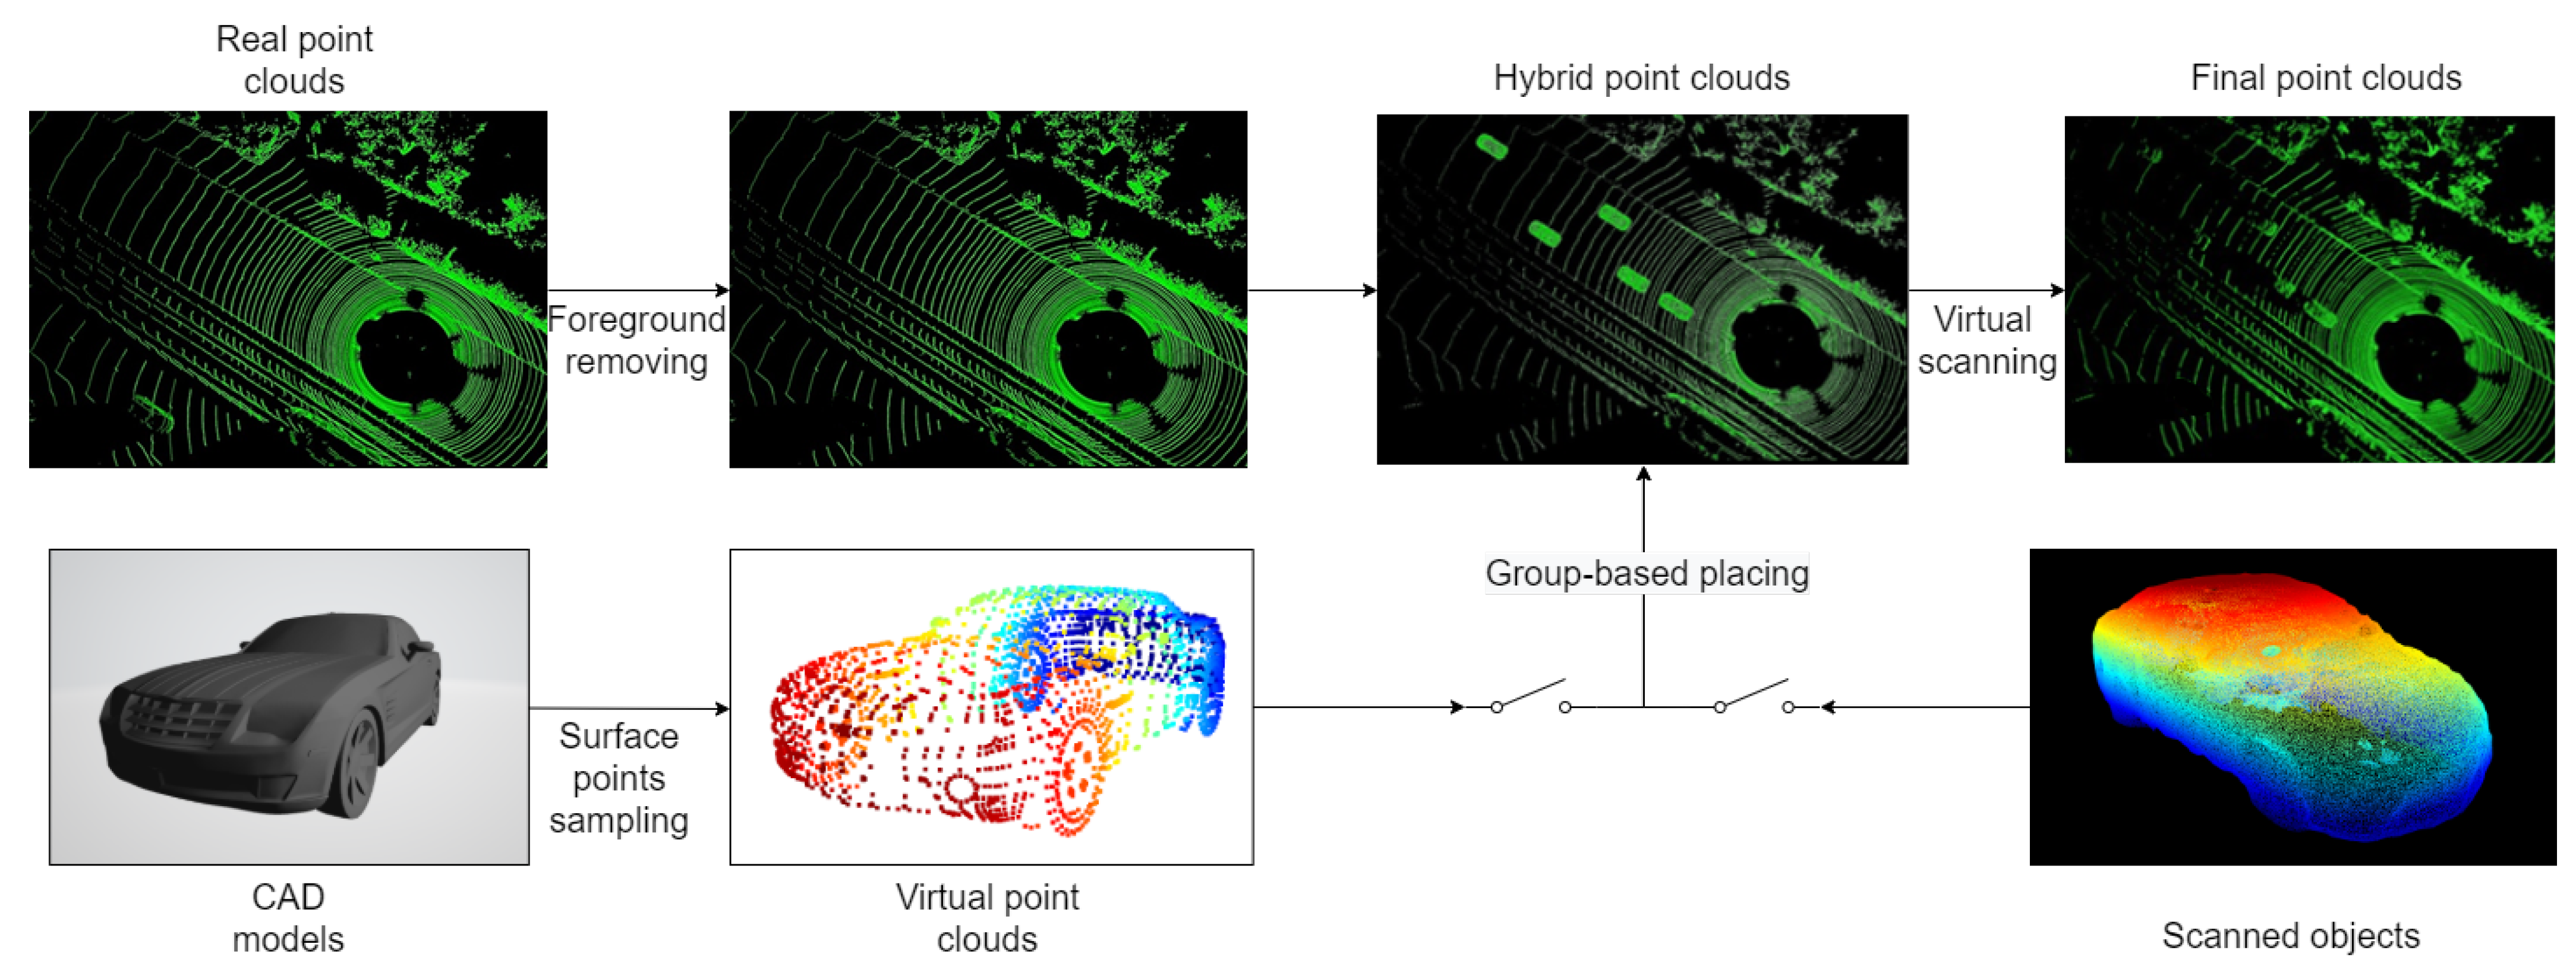
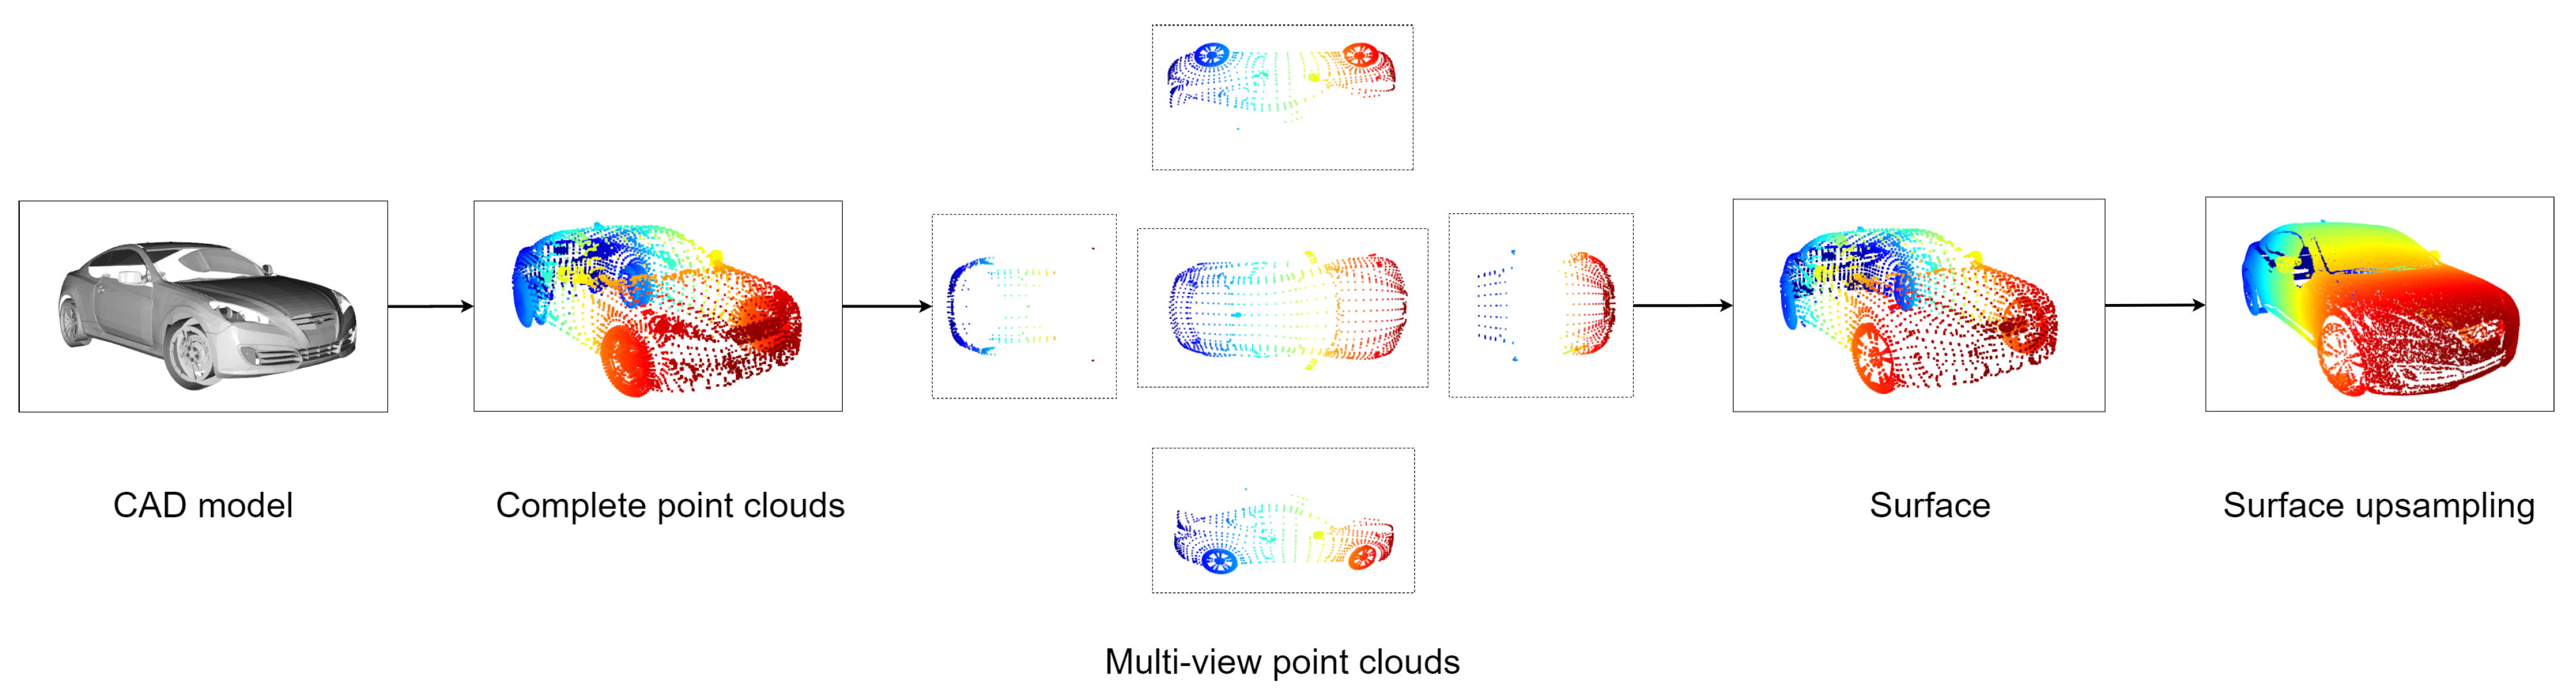
3.2. Hybrid Point Cloud Integration

To improve the realness of synthetic point clouds and avoid the heavy data annotation work, we separated the background point clouds and foreground point clouds. Real environmental point clouds were used as the background to reduce the domain difference. Virtual point clouds or scanned point clouds of objects of interest were used as the foreground to generate annotated data automatically. The public point cloud dataset KITTI [25] was used as the source of real point clouds. The integration of the hybrid point cloud pipeline is illustrated in Figure 3. To eliminate the influence of real points from foreground objects, all the points within the 3D bounding box were removed according to the labels of KITTI. Point clouds of foreground objects can either be generated from CAD models or scanned objects. For CAD models, we obtained their surface points with our surface point sampling method. To scan the objects in the real world, an iPad pro device with a LiDAR sensor was used. It can conveniently generate the point clouds of the objects of interest. We also proposed an automatic placing algorithm to choose proper places for foreground virtual point clouds. Although, in our scenario, foreground point clouds can be placed in the positions where real foreground objects are removed, such a placing mechanism cannot be generalized to background scenes with no real objects. Then, background and foreground points are combined, and virtual points are further processed by our virtual LiDAR to keep the visible points.
Existing CAD models can be used as the sources to generate the point clouds of the objects of interest. Considering that only outside points of an object can be captured in real scenes, we proposed a surface point sampling method to produce and upsample the points lying on the surface of the CAD models. As shown in Figure 4, firstly, the complete point clouds are generated from the CAD model with uniform sampling. Complete point clouds include both the outside and inside points of the CAD model. Therefore, it is necessary to remove the points lying inside the object. Making use of current 3D graphic software such as Blender, surface points can be extracted easily. However, in this paper, we tried to avoid using external software or applications to develop an online processing mechanism. We used the multiview projection to decide which points were on the surface of the object. Five views (front view, back view, left view, right view, and bird’s eye view) were used to create effects according to real situations. Finally, the points from different views were combined, and duplicate points were eliminated to generate the surface point clouds. The surface point clouds were further upsampled to guarantee that every beam of the virtual LiDAR could generate the point when it collided with the target.
Foreground point cloud generation: Two approaches were adopted to generate the foreground point clouds, i.e., generating from CAD models and generating from scanned real objects.
CAD models can provide a flexible imitation of common objects, but are not realistic enough. Existing real objects that we just removed only contain partial information (visible parts) and thus cannot be used for flexible data generation. Therefore, we proposed to use mobile LiDAR to reconstruct the objects in the real world. An iPad Pro (2020) was used to scan the real objects. We used the app called 3D Scanner APP [37] to scan objects and transform them into point clouds. The 3D models and corresponding point clouds are shown in Figure 5.
Group-based placing algorithm: To make the integration of virtual and real point clouds reasonable, we proposed a group-based placing algorithm to find the proper areas to place the virtual points into the real background points. Firstly, 2D keypoints on the BEV plane are uniformly defined with a resolution of r e s . Then, k neighbors for each keypoint are found according to the x and y coordinates using the constrained K-Nearest Neighbor (KNN) algorithm with a range of r. Finally, we computed the maximum and minimum height for the points within each group. If the height difference d h is below the threshold τ 0 , the corresponding keypoint is selected as a candidate position. For the object that is only provided with the normalized coordinates, we randomly generated the size S r to obtain its absolute coordinates using the constrained normal distribution, which is defined as:
S r = m a x ( m i n ( X s , S m i n ) , S m a x ) , X s N ( S μ , S δ 2 ) ,
where S m i n and S m a x are the minimum and maximum values of the size, respectively. X s is a random variable with a normal distribution. The mean value and the variance of the normal distribution are S μ and S δ , respectively. To find a suitable orientation for the foreground object, we proposed a “random try and region-based validation” method.
We evenly generated N a anchor angles. For each anchor angle, a random shift, which obeys uniform distribution, is added. The t-th value of the angle is:
A t = t × π / N a + X a , X a U ( π / N a , π / N a ) , t = 0 , 1 , 2 , , N a 1 .
Then, we tried each random angle and cropped points in the 3D region formed by the candidate position, a random size, and a random angle with 3D Region of Interest (RoI) pooling. If the height difference of the points in the 3D region is lower than τ 1 , the current box is labeled as a valid one and the corresponding position, size, and angle information is recorded for placing the foreground object. To avoid the collision between multiple foreground objects, we iteratively removed the keypoints that lied in the current valid box. The group-based placing algorithm is illustrated in Algorithm 1.

3.3. Human-in-the-Loop Optimization

The parallel point cloud framework makes it possible for consistent optimization of both the point cloud generation and model parameters’ update. In this part, we mainly discuss the adjustment of the point cloud generation with the human in the loop.
There are many factors to be considered in the virtual point cloud generation such as the types of virtual objects, the density of points of the object, the size of the object, and so on. Although machine intelligence such as auto-augmentation [38] may have the potential to solve these problems, it demands massive computational capacity and needs carefully designed learning networks. In our situation, taking advantage of the human experience and the flexibility of virtual data was the most direct and effective way. After the training process, several randomly sampled data were used to evaluate the performance of the current model. Then, we visualized the outputs and asked three volunteers to comment on the detection results. Based on their opinions, the parameters in the generation of point clouds, such as the mean number of foreground objects in each frame, the mean size of foreground objects, the receptive range of the virtual LiDAR, the reflectance rate of virtual points, and so on, were optimized accordingly. After several iterations, the quality of the point clouds and the performance of the detectors were improved.
Algorithm 1: Group-based placing algorithm.
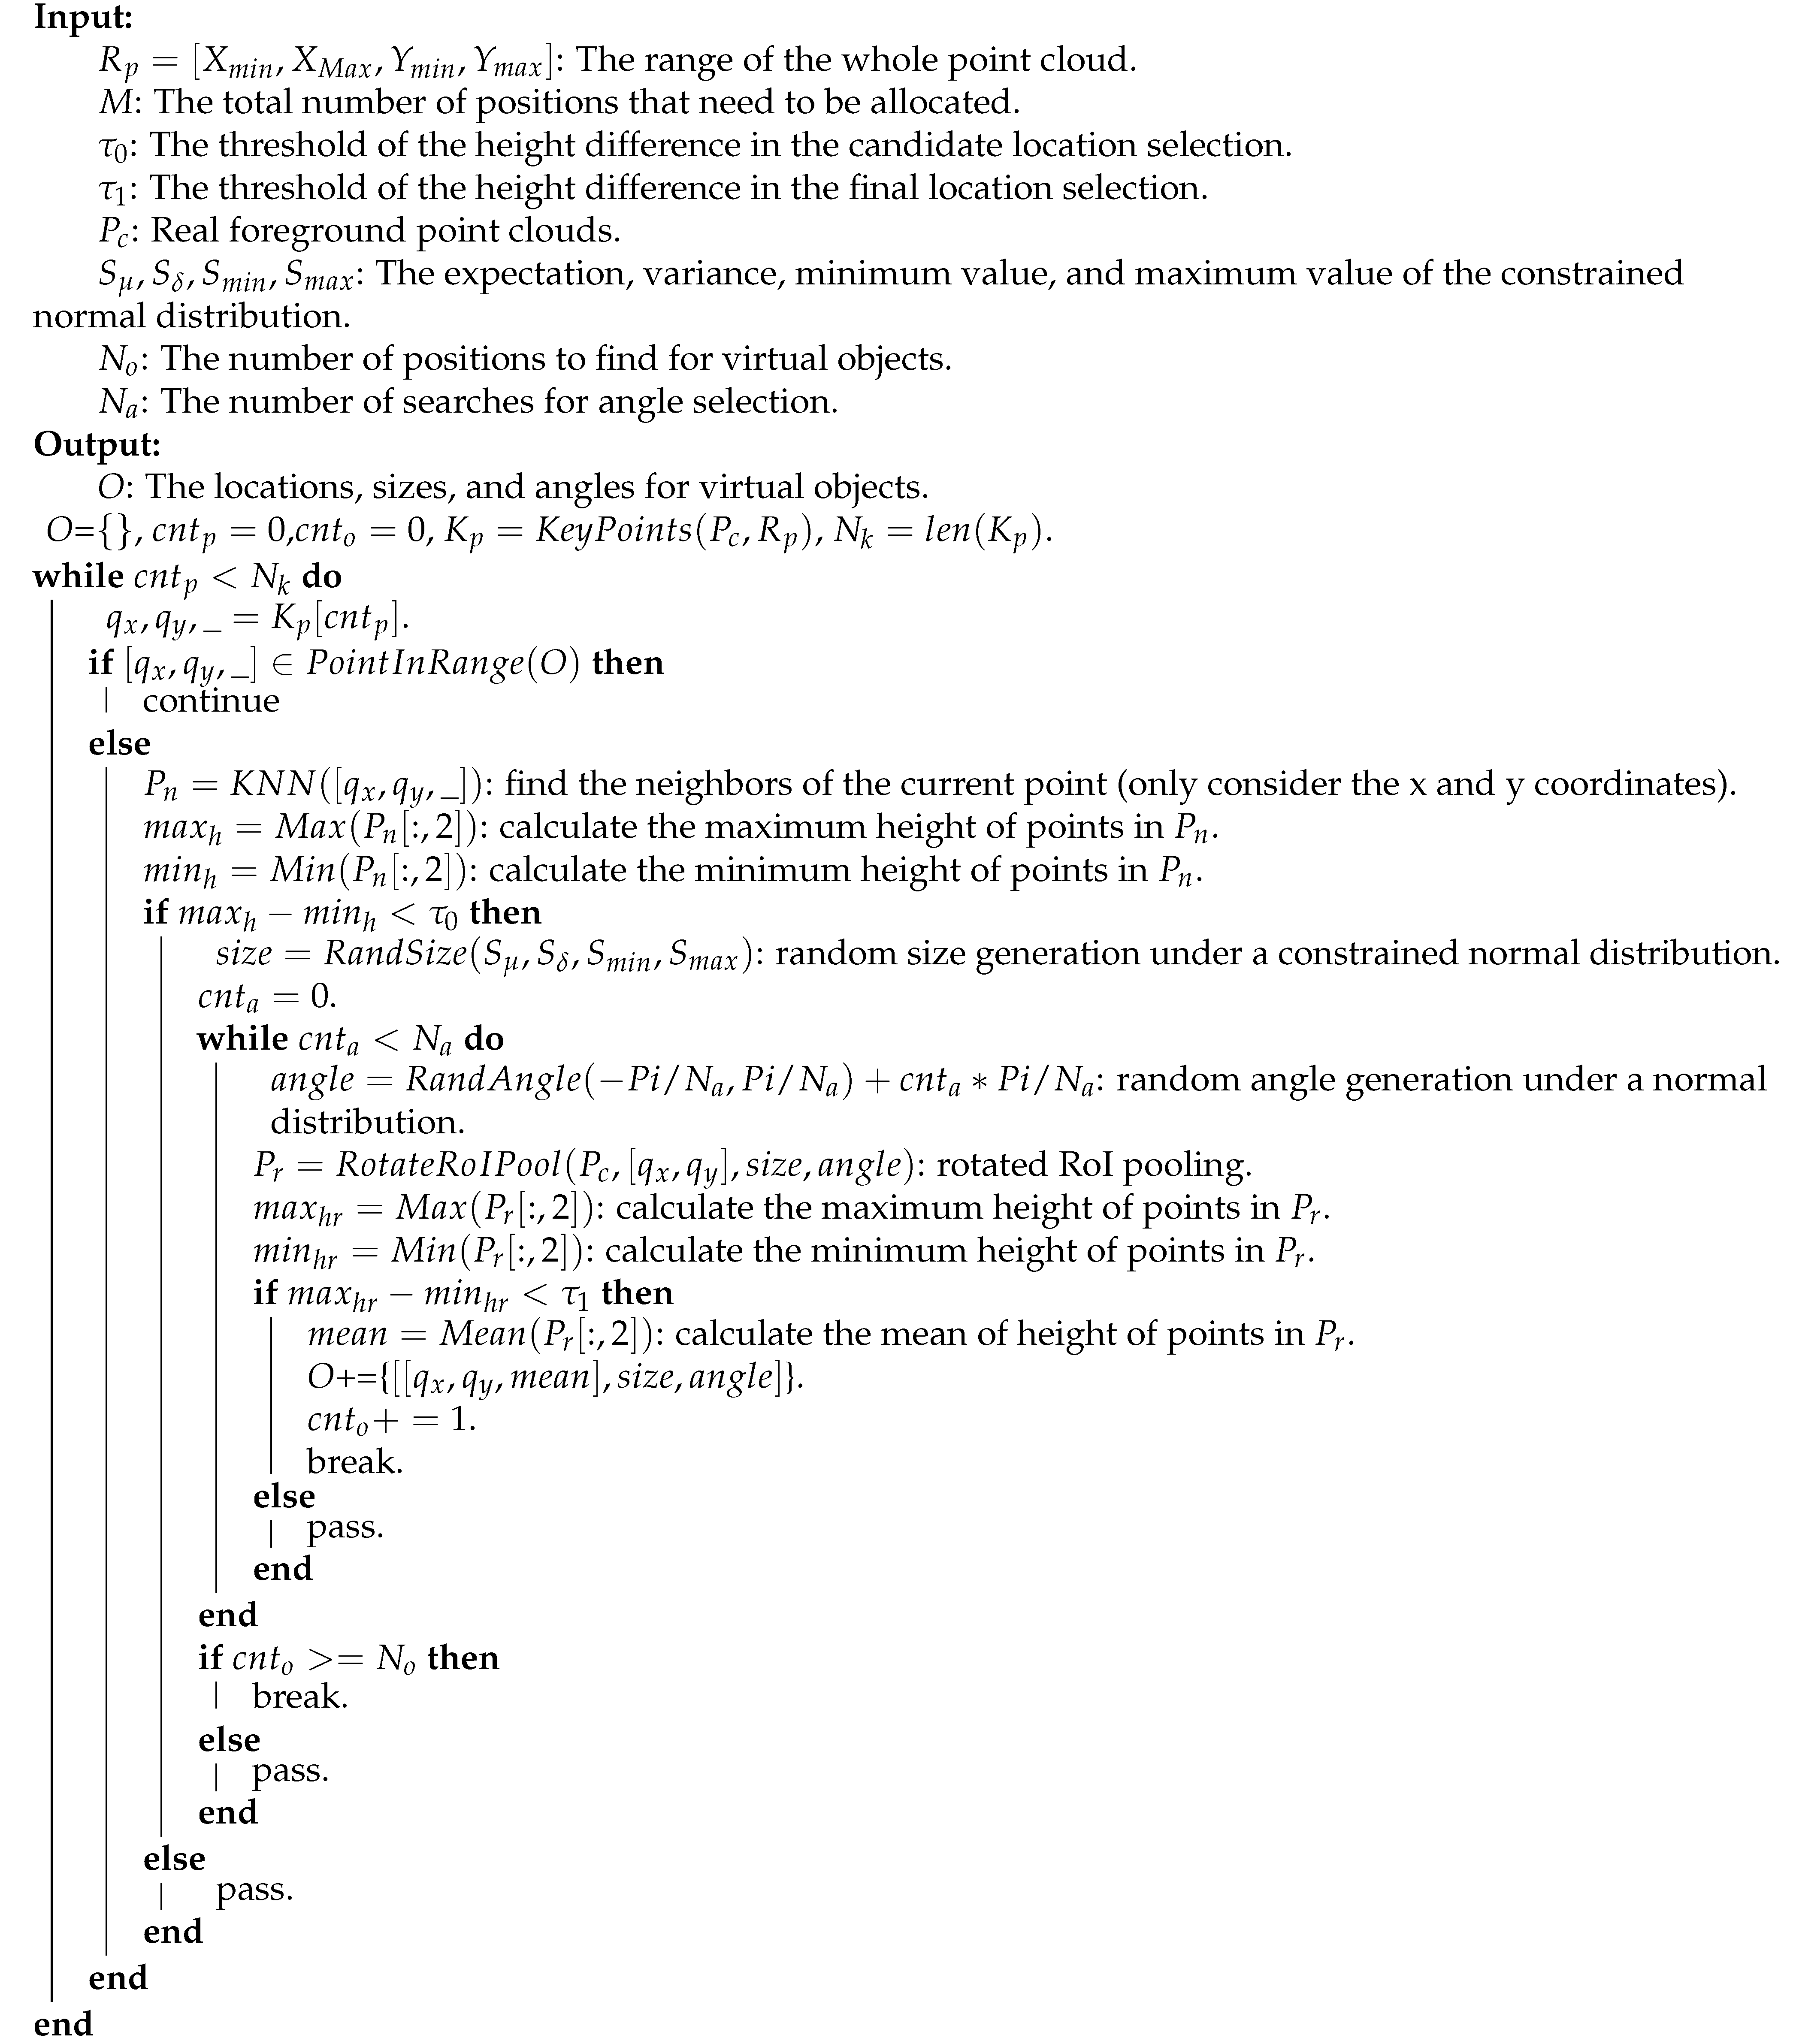
Remotesensing 13 02868 i001

4. Experiments

In this section, we discuss the construction of the ShapeKITTI and MobilePointClouds datasets in Section 4.1 and Section 4.2. ShapeKITTI was built by using CAD models as the foreground, and MobilePointClouds was built by using scanned objects as the foreground. In Section 4.3, we evaluate our method on the 3D detection task. The optimization of data generation with the human in the loop is discussed in Section 4.4.

4.1. ShapeKITTI

We proposed a hybrid point cloud dataset, ShapeKITTI, using KITTI and ShapeNet as our sources of real and virtual point clouds. There were 3712 samples from the KITTI dataset and 200 car models from ShapeNet used to generate the training data for 3D detectors. The left 3769 KITTI samples were used to evaluate the performance of 3D detection. When generating the reflectance of virtual point clouds, λ was set to 0.01. In our group-based placing algorithm, the resolution was set as 0.16m and the threshold as 0.1. We selected at most 64 points for each keypoint within 0.5 m around the keypoint. The demos of candidate placing generated by the group-based placing method are shown in Figure 6. As we can see, most of the proposed regions are flat, being suitable and reasonable for parking or driving. Imitating the parameters of the real LiDAR (Velodyne HDL-64E) used in the KITTI dataset, we configured our virtual LiDAR as shown in Table 1. The demos of our hybrid point clouds are shown in Figure 7. The proposed group-based placing algorithm distributes most of the added objects evenly into possible regions. Besides, it also effectively avoids the collision between adjacent objects.

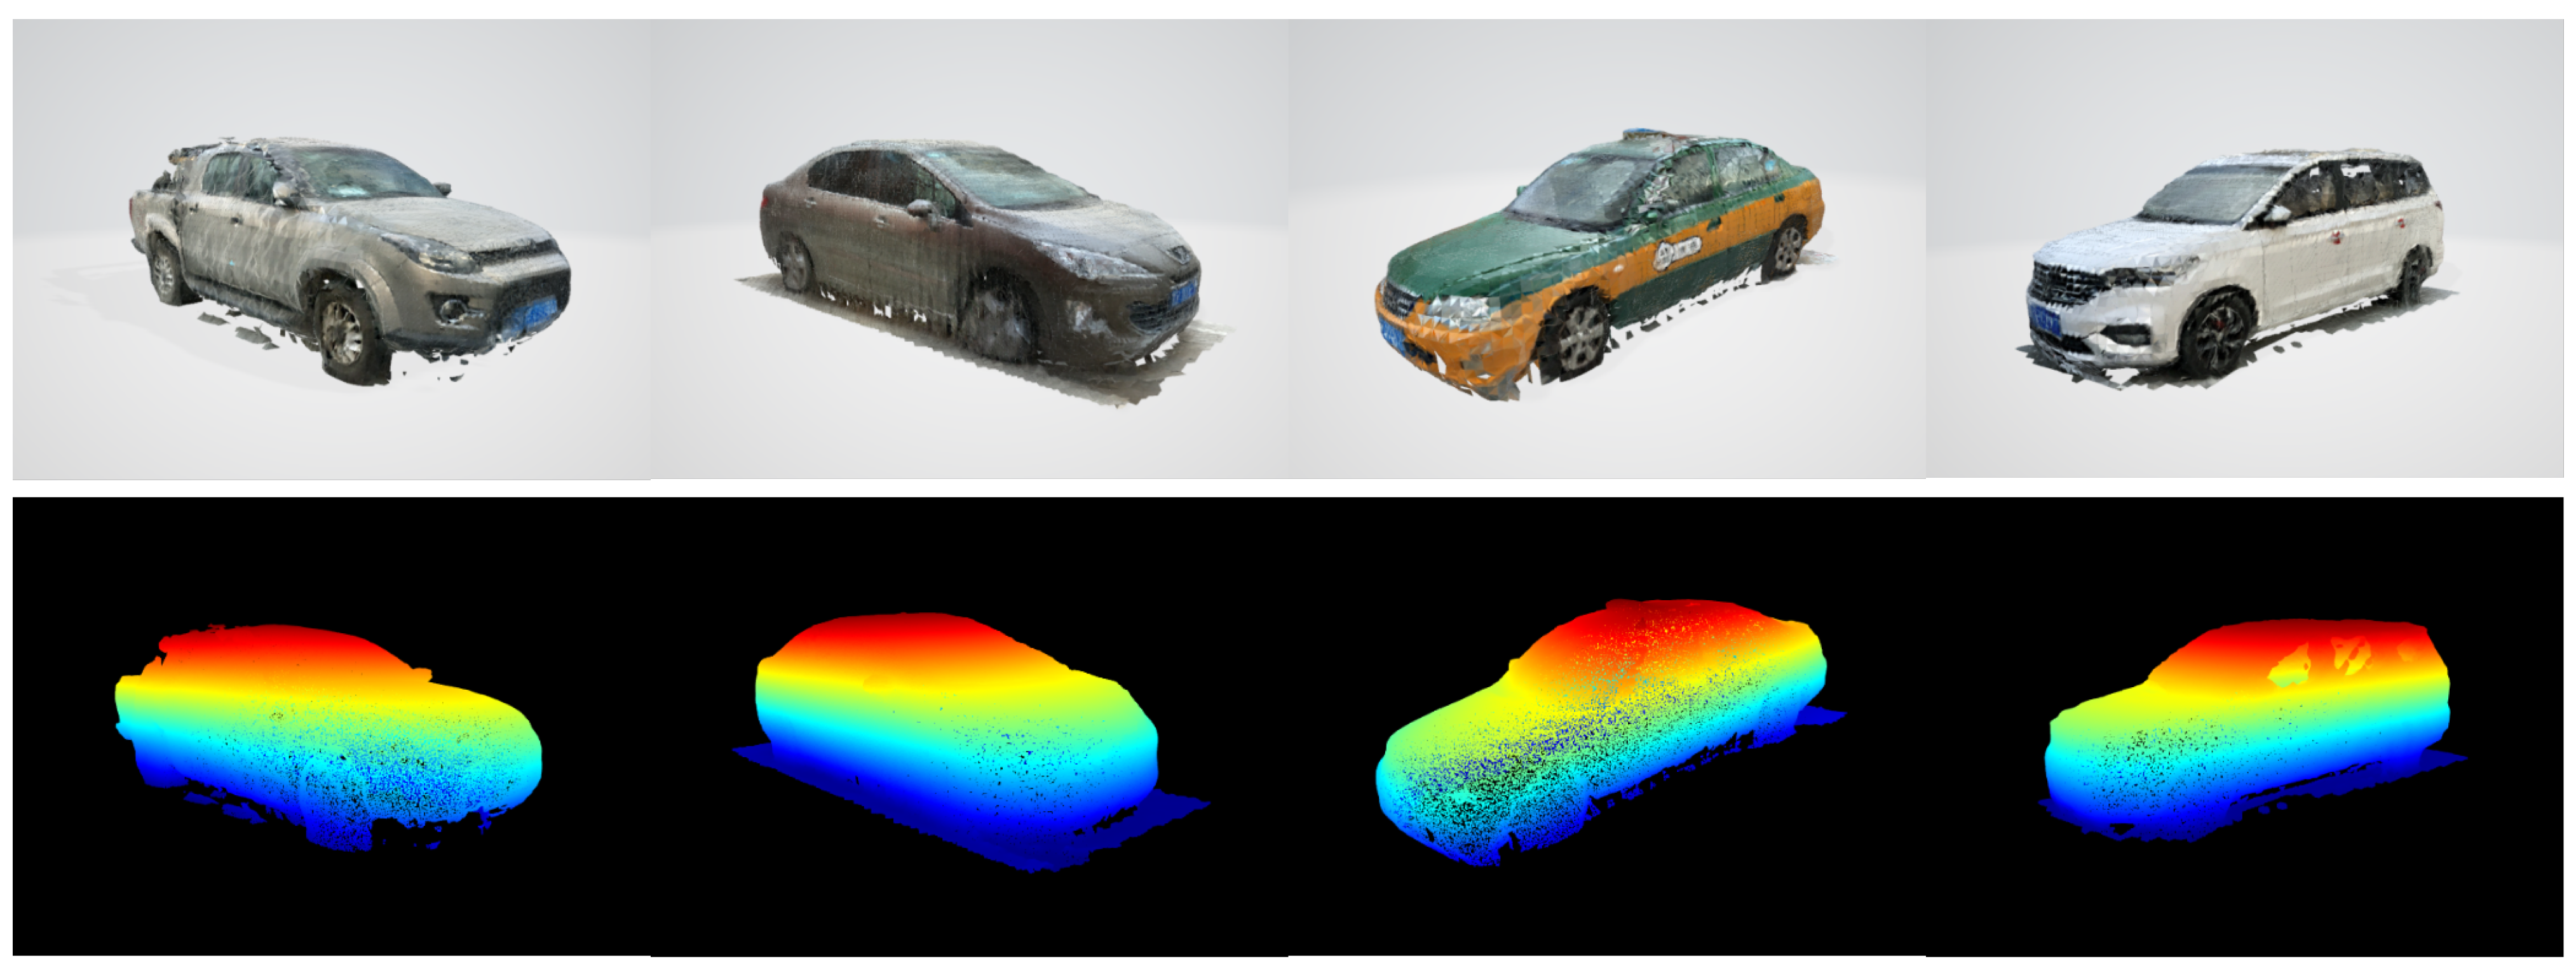
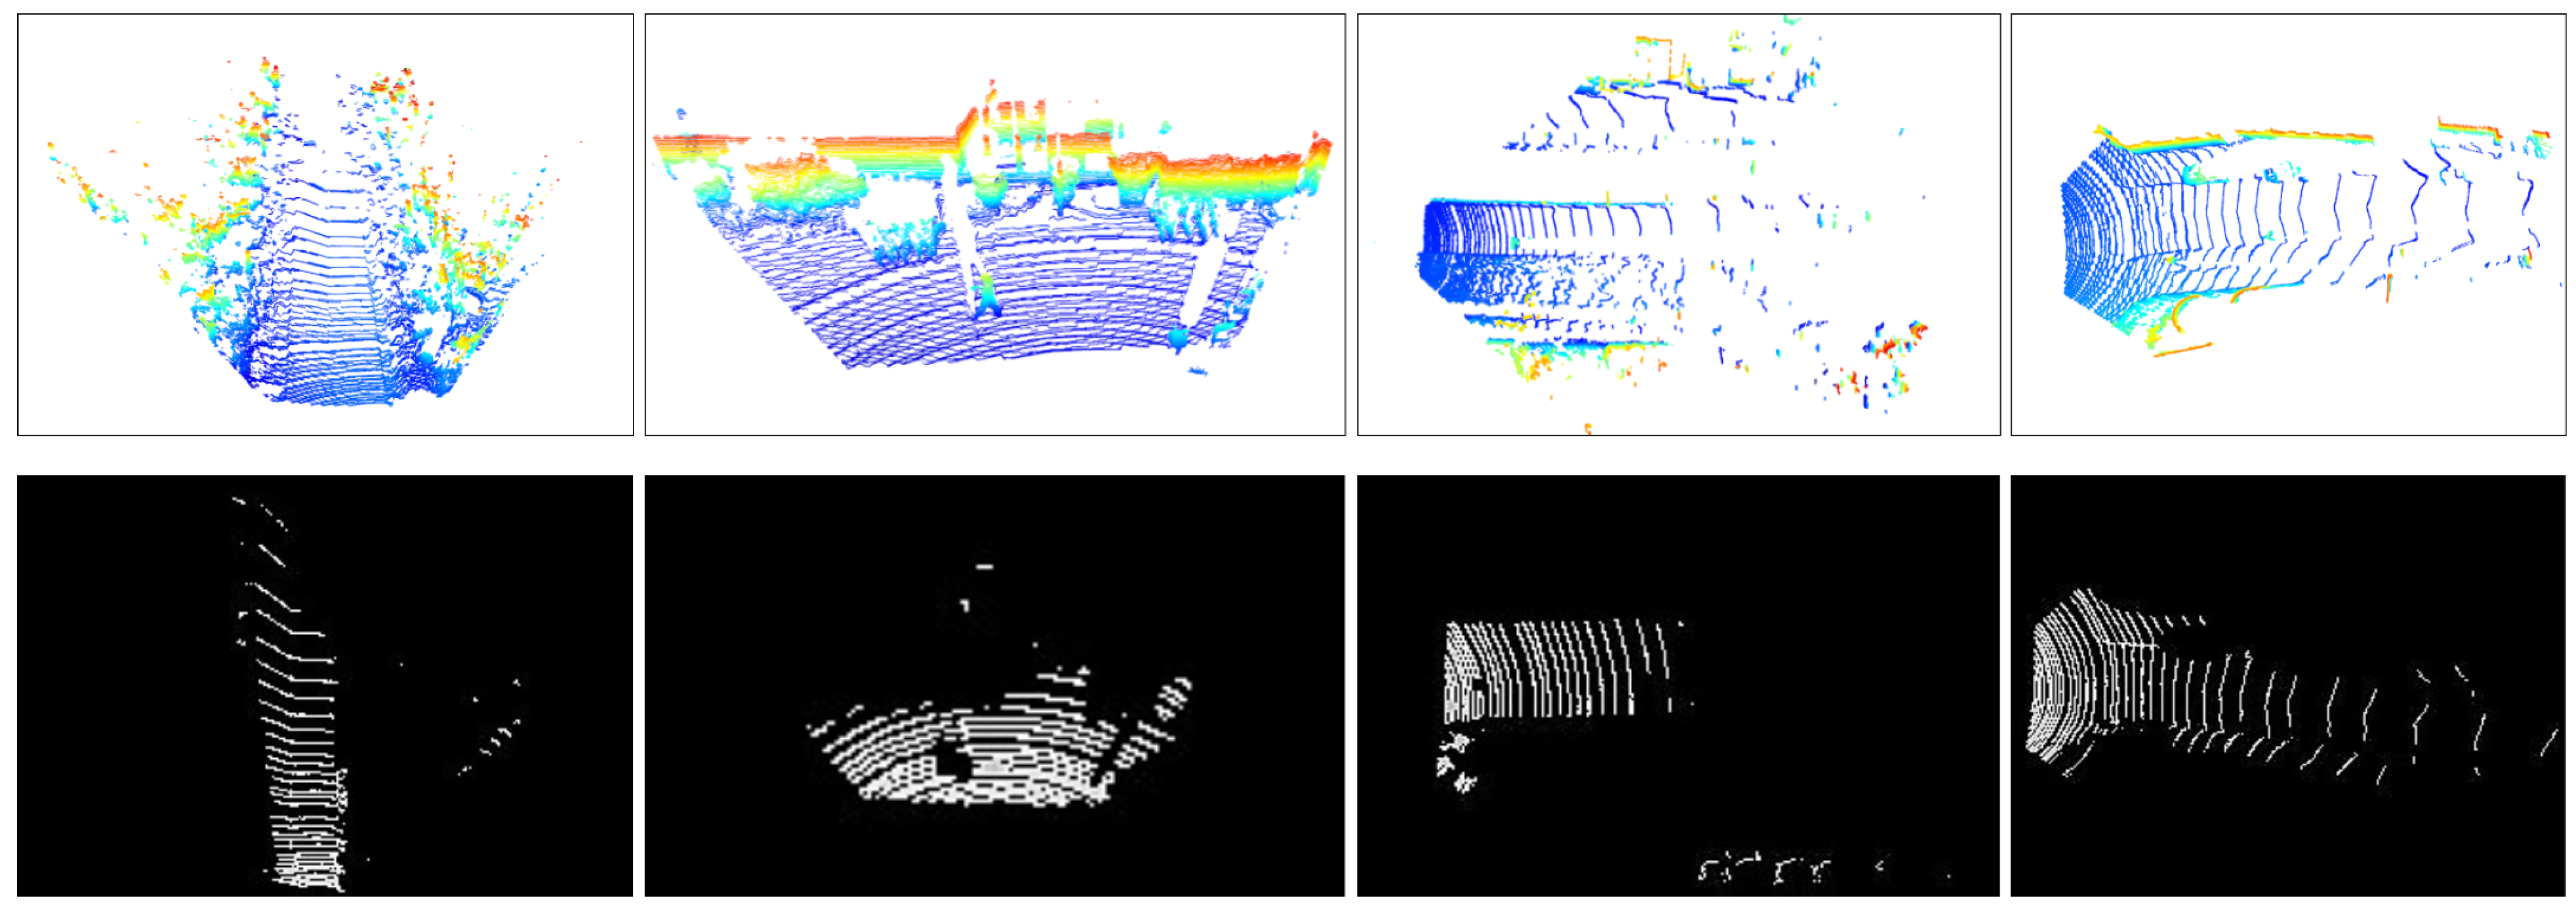
4.2. MobilePointClouds

To enrich the source of object-level point clouds, we took advantage of the LiDAR sensor on the latest iPad Pro device and the 3D Scanner APP [37] to obtain more object-level point clouds from the real world. There were 40 real cars scanned to generate their point clouds. There were 3712 samples from the KITTI dataset used to generate the training data with 40 scanned objects for the 3D detectors. The left 3769 KITTI samples were used to evaluate the performance of 3D detection. Other settings were the same as those in the construction of ShapeKITTI. Following the steps described in Section 3, we set up another dataset called MobilePointClouds.
To fairly compare the difference of foreground objects between our hybrid datasets and KITTI dataset, we placed the virtual foreground objects into the locations of the original KITTI objects so that they had the same contexts. The comparisons are shown in Figure 8. Both the hybrid dataset and real KITTI showed the characteristics of linear scanning. While the density of point clouds in the hybrid dataset was higher than that in real KITTI, that may be caused by the higher complexity of the real environment where the emitted laser has a higher probability of loss.

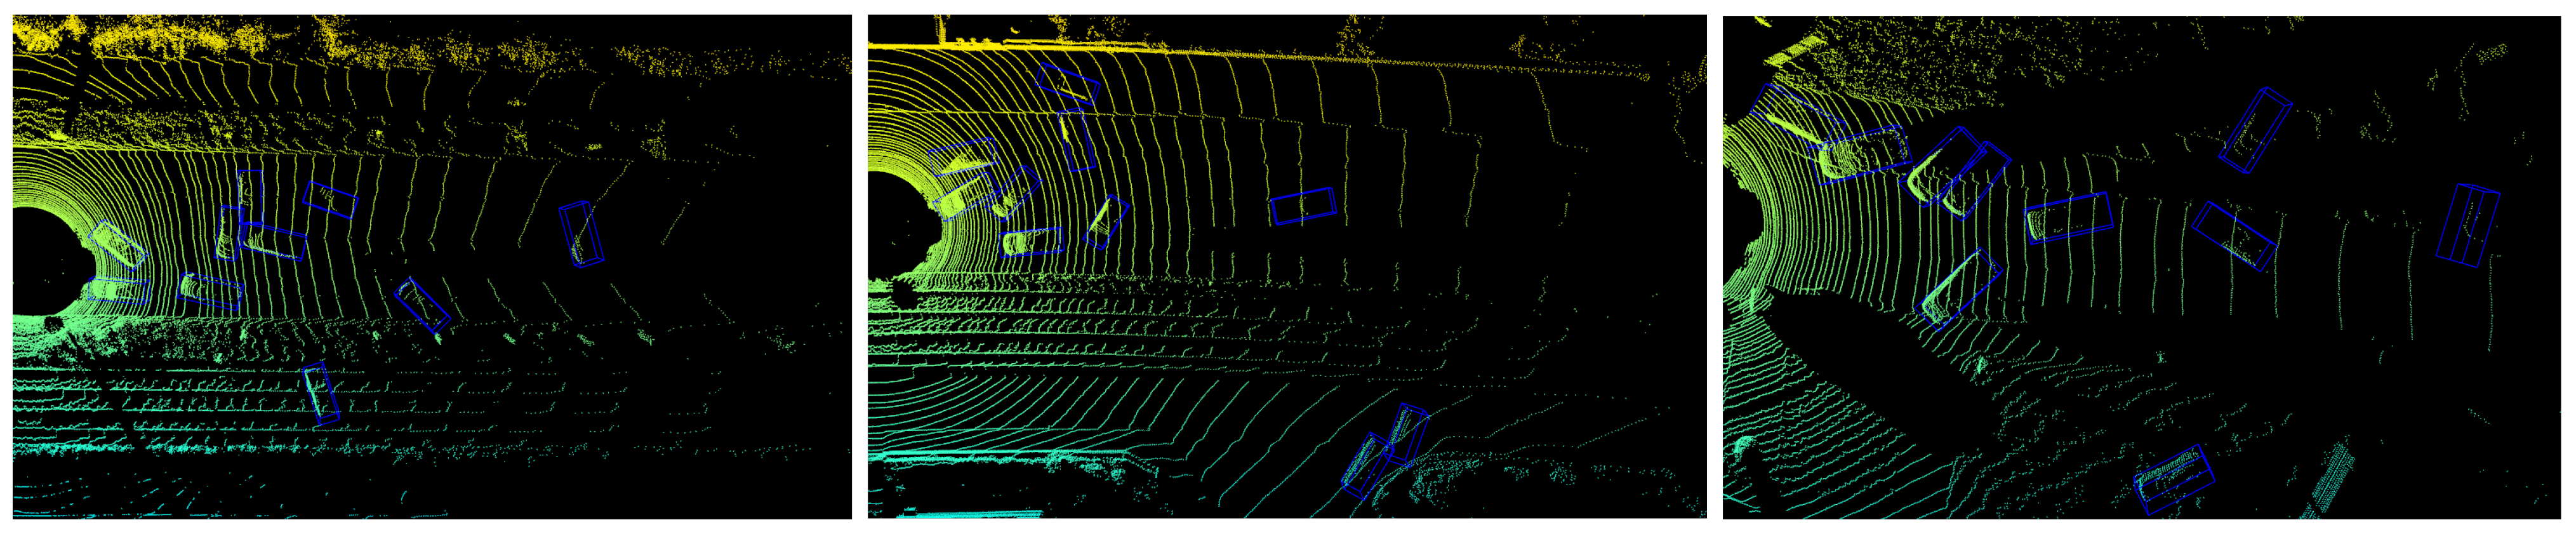
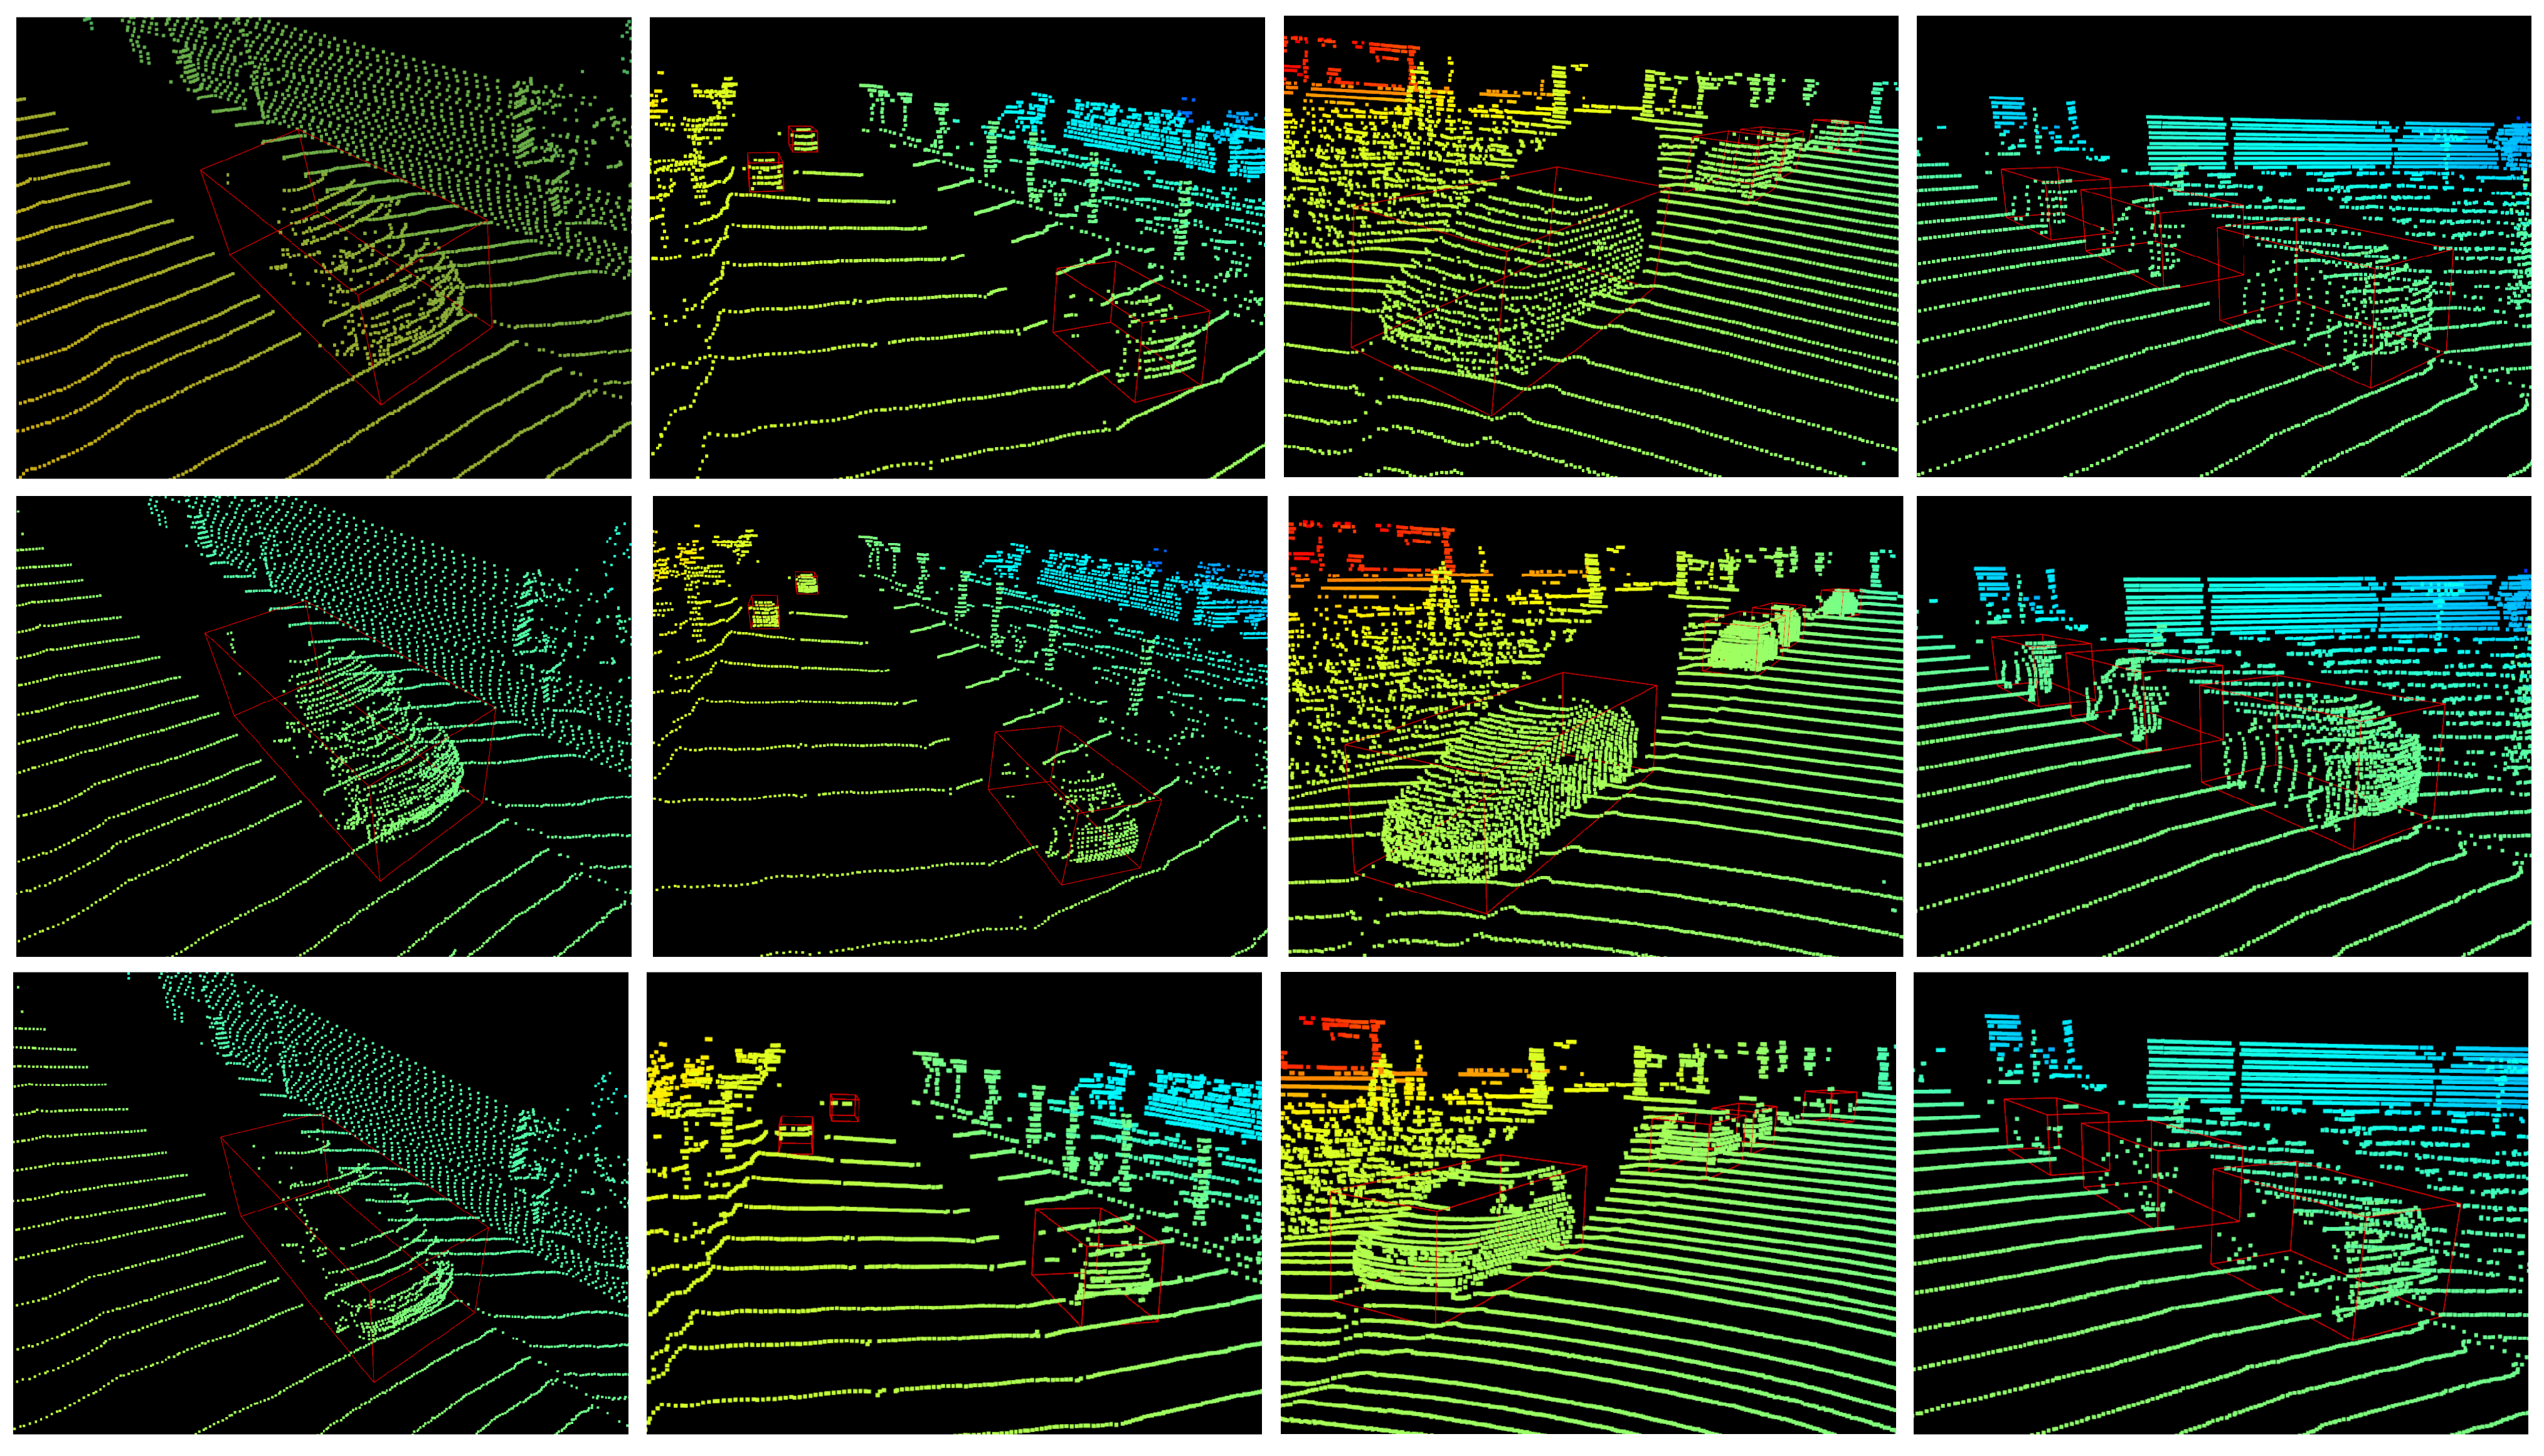
4.3. Three-Dimensional Object Detection

In this part, we evaluate the ShapeKITTI dataset on real-time 3D detectors (PointPillars [34] and SECOND [33]). We trained all four models for 20 epochs with the Adam optimizer. The initial learning rates were set to 0.003 for these one-stage detectors. We evaluated the performance of the model under an IoU of 0.7 on the KITTI validation set. The results are shown in Table 2, and we abbreviate the real KITTI dataset as K, the ShapeKITTI dataset as SK, and the MobilePointClouds dataset as MPC. For the widely used detector PointPillars (fast and light-weight), using ShapeKITTI, we could achieve 78.6% and 86.8% of the performance of models trained with the real KITTI dataset for 3D precision and BEV precision, respectively. This is a very promising result for a dataset that requires almost zero human annotations. With only 40 cars in our MobilePointClouds dataset, we achieved 60.0% and 82.2% of the performance of the PointPillars model trained with real KITTI for 3D and BEV precision, respectively, under moderate mode.
From the results in Table 2, we can see that detectors trained with SK achieved better results than MPC. Such superiority may come from the larger number of models in SK compared with MPC. We also found that both SK and MPC failed to achieve superior results compared to the real KITTI dataset. Although we tried to imitate the mechanisms of real LiDAR, several gaps between the real KITTI and our hybrid datasets still exist, such as the locations of foreground objects, the number or diversity of foreground models, and the distribution of point clouds on foreground objects. We analyze the influence of the first two factors in the following sections (Section 5.1 and Section 5.3. ). We think that the influence of the locations of foreground models can be handled to a large extent by our current group-based placing algorithm, and the influence of the number or diversity of foreground models will diminish with more kinds of foreground objects added. The distribution gap of point clouds on foreground objects between real and hybrid datasets was mainly caused by the difference in the scanning processes. This has a strong influence on the feature extraction, and many related approaches and methods have been proposed in transfer learning [39,40] and domain adaptation [41,42]. However, finding solutions to this is beyond the scope of this paper.

4.4. Human-in-the-Loop Optimization

The above experiments were all based on the final version of ShapeKITTI, which has gone through many generations of updates. In this part, we elaborate the process to update our hybrid point cloud dataset with the human in the loop. Taking PointPillars as an example, we evaluated the 3D AP on the KITTI val set for different generations of ShapeKITTI. The results are shown in Table 3. We trained the 3D detectors for each version of the data and obtained feedback and advice from volunteers. For each iteration, we randomly sampled three groups of detection results from the validation data. They were provided to the volunteers so that they could evaluate the performance of the model trained with the current data. The feedback included the number of virtual objects, the size of virtual objects, the type of virtual objects, the density of generated point clouds, and the position of virtual objects. We collected 45 comments for each version of the data. Considering the possible variation of the feedback, we only selected the most common comment. The generation process of the hybrid dataset was then adjusted according to this advice, and the detectors were retrained with the new data.

5. Discussion

In this section, we analyze the design and effectiveness of the components in the proposed parallel point cloud framework. All the models (PointPillars) were trained on the MobilePointClouds dataset and evaluated on the KITTI validation set. To avoid the uncertainty introduced by the random functions in our method, we fixed the random seeds in this part (therefore, some results may be slightly different from the results in Section 4).

5.1. The Effectiveness of the Group-Based Placing Algorithm

In this part, we validated the effectiveness of the proposed Group-based Placing algorithm (GP) by comparing it to the Fully Random Placing algorithm (FRP) and the Ground-Truth-based Placing algorithm (GTP). For FRP, the objects were randomly placed in the range of view of the virtual LiDAR. For GTP, the ground-truth of the KITTI dataset was used to place virtual objects. The results are shown in Table 4. The proposed group-based placing algorithm achieved much better results than the fully random placing algorithm and competitive performance compared with the ground-truth-based placing method. Form the results, we can see that the locations for placing objects had a great influence on the quality of the hybrid dataset. Randomly placing foreground objects might ignore the relations between foreground objects and the background, for example: it may place a car in a wall. Our method can automatically find the proper places for foreground objects, as shown in Figure 7, thanks to the perception ability of the local regions by analyzing the group statistics.

5.2. The Receptive Field of the Virtual LiDAR

In the proposed virtual LiDAR, most of the settings were designed by referring to the real Velodyne HDL-64E LiDAR such as the vertical and horizontal resolution. In this part, we discuss the influence of the value of the receptive field (in pixels) on the performance of 3D object detection. As shown in Table 5, we obtained the best performance with the value of the receptive field set as 1.5 pixels. When we decreased the value of the receptive field, the diversity of the generated point clouds also declined because the captured points of each laser beam were restricted to a smaller range. On the contrary, the diversity would increase with a larger receptive field; however, more noise would be introduced, and the accuracy would be lower. According to the results shown in Table 5, setting the value of the receptive field to 1.5 achieved a good trade-off between diversity and accuracy.

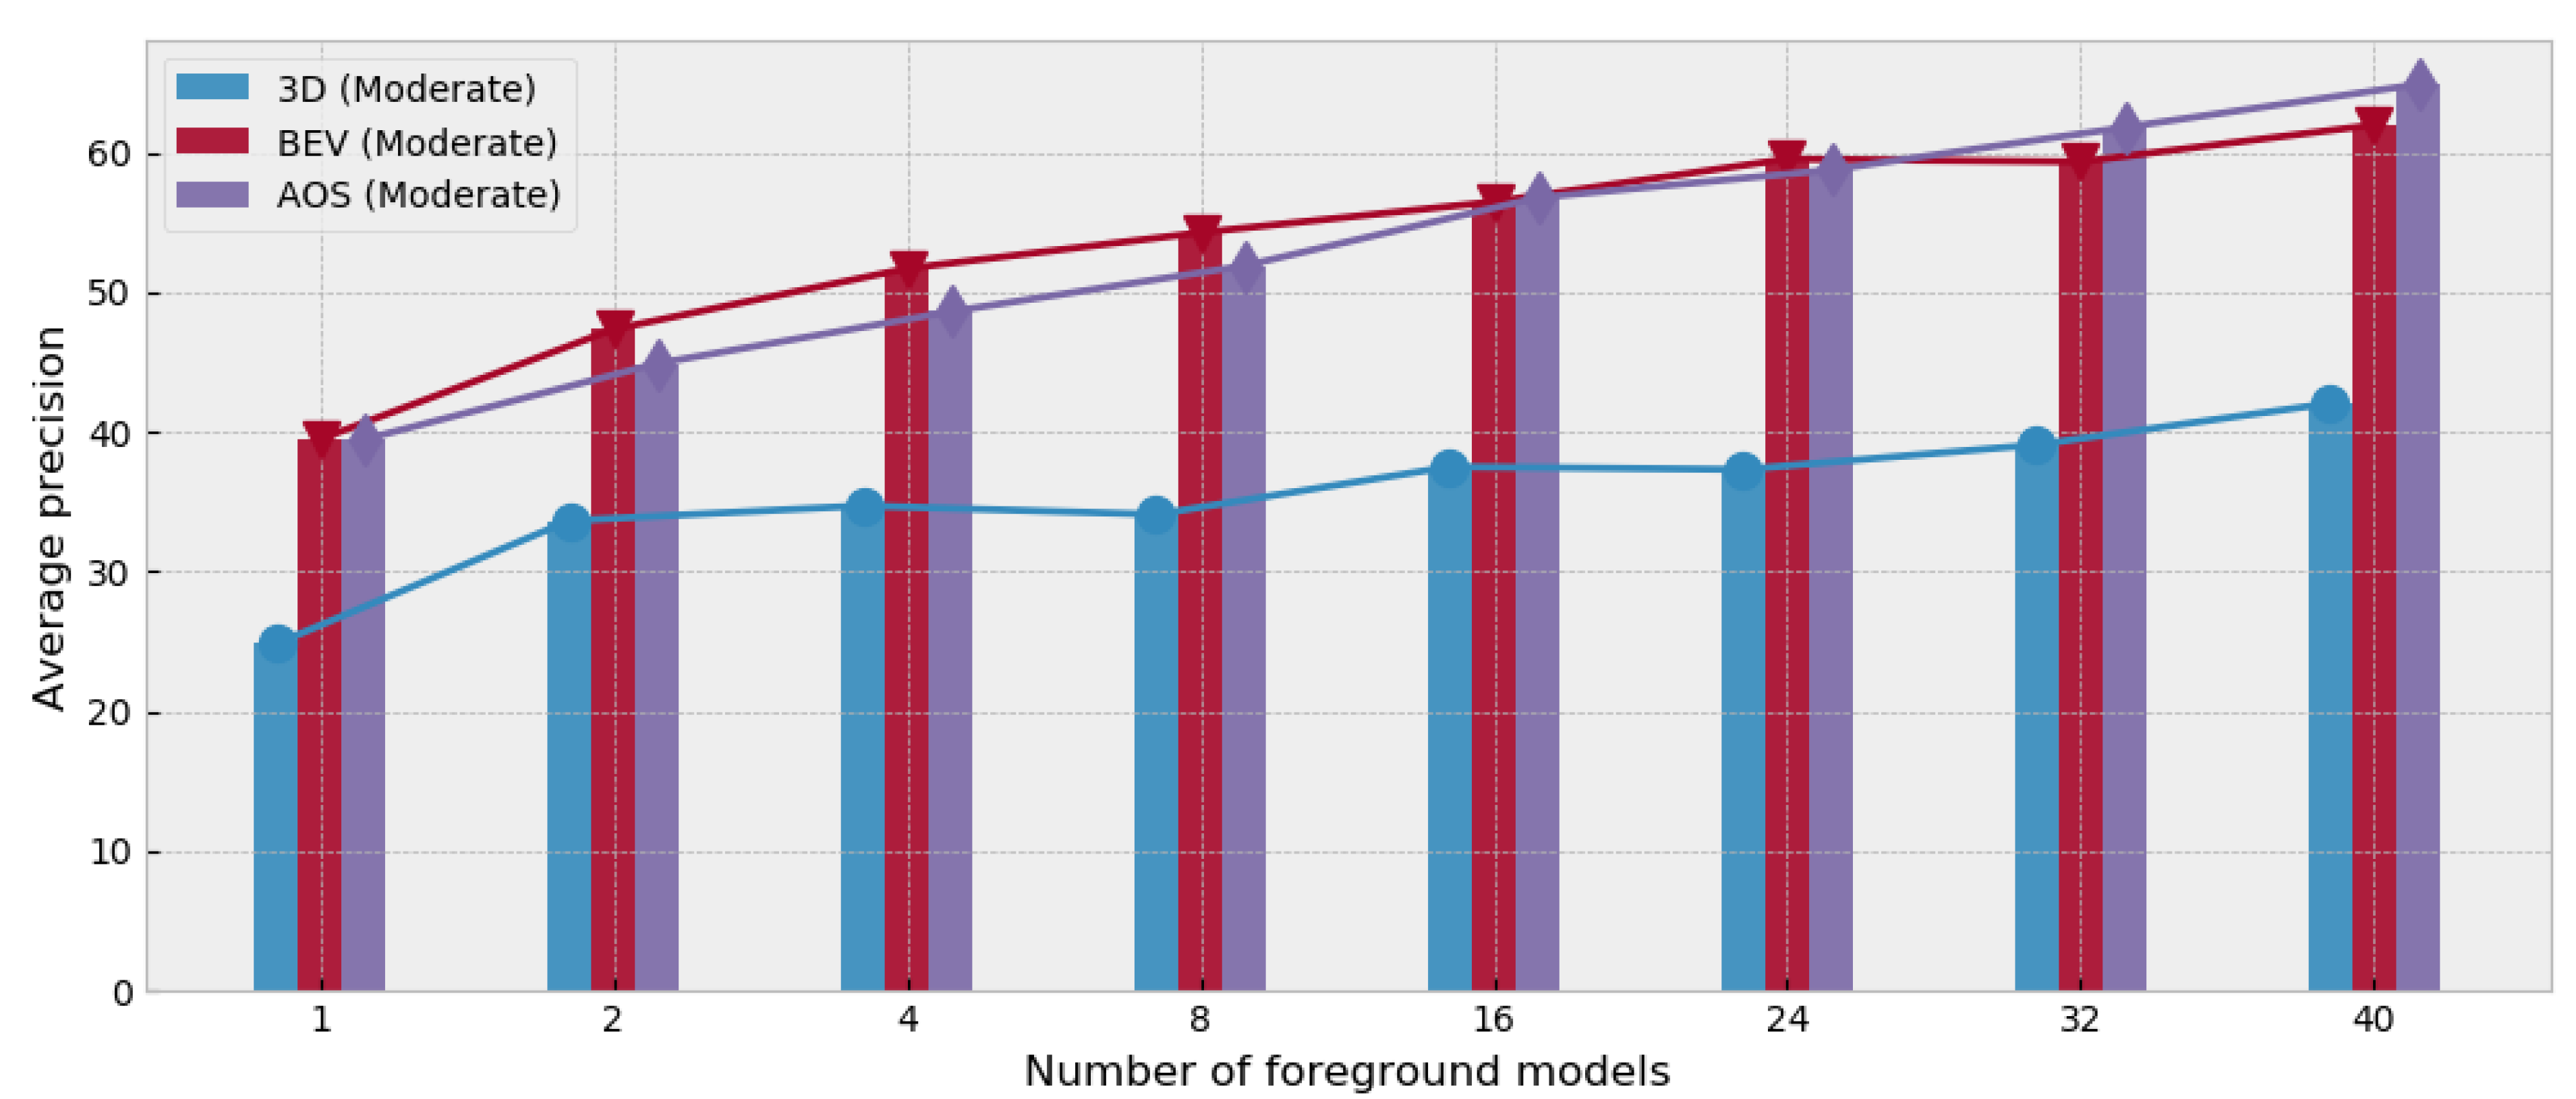
5.3. The Number of Foreground Models

In this part, we compare the models trained using the dataset generated with different numbers of foreground models. It is worth noting that the “number” here refers to how many 3D models we used to generate the hybrid dataset instead of the number of objects in the generated hybrid dataset. One 3D model can generate multiple objects with different settings and background environments. The changes of the average precision for 3D detection, BEV detection, and AOS under moderate mode are illustrated in Figure 9. In general, using more foreground models usually results in better performance. However, some exceptions exist in 3D detection where more models lead to a relatively bad performance sometimes. One possible reason behind this is that the newly added models have distinct 3D structures from the objects in the KITTI validation set; therefore, they may lead to more serious divergence between the real (KITTI) and hybrid (MobilePointClouds) domains. Besides, we also found that even with only one foreground 3D model, we can still achieve an AP of 24.82 for 3D detection, which illustrates the effectiveness of our virtual LiDAR scanning method and automatic group-based placing algorithm.

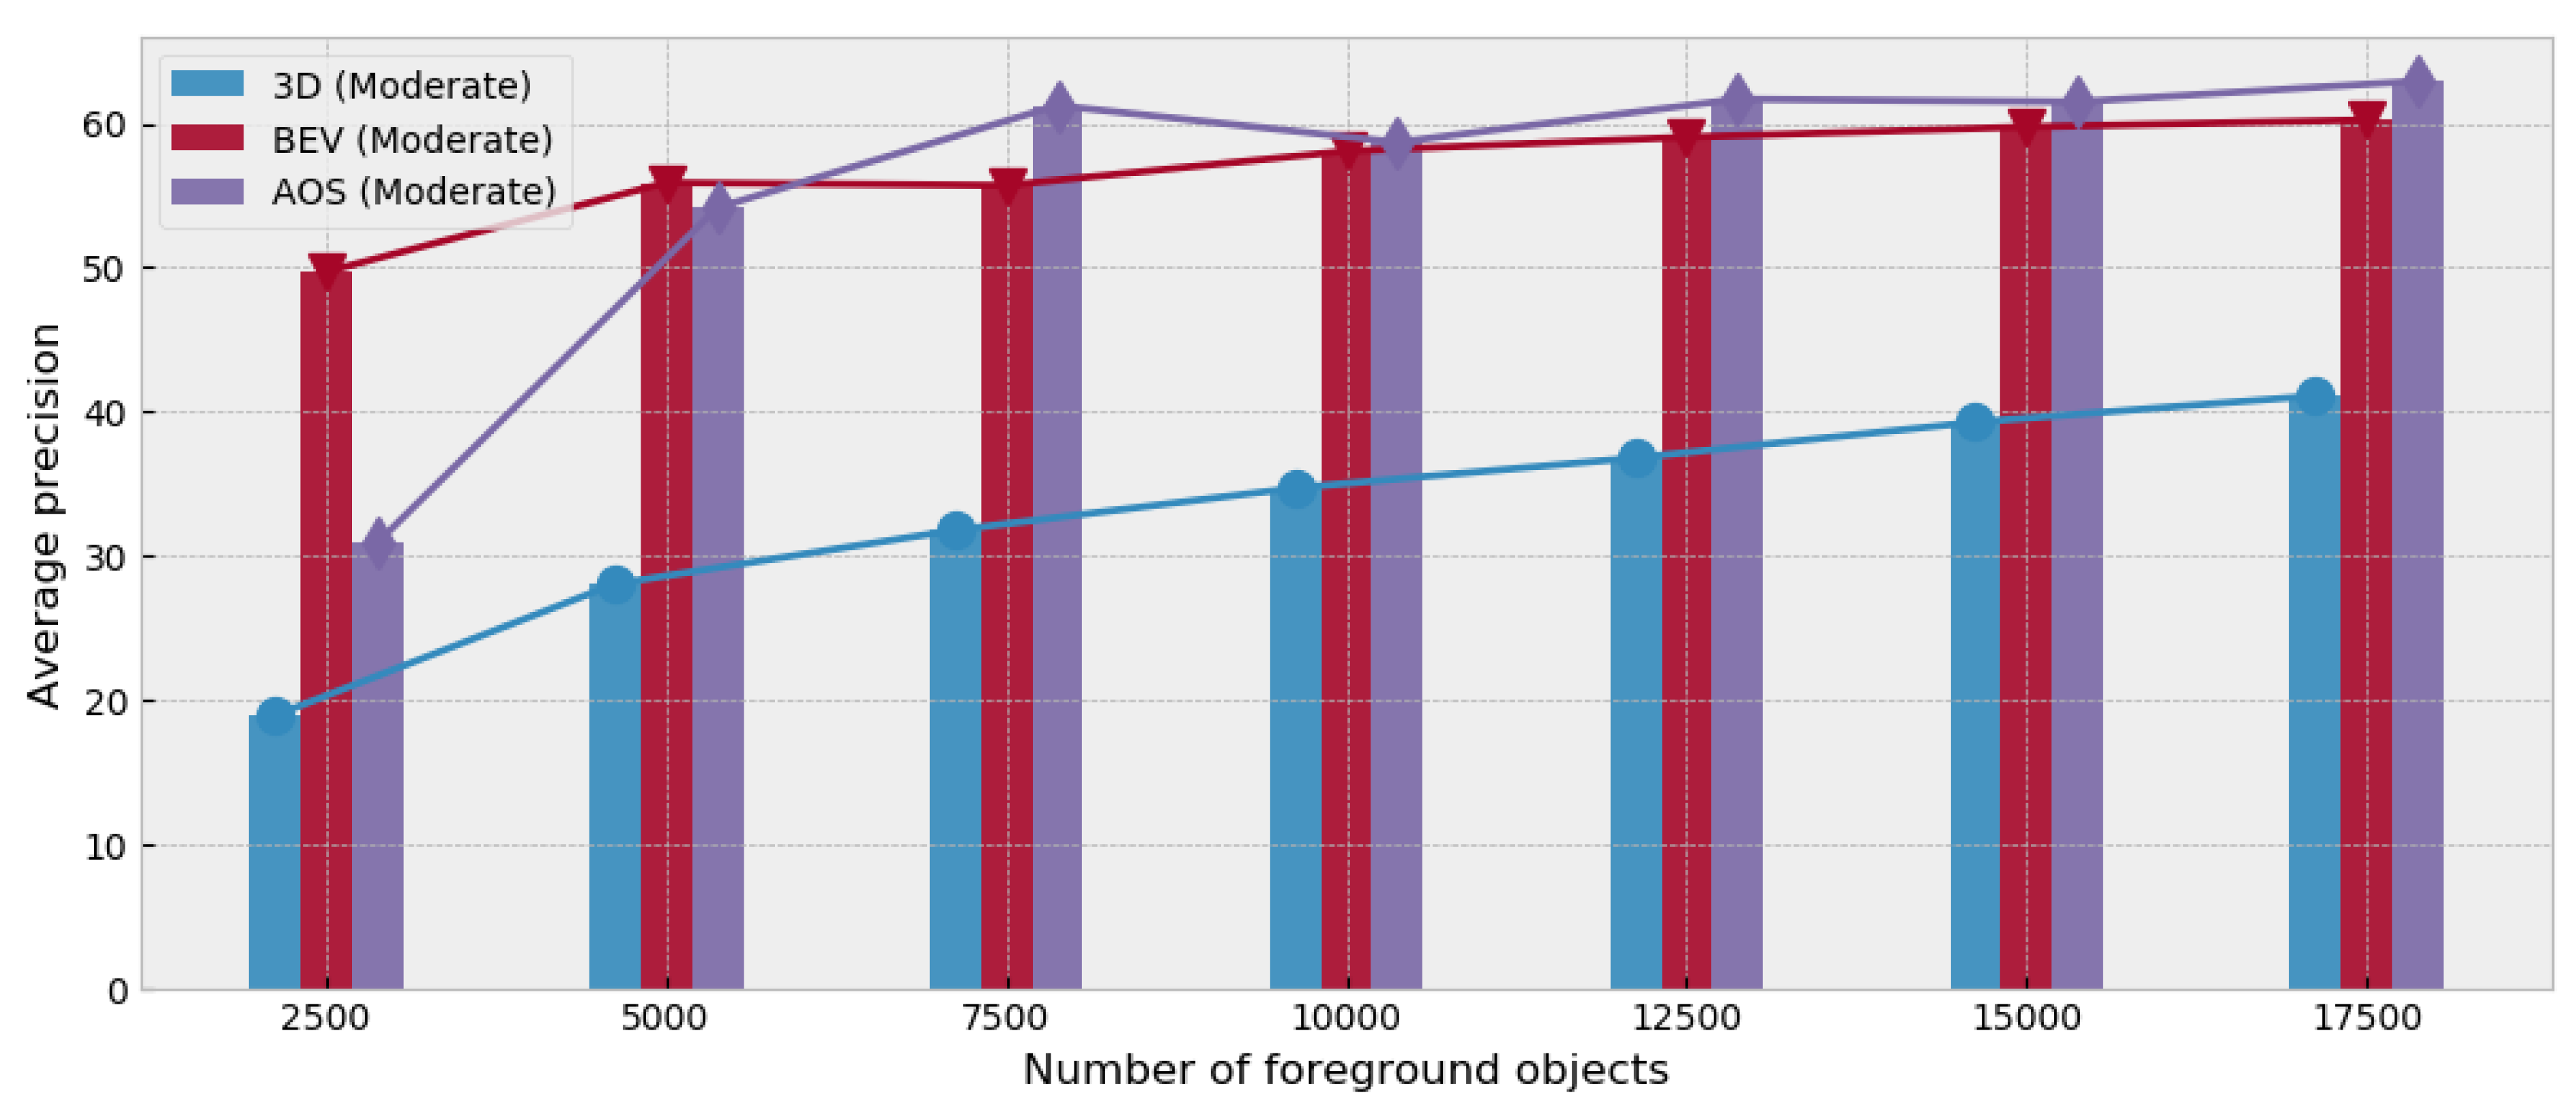
5.4. The Number of Objects in the Dataset

As shown in Figure 10, we analyzed the influence of the number of foreground objects in the hybrid dataset on the performance of the trained models. The biggest increase was witnessed when the number of objects increased from 2500 to 5000. When we added more objects, the increase slowed down and sometimes could not be guaranteed. With the increase of the number of objects, the main obstacles that constrained the performance may change from the number of objects to the difference between real data and hybrid data.

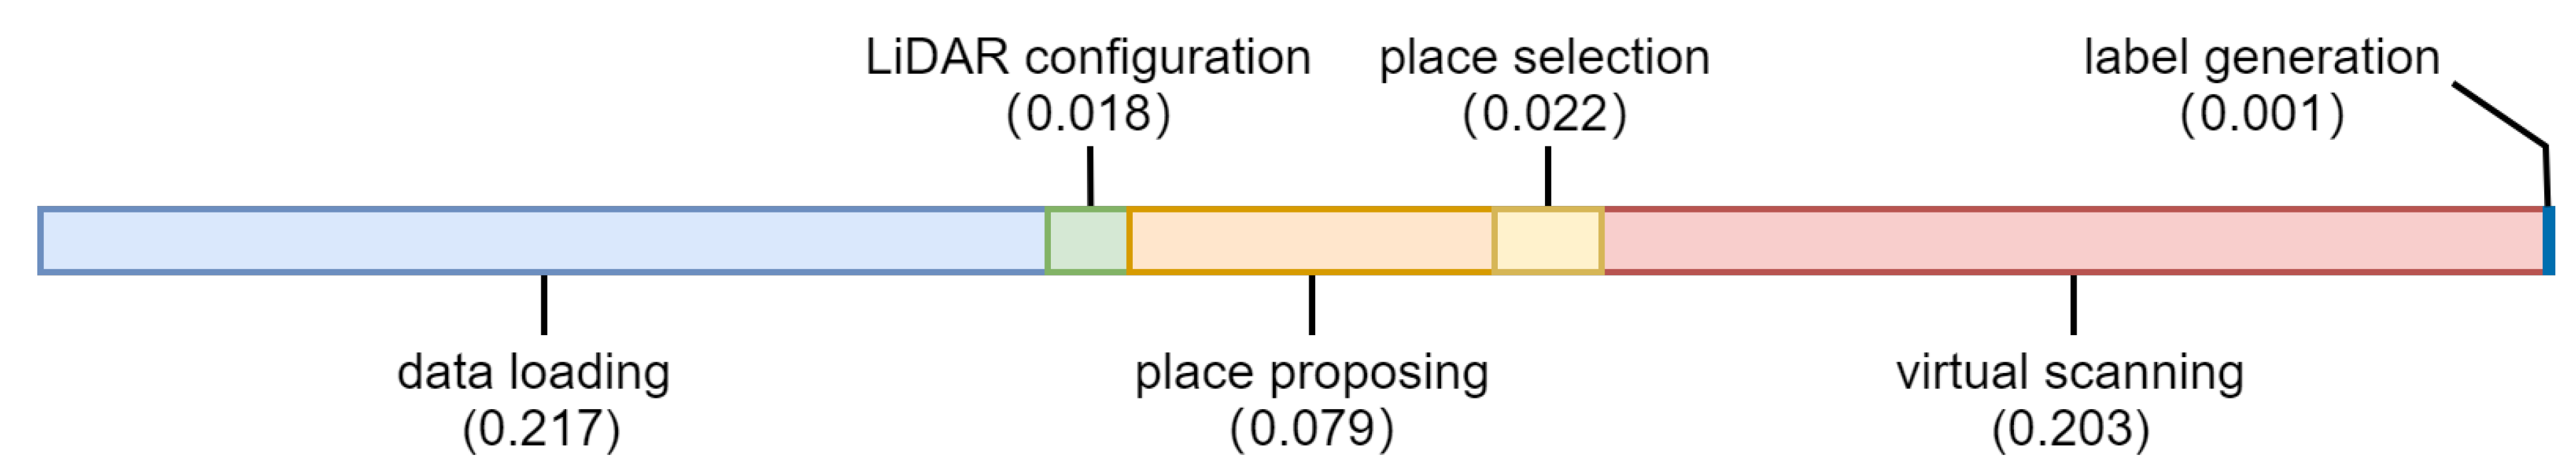
5.5. The Time Cost of Each Operation in the Pipeline

To analyze the time consumption in the proposed hybrid point cloud generation method, we took the generation of hybrid data containing one foreground object as an example and divided the whole pipeline into six parts, as shown in Figure 11. “Data loading” denotes the loading of foreground and background points, as well as other configuration files. “LiDAR configuration” denotes the generation of equivalent scanning grids as depicted in Figure 2. “Place proposing” and “place selection” compose the group-based placing algorithm, as shown in Algorithm 1. “Virtual scanning” denotes the scanning process of the virtual LiDAR, and “label generation” denotes the generation of labels for hybrid point clouds. The whole process took 0.54 s, and the loading of the data took most of this time. All the data were stored on a hard disk; therefore, the loading process can be accelerated with a solid-state drive. The virtual scanning took 0.203 s, and the group-based placing algorithm took 0.101 s. Both of these processes are fully automatic and avoid manual participation, which can achieve higher efficiency compared with the human–machine interactive graphic software.

6. Conclusions and Future Works

In this paper, we proposed a simple and effective hybrid point cloud generation pipeline with almost zero human annotation. It greatly reduces the cost of constructing a large-scale point cloud dataset. Besides, we proposed a human-in-the-loop optimization method to build a closed-loop data generation and model update framework inspired by the ACP method. The experiments with 3D detectors verified the effectiveness of our approach. Three conclusions can be summarized for this paper. Firstly, the closed-loop framework was proven to be effective in the development of 3D detection models. Secondly, the proposed point-based LiDAR simulation method was validated to be effective in the generation of object-level point clouds. Thirdly, the proposed group-based placing algorithm was validated to be effective in the integration of foreground and background point clouds.
In future, we will further increase the diversity of our hybrid dataset by generating more 3D models, especially the scanned models with mobile devices. With the popularity of mobile devices with LiDAR or a ToF camera, the acquisition of 3D models will become more and more simple. It is possible to build a rich dataset by collecting the models that will be widespread through the Internet, which is promising to promote the development of 3D perception. Besides, improving the quality of hybrid point clouds with deep learning models is also very attractive. There still exists a gap between hybrid point clouds and real ones in the distribution of points. The influence of the environment on the LiDAR sensor in the real world is hard to simulate. With the development of generative adversarial networks, it will be possible for networks to learn to refine the hybrid point clouds and make them good substitutes for real point clouds.

Author Contributions

Conceptualization, Y.T., X.W. and F.-Y.W.; methodology, Y.T.; software, Y.T., Y.S. and Z.G.; validation, Y.T. and Y.S.; formal analysis, Y.T.; writing—original draft preparation, Y.T., X.W., Y.S., Z.W. and F.-Y.W.; visualization, Y.T.; supervision, F.-Y.W. and Z.W.; project administration, F.-Y.W.; funding acquisition, X.W. and F.-Y.W. All authors read and agreed to the published version of the manuscript.

Funding

This research was funded by the State Key Program of the National Natural Science Foundation of China OF FUNDER Grant Number 61533019, the Intel Collaborative Research Institute for Intelligent and Automated Connected Vehicles (ICRI–IACV), the Joint Funds of the National Natural Science Foundation of China OF FUNDER Grant Number U1811463, and the Key Research and Development Program of Guangzhou OF FUNDER Grant Number 202007050002.

Institutional Review Board Statement

Not applicable.

Informed Consent Statement

Not applicable.

Data Availability Statement

KITTI dataset can be obtained from http://www.cvlibs.net/datasets/kitti/index.php (accessed on 20 May 2021), and ShapeNet dataset can be obtained from https://www.shapenet.org/ (accessed on 20 May 2021).

Conflicts of Interest

The authors declare no conflict of interest.

References

  1. He, K.; Zhang, X.; Ren, S.; Sun, J. Deep residual learning for image recognition. In Proceedings of the IEEE Conference on Computer Vision and Pattern Recognition, Las Vegas, NV, USA, 27–30 June 2016; pp. 770–778. [Google Scholar]
  2. Huang, G.; Liu, Z.; Van Der Maaten, L.; Weinberger, K.Q. Densely connected convolutional networks. In Proceedings of the IEEE Conference on Computer Vision and Pattern Recognition, Honolulu, HI, USA, 21–26 July 2017; pp. 4700–4708. [Google Scholar]
  3. Ren, S.; He, K.; Girshick, R.; Sun, J. Faster R-CNN: Towards real-time object detection with region proposal networks. In Proceedings of the Advances in Neural Information Processing Systems, Montreal, ON, Canada, 7–12 December 2015; pp. 91–99. [Google Scholar]
  4. Zhang, H.; Tian, Y.; Wang, K.; Zhang, W.; Wang, F.Y. Mask SSD: An Effective Single-Stage Approach to Object Instance Segmentation. IEEE Trans. Image Process. 2019, 29, 2078–2093. [Google Scholar] [CrossRef]
  5. Shen, T.; Gou, C.; Wang, F.Y.; He, Z.; Chen, W. Learning from adversarial medical images for X-ray breast mass segmentation. Comput. Methods Programs Biomed. 2019, 180, 105012. [Google Scholar] [CrossRef]
  6. Shen, T.; Wang, J.; Gou, C.; WANG, F. Hierarchical Fused Model with Deep Learning and Type-2 Fuzzy Learning for Breast Cancer Diagnosis. IEEE Trans. Fuzzy Syst. 2020, 28, 3204–3218. [Google Scholar] [CrossRef]
  7. Zhu, Z.; Wu, W.; Zou, W.; Yan, J. End-to-end flow correlation tracking with spatial-temporal attention. In Proceedings of the IEEE Conference on Computer Vision and Pattern Recognition, Salt Lake City, UT, USA, 18–22 June 2018; pp. 548–557. [Google Scholar]
  8. Qi, C.R.; Su, H.; Mo, K.; Guibas, L.J. Pointnet: Deep learning on point sets for 3d classification and segmentation. In Proceedings of the IEEE Conference on Computer Vision and Pattern Recognition, Honolulu, HI, USA, 21–26 July 2017; pp. 652–660. [Google Scholar]
  9. Chen, X.; Ma, H.; Wan, J.; Li, B.; Xia, T. Multi-view 3d object detection network for autonomous driving. In Proceedings of the IEEE Conference on Computer Vision and Pattern Recognition, Honolulu, HI, USA, 21–26 July 2017; pp. 1907–1915. [Google Scholar]
  10. Wang, C.; Xu, D.; Zhu, Y.; Martín-Martín, R.; Lu, C.; Li, F.F.; Savarese, S. Densefusion: 6d object pose estimation by iterative dense fusion. In Proceedings of the IEEE Conference on Computer Vision and Pattern Recognition, Long Beach, CA, USA, 16–20 June 2019; pp. 3343–3352. [Google Scholar]
  11. Dosovitskiy, A.; Ros, G.; Codevilla, F.; Lopez, A.; Koltun, V. CARLA: An open urban driving simulator. arXiv 2017, arXiv:1711.03938. [Google Scholar]
  12. Zhang, H.; Luo, G.; Tian, Y.; Wang, K.; He, H.; Wang, F.Y. A Virtual-Real Interaction Approach to Object Instance Segmentation in Traffic Scenes. IEEE Trans. Intell. Transp. Syst. 2020, 22, 863–875. [Google Scholar] [CrossRef]
  13. Sambasivan, N.; Kapania, S.; Highfill, H.; Akrong, D.; Paritosh, P.; Aroyo, L.M. “Everyone wants to do the model work, not the data work”: Data Cascades in High-Stakes AI. In Proceedings of the 2021 CHI Conference on Human Factors in Computing Systems, Yokohama, Japan, 8–13 May 2021; pp. 1–15. [Google Scholar]
  14. Wang, F.Y. Parallel system methods for management and control of complex systems. Control Decis. 2004, 19, 485–489. [Google Scholar]
  15. Wang, K.; Gou, C.; Zheng, N.; Rehg, J.M.; Wang, F.Y. Parallel vision for perception and understanding of complex scenes: Methods, framework, and perspectives. Artif. Intell. Rev. 2017, 48, 299–329. [Google Scholar] [CrossRef]
  16. Wang, K.; Lu, Y.; Wang, Y.; Xiong, Z.; Wang, F.Y. Parallel imaging: A new theoretical framework for image generation. Pattern Recognit. Artif. Intell. 2017, 30, 577–587. [Google Scholar]
  17. Li, L.; Lin, Y.; Zheng, N.; Wang, F.Y. Parallel learning: A perspective and a framework. IEEE CAA J. Autom. Sin. 2017, 4, 389–395. [Google Scholar] [CrossRef]
  18. Wang, F.Y.; Zheng, N.N.; Cao, D.; Martinez, C.M.; Li, L.; Liu, T. Parallel driving in CPSS: A unified approach for transport automation and vehicle intelligence. IEEE CAA J. Autom. Sin. 2017, 4, 577–587. [Google Scholar] [CrossRef] [Green Version]
  19. Wang, F.Y. Parallel control and management for intelligent transportation systems: Concepts, architectures, and applications. IEEE Trans. Intell. Transp. Syst. 2010, 11, 630–638. [Google Scholar] [CrossRef]
  20. Wei, Q.; Li, H.; Wang, F.Y. Parallel control for continuous-time linear systems: A case study. IEEE/CAA J. Autom. Sin. 2020, 7, 919–928. [Google Scholar] [CrossRef]
  21. Deng, J.; Dong, W.; Socher, R.; Li, L.J.; Li, K.; Fei-Fei, L. Imagenet: A large-scale hierarchical image database. In Proceedings of the 2009 IEEE Conference on Computer Vision and Pattern Recognition, Miami, FL, USA, 20–25 June 2009; pp. 248–255. [Google Scholar]
  22. Prendinger, H.; Gajananan, K.; Zaki, A.B.; Fares, A.; Molenaar, R.; Urbano, D.; van Lint, H.; Gomaa, W. Tokyo virtual living lab: Designing smart cities based on the 3d internet. IEEE Internet Comput. 2013, 17, 30–38. [Google Scholar] [CrossRef]
  23. Ros, G.; Sellart, L.; Materzynska, J.; Vazquez, D.; Lopez, A.M. The synthia dataset: A large collection of synthetic images for semantic segmentation of urban scenes. In Proceedings of the IEEE Conference on Computer Vision and Pattern Recognition, Vegas, NV, USA, 27–30 June 2016; pp. 3234–3243. [Google Scholar]
  24. Gaidon, A.; Wang, Q.; Cabon, Y.; Vig, E. Virtual worlds as proxy for multi-object tracking analysis. In Proceedings of the IEEE Conference on Computer Vision and Pattern Recognition, Vegas, NV, USA, 27–30 June 2016; pp. 4340–4349. [Google Scholar]
  25. Geiger, A.; Lenz, P.; Urtasun, R. Are we ready for autonomous driving? the kitti vision benchmark suite. In Proceedings of the 2012 IEEE Conference on Computer Vision and Pattern Recognition, Providence, RI, USA, 16–21 June 2012; pp. 3354–3361. [Google Scholar]
  26. Li, X.; Wang, K.; Tian, Y.; Yan, L.; Deng, F.; Wang, F.Y. The ParallelEye dataset: A large collection of virtual images for traffic vision research. IEEE Trans. Intell. Transp. Syst. 2018, 20, 2072–2084. [Google Scholar] [CrossRef]
  27. Tian, Y.; Li, X.; Wang, K.; Wang, F.Y. Training and testing object detectors with virtual images. IEEE/CAA J. Autom. Sin. 2018, 5, 539–546. [Google Scholar] [CrossRef] [Green Version]
  28. Yue, X.; Wu, B.; Seshia, S.A.; Keutzer, K.; Sangiovanni-Vincentelli, A.L. A lidar point cloud generator: From a virtual world to autonomous driving. In Proceedings of the 2018 ACM on International Conference on Multimedia Retrieval, Yokohama, Japan, 11–14 June 2018; pp. 458–464. [Google Scholar]
  29. Fang, J.; Zhou, D.; Yan, F.; Zhao, T.; Zhang, F.; Ma, Y.; Wang, L.; Yang, R. Augmented lidar simulator for autonomous driving. IEEE Robot. Autom. Lett. 2020, 5, 1931–1938. [Google Scholar] [CrossRef] [Green Version]
  30. Qi, C.R.; Liu, W.; Wu, C.; Su, H.; Guibas, L.J. Frustum pointnets for 3d object detection from rgb-d data. In Proceedings of the IEEE Conference on Computer Vision and Pattern Recognition, Salt Lake City, UT, USA, 18–22 June 2018; pp. 918–927. [Google Scholar]
  31. Qi, C.R.; Litany, O.; He, K.; Guibas, L.J. Deep hough voting for 3d object detection in point clouds. In Proceedings of the IEEE International Conference on Computer Vision, Seoul, Korea, 27–28 October 2019; pp. 9277–9286. [Google Scholar]
  32. Zhou, Y.; Tuzel, O. Voxelnet: End-to-end learning for point cloud based 3d object detection. In Proceedings of the IEEE Conference on Computer Vision and Pattern Recognition, Salt Lake City, UT, USA, 18–22 June 2018; pp. 4490–4499. [Google Scholar]
  33. Yan, Y.; Mao, Y.; Li, B. Second: Sparsely embedded convolutional detection. Sensors 2018, 18, 3337. [Google Scholar] [CrossRef] [Green Version]
  34. Lang, A.H.; Vora, S.; Caesar, H.; Zhou, L.; Yang, J.; Beijbom, O. Pointpillars: Fast encoders for object detection from point clouds. In Proceedings of the IEEE Conference on Computer Vision and Pattern Recognition, Long Beach, CA, USA, 15–20 June 2019; pp. 12697–12705. [Google Scholar]
  35. Meyer, G.P.; Laddha, A.; Kee, E.; Vallespi-Gonzalez, C.; Wellington, C.K. Lasernet: An efficient probabilistic 3d object detector for autonomous driving. In Proceedings of the IEEE Conference on Computer Vision and Pattern Recognition, Long Beach, CA, USA, 16–20 June 2019; pp. 12677–12686. [Google Scholar]
  36. Bewley, A.; Sun, P.; Mensink, T.; Anguelov, D.; Sminchisescu, C. Range Conditioned Dilated Convolutions for Scale Invariant 3D Object Detection. arXiv 2020, arXiv:2005.09927. [Google Scholar]
  37. 3D Scanner APP. Available online: http://www.3dscannerapp.com/ (accessed on 1 December 2020).
  38. Cubuk, E.D.; Zoph, B.; Mane, D.; Vasudevan, V.; Le, Q.V. Autoaugment: Learning augmentation strategies from data. In Proceedings of the IEEE Conference on Computer Vision and Pattern Recognition, Long Beach, CA, USA, 16–20 June 2019; pp. 113–123. [Google Scholar]
  39. Pan, S.J.; Qiang, Y. A Survey on Transfer Learning. IEEE Trans. Knowl. Data Eng. 2010, 22, 1345–1359. [Google Scholar] [CrossRef]
  40. Zhuang, F.; Qi, Z.; Duan, K.; Xi, D.; He, Q. A Comprehensive Survey on Transfer Learning. Proc. IEEE 2020, 109, 43–76. [Google Scholar] [CrossRef]
  41. Wang, M.; Deng, W. Deep Visual Domain Adaptation: A Survey. Neurocomputing 2018, 312, 135–153. [Google Scholar] [CrossRef] [Green Version]
  42. Wilson, G.; Cook, D.J. A survey of unsupervised deep domain adaptation. ACM Trans. Intell. Syst. Technol. (TIST) 2020, 11, 1–46. [Google Scholar] [CrossRef]
Figure 1. The framework of the parallel point clouds.
Remotesensing 13 02868 g001
Figure 2. The illustration of our virtual point cloud generation pipeline.
Remotesensing 13 02868 g002
Figure 3. The illustration of our hybrid point cloud integration pipeline. Firstly, foreground models are converted to point clouds. Secondly, an empty background is generated by removing existing objects. Thirdly, the background and foreground are integrated with the proposed ground-based placing algorithm. Finally, foreground objects are virtually scanned by the virtual LiDAR.
Remotesensing 13 02868 g003
Figure 4. The illustration of our surface point sampling method.
Remotesensing 13 02868 g004
Figure 5. The models and point clouds of real cars scanned by the iPad Pro.
Remotesensing 13 02868 g005
Figure 6. The visualization of candidate places generated by our group-based placing method (second row) and original point clouds (first row).
Remotesensing 13 02868 g006
Figure 7. The demos of ShapeKITTI (blue boxes indicate the bounding boxes of newly added objects).
Remotesensing 13 02868 g007
Figure 8. The visualization of ShapeKITTI (first row), MobilePointClouds (second row), and KITTI (last row).
Remotesensing 13 02868 g008
Figure 9. The influence of the number of foreground models on the average precision of the 3D detector.
Remotesensing 13 02868 g009
Figure 10. The influence of the number of foreground objects in the hybrid dataset on the average precision of the 3D detector.
Remotesensing 13 02868 g010
Figure 11. The time (in seconds) cost of each operation in the pipeline.
Remotesensing 13 02868 g011
Table 1. The configurations of the virtual scanning grids.
AttributeH-Resolution (Channels)V-ResolutionH-FoVV-FoVDetection Range
Value0.4° (64)0.2°[−45°, 45°][−24.8°, 2°]120 m
Table 2. Performance on the KITTI validation set of detectors trained with the real KITTI and ShapeKITTI.
Method3D APBEV APAOS AP
ModerateEasyHardModerateEasyHardModerateEasyHard
PointPillars-K77.5886.6875.8287.4489.7984.7789.3490.6388.36
PointPillars-SK60.9475.5458.2675.9386.4973.9574.2386.9072.38
PointPillars-MPC46.2856.3245.8171.8685.4971.5371.0885.5170.62
SECOND-K78.0687.6276.5287.2889.5283.8989.4590.4988.41
SECOND-SK45.0460.1342.6668.4079.5964.8264.1180.1342.66
SECOND-MPC38.8353.6236.8754.3370.3555.0158.5274.2255.90
Table 3. The process of updating the ShapeKITTI dataset.
VersionModerateEasyHardFeedbackAdviceAP
V010.3210.6410.53Works for a few types of carAdd more cars-
V116.6422.1413.98Bad estimation for the sizeRefine the size of the CAD models6.14
V222.4032.8519.52Bad performance for sparse objectsGenerate more sparse objects5.94
V326.8529.4323.51Bad estimation for the heightAdjust the height of the objects4.45
V429.7438.9927.10Bad performance for sparse objectsGenerate more sparse objects2.89
V531.0439.2230.302.30
Table 4. Comparison of different placing algorithms.
Method3D APBEV APAOS AP
ModerateEasyHardModerateEasyHardModerateEasyHard
FRP35.2540.5931.9361.2272.6256.2960.1775.8855.37
GP42.0352.9138.7261.9676.9458.4864.8683.7460.35
GTP45.2454.3644.1370.9182.5468.6672.9383.8870.36
Table 5. Comparison of different receptive fields in the proposed virtual LiDAR.
Value (m)3D APBEV APAOS AP
ModerateEasyHardModerateEasyHardModerateEasyHard
0.518.2422.4416.1145.2360.3439.7039.6849.8135.51
1.040.6343.4137.6657.0168.0555.0262.8575.6758.52
1.542.0352.9138.7261.9676.9458.4864.8683.7460.35
2.039.1046.5037.0557.7770.2556.5862.3171.6457.07
2.538.2841.0434.6854.0563.1152.7360.6369.1155.56
Publisher’s Note: MDPI stays neutral with regard to jurisdictional claims in published maps and institutional affiliations.

