Abstract
The availability of accurate and reliable rainfall data that are applicable to various phenomenological, climatological, and modeling studies is important, especially in the Philippines, which is considered to be highly vulnerable to natural hazards and a changing climate. The presented strategy involved constructing a dataset consisting of synoptic data, automatic rain gauge (ARG) measurements, and satellite data that are co-registered, consistent, and formatted in the same manner. Although sparse in number, the synoptic stations provide the most accurate rainfall information and were used as the baseline for creating the dataset. The ARGs that are within a distance of 1 km to the synoptic stations were used to determine the correction factors needed to make the synoptic and ARG data consistent. Subsequently, the corrected ARGs were used to make the satellite IMERG data consistent with both ARG and synoptic data. In case of the latter, only IMERG pixels with at least 10 ARGs within the relatively large footprint of the satellite sensor were used in estimating the required correction parameters derived from a combination of a power transform and linear regression correction techniques. The final results show good agreement of synoptic and corrected ARG data with correlation coefficients of 0.94 and 0.97 for the 10 day and monthly data, respectively, and improvement in the linear regression slope from 0.67 to 0.90 for 10 day data, and 0.70 to 0.94 for monthly data. In addition, the corrected ARG data agree well with the corrected IMERG data, with correlation coefficients of 0.88 and 0.93 for the 10 day and monthly data, respectively, and an improvement in slope from 0.66 to 0.87 for 10 day data, and 0.74 to 0.99 for monthly data. The merit of using a combined dataset is illustrated through comparative analyses of the IMERG data and spatially interpolated synoptic and ARG data. The results show general agreements in spatial patterns of rainfall across the datasets, especially in areas where in situ measurements are recorded. The observed discrepancy when ground data is limited emphasizes the need for satellite IMERG data to obtain the true spatial patterns of rainfall distribution.
1. Introduction
Rainfall is essential to life and is the primary source of fresh water needed by humans, plants, and animals. It is responsible for the movement of enormous amounts of water and heat through the Earth’s atmosphere, and is a major part of the Earth’s energy budget and climate. In the Philippines, rain is driven mainly by the monsoons: the Summer Monsoon, called Habagat, and the Winter Monsoon, called Amihan. The Summer Monsoon is usually carried by southwest winds and is the predominant weather pattern from June until September. The Winter Monsoon, by comparison, overlaps with the Summer Monsoon for about a week and becomes part of the weather pattern for the remainder of the year until March the following year. The Winter Monsoon usually originates in Siberia or Mongolia and is transported through anticyclonic northeast winds. Other sources of rain include the occurrences of tropical cyclones that come from the mid-Pacific Ocean and reach the Philippines a few times a year.
Reliable information on rainfall in the Philippines at sufficient spatial and temporal resolution is important for several reasons. First, the Philippines is primarily an agricultural country, and it is critical to know rainfall patterns that may lead to drought or flooding. Second, rainfall data provide the means to assess the rate and persistence of precipitation events and how they may affect communities. Third, such information is also needed in the development of risk assessment models that are used to provide early warning systems [1]. Currently, the key sources of rainfall data are the 51 synoptic stations installed and maintained by the Philippine Atmospheric, Geophysical and Astronomical Services Administration (PAGASA), and about 2000 automatic rain gauges (ARGs) installed by the Department of Science and Technology—Advance Science and Technology Institute (DOST-ASTI). The synoptic data are regarded as the more accurate and dependable dataset because the instruments were built, calibrated, and maintained according to the standards set by the World Meteorological Organization (WMO). The ARGs are unmanned stations that provide real time rainfall measurements every 10 or 15 min and provide much improved spatial coverage over the entire country compared with synoptic data coverage. However, the quality of the data may not be as good as the synoptic measurements because of less attention to proper calibration and the lack of maintenance of the sensors.
The synoptic stations were also designed to monitor synoptic scale systems running from 200 to 10,000 km spatial radius and lifetimes of a day to a month [2]. Such systems include tropical cyclones, high and low pressure areas, and movements of air masses. However, the insufficient density of these stations leads to the lack of accurate representation of the areal distribution of rainfall within a synoptic system [3]. The low density of synoptic stations also makes it difficult to detect patterns caused by small scale systems such as thunderstorms. The situation was improved with the introduction of ARGs. However, even with reliable and quality checked ARGs, there are still considerable gaps in the spatial coverage, especially in mountainous and difficult to reach areas.
The situation can be considerably improved through additional use of satellite remote sensing data. Historically, satellite rainfall data have had problems with statistical gaps in coverage because of the dynamic nature of rainfall events and inability of polar orbiting sensors to cover all events, especially when they are regional and short term. However, the satellite rainfall products are becoming increasingly capable, with significantly improved spatial and temporal coverage and suitable for hydrological and climate studies [1]. The most popular and widely used product has been that from the Tropical Rainfall Measuring Mission (TRMM) [4]. With a global coverage, spatial resolution of 0.25°, and temporal resolution up to 3 h, TRMM can provide continuous rainfall measurements covering the whole Philippines. However, some studies show that satellite products are prone to over/underestimation depending on the season and location [5,6]. The Global Precipitation Measurement (GPM) continued the legacy of TRMM after the latter was decommissioned in 2014. GPM provides global coverage at higher spatial (0.1°) and temporal (30 min) resolution than TRMM [7].
Satellite rainfall products have been validated and merged with ground-based measurements on a global scale. In Pakistan, the Integrated Multisatellite Retrievals for GPM (IMERG) was validated using reference gauges and found that IMERG correlates well with monthly gauge data and performs better than its predecessor TRMM with respect to errors and biases in rainfall estimates [8]. In southeastern Austria, IMERG near real-time and final runs were compared with a dense network of rain gauges wherein the near real-time products overestimate low rain rates from averaged rain gauges while all product runs underestimates high rain rates [9]. Similar results were obtained in Singapore where daily IMERG moderately correlates with average data from multiple rain gauges and monthly products perform better than finer temporal resolutions but, in contrast, the light rain events (0.1–1.0 mm/day) were underestimated by satellite products of TRMM and GPM [10]. Various studies have also been conducted to correct errors and biases in IMERG, such as using Digital Elevation Models (DEM) and adjustment of a Cumulative Distribution Function (CDF) to better represent rainfall in parts of China [11,12]. In the Philippines, several studies have been conducted only to validate satellite-based rainfall products using the sparse point measurements from synoptic stations [6,13,14,15]. However, the results of these validation studies have not always been favorable, with limited efforts to understand the problem and resolve the discrepancies.
The goal of this study is to develop a rainfall dataset through concurrent use of IMERG and synoptic and ARG ground-based measurements. The strategy involved using synoptic measurements as the baseline data to correct any biases on near simultaneous and co-located ARG measurements. Then, the corrected ARG data were used to normalize the IMERG data. Because each IMERG grid measurement covers a relatively large area, the averages of several ground measurements within its footprint are considered for comparative studies. The production of IMERG, ARG, and synoptic datasets that are similarly formatted and have consistent values is expected to provide a more powerful tool for rainfall studies. The bias-corrected product can be used to accurately assess large scale and mesoscale distributions and patterns of rain in the entire country. This study also provides new insights into why previous reports indicated inconsistencies between satellite gridded rainfall products and synoptic data [6,13,14,15].
2. Materials and Methods
2.1. Ground Rainfall Measurements
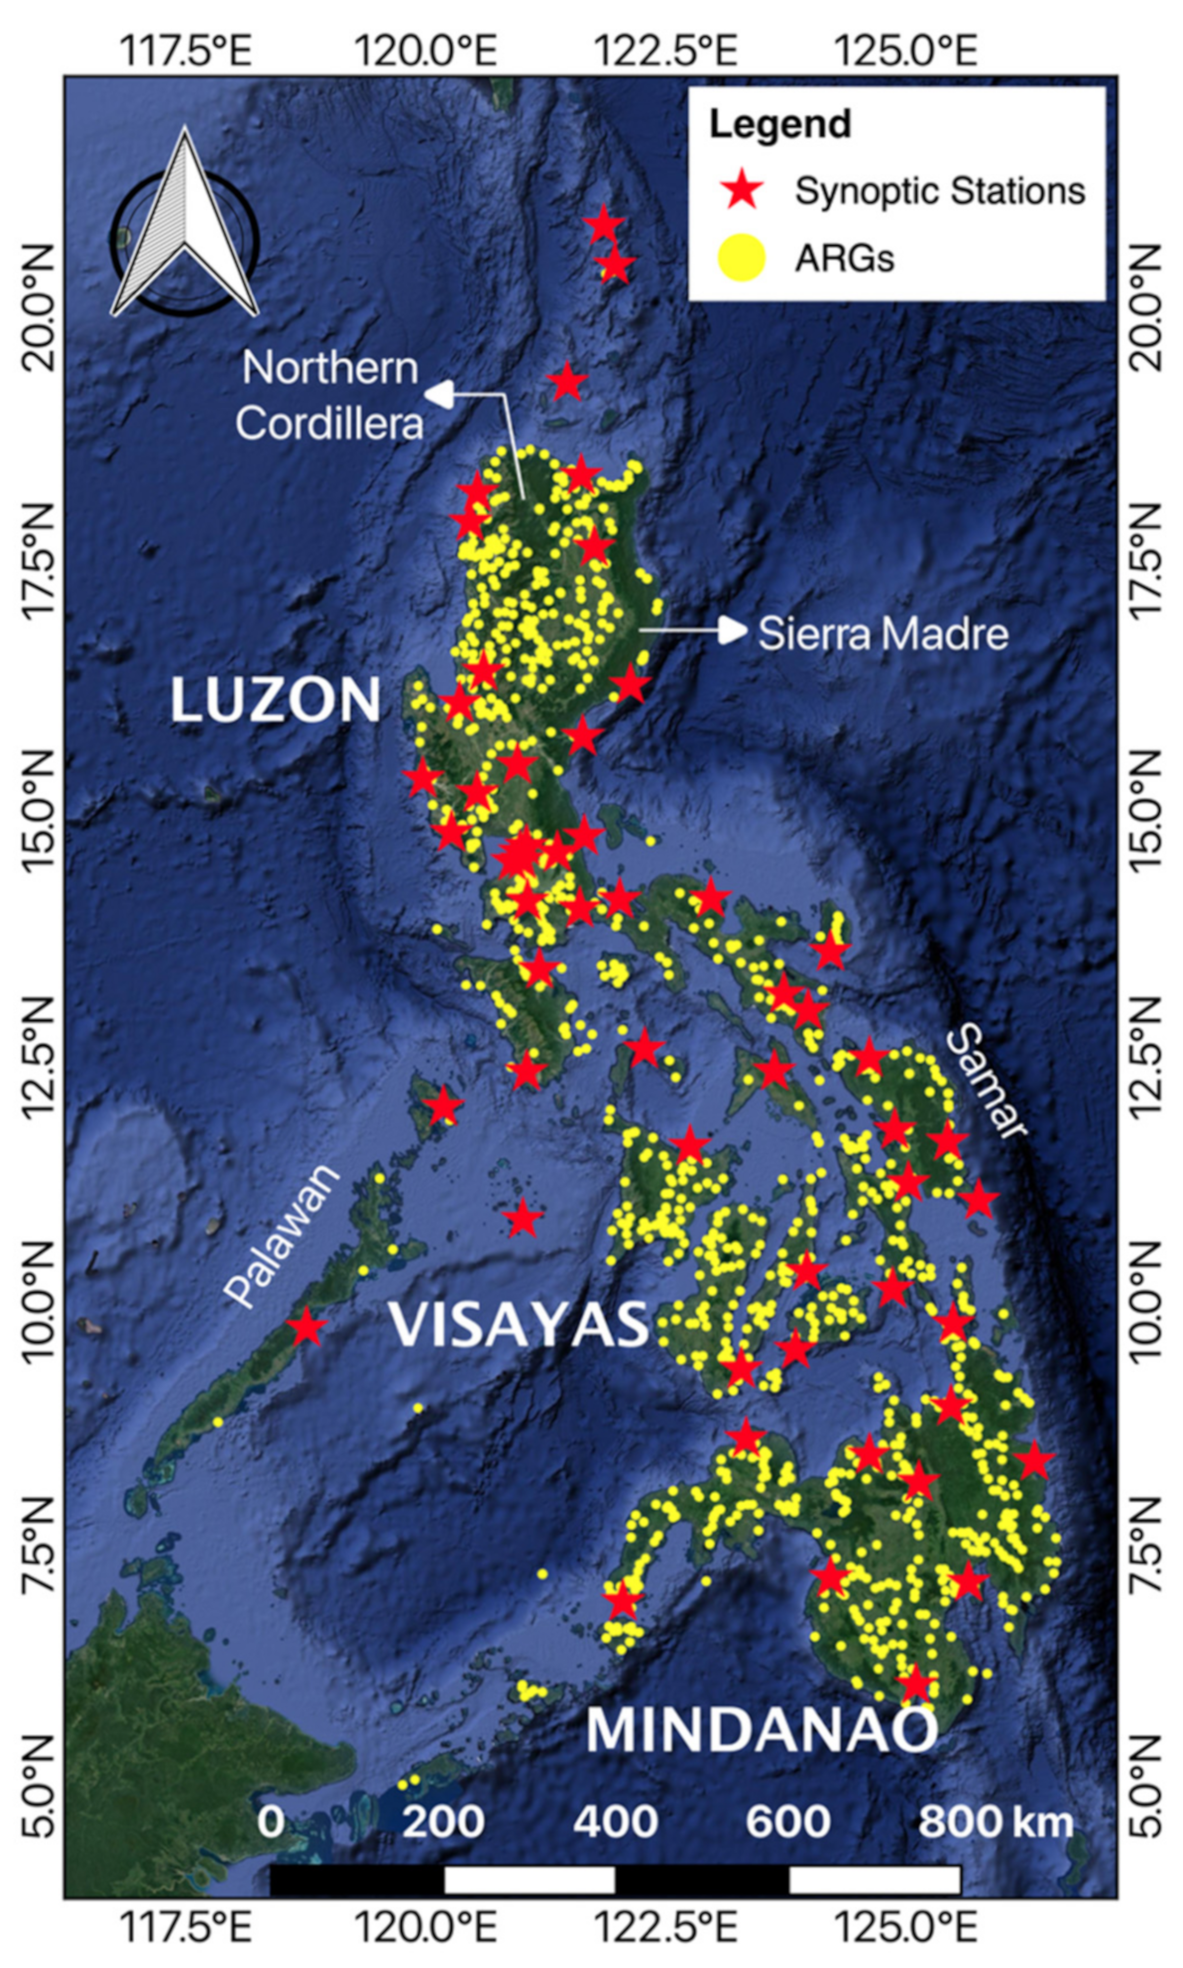
The locations of synoptic stations and automatic rain gauges (ARGs) in the Philippines are depicted in Figure 1. The paucity of synoptic stations is apparent, with only four in Northern Luzon, two in Palawan, and a small number on the southern island of Mindanao. The coverage of ARG stations is significantly better but there are still many gaps, especially in Northern Cordillera mountains, Eastern Sierra Madre Forest, Palawan, Samar, and parts of Mindanao. With satellite data, there are no gaps in the coverage and there are spatial and temporal consistencies in the measurements.

Figure 1.
Locations of synoptic stations (red) and ARGs (yellow) over the Philippines as of 2019.
2.1.1. Synoptic Stations
Synoptic stations provide rainfall measurements using tipping bucket rain gauges that are manned and calibrated by weather observers. In addition, these stations follow the standards set by the World Meteorological Organization in measuring and recording meteorological parameters and, therefore, the synoptic station rainfall data are regarded as the most accurate ground rainfall measurement in the Philippines. Daily rainfall from 55 active stations, provided by PAGASA, during the period 2014 to 2017 were considered in the study. The daily rainfall averages were then aggregated to 10 day and monthly averages expressed in mm/day.
2.1.2. Automatic Rain Gauges
To improve the spatial coverage of rain, the Department of Science and Technology (DOST) started installing automatic rain gauges (ARGs) all over the Philippines in 2011 and, over time, the number reached approximately 2000 ARGs by 2017. Many of these ARGs are standalone systems, whereas the remainder are incorporated in automatic weather stations and water level monitoring systems. By 2014, almost 1000 ARGs were installed and are fully operational. To ensure robust coverage, only rainfall data from ARGs during 2014 to 2017 were utilized in this study. Currently, the DOST Advanced Science and Technology Institute (DOST-ASTI) receives, stores, and distributes the data transmitted by these rain gauges.
ARGs provide rainfall measurements every 10 or 15 min depending on the type of instrument installed. Similar to the synoptic stations, this network also makes use of tipping bucket rain gauges for the basic measurement. Because the ARGs are not supervised, there is always the possibility of instrument malfunction or other unforeseen sources of error. To ensure quality and optimize accuracy and reliability of the measurements, the following quality checks, as suggested by Combinido et al. [16], were implemented:
- Geolocation check to ensure that the reported location of the measurement is consistent with the actual location established during installation;
- Timestamp check to ensure that the automatically logged data follow the set time intervals per rainfall measurement;
- Range check to remove abnormally high rainfall measurements (e.g., >20 (30) mm for 10 (15) min instantaneous sampling); and
- Internal consistency check to verify rainfall measurements are within expected values as can be inferred from corresponding temperature and relative humidity measurements.
Additionally, the following checks were included in the quality assurance procedure to account for further data cleaning:
- Climatology consistency check to verify that monthly averages are consistent within 1.5 standard deviations with monthly climatology for the same month of the nearest synoptic station; and
- Zero measurements check to exclude in this study ARGs that provide 75% or more zero (0 mm) or no rainfall data during the study period.
The quality assured rainfall measurements were then aggregated to 10 day and monthly averages. Location and elevation details were utilized to perform distance-dependent comparative analyses with synoptic stations and satellite data.
2.2. Satellite Rainfall Measurement
NASA and JAXA launched the Global Precipitation Measurement Core Observatory Satellite (GPM) in February 2014 to continue the legacy of the Tropical Rainfall Measuring Mission (TRMM), which was decommissioned in July 2014. The GPM precipitation data are more accurate and have higher spatial and temporal resolutions than those of TRMM.
The GPM product used in this study is the Integrated Multisatellite Retrievals for GPM (IMERG), which includes an enhanced TRMM product for longer time series studies. IMERG also incorporates precipitation estimates from other passive microwave (PMW) sensors, in addition to infrared (IR) sensors from Low Earth Orbiting (LEO) and geostationary satellites [7,8]. IMERG precipitation is available every 30 min at 0.1° spatial resolution. Half-hourly precipitation estimates are composed of instantaneous PMW estimates when available and PMW estimates propagated from previous or future times using Lagrangian time interpolation [8]. IR estimates are used to supplement PMW estimates. Subsequently, precipitation estimates are calibrated using monthly precipitation data from the Global Precipitation Climatology Center (GPCC). IMERG data are available in three stages, namely, early, late, and final run products. Early and late run products correspond to near real-time precipitation data, which are released after four and 12 h, respectively. The final run product undergoes monthly rainfall calibration from GPCC and is available after 3.5 months.
In this study, half-hourly rainfall estimates from 2014 to 2017 were utilized using the IMERG late (IMERG LR) and final (IMERG FR) runs version 6 product with emphasis on the final run product. The half-hourly rainfall data were clipped covering the entire Philippines and adjacent areas, and aggregated to 10 day and monthly averages. The gridded rainfall product of IMERG was then matched with ground station data for the comparative analysis.
2.3. Comparative Analysis
Comparative analyses of raw values of synoptic, ARG, and IMERG data indicated discrepancies when data from pairs of these variables were analyzed. To gain insight into these discrepancies, we examined the effect of the difference in distance of the location of the measurements being compared, such as that between the synoptic station and ARG data. We also examined the effect of comparing point measurements from the synoptic stations or ARGs with those from the IMERG products over much larger areas. Effects of difference in elevation and time of measurements were also considered. Quantitative analyses including the use of statistical metrics, such as correlation coefficient, root mean square error, mean absolute error and bias, were estimated using standard techniques [8,10,15,17]. The results of these analyses are presented in the following section.
The analyses started with the comparison of synoptic rainfall measurements with IMERG data, which was undertaken by matching synoptic data with IMERG observations, which cover a much larger area but enclose the location of the station. Only days with recorded rainfall of greater than 0.1 mm from both synoptic stations and IMERG were considered in the comparative study. Analyses were undertaken using only 10 day and monthly rainfall averages because daily data was characterized by excessive variability. The 10 day rainfall data are useful in the evaluation of the direct effects of rain on crops and soil by capturing crop growth stages and serving as a compromise between daily and monthly rainfall data [18]. By comparison, although the effects of topography and localized circulations are smoothed in the monthly rainfall data [19], these data are useful in long-term variability and climate change studies.
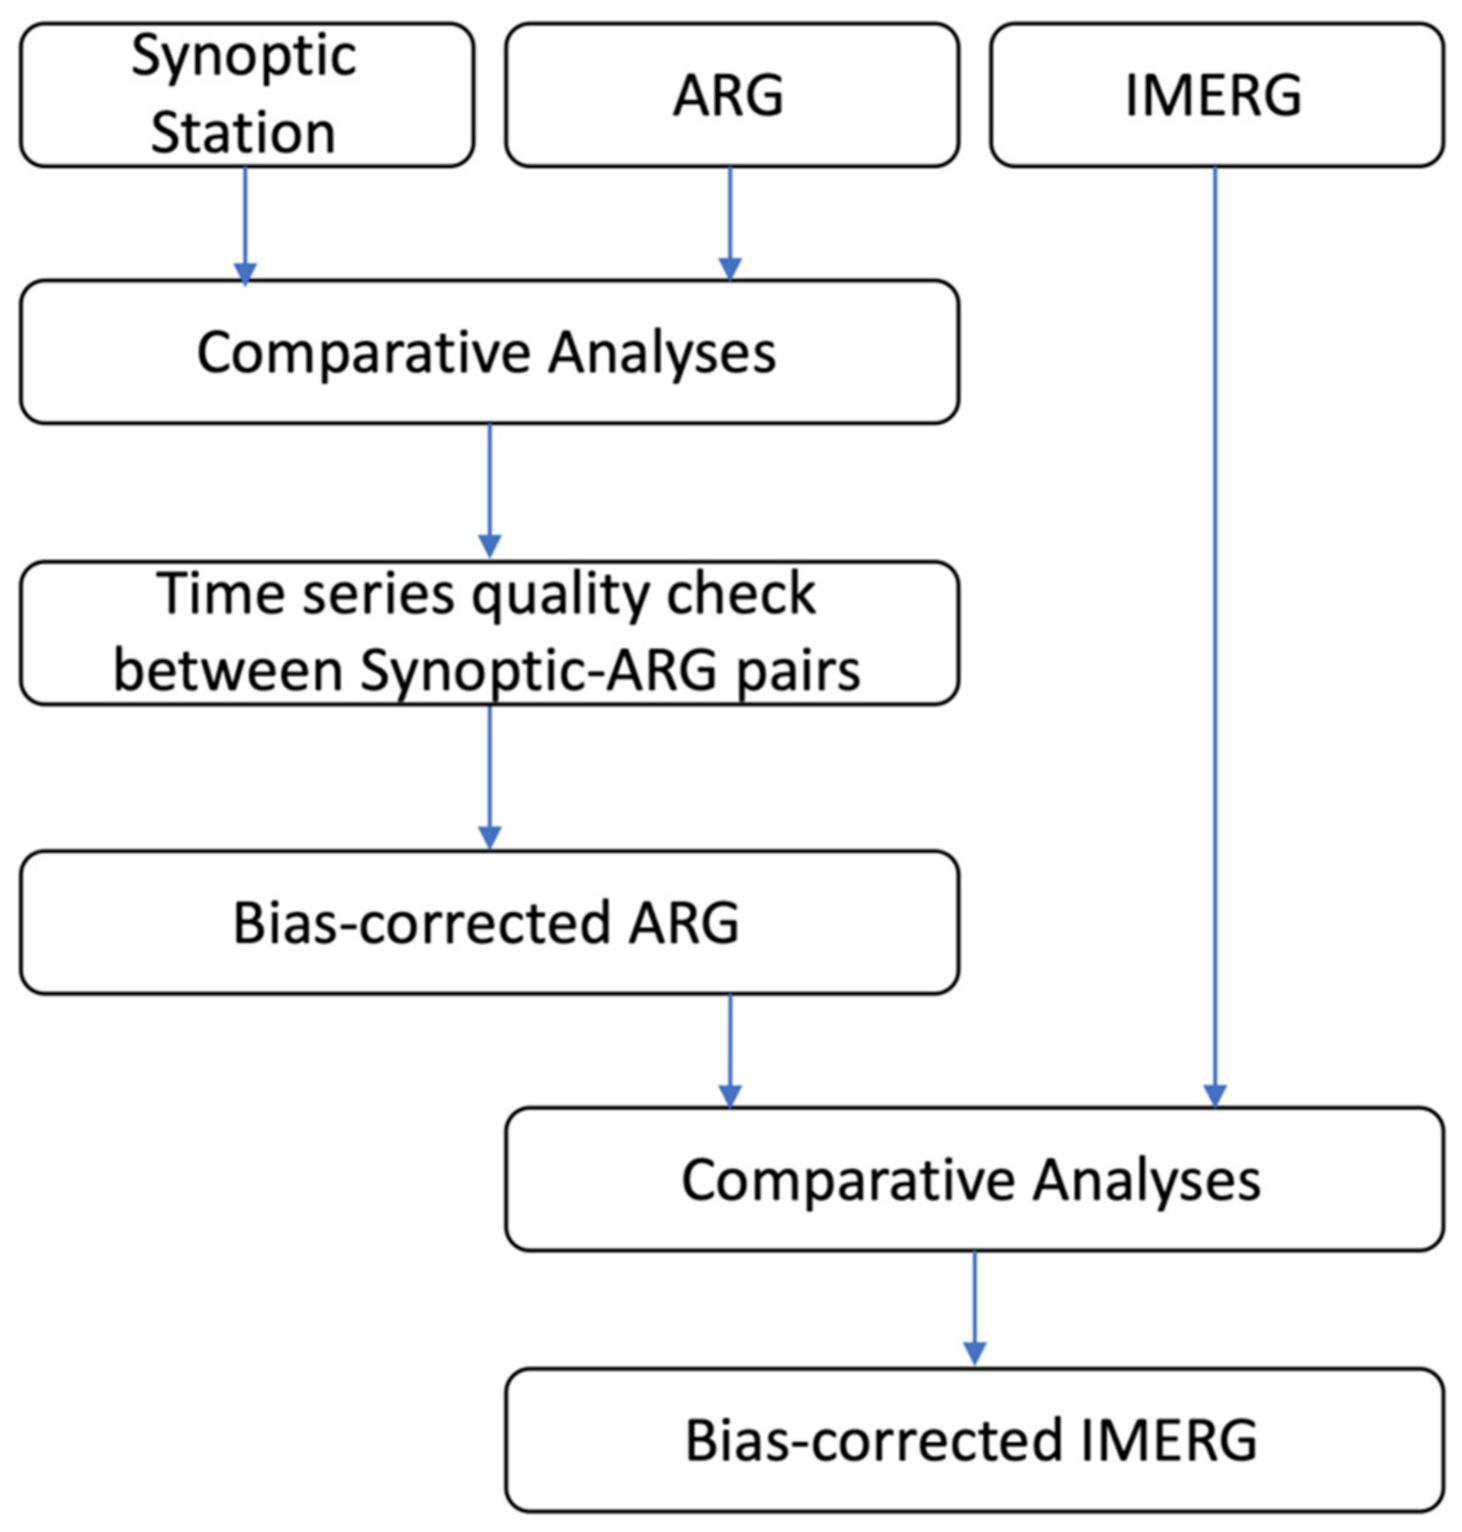
The strategy for producing a comprehensive and consistent rainfall dataset that consists of synoptic station data, ARG data, and the IMERG product is shown schematically in Figure 2. The first task is to compare synoptic stations with ARG data that have undergone quality checks. Distances between the synoptic station locations and the ARG sites were also established using the distance formula used by Beck et al. [20] and the differences in time of the near coincident measurements were documented. Spatial autocorrelation analysis in terms of the Global Moran’s I [21] was conducted to establish that the shorter the distance, the higher the strength of the correlation between the two measurements, using ARG and synoptic station data. In this study, only ARGs and synoptic stations with a maximum distance of 1 km were considered to establish any instrumentation bias or error associated with ARG data using the synoptic station data as the baseline. In addition, only ARG–synoptic pairs with homogenous locations and an elevation difference of less than 50 m were used in this analysis. Before proceeding with the comparison, additional quality control was applied to ARG data. In particular, time series plots showed that there were cases when synoptic data depicted realistic rainfall values, but ARGs reported zero or near zero values. These data were excluded in the analyses.
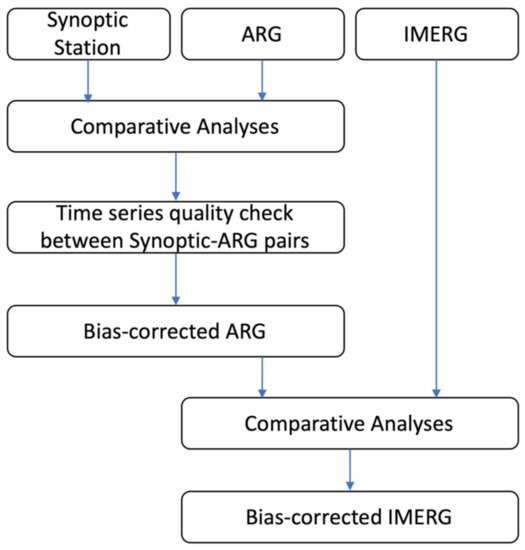
Figure 2.
Process flow of comparative analyses performed using synoptic stations, ARGs, and IMERG data.
Systematic biases in rainfall measurements from ARGs were corrected using the generalized reduced gradient algorithm [22,23]. In this case, the algorithm was applied using a power transform [23]:
where y represents the corrected rainfall from ARGs, x represents the actual ARG rainfall data, and a and b are coefficients optimized to obtain minimum residuals between synoptic and ARG rainfall measurements. The bias-corrected rainfall from ARGs were again compared with the synoptic data using the same statistical metrics.
y = axb
The next step was to compare the bias-corrected ARG data with IMERG FR. Because point measurements from ARGs do not necessarily represent the satellite measurements from a much larger area, the strategy was to use as many ground measurements as possible to match the satellite data. The size of each grid element (i.e., pixel) of the IMERG FR data was extended to about 5.5 km (0.05°) on all sides. Rain gauge measurements within the satellite footprint were averaged and then compared with the IMERG FR pixel value. As IMERG represents the average rainfall within the grid, only pixels which have a minimum of 10 ARGs were used to match the IMERG FR data to establish any bias or discrepancy, if any, between the ground and satellite data. Comparative analysis of ARGs and IMERG FR was also divided into rainfall intervals for light to moderate rain days (0.1 to 10.0 mm/day) and heavy to severe rain days (>10.0 mm/day) to better understand the variability in the relationship and improve our ability to assess the difference in the datasets.
Further correction of raw IMERG FR data based on comparative analysis with corrected ARGs was undertaken using a two-step procedure involving a generalized reduced gradient algorithm using a power transform followed by a linear regression model, which is discussed in the following sections. Statistical metrics were also calculated to determine changes in the accuracy of the gridded product.
3. Results and Discussion
3.1. Synoptic Stations vs. IMERG
As indicated earlier, synoptic stations provide the most accurate rainfall measurements in the Philippines because they are manned, regularly calibrated, and the measurement procedures follow the standards set by WMO. However, these stations are few and sparsely distributed in the country. Synoptic stations are maintained and operated to monitor mainly synoptic scale systems such as tropical cyclones. Thus, these stations are spaced strategically to capture most of the weather and climatic events in locations that represent the general conditions in the country. However, such events are often unpredictable depending on the location, especially with the advent of climate change and periodic or natural phenomena, such as the El Niño Southern Oscillation (ENSO) and the Pacific Decadal Oscillation. This makes the denser coverage provided by ARGs and satellite data critically important.
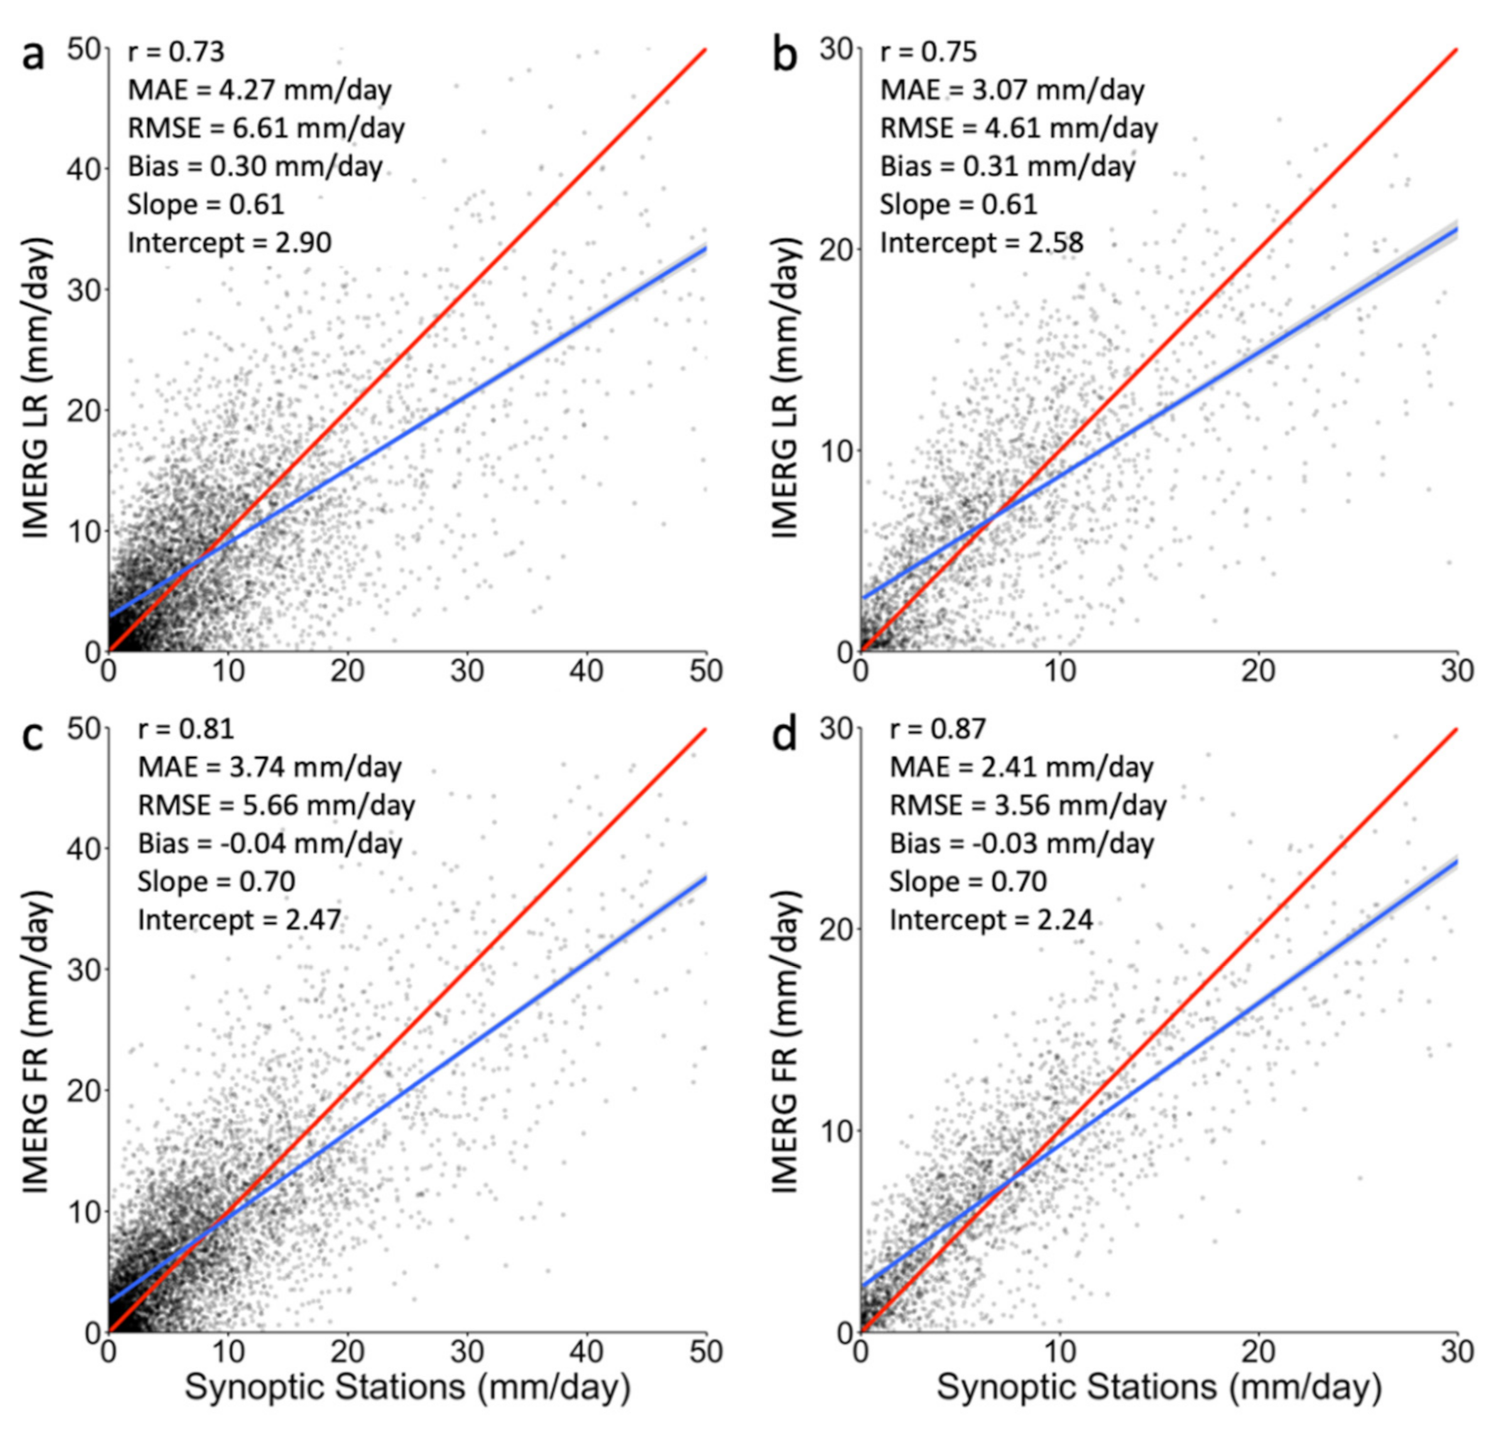
The scatter plot of IMERG LR data versus synoptic station data, as presented in Figure 3a,b, shows a generally good relationship with correlation coefficients of 0.73 and 0.75 for the 10 day and monthly rainfall, respectively. Better statistics were obtained by comparing the final product, IMERG FR, with synoptic station data, having correlation coefficients of 0.81 and 0.87 for 10 day and monthly rainfall, respectively. IMERG FR also improved on the MAE, RMSE, and bias of IMERG LR. The results of regression analysis, however, show disagreements with the slope and offset (blue line) far from the line that corresponds to perfect agreement (red line). With the synoptic station data being used as the baseline, the disagreement cannot be attributed to problems with the IMERG data alone because there was also likely a mismatch in the values that were compared. As indicated earlier, the synoptic data is just a point measurement, whereas the IMERG data represent an average of the rain conditions over a much larger area. This is likely the cause of reported disagreements in previous studies comparing synoptic station data with satellite rainfall products [6,13,14,15].

Figure 3.
Synoptic rainfall measurements compared with IMERG LR at the (a) 10 day and (b) monthly scale. Plots (c,d) are counterpart comparisons using IMERG FR. The red line depicts perfect agreement rainfall values and the blue line indicates the linear regression fit to the data points.
3.2. ARGs vs. Synoptic Stations
The relatively dense network of rain gauges provides the means to extend the limited coverage provided by the synoptic stations. However, it is important that the unmanned rain gauges provide rainfall data that are consistent with those from the more accurate synoptic station measurements. To assess the consistency, scatter plots for synoptic rainfall data versus ARG data from various sites surrounding the synoptic station are presented in Figure 4 for both 10 day and monthly averages. The data points in the scatter plots are color coded to indicate the distance between the synoptic station and the location of the ARG. As expected, the plots indicate that the discrepancies are higher when the distance of the locations of the two datasets are larger. Qualitative analysis indicates that most of the data points that show general agreement are those within an optimal distance of about 1 km.
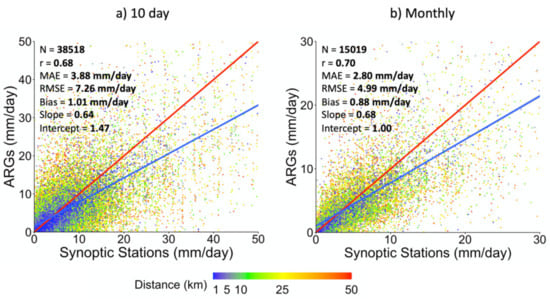
Figure 4.
ARG rainfall measurements compared with synoptic station data using (a) 10 day and (b) monthly averages. The plots are color coded to indicate the distance between each ARG and the closest synoptic station.
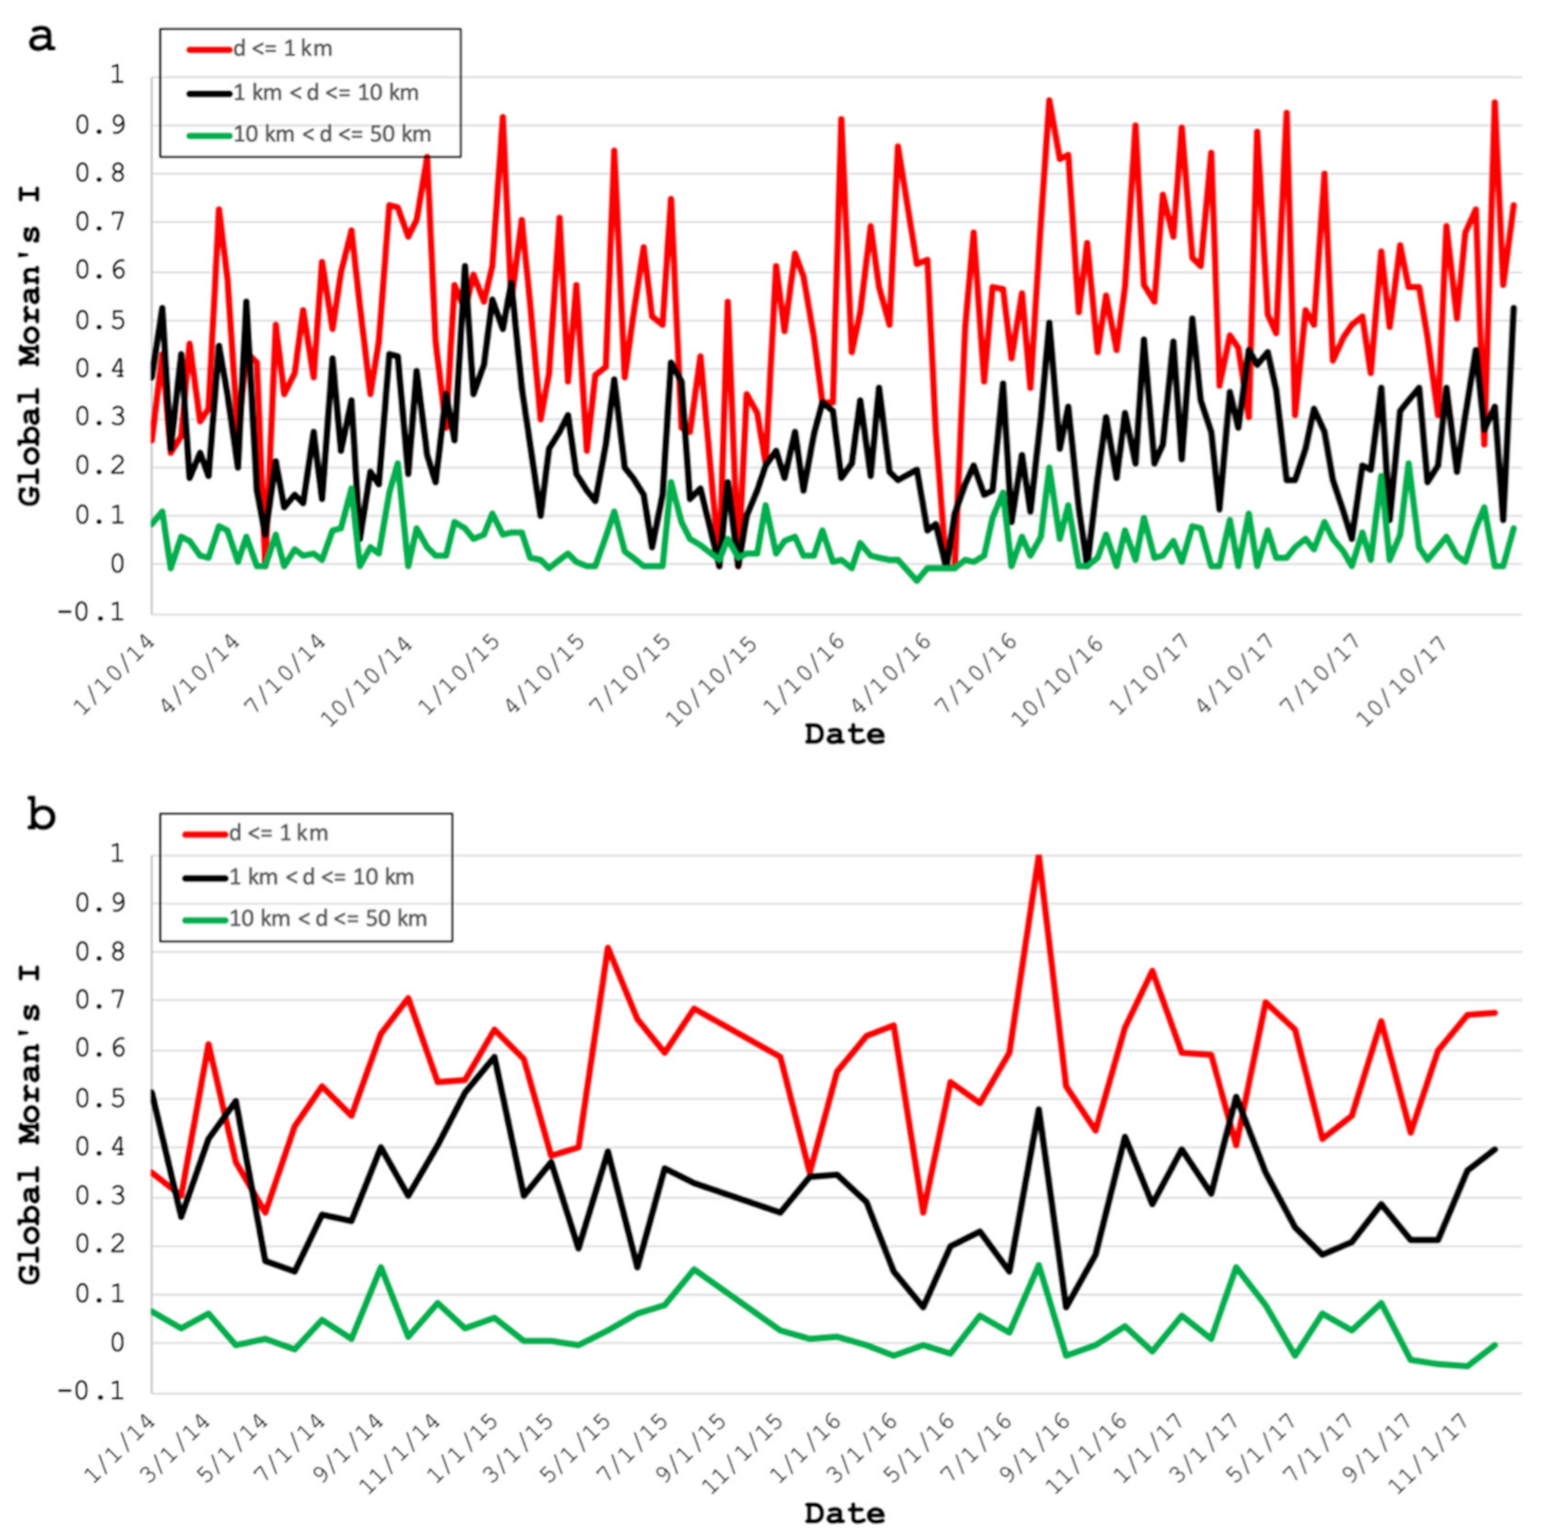
To further illustrate the distance-dependent relationship of rainfall measurements from the ground stations, spatial autocorrelation analysis of the data was conducted. Figure 5 shows the spatial autocorrelation, in terms of the Global Moran’s I value, for all 10 day and monthly rainfall obtained from all ARGs and synoptic stations in the country. The distance (d) considered for each ground stations’ neighbors was tested using intervals of d ≤ 1 km, 1 km < d ≤ 10 km, and 10 km < d ≤ 50 km. It can be observed that the majority of the Global Moran’s I throughout the study period are significantly positive (with p < 0.05), revealing potential spatial clustering of both high and low rainfall values obtained from the ground stations. The magnitude of Global Moran’s I values increases as the distance between neighboring stations is reduced. This suggests that for distances within 1 km, ARGs and synoptic stations exhibit the greatest spatial autocorrelation. This result again suggests the need for short distances when ARGs and synoptic stations are being compared. In this study, only data within distances of 1 km were selected for estimating the correction parameters needed to make ARG consistent with synoptic data. As confirmed later, such a distance provides a high likelihood that the same rain is being observed by both ARG and synoptic station.

Figure 5.
Global Moran’s I obtained for each (a) 10 day period and (b) month in the study period using all ARGs and synoptic rainfall measurements in the Philippines.
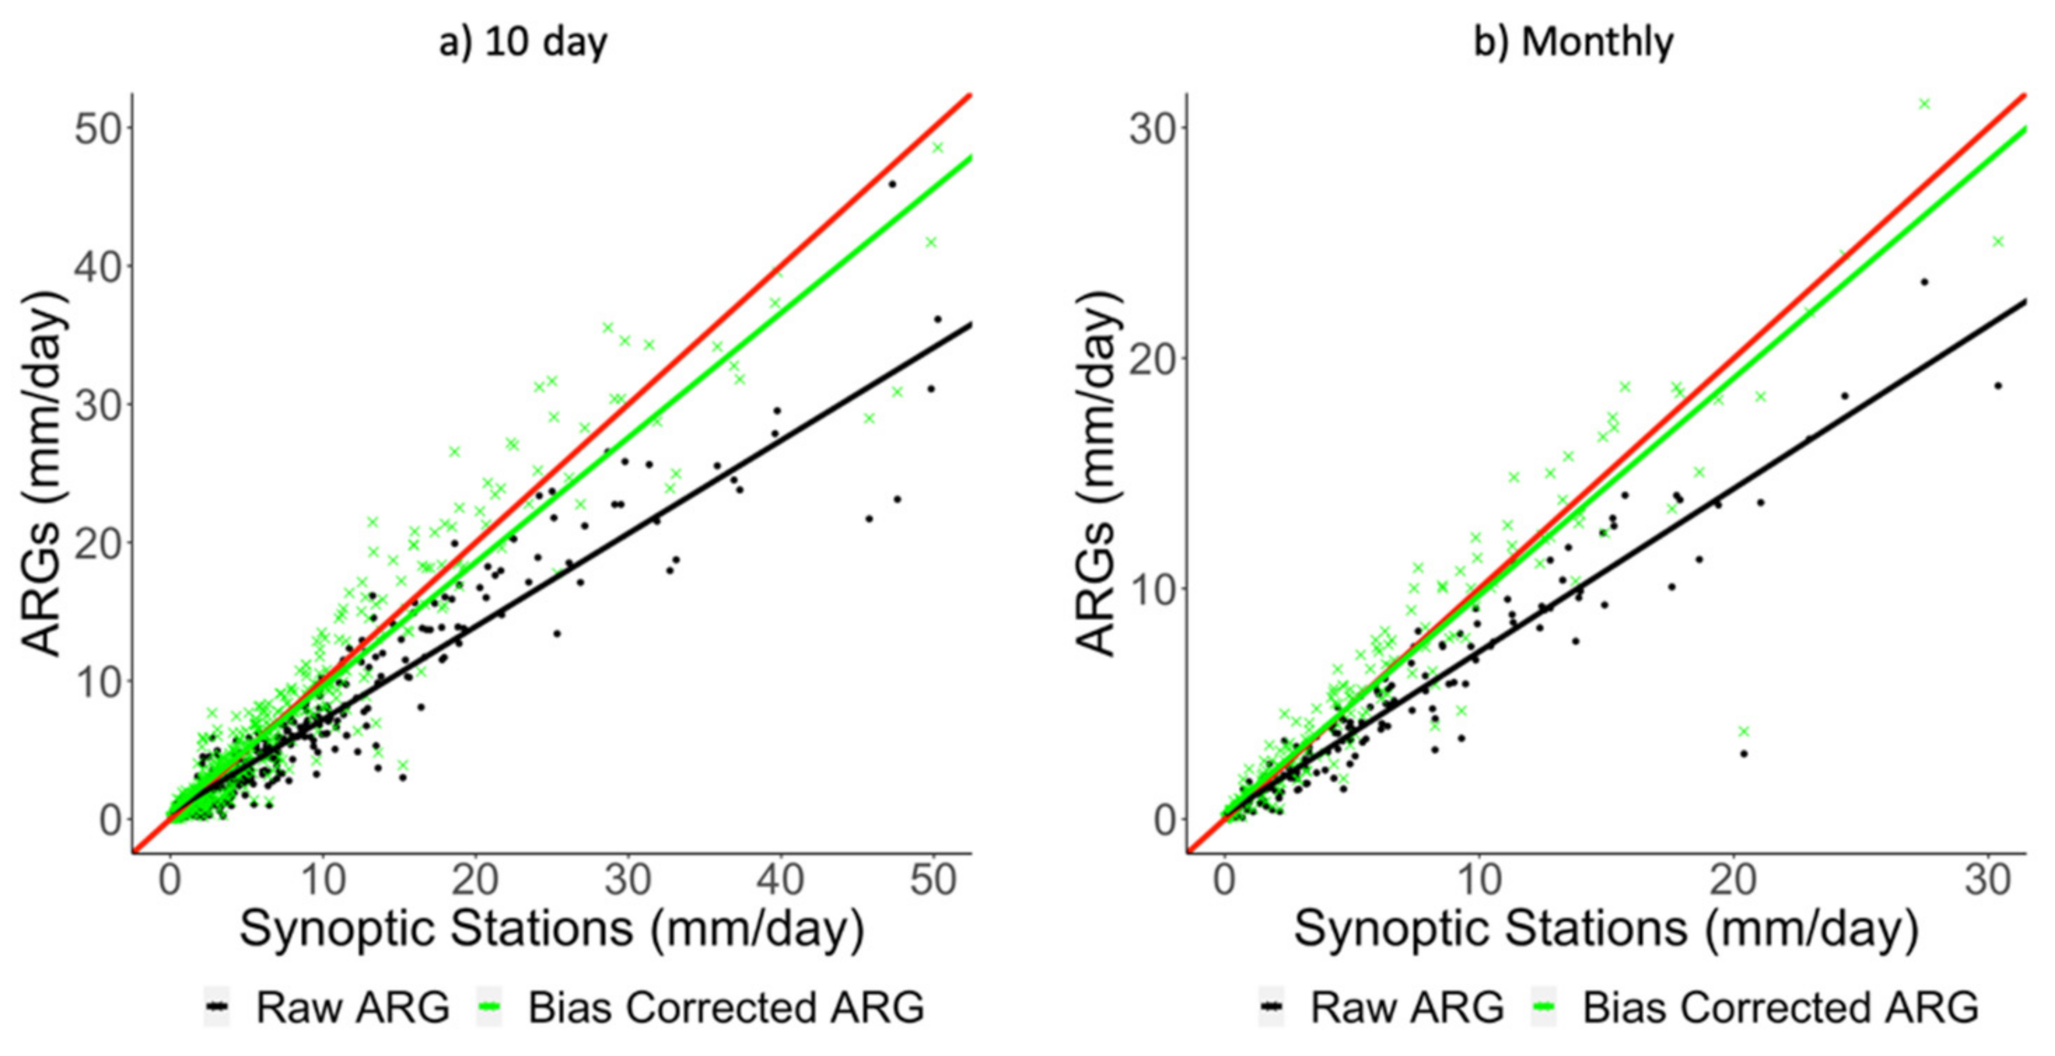
Synoptic station and ARG pairs that are separated by 1 km or less, and were used in the analysis to obtain the correction parameters, are listed in Table 1. Each ARG was identified by an ID previously set based on installation number. To minimize the influence of topography, only data pairs with a difference in elevation of less than 50 m were considered. Results of this comparative analysis are shown in the scatter plots of Figure 6. The results of regression analysis of the raw data points (in black) indicate a much stronger relationship, with the correlation coefficients being 0.94 and 0.97 for the 10 day and monthly averages, respectively. However, the corresponding biases of 1.93 and 1.69 mm/day, and slopes that are significantly less than 1.0 (red line), indicate a mismatch that might be caused by instrumentation differences associated with calibration and maintenance. Using the generalized reduced gradient algorithm to correct the bias, the results improved shown by green data points depict a much better consistency of the two sets of data. Optimized values of correction factors, a = 1.282 and b = 1.013, were obtained for 10 day rainfall, and a = 1.349 and b = 0.996 for monthly rainfall. Bias correction on ARG rainfall reduced the errors (MAE, RMSE) and biases compared with those of the synoptic measurements. A summary of the improvements is presented in Table 2.

Table 1.
Elevation and distance information of synoptic and ARG pairs used for bias correction.

Figure 6.
ARG and synoptic station rainfall at distances less than 1 km. (a) 10 day period and (b) monthly rainfall represented by black points are raw ARG data whereas green points are corrected data.
Table 2.
Statistics before and after bias correction of ARG rainfall data.
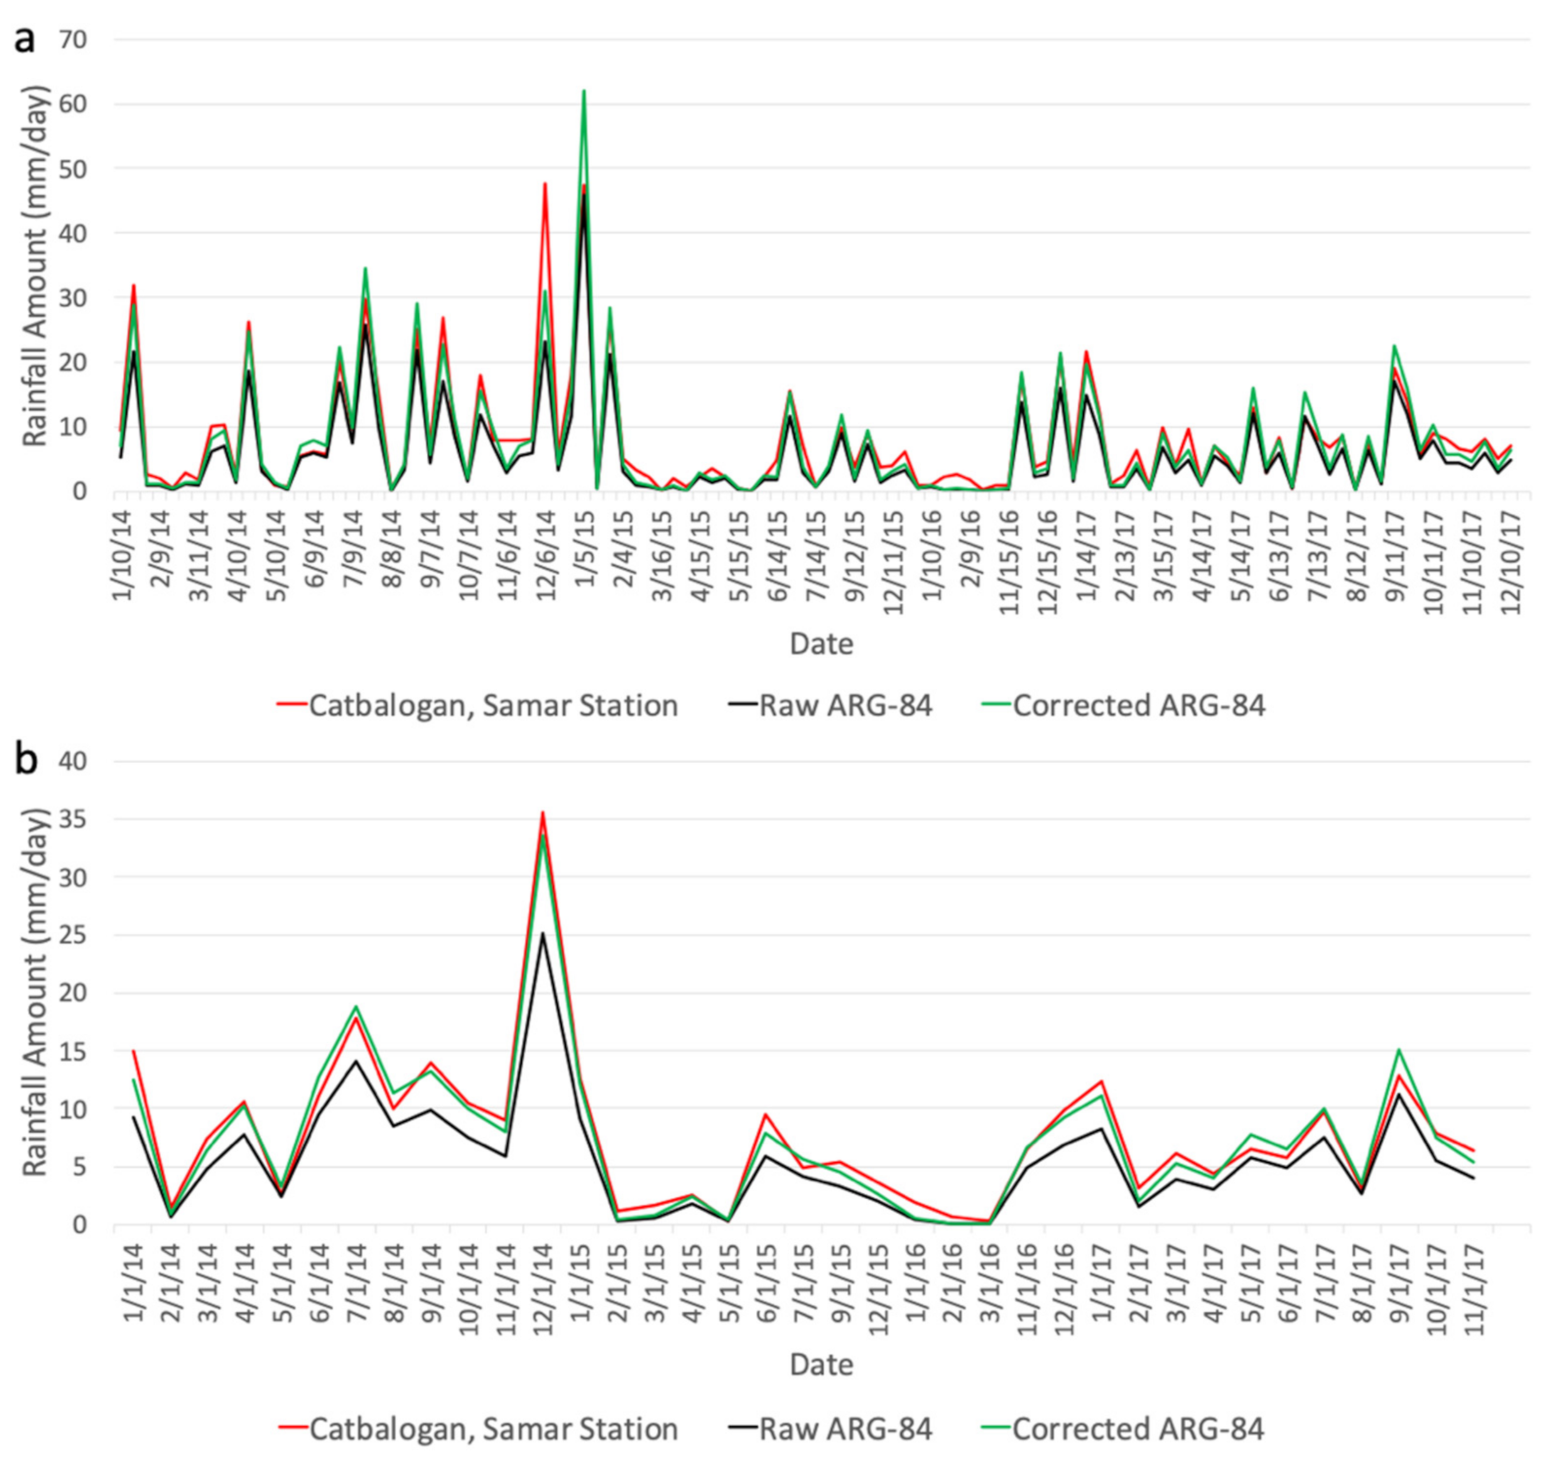
To further illustrate the value of making corrections on the ARG data, time series of 10 day and monthly rainfall are presented in Figure 7a,b, respectively. The plots show a comparison of raw ARG values, corrected ARG values, and synoptic station data in Catbalogan, Samar. It is apparent from the plots that the corrected ARG values, represented by the green line, are in a much better agreement with the synoptic data (in red) than the raw ARG data (in black). However, there are some disagreements with the synoptic data, which are sometimes higher than corrected ARG data, and vice-versa. This is expected because there are factors other than distances that may affect the difference in rainfall values. By comparison, the raw ARG data are shown to be consistently lower than the synoptic station data. Assuming that the differences between the synoptic data and raw ARG values are caused primarily by the same technical differences, including calibration, the same set of correction parameters was applied to all raw ARG data to generate an improved ARG dataset that is consistent with synoptic data.
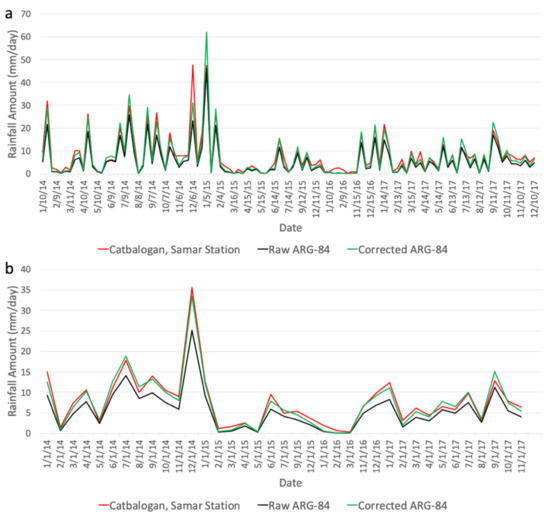
Figure 7.
Before and after bias correction of ARG: (a) 10 day period and (b) monthly rainfall at Catbalogan, Samar synoptic station.
After performing bias correction for the ARGs, the absolute differences between rainfall measurements from ARGs and its nearest neighboring synoptic station were obtained per individual 10 day period and month. The absolute differences from all ARG–synoptic station pairs within specific distances were averaged, as shown in Figure 8. It can be observed that the discrepancy between the ARGs and synoptic stations decrease as their distance becomes closer. In this case, for distances of less than 1 km, the average discrepancy for both 10 day and monthly rainfall is usually less than 3 mm/day. It should also be noted that the discrepancies between ARGs and synoptic stations do not necessarily decrease monotonically with distances within the optimal range of 1 km because of the other factors indicated earlier. Moreover, there appears to be a seasonality in the differences, with peak rainfall discrepancies occurring during the Summer Monsoon months from June until September.
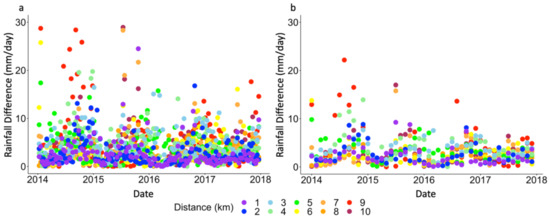
Figure 8.
Absolute difference between ARGs and synoptic stations with respect to distances in their locations for (a) 10 day and (b) monthly rainfall averages.
3.3. ARGs vs. IMERG
The next step was to derive a IMERG dataset that is consistent with both synoptic data and corrected ARG measurements. Following the better statistics obtained from IMERG FR in Figure 3, the GPM product used from this section onwards will be the IMERG FR. The challenge in this venture is overcoming the difference between the point measurements made at the synoptic station and ARG, and the satellite measurements that cover a much larger footprint. This difference produced the observed inconsistencies reported in previous studies that directly compared point values from synoptic stations with satellite gridded values that covered the same location as the synoptic station [6,13,14,15]. To overcome this problem, we used the more robust number of ARG measurements to compare with IMERG FR. The strategy was to find IMERG FR data elements that have a number of ARG measurements within the IMERG FR pixel, and use the data to derive the correction factor that makes IMERG consistent with corrected ARG and synoptic data.
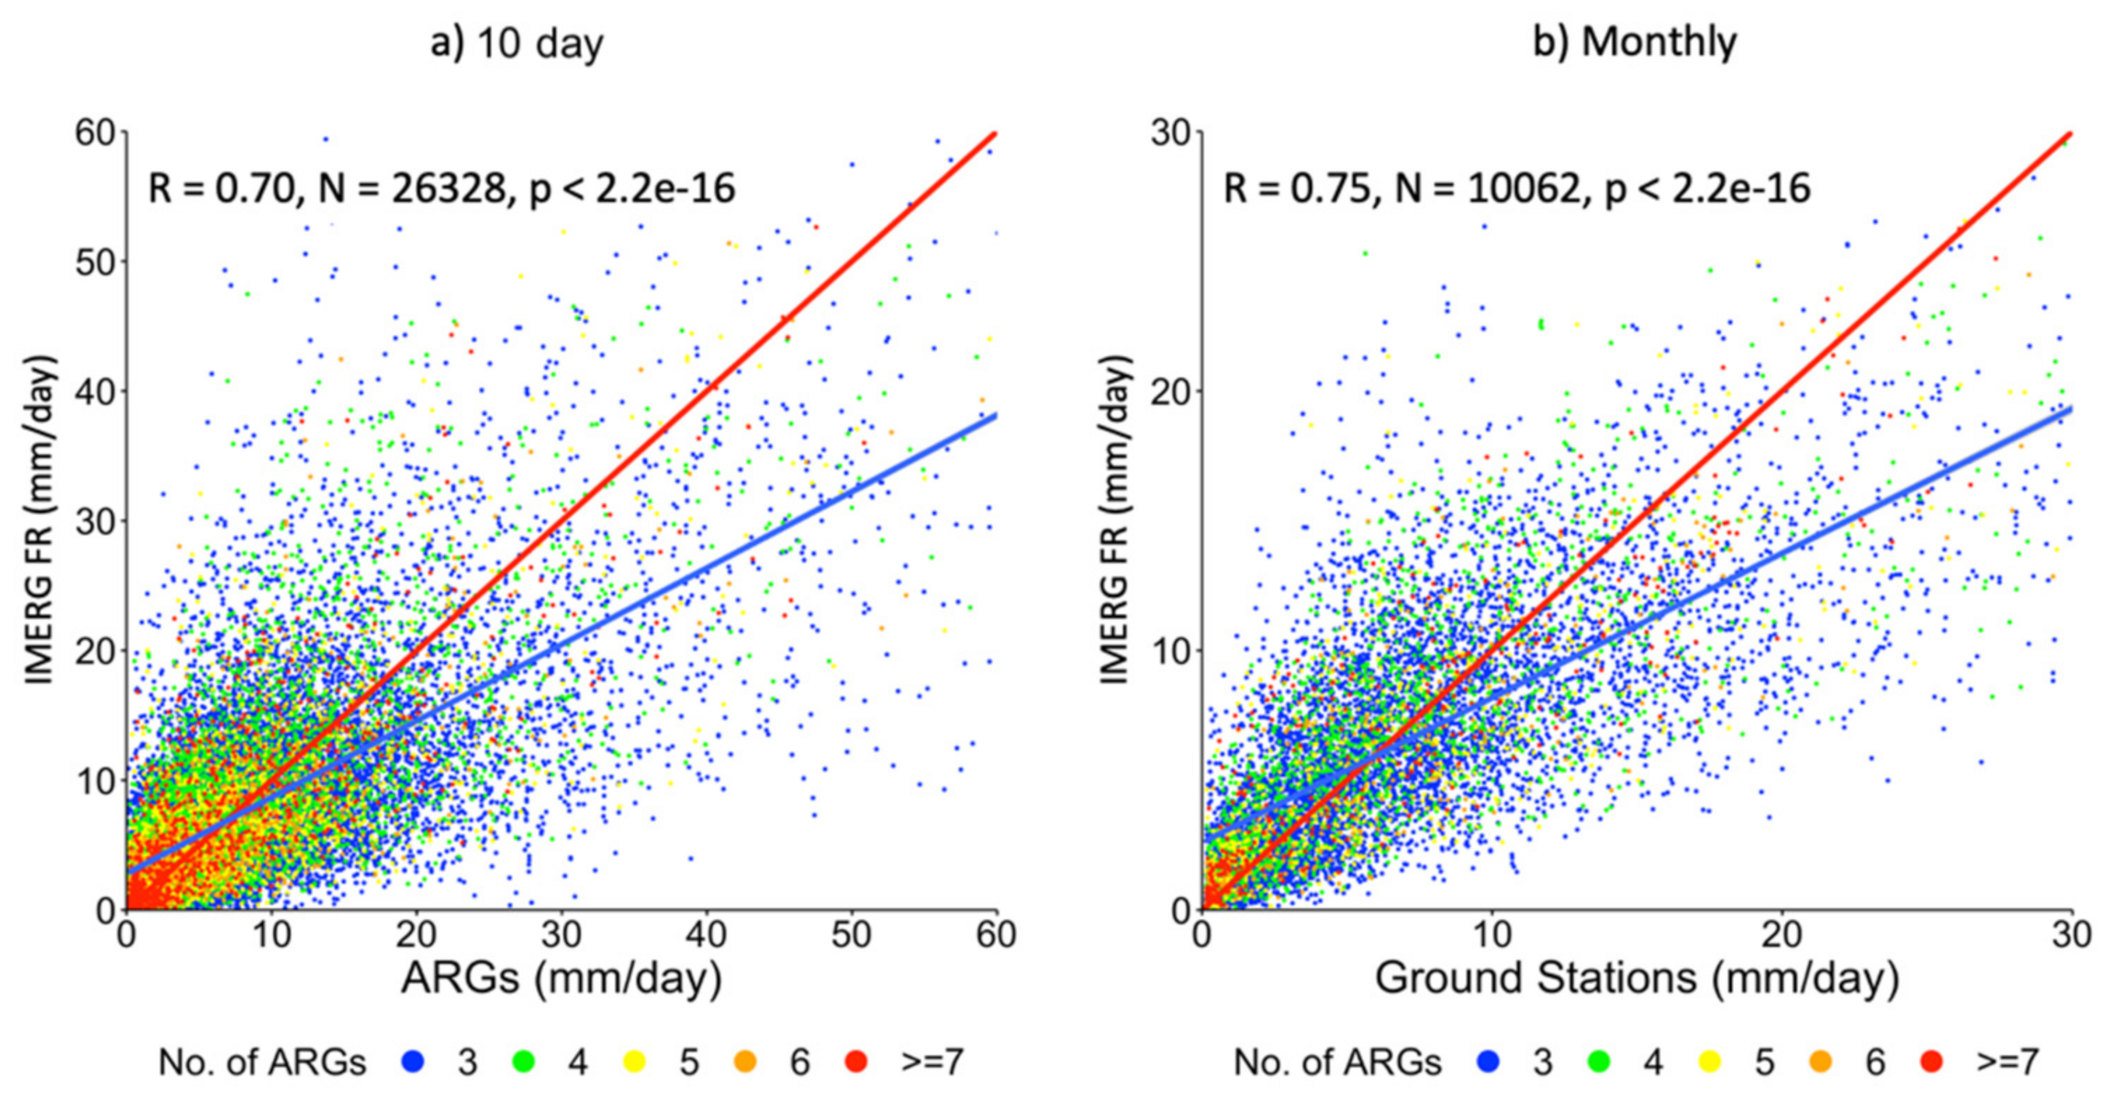
Comparisons of raw IMERG FR data with corrected ARG measurements within the footprint of the IMERG FR are presented in the scatter plots shown in Figure 9. The scatter plots are color coded to indicate the number of ARG measurements within the IMERG FR footprint that were used. The averaging is either over 10 days as presented in Figure 9a, or over a month as shown in Figure 9b. It is apparent that the higher the number of ARGs, the closer the data points to the red line, which represents perfect agreement. This indicates that within the IMERG FR footprint, the ARG values are not necessarily uniform and an average of a few ARG measurements, at least, is required to compare well with IMERG FR values.

Figure 9.
Average of ARG station values within IMERG FR footprint compared with actual (a) 10 day and (b) monthly rainfall value of the IMERG FR. Red line depicts 1:1 rainfall values. Blue line represents the result of linear regression analysis.
Considering the effect of the number of ARGs on the agreement of ARG rainfall with IMERG FR values, the analysis proceeded by comparing only IMERG FR pixels with the average of an ample number of ARGs within its footprint. A buffer of 0.5° outside the IMERG FR pixel was applied to nearby ARGs as their measurements still have direct effect on the average rainfall within the pixel. Only IMERG FR pixels that initially have 10 ARGs or more within their footprint were considered in further analysis. Because not all ARGs can provide rainfall data all of the time, a minimum of five stations (out of 10 or more stations) must have 10 day and monthly measurements to be considered in the time series comparison.
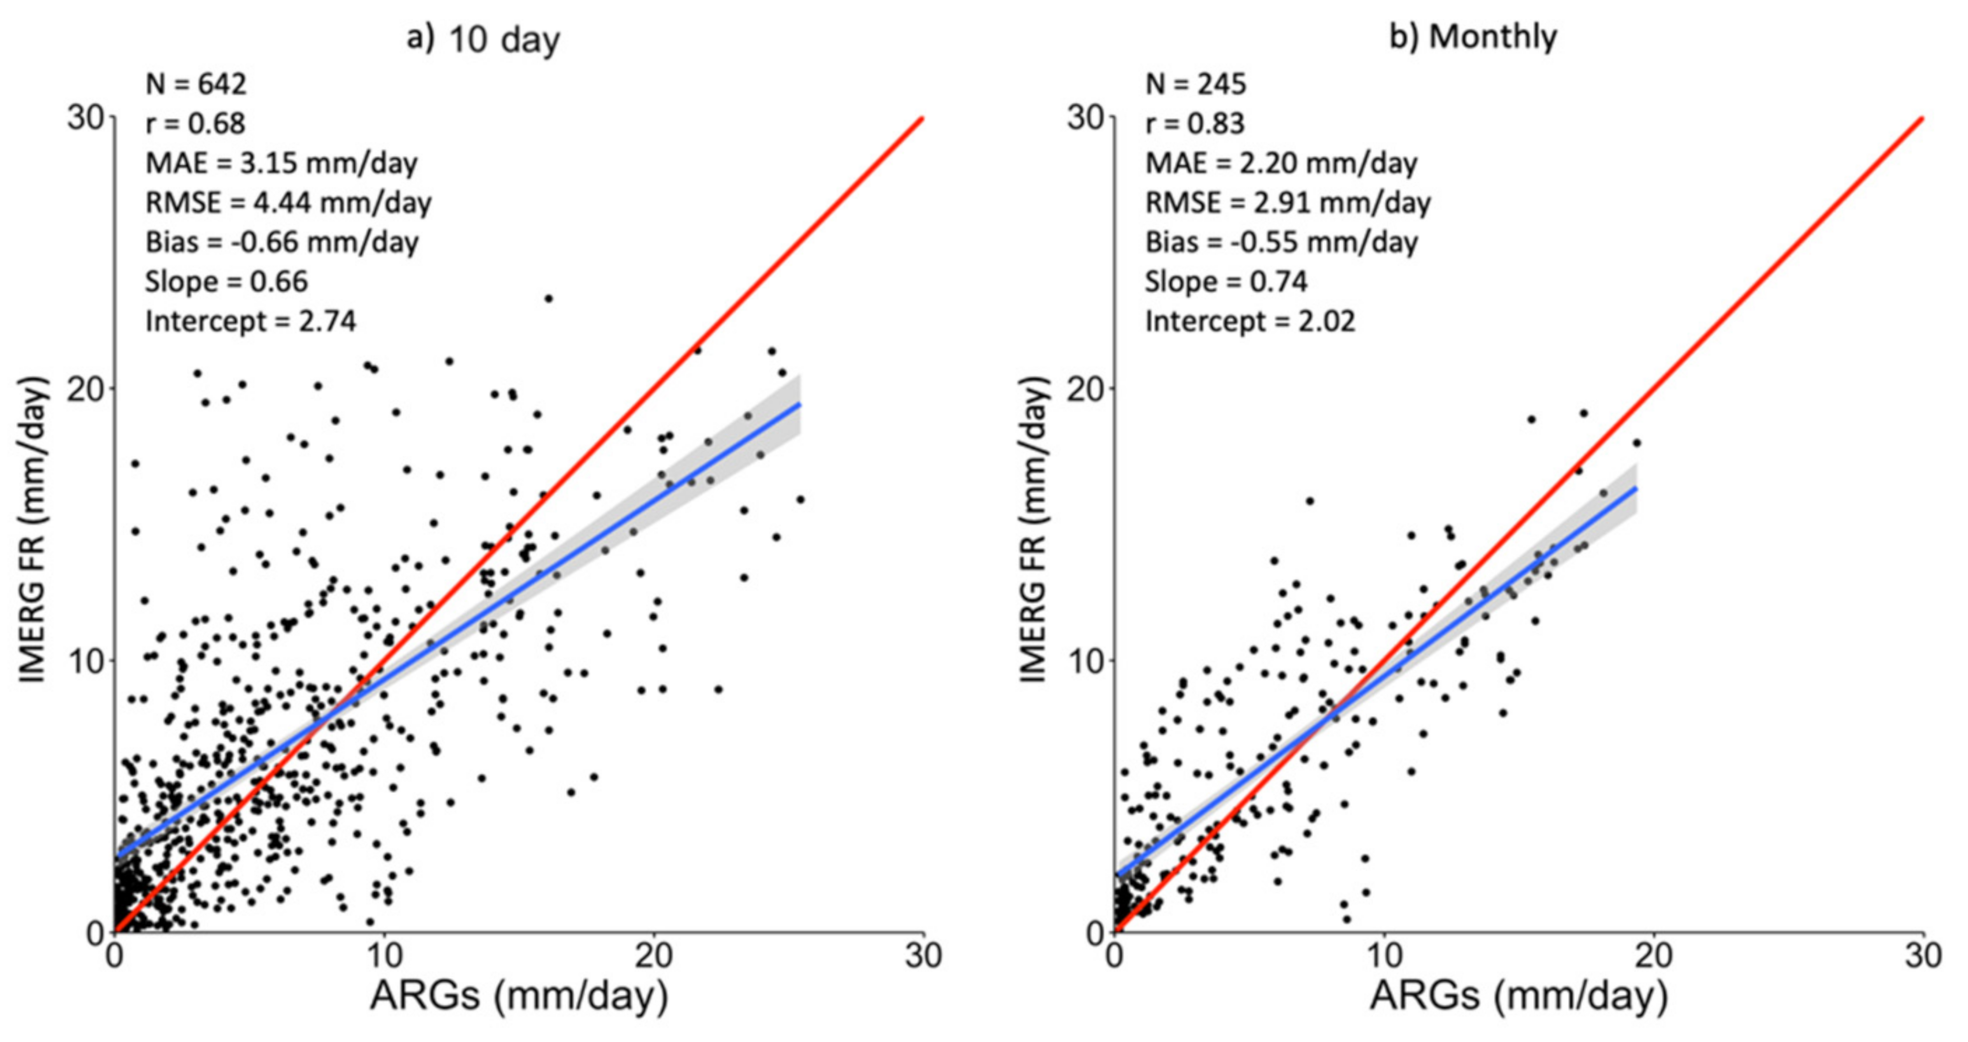
Scatter plots of raw IMERG FR versus averages of corrected ARGs within the IMERG FR footprints are presented in Figure 10a,b for 10 day and monthly data, respectively. Only pixels with a minimum of 10 ARGs within its footprint are presented, and linear regression analysis yielded a correlation coefficient of 0.68 for the 10 day and 0.83 for the monthly data. In addition, rainfall biases were −0.66 mm/day and −0.55 mm/day for 10 day and monthly rainfall. Negative biases indicate that average residuals point to higher IMERG FR rainfall estimates. However, the slope values of less than one indicate a linear trend in which ARGs are greater than IMERG FR rainfall estimates. Similar comparisons were also performed using IMERG LR and the results were similar to those from the use of IMERG FR.
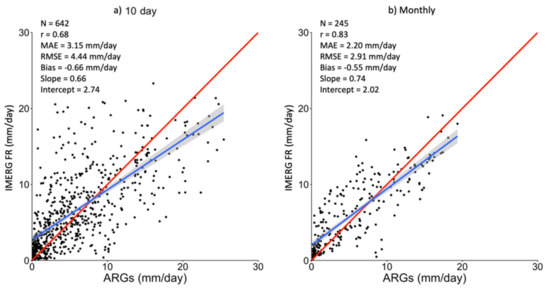
Figure 10.
Scatter plot of raw IMERG FR (a) 10 day and (b) monthly values versus the average of corrected ARG measurements within the footprint of IMERG FR. Red line depicts 1:1 rainfall values. Blue line indicates linear regression results with uncertainties.
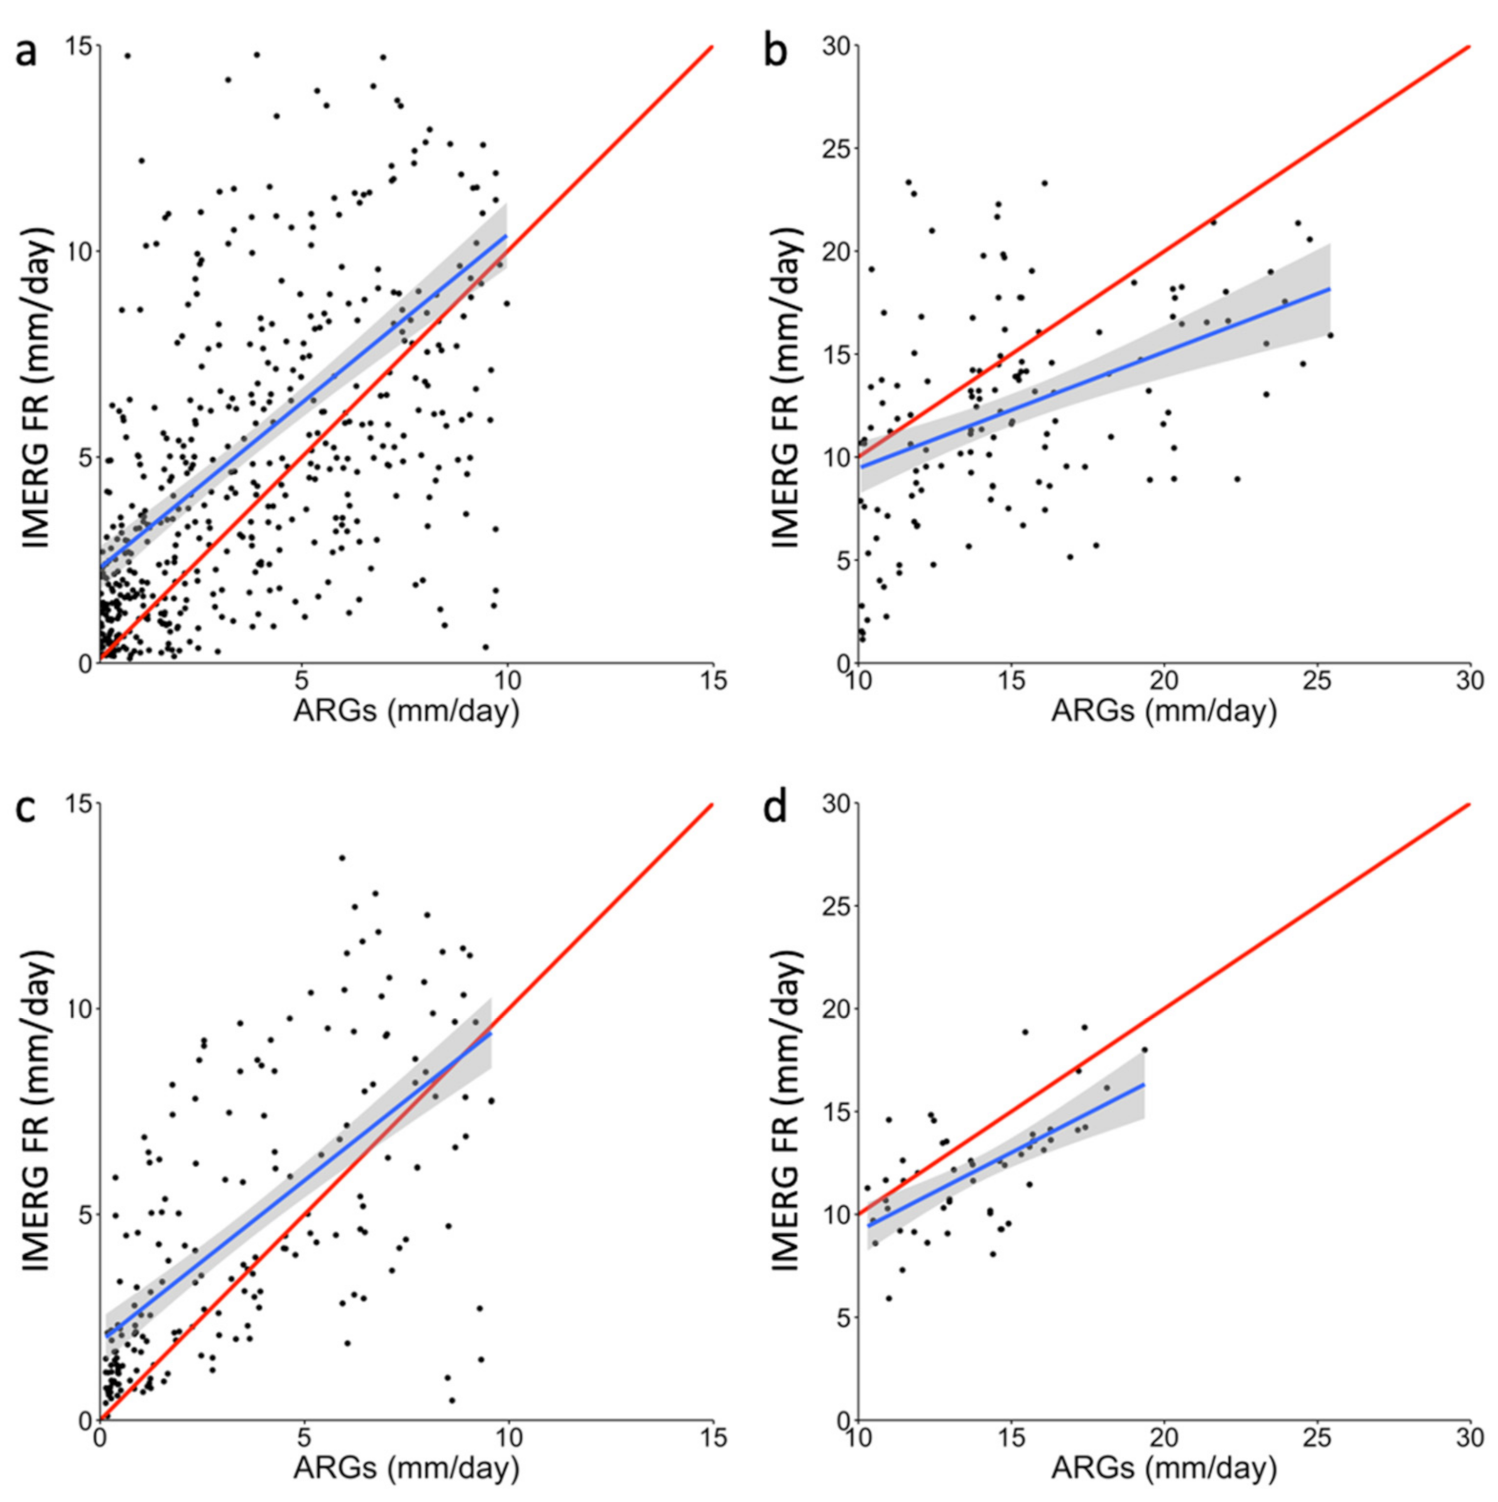
To better understand the relationship of IMERG FR and ARGs, as depicted in Figure 10, data during light to moderate rain days (0.1 to 10.0 mm/day) were plotted separately from those during heavy to severe rain days (10.0 to 30.0 mm/day). As shown in Figure 11, IMERG FR tends to overestimate ARG rainfall during light to moderate rain days, which is depicted by the majority of the scattered points lying above the perfect agreement (red) line. The opposite can be observed during heavy to severe rain days, in which IMERG FR usually underestimates ARG rainfall. Because the slopes are different, these discrepancies per rainfall interval can be further used to optimize the accuracy of the bias correction technique that will be employed to IMERG FR.
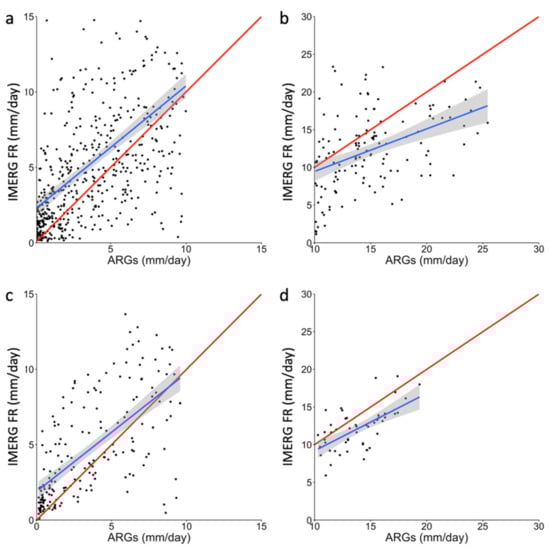
Figure 11.
Comparison of IMERG FR and ARGs 10 day rainfall at (a) ≤10.0 mm/day and (b) >10.0 mm/day. Plots (c) to (d) are comparisons at similar rainfall intervals for monthly rainfall.
Further correction to the IMERG FR values was performed in two steps. The first step was performed by employing the generalized reduced gradient algorithm in Equation (1) for different rainfall intervals. Optimized correction factors were obtained and applied to IMERG FR depending on the average value of ARGs within the IMERG FR footprint. Because the monthly data is more uniform than the 10 day data, correction factors obtained from the monthly data were also used for the 10 day rainfall. The correction procedure of the first step is as follows:
For ARGs ≤ 8 mm/day:
IMERG FR′ = 1.29 * (IMERG FR)0.69
For ARGs ≥ 12 mm/day:
IMERG FR′ = 4.84 * (IMERG FR)0.42
For 8 mm/day < ARGs < 12 mm/day:
IMERG FR′ = [(1.29 * (IMERG FR)0.69) + (4.84 * (IMERG FR)0.42)]/2
The second step is to use the resulting linear regression parameters (slope = 0.81 and intercept = 1.12) obtained by comparing IMERG FR′ with the average ARGs. The correction procedure of the second step is as follows:
For IMERG FR′ < 1.12 mm/day:
IMERG FR″ = IMERG FR′/0.81
For IMERG FR′ ≥ 1.12 mm/day:
IMERG FR″ = (IMERG FR′ − 1.12)/0.81
Equation (5) was used to avoid having negative values for IMERG FR″, which serves as the final bias-corrected IMERG FR product.
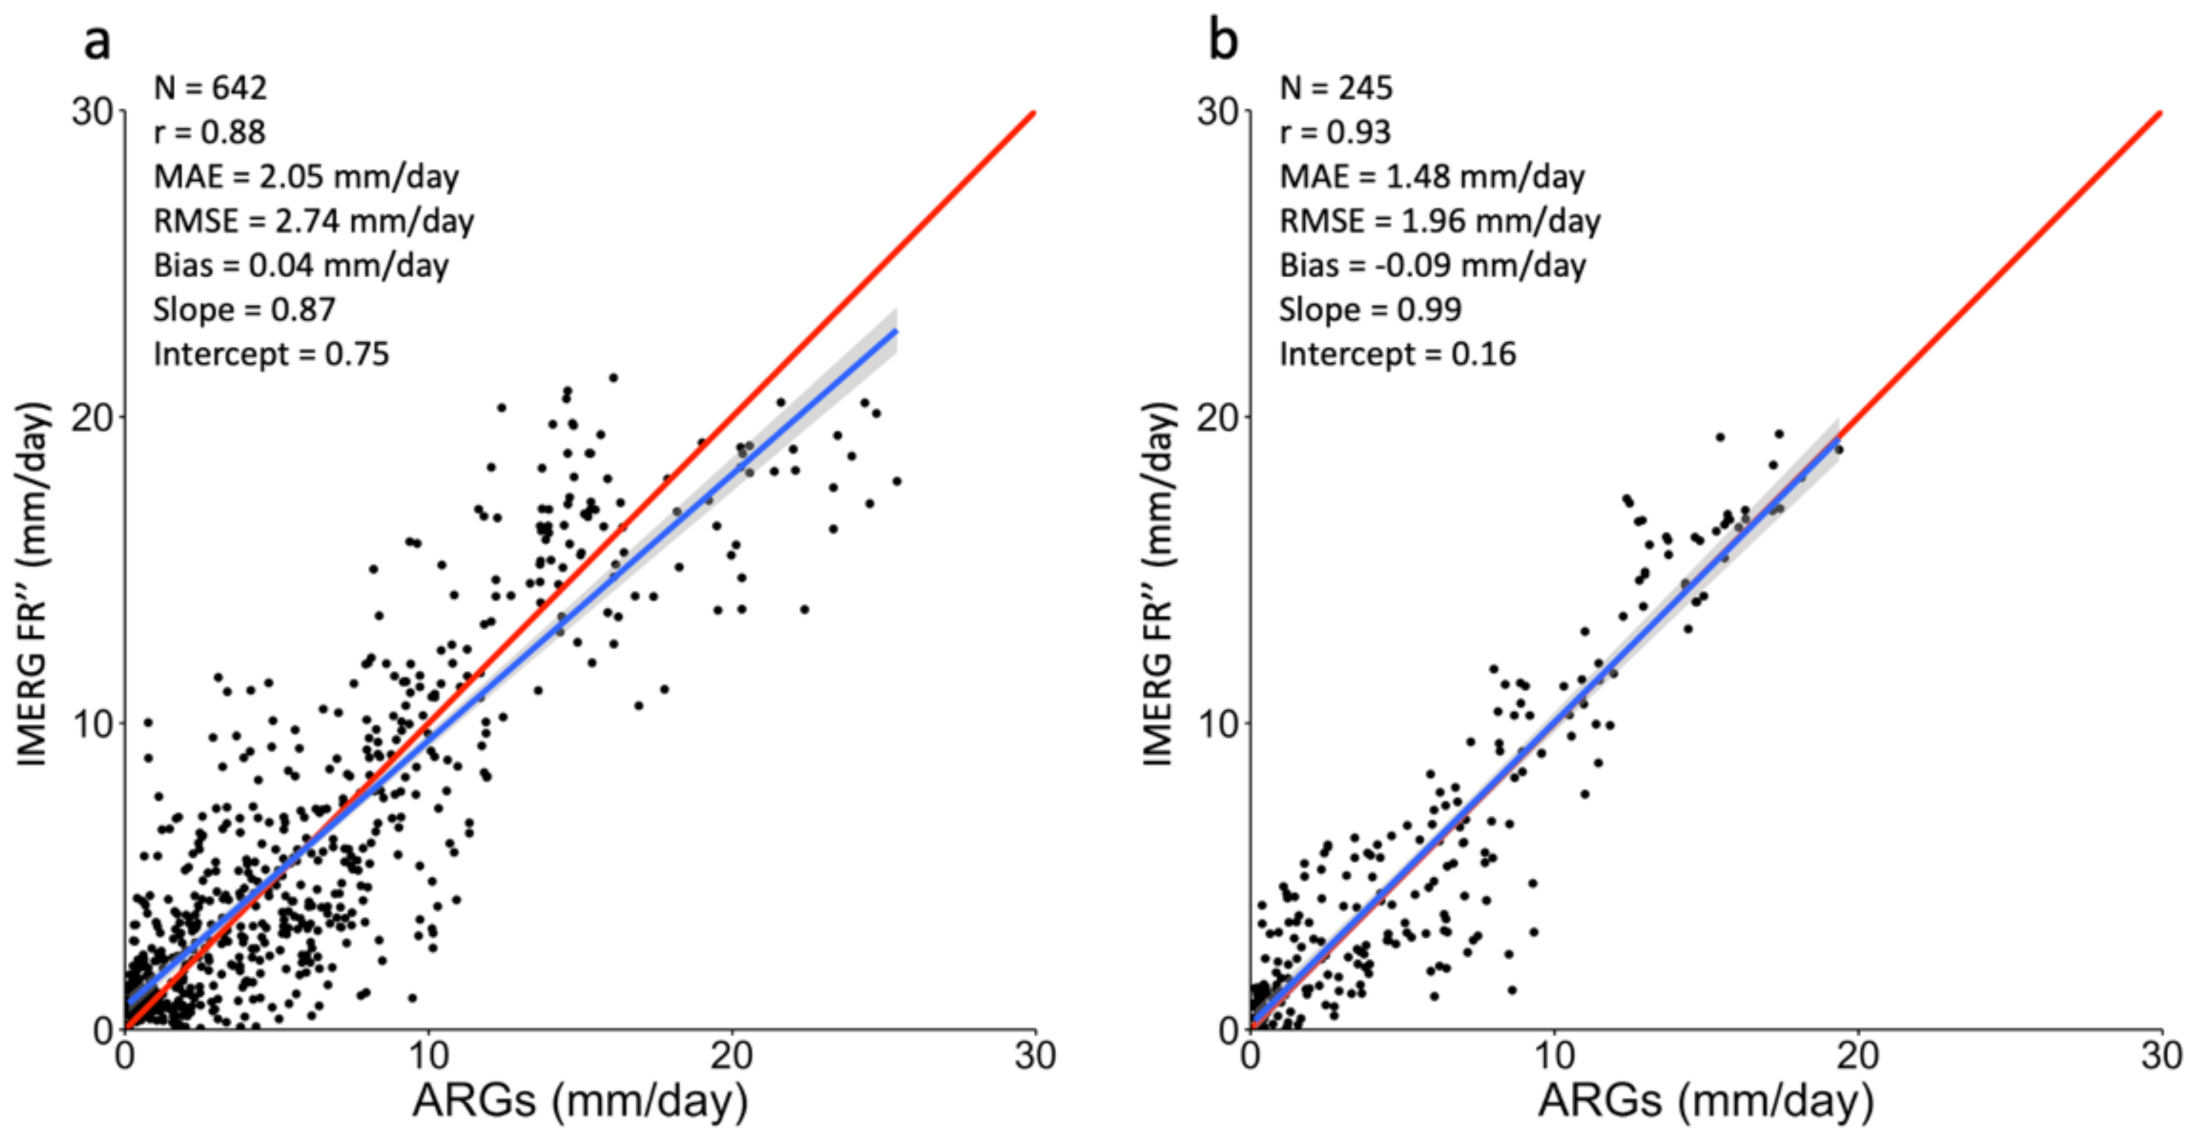
The bias-corrected IMERG FR was compared with the average ARG rainfall, as shown in Figure 12. Correlation coefficients improved from the raw IMERG FR with values from 0.68 to 0.88 for 10 day rainfall, and 0.83 to 0.93 for monthly rainfall. Error statistics MAE and RMSE were reduced. Rainfall biases also decreased to 0.04 and −0.09 mm/day for 10 day and monthly data, respectively. Finally, slopes become closer to one and the intercepts were reduced. These results suggest that performing correction on IMERG FR using both the generalized reduced gradient algorithm (power transform) and linear regression provides better consistency with ground rainfall data in terms of reduction in rainfall errors and biases. Moreover, employing the two-step correction is a direct method to concurrently use rainfall data from ARGs and IMERG FR, which are made consistent with synoptic station data. Through this technique, the final product was obtained from comparisons of similar rainfall events that generated optimized correction factors that can be used to construct a long-term gridded rainfall dataset for the Philippines.
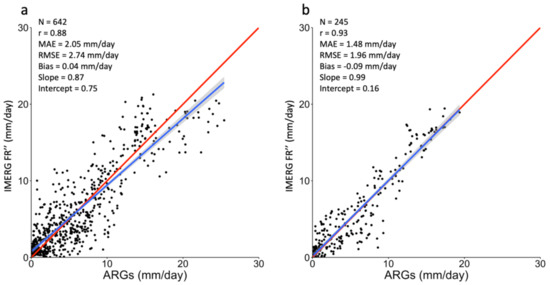
Figure 12.
Performance of bias-corrected IMERG FR compared to ARG rainfall at (a) 10 day and (b) monthly timescales. Slope of the regression line (blue) becomes much closer to the perfect agreement line (red).
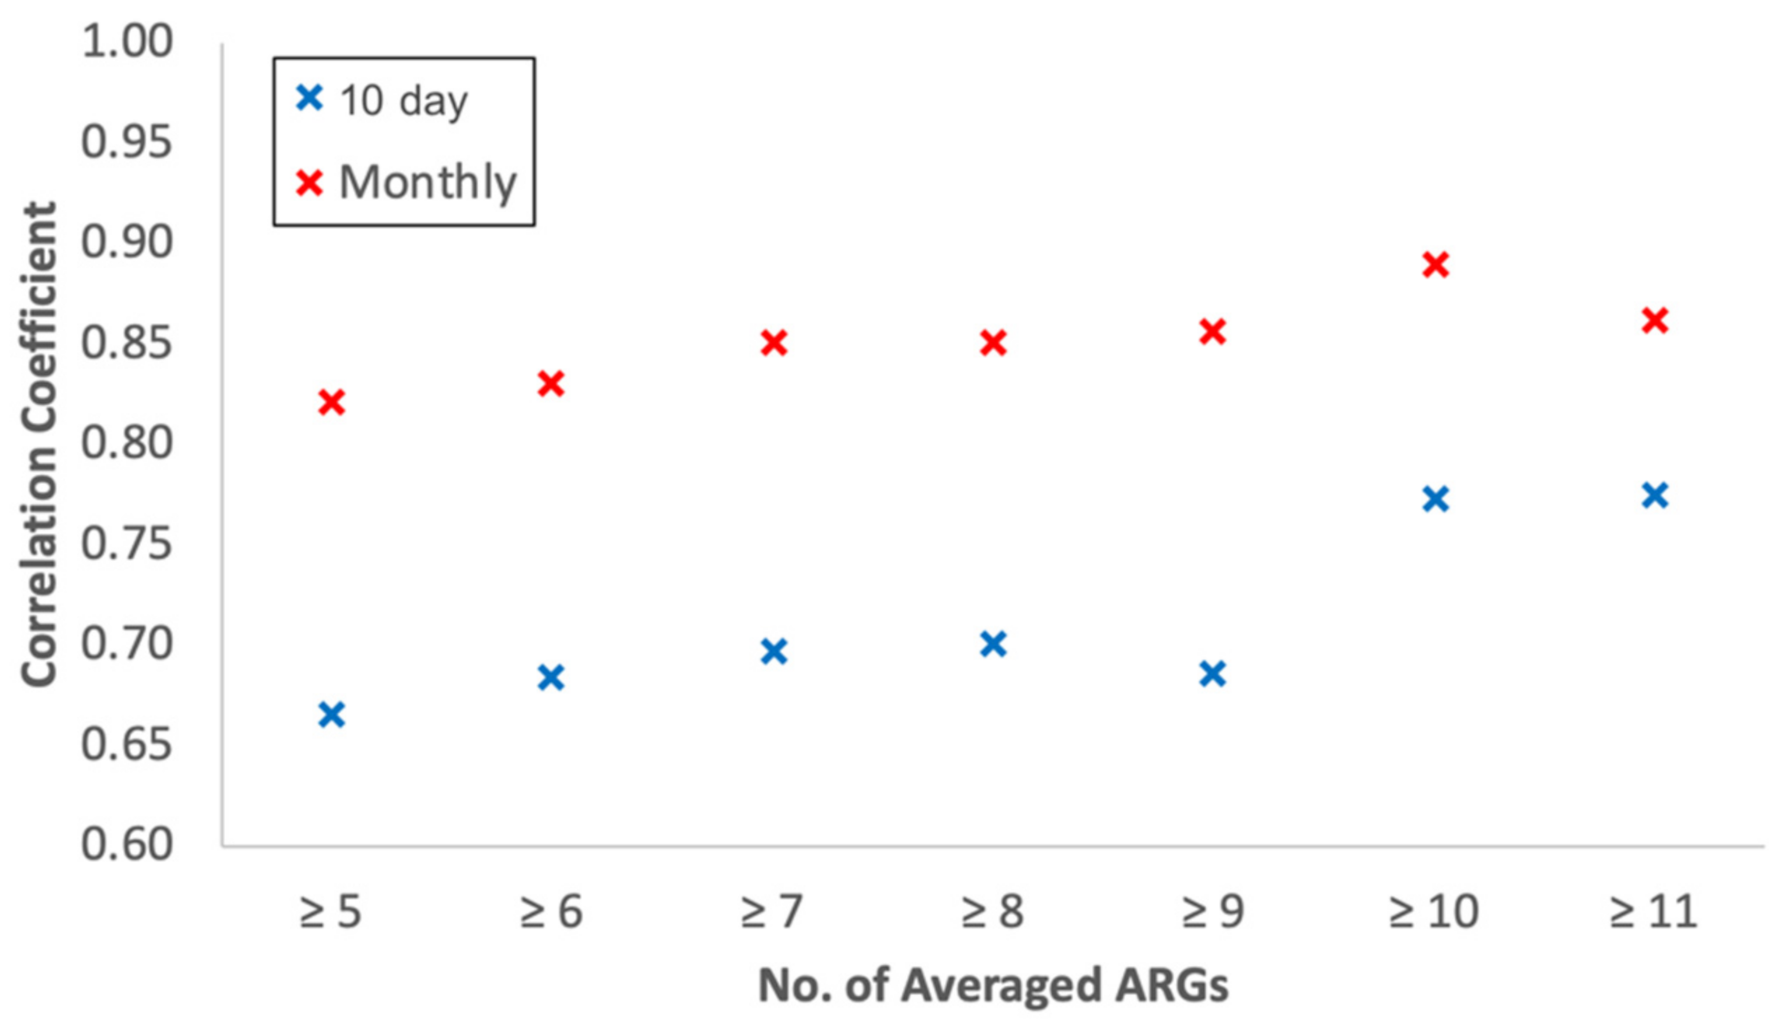
The number of ARG stations needed for an effective comparative study of IMERG FR data and ARG data depends on various factors, including the uniformity of rain over a large area. To assess the optimal number, correlation coefficients as a function of the minimum number of ARGs within the satellite footprint are plotted in Figure 13. It is apparent that the correlation coefficient increases with the minimum number of ARGs. The plot for monthly data shows a slight increase in the correlation coefficients from 0.83 for ≥5 ARGs to about 0.89 for ≥10 ARGs. The plot for 10 day data shows a greater increase from 0.67 for ≥5 ARGs to about 0.77 for ≥10 ARGs. It appears that the use of 10 ARGs in the aforementioned analysis is desirable and, although using more would be preferred, the results at ≥11 ARGs indicate declines in correlation coefficients, suggesting statistical limits due to the relatively small number of ARG measurements that meet this criterion.
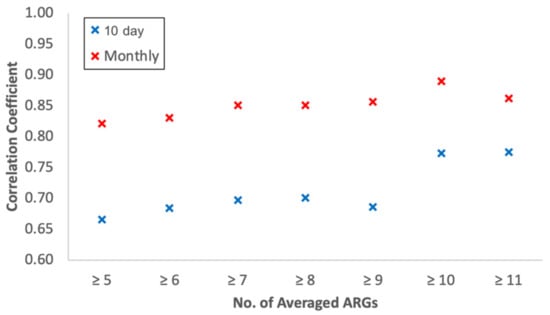
Figure 13.
Variability of correlation coefficients based on number of ARGs within IMERG FR’s footprint.
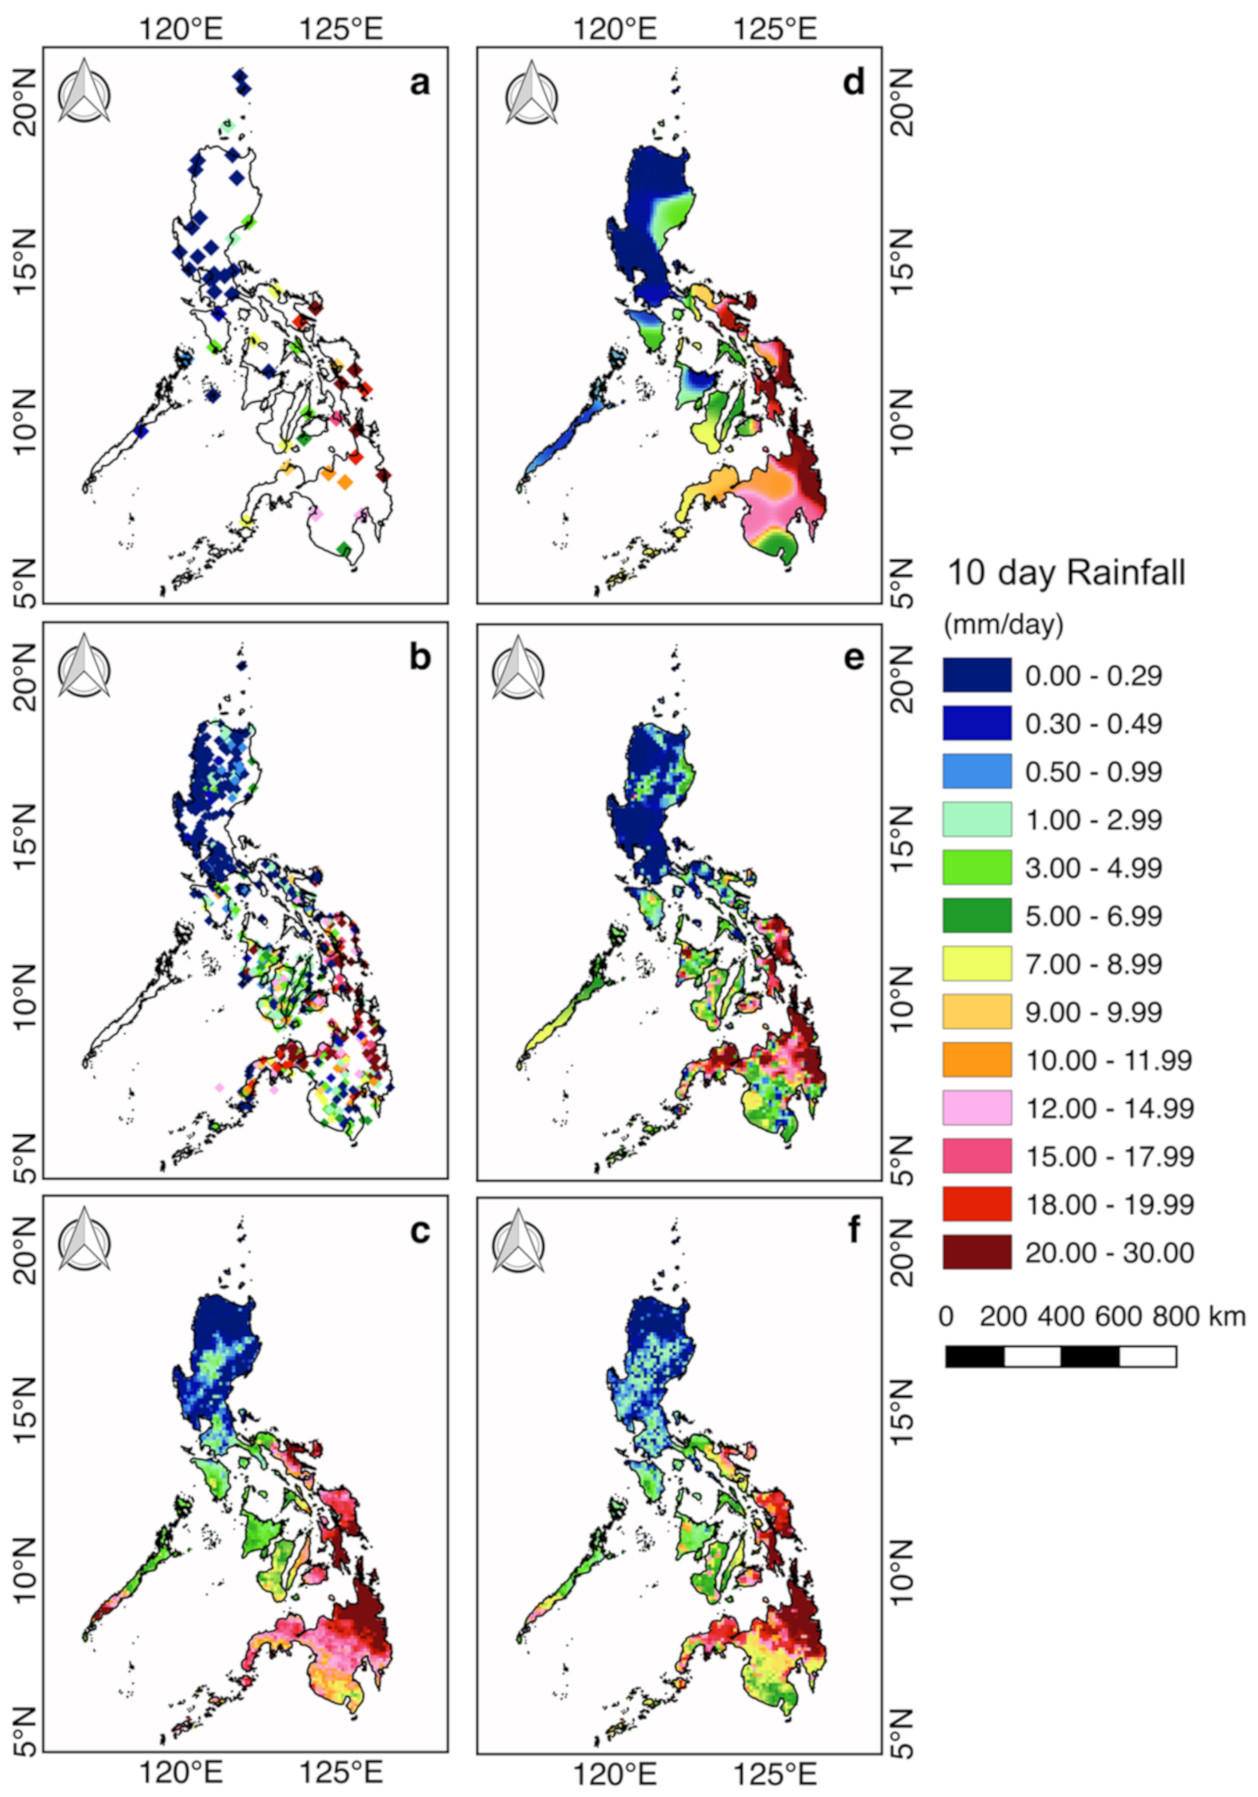
To illustrate the merit of having a rainfall dataset that consists of synoptic station data, rain gauge data, and IMERG FR data, sample color-coded maps of raw, interpolated, and corrected 10 day data for the period 6–15 March 2017 are presented in Figure 14. Figure 14a,b represents the point measurements provided by synoptic stations and ARGs, with the size of the data points considerably increased for improved visibility. The images show relatively low values in Luzon and other areas, but considerably higher values towards the south, and particularly on the island of Mindanao. The more comprehensive measurements provided by IMERG FR and depicted in Figure 14c show significantly more defined spatial distribution, with the northern regions exhibiting the dry season expected for this time of the year but with an increasing rate towards the southern region. The rainfall pattern depicted is influenced by the lack of tropical cyclones and the behavior of the monsoons during this period.
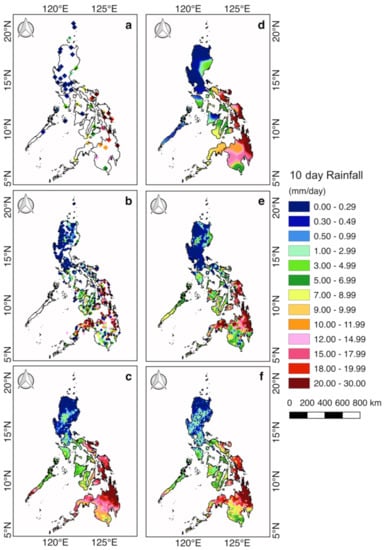
Figure 14.
Sample 10 day rainfall during 6–15 March 2017 from (a) synoptic stations, (b) ARGs, (c) raw IMERG FR, (d) interpolated synoptic stations, (e) interpolated rain gauges, and (f) bias-corrected IMERG FR.
If satellite data is not available, the only means of obtaining regional patterns is through spatial interpolation of the synoptic and ARG data. Spatial interpolation was undertaken by applying inverse distance weighting [24] with the power parameter, p = 5 on synoptic and ARG rainfall data, as illustrated in Figure 14d,e, respectively. These two images show generally similar patterns but there are distinct differences in some regions. For example, the patterns in the southern island of Mindanao and of the island of Palawan are quite different. Spatially interpolated ARGs were used as a basis for the ARG threshold values required for the two-step bias correction of the IMERG FR product shown in Figure 14f. However, interpolated synoptic stations may also be used when ARGs are not available because similar spatial patterns are observed between the two. When the bias-corrected IMERG FR is compared with the raw IMERG FR data shown in Figure 14c, distinct differences are observed, highlighting the significant improvements in the IMERG FR product. However, when compared with the spatially interpolated synoptic and ARG data, huge differences are apparent, especially in areas where there is a paucity of measurements, or no measurements, from the ground. These results show the weakness of having just ground observations as provided by the synoptic and ARG data.
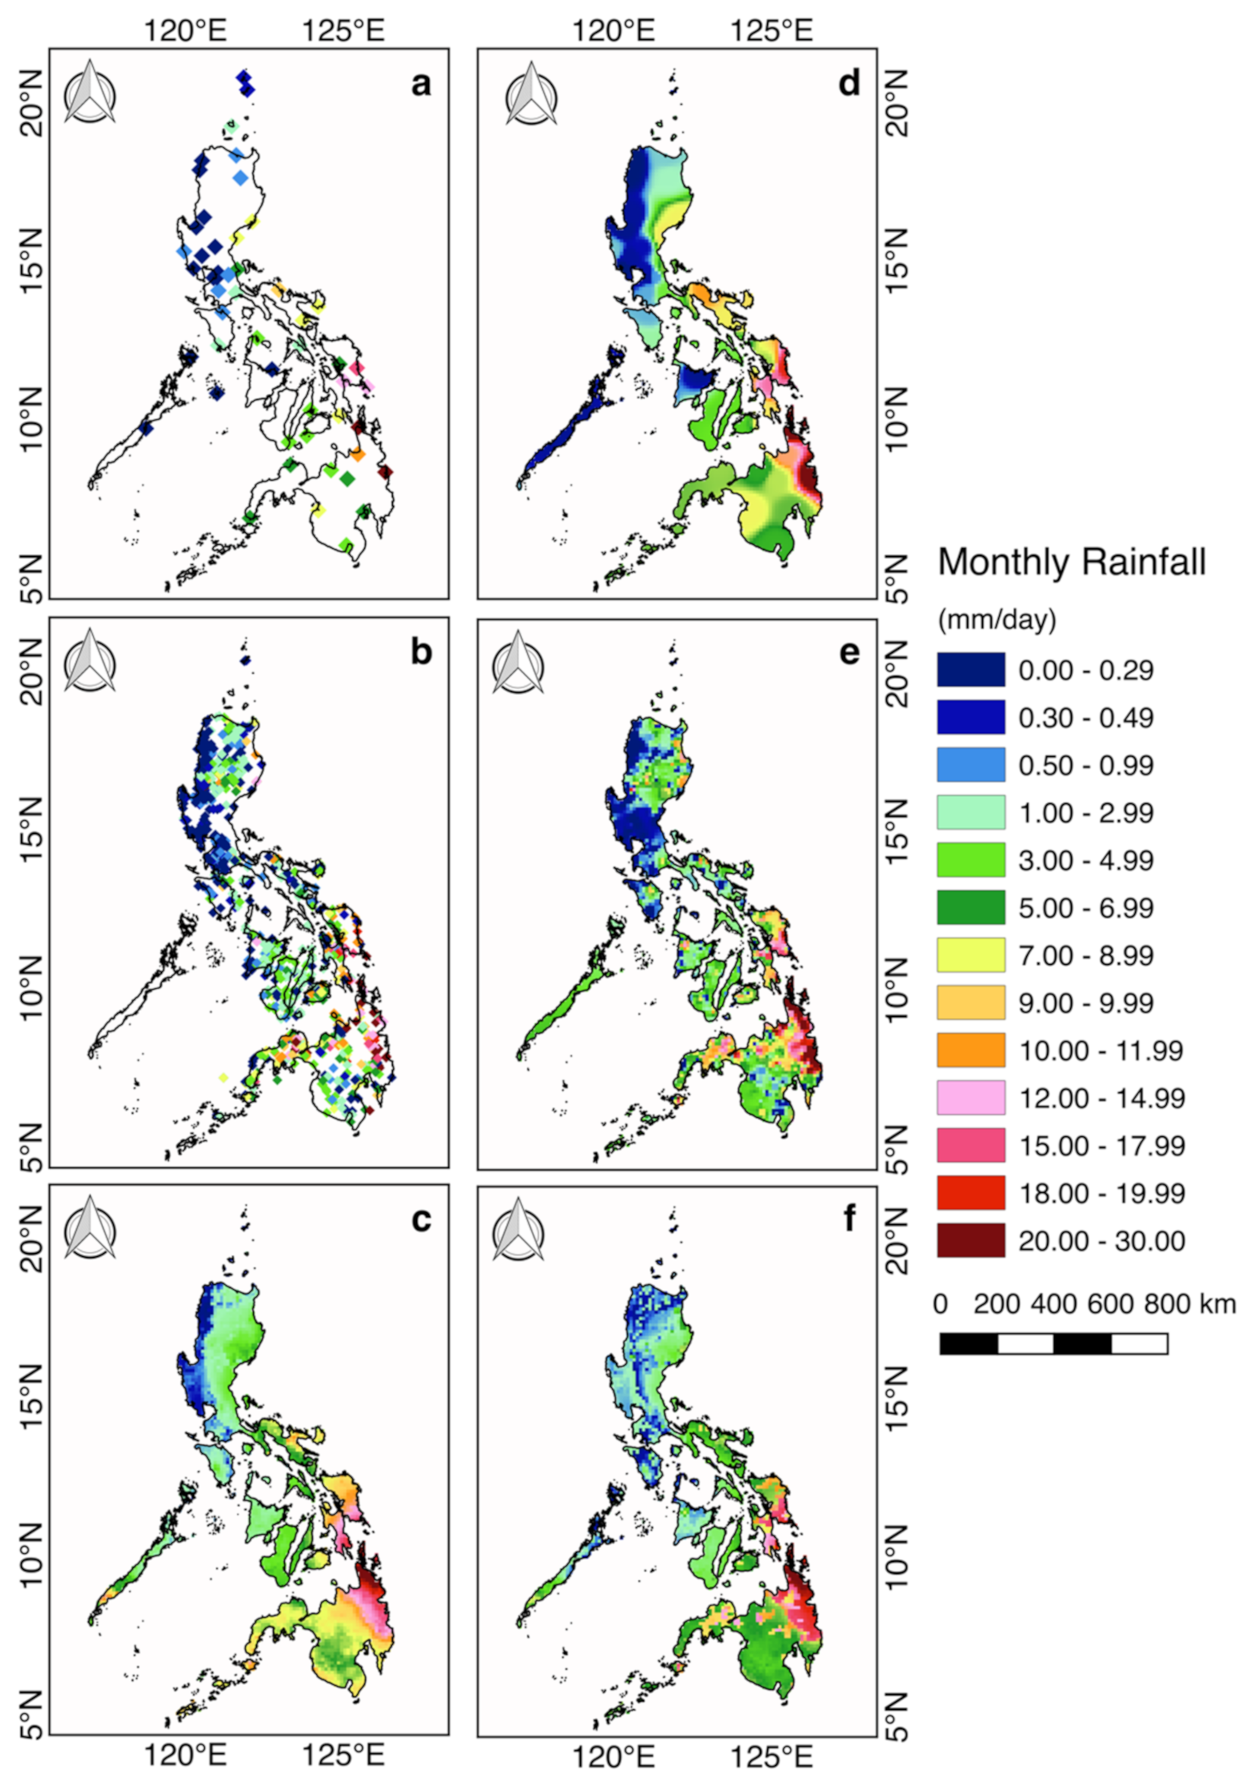
Similar sets of color-coded maps are presented in Figure 15, but for the monthly data in March 2017. The monthly data show similar patterns, but somewhat different values when compared with the 10 day data because they represent average measurements for a longer period, with the non-overlapping data likely representing a different rain event than the rest of the monthly data. Again, the spatially interpolated synoptic and ARG data shown in Figure 15d,e depict approximately similar patterns but different values, with the ARG providing more regional details, thereby confirming the value of having measurements in more locations. The maps for raw IMERG FR and the corrected IMERG FR are again shown to have slight but significant differences, but are nonetheless consistent with the spatial patterns of rainfall. The subtle differences in various locations indicates that for monthly averages, the raw IMERG FR data already provide a good representation of the rainfall patterns in the Philippines, which is further improved upon introduction of bias correction.
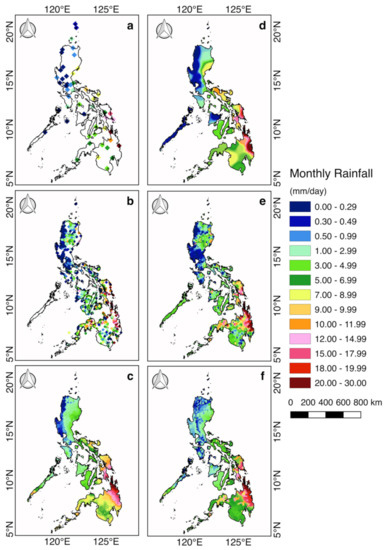
Figure 15.
Sample monthly rainfall during March 2017 from (a) synoptic stations, (b) ARGs, (c) raw IMERG FR, (d) interpolated synoptic stations, (e) interpolated rain gauges, and (f) bias-corrected IMERG FR.
4. Conclusions
As an archipelago in the tropics, Philippines receives a huge amount of rain that varies depending on the location and season [25]. Reliable and accurate rainfall information is needed because rainfall is the key source of clean fresh water that is critically needed for domestic use and to sustain agriculture, forests, lakes, and rivers in the country. This study explored the creation of a rainfall dataset that would be effective in meeting most of these needs. Three sources of rainfall data were considered. The first source was the synoptic station data, which are recognized as the most accurate measurements of rainfall in the country because the stations are manned, the instruments are regularly calibrated, and the technique meets the specifications of the WMO. The second was the ARG data, which are unmanned measurements and provide data similar to those of the synoptic stations, but with a higher number and greater coverage. The third was satellite data, which provide large scale and comprehensive measurement of rainfall all over the Philippines. Because of different requirements in different applications, the strategy of the current study was to generate a rainfall dataset that makes use of all three sources, while ensuring that the values are consistent, and the data are co-registered and formatted in the same manner. This was accomplished by using synoptic station data as the baseline, and correcting both ARG and IMERG data to be consistent with the synoptic data using standard power transform and linear regression techniques for bias correction. This technique is unique because it considers the effect of distance between measurements, elevation, and the difference between point measurement and satellite measurement from a much larger area. To our knowledge, a similar technique and an equivalent dataset has not been reported in the literature.
Using scatter plots and spatial autocorrelation analysis, considerable differences between synoptic and ARG data were apparent, but the reason was found to be primarily because of differences in location of measurements. The discrepancies were minimized by choosing pairs of data that are within 1 km distance in location. The latter led to good agreement of synoptic and corrected ARG data, with a correlation coefficient of 0.94 and 0.97 for the 10 day and monthly data, respectively, and improvements in linear regression slope from 0.67 to 0.90 for 10 day data, and 0.70 to 0.94 for monthly data. The improved agreement with shorter distances is significant and indicates that point measurements may represent rainfall patterns only within a limited area. Comparative analysis of corrected individual ARG data with IMERG FR data also indicated large discrepancies. Such discrepancies were minimized by choosing only pairs of data in which there are ample ARG measurements within the large footprint of IMERG FR. By using pairs in which there are at least 10 ARGs within the footprint, the corrected ARG data agreed significantly better with the corrected IMERG FR data, with a correlation coefficient of 0.88 and 0.93 for the 10 day and monthly data, respectively, and an improvement in slope from 0.66 to 0.87 for 10 day data, and 0.74 to 0.99 for monthly data. These results reveal that the main reason why previous reports showed large discrepancies between synoptic data and satellite measurements was likely because point measurements were being compared with satellite data that represent rainfall from a much larger area.
The merit of using satellite data, and in particular IMERG FR data, to complement in situ data, is manifested by the results of comparative analysis of color-coded maps of IMERG FR, which provides comprehensive measurement for the entire country, with spatially interpolated maps of synoptic and corrected ARG data. The maps show large discrepancies between IMERG FR and synoptic or ARG data, especially in areas where there are no ground measurements. Such a result is a confirmation that the synoptic and ARG data are not able to capture the spatially detailed patterns of rainfall that need to be represented in many mesoscale and modeling studies. However, it should be emphasized that synoptic data are the most useful data for rainfall studies in the specific areas where they are located because they represent direct and accurate measurements of the variable in these regions. In addition, the more robust and corrected ARGs provide excellent supplementary information to the synoptic data.
The raw IMERG FR and IMERG LR, which can be used as a substitute to the final run for near real-time operations and other requirements, are shown to provide data that are different from those of ground stations, but are similar enough to capture rainfall patterns and fill in rainfall data where ground observations are scarce. However, it is desirable to use bias-corrected IMERG data to ensure consistency with synoptic and ARG data, especially if the satellite sensor calibration changes with time or if other corrections such as changes in satellite altitude are needed. If such changes in satellite parameters are accounted for, the correction factor could be used to extend the data to a much longer time period than that of the ARG data.
Overall, the results of this study indicate that a combined use of consistent synoptic, ARG, and satellite GPM would provide a powerful tool for meeting most of the requirements in rainfall studies. These sources can be used to improve the accuracy of weather and climate models that are used to forecast flood, drought, fire, and other natural hazards. Finally, they would be most suitable for the construction of a long-term rainfall dataset of the entire country, which is needed in phenomenological and climate trend studies, and to establish the actual boundaries of the different climate types.
Author Contributions
Conceptualization, A.V., G.J.P., G.T. and J.C.; methodology, A.V., G.J.P., G.T. and J.C.; software, A.V.; validation, A.V., G.J.P., G.T. and J.C.; formal analysis, A.V., G.J.P., G.T. and J.C.; investigation, G.J.P., G.T. and J.C.; resources, A.V. and G.J.P.; data curation, A.V.; writing—original draft preparation, A.V., G.J.P., G.T. and J.C.; writing—review and editing, A.V., G.J.P., G.T. and J.C.; visualization, A.V., G.J.P., G.T. and J.C.; supervision, G.J.P., G.T. and J.C.; project administration, G.J.P.; funding acquisition, G.J.P. All authors have read and agreed to the published version of the manuscript.
Funding
This research was partly funded by the DOST—Grants-In-Aid (DOST-GIA) through the Understanding Lightning and Thunderstorm (ULAT) Project and the Drought and Crop Assessment and Forecasting (DCAF) project funded by DOST Philippine Council for Agriculture, Aquatic, and Natural Resources Research and Development (PCAARRD). A.V. received scholarship and funding support from DOST through the Accelerated Science and Technology Human Resource Development Program (ASTHRDP). J.C. was also supported by DOST under the Balik Scientist Program.
Institutional Review Board Statement
Not applicable.
Informed Consent Statement
Not applicable.
Data Availability Statement
The synoptic station and ARG data presented in this study are available upon request from PAGASA and DOST-ASTI, respectively. GPM data is publicly available through this website (https://gpm.nasa.gov/data/directory (accessed on 10 November 2020)).
Acknowledgments
The authors would like to acknowledge the help of DOST-ASTI and PAGASA for providing ARG and synoptic station data used in this study.
Conflicts of Interest
The authors declare no conflict of interest.
References
- Dembélé, M.; Zwart, S.J. Evaluation and comparison of satellite-based rainfall products in Burkina Faso, West Africa. Int. J. Remote Sens. 2016, 37, 3995–4014. [Google Scholar] [CrossRef] [Green Version]
- Lin, Y. Overview. In Mesoscale Dynamics; Cambridge University Press: Cambridge, UK, 2007; pp. 1–11. [Google Scholar] [CrossRef]
- Mishra, A.K. Effect of rain gauge density over the accuracy of rainfall: A case study over Bangalore, India. Springerplus 2013, 2, 311. [Google Scholar] [CrossRef] [PubMed] [Green Version]
- Fensterseifer, C.; Allasia, D.G.; Paz, A.R. Assessment of the TRMM 3B42 Precipitation Product in Southern Brazil. J. Am. Water Resour. Assoc. 2016, 52, 367–375. [Google Scholar] [CrossRef]
- Aghakouchak, A.; Behrangi, A.; Sorooshian, S.; Hsu, K.; Amitai, E. Evaluation of satellite—Retrieved extreme precipitation rates across the central United States. J. Geophys. Res. 2011, 116. [Google Scholar] [CrossRef]
- Jamandre, C.A.; Narisma, G.T. Spatio-temporal validation of satellite-based rainfall estimates in the Philippines. Atmos. Res. 2013, 122, 599–608. [Google Scholar] [CrossRef]
- Huffman, G.J.; Bolvin, D.T.; Braithwaite, D.; Hsu, K.; Joyce, R.; Kidd, C.; Nelkin, E.J.; Sorooshian, S.; Tan, J.; Xie, P. NASA Global Precipitation Measurement (GPM) Integrated Multi-SatellitE Retrievals for GPM (IMERG); Algorithm Theoretical Basis Document, Version 06; National Aeronautics and Space Administration: Washington, DC, USA, 2019. [Google Scholar]
- Anjum, M.N.; Ding, Y.; Shangguan, D.; Ahmad, I.; Ijaz, M.W.; Farid, H.U.; Yagoub, Y.E.; Zaman, M.; Adnan, M. Performance evaluation of latest integrated multi-satellite retrievals for Global Precipitation Measurement (IMERG) over the northern highlands of Pakistan. Atmos. Res. 2018, 205, 134–146. [Google Scholar] [CrossRef]
- Sungmin, O.; Foelsche, U.; Kirchengast, G.; Fuchsberger, J.; Tan, J.; Petersen, W. Evaluation of GPM IMERG Early, Late, and Final rainfall estimates using WegenerNet gauge data in southeastern Austria. Hydrol. Earth Syst. Sci. 2017, 21, 6559–6572. [Google Scholar] [CrossRef] [Green Version]
- Tan, M.L.; Duan, Z. Assessment of GPM and TRMM precipitation products over Singapore. Remote Sens. 2017, 9, 720. [Google Scholar] [CrossRef] [Green Version]
- Lu, X.; Wei, M.; Tang, G.; Zhang, Y. Evaluation and correction of the TRMM 3B43V7 and GPM 3IMERGM satellite precipitation products by use of ground-based data over Xinjiang, China. Environ. Earth Sci. 2018, 77, 209. [Google Scholar] [CrossRef]
- Sun, W.; Sun, Y.; Li, X.; Wang, T.; Wang, Y.; Qiu, Q.; Deng, Z. Evaluation and Correction of GPM IMERG Precipitation Products over the Capital Circle in Northeast China at Multiple Spatiotemporal Scales. Adv. Meteorol. 2018, 2018. [Google Scholar] [CrossRef]
- Ramos, M.D.; Tendencia, E.; Espana, K.; Sabido, J.; Bagtasa, G. Assessment of Satellite Precipitation Products in the Philippine Archipelago. Int. Arch. Photogramm. Remote Sens. Spat. Inf. Sci 2016, XLI-B1, 423–427. [Google Scholar] [CrossRef] [Green Version]
- Veloria, A.; Perez, G.J.; Tapang, G.; Comiso, J. From TRMM to GPM: Verifying the Continuity of Satellite-derived Rainfall through comparison with Philippine synoptic measurements. In Proceedings of the Samahang Pisika ng Pilipinas, Tagbilaran, Bohol, Philippines, 29 May–1 June 2019. [Google Scholar]
- Peralta, J.C.A.; Narisma, G.T.; Cruz, F.A. Validation of High-Resolution Gridded Rainfall Datasets for Climate Applications in the Philippines. J. Hydrometeorol. 2020, 21, 1571–1587. [Google Scholar] [CrossRef]
- Combinido, J.S.; De Paz, M.; Carlos, J. Automated Quality Control of ASTI Automatic Weather Station (AWS) Meteorological Measurements: Quality Control Algorithm Version 1.0; Department of Science and Technology-Advanced Science and Technology Institute (DOST-ASTI): Quezon City, Philippines, 2018. [Google Scholar]
- Siuki, S.; Saghafian, B.; Moazami, S. Comprehensive evaluation of 3-hourly TRMM and half-hourly GPM-IMERG satellite precipitation products. Int. J. Remote Sens. 2016, 38, 558–571. [Google Scholar] [CrossRef]
- Verdin, J.; Klaver, R. Grid-cell-based crop water accounting for the famine early warning system. Hydrol. Process. 2002, 16, 1617–1630. [Google Scholar] [CrossRef]
- Vila, D.; De Goncalves, L.G.; Toll, D.; Rozante, J.R. Statistical Evaluation of Combined Daily Gauge Observations and Rainfall Satellite Estimates over Continental South America. J. Hydrometeorol. 2009, 10, 533–543. [Google Scholar] [CrossRef]
- Beck, H.; van Dijk, A.; Levizzani, V.; Schellekens, J.; Miralles, D.; Martens, B.; de Roo, A. MSWEP: 3-hourly 0.25° global gridded precipitation (1979-2015) by merging gauge, satellite, and reanalysis data. Hydrol. Earth Syst. Sci. 2017, 21, 589–615. [Google Scholar] [CrossRef] [Green Version]
- Moran, P.A.P. Notes on Continuous stochastic phenomena. Biometrika 1950, 37, 17–23. [Google Scholar] [CrossRef] [PubMed]
- Fylstra, D.; Lasdon, L.; Watson, J.; Waren, A. Design and Use of the Microsoft Excel Solver. Interfaces 1998, 28, 29–55. [Google Scholar] [CrossRef] [Green Version]
- Gumindoga, W.; Rientjes, T.H.M.; Haile, A.T.; Makurira, H.; Regianni, P. Bias correction schemes for CMORPH satellite rainfall estimates in the Zambezi River Basin. Hydrol. Earth Syst. Sci. Discuss. 2016. [Google Scholar] [CrossRef] [Green Version]
- Chen, F.; Liu, C. Estimation of the spatial rainfall distribution using inverse distance weighting (IDW) in the middle of Taiwan. Paddy Water Environ. 2012, 10, 209–222. [Google Scholar] [CrossRef]
- Coronas, J. The Climate and Weather of the Philippines, 1903 to 1918; Bureau of Printing: Manila, Philippines, 1920. [Google Scholar]


Publisher’s Note: MDPI stays neutral with regard to jurisdictional claims in published maps and institutional affiliations. |
© 2021 by the authors. Licensee MDPI, Basel, Switzerland. This article is an open access article distributed under the terms and conditions of the Creative Commons Attribution (CC BY) license (https://creativecommons.org/licenses/by/4.0/).