Abstract
The Pulang porphyry copper deposit (PCD), one of the main potential areas for copper resource exploration in China, exhibits typical porphyry alteration zoning. However, further investigation of the indicative significance of alteration minerals, additional insight into metallogenic characteristics, and prospecting guidelines continue to be challenging. In this study, ASTER and WorldView-3 data were used to map hydrothermal alteration minerals by employing band ratios, principal component analysis, and spectrum-area techniques; and subsequently, the indication significance of alteration minerals was studied in-depth. The following new insights into the metallogenic structure and spatial distribution of alteration zoning in Pulang PCD were obtained and verified. (1) A new NE trending normal fault, passing through the northeast of Pulang PCD, was discovered. (2) Two mineralization alteration centers, exhibiting alteration zoning characteristics of potassic-silicified, phyllic, and propylitic zones from the inside to the outside, were observed on both sides of the fault. (3) At the junction of the redivided potassic-silicification and phyllic zones, favorable prospecting potential areas were delineated. This study shows that the spectral/multi-sensor satellite data are valuable and cost-effective tools for the preliminary stages of porphyry copper exploration in inaccessible and remote areas around the world.
1. Introduction
Porphyry copper deposits (PCDs), one of the most significant copper resources worldwide, produce nearly three-quarters of the world’s copper [1]. PCDs are extensive in scale, feature entirely uniform mineralization, comprise shallow intrusions, and are suitable for large-scale mining. Many scholars consider these deposit types to be significant [2]. The Pulang porphyry copper deposit (PCD) is one of the main potential areas for copper resource exploration in China. Furthermore, they feature typical “porphyry” alteration zoning that comprises the potassic-silicification, phyllic, and propylitization zones from the center to the outward sections [2,3,4]. The potassic-silicification and phyllic alterations are strongly associated with high grade copper mineralization: the more optimized the zoning, the higher the mineralization enrichment [5]. Therefore, comprehensible spatial distribution patterns of the potassic-silicification and phyllic zones are important indicators for mineral exploration [1]. However, owing to its remoteness, rugged topography, and severe climate, the traditional field investigation method for identifying the alteration zones is very time-consuming and labor intensive. Consequently, taking advantage of remote sensing technology to map hydrothermal alteration minerals can contribute to the speedy and cost-effective identification of prospective target ore areas.
The application of multispectral remote sensing data in hydrothermal alteration mineral identification is an important method of mineral exploration and is especially useful at reconnaissance stages in inaccessible and remote areas [6,7,8]. Numerous studies have successfully utilized multispectral remote sensing data for the reconnaissance phase of mineral exploration around the world [9,10,11,12,13,14,15,16,17]. The most widely used data for alteration identification is Advanced Spaceborne Thermal Emission and Reflection Radiometer (ASTER) [18,19,20,21,22,23,24]. The visible and near-infrared (VNIR) and short-wave infrared (SWIR) bands of ASTER can be used to detect hydroxyl-bearing, iron oxides, and carbonate mineral groups due to their diagnostic spectral features [25,26,27]. The identification of silicified alteration can be accomplished using thermal infrared (TIR) bands of ASTER, owing to the different emissivity spectra characteristics of Si–O–Si stretching vibrations in the TIR region [28,29,30,31,32]. At present, the most accurate multispectral data for alteration minerals identification are WorldView-3 (WV-3), which exhibit the highest radiation, spectral, and spatial features in the VNIR (eight bands with a spatial resolution of 1.2 m) and SWIR (eight bands with a spatial resolution of 3.7 m) portions among the multispectral satellite sensors [33,34,35]. Recently, certain studies successfully used the WV-3 to map lithologies and hydrothermal alteration [14,17,36,37,38]. In Pulang PCD, it was verified that the extraction accuracy of porphyry alteration minerals based on WorldView-3 data is significantly improved comparing with that of ASTER data [39].
Along with the development of remote sensing hydrothermal alteration detection technology, many scholars have focused on the methods for hydrothermal alteration detection, such as band ratio (BR), principal component analysis (PCA), mixture tuned matched filtering (MTMF), and support vector machine (SVM) [2,40,41,42,43,44]. Recently, a spectrum-area (S-A) method, proposed to characterize the relationship of spectrum and area [45], illustrated that the mapping accuracy of hydrothermal alteration minerals can be significantly improved when combined with the conventional PCA method [39,46,47]. However, further investigation of the significance of alteration minerals as indicators, comprehension of metallogenic characteristics, and prospecting guidance continue to be challenging.
In this study, ASTER and WV-3 data were adopted for prospecting the Cu mineralization in the Pulang PCD, SW China. The main purposes of this research were the following: (i) detect hydrothermal alteration minerals using BR, PCA, and S-A techniques to ASTER and WV-3 data; (ii) further explore the significance of alteration minerals as indicators, comprehend metallogenic characteristics, and provide prospecting guidelines; and (iii) verify the results via field investigation and petrographic analysis.
2. Materials and Methods
2.1. Geological Setting
The Pulang PCD, located at the southern end of the Yidun island arc in SW China (Figure 1), is the product of the westward subduction of Garze–Litang oceanic crust [2,48,49,50]. Pulang, the largest Indosinian porphyry deposit in the Zhongdian district [51], has been found to comprise 4.31 Mt of Cu with average grades of 0.34%.
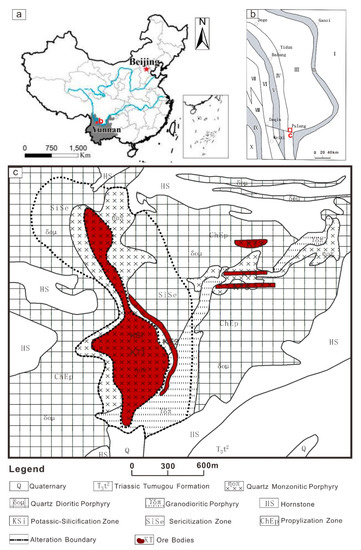
Figure 1.
Geological map of the Pulang PCD (modification of the map reported by Wang et al. [52]). (a) Location map of the study area; (b) Tectonic map of the Yidun island arc; (c) Simplified geological map of the Pulang PCD. I—Yangtze plate; II—Ganzi-Litang plate junction belt; III—Yidun island arc; IV—Zhongza microblock; V—Jinsha River junction zone; VI—Janda-Wixi volcanic arc; VII—Changdu-Lanping block; VIII—Sanda mountain-Jinghong volcanic arc; IX—Lancang River junction belt; X—Baoshan block.
The outcrop rocks are dominated by clastic rocks and andesite of Upper Triassic Tumugou Formation and Quaternary sediments [53]. According to the petrological relationship, the Triassic porphyry intrusions mainly include quartz dioritic porphyry, quartz monzonitic porphyry, and granodioritic porphyry. The quartz dioritic porphyry intruded the Tumugou Formation at the age of 219.6 ± 3.5 Ma (Zircon U–Pb dating) and was subsequently crosscut by the quartz monzonitic porphyry and granodioritic porphyry emplaced at 212.8 ± 1.9 Ma [54] and 206.3 ± 0.7 Ma (Zircon U–Pb dating) [52], respectively. The quartz monzonitic porphyry is thought to be related to mineralization, as it is the same age as the molybdenite Re–Os isochron (213 ± 3.8 Ma) from ore body [51,54,55] and features relatively high Cu concentrations compared to other porphyries.
The rock is strongly altered and has a typical porphyry alteration zoning [3,4,50]. The porphyry-type alteration zone was delineated via microscopic identification and core drilling [56]. It has alteration zoning characteristics of potassic-silicified, phyllic, and propylitic zones from the inside to the outside. Systematic drilling showed that the main ore body occurs in the potassic-silicification and phyllic zones, whereas weak mineralization develops in the propylization zone. Potassium feldspar (K[AlSi3O8]) and quartz (SiO2) are the alteration minerals associated with the potassic-silicification zone; the sericite (KAl2(Si,Al)4O10 (OH,F)2) and quartz (SiO2) are the alteration minerals closely related to the phyllic zone; chlorite (Fe, Mg, Al6(Si,Al)4O10OH8) and epidote(Ca2 (Al, Fe)3(SiO4)3(OH) are the alteration minerals closely related to the propylization zone.
2.2. Remote Sensing Data and Characteristics
In this study, ASTER and WV-3 data were utilized to identify alteration minerals associated with cu mineralization in Pulang PCD. Table 1 presents the technical performance of the ASTER and WV-3 data.

Table 1.
Technical performance of the ASTER and WV-3 data.
Multispectral ASTER Satellite, launched on 18 December 1999, has 14 spectral bands. It includes three VNIR bands at a spatial resolution of 15 m, ranging from 0.52 to 0.86 μm; six SWIR bands at a spatial resolution of 30 m, ranging from 1.6 to 2.43 μm; and five thermal infrared (TIR) bands at 90 m spatial resolution, ranging from 8.0 to 14.0 μm. Each scene of ASTER data covers an area of 60 × 60 km2 [57].
Multispectral commercial satellite WV-3 has the highest radiation, spectral, and spatial levels among the multispectral satellite sensors currently, launched on 13 August 2014 by the Digital Globe Company from Vandenberg Air Force Base. It contains eight VNIR bands (ranging from 0.42 to 1.04 μm) at a spatial resolution of 1.2 m and eight SWIR bands (ranging from 1.2 to 2.33 µm) at a spatial resolution of 3.7 m. Each scene WV-3 covers an area of 13.2 × 13.2 km2 [33,34,35].
In this study, a level 1T ASTER scene covering the study area was downloaded from the USGS (United States Geological Survey) Global Visualization Viewer (GloVis) (https://glovis.usgs.gov/, accessed on 18 June 2021), which was acquired on 22 December 2006. A level 2A WV-3 scene was purchased from the Twenty First Century Aerospace Technology Co., Ltd. (Beijing, China), which was acquired on 6 December 2015.
2.3. Pre-Processing of Remote Sensing Data
Atmospheric correction of the ASTER data is required to eliminate the influence of atmospheric attenuation and rescale the radiance to the surface reflectance data. The Fast Line-of-sight Atmospheric Analysis of Hypercubes (FLAASH) algorithm was applied to the VNIR and SWIR bands of the ASTER scene with the Mid-Latitude Winter atmospheric model and the Rural aerosol model [58,59]. To match the VNIR bands, SWIR bands were resampled to 15 m spatial dimensions by the nearest neighbor resampling method. The layer stacking of VNIR and SWIR bands was then generated. Similarly, the WV-3 VNIR and SWIR bands were atmospherically corrected via the FLAASH algorithm, converting relative radiometrically corrected images into Top-of-Atmosphere spectral reflectance; and then the layer stack of VNIR and SWIR bands with 1.24 m was generated by the nearest neighbor resampling method.
2.4. Hydrothermal Alteration Mineral Mapping Methods
The BR and PCA methods are utilized for ASTER data to detect the quartz alteration mineral; the PCA and S-A methods are utilized to map the sericite, chlorite, and epidote alteration minerals with WV-3 data.
2.4.1. Combination of the Band Ratio and Principal Component Analysis Methods
Band Ratio
The BR method [60] is the principle of algebraic operation. Different alteration minerals have different absorption valleys and reflection peak characteristics in their spectral curves. The differences between their geological information can be effectively enhanced, and shadow effects caused by topography can be reduced by calculating the ratio of the reflectance value of the reflection peak to the absorption valley [61], to extract alteration minerals information. The BR technique is a valuable method for enhancing the alteration minerals information [21,62,63,64].
Principal Component Analysis
Owing to the high correlation between image bands, image data are redundant. PCA combines the original i characteristic linearly to build the j principal components (PCs). The PCs are uncorrelated with each other. The transformation is expressed as follows:
where X is the remote sensing data before transformation, Y is the remote sensing data after transformation, and A is the transformation matrix.
PCA has been widely applied in mineralization alteration mapping of multi-spectral remote sensing data [22,63,64,65,66,67], whose essence is dimensionality reduction. By carrying out principal component transformation, the redundant original bands can be converted into a new set of incoherent bands, so that the relevant information is independently distributed among the new PCs. Thus, PCA plays the role of separating information [22,66]. The sign and magnitude of eigenvector loadings determine the principal component of the relevant information.
In this study, the BR method and PCA method were combined to fully utilize their respective advantages in the extraction of quartz alteration mineral. The procedure is as follows. (1) The quartz index (QI), carbonate index (CI), and mafic index (MI) are determined via ratio calculation; (2) QI, CI, and MI are determined to be the three components of the principal component analysis, and the PC for the extraction of quartz-altered minerals is selected according to the contribution value of the feature vector.
2.4.2. Principal Component Analysis and Spectrum-Area Methods
The S-A model is a sophisticated method considering the distributions of spatial and frequency domains [68,69]. The S-A method can be used to identify the anisotropic generalized self-similarity in the frequency domain and detect the different local singularity of the energy spectrum, by which the filters of the hydrothermal alteration minerals separate from the background and can be designed. The formula is as follows:
where S is the spectral energy density of the principal component of the relevant information in frequency space; A is the area of the energy spectral density, which exceeds a critical value (S0); and β is available in the log A (>S0)-log (S) diagram. In the detection of remote sensing hydrothermal alteration minerals information, S is the pixel value of remote sensing data, and A is the pixel number that is larger than the corresponding pixel value. In the log-log diagram, different fractal relationships can be represented by different straight segments, and the intersection point of two straight segments is the segmentation threshold value of the background and hydrothermal alteration minerals information. Based on the threshold value, the segmentation filter can be designed to separate the relevant information from the background using Fourier Inverse Transformation [45,46,47].
A combination of the PCA and S-A techniques was successfully applied to the enhanced detection of weak alteration minerals in contrast with the mere use of the conventional PCA method in our previous study [45,46,47]. In this study, owing to Pulang’s remoteness, rugged topography, and severe climate, we prefer to use a combination of the PCA and S-A methods to detect the sericite, chlorite, and epidote alteration minerals information.
3. Results
3.1. Quartz Alteration Mineral Extraction Using a Combination of the Band Ration and Principal Component Analysis Methods along with ASTER Data
The basis for the alteration minerals mapping is the spectral responses on the alteration minerals. Quartz has a strong reflection peak in thermal infrared bands 10 and 12 of ASTER data, and a strong absorption peak in band 11 of ASTER data (Figure 2). According to the response characteristics of quartz in the ASTER thermal infrared bands, Boardman [70] proposed Quartz Index (QI = B11 × B11/B10 × B12) to identify quartz information. At the same time, Boardman also proposed the Carbonate Index (CI = B13/B14) and Mafic Index (MI = B12/B13) using ASTER data thermal infrared bands. Pour [8] used QI, CI, and MI as input datasets for running the PCA, and mapped quartz, carbonate, and mafic alteration minerals successfully. Therefore, a combination of the BR and PCA methods was employed to map quartz alteration mineral with ASTER TIR bands in this study.
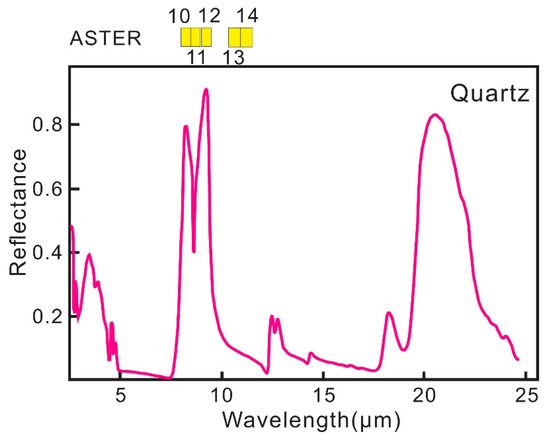
Figure 2.
Spectral curves of quartz from thermal infrared spectra in ASTER data (the spectral curves from the USGS spectral library version 7).
Table 2 shows the eigenvector matrix of the quartz obtained via the PCA method. In the PC2 component, QI (0.725769) is a positive sign and has a large contribution value, while CI (−0.178896) and MI (−0.664270) are both negative signs. Therefore, the bright pixel (pixel value > 0) in the PC2 component can be represented as the quartz alteration mineral.
Table 2.
Eigenvector matrix of the sericite obtained via the PCA method.
3.2. Hydrothermal Alteration Minerals Extraction Using a Combination of the Principal Component Analysis and Spectrum-Area Methods along with WV-3 Data
Sericite, chlorite, and epidote were extracted using a combination of the PCA and S-A methods along with WV-3 data, which are closely associated with the phyllic and propylitization zones.
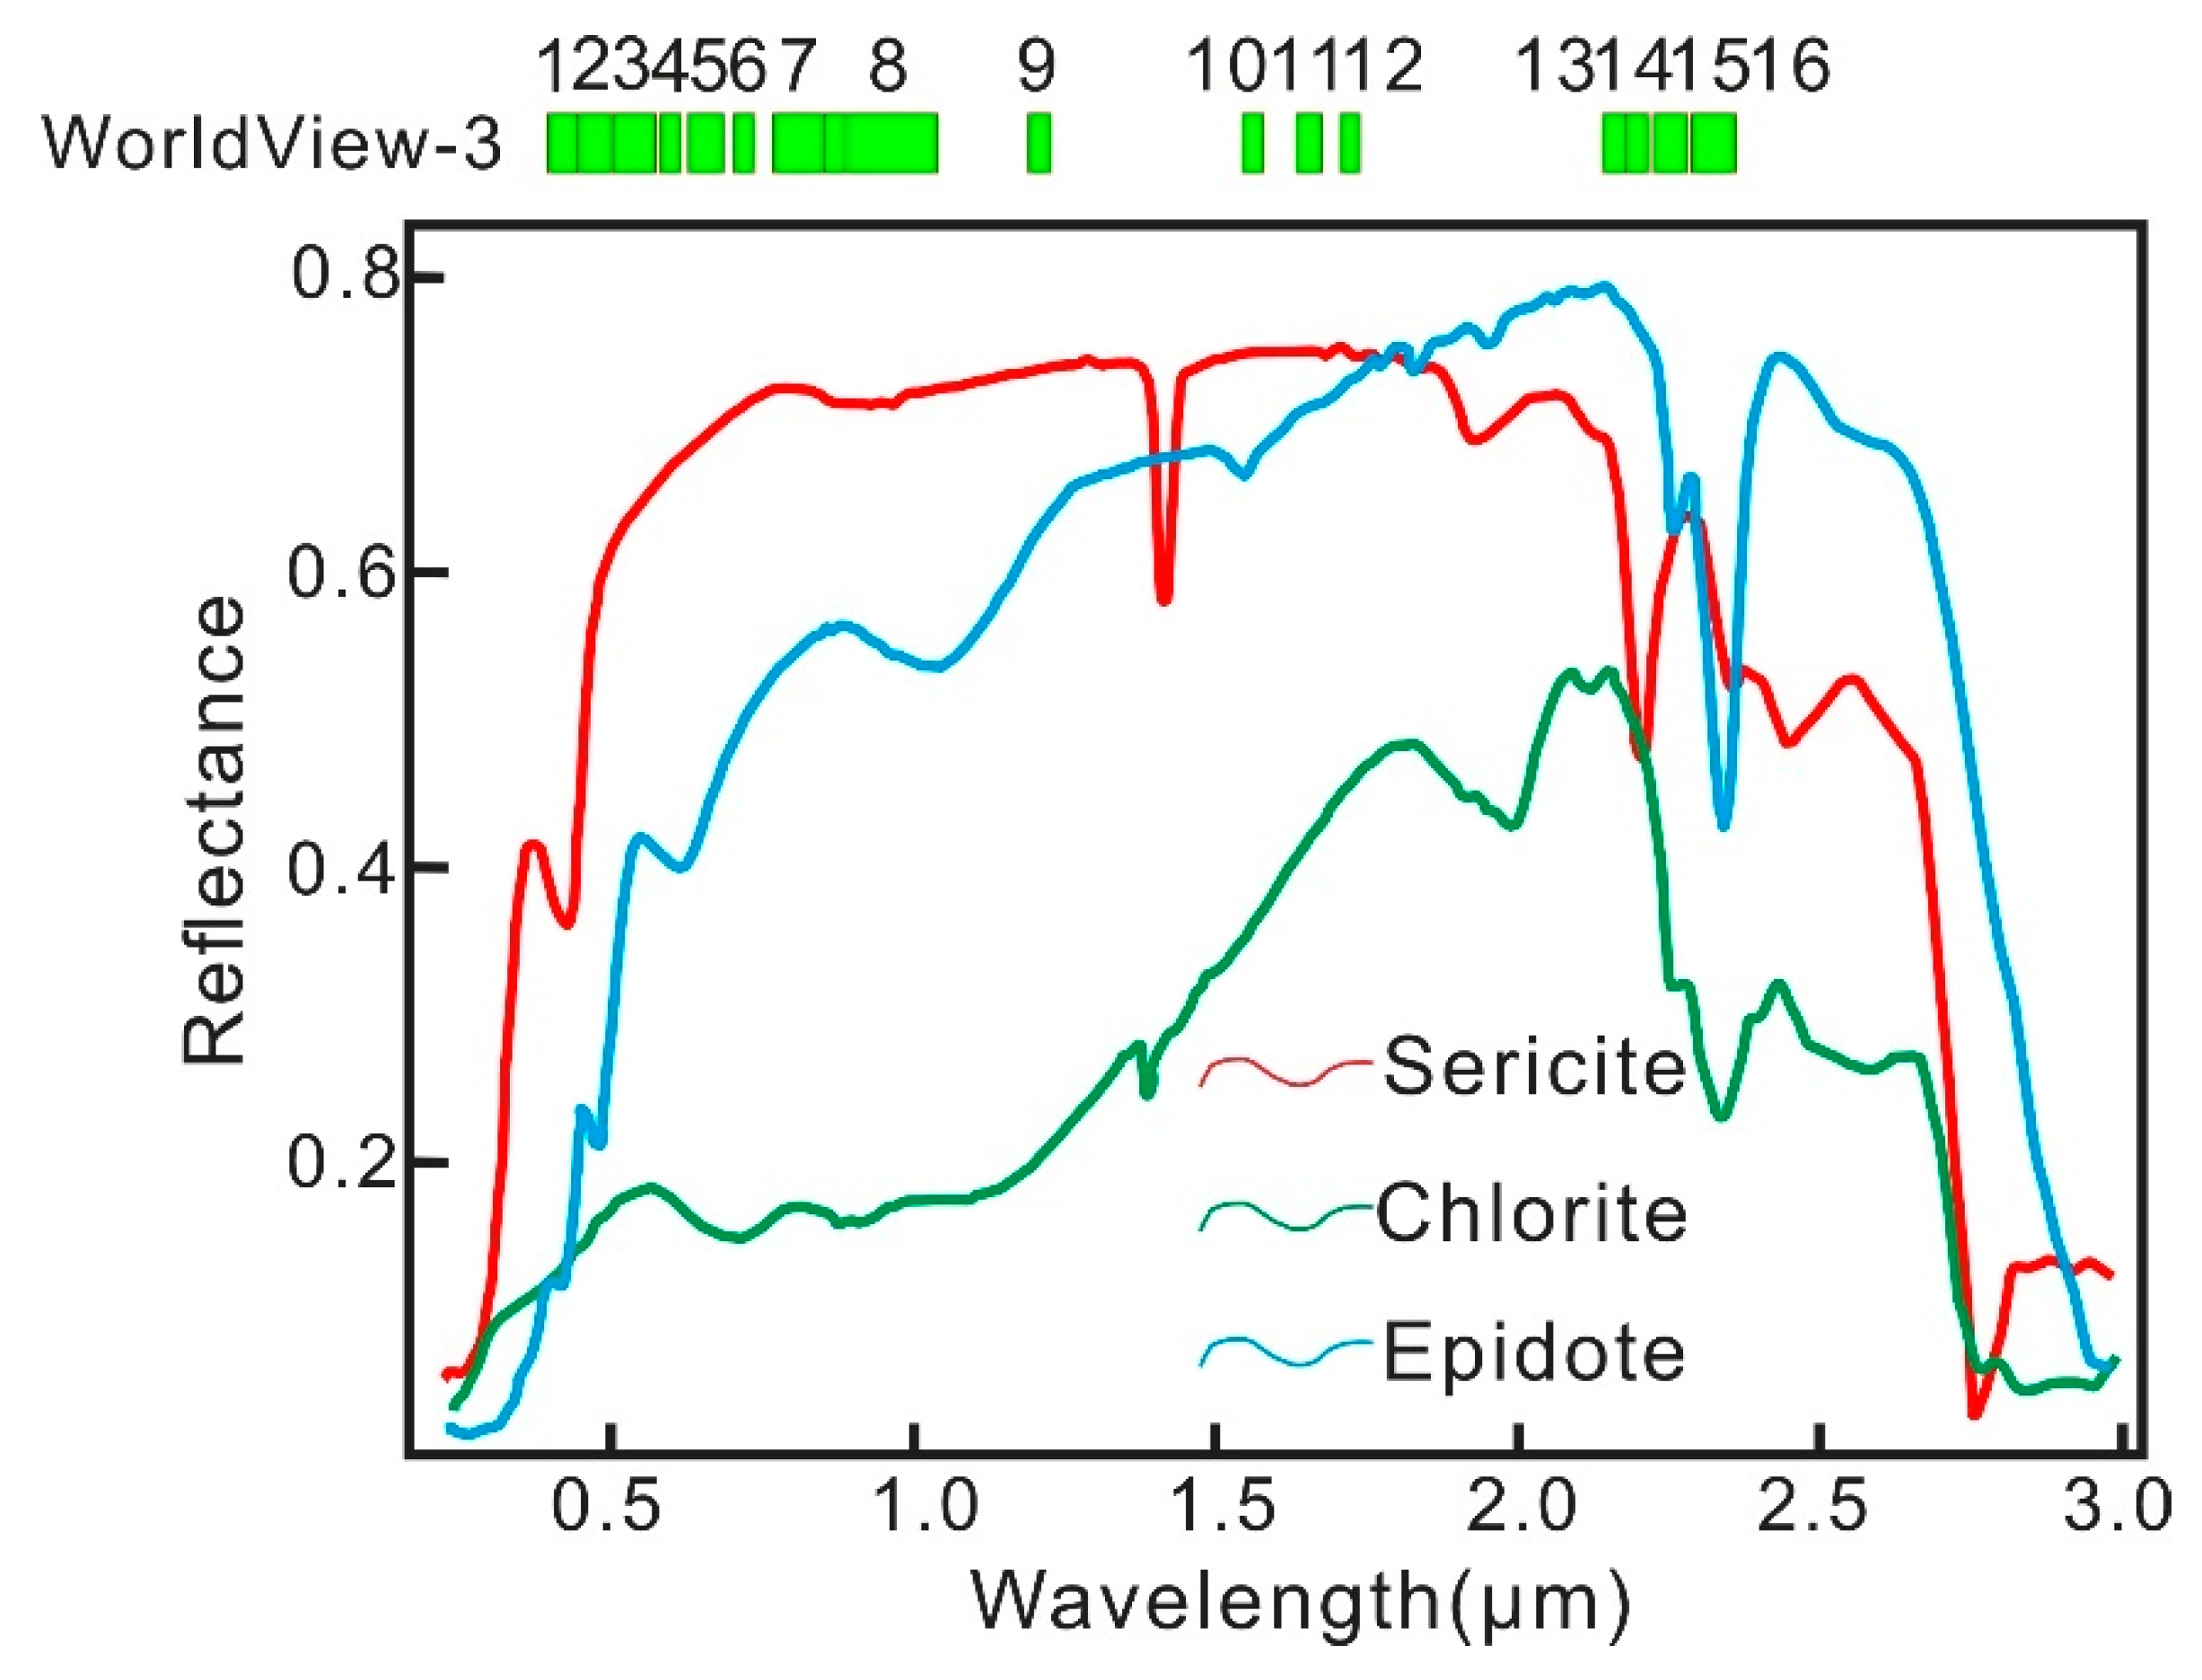
The band selection of alteration mineral identification was based on the characteristic spectrum with the largest reflectivity difference in WV-3 data (Figure 3). With respect to the sericite reflectance spectra, the sericite has reflectance peak at bands 6 and 15 and absorption valley at bands 1 and 14. Therefore, bands 1, 6, 14, and 15 were used for PCA transform as input bands. Table 3 is the eigenvector matrix of the sericite obtained via the PCA method. Given the spectral characteristics of sericite, the coefficient sign at 1 and 14 should be negative and the coefficient sign at 6 and 15 should be positive. Therefore, the PC3 in Table 3 was determined to be the extraction principal component of sericite.
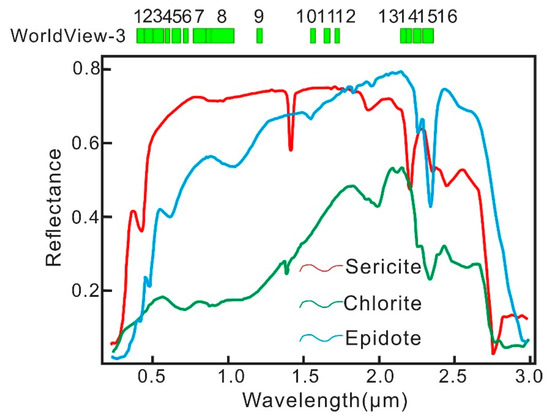
Figure 3.
Spectral curves of sericite, chlorite, and epidote from visible to shortwave infrared spectra in WV-3 data (the spectral curves from the USGS spectral library version 7).
Table 3.
Eigenvector matrix of the sericite obtained via the PCA method.
Similarly, with respect to the chlorite reflectance spectra, chlorite exhibited reflectance peaks at bands 3 and 13 and absorption valleys at bands 5 and 16. Therefore, bands 3, 5, 13, and 16 were used for PCA transform as input bands. Table 4 is the eigenvector matrix of the chlorite by PCA method. Given the spectral characteristics of chlorite, the coefficient sign at 5 and 16 should be negative and the coefficient sign at 3 and 13 should be positive. The negative of PC4 in Table 4 satisfies the above conditions. Thus, the PC4 in Table 4 was determined to be the extraction principal component of chlorite.
Table 4.
Eigenvector matrix of the chlorite by PCA method.
Similarly, with respect to the epidote reflectance spectra, the epidote has reflectance peaks at bands 7 and 13 and absorption valleys at bands 4 and 16. Therefore, 4, 7, 13, and 16 were used for PCA transform as input bands. Table 5 is the eigenvector matrix of the chlorite by PCA method. Given the spectral characteristics of epidote, the coefficient sign at 4 and 16 should be negative and the coefficient sign at 7 and 13 should be positive. The negative of PC4 in Table 5 satisfies the above conditions. Thus, the PC4 in Table 5 was determined to be the extraction principal component of epidote.
Table 5.
Eigenvector matrix of the chlorite by PCA method.
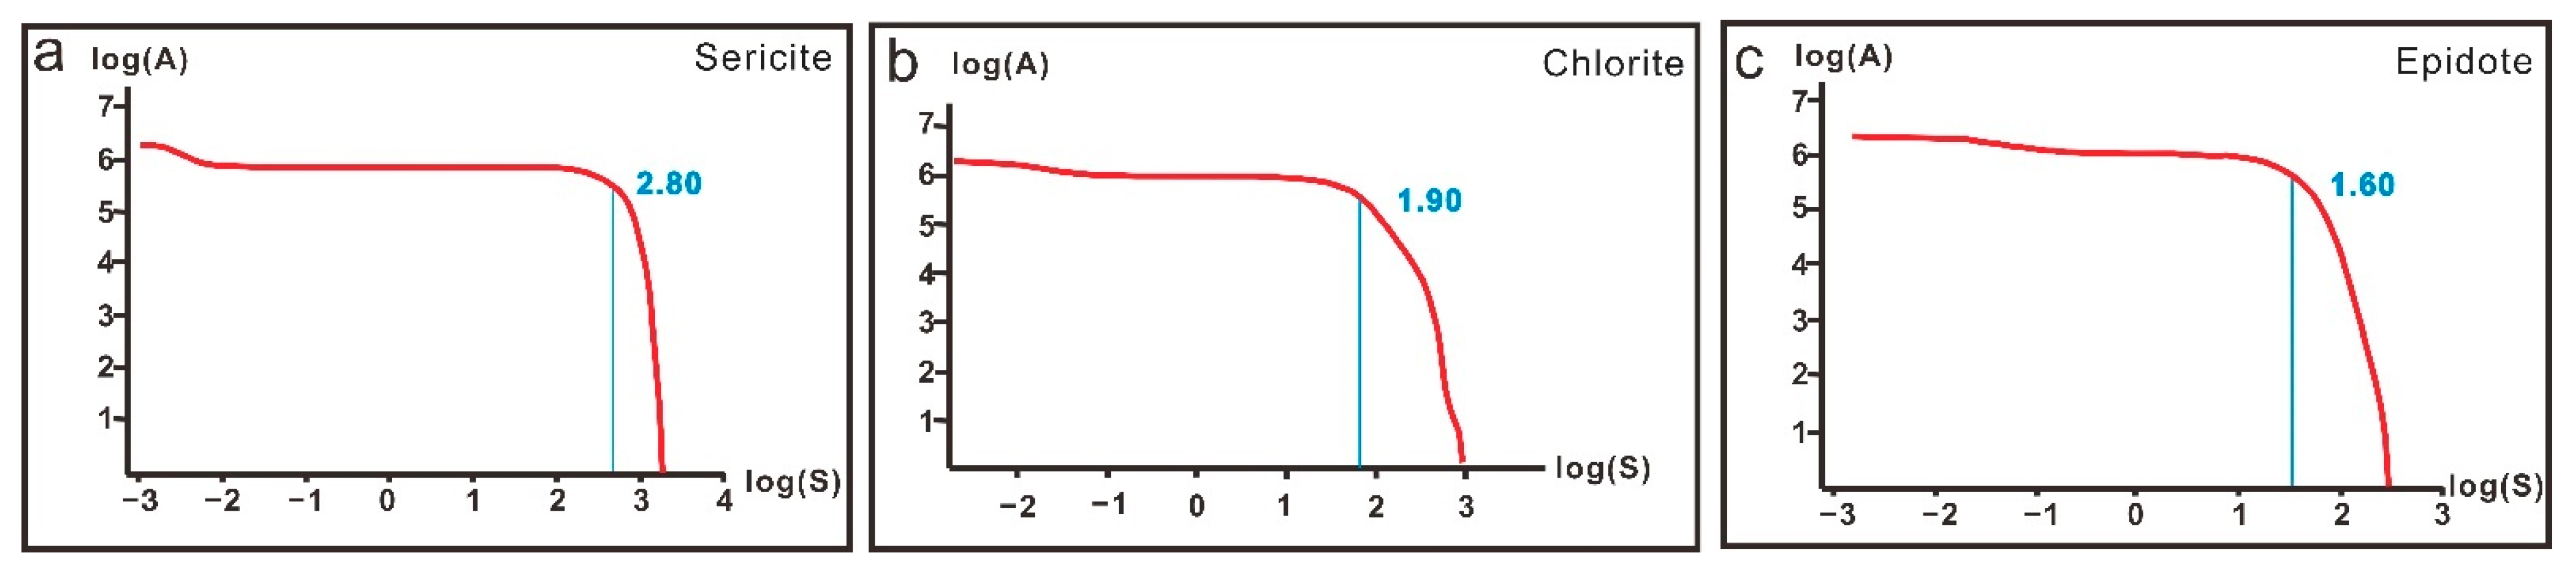
The principal component of relevant alteration minerals was determined using the above treatment and then the S-A method was applied in this principal component to extract refined alteration minerals. The extraction flow of alteration minerals was as follows. First, the determined principal component of alteration minerals was transformed to the frequency domain from the space domain. Second, the log(S)-log(A) diagram was generated, where the frequency value was represented by S and the number of pixels by A, respectively. Third, according to the fractal characteristics of the log-log diagram, the fractal filter threshold of the alteration minerals and the background can be obtained, which is the inflection point of the curve. In this study, the fractal filter thresholds values of sericite, chlorite, and epidote were 2.80, 1.90, and 1.60, respectively; and then the filter was determined with log(S) values exceeding 2.80, 1.90, and 1.60, which represented the sericite, chlorite, and epidote, respectively. Finally, the Inverse Fourier Transform was used to extract the sericite, chlorite, and epidote from the background with the above filter (Figure 4).
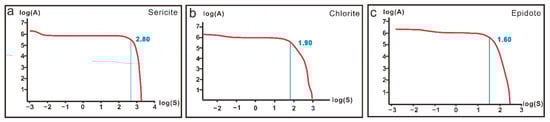
Figure 4.
Log(S)-log(A) diagram of the sericite, chlorite, and epidote. (a) The fractal filter threshold of sericite is 2.80; (b) the fractal filter threshold of chlorite is 1.90; and (c) the fractal filter threshold of epidote is 1.60.
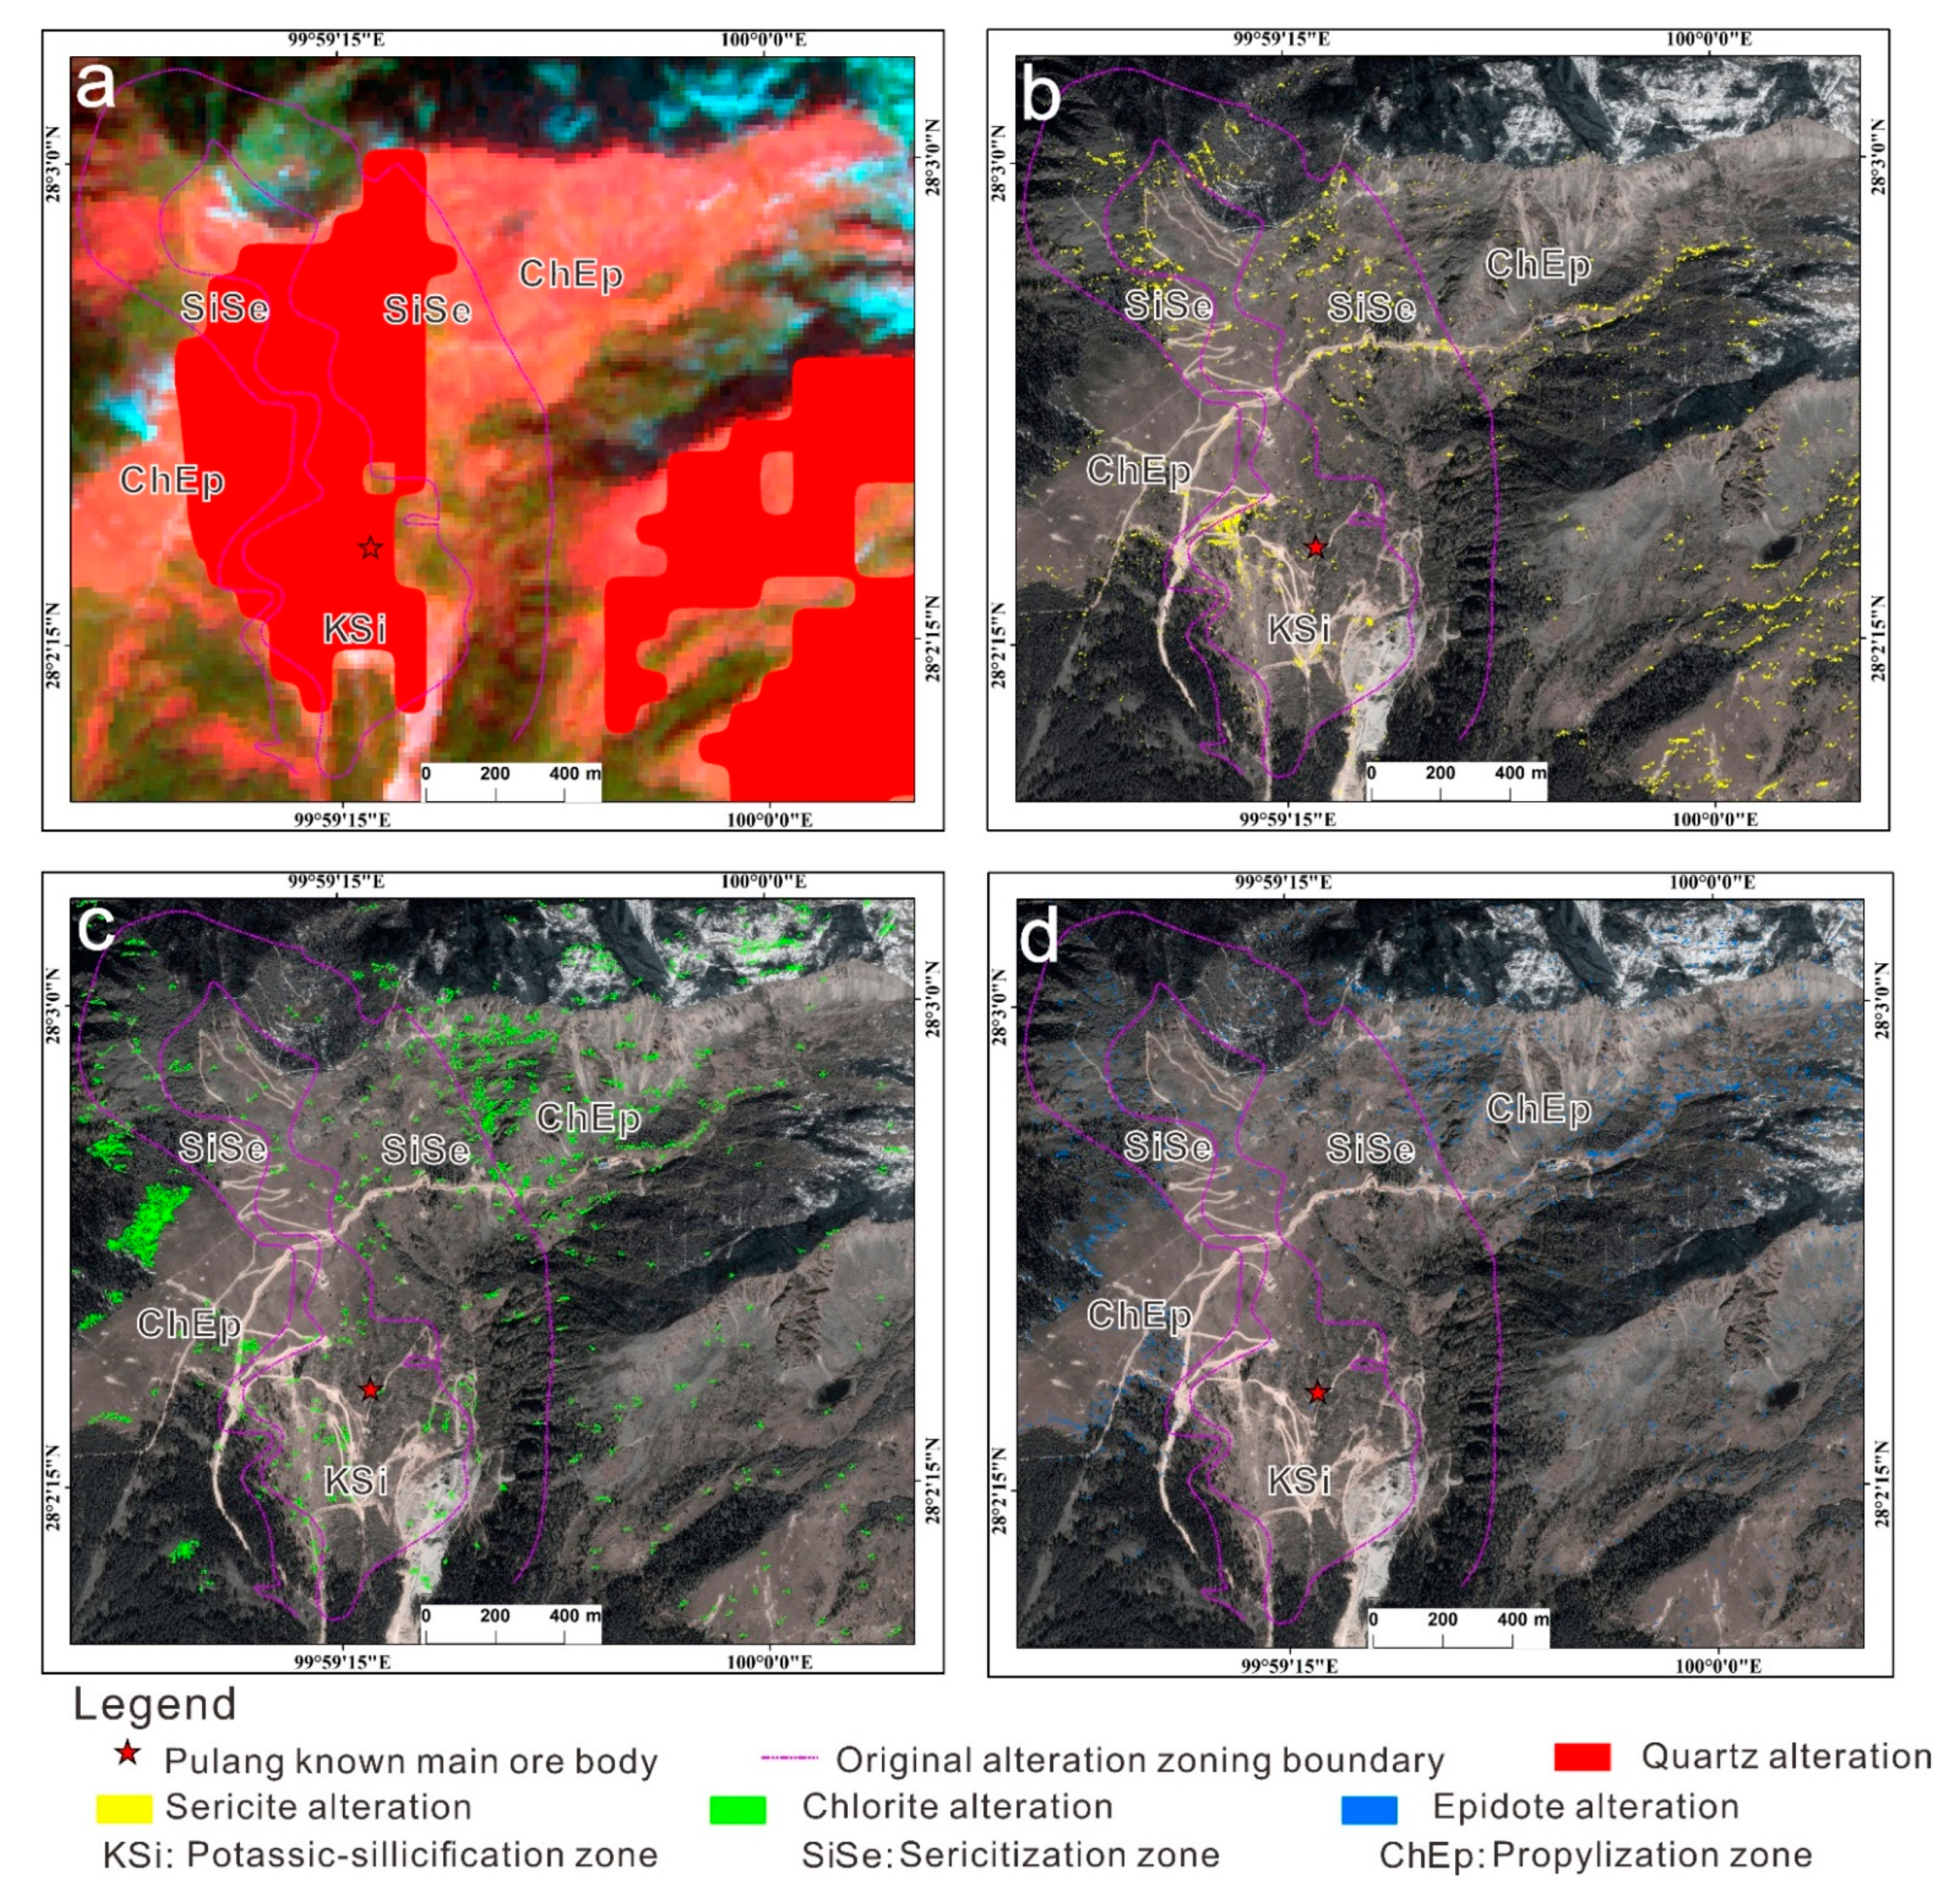
The identification results of the quartz alteration mineral are shown in Figure 5a. Figure 5b–d is the result of hydrothermal alteration minerals extracted using a combination of the PCA and S-A techniques along with WV-3 data. The extracted quartz alteration minerals are mainly concentrated in the inner part and southeastern region of the Pulang’s main ore body (Figure 5a); the extracted sericite alteration minerals are mainly distributed in the inner part, northeastern region, and southeastern region of the Pulang’s main ore body (Figure 5b); whereas the extracted chlorite and epidote alteration minerals are widely distributed in the outer part and northeastern region of the Pulang’s main ore body (Figure 5c,d).
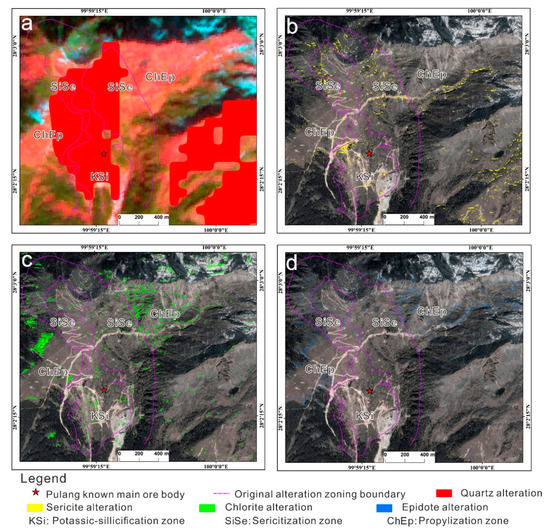
Figure 5.
Extraction results of alteration minerals with ASTER and WV-3 data. (a) Quartz alteration; (b) sericite alteration; (c) chlorite alteration; (d) epidote alteration; the background of a is Band 6(R) 3(G) 2(B) composite image of ASTER data; the background of (b–d) is Band 5(R) 3(G) 2(B) composite image of WorldView-3 data.
4. Discussion
4.1. Indications of Alteration Minerals to Faults
The structure comprises ore-guiding channels and favorable locations for ore fluid enrichment, which provides an important channel and place for ore formation. The ore-forming process is often accompanied by mineralization alteration. Therefore, the structure and mineralization alteration are closely related. The high frequency areas of the intersection of the line and ring structure are well correlated with the areas where the alteration information is most widely distributed [71], and most alteration information is distributed linearly along the structure [72].
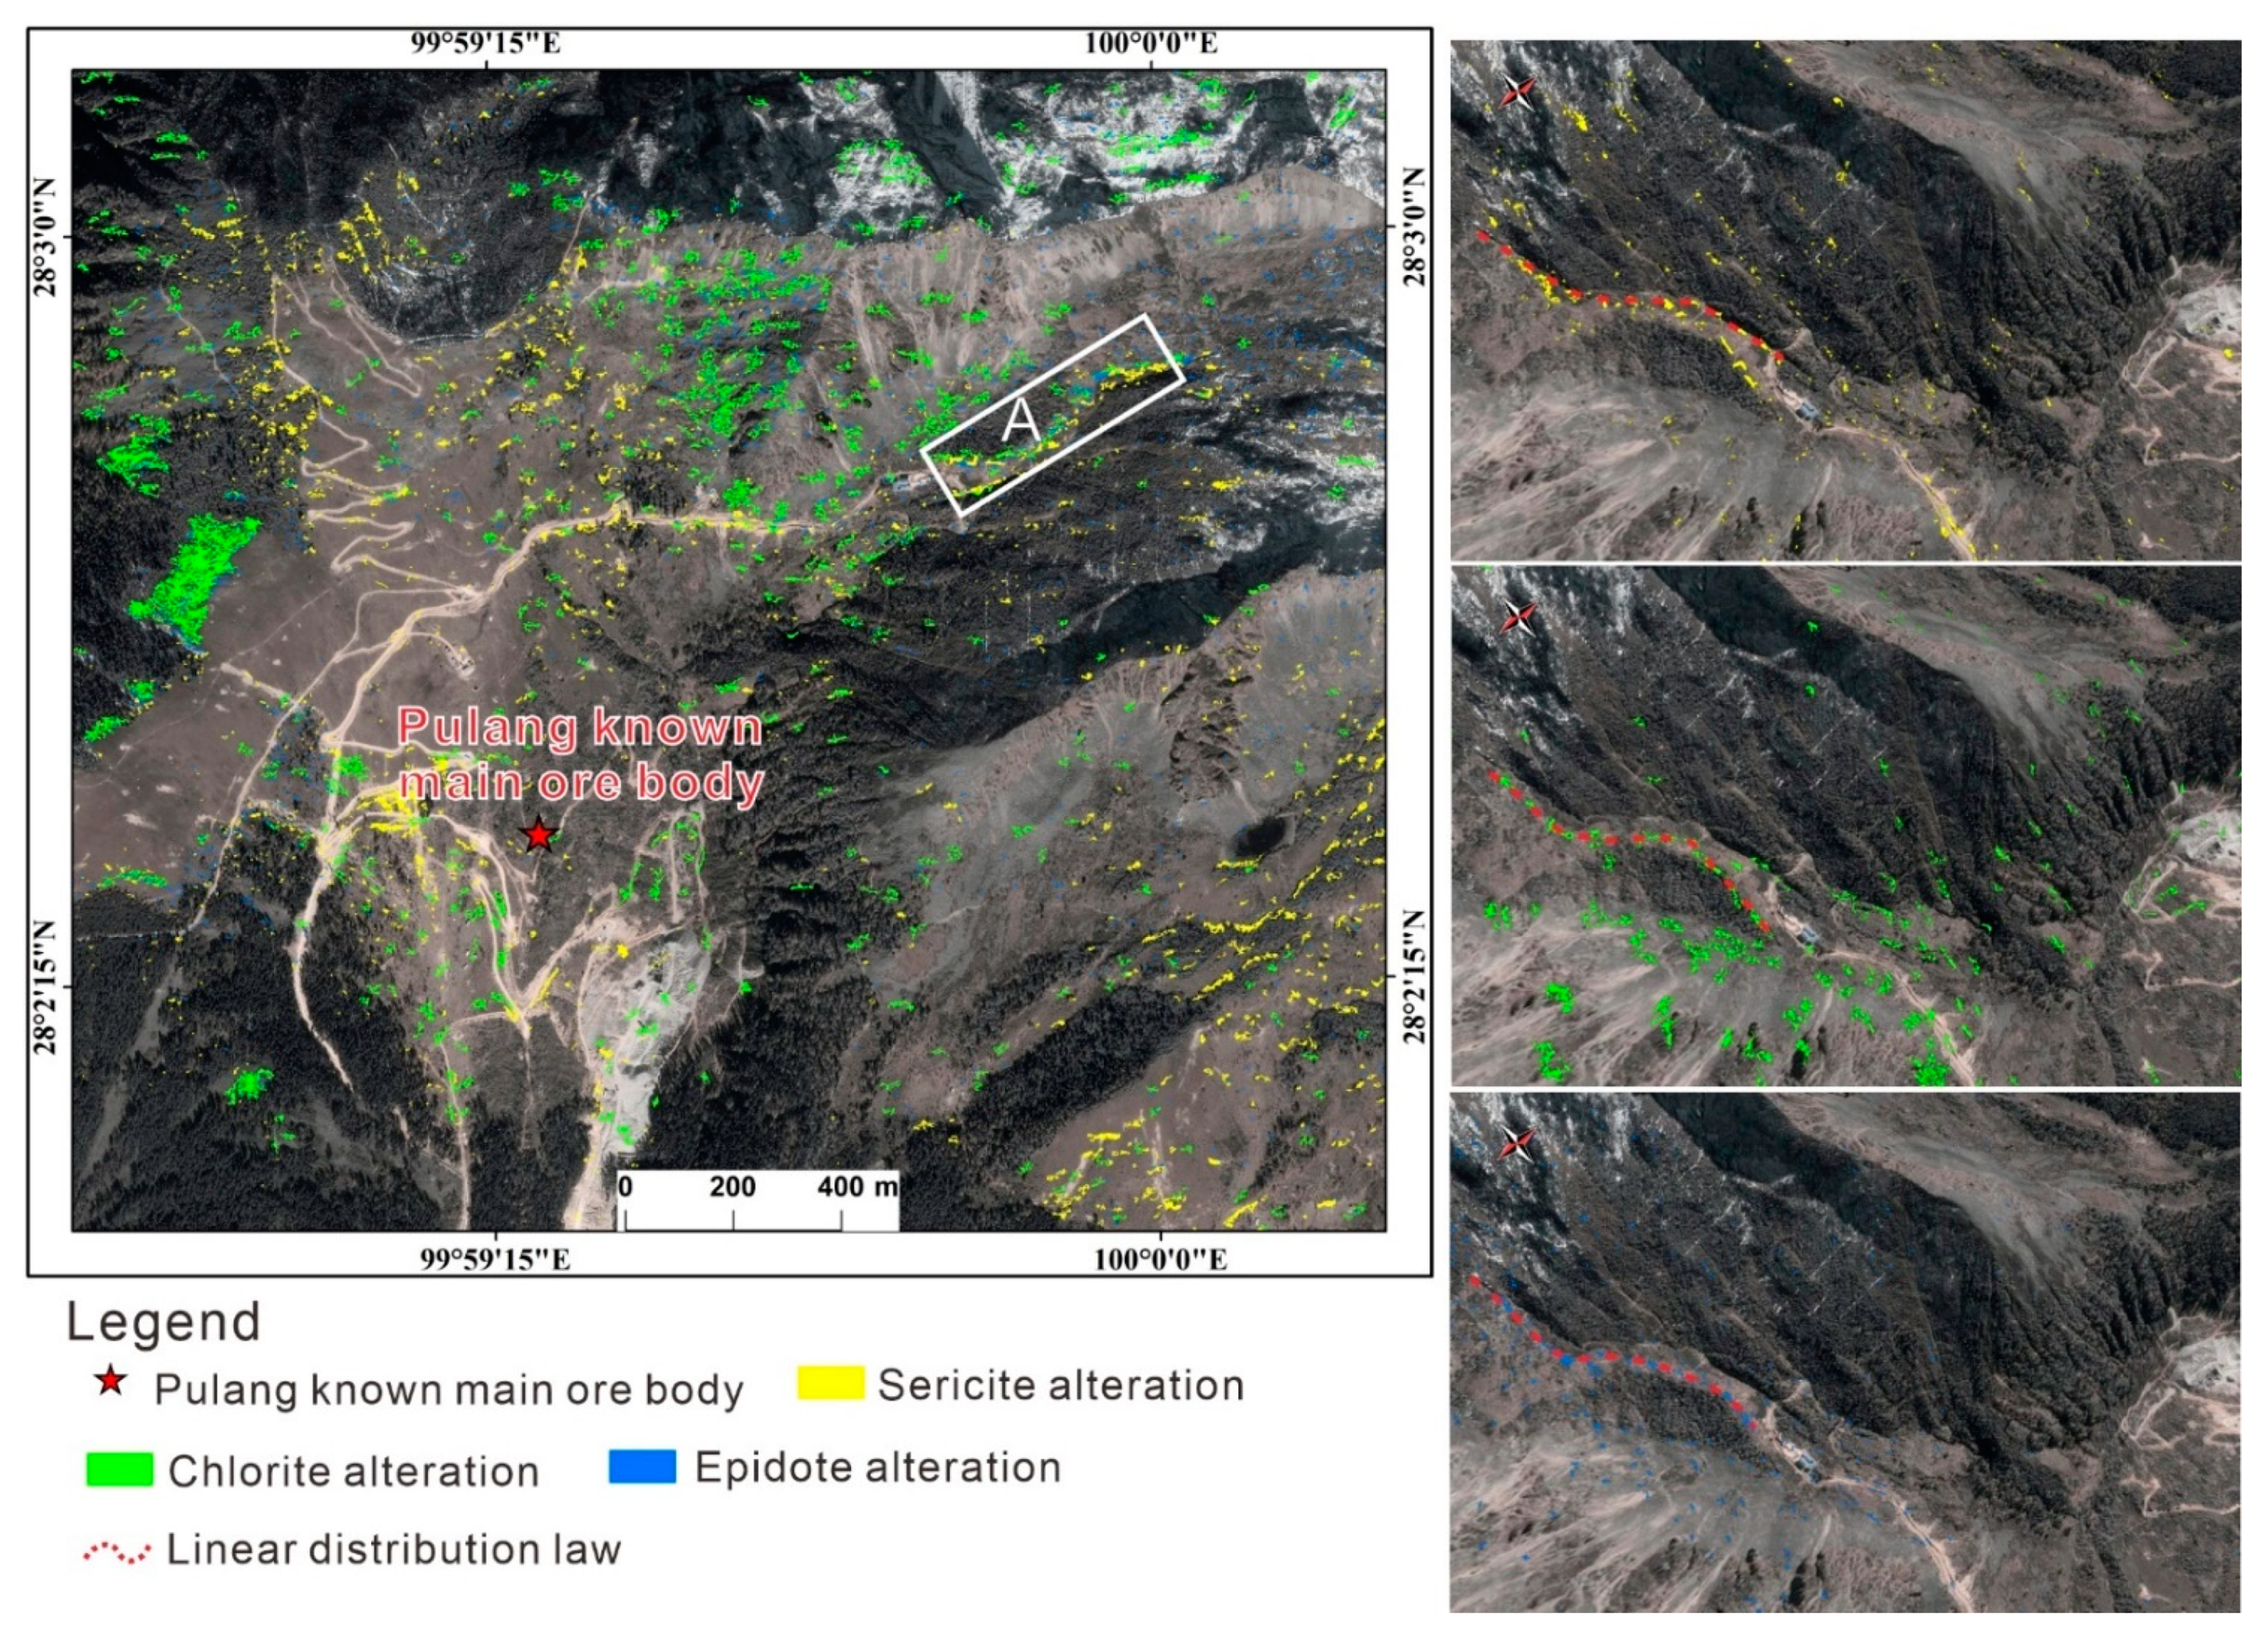
In-depth analysis of the sericite, epidote, and chlorite alteration minerals extracted by WV-3 data showed that sericite, epidote, and chlorite alteration minerals are exposed in area A on the northeast side of the Pulang’s main ore body, based on a certain linear distribution law (Figure 6). Therefore, it is speculated that there may be a fault in this area. The fault distribution trace was interpreted using 3D reconstruction technology of the remote sensing image, combined with the distribution law of sericite, chlorite, and epidote, and image characteristics (Figure 7).
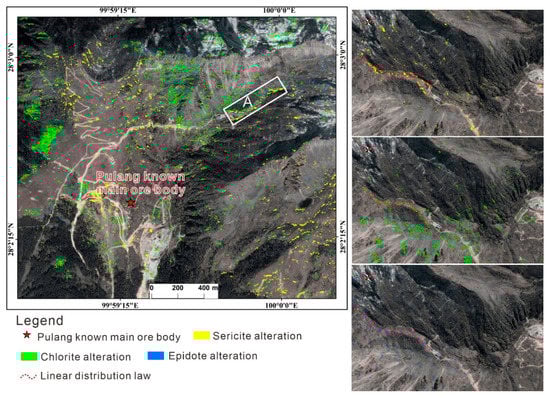
Figure 6.
Distribution characteristics of alteration minerals extracted from area A and their linear patterns.
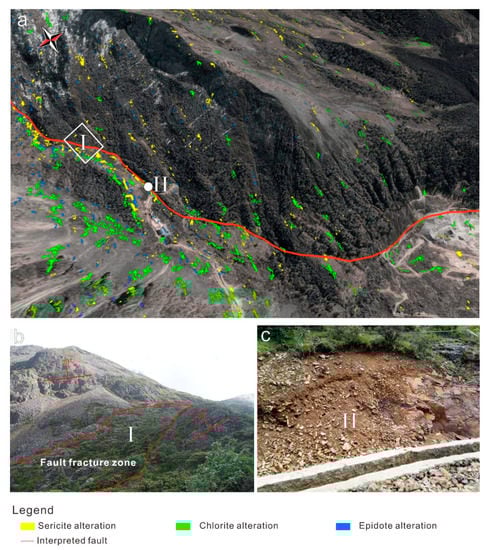
Figure 7.
3D reconstruction of the remote sensing image and the field validation of the speculated fault. (a) 3D reconstruction of the remote sensing image and the speculated fault; (b) the field validation of the fault trace; (c) the outcrop of the fault).
To verify the presence of the fault, a special field survey was conducted in October 2018. The fault trace was found at point I and the outcrop of the fault fracture zone at point II (Figure 7). Field investigation and analysis confirmed the presence of a NE-trending normal fault passing through this region.
4.2. Reconstruction of Alteration Zoning in Pulang Copper Deposit
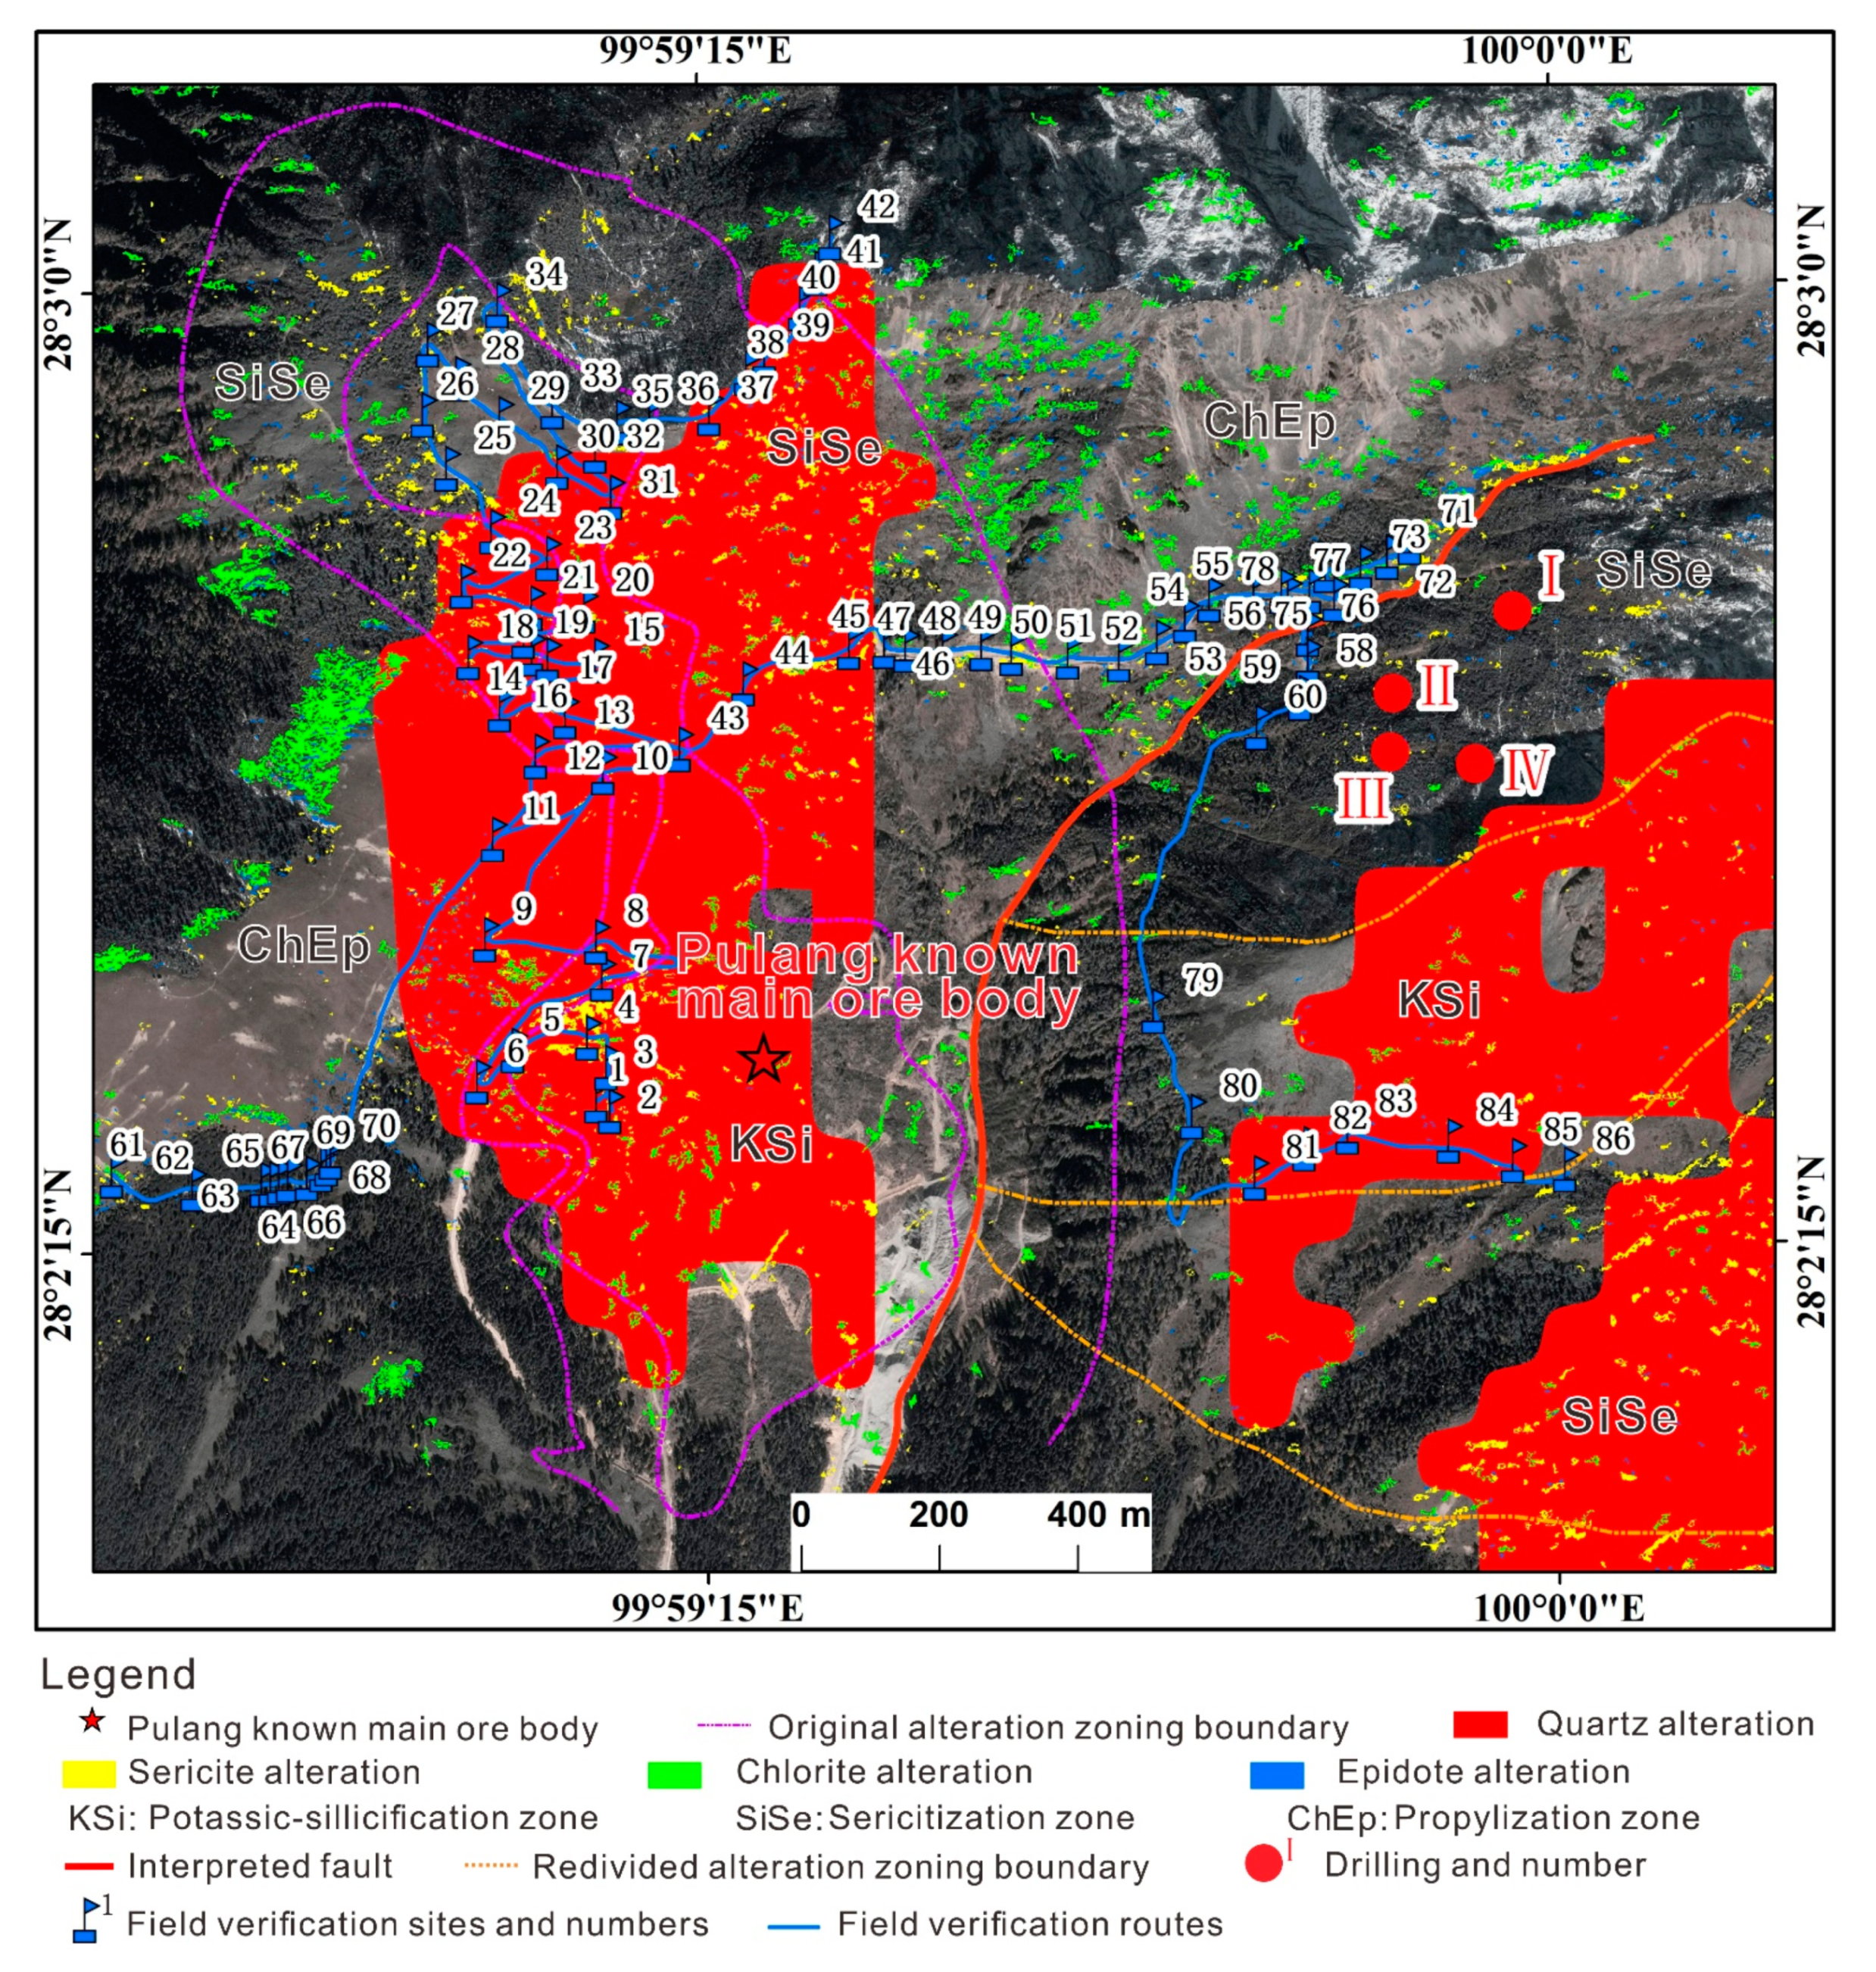
With respect to alteration minerals mapping, the alteration zoning rule of the Pulang PCD was previously believed to be basically similar to the common porphyry deposits, with typical potassic-silicified, phyllic, and propylitic zones from the center to the outward sections. The purple line in Figure 8 is the boundary of the alteration zone divided by the ground alteration minerals mapping.
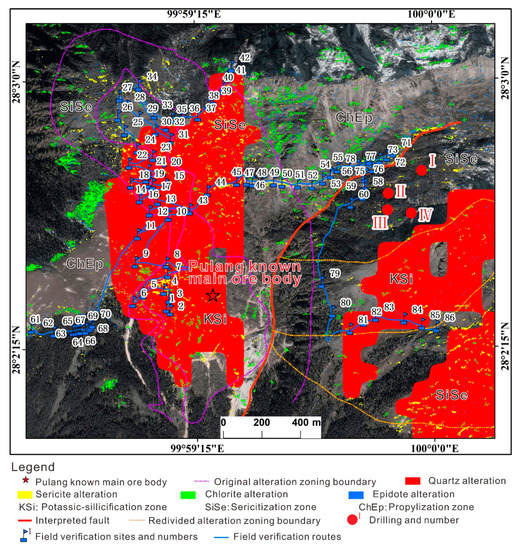
Figure 8.
Redivision of alteration zoning of Pulang PCD.
Comparison of the extracted alteration minerals with the original alteration zoning boundary shows that the distribution of the extracted quartz, sericite, chlorite, and epidote alteration minerals in the Pulang’s main ore body are basically consistent with the alteration zoning divided by the original alteration mapping. However, in the eastern region of Pulang’s main ore body where the alteration zone is classified as propylitic by the original alteration mapping, a large amount of quartz and sericite alteration minerals belonging to the potassic-silicification and phyllic zones were extracted. The phenomenon is inconsistent with the previous understanding of alteration minerals mapping.
Combined with the predicted fault trace, Pulang’s main ore body comprised the upper wall of the fault, while the area on the east side of the fault comprised the footwall, and Pulang’s main ore body slipped from the eastern side of the fault to the present position. It is inferred that there are two mineralization alteration centers in the Pulang PCD, which are located on both sides of the fault, and that both exhibit potassic-silicification, phyllic, and propylitic alteration zoning characteristics from the inside to the outside sections. The yellow line in Figure 8 is a newly established alteration zoning boundary.
To verify the redivided alteration zoning of Pulang PCD, 86 field sites were designed for field investigation in October 2018 according to the distribution characteristics of extracted alteration minerals. This process included GPS location, lithology identification, sample collection, and photo shooting, and indoor thin section production and petrographic analysis were performed on the collected samples (Table 6).
Table 6.
Field verification survey for the redivided alteration zone.
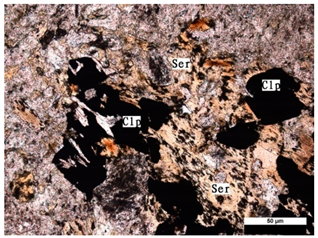
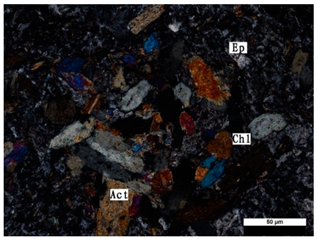
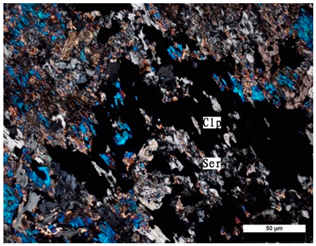
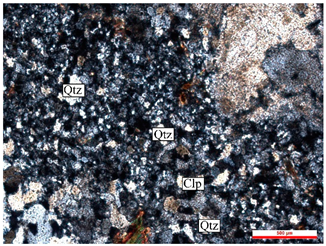
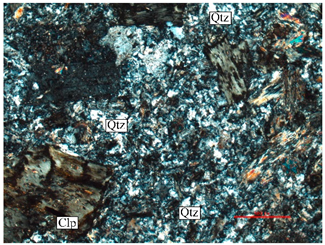
Field verification points 43, 47, and 51, located in Pulang’s main ore body, belong to the redivided potassic-silicification, phyllic, and propylitic zones, respectively, which is consistent with previous alteration minerals mapping recognition. Field investigation and petrographic analysis show that field verification points 43, 47, and 51 have the alteration characteristics of potassic-silicified, phyllic, and propylitic zones, respectively (Table 6).
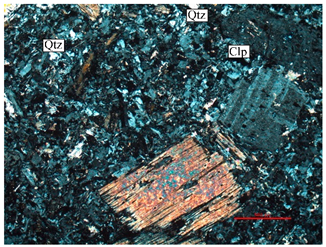
Among field verification points 59, 82, 83, and 85 located in the eastern region of Pulang’s main ore body, all of them are inconsistent with the previous alteration minerals mapping. In the redivided alteration zone, point 59 belongs to the phyllic zone, and points 82, 83, and 85 belong to the potassic-silicification zone, which is inconsistent with the determination of their classification as being the propylitic zone in previous alteration mineral mapping. Petrographic analysis shows that the sample collected at point 59 has the alteration characteristics of the phyllic zone, and the samples collected at points 82, 83, and 85 exhibit the alteration characteristics of the potassium-silicification zone (Table 6). In conclusion, compared with the alteration zoning of the original alteration mineral mapping, the newly redivided alteration zoning of Pulang PCD according to the extracted alteration minerals was more consistent with the field verification results.
4.3. Delineation of Prospecting Potential Areas
According to previous studies, the potassic-silicification and phyllic zones are important indicators for the prospecting of high-grade porphyry copper. This study speculated that the redivided potassic-silicification and phyllic zones in the eastern region of the Pulang’s main ore body have great prospecting potential; particularly, the boundary of the potassic-silicification and phyllic zones has the greatest prospecting potential.
Owing to the complicated terrain and traffic conditions, only a few drillings have been arranged in the eastern region of the Pulang’s main ore body. Four drilling data have been collected in this study. According to the previous alteration mineral mapping, this area is classified under the propylitic zone, and the formation of high grade copper is limited. However, analysis of the copper mineralization of the four drillings shows the presence of copper resources at the locations of the four drillings, which are mainly located at depths of 200–430 m. Copper mineralization improves with increasing depth, and the copper grade increases from 0.1 to approximately 0.4%, which is consistent with the division of this area into prospecting potential zones.
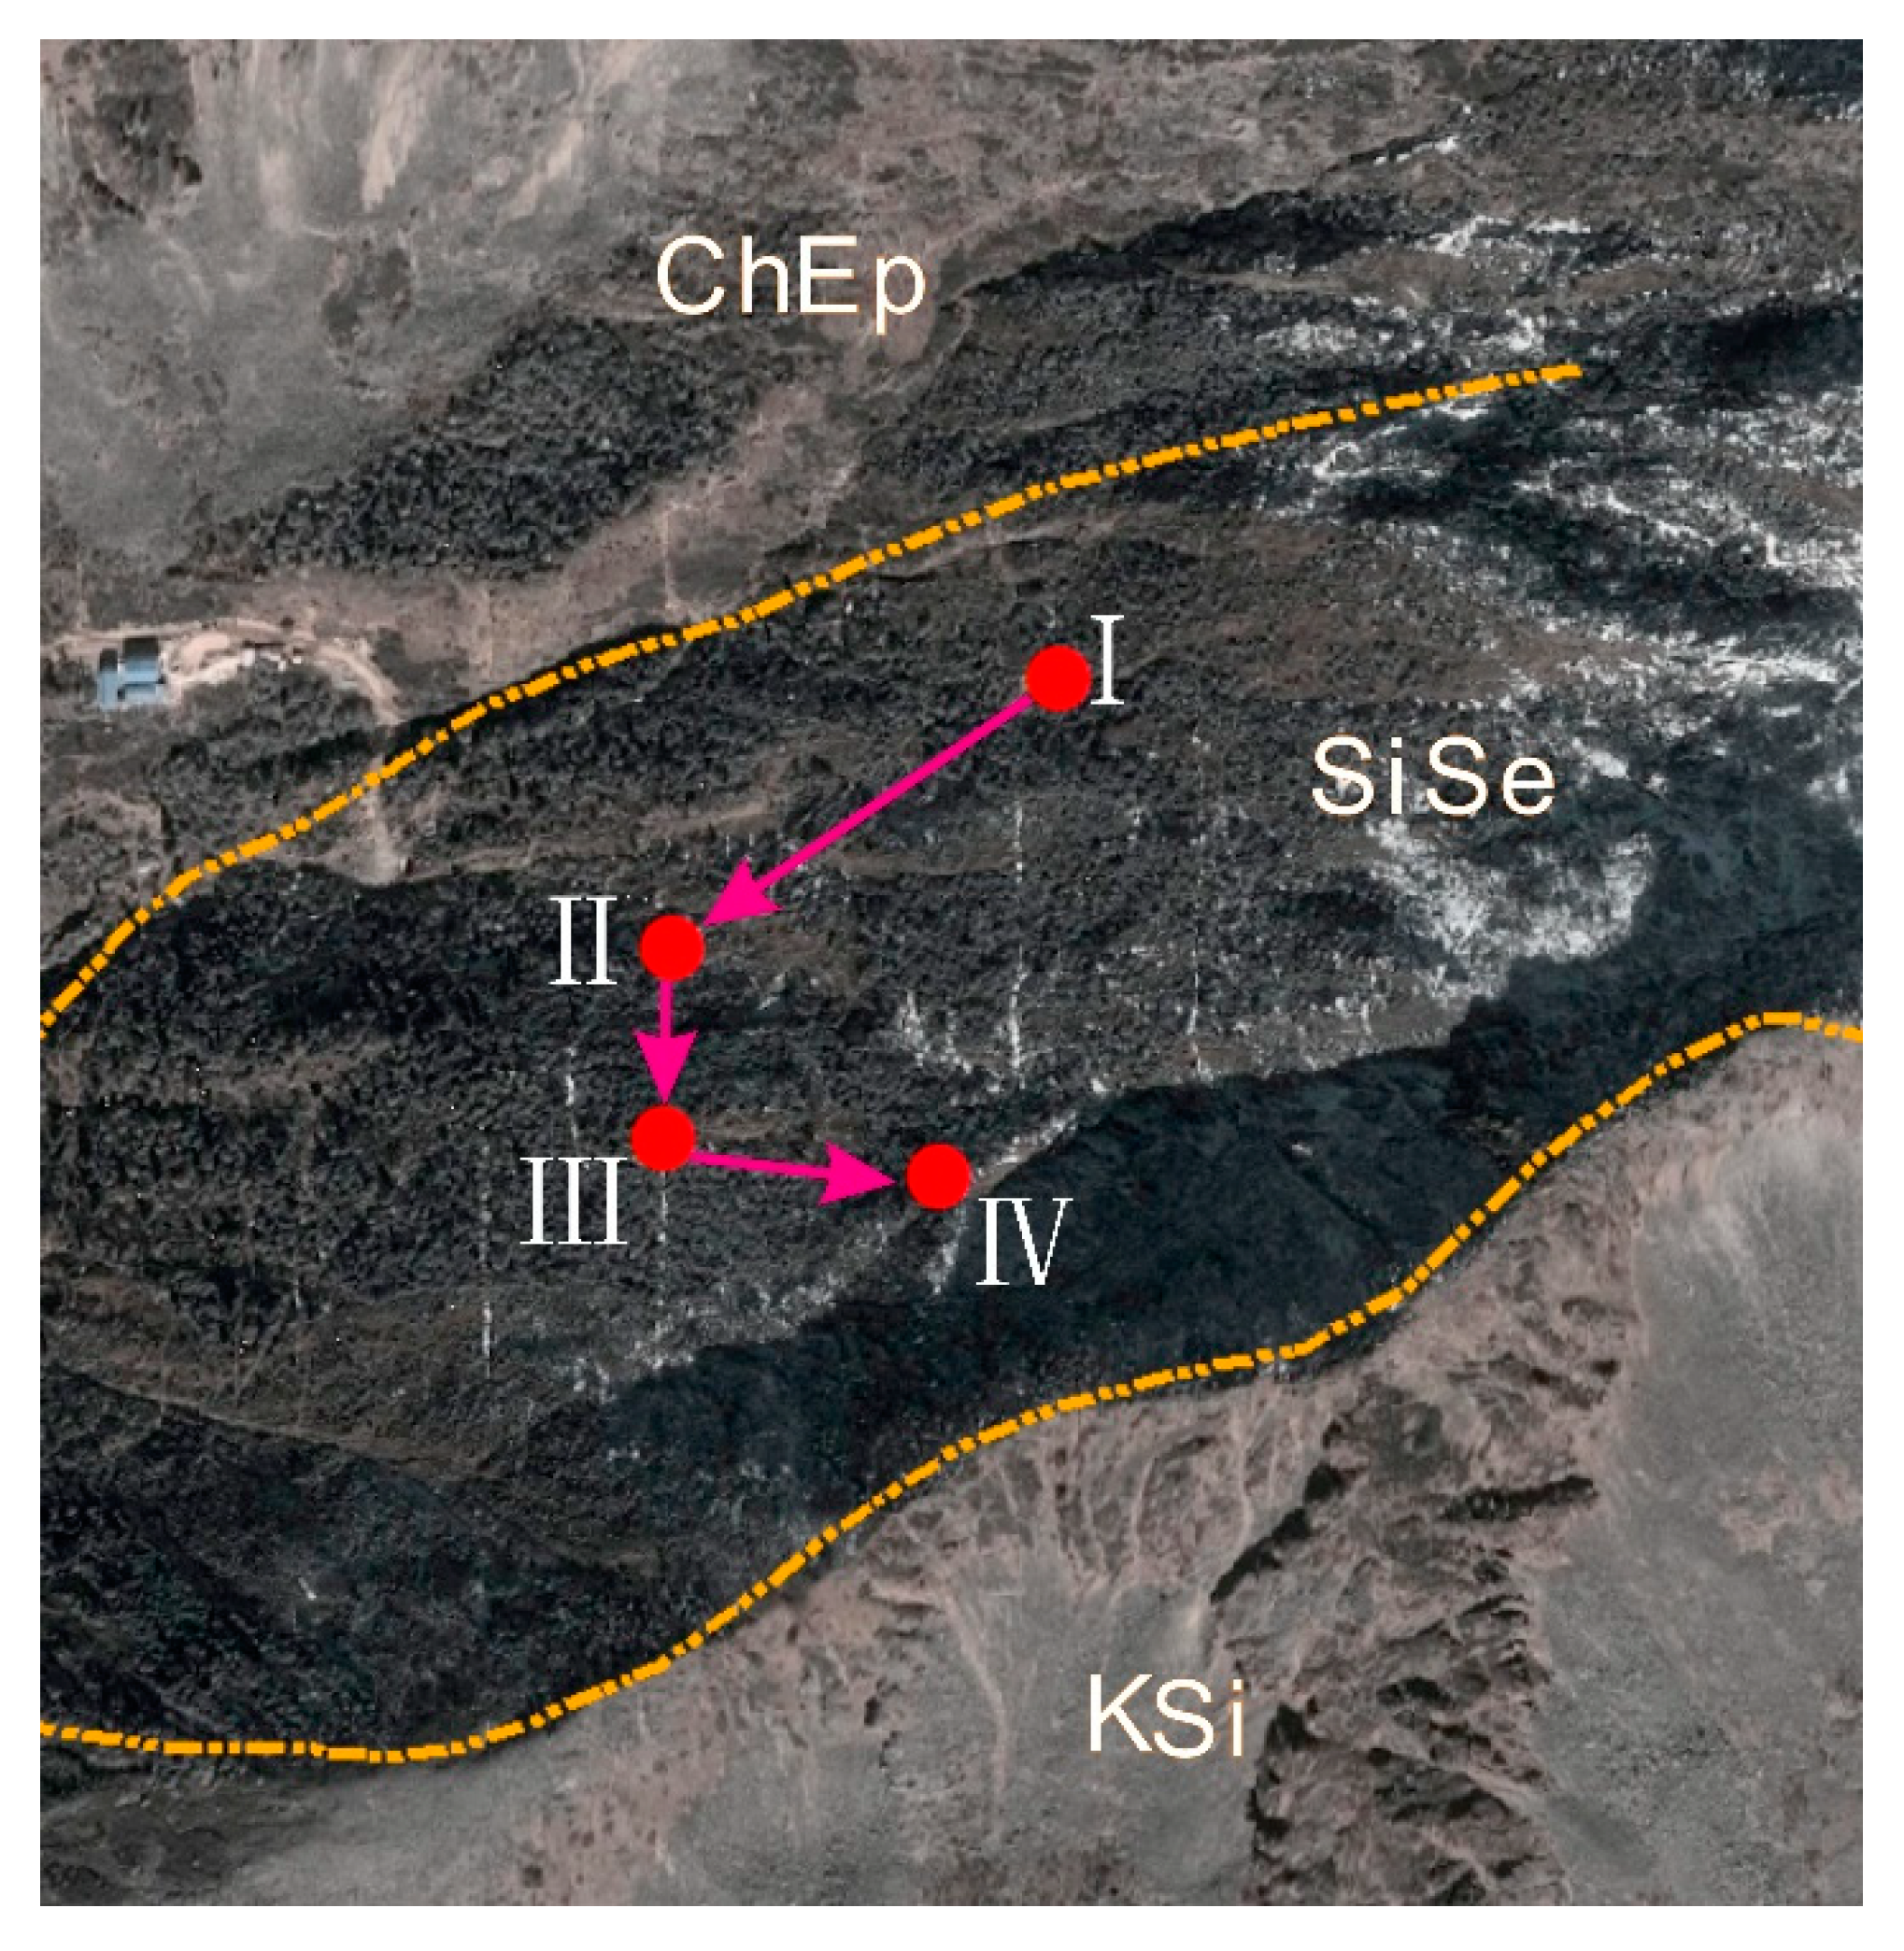
In addition, analysis of the positions of the four aforementioned drillings in the redivided alteration zone (Figure 9) shows that from drilling I to drilling IV, the location of the drilling gradually approached from the phyllic zone to the edge of the potassium-silicification zone. The phyllic zone is an important ore-forming site, and formation of the enriched industrial ore body becomes easier as proximity to the potassic-silicification zone increases. The mineralization enrichment phenomenon should improve increasingly from drilling I to drilling IV, which is consistent with the collected drilling data: drillings I and II begin mineralization at a depth of approximately 200 m, drilling III starts mineralization at a depth of 80 m, and drilling IV starts mineralization from the surface. Therefore, the above analysis verifies the reliability of the redivided alteration zoning in this study.
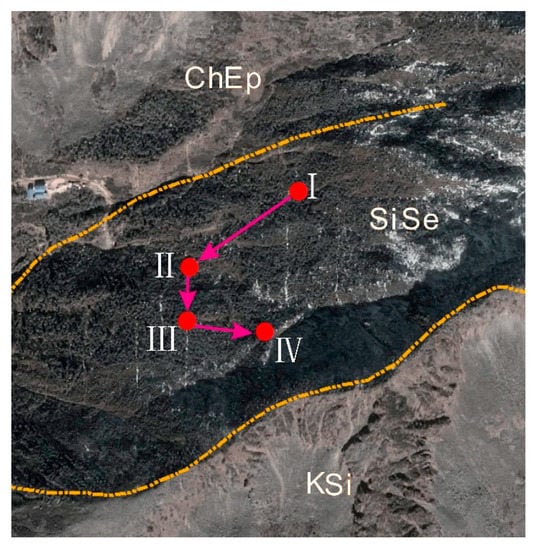
Figure 9.
Analysis diagram of correlation between the four drillings and the new alteration zoning. I–IV: drilling numbers; KSi: potassic-silicification zone; SiSe: phyllic zone; ChEp: propylization zone.
5. Conclusions
Through in-depth analysis of the alteration minerals extracted by ASTER and WV-3 data in Pulang PCD, new insight into the metallogenic structure and spatial distribution of alteration zoning in Pulang PCD is presented and adequately verified in the field.
- (1)
- A new NE-trending normal fault passing through the northeast of Pulang PCD was discovered;
- (2)
- The alteration zoning of Pulang PCD was redivided. With two mineralization alteration centers located on both sides of the fault in Pulang PCD, and alteration zoning characteristics of the potassic-silicified, phyllic, and propylitic zones from the inside to the outside were identified in the Pulang PCD.
- (3)
- At the junction of the redivided potassic-silicification and phyllic zones of Pulang PCD, the favorable prospecting potential areas were delineated.
Author Contributions
Conceptualization, Z.Z. and Q.C.; Methodology, Q.C., Software, Q.C., and X.Z.; Formal Analysis, Q.C., Resources, Z.Z.; Data Curation, Q.C.; Writing—Original Draft Preparation, Q.C.; Writing Review & Editing, T.S., J.Z. and M.Z.; Funding Acquisition, Z.Z. and J.X. All authors have read and agreed to the published version of the manuscript.
Funding
This study was funded by “National Natural Science Foundation of China” (Grant No.41462015, 41872251 and 42061038), “Monitoring the environment of mining regions of Yunnan” (Grant No.1212011220075), “the Joint Fund of Science Technology Department of Yunnan Province and Yunnan University (Grant No.2018FY001(-019))” and “the 12th Postgraduate Scientific Research Innovation Project of Yunnan University (Grant No. 2020192)”.
Institutional Review Board Statement
Not applicable.
Informed Consent Statement
Informed consent was obtained from all subjects involved in the study.
Data Availability Statement
The data presented in this study are available upon request from the corresponding author.
Acknowledgments
The authors would like to thank the anonymous reviewers for providing valuable feedback on the manuscript.
Conflicts of Interest
The authors declare no conflict of interest.
References
- Sillitoe, R. Porphyry copper systems. Econ. Geol. 2010, 105, 3–41. [Google Scholar] [CrossRef] [Green Version]
- Wang, P.; Dong, G.C.; Zhao, G.C.; Han, Y.G.; Li, Y.P. Petrogenesis of the Pulang porphyry complex, southwestern China: Implications for porphyry copper metallogenesis and subduction of the Paleo-Tethys Oceanic lithosphere. Lithos 2018, 304–307, 280–297. [Google Scholar] [CrossRef]
- Hu, Q.H.; Zhang, S.Q.; Yin, J.; Huang, D.Z.; Wu, J.J.; Meng, Q.; Yang, L.M.; Luo, G.M. Preliminary study on wall rock alteration of the Pulang Porphyry Copper Deposit in Zhongdian. Bull. Mineral. Geochem. 2010, 29, 192–201, (In Chinese with English abstract). [Google Scholar]
- Liu, H.; Wang, Q.F.; Zhang, C.Q.; Lou, D.B.; Zhou, Y.M.; He, Z.H. Spatial pattern and dynamic control for mineralization in the Pulang porphyry copper deposit, Yunnan, SW China: Perspective from fractal analysis. J. Geochem. Explor. 2016, 164, 42–53. [Google Scholar] [CrossRef]
- Lowell, J.D.; Guilbert, J.M. Lateral and vertical alteration mineralization zoning in porphyry ore deposits. Econ. Geol. 1970, 65, 373–408. [Google Scholar] [CrossRef]
- Sabins, F.F. Remote sensing for mineral exploration. Ore Geol. Rev. 1999, 14, 157–183. [Google Scholar] [CrossRef]
- Xu, K.; Wang, X.F.; Kong, C.F.; Feng, R.Y.; Liu, G.; Wu, C.L. Identification of hydrothermal alteration minerals for exploring gold deposits based on SVM and PCAU sing ASTER Data: A case study of gulong. Remote Sens. 2019, 11, 3003. [Google Scholar] [CrossRef] [Green Version]
- Pour, A.B.; Park, T.-Y.S.; Park, Y.; Hong, J.K.; Muslim, A.M.; Läufer, A.; Crispini, L.; Pradhan, B.; Zoheir, B.; Rahmani, O.; et al. Landsat-8, advanced spaceborne thermal emission and reflection radiometer, and WorldView-3 multispectral satellite imagery for prospecting copper-gold mineralization in the northeastern Inglefield Mobile Belt (IMB), Northwest Greenland. Remote Sens. 2019, 11, 2430. [Google Scholar] [CrossRef] [Green Version]
- Leverington, D.W.; Moon, W.M. Landsat-TM-Based discrimination of Lithological units associated with the Purtuniq ophiolite, Quebec, Canada. Remote Sens. 2012, 4, 1208–1231. [Google Scholar] [CrossRef] [Green Version]
- Pour, B.A.; Hashim, M.; van Genderen, J. Detection of hydrothermal alteration zones in a tropical region using satellite remote sensing data: Bau gold field, Sarawak, Malaysia. Ore Geol. Rev. 2013, 54, 181–196. [Google Scholar] [CrossRef]
- Gabr, S.S.; Hassan, S.M.; Sadek, M.F. Prospecting for new gold-bearing alteration zones at El-Hoteib area, South Eastern Desert, Egypt, using remote sensing data analysis. Ore Geol. Rev. 2015, 71, 1–13. [Google Scholar] [CrossRef]
- Guha, A.; Yamaguchi, Y.; Chatterjee, S.; Rani, K.; Vinod Kumar, K. Emittance spectroscopy and broadband thermal remote sensing applied to phosphorite and its utility in geoexploration: A study in the parts of Rajasthan, India. Remote Sens. 2019, 11, 1003. [Google Scholar] [CrossRef] [Green Version]
- Pour, A.B.; Park, T.S.; Park, Y.; Hong, J.K.; Zoheir, B.; Pradhan, B.; Ayoobi, I.; Hashim, M. Application of multi-sensor satellite data for exploration of Zn-Pb sulfide mineralization in the Franklinian Basin, North Greenland. Remote Sens. 2018, 10, 1186. [Google Scholar]
- Salehi, T.; Tangestani, M.H. Large-scale mapping of iron oxide and hydroxide minerals of Zefreh porphyry copper deposit, using Worldview-3 VNIR data in the Northeastern Isfahan, Iran. Int. J. Appl. Earth Obs. Geoinf. 2018, 73, 156–169. [Google Scholar] [CrossRef]
- Pour, A.B.; Hashim, M.; Hong, J.K.; Park, Y. Lithological and alteration mineral mapping in poorly exposed lithologies using Landsat-8 and ASTER satellite data: North-eastern Graham Land, Antarctic Peninsula. Ore Geol. Rev. 2019, 108, 112–133. [Google Scholar] [CrossRef]
- Zoheir, B.; Emam, A.; Abdel-Wahed, M.; Soliman, N. Multispectral and radar data for the setting of gold mineralization in the South Eastern Desert, Egypt. Remote Sens. 2019, 11, 1450. [Google Scholar] [CrossRef] [Green Version]
- Bedini, E. Application of WorldView-3 imagery and ASTER TIR data to map alteration minerals associated with the Rodalquilar gold deposits, southeast Spain. Adv. Space Res. 2019, 63, 3346–3357. [Google Scholar] [CrossRef]
- Pour, A.B.; Hashim, M.; Park, Y.; Hong, J.K. Mapping alteration mineral zones and lithological units in Antarctic regions using spectral bands of ASTER remote sensing data. Geocarto Int. 2018, 33, 1281–1306. [Google Scholar] [CrossRef]
- Amer, R.; El Mezayen, A.; Hasanein, M. ASTER spectral analysis for alteration minerals associated with gold mineralization. Ore Geol. Rev. 2016, 75, 239–251. [Google Scholar] [CrossRef]
- Testa, F.J.; Villanueva, C.; Cooke, D.R.; Zhang, L. Lithological and hydrothermal alteration mapping of epithermal, porphyry and tourmaline breccia districts in the Argentine Andes using ASTER imagery. Remote Sens. 2018, 10, 203. [Google Scholar] [CrossRef] [Green Version]
- Sheikhrahimi, A.; Pour, B.A.; Pradhan, B.; Zoheir, B. Mapping hydrothermal alteration zones and lineaments associated with orogenic gold mineralization using ASTER remote sensing data: A case study from the Sanandaj-Sirjan Zone, Iran. Adv. Space Res. 2019, 63, 3315–3332. [Google Scholar] [CrossRef]
- Noori, L.; Pour, B.A.; Askari, G.; Taghipour, N.; Pradhan, B.; Lee, C.-W.; Honarmand, M. Comparison of different algorithms to map hydrothermal alteration zones using ASTER remote sensing data for polymetallic vein-type ore exploration: Toroud–Chahshirin Magmatic Belt (TCMB), North Iran. Remote Sens. 2019, 11, 495. [Google Scholar] [CrossRef] [Green Version]
- Dong, P. A test study on alteration mapping using Landsat TM data and geographic information system. In Methodology and Practice of Remote Sensing for Mineral Exploration; Science Press: Beijing, China, 1995; pp. 24–28. [Google Scholar]
- Pour, A.B.; Park, Y.; Crispini, L.; Läufer, A.; Hong, J.K.; Park, T.-Y.S.; Zoheir, B.; Pradhan, B.; Muslim, A.M.; Hossain, M.S.; et al. Mapping listvenite occurrences in the damage zones of Northern Victoria Land, Antarctica using ASTER satellite remote sensing data. Remote Sens. 2019, 11, 1408. [Google Scholar]
- Hunt, G.R.; Ashley, R.P. Spectra of altered rocks in the visible and near-infrared. Econ. Geol. 1979, 74, 1613–1629. [Google Scholar] [CrossRef]
- Clark, R.N. Spectroscopy of rocks and minerals, and principles of spectroscopy. In Manual of Remote Sensing; Rencz, A., Ed.; Wiley and Sons Inc.: New York, NY, USA, 1999; Volume 3, pp. 3–58. [Google Scholar]
- Cloutis, E.A.; Hawthorne, F.C.; Mertzman, S.A.; Krenn, K.; Craig, M.A.; Marcino, D.; Methot, M.; Strong, J.; Mustard, J.F.; Blaney, D.L. Detection and discrimination of sulfate minerals using reflectance spectroscopy. Icarus 2006, 184, 121–157. [Google Scholar] [CrossRef]
- Ninomiya, Y.; Fu, B. Thermal infrared multispectral remote sensing of lithology and mineralogy based on spectral properties of materials. Ore Geol. Rev. 2019, 108, 54–72. [Google Scholar] [CrossRef]
- Salisbury, J.W.; D’Aria, D.M. Emissivity of terrestrial material in the 8–14 µm atmospheric window. Remote Sens. Environ. 1992, 42, 83–106. [Google Scholar] [CrossRef]
- Salisbury, J.W.; Walter, L.S. Thermal infrared (2.5–13.5 µm) spectroscopic remote sensing of igneous rock types on particulate planetary surfaces. J. Geophys. Res. 1989, 94, 9192–9202. [Google Scholar] [CrossRef]
- Ninomiya, Y. Quantitative estimation of SiO2 content in igneous rocks using thermal infrared spectra with a neural network approach. IEEE Trans. Geosci. Remote Sens. 1995, 33, 684–691. [Google Scholar] [CrossRef]
- Ninomiya, Y.; Fu, B. Regional lithological mapping using ASTER-TIR data: Case study for the Tibetan Plateau and the surrounding area. Geosciences 2016, 6, 39. [Google Scholar] [CrossRef] [Green Version]
- Kruse, F.; Perry, S. Mineral mapping using simulated Worldview-3 short-wave infrared imagery. Remote Sens. 2013, 5, 2688–2703. [Google Scholar] [CrossRef] [Green Version]
- Kruse, F.A.; Baugh, M.W.; Perry, S.L. Validation of DigitalGlobe Worldview-3 earth imaging satellite shortwave infrared bands for mineral mapping. J. Appl. Remote Sens. 2015, 9, 1–18. [Google Scholar] [CrossRef]
- Asadzadeh, S.; Filho, C.R.S. Investigating the capability of WorldView-3 superspectral data for direct hydrocarbon detection. Remote Sens. Environ. 2016, 173, 162–173. [Google Scholar] [CrossRef]
- Mars, J.C. Mineral and lithologic mapping capability of WorldView 3 data at Mountain Pass, California, using true- and false-color composite images, band ratios, and logical operator algorithms. Econ. Geol. 2018, 113, 1587–1601. [Google Scholar] [CrossRef] [Green Version]
- Sun, Y.; Tian, S.; Di, B. Extracting mineral alteration information using Worldview-3 data. Geosci. Front. 2017, 8, 1051–1062. [Google Scholar] [CrossRef]
- Ye, B.; Tian, S.H.; Ge, J.; Sun, Y. Assessment of WorldView-3 data for lithological mapping. Remote Sens. 2017, 9, 1132. [Google Scholar] [CrossRef]
- Zhao, Z.F.; Zhou, J.X.; Lu, Y.X.; Chen, Q.; Cao, X.M.; He, X.H.; Fu, X.H.; Zeng, S.H.; Feng, W.J. Mapping alteration minerals in the Pulang porphyry copper ore district, SW China, using ASTER and WorldView-3 data: Implications for exploration targeting. Ore Geol. Rev. 2021, 134, 104171. [Google Scholar] [CrossRef]
- Inzana, J.; Kusky, T.; Higgs, G.; Tucker, R. Supervised classifications of Landsat TM band ratio images and Landsat TM band ratio image with radar for geological interpretations of central Madagascar. J. Afr. Earth Sci. 2003, 37, 59–72. [Google Scholar] [CrossRef]
- Abedi, M.; Norouzi, G.H.; Bahroudi, A. Support vector machine for multi-classification of mineral prospectivity areas. Comput. Geosci. 2012, 46, 272–283. [Google Scholar] [CrossRef]
- Zadeh, M.H.; Tangestani, M.H.; Roldan, F.V.; Yusta, I. Mineral exploration and alteration zone mapping using mixture tuned matched filtering approach on ASTER data at the central part of Dehaj-Sarduiyeh Copper Belt, SE Iran. IEEE J. Sel. Top. Appl. Earth Obs. Remote Sens. 2014, 7, 284–289. [Google Scholar] [CrossRef]
- Vivek, K.S.; Venkatesh, A.S.; Champatiray, P.K.; Sahoo, P.R.; Khan, I.; Chattoraj, S.L. Spaceborne mapping of hydrothermal alteration zones associated with the Mundiyawas-Khera copper deposit, Rajasthan, India, using SWIR bands of ASTER: Implications for exploration targeting. Ore Geol. Rev. 2020, 118, 103327. [Google Scholar]
- Takodjou Wambo, J.D.; Pour, A.B.; Ganno, S.; Asimow, P.D.; Zoheir, B.; dos Reis Salles, R.; Nzenti, J.P.; Pradhan, B.; Muslim, A.M. Identifying high potential zones of gold mineralization in a sub-tropical region using Landsat-8 and ASTER remote sensing data: A case study of the Ngoura-Colomines goldfield, Eastern Cameroon. Ore Geol. Rev. 2020, 122, 103530. [Google Scholar] [CrossRef]
- Cheng, Q.; Xu, Y.; Grunsky, E. Integrated spatial and spectral analysis for geochemical anomaly separation. In Proceedings of the Fifth Annual Conference of the International Association for Mathematical Geology, Trondheim, Norway, 6–11 August 1999; pp. 87–92. [Google Scholar]
- Chen, Q.; Zhao, Z.F.; Jiang, Q.G.; Tan, S.C.; Tian, Y.G. Identification of metamorphic rocks in Wuliangshan Mountains (Southwest China) using ASTER data. Arab. J. Geosci. 2018, 11, 311. [Google Scholar] [CrossRef] [Green Version]
- Chen, Q.; Zhao, Z.F.; Jiang, Q.G.; Zhou, J.X.; Tian, Y.G.; Zeng, S.H.; Wang, J.L. Detecting subtle alteration information from ASTER data using a multifractal-based method: A case study from Wuliang Mountain, SW China. Ore Geol. Rev. 2019, 115, 103182. [Google Scholar] [CrossRef]
- Deng, J.; Wang, Q.F.; Li, G.J.; Li, C.S.; Wang, C.M. Tethys tectonic evolution and its bearing on the distribution of important mineral deposits in the Sanjiang Region, SW China. Gondwana Res. 2014, 26, 419–437. [Google Scholar] [CrossRef]
- Deng, J.; Wang, Q.F.; Li, G.J.; Hou, Z.Q.; Jiang, C.Z.; Danyushevsky, L. Geology and genesis of the giant Beiya porphyry-skarn gold deposit, northwestern Yangtze Block, China. Ore Geol. Rev. 2015, 70, 457–485. [Google Scholar] [CrossRef]
- Wang, Q.F.; Deng, J.; Li, C.S.; Li, G.J.; Yu, L.; Qiao, L. The boundary between the Simao and Yangtze Blocks and their locations in Gondwana and Rodinia: Constraints from detrital and inherited zircons. Gondwana Res. 2014, 26, 438–448. [Google Scholar] [CrossRef]
- Cao, K.; Yang, Z.M.; Xu, J.F.; Fu, B.; Li, W.K.; Sun, M.Y. Origin of dioritic magma and its contribution to porphyry Cu-Au mineralization at Pulang in the Yidun arc, eastern Tibet. Lithos 2018, 304, 436–449. [Google Scholar] [CrossRef]
- Liu, X.L.; Li, W.C.; Yin, G.H.; Zhang, N. The geochronology, mineralogy and geochemistry study of the Pulang porphyry copper deposits in Geza arc of Yunnan Province. Acta Petrol. Sin. 2013, 29, 3049–3064, (In Chinese with English abstract). [Google Scholar]
- Yang, L.Q.; He, W.Y.; Gao, X.; Xie, S.X.; Yang, Z. Mesozoic multiple magmatism and porphyry-skarn Cu-polymetallic systems of the Yidun Terrane, Eastern Tethys: Implications for subduction- and transmission-related metallogeny. Gondwana Res. 2018, 62, 144–162. [Google Scholar] [CrossRef]
- Leng, C.B.; Gao, J.F.; Chen, W.T.; Zhang, X.C.; Tian, Z.D.; Guo, J.H. Platinum-group elements, zircon Hf-O isotopes, and mineralogical constraints on magmatic evolution of the Pulang porphyry Cu-Au system, SW China. Gondwana Res. 2018, 62, 163–177. [Google Scholar] [CrossRef]
- Zeng, P.S.; Hou, Z.Q.; Li, L.H.; Qu, W.J.; Wang, H.P.; Li, W.C.; Meng, Y.F.; Yang, C.S. Metallogenic age and its significance of the Pulang Porphyry Copper Deposit, Northwest Yunnan, China. Chin. J. Geol. 2004, 23, 1127–1131, (In Chinese with English abstract). [Google Scholar]
- Abrams, M.; Hook, S.J. Simulated ASTER data for geologic studies. IEEE Trans. Geosci. Remote Sens. 1995, 33, 692–699. [Google Scholar] [CrossRef]
- Fraser, S.J.; Green, A.A. A software defoliant for geological analysis of band ratios. Int. J. Remote Sens. 1987, 8, 525–532. [Google Scholar] [CrossRef]
- Crosta, A.; Moore, J. Enhancement of Landsat Thematic Mapper imagery for residual soil mapping in SW Minais Gerais State, Brazil: A prospecting case history in Greenstone belt terrain. In Proceedings of the 7th ERIM Thematic Conference: Remote Sensing for Exploration Geology, Calgary, AB, Canada, 2–6 October 1989; pp. 1173–1187. [Google Scholar]
- Rowan, L.C.; Goetz, A.F.H.; Ashley, R.P. Discrimination of hydrothermaly altered rocks and unaltered rocks in visible and near infrared multispectral images. Geophysics 1977, 42, 522–535. [Google Scholar] [CrossRef]
- Colby, J.D. Topographic normalization in rugged terrain. Photogramm. Eng. Remote Sens. 1991, 57, 531–537. [Google Scholar]
- Mars, J.C.; Rowan, L.C. Regional mapping of phyllic- and argillic-altered rocks in the Zagros magmatic arc, Iran, using Advanced Spaceborne Thermal Emission and Reflection Radiometer (ASTER) data and logical operator algorithms. Geosphere 2006, 7, 276–289. [Google Scholar] [CrossRef] [Green Version]
- Pour, B.A.; Hashim, M. Identification of hydrothermal alteration minerals for exploring of porphyry copper deposit using ASTER data, SE Iran. J. Asian Earth Sci. 2011, 42, 1309–1323. [Google Scholar] [CrossRef]
- Pour, B.A.; Hashim, M. The application of ASTER remote sensing data to porphyry copper and epithermal gold deposits. Ore Geol. Rev. 2012, 44, 1–9. [Google Scholar] [CrossRef] [Green Version]
- Eldosouky, A.M.; Sehsah, H.; Elkhateeb, S.O.; Pour, A.B. Integrating aeromagnetic data and Landsat-8 imagery for detection of post-accretionary shear zones controlling hydrothermal alterations: The Allaqi-Heiani Suture zone, South Eastern Desert, Egypt. Adv. Space Res. 2019, 65, 1008–1024. [Google Scholar] [CrossRef]
- Crosta, A.P.; Souza Filho, C.R.; Azevedo, F.; Brodie, C. Targeting key alteration minerals in epithermal deposits in Patagonia, Argentina, Using ASTER imagery and principal component analysis. Int. J. Remote Sens. 2003, 24, 4233–4240. [Google Scholar] [CrossRef]
- Loughlin, W.P. Principal components analysis for alteration mapping. Photogramm. Eng. Remote Sens. 1991, 57, 1163–1169. [Google Scholar]
- Zoheir, B.; El-Wahed, M.A.; Pour, A.B.; Abdelnasser, A. Orogenic gold in transpression and transtension zones: Field and remote sensing studies of the Barramiya-Mueilha Sector, Egypt. Remote Sens. 2019, 11, 2122. [Google Scholar] [CrossRef] [Green Version]
- Singer, D.A.; Kouda, R. Some simple guides to finding useful information in exploration geochemical data. Nat. Resour. Res. 2001, 10, 137–147. [Google Scholar] [CrossRef]
- Cheng, Q. A new model for quantifying anisotropic scale in variance and decomposing of complex patterns. Math. Geol. 2004, 36, 345–360. [Google Scholar] [CrossRef] [Green Version]
- Boardman, J.W. Sedimentary Facies Analysis Using Imaging Spectrometry: A Geophysical Inverse Problem. Ph.D. Thesis, University of Colorado, Boulder, CO, USA, 1992; p. 212. [Google Scholar]
- Tang, C.; Shao, L.Y. Study on the mechanism of remote sensing anomaly extraction and correlation analysis of ore controlling: Take the Qimantag metallogenic belt of Qinghai as an example. J. Min. Sci. Technol. 2017, 2, 316–329, (In Chinese with English abstract). [Google Scholar]
- Ma, H.L.; Jia, W.J.; Fu, C.L.; Li, W. Extraction of geological structural and alteration information and the prediction of metallogenic favorable locations in northeastern Jeddah, Saudi Arabia. Remote Sens. Land Resour. 2019, 31, 174–182, (In Chinese with English abstract). [Google Scholar]


Publisher’s Note: MDPI stays neutral with regard to jurisdictional claims in published maps and institutional affiliations. |
© 2021 by the authors. Licensee MDPI, Basel, Switzerland. This article is an open access article distributed under the terms and conditions of the Creative Commons Attribution (CC BY) license (https://creativecommons.org/licenses/by/4.0/).