
Internet-of-Things-Based Geotechnical Monitoring Boosted by Satellite InSAR Data

 , ,
, ,  and
and
Abstract
:1. Introduction
- They do not require human interaction to collect the data;
- They require minimum maintenance;
- They are battery powered;
- They have low power consumption;
- Connectivity to the internet facilitates real-time data visualization and further analyses.
2. Materials and Methods
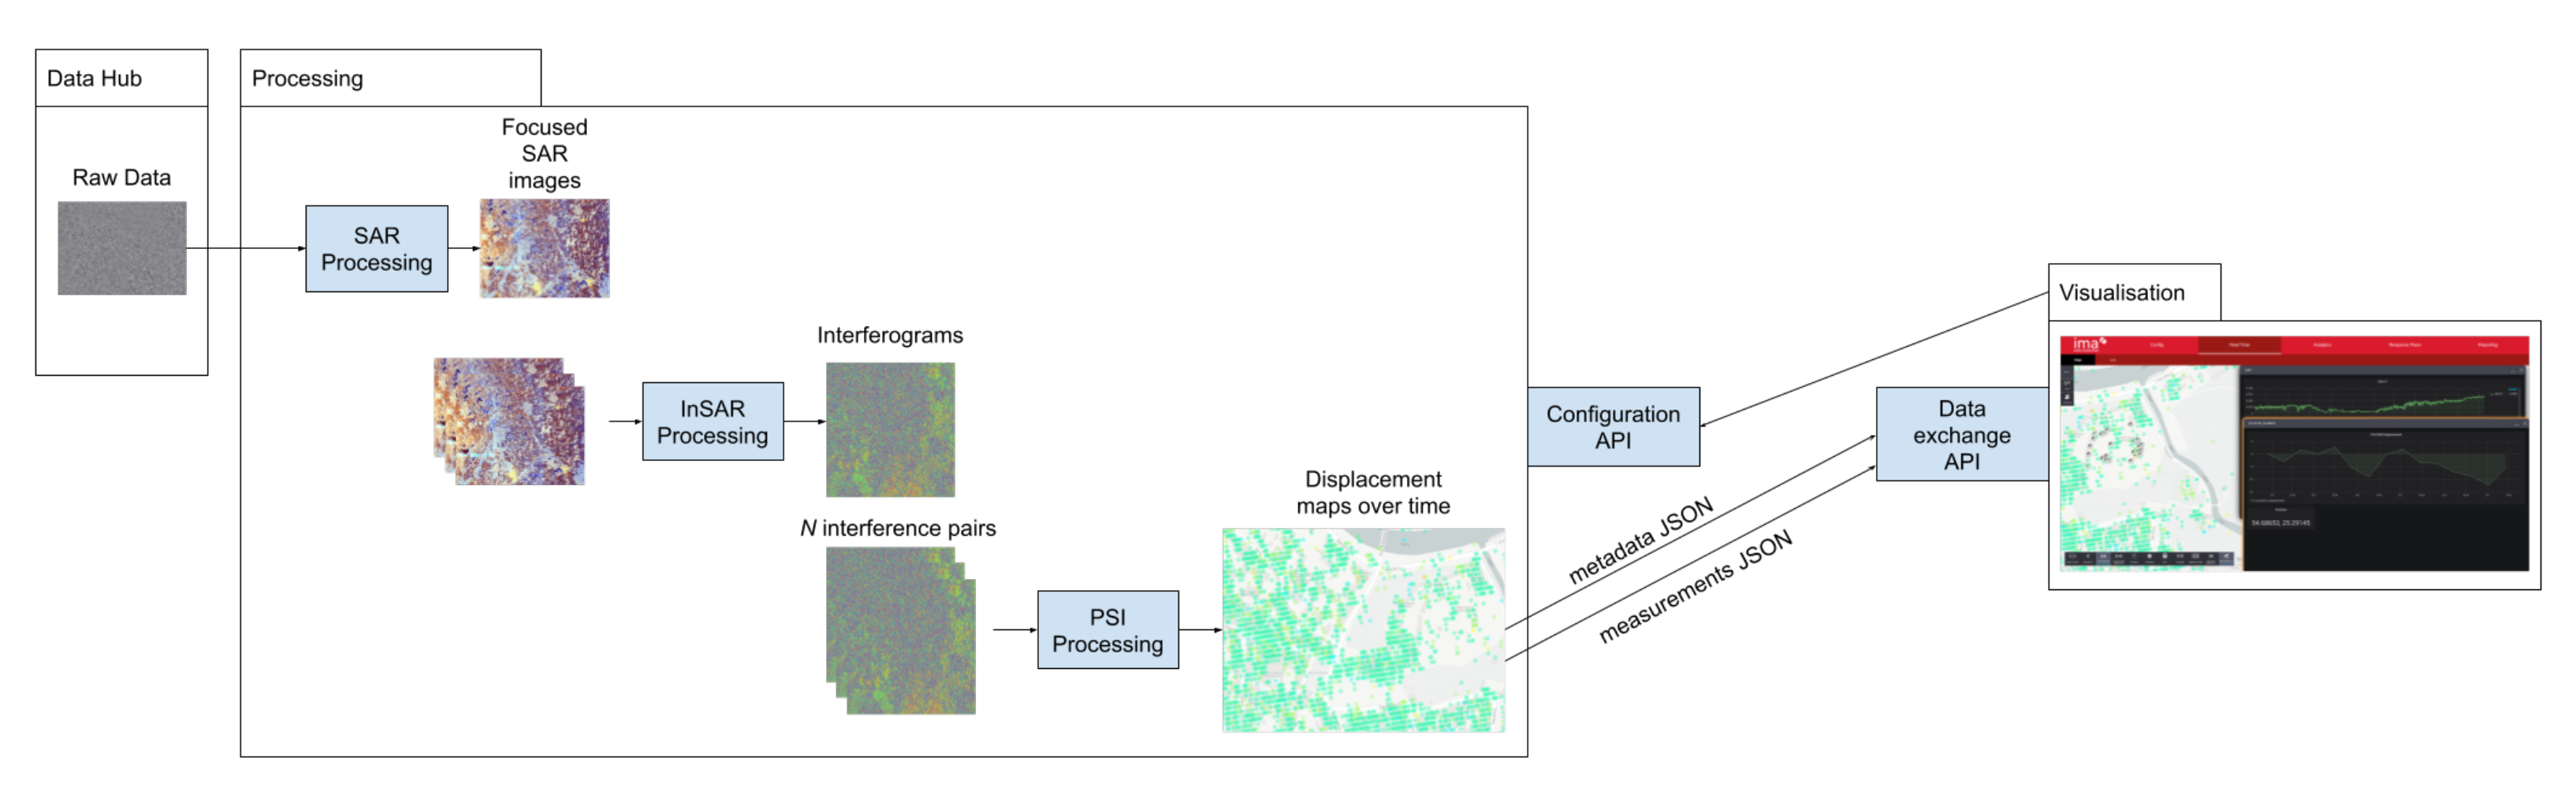
2.1. InSAR
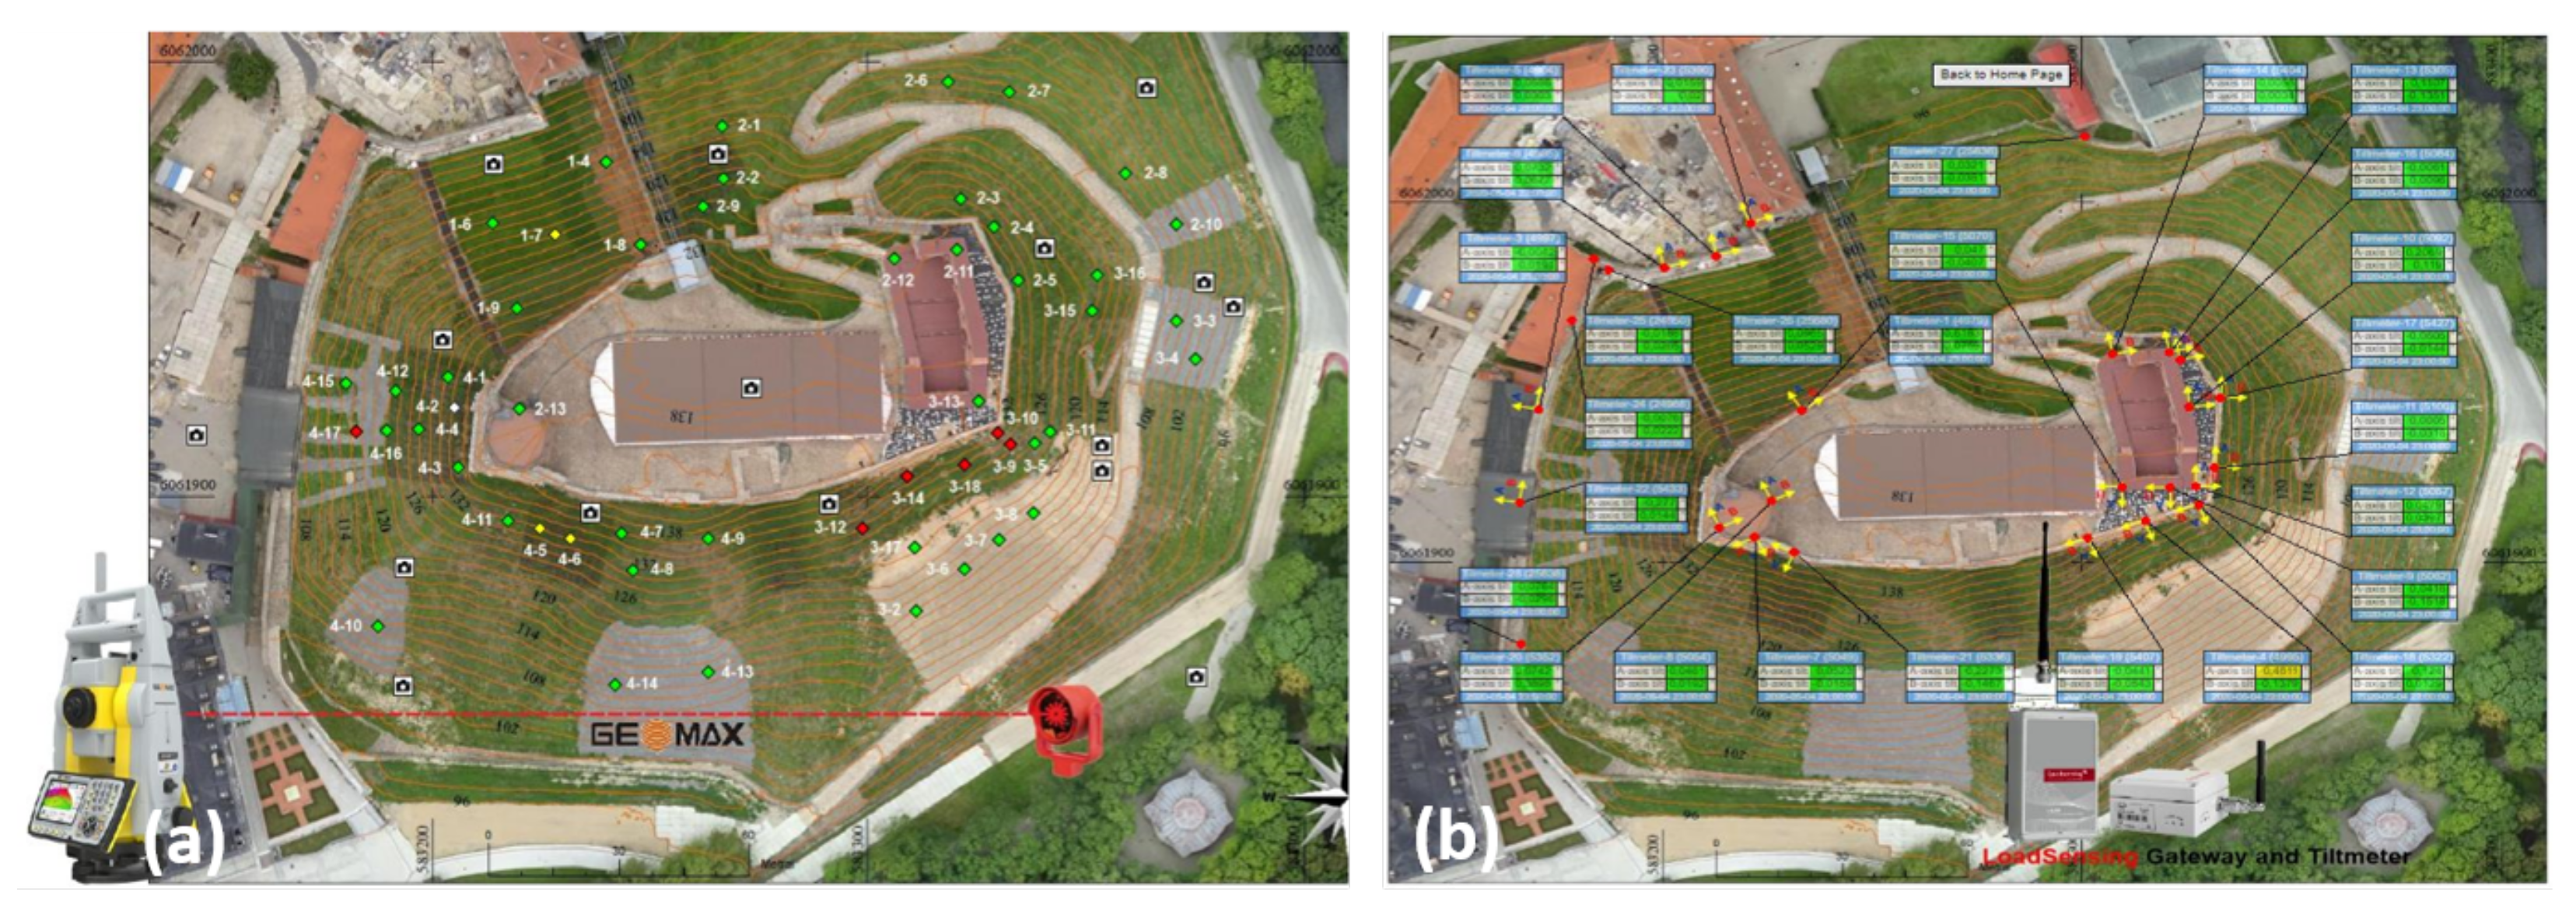
2.2. Robotic Total Stations (RTS)
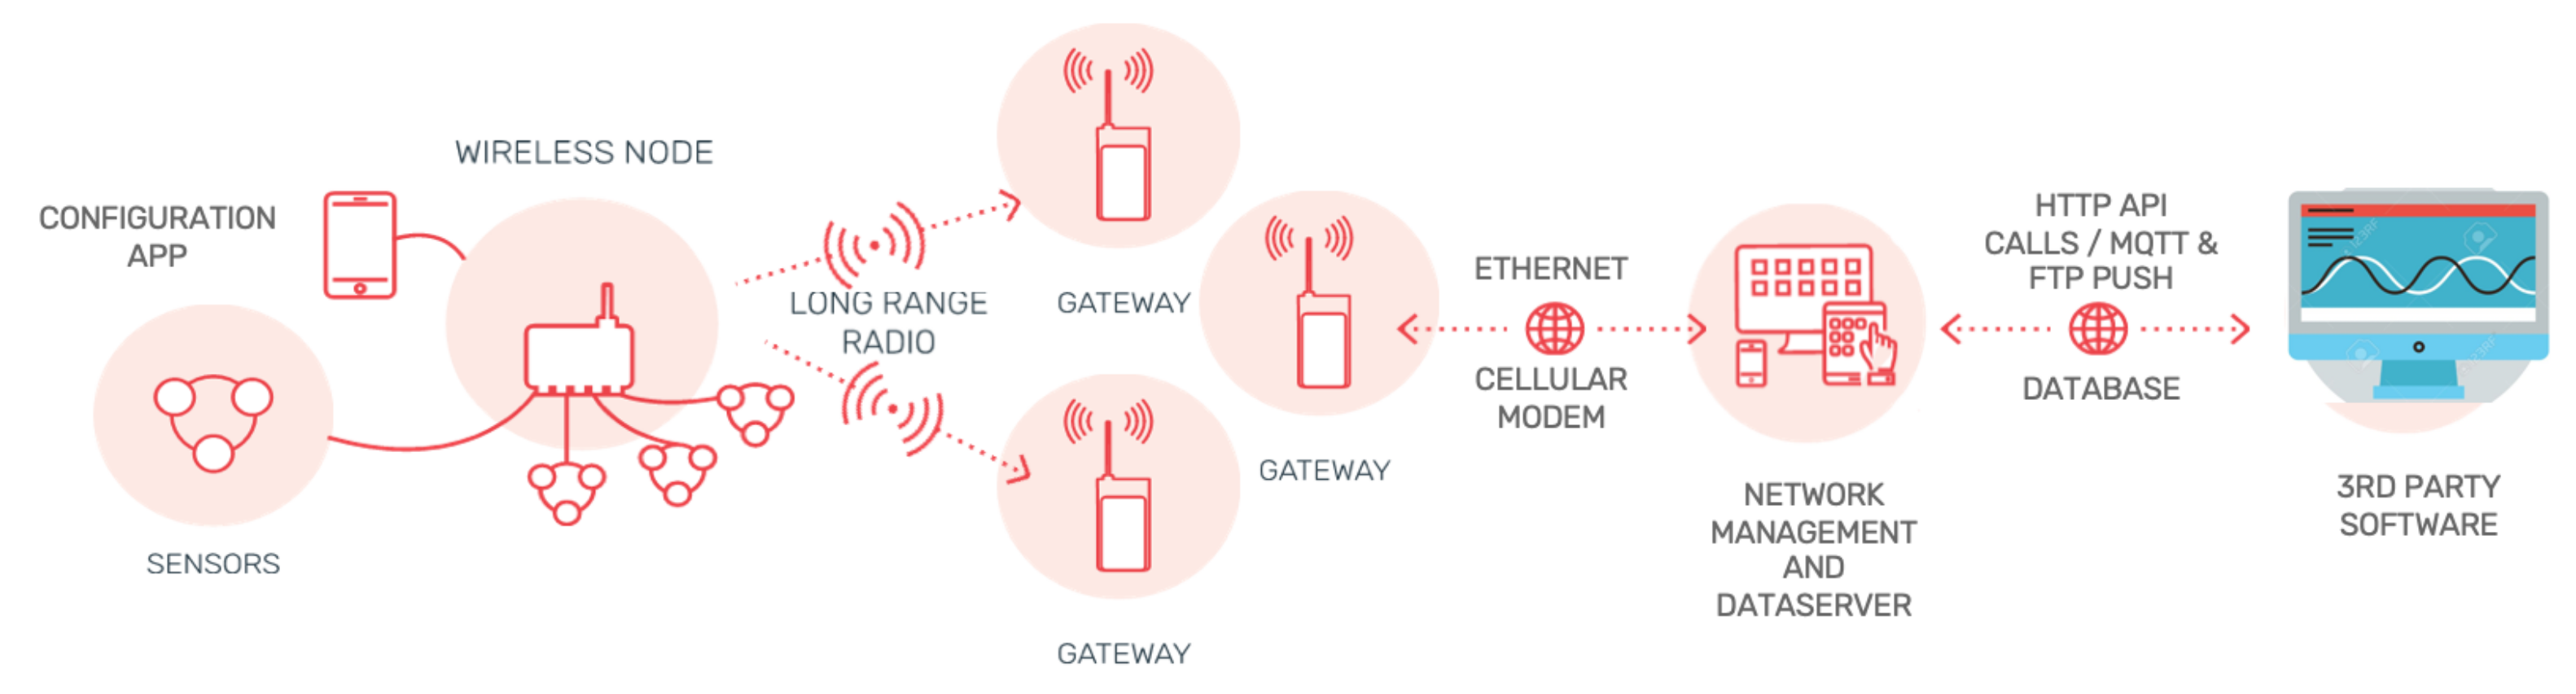
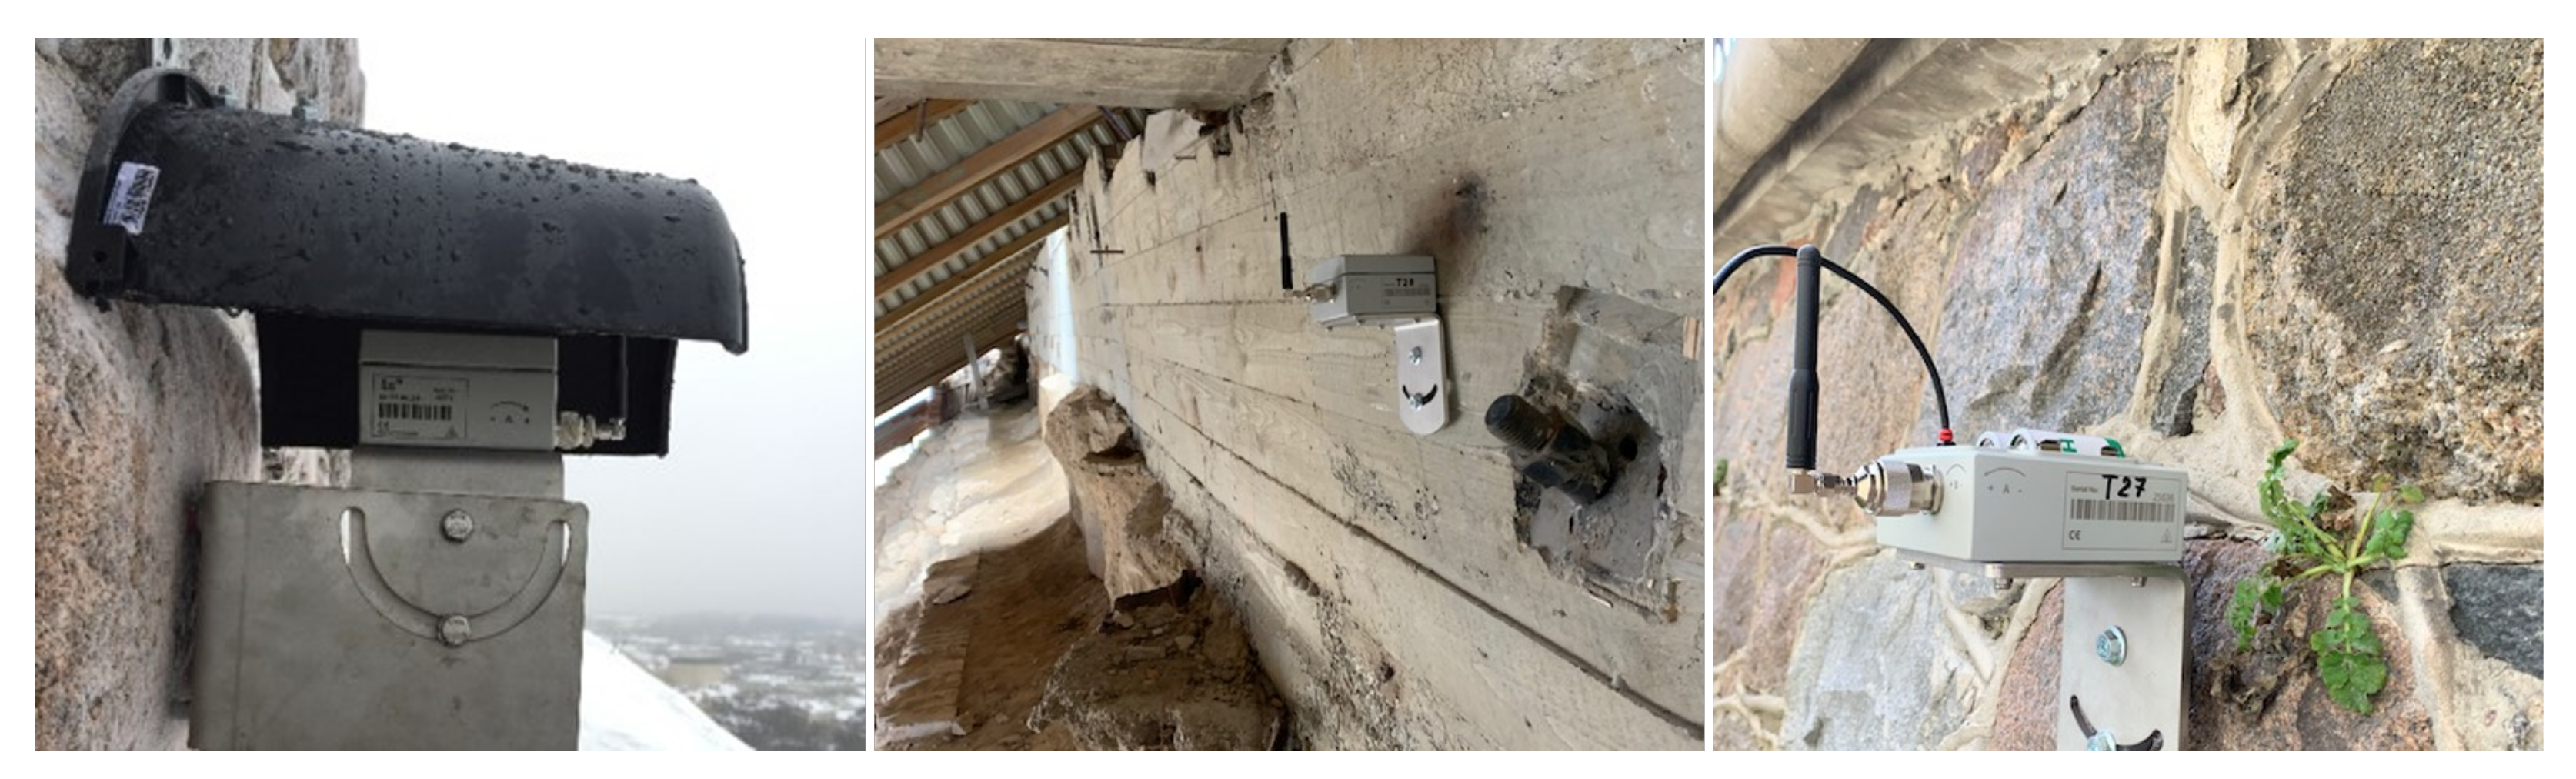
2.3. In Situ Sensors
- Sensors (here, inclinometers);
- Distributed low-power nodes;
- Powered gateways;
- Software interface (to configure the devices and manage the wireless network).
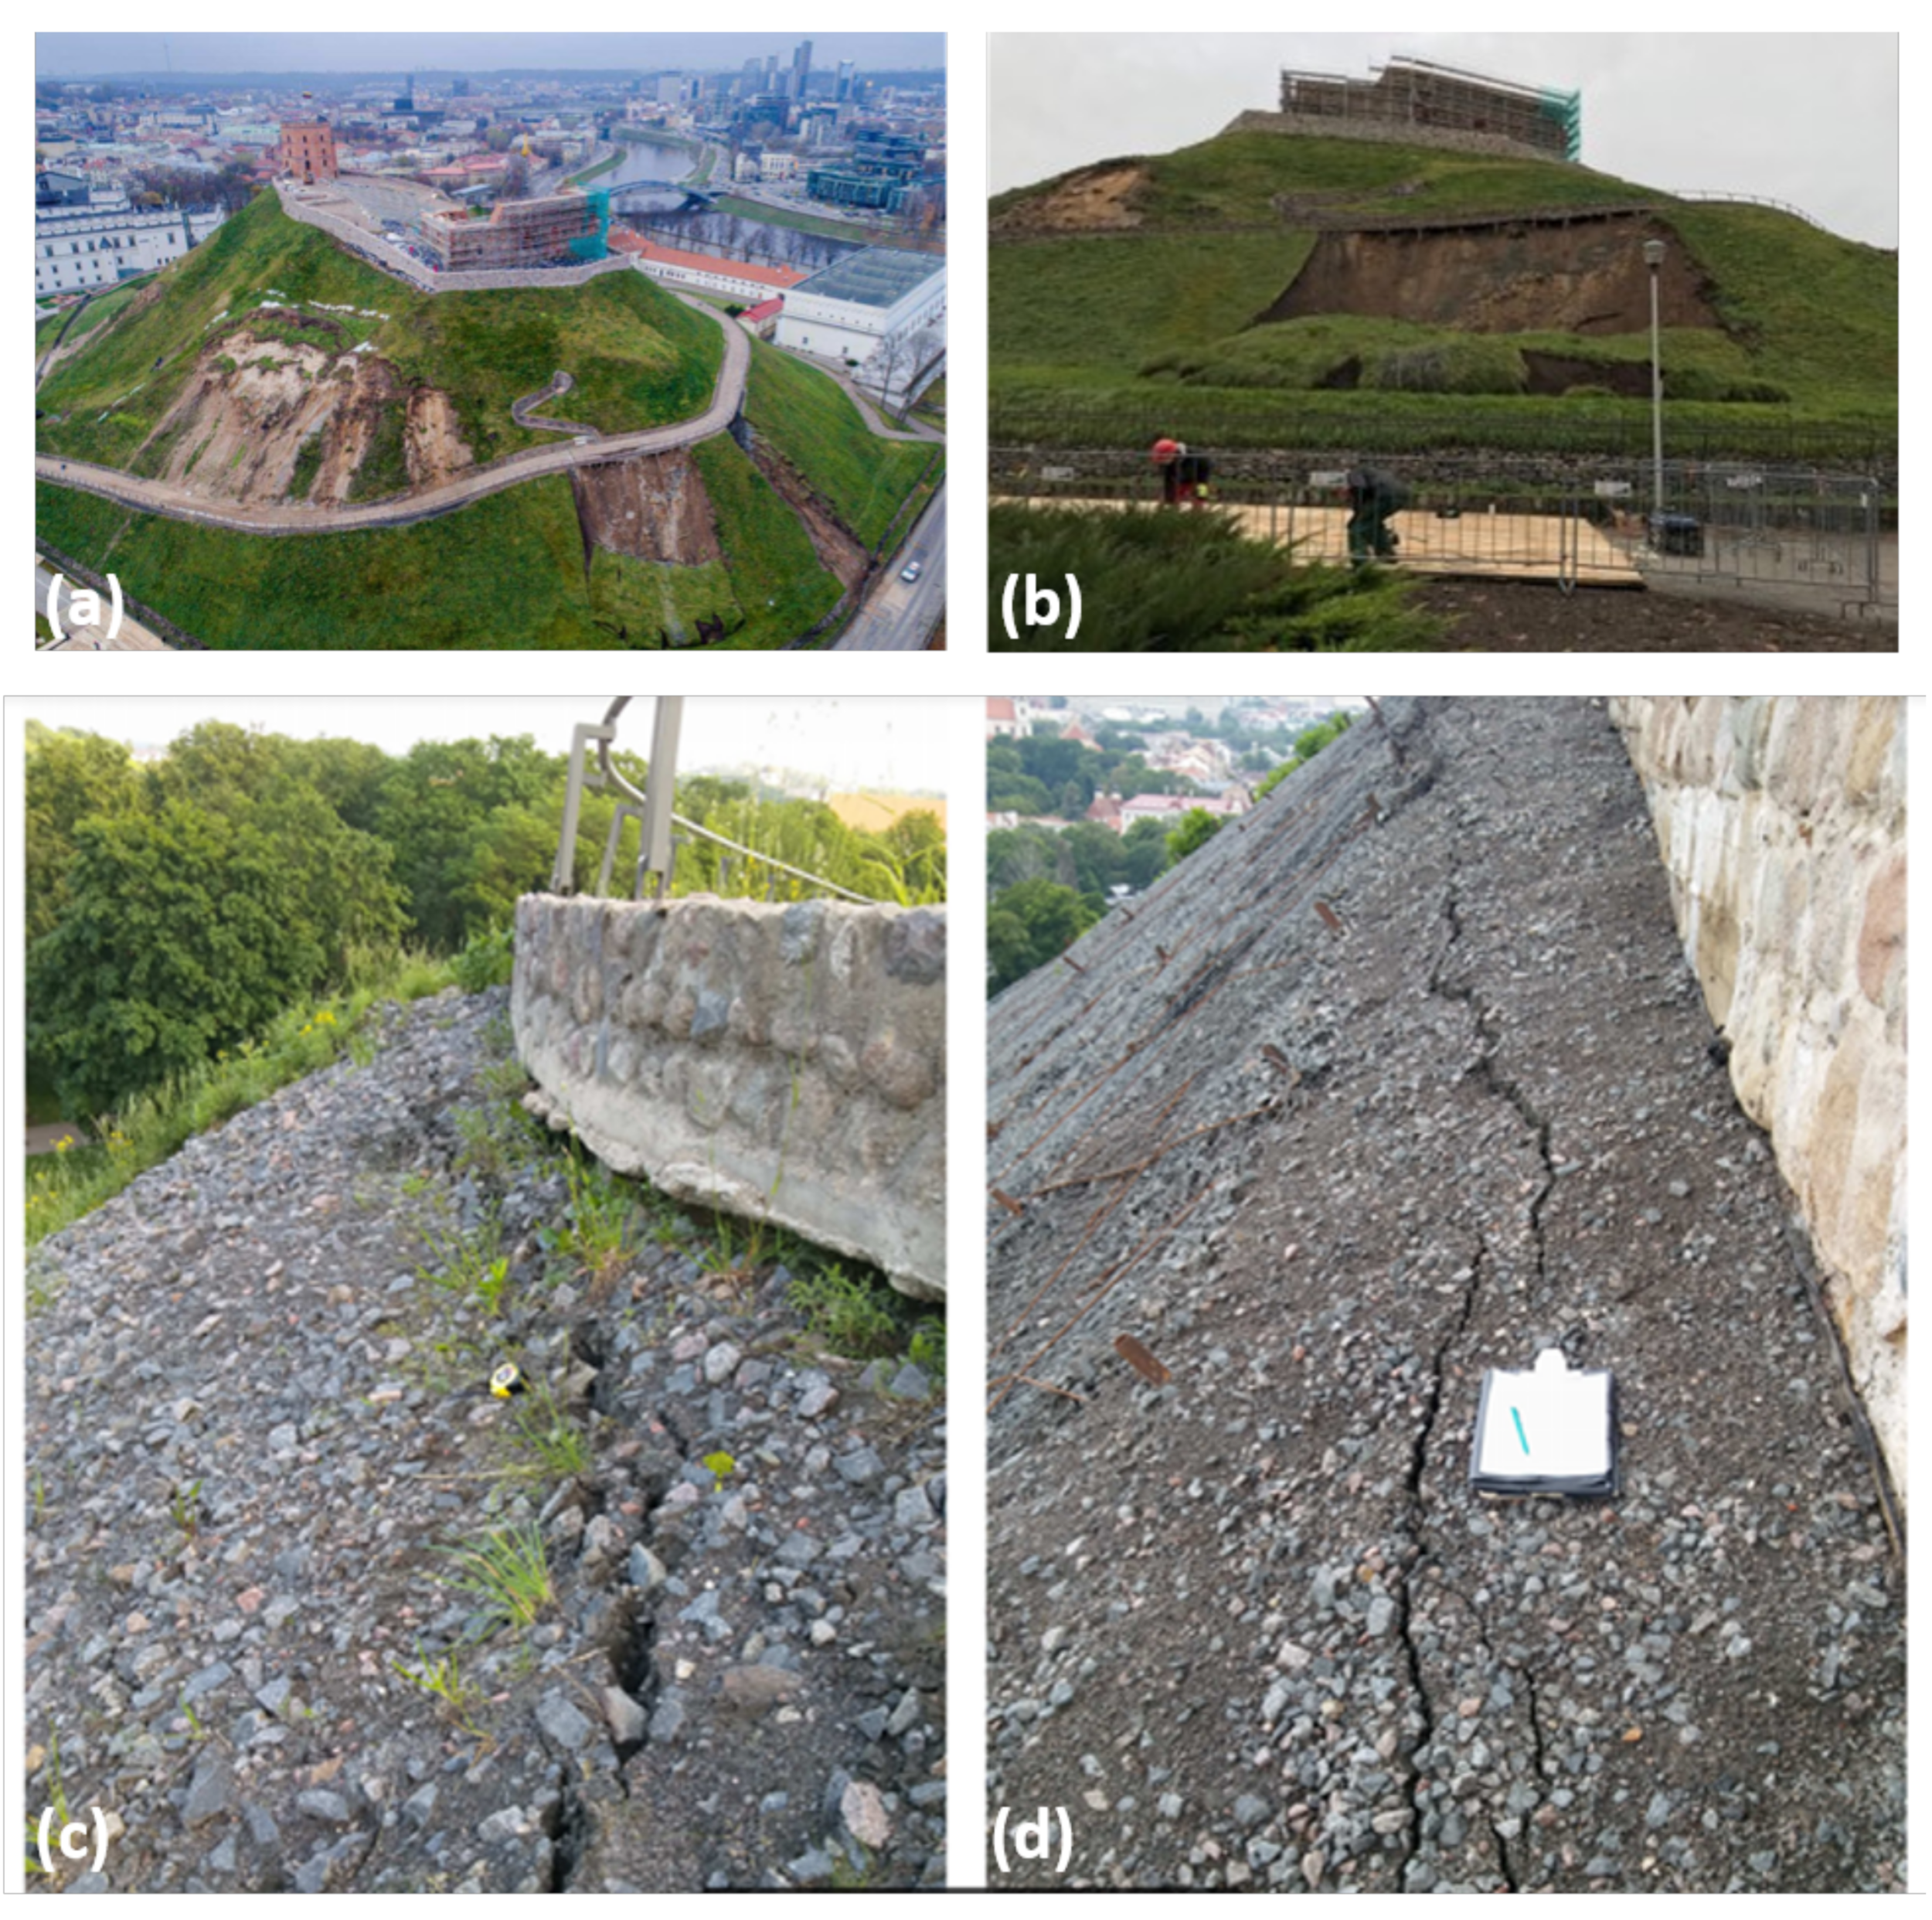
3. Case Study: Gediminas Castle
3.1. The Problem
3.2. The Solution
3.3. Results
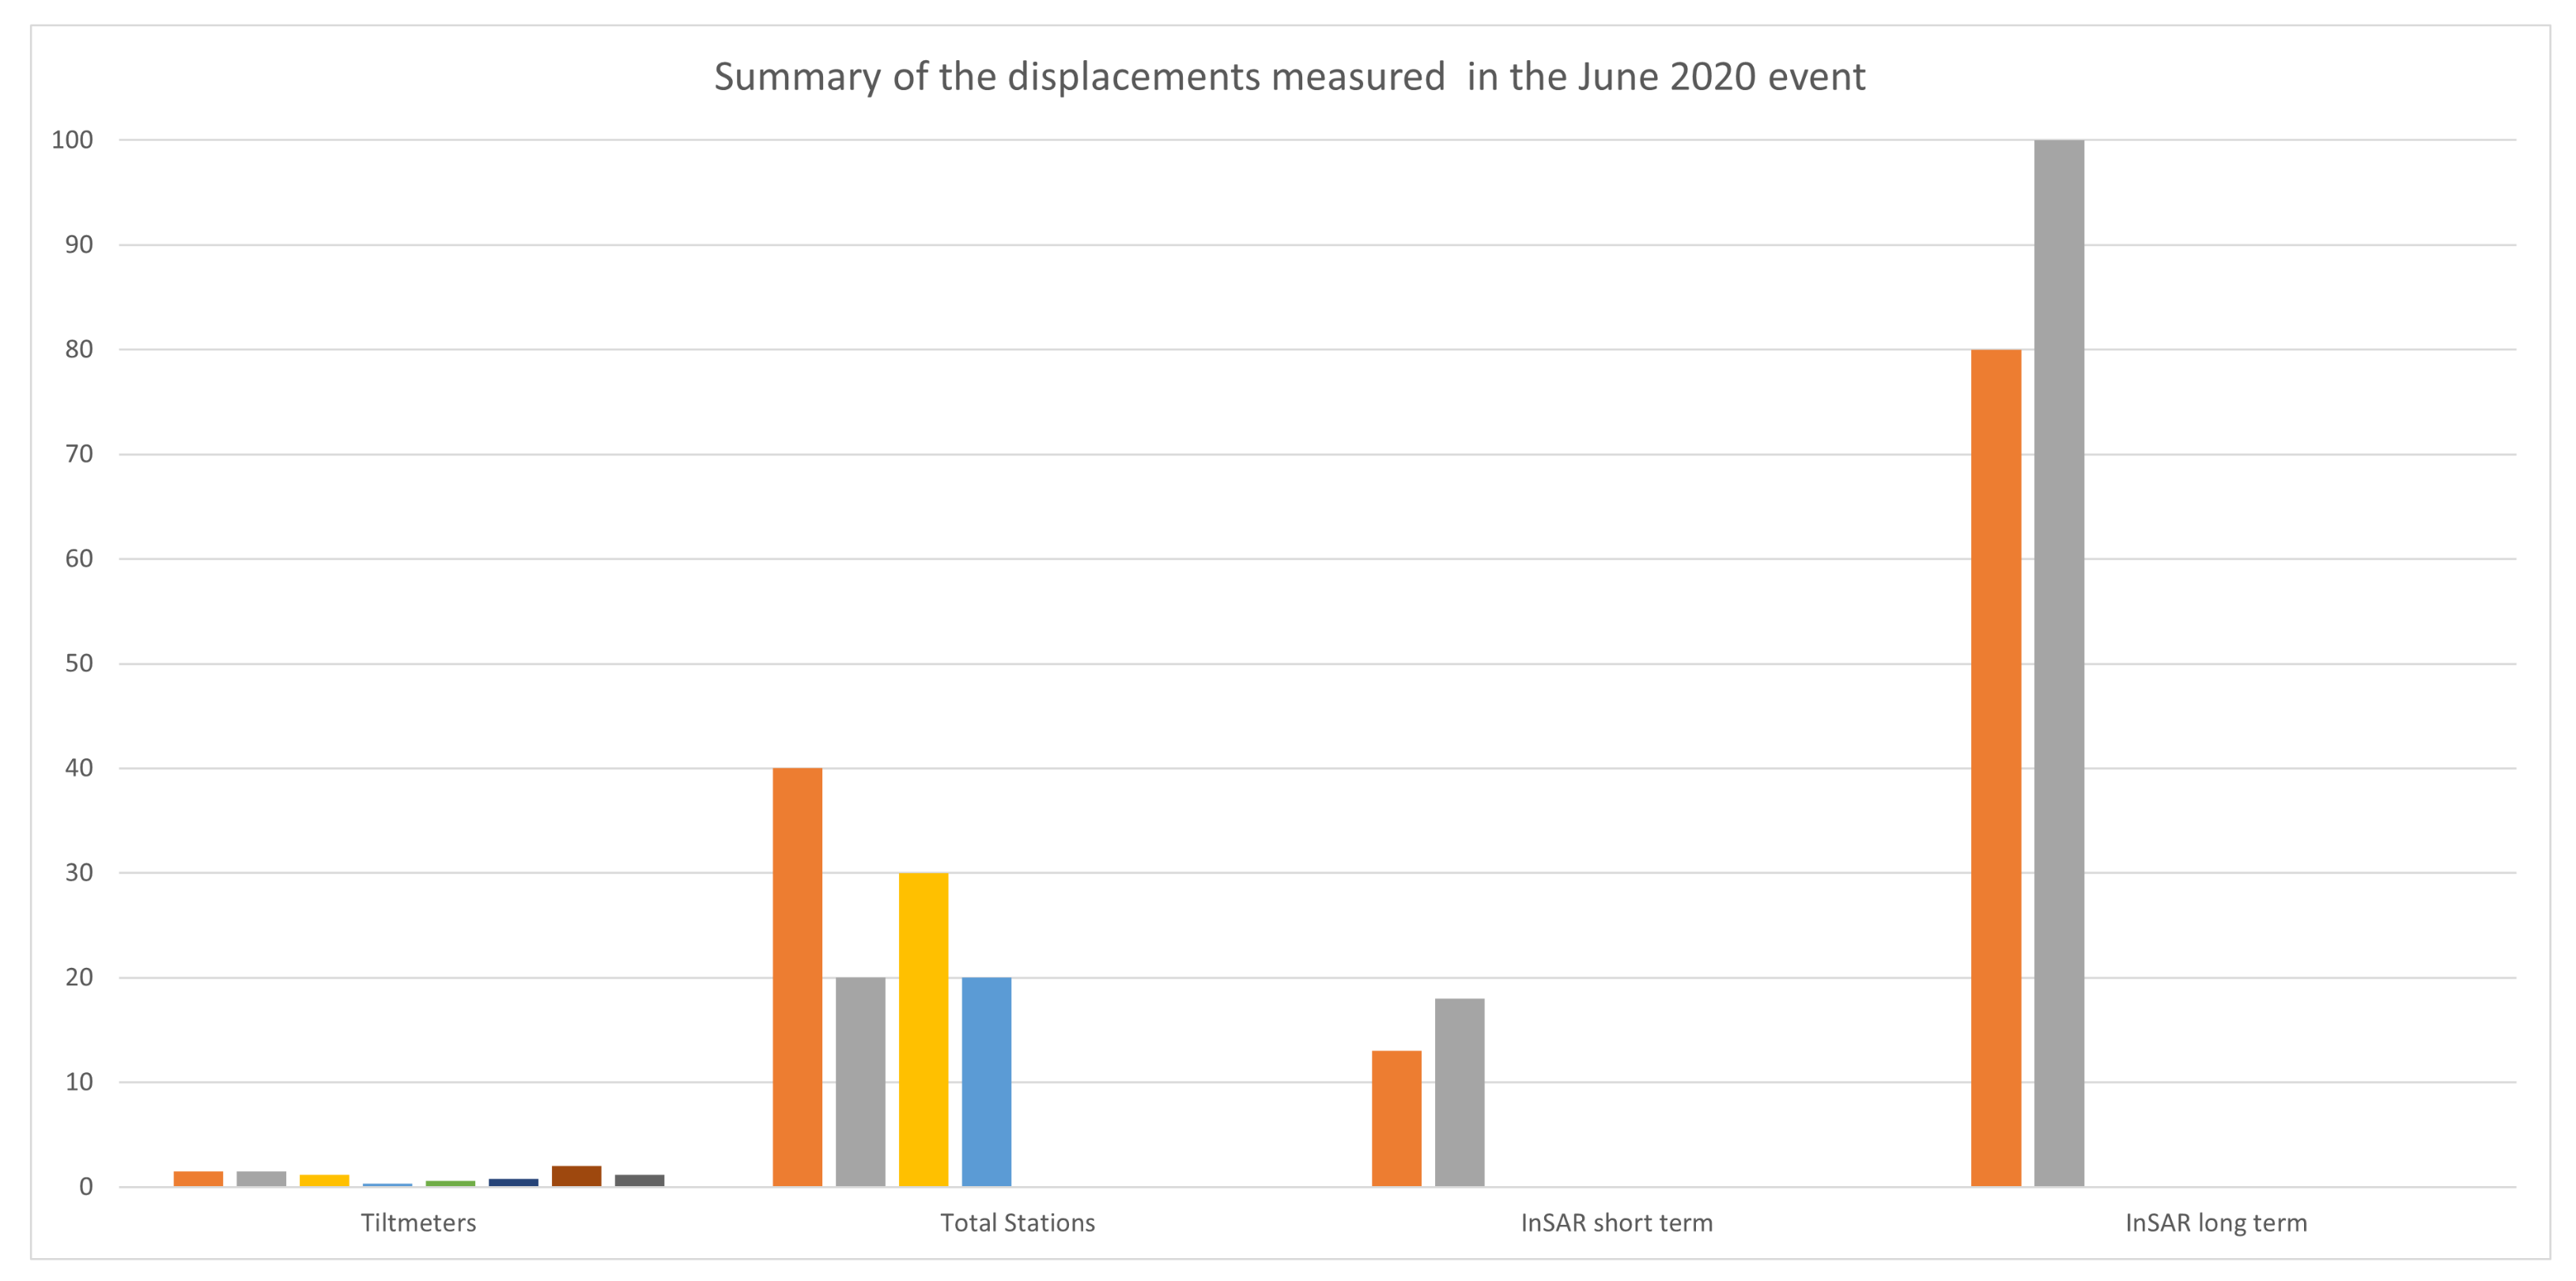
3.3.1. June 2020
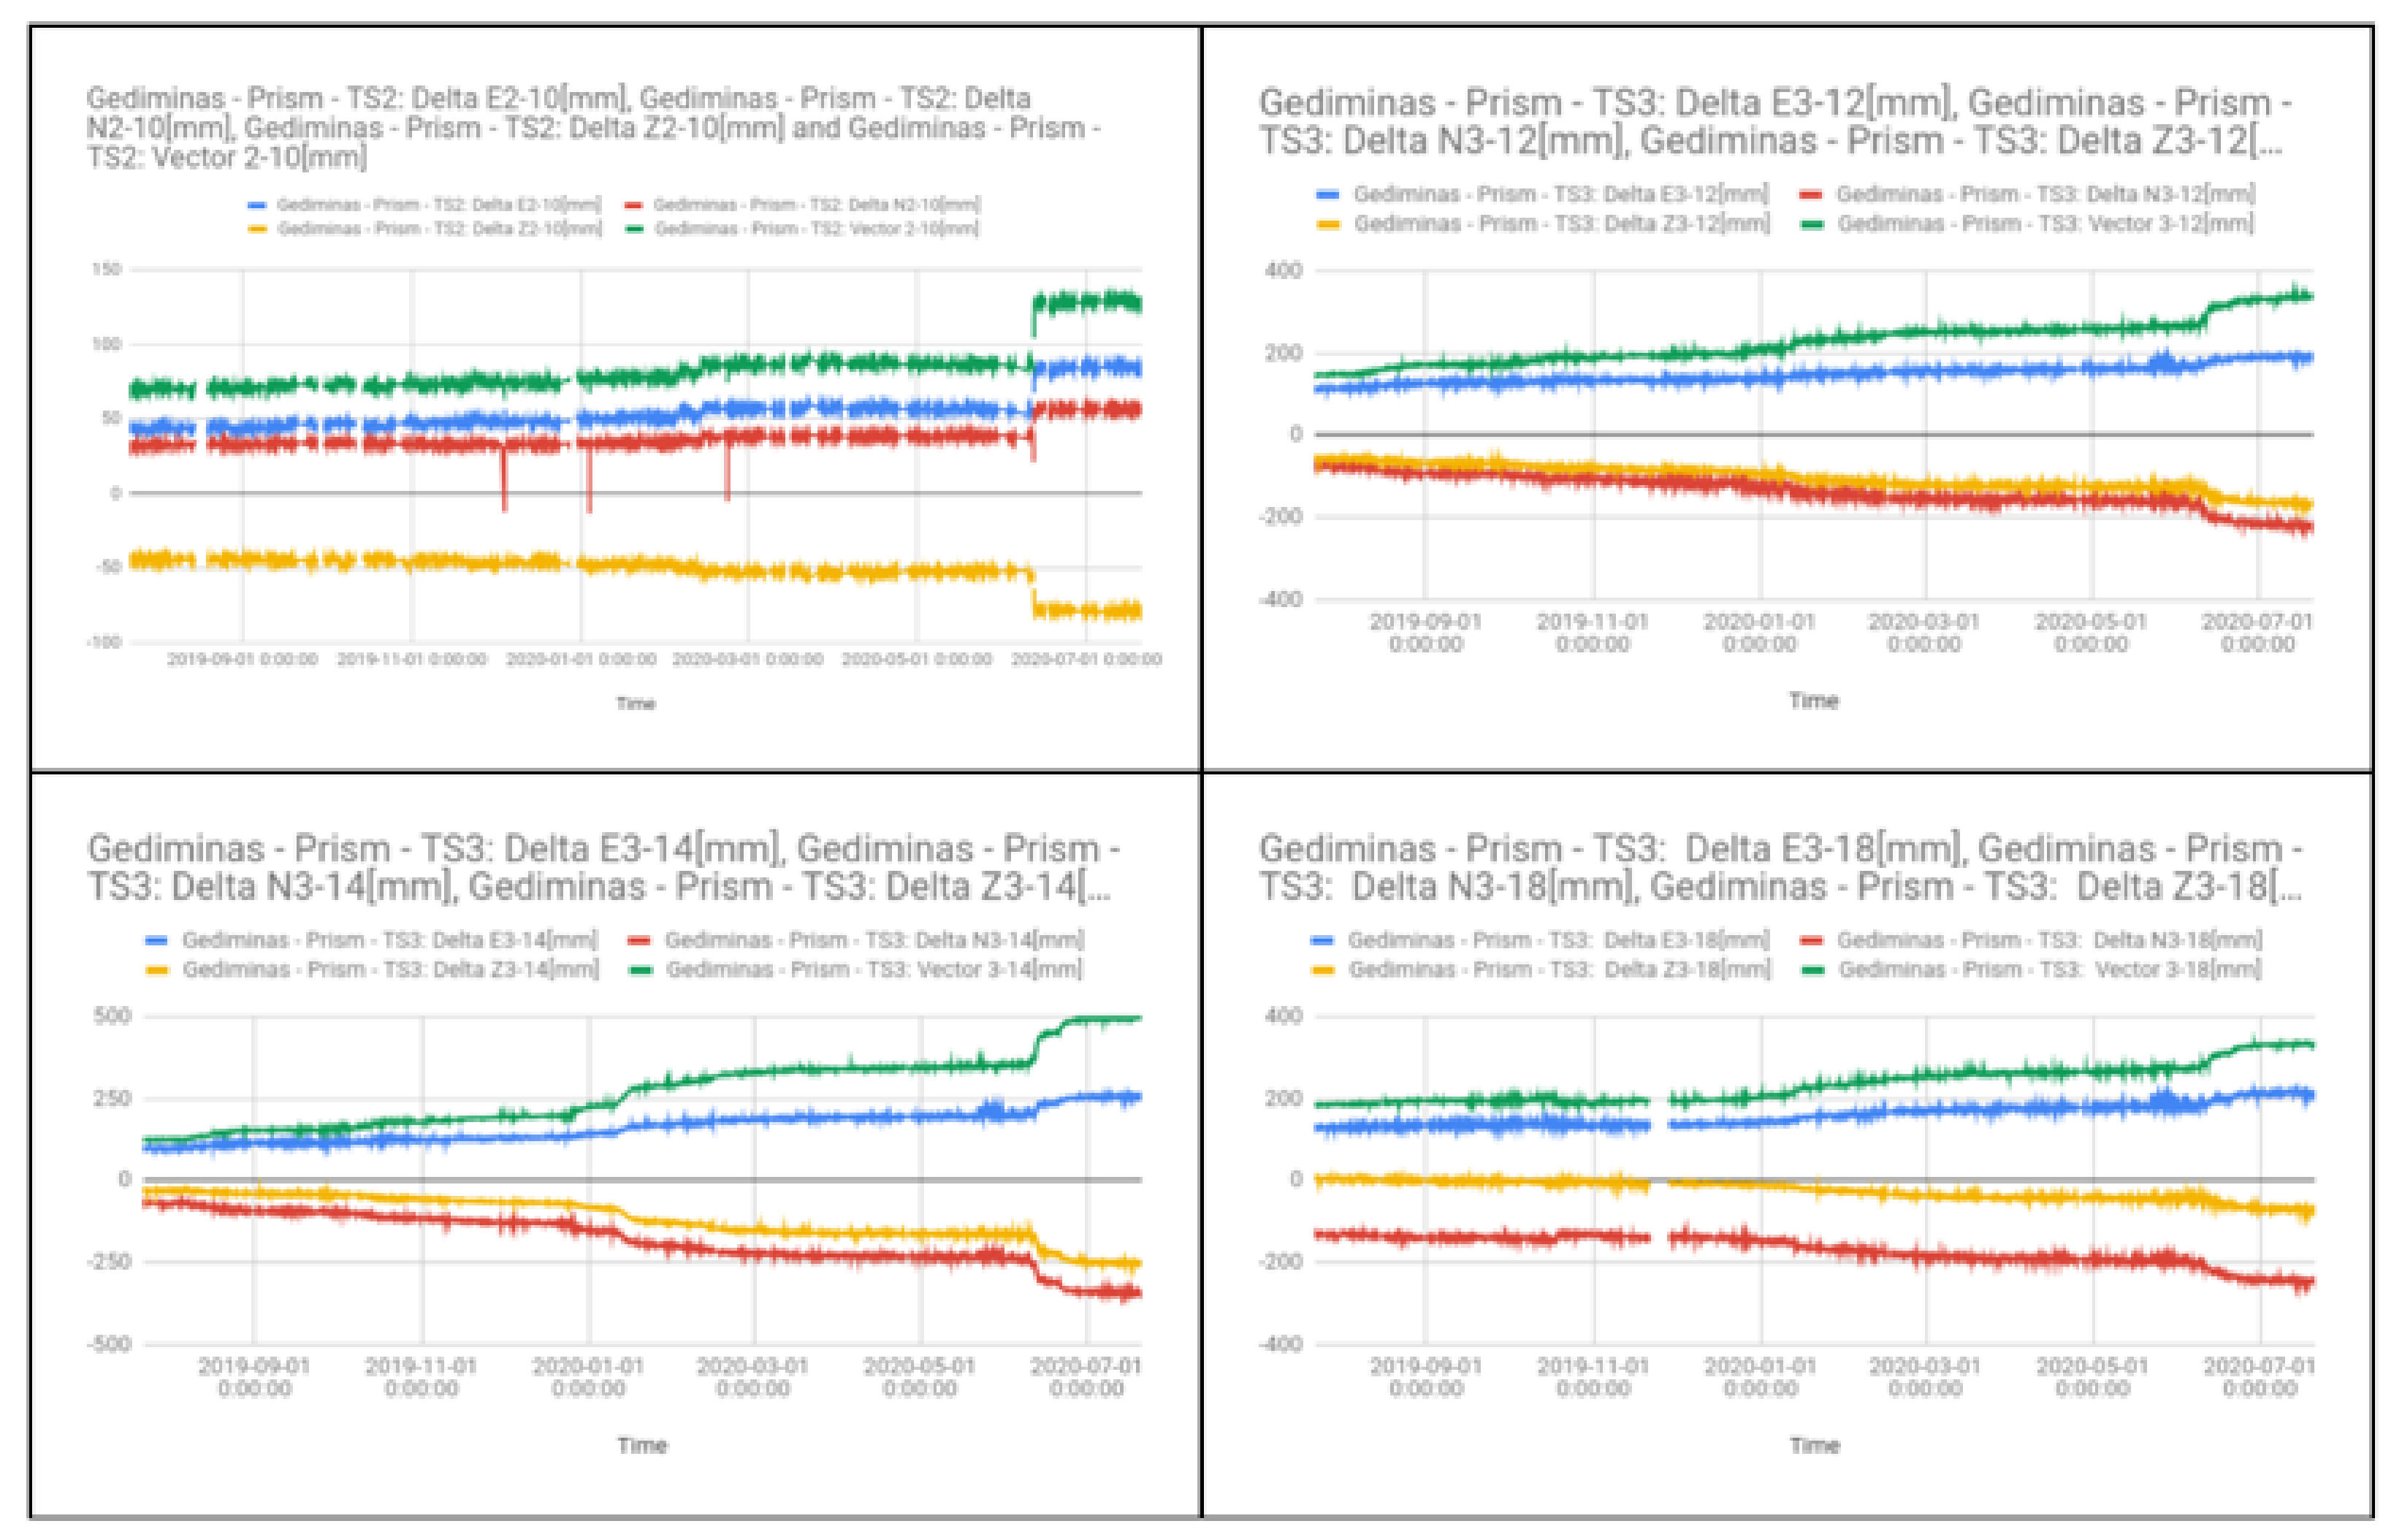
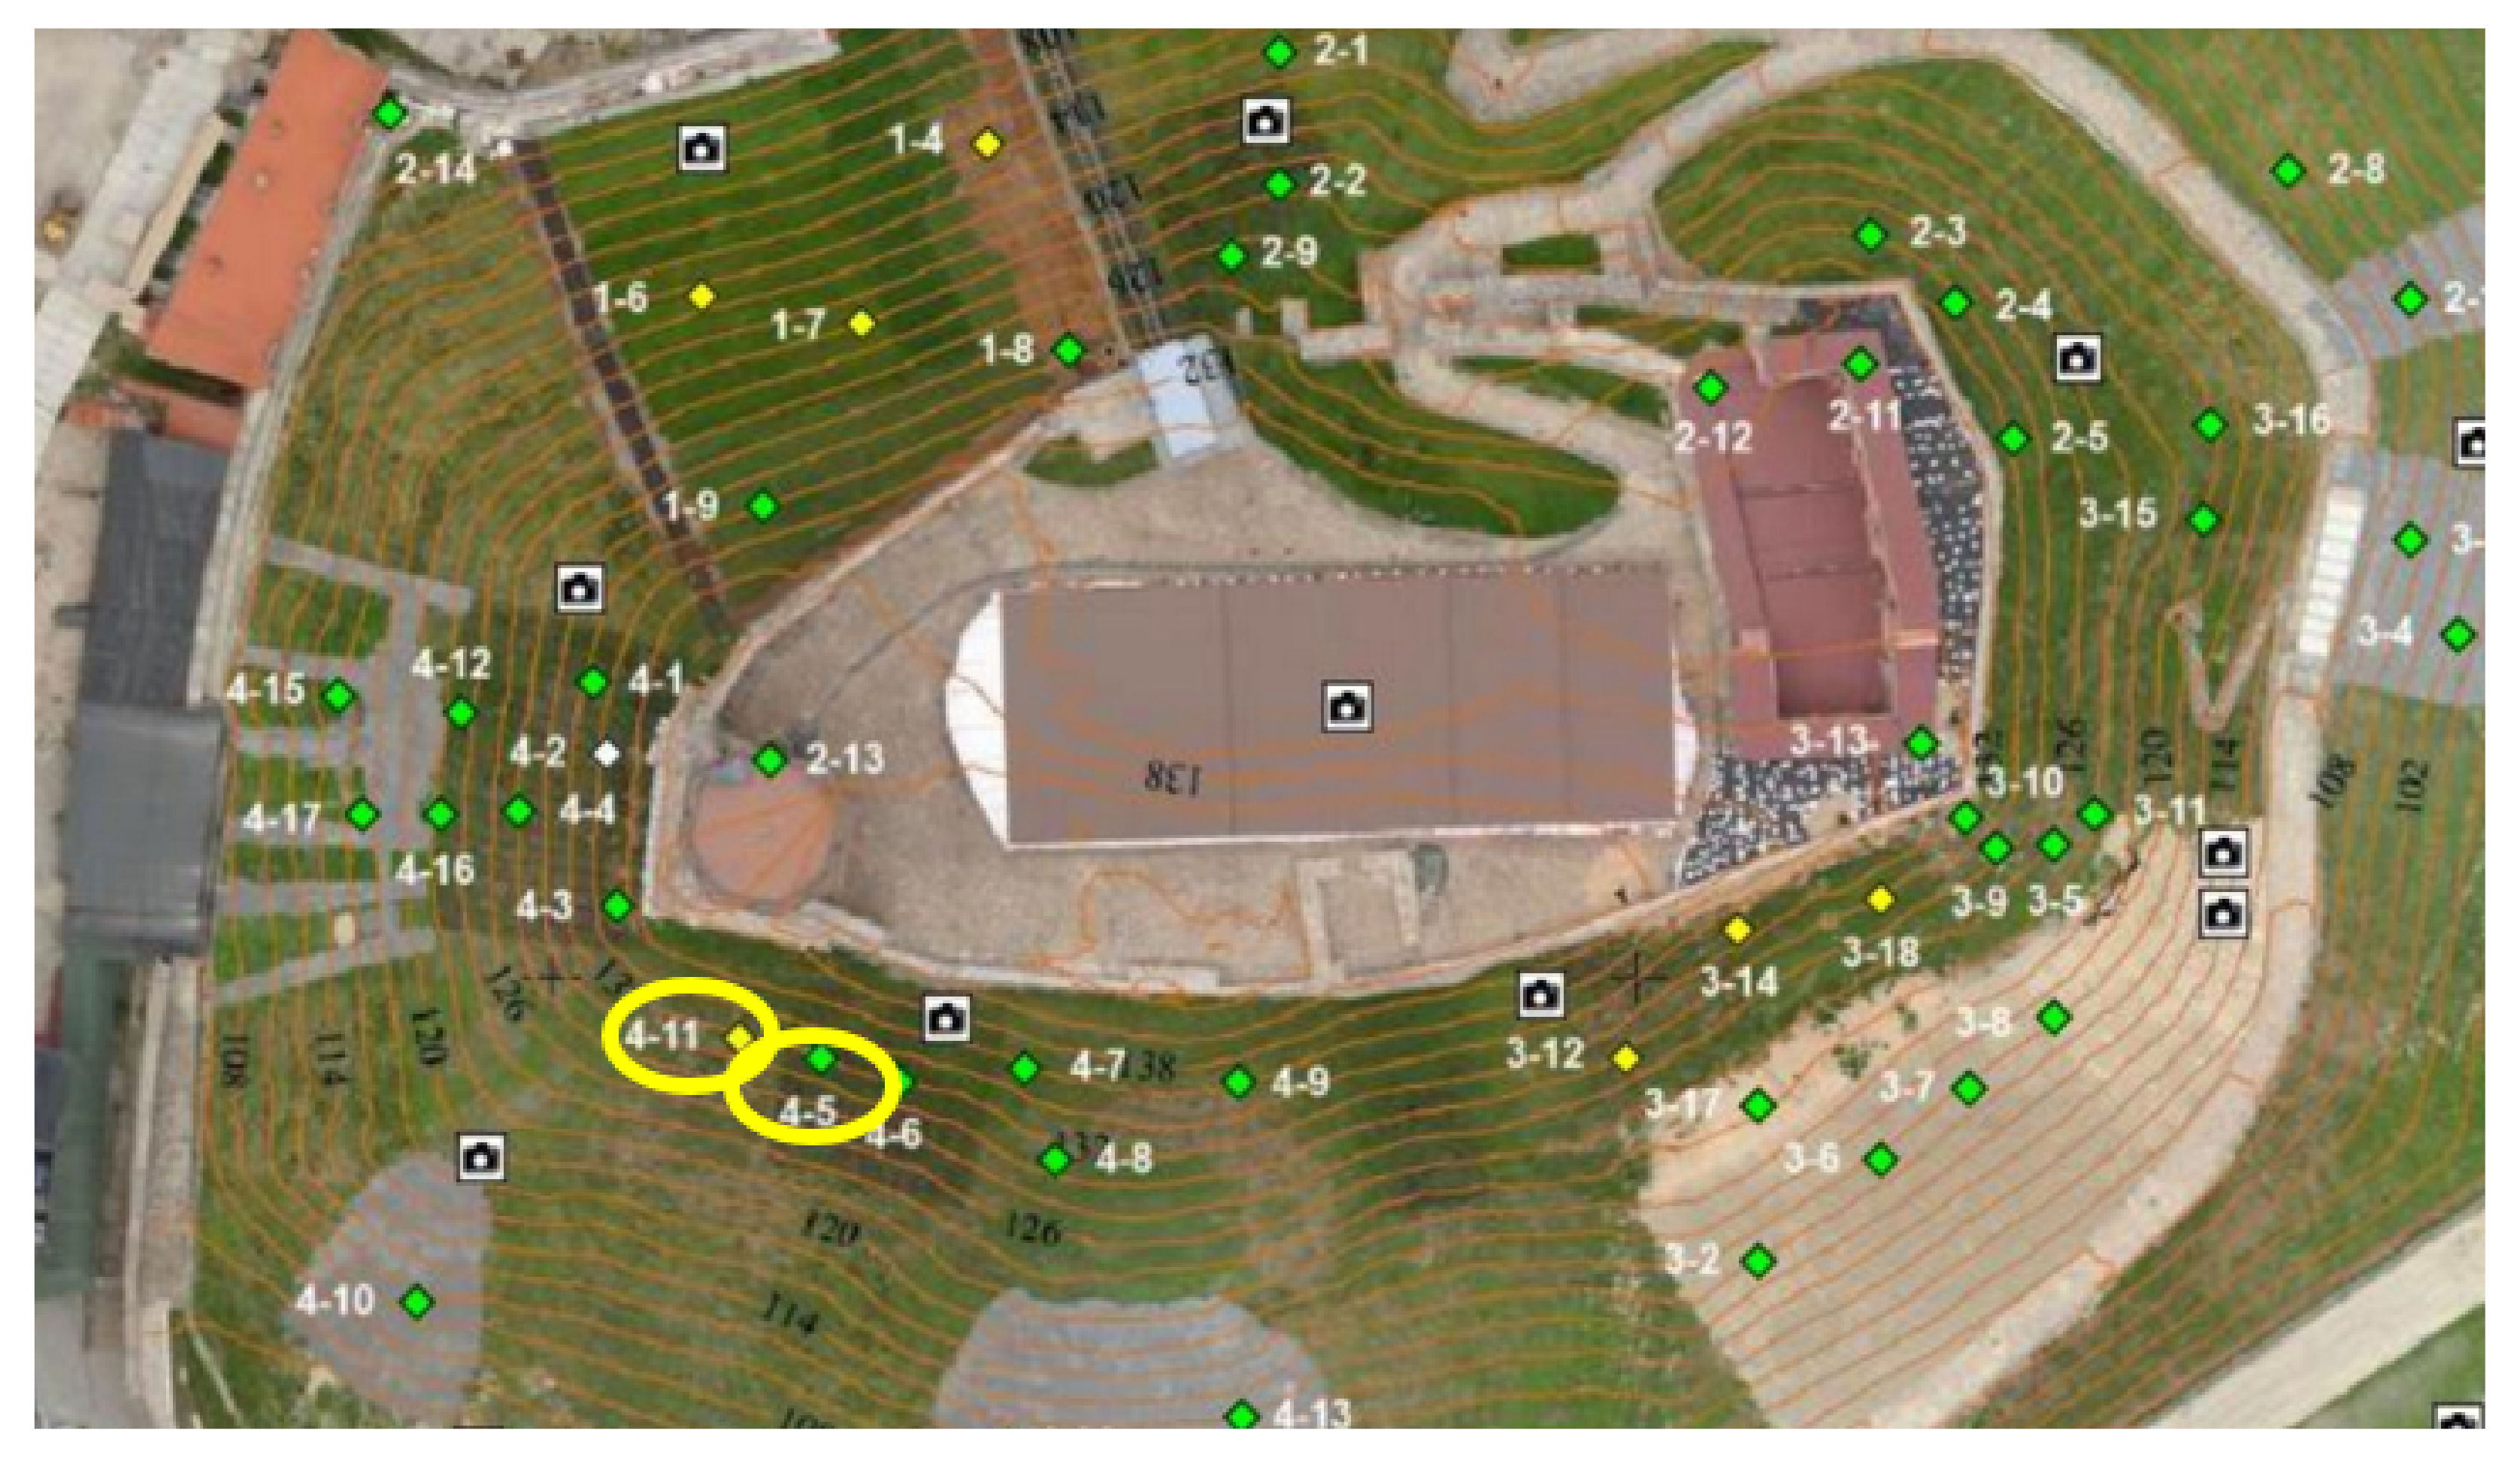
Robotic Total Stations
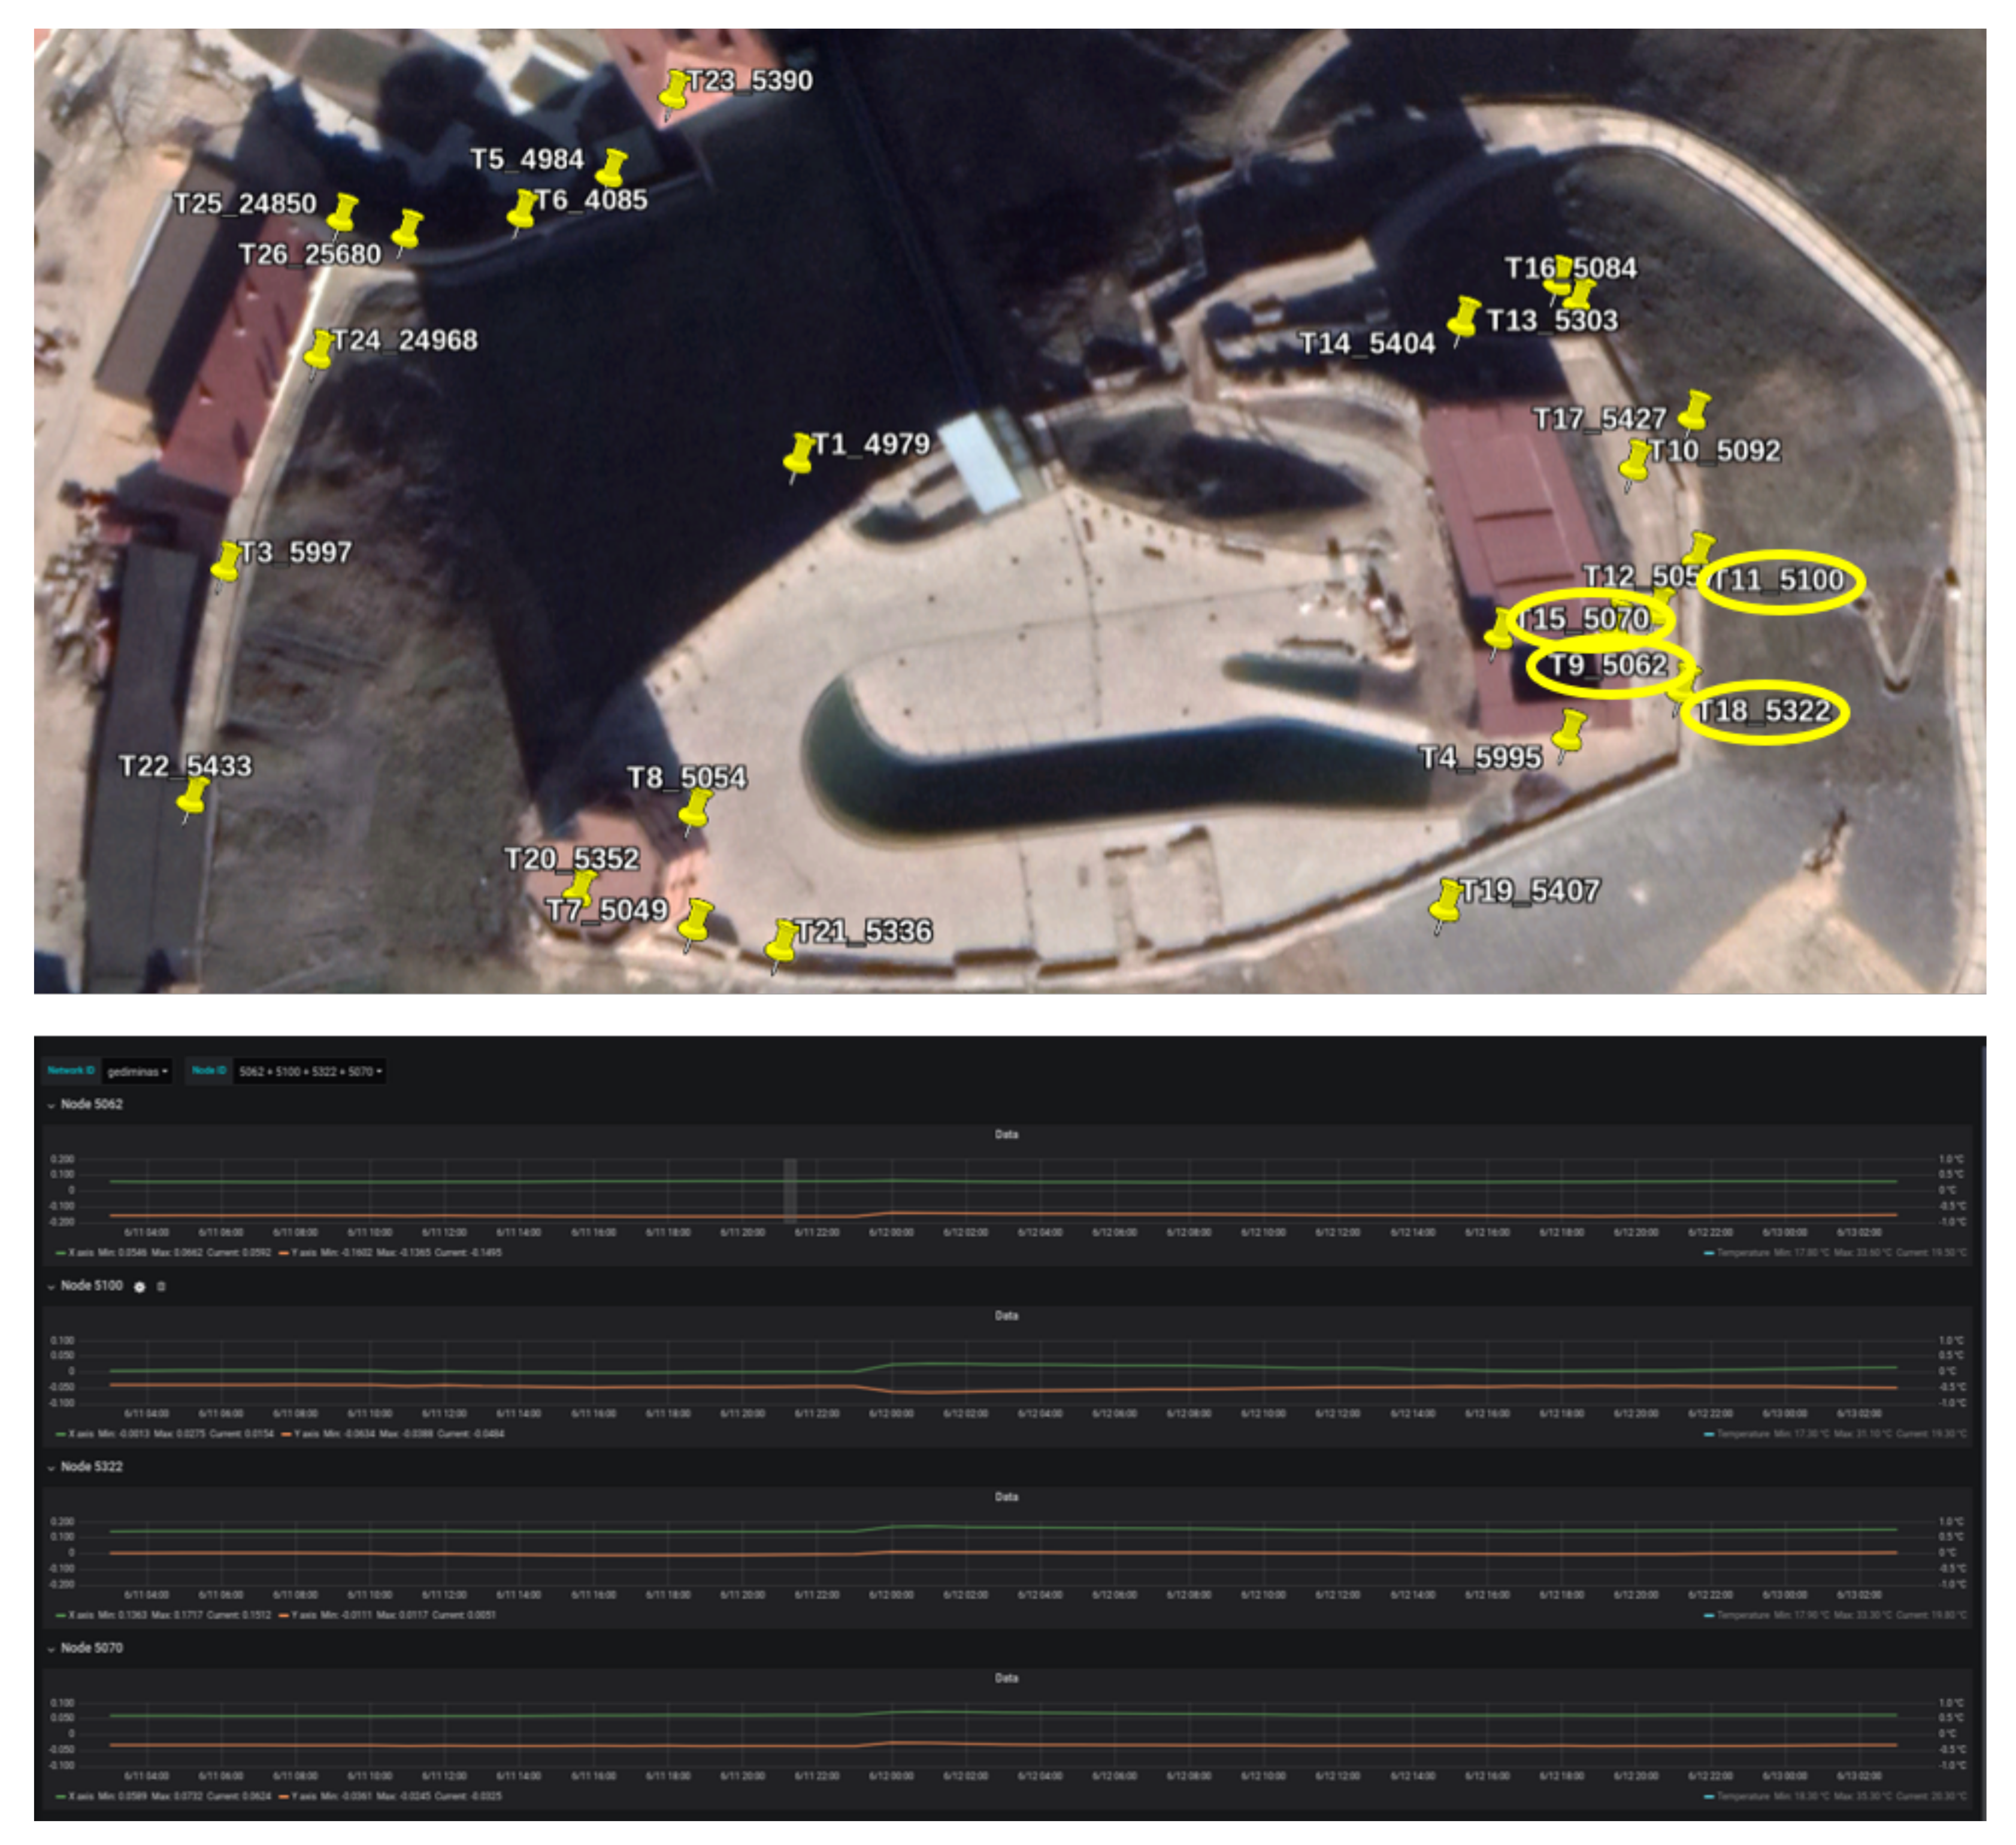
Tiltmeters
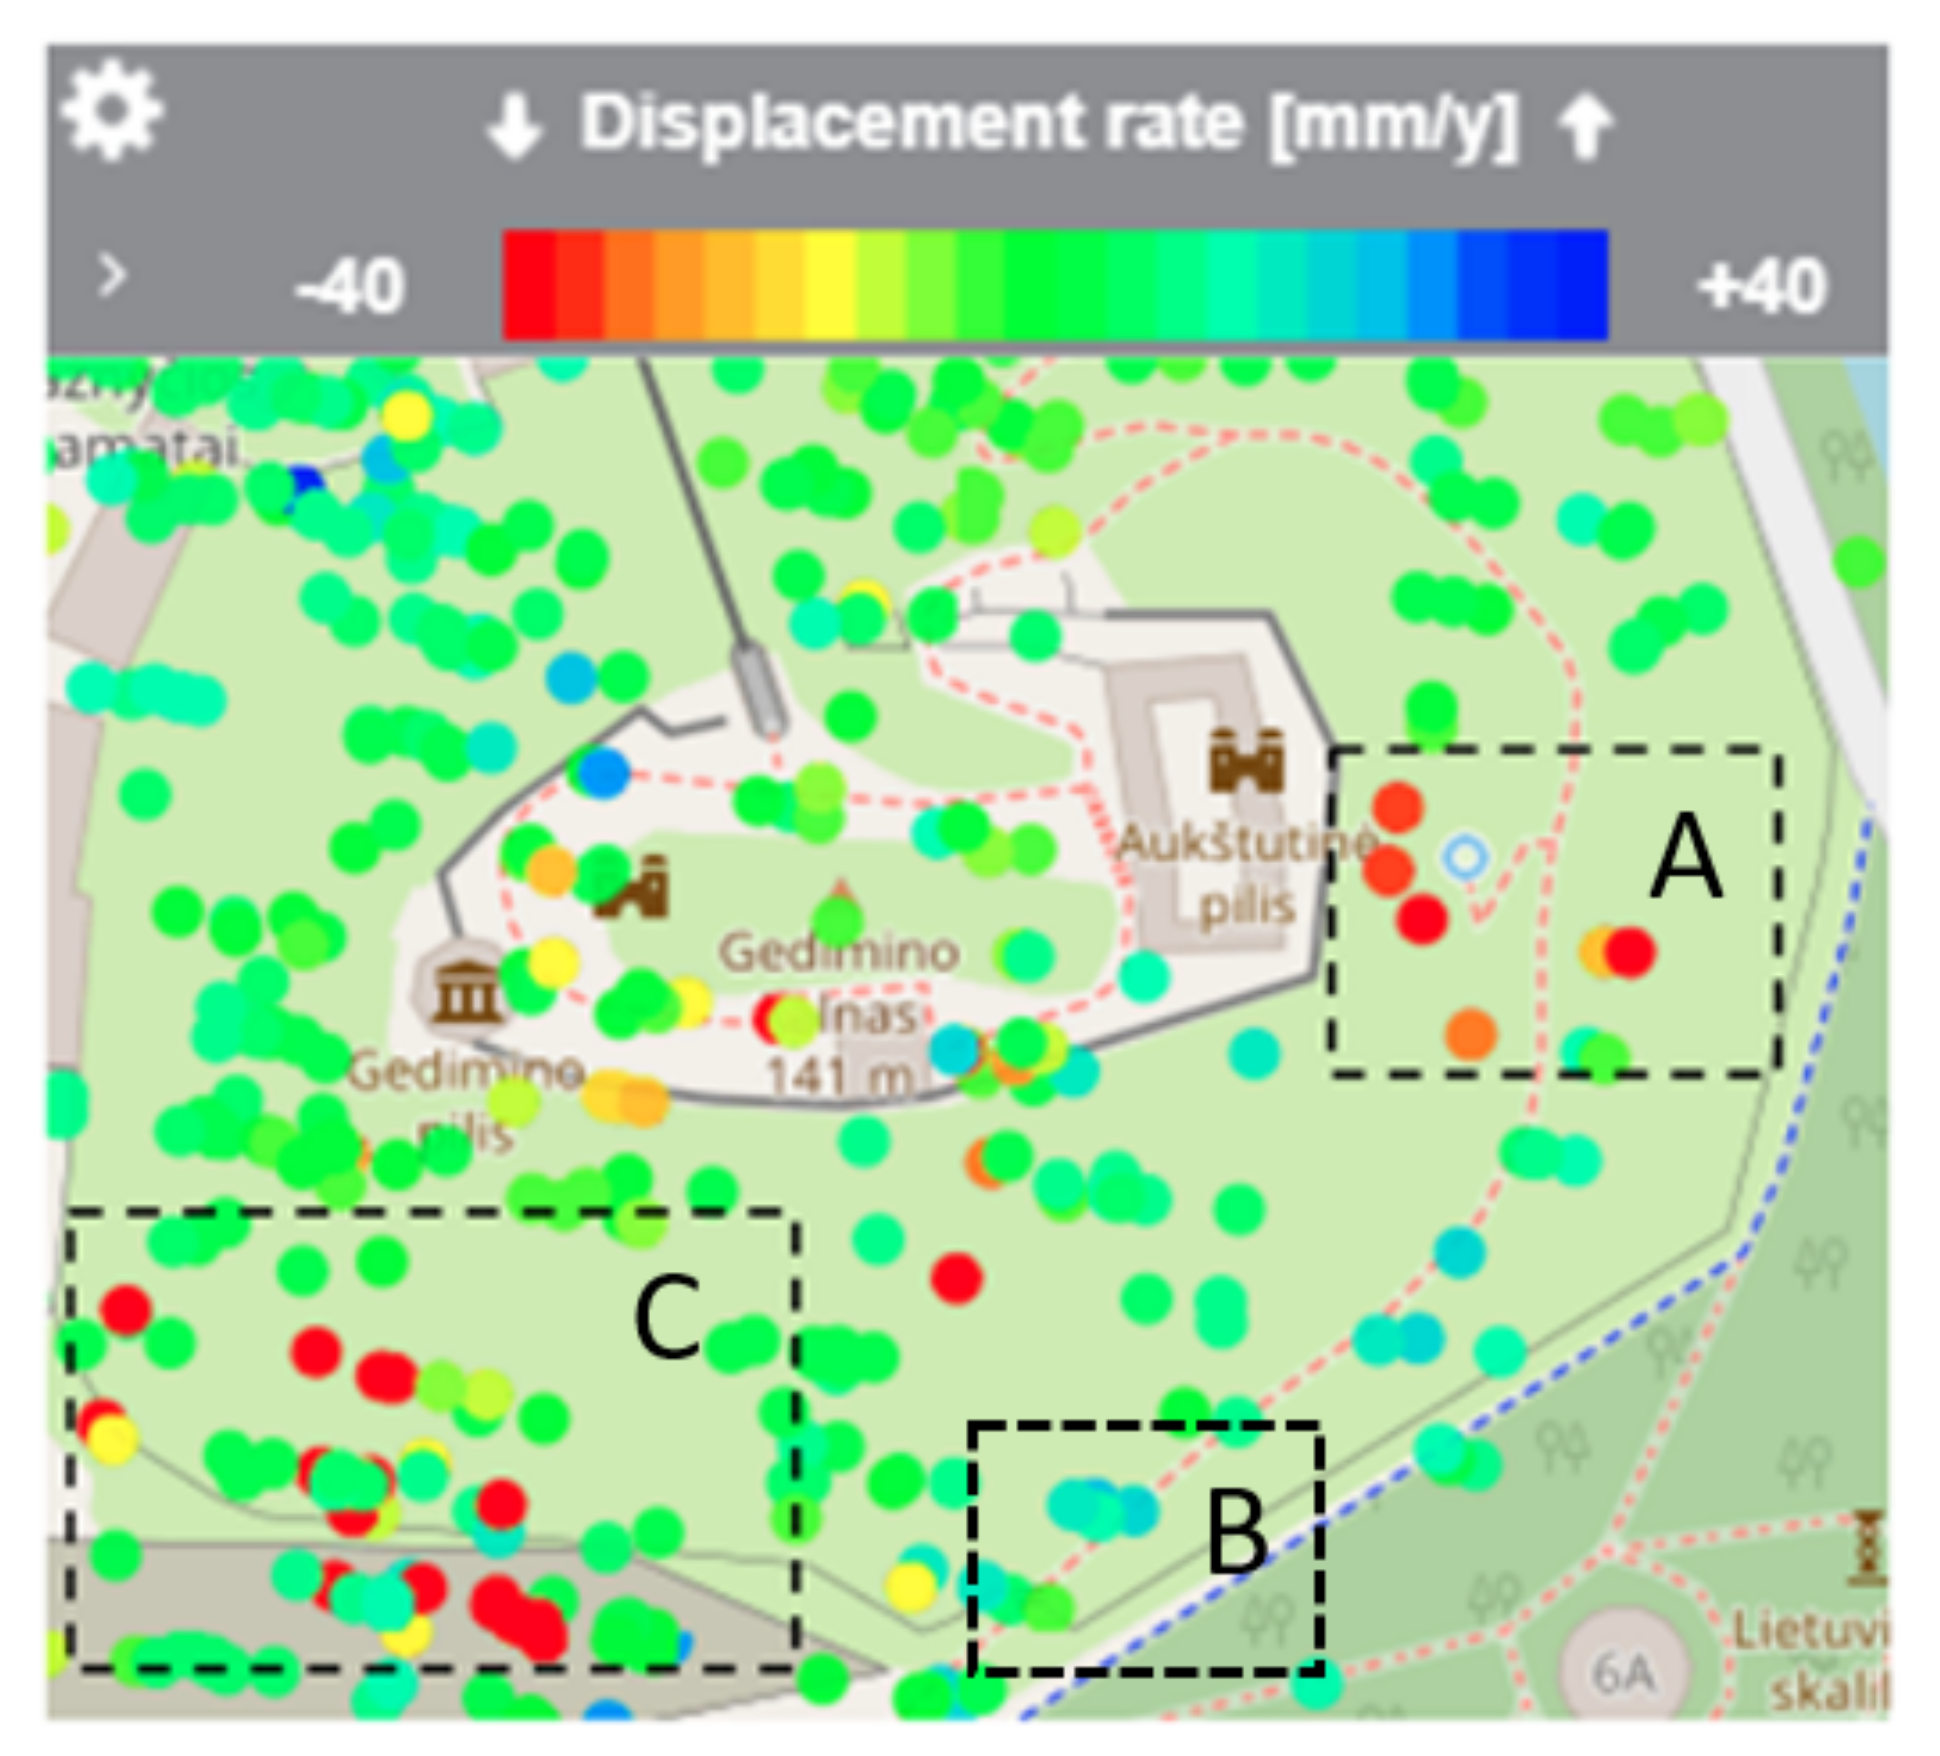
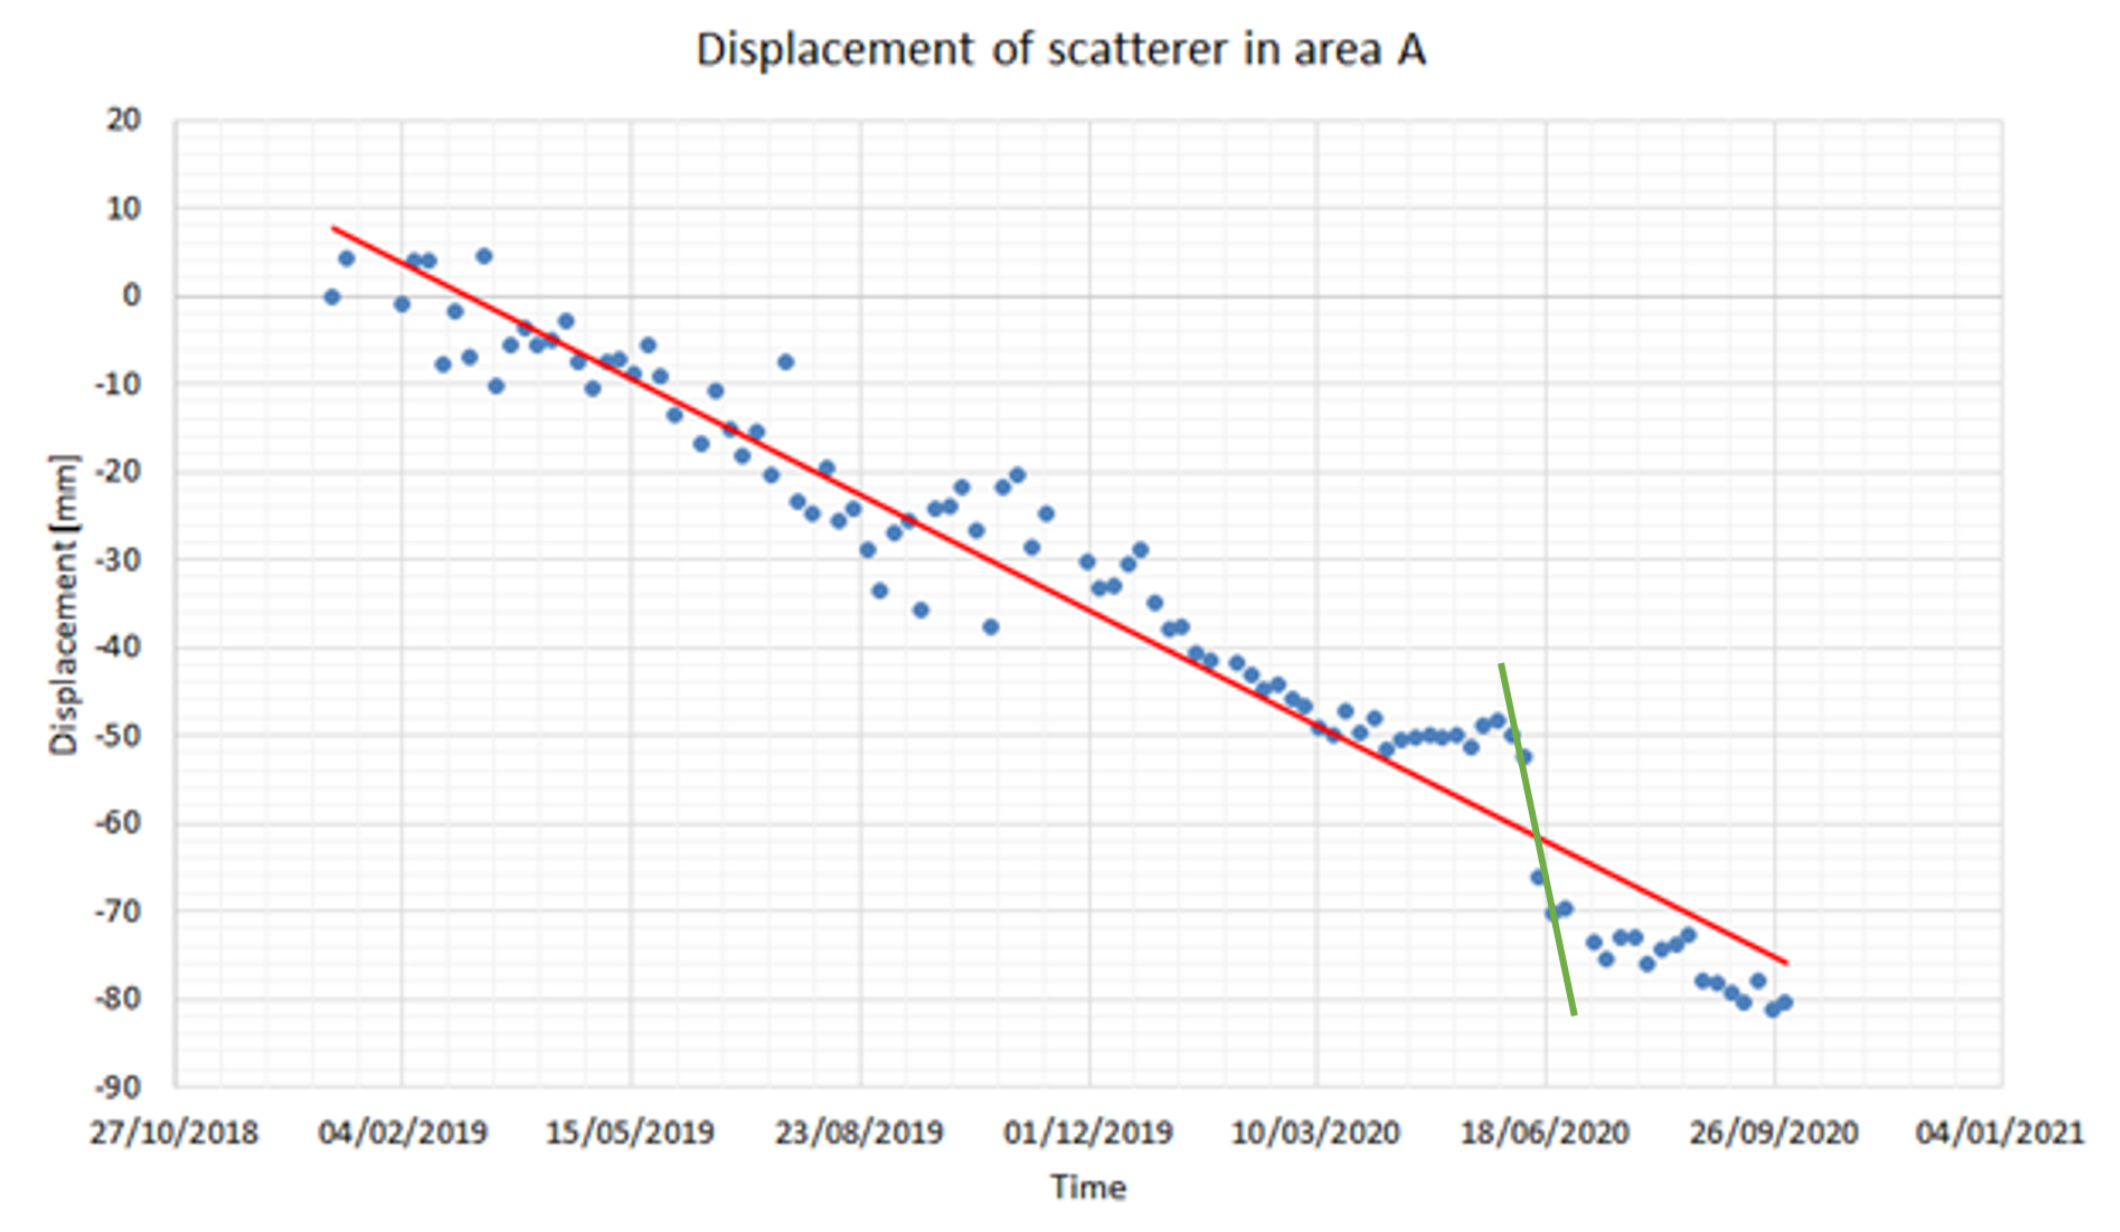
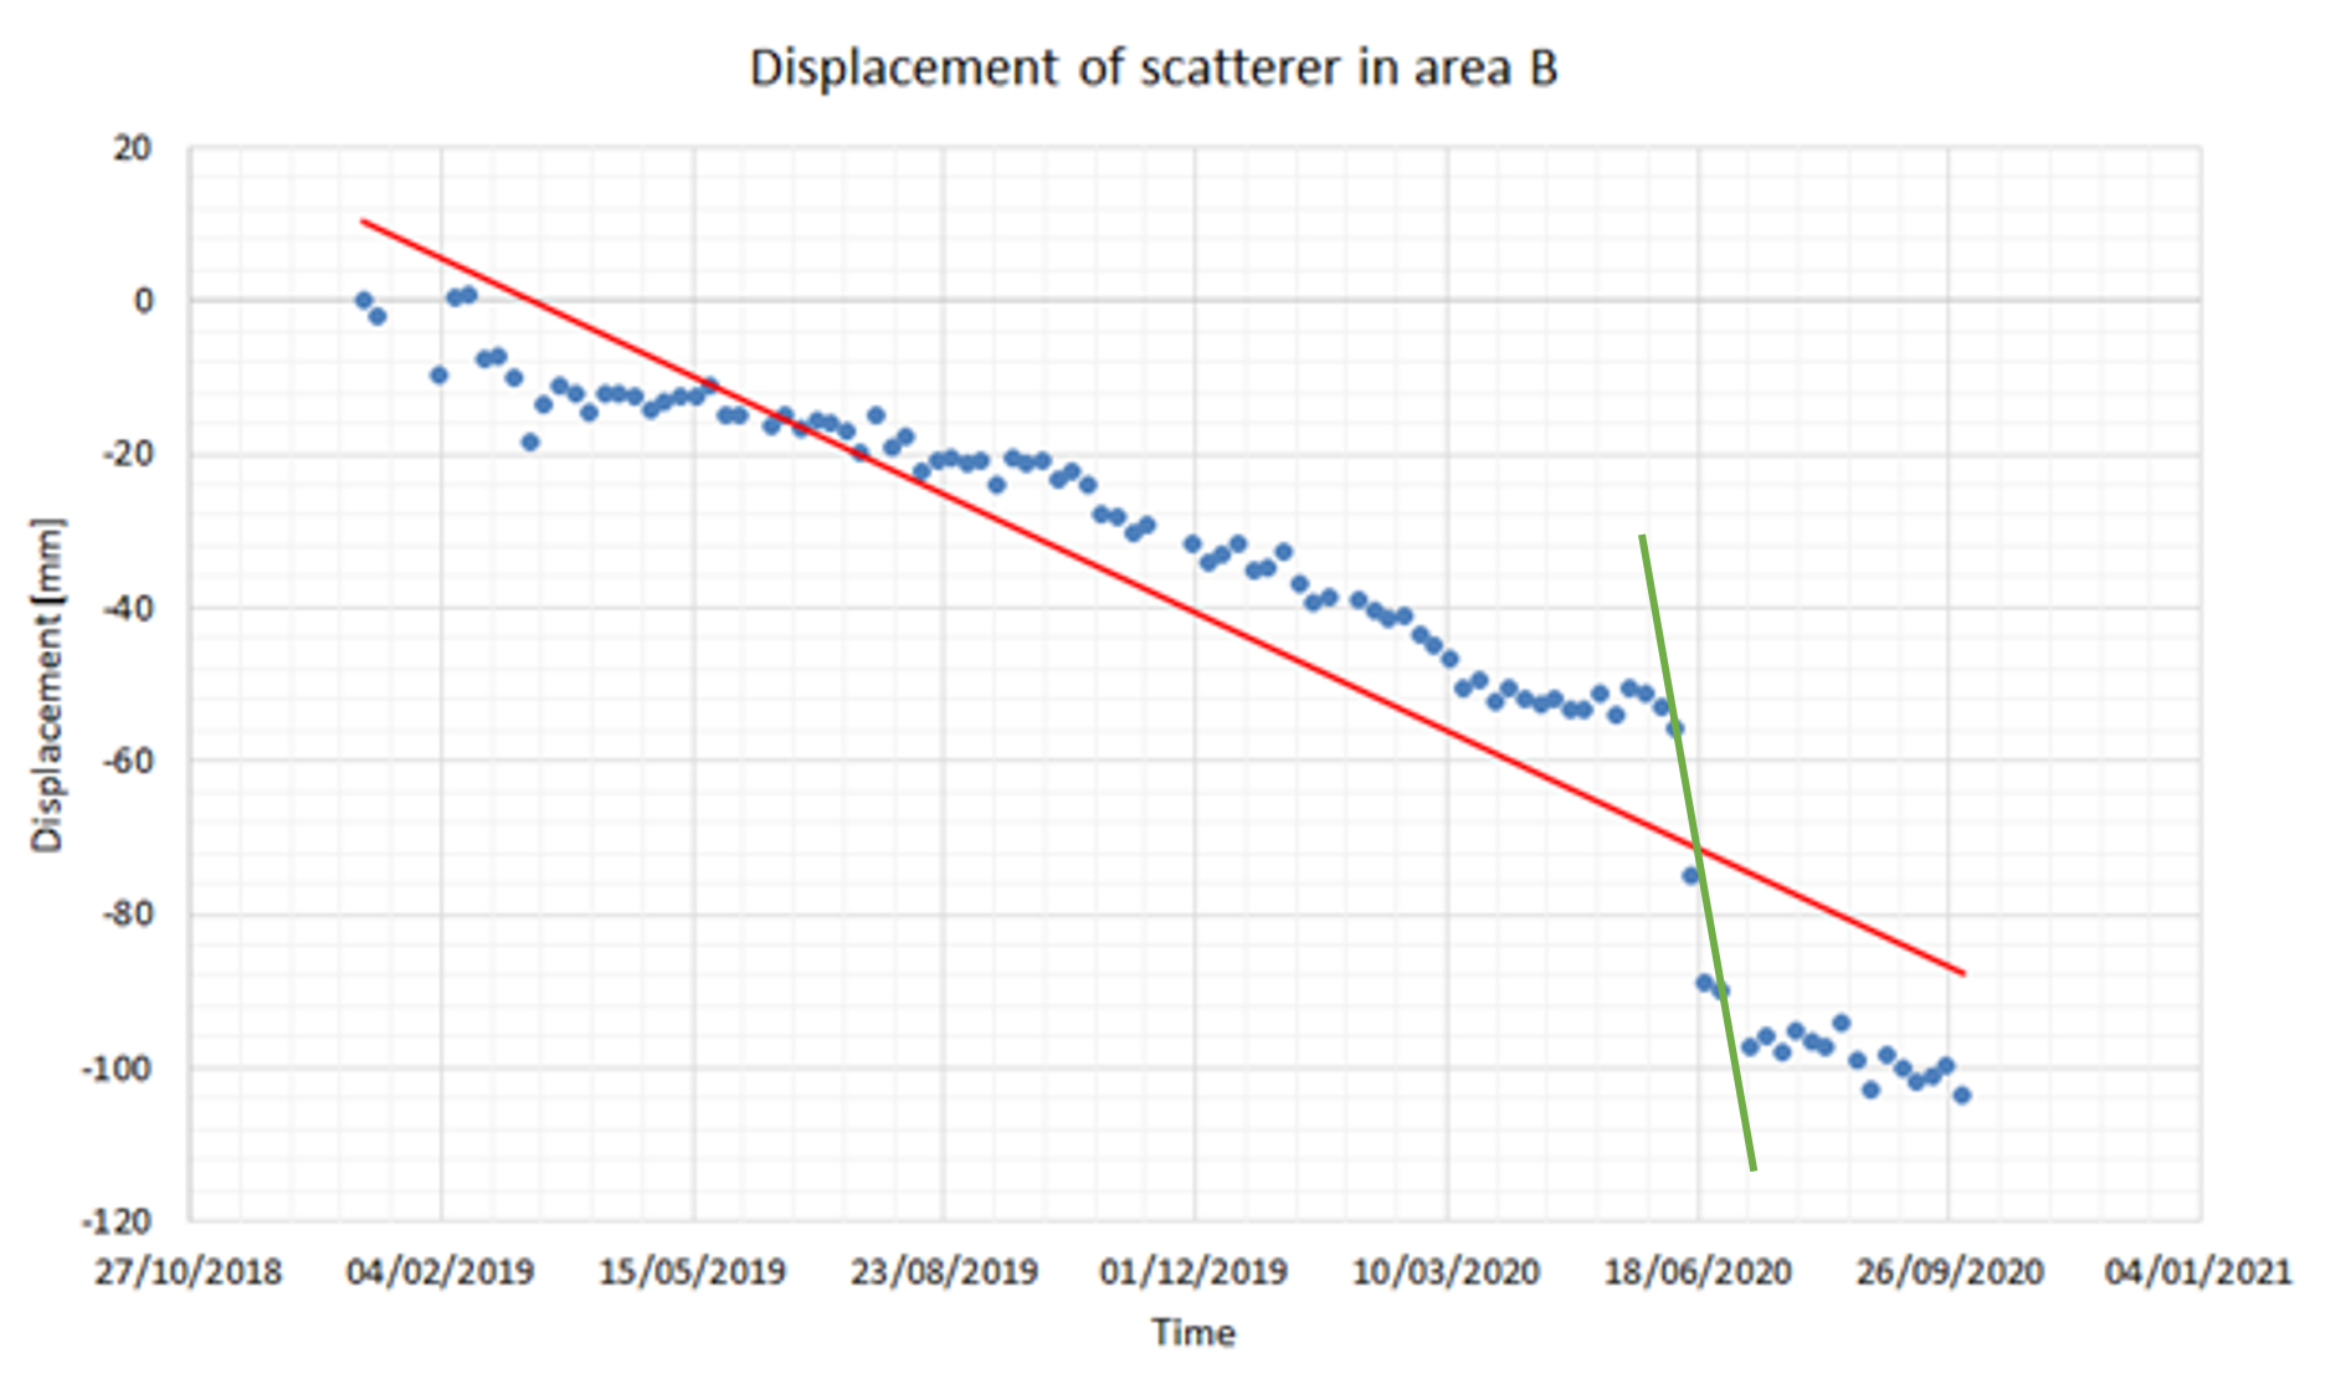
InSAR
3.3.2. July 2020
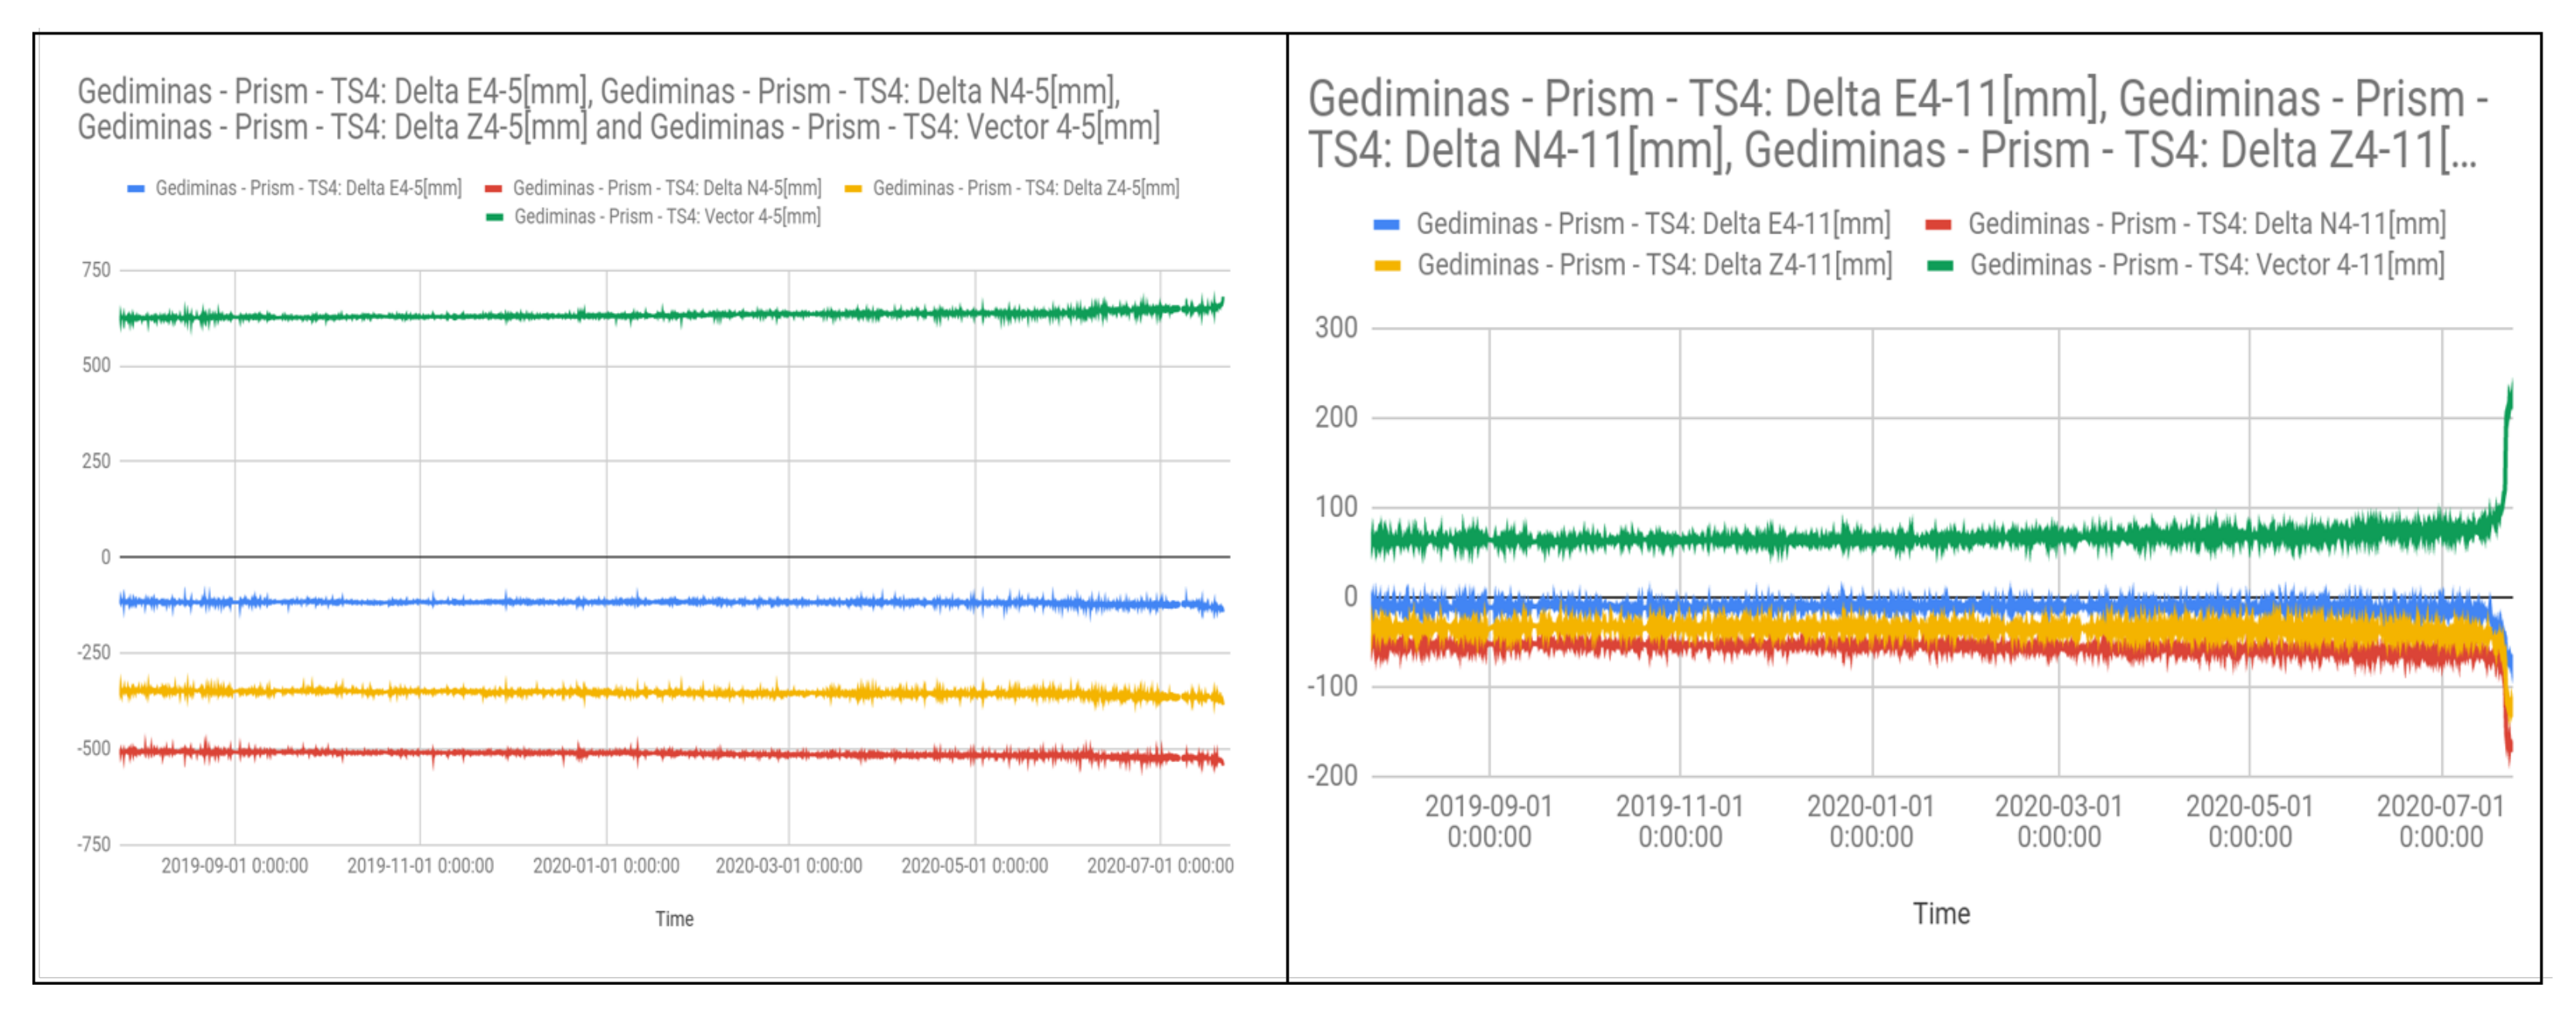
Robotic Total Stations
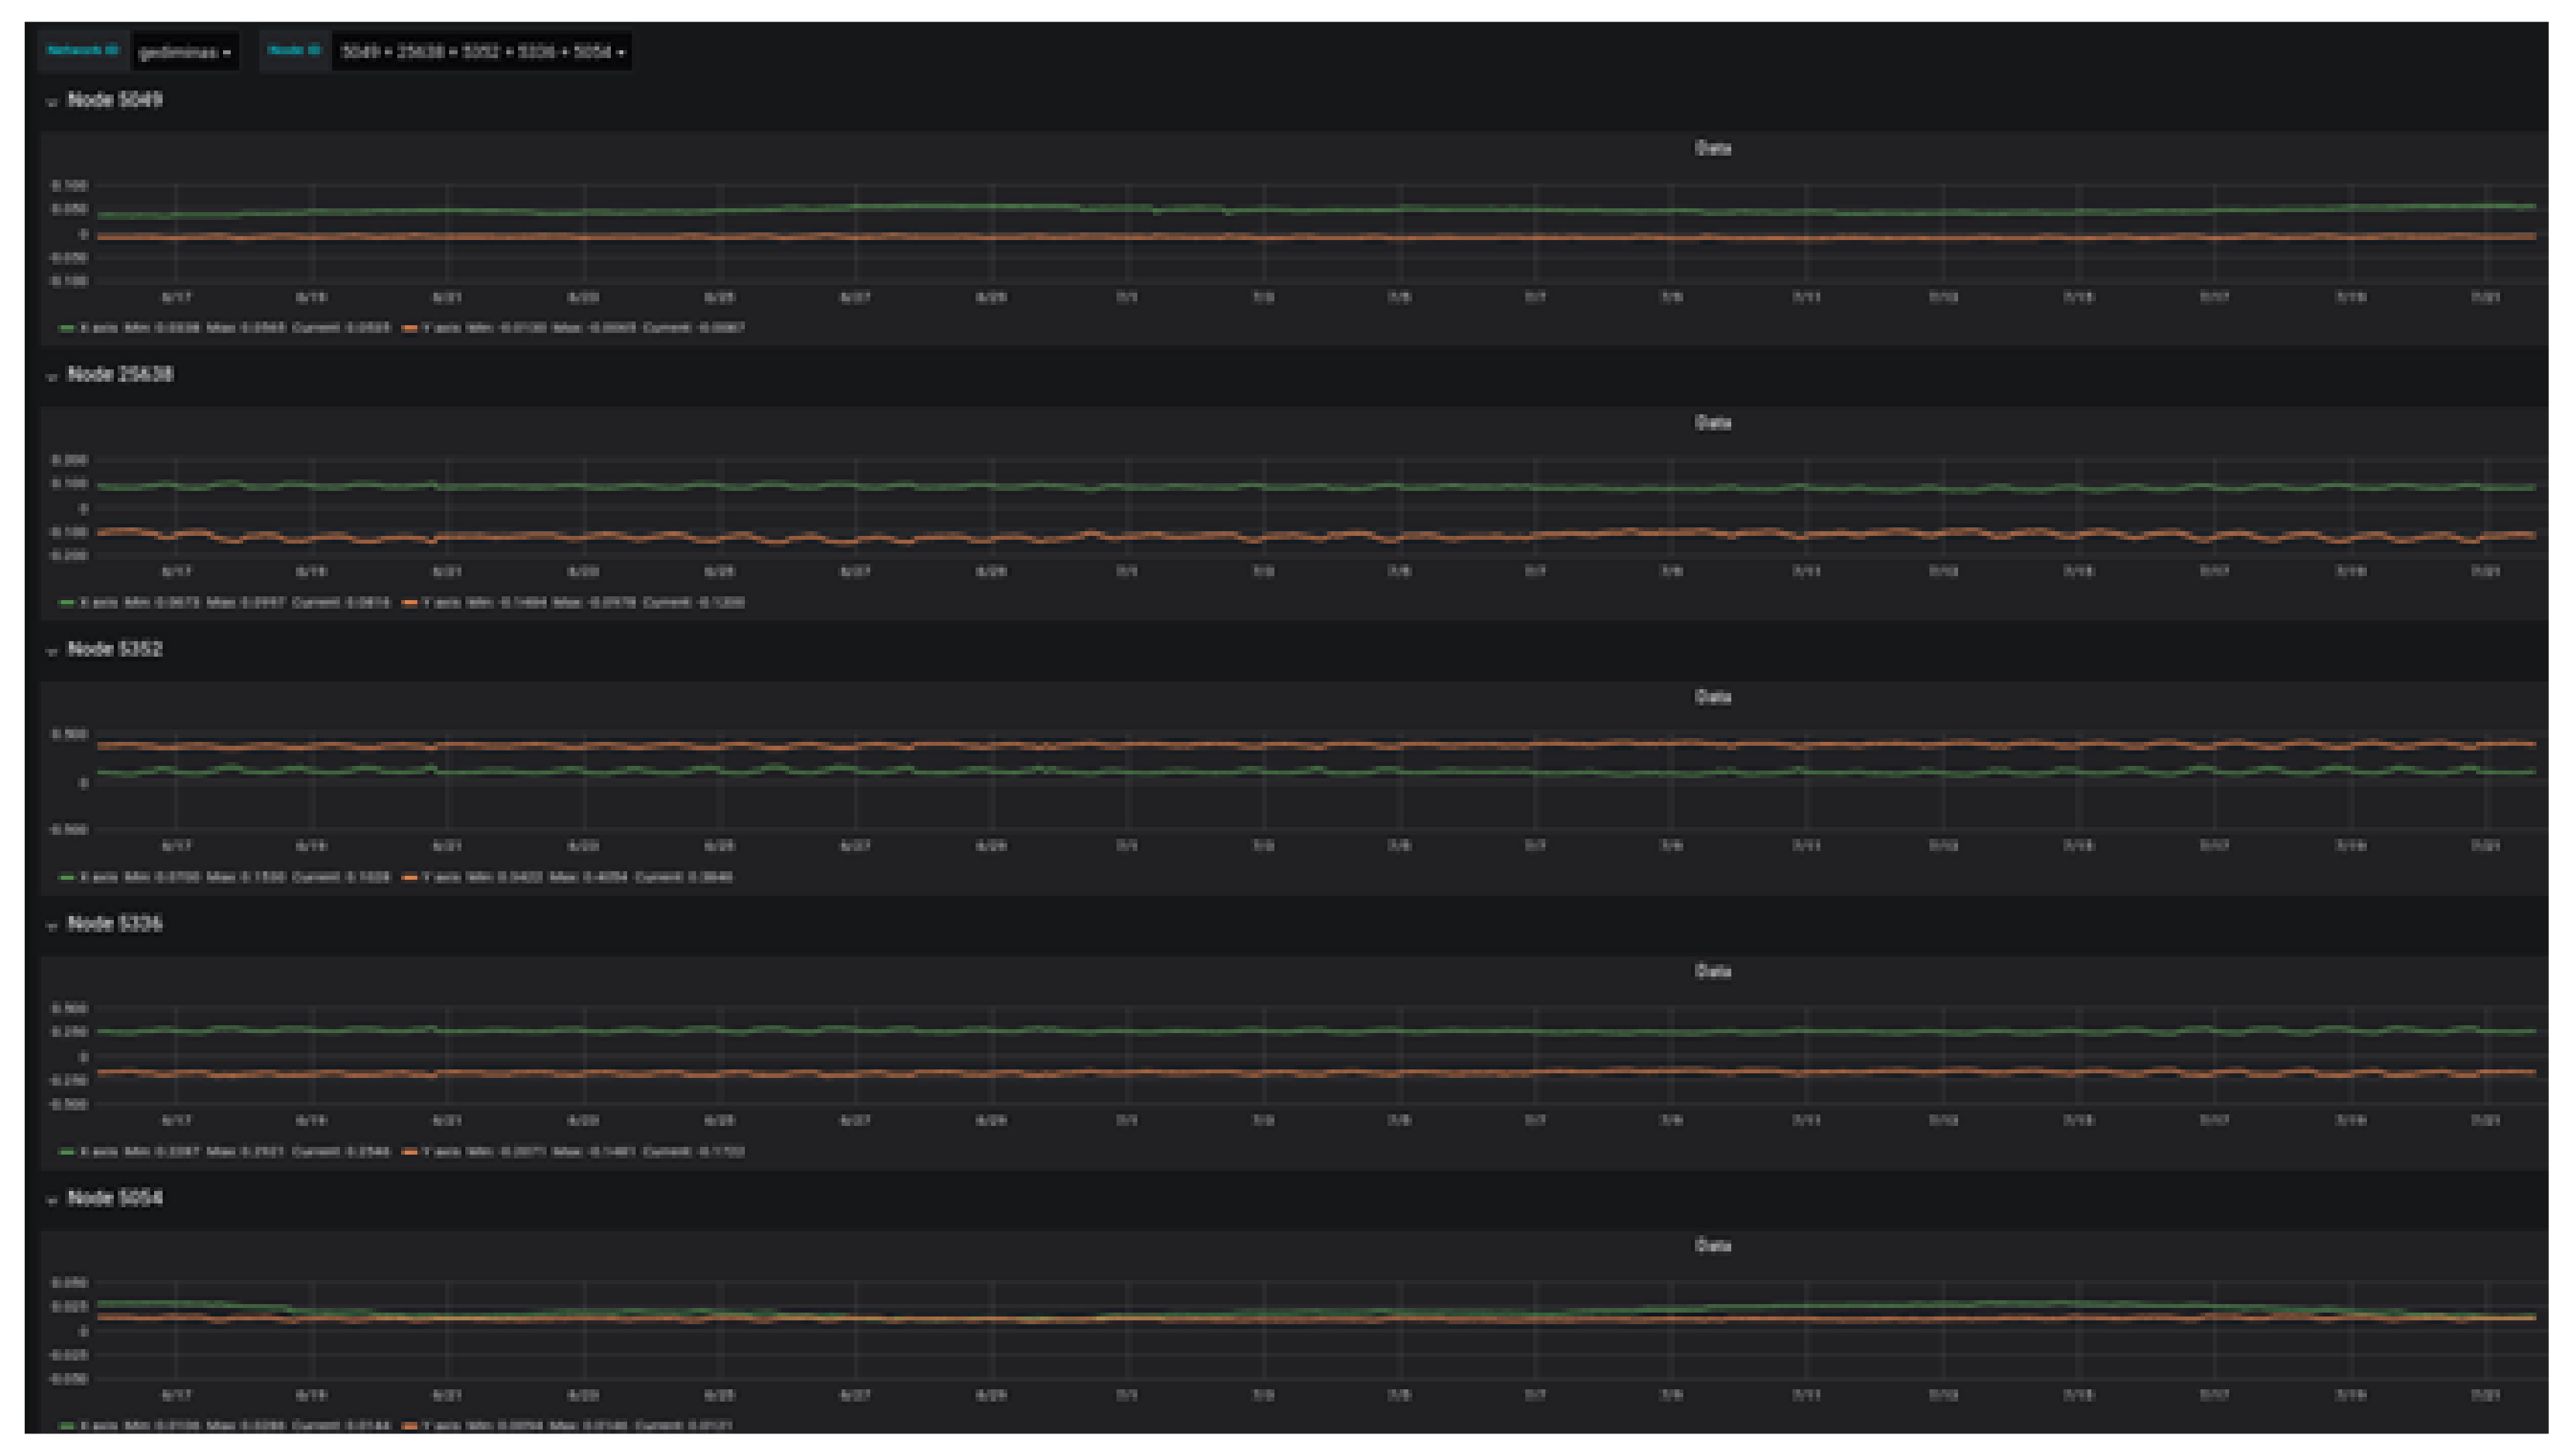
Tiltmeters
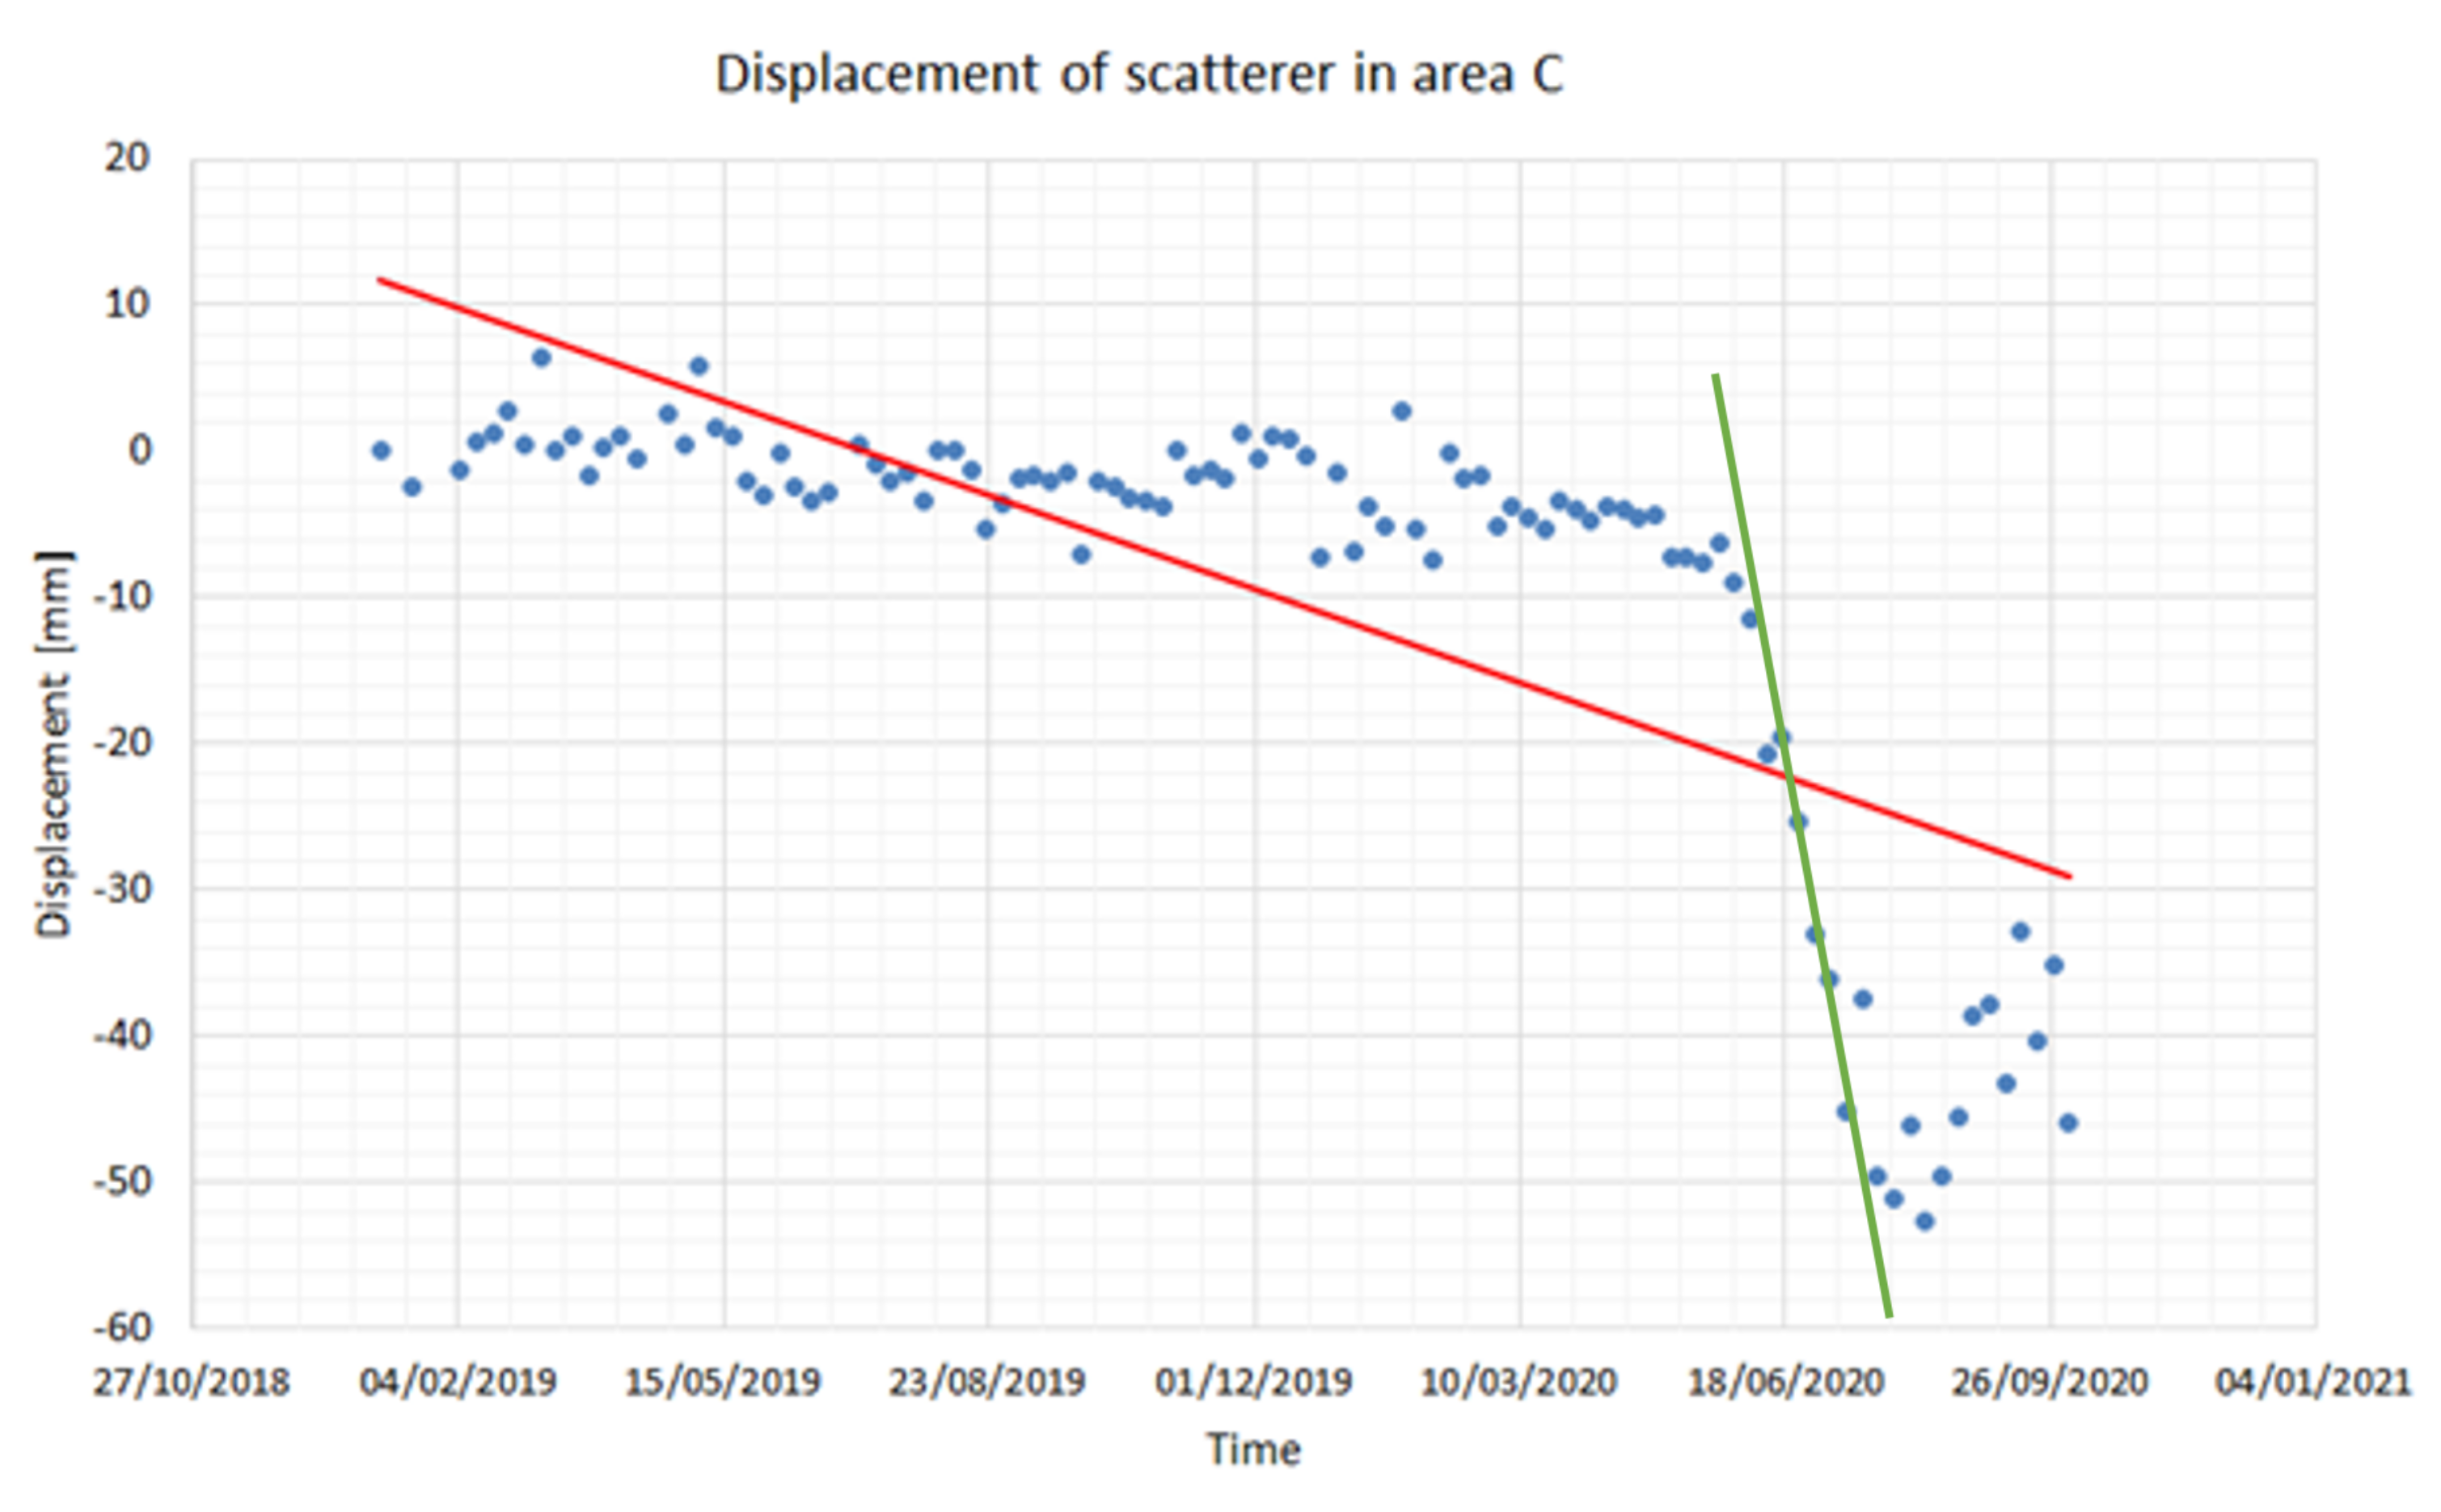
InSAR
4. Discussion
5. Conclusions
Author Contributions
Funding
Institutional Review Board Statement
Informed Consent Statement
Data Availability Statement
Acknowledgments
Conflicts of Interest
Abbreviations
| 2D | 2-Dimensional |
| 3D | 3-Dimensional |
| ATS | Automated Total Station |
| DS | Distributed Scatterer |
| GNSS | Global Navigation Satellite System |
| GPS | Global Positioning System |
| IoT | Internet of Things |
| InSAR | Synthetic Aperture Radar Interferometry |
| LoRa | Long Range |
| LOS | Line of Sight |
| PS-InSAR | Persistent Scatterer Synthetic Aperture Radar Interferometry |
| ROI | Region of Interest |
| RTS | Robotic Total Station |
| SAR | Synthetic Aperture Radar |
| TLS | Terrestrial Laser Scanning |
References
- US Geological Survey. Available online: https://www.usgs.gov/natural-hazards/landslide-hazards (accessed on 9 April 2021).
- Senouci, O. Mining: A Key Human Cause of Landslides. Int. Res. J. Eng. Technol. 2020, 7, 6604–6606. [Google Scholar]
- Mining—Statistics and Facts. Available online: https://www.statista.com/topics/1143/mining/#:~:text=Consequently (accessed on 7 April 2021).
- Barbarella, M.; Fiani, M. Monitoring of large landslides by Terrestrial Laser Scanning techniques: Field data collection and processing. Eur. J. Remote Sens. 2013, 46, 126–151. [Google Scholar] [CrossRef]
- Singhroy, V.; Mattar, K.E.; Gray, A.L. Landslide characterisation in Canada using interferometric SAR and combined SAR and TM images. Adv. Space Res. 1998, 21, 465–476. [Google Scholar] [CrossRef]
- Massonnet, D.; Feigl, K.L. Radar interferometry and its application to changes in the Earth’s surface. Rev. Geophys. 1998, 36, 441–500. [Google Scholar] [CrossRef] [Green Version]
- Zaki, A.; Chai, H.K.; Razak, H.A.; Shiotani, T. Monitoring and evaluating the stability of soil slopes: A review on various available methods and feasibility of acoustic emission technique. Comptes Rendus Geosci. 2014, 346, 223–232. [Google Scholar] [CrossRef]
- Highland, L.M.; Bobrowsky, P. Appendix B. In Introduction to Landslide Evaluation Tools—Mapping, Remote Sensing, and Monitoring of Landslides. In The Landslide Handbook—A Guide to Understanding Landslides; U.S. Geological Survey Circular: Reston, VI, USA, 2008; pp. 65–74. [Google Scholar]
- El Moulat, M.; Debauche, O.; Mahmoudi, S.; Brahim, L.A.; Manneback, P.; Lebeau, F. Monitoring System Using Internet of Things For Potential Landslides. Procedia Comput. Sci. 2018, 134, 26–34. [Google Scholar] [CrossRef]
- Abraham, M.T.; Satyam, N.; Pradhan, B.; Alamri, A.M. IoT.based Geotechnical Monitoring of Unstable Slopes for Landslide Early Warning in the Darjeeling Himalayas. Sensors 2020, 20, 2611. [Google Scholar] [CrossRef] [PubMed]
- Elavarasi, K.; Nandhini, S. Landslide Monitoring and Tracking Using IoT Sensors. J. Phys. Conf. Ser. 2021, 1717, 012060. [Google Scholar] [CrossRef]
- Carlà, T.; Intrieri, E.; Raspini, F.; Bardi, F.; Farina, P.; Ferretti, A.; Colombo, D.; Novali, F.; Casagli, N. Perspectives on the prediction of catastrophic slope failures from satellite InSAR. Nat. Res. Sci. Rep. 2019, 9, 14137. [Google Scholar] [CrossRef] [PubMed] [Green Version]
- Aslan, G.; Founelis, M.; Raucoules, D.; De Michele, M.; Bernardie, S.; Cakir, Z. Landslide Mapping and Monitoring Using Persistent Scatter Interferometry (PSI) Technique in the French Alps. Remote Sens. 2020, 12, 1305. [Google Scholar] [CrossRef] [Green Version]
- Wasowski, J.; Bovenga, F. Investigating landslides and unstable slopes with satellite Multi Temporal Interferometry: Current issues and future perspectives. Eng. Geol. 2014, 174, 103–138. [Google Scholar] [CrossRef]
- Carnec, C.; Massonnet, D.; King, C. Two examples of the use of SAR interferometry on displacement fields of small spatial extent. Geophys. Res. Lett. 1996, 23, 3579–3582. [Google Scholar] [CrossRef]
- Colombo, D.; MacDonald, B. Using advanced InSAR techniques as a remote tool for mine site monitoring. In Proceedings of the International Symposium on Slope Stability in Open Pit Mining and Civil Engineering, Nantes, France, 12–14 October 2015. [Google Scholar]
- Ma, C.; Cheng, X.; Yang, Y.; Zhang, X.; Guo, Z.; Zou, Y. Investigation on Mining Subsidence Based on Multi-Temporal InSAR and Time-Series Analysis of the Small Baseline Subset—Case Study of Working Faces 22201-1/2 in Bu’ertai Mine, Shendong Coalfield, China. Remote Sens. 2016, 8, 951. [Google Scholar] [CrossRef] [Green Version]
- Xiong, S.; Muller, J.P.; Li, G. The application of ALOS/PALSAR InSAR to measure subsurface penetration depths in deserts. Remote Sens. 2017, 9, 638. [Google Scholar] [CrossRef] [Green Version]
- Natsuaki, R.; Nagai, H.; Motohka, T.; Ohki, M.; Watanabe, M.; Thapa, R.B.; Tadono, T.; Shimada, M.; Suzuki, S. SAR interferometry using ALOS-2 PALSAR-2 data for the Mw 7.8 Gorkha, Nepal earthquake. Earth Planets Space 2016, 68. [Google Scholar] [CrossRef] [Green Version]
- Qu, F.; Zhang, Q.; Lu, Z.; Zhao, C.; Yang, C.; Zhang, J. Land subsidence and ground fissures in Xi’an, China 2005–2012 revealed by multi-band InSAR time-series analysis Remote Sensing of Environment Land subsidence and ground fi ssures in Xi’an, China 2005–2012 revealed by multi-band InSAR time-series analysis. Remote Sens. Environ. 2014, 155, 366–376. [Google Scholar]
- Wegmüller, U.; Member, S.; Walter, D.; Spreckels, V.; Werner, C.L.; Memeber, S. Nonuniform Ground Motion Monitoring with TerraSAR-X Persistent Scatterer Interferometry. IEEE Trans. Geosci. Remote Sens. 2010, 48, 895–904. [Google Scholar] [CrossRef]
- Tarchi, D.; Casagli, N.; Fanti, R.; Leva, D.D.; Luzi, G.; Pasuto, A.; Pieraccini, M.; Silvano, S. Landslide monitoring by using ground-based SAR interferometry: An example of application to the Tessina landslide in Italy. Eng. Geol. 2003, 68, 15–30. [Google Scholar] [CrossRef]
- InSAR Technical Background. Available online: https://skygeo.com/insar-technical-background/ (accessed on 5 July 2021).
- Venmans, A.A.M.; de Kelder, M.; de Jong, J.; Korff, M.; Houtepen, M. Reliability of InSAR satellite monitoring of buildings nearinner city quay walls. Proc. IAHS 2020, 382, 195–199. [Google Scholar] [CrossRef] [Green Version]
- Van Leijen, F.J. Persistent Scatterer Interferometry Based on Geodetic Estimation Theory. Ph.D. Thesis, Delft University of Technology, Delft, The Netherlends, 2014. [Google Scholar] [CrossRef]
- Lenda, G.; Uznanski, A.; Strach, M. Influence of time delays of robotic total stations with high sampling frequency on accuracy of measurements to moving prisms. Arch. Civ. Eng. 2019, LXV, 31–48. [Google Scholar] [CrossRef] [Green Version]
- Terzaghi, K. Theoretical Soil Mechanics; John Wiley and Sons, Inc.: New York, NY, USA, 1943. [Google Scholar] [CrossRef]
- Peck, R.B. Advantages and limitations of the observational method in applied soil mechanics. Geotechnique 1969, 19, 171–187. [Google Scholar] [CrossRef] [Green Version]
- Mazzanti, P. Toward Transportation Asset Management: What is the role of geotechnical monitoring? J. Civ. Struct. Health Monit. 2017, 7, 645–656. [Google Scholar] [CrossRef]
- Chung, W.W.S.; Tariq, S.; Mohandes, S.R.; Zayed, T. IoT-based application for construction site safety monitoring. Int. J. Constr. Manag. 2020, 1–17. [Google Scholar] [CrossRef]
- Sharkar, D.; Patel, H.; Dave, B. Development of integrated cloud-based Internet of Things (IoT) platform for asset management of elevated metro rail projects. Int. J. Constr. Manag. 2020, 1–10. [Google Scholar] [CrossRef]
- Bartoli, A.; Guilhot, D.; Vilajosana, X. Boosting a More Efficient Tailings Dam Risk Management Service through an Innovative IoT Ecosystem. In Proceedings of the 24th International Conference on Tailings Mine Waste, Fort Collins, CO, USA, 15 November 2020; pp. 649–660. [Google Scholar]
- Milkulenas, V.; Minkevicius, V.; Satkunas, J. Gediminas’s Castle Hill (in Vilnius) case: Slopes failure through historical times until present. Proc. World Landslide Forum 2017, 4, 69–76. [Google Scholar]
- 2020 Was Lithuania’s Warmest Year on Record. Available online: https://www.delfi.lt/en/lifestyle/2020-was-lithuanias-warmest-year-on-record.d?id=86157103 (accessed on 8 June 2021).
- Treuhaft, R.N.; Law, B.E.; Asner, G.P. Forest Attributes from Radar Interferometric Structure and Its Fusion with Optical Remote Sensing. BioScience 2004, 54, 561–571. [Google Scholar] [CrossRef] [Green Version]
- Carlà, T.; Tofani, V.; Lombardi, L.; Raspini, F.; Bianchini, S.; Bertolo, D.; Thuegaz, P.; Casagli, N. Combination of GNSS, satellite InSAR, and GBInSAR remote sensing monitoring to improve the understanding of a large landslide in high alpine environment. Geomorphology 2019, 335, 62–75. [Google Scholar] [CrossRef]
- Wei, M.; Sandwell, D.; Smith-Konter, B. Optimal combination of InSAR and GPS for measuring interseismic crustal deformation. Adv. Space Res. 2010, 46, 236–249. [Google Scholar] [CrossRef]
- Carlà, T.; Farina, P.; Intrieri, E.; Ketizmen, H.; Casagli, N. Integration of ground-based radar and satellite InSAR data for the analysis of an unexpected slope failure in an open-pit mine. Eng. Geol. 2018, 235, 39–52. [Google Scholar] [CrossRef]
- Shamshiri, R.; Motagh, M.; Maes, M.; Sharifi, M.A. Insar and Finite Element Analysis of Ground Deformation at Lake Urmia Causeway (luc), Northwest Iran. Int. Arch. Photogramm. Remote Sens. Spat. Inf. Sci. 2013, w3, 389–391. [Google Scholar] [CrossRef] [Green Version]
- Available online: https://site.tre-altamira.com/rocscience-3d-slope-stability-programs-now-integrated-with-our-satellite-insar-data/ (accessed on 24 August 2020).
- Selvakumaran, S.; Rossi, C.; Marinoni, A.; Webb, G.; Bennetts, J.; Barton, E.; Plank, S.; Middleton, C. Combined InSAR and Terrestrial Structural Monitoring of Bridges. IEEE Trans. Geosci. Remote Sens. 2020, 58, 7141–7153. [Google Scholar] [CrossRef]
- Lastra, A.; Gonzalez, P.; Beniamino, R.; Rodriguez Solá, R.; Ribalaygua, J. Escenarios de cambio climático para eventos pluviométricos severos en la Comunidad de Madrid. In Cuadernos de I+D+i 27; Canal de Isabel II: Madrid, Spain, 2018. [Google Scholar]
- DiMartire, D.; Iglesias, R.; Monells, D.; Centolanza, G.; Sica, S.; Ramondini, M.; Pagano, L.; Mallorqui, J.; Calcaterra, D. Comparison between Differential SAR interferometry and ground measurements data in the displacement monitoring of the earth-dam of Conza della Campania (Italy). Remote Sens. Environ. 2014, 148, 58–69. [Google Scholar] [CrossRef]
- Tofani, V.; Raspini, F.; Catani, F.; Casagli, N. Persistent Scatterer Interferometry (PSI) Technique for Landslide Characterization and Monitoring. Remote Sens. 2013, 5, 1045–1065. [Google Scholar] [CrossRef] [Green Version]
- Antronico, L.; Borrelli, L.; Peduto, D.; Fornaro, G.; Gulla, G.; Paglia, L.; Zeni, G. Conventional and Innovative Techniquesfor the Monitoring of Displacementsin Landslide Affected Area. In Landslide Science and Practice; Margottini, C., Canuti, P., Sassa, K., Eds.; Springer: Berlin/Heidelberg, Germany, 2013; pp. 125–131. [Google Scholar]
- Salem, M.; El-Sherbiny, R. Comparison of measured and calculated consolidation settlements of thick underconsolidated clay. Alex. Eng. J. 2013. [Google Scholar] [CrossRef] [Green Version]
- Wasswa, B.; Kakitahi, D.; JJuuko, S.; Semuwemba, J.; Kalumba, D. Study of Slope Stability and Settlement Characteristics of Mpererwe Landfill. In Proceedings of the Pan American Conference on Soil Mechanics and Geotechnical Engineering, Buenos Aires, Argentina, 15–18 November 2015. [Google Scholar]


| ID | Easting | Northing | Up | Total (mm) |
|---|---|---|---|---|
| 3–10 | + + | + | - - | 40 |
| 3–12 | 0 | - | - | 20 |
| 3–14 | + | - - | - - | 30 |
| 3–18 | + | - | - | 20 |
| Tiltmeter | Displacement in Each Direction (mm) |
|---|---|
| 5062 (T9) | [−1.5;−0.3] |
| 5100 (T11) | [−1.5;1.2] |
| 5322 (T18) | [−0.6;−0.8] |
| 5070 (T15) | [−2;−1.2] |
| ID | Easting | Northing | Up | Total (mm) |
|---|---|---|---|---|
| 4–5 | - | - | - | 30 |
| 4–11 | - - | - - | - - | 150 |
| RTS ID | RTS Disp. (mm) | Tiltmeter ID | Tiltmeter Disp. Axis 1 (mm) | Tiltmeter Disp. Axis 2 (mm)) | InSAR Scatterer ID | InSAR Short Term Disp. (mm)) | InSAR Long Term Disp. (mm)) |
|---|---|---|---|---|---|---|---|
| 3–10 | 40 | 5062 (T9) | −1.5 | −0.3 | A | −13 | −80 |
| 3–12 | 20 | 5100 (T11) | −1.5 | 1.2 | B | −18 | −100 |
| 3–14 | 30 | 5322 (T18) | −0.6 | −0.8 | - | - | - |
| 3–18 | 20 | 5070 (T15) | −2 | −1.2 | - | - | - |
| RTS ID | RTS Disp. (mm) | Tiltmeter ID | Tiltmeter Disp. Axis 1 (mm) | Tiltmeter Disp. Axis 2 (mm) | InSAR Scatterer ID | InSAR Short Term Disp. (mm) | InSAR Long Term Disp. (mm) |
|---|---|---|---|---|---|---|---|
| 4–5 | 30 | 5336 | - | - | C | −5 | −53 |
| 4–11 | 150 | 5049 | - | - | - | - | - |
| - | - | 5352 | - | - | - | - | - |
| - | - | 5054 | - | - | - | - | - |
| - | - | 25,638 | - | - | - | - | - |
Publisher’s Note: MDPI stays neutral with regard to jurisdictional claims in published maps and institutional affiliations. |
© 2021 by the authors. Licensee MDPI, Basel, Switzerland. This article is an open access article distributed under the terms and conditions of the Creative Commons Attribution (CC BY) license (https://creativecommons.org/licenses/by/4.0/).
Share and Cite
Guilhot, D.; Martinez del Hoyo, T.; Bartoli, A.; Ramakrishnan, P.; Leemans, G.; Houtepen, M.; Salzer, J.; Metzger, J.S.; Maknavicius, G. Internet-of-Things-Based Geotechnical Monitoring Boosted by Satellite InSAR Data. Remote Sens. 2021, 13, 2757. https://doi.org/10.3390/rs13142757
Guilhot D, Martinez del Hoyo T, Bartoli A, Ramakrishnan P, Leemans G, Houtepen M, Salzer J, Metzger JS, Maknavicius G. Internet-of-Things-Based Geotechnical Monitoring Boosted by Satellite InSAR Data. Remote Sensing. 2021; 13(14):2757. https://doi.org/10.3390/rs13142757
Chicago/Turabian StyleGuilhot, Denis, Toni Martinez del Hoyo, Andrea Bartoli, Pooja Ramakrishnan, Gijs Leemans, Martijn Houtepen, Jacqueline Salzer, John S. Metzger, and Gintaris Maknavicius. 2021. "Internet-of-Things-Based Geotechnical Monitoring Boosted by Satellite InSAR Data" Remote Sensing 13, no. 14: 2757. https://doi.org/10.3390/rs13142757
APA StyleGuilhot, D., Martinez del Hoyo, T., Bartoli, A., Ramakrishnan, P., Leemans, G., Houtepen, M., Salzer, J., Metzger, J. S., & Maknavicius, G. (2021). Internet-of-Things-Based Geotechnical Monitoring Boosted by Satellite InSAR Data. Remote Sensing, 13(14), 2757. https://doi.org/10.3390/rs13142757