Article

Target Detection Network for SAR Images Based on Semi-Supervised Learning and Attention Mechanism

The National Lab of Radar Signal Processing, Xidian University, Xi’an 710071, China
*
Author to whom correspondence should be addressed.
Remote Sens. 2021, 13(14), 2686; https://doi.org/10.3390/rs13142686
Submission received: 24 May 2021 / Revised: 5 July 2021 / Accepted: 5 July 2021 / Published: 8 July 2021
(This article belongs to the Special Issue Advances in SAR Image Processing and Applications)

Abstract

:
The existing Synthetic Aperture Radar (SAR) image target detection methods based on convolutional neural networks (CNNs) have achieved remarkable performance, but these methods require a large number of target-level labeled training samples to train the network. Moreover, some clutter is very similar to targets in SAR images with complex scenes, making the target detection task very difficult. Therefore, a SAR target detection network based on a semi-supervised learning and attention mechanism is proposed in this paper. Since the image-level label simply marks whether the image contains the target of interest or not, which is easier to be labeled than the target-level label, the proposed method uses a small number of target-level labeled training samples and a large number of image-level labeled training samples to train the network with a semi-supervised learning algorithm. The proposed network consists of a detection branch and a scene recognition branch with a feature extraction module and an attention module shared between these two branches. The feature extraction module can extract the deep features of the input SAR images, and the attention module can guide the network to focus on the target of interest while suppressing the clutter. During the semi-supervised learning process, the target-level labeled training samples will pass through the detection branch, while the image-level labeled training samples will pass through the scene recognition branch. During the test process, considering the help of global scene information in SAR images for detection, a novel coarse-to-fine detection procedure is proposed. After the coarse scene recognition determining whether the input SAR image contains the target of interest or not, the fine target detection is performed on the image that may contain the target. The experimental results based on the measured SAR dataset demonstrate that the proposed method can achieve better performance than the existing methods.

Graphical Abstract

1. Introduction

Synthetic aperture radar (SAR) is an active microwave remote sensor, which has the advantage of providing high-resolution and super-wide coverage remote sensing images in all-day and all-weather conditions. In recent years, with the vigorous development of SAR-related technologies, the rapid and accurate target detection of SAR images has become a very challenging task, and research into this topic is very valuable.
In the traditional SAR target detection methods, the constant false alarm rate (CFAR) detection method [1] is widely studied because of its simple model and fast detection speed. The CFAR detection method first calculates the detection threshold based on the statistical characteristics of the clutter and the given false alarm rate and then compares the current pixel with the threshold to determine whether it is a target. The two-parameter CFAR [1], also known as Gaussian CFAR, is a widely used CFAR detection method, which assumes that the background clutter of the SAR image obeys Gaussian distribution. The two-parameter CFAR can achieve excellent detection performance in some simple scenes, but detection performance will be reduced in complex scenes.
In recent years, with the development of deep learning technology, convolutional neural networks (CNNs) have achieved remarkable success in the fields of computer vision, speech processing, and so on [2]. CNN can extract the most suitable features for the current task using a data-driven method. Because of the powerful feature extraction capability, CNN-based target detection methods can achieve superior performance compared to many traditional methods. There are two types of target detection methods based on CNN. One is the two-stage target detector, including region-based CNN (R-CNN) [3], Faster R-CNN [4], and FPN [5], etc. The two-stage detector first extracts candidate regions from the input image and then performs further classification and bounding box regression on the candidate regions. The detection performance of this method is excellent, but the detection speed is slow. The other is the single-stage target detector, including you only look once (YOLO) [6] and single shot multibox detector (SSD) [7], etc. Without the candidate region extraction step, the detection speed of the single-stage detector is faster than the two-stage detector. Compared with YOLO, SSD can achieve higher detection performance by applying default boxes and multi-scale prediction [8]. Besides optical images, CNN-based target detection methods also achieve good detection performance in SAR images [9,10,11,12,13]. Wang et al. [11] proposed a SAR target detection method based on SSD and achieved good detection performance. Du et al. [12] proposed S-SSD target detection method, which integrates the saliency information into SSD and improves the detection performance.
Although the existing CNN-based SAR target detection methods can achieve good performance, most of them are fully supervised learning algorithms. The training of these networks requires a large number of target-level labeled training samples, which must include the targets of interest, and the positions of the targets in the images must be marked. However, in actual situations, it takes a lot of labor and material resources to label the SAR images at target-level. Semi-supervised learning target detection methods are effective to solve this problem. They require only a small number of target-level labeled training samples and an additional set of unlabeled or weakly labeled training samples. The image-level labeled training samples are the weakly-level labeled training samples. Compared with target-level labeling, image-level labeling is easier and requires less labor and material resources, which simply marks whether the image contains the target of interest or not and does not need to mark the specific location of the target. Therefore, the target detection network can be trained by a semi-supervised learning method using a small number of target-level labeled training samples and a large number of image-level labeled training samples. Rosenberg et al. [14] proposed a target detection method based on semi-supervised self-training. In this method, the self-training method is simply applied to an existing target detector, which improves the performance of target detection. Zhang et al. [15] proposed a target detection network based on a self-training method. In this method, negative slices are obtained from image-level labeled training samples and given pseudo-labels by the prediction results of the classifier, and then those negative slices are used to update the dataset and train the network. This method can achieve good detection performance for optical remote sensing images. The above methods can reduce the demand for the number of target-level labeled training samples in the network training process. However, those methods only use a simple target detection method as the basic framework for semi-supervised learning, and thus the detection performance will be degraded when the SAR image scene is complex in practice. Further, since some clutter and the targets are relatively similar in SAR images with complex scenes, there is a risk that the clutter could be wrongly selected as the target during the sample selection process of the self-training method.
SAR images with complex scenes contain significant amounts of clutter, and some man-made clutter is very similar to the target of interest in shape contour and the distribution of scattering intensity, making them difficult to discriminate. As a result, there may be many false alarms in the detection results. The attention mechanism is one of the most effective methods to solve this problem. The idea of the attention mechanism is to automatically focus on important regions and suppressing unnecessary ones by learning from the data [16], therefore, the performance of the CNN can be improved by using attention mechanisms. Woo et al. [16] proposed a convolutional block attention module (CBAM), a channel and spatial attention module that can be easily integrated into CNN architectures, which improved the performance of target detection and classification. Jetley et al. [17] proposed an end-to-end attention module for CNN architectures built for image classification. This method generates attention maps using global features and local features to enhance the targets and suppress the background, and its classification performance is better than other traditional CNN-based methods. Li et al. [18] proposed a deep learning-based model named the point-wise discriminative auto-encoder for target recognition. With the attention mechanism of this method, the features of the target area are automatically selected for target recognition, and the performance of target recognition has been improved.
In this paper, a SAR target detection network based on semi-supervised learning and attention mechanism is proposed with regard to the analysis above. The proposed semi-supervised learning method takes SSD as the detection branch and constructs an auxiliary scene recognition branch, where these two branches share a feature extraction module and an attention module. In the feature extraction module, the deep features of the input SAR image will be extracted. In the attention module, the network can generate the attention map automatically, and then the feature maps and attention map are multiplied to focus on the target area and suppress the background clutter area. The detection branch can output the bounding boxes of the targets in the SAR image, and the scene recognition branch outputs the binary classification result indicating whether the input SAR image contains targets. During the training stage, the target-level labeled training samples will pass through the detection branch, and the image-level labeled training samples will pass through the scene recognition branch. During the test stage, a novel coarse-to-fine detection procedure is used to reduce the false alarms. Considering the help of global scene information in SAR images, we first apply the coarse scene recognition branch to the input SAR image, and the scene recognition results of the coarse scene recognition branch are binary classification results indicating if the input SAR images contain the targets or not. According to the scene recognition results, the fine target detection branch is performed on the input SAR images which may contain the targets, and the final detection results of the fine target detection branch are the predicted specific locations of the targets. In this way, the proposed method can reduce the number of false alarms.
The experimental results based on the measured SAR dataset demonstrate that the proposed method outperforms the existing SAR target detection method in terms of detection performance. More specifically, the main contributions of the proposed target detection method are as follows:
(1)
We propose a semi-supervised SAR target detection framework with a detection branch and a scene recognition branch. The proposed method can use a small number of target-level labeled training samples and a large number of image-level labeled training samples simultaneously to learn the network, and the entire network is end-to-end jointly optimized. The feature extraction module is shared across the two branches, and the learning of image-level labeled training samples by the newly added scene recognition branch will enhance the feature extraction capability of the shared feature extraction module, which is helpful for the detection task. Thus, the proposed method can reduce the dependence of network training on target-level labeled training samples which are difficult to obtain.
(2)
We introduce an attention mechanism into the SAR image target detection network. In contrast to the attention mechanisms commonly used in the existing detection networks, we introduce global descriptor into the attention mechanism to guide local features to calculate the attention map. With the fusion of global descriptors and local features, the attention mechanism can not only consider local information but also consider global information, thus the attention mechanism can learn a more accurate attention map.
The remainder of this paper is organized as follows. Section 2 and Section 3 introduce the network structure and the algorithm flow of the proposed SAR target detection method in detail, respectively. Section 4 shows the experimental results and analysis based on the miniSAR real data. Finally, the discussion and conclusion are presented in Section 5 and Section 6, respectively.

2. Network Structure of the Proposed Method

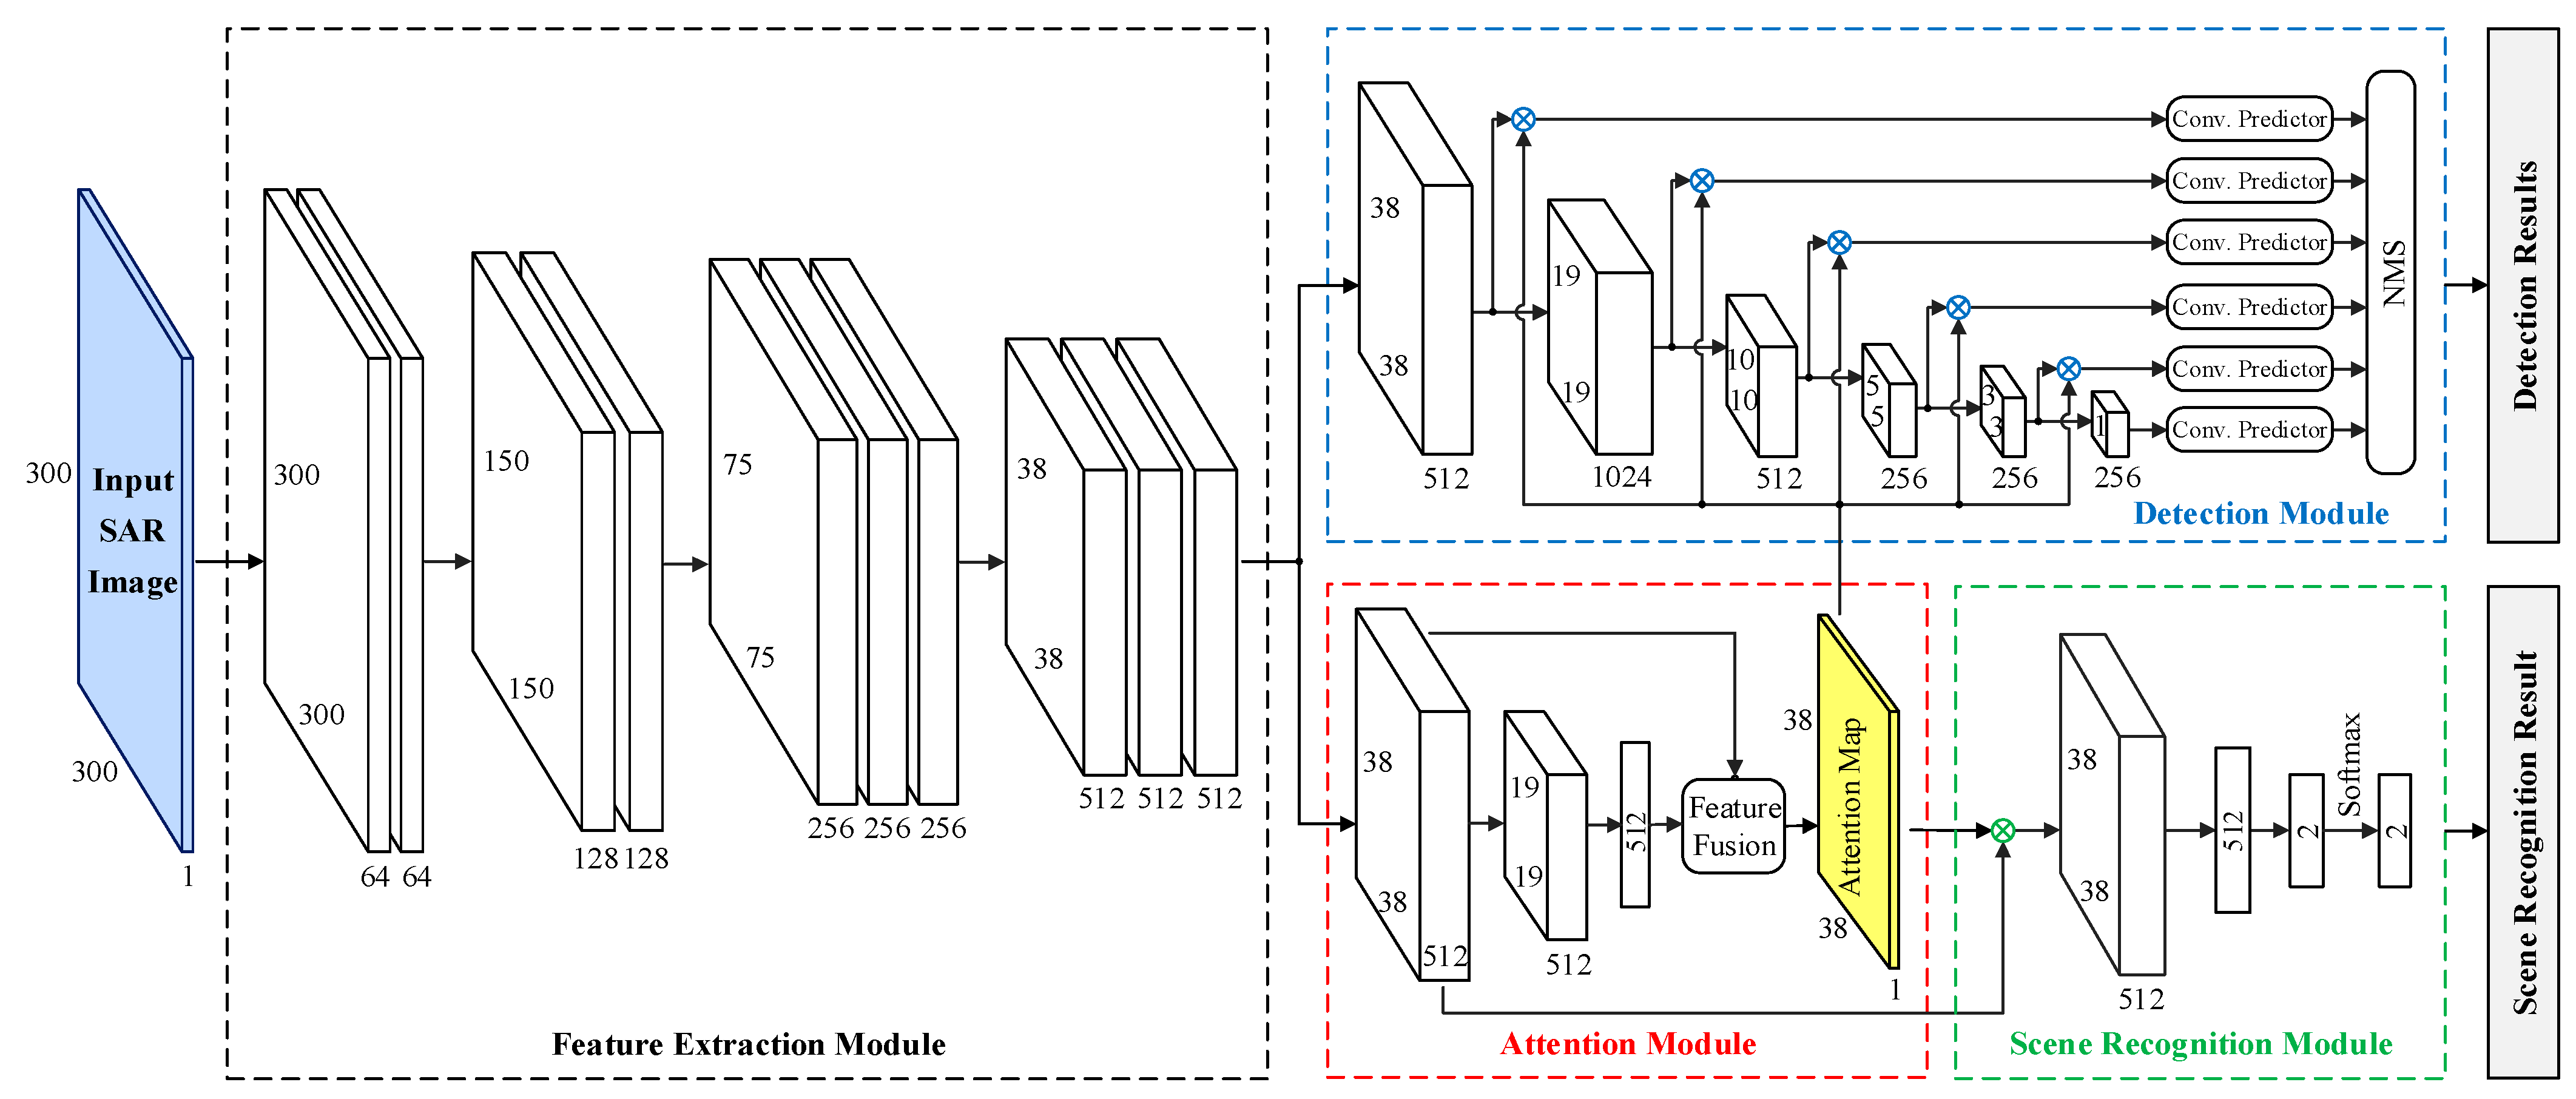
Figure 1 shows the whole flowchart of the proposed SAR target detection network based on semi-supervised learning and attention mechanism.
As shown in Figure 1, the proposed SAR target detection network consists of four modules, including the feature extraction module, attention module, scene recognition module, and detection module. The input of the feature extraction module is the input SAR image X input H × W × C , where H , W , C denotes the height of the input SAR images, the width of the input SAR images, the number of channels of the input SAR images, respectively. We take H , W , C as 300, 300, 1, respectively, to describe the flow of the proposed method. Given an input SAR image X input 300 × 300 × 1 , the feature extraction module is first employed to extract the deep features L 38 × 38 × 512 of X input by the deep convolutional network. Then the attention module takes L as input. By fusing the deep features and the global descriptor and applying the softmax activation function, the attention module can obtain the attention map A 38 × 38 × 1 . In the scene recognition module, the inputs are the deep features L and the attention map A . They are multiplied to obtain the global feature g 512 , then a fully connected layer and softmax function are used to get the output of the scene recognition module o u t SR 2 , it denotes whether the input SAR image X input contains targets or not. In the detection module, the inputs are also the deep features L and the attention map A . By performing a series of convolution operations and pooling operations on L , the multi-scale feature maps L 38 × 38 × 512 , L 2 19 × 19 × 1024 , L 3 10 × 10 × 512 , L 4 5 × 5 × 256 , L 5 3 × 3 × 256 , are obtained, then these multi-scale feature maps are multiplied by attention map A . Finally, the convolution predictors composed of some convolution layers are used to predict the targets, and the details about the convolution predictors can be traced in [7]. After the non-maximum suppression (NMS) [19], the outputs of the detection module can be obtained, which are the predicted specific locations of the targets.
In the following sections, the structure of each module is introduced in detail.

2.1. Feature Extraction Module

The feature extraction module is the basic part of the entire network, which is employed to extract the deep features of the input SAR image. Similar to SSD, the feature extraction module is a modified VGGNet. VGGNet has been widely used in the field of SAR target detection [11,12,13] and has excellent performance. It has a deep architecture to achieve good feature representation. According to the 6 ConvNet configurations of VGGNet in [20], and under the premise of comprehensive consideration of accuracy and speed, our feature extraction module is designed to contain four convolution stages. There are two convolutional layers in the first two convolutional stages, and three convolutional layers in the last two convolutional stages.
The size of the convolutional kernels of the convolutional layers in the feature extraction module is all 3 × 3, and each convolutional stage is composed of multiple cascaded convolutional layers. Compared with using one convolutional layer with a larger convolution kernel directly, the advantage of the cascade of multiple convolutional layers with a smaller convolution kernel size is that a large receptive field can be achieved with a small number of parameters. For example, a stack of two convolutional layers with 3 × 3 convolutional kernels has the same effective receptive field with one convolutional layer with 5 × 5 convolutional kernels. However, the stack of two convolutional layers with 3 × 3 convolutional kernels increases the non-linearity and decreases the number of parameters compared with the single convolutional layers with 5 × 5 convolutional kernels. The ReLU [21] activation function has the advantages of overcoming the problems of gradient disappearance and gradient explosion, and it can speed up the training process. Therefore, in the proposed method, each convolutional layer is followed by a ReLU activation function layer to improve the non-linear representation capability of the network. At the end of each convolutional stage is the pooling layer, which is used to decrease computational cost, reduce the risk of overfitting and increase the speed of network operations.

2.2. Attention Module

The attention module is one of the core parts of the proposed SAR target detection method. The attention module can automatically generate the attention map, and then the attention map and the feature map are multiplied by the spatial position, so that the network automatically enhances the target area and suppresses the clutter area. Figure 2 shows the flowchart of the attention module.
As shown in Figure 2, the input of the attention module is the deep features L M × M × N c obtained by the feature extraction module, where M and N c are the spatial size and the channel dimension of L . The local feature of L at the spatial position ( i , j ) can be represented by a vector l i , j N c . First, the deep features L are fed into a convolutional layer, and then we use a max pooling layer with a pixel window of 2 × 2 and a stride of 2 to down-sample the feature maps. Finally, a fully connected layer is adopted after the max pooling layer to obtain the global descriptor f N c , which can be regarded as a global representation of the input SAR image. In the fusion module, the local feature l i , j and the global descriptor f are fused by a compatibility measure. Specifically, each local feature l i , j is added to the global descriptor f , and then multiplied by the learnable weight W N c to obtain the compatibility score S i , j :
S i , j = W T ( l i , j + f )   ,   i , j { 1 , 2 , , M }
Finally, the compatibility scores S = { S 1 , 1 , S 1 , 2 , , S M , M } are normalized by softmax operation to acquire the attention map A M × M :
A ( i , j ) = S i , j m , n M , M S m , n , i , j { 1 , 2 , , M }
The attention map and the feature map are dot-multiplied according to the spatial position, which can enhance the target area and suppress the clutter area.
The global information represents the overall feature information of the input SAR image, and the local information represents the information of a certain area of the input SAR image, which contains more detailed information. It is beneficial to fuse these two kinds of information when calculating the spatial attention map. However, the attention mechanisms [16,22,23] commonly used in existing detection networks don’t do this. In contrast, we fuse the global descriptor and local features in our attention module. In this way, the fusion features used to calculate the attention map will be richer, which will make the attention module not only consider the local information but also consider the global information, thus our attention module can learn a more accurate attention map. Since our attention module can automatically enhance the target area and suppress the clutter area, the false alarm and missed alarm of the detection results can be reduced, and the performance of target detection can be improved.

2.3. Scene Recognition Module

The scene recognition module is also one of the core parts of the proposed SAR target detection method, which is used to classify the input SAR image. The input of the scene recognition module is the deep features and attention map of the SAR image, and the output is the scene classification result of the SAR image.
First, the attention map and the deep features are dot-multiplied according to the spatial position, and then the vector corresponding to each spatial position of the feature maps are added to obtain the global feature:
g = i , j A ( i , j ) l i , j , i , j { 1 , 2 , , M }
where A ( i , j ) ( 0 , 1 ) is the value of the attention map at position ( i , j ) , l i , j N c is the local feature of the deep features L at position ( i , j ) , and g N c is the output global feature vector. In other words, the global feature g is obtained by the weighted summation of all local features, where the weight is attention map. Then, the global feature g is used to obtain scene classification results by fully connected layers and softmax classifiers. The loss function of the scene recognition module is the cross-entropy loss function.

2.4. Detection Module

The detection module is an important part of the proposed SAR target detection method, whose task is to predict the bounding boxes of targets. As shown in Figure 1, in the detection module, the deep features are passed through multiple convolution layers to extract multi-scale feature maps. In SSD, the multi-scale feature maps are directly fed into the convolution predictors for target detection. However, in our method, the multi-scale feature maps are first multiplied by the attention map and then fed into the convolution predictors. Since the sizes of multi-scale feature maps are different, they cannot be directly multiplied by a fixed-size attention map. Therefore, we down-sample the attention map many times to generate multiple attention maps with different sizes, which are matched with the sizes of multi-scale feature maps respectively. Compared with methods which require learning attention maps for each relevant feature map size, our method only needs to learn one attention map. The advantage of our method is that it increases less computational complexity while having a high detection performance. Then, the multi-scale feature maps after multiplication are fed into convolutional predictors to predict targets and their bounding boxes. Finally, the NMS algorithm is employed to remove redundant targets to obtain the final detection results.
In the detection module, the multi-scale feature maps and the attention map are multiplied to automatically enhance the features of the target area and suppress the clutter area, thus the performance of the detection results can be improved.

3. Algorithm Flow of the Proposed Method

In this section, the algorithm flow of the proposed method is introduced, including the training process, which is the semi-supervised learning process, and the test process, which is the coarse-to-fine SAR target detection procedure.

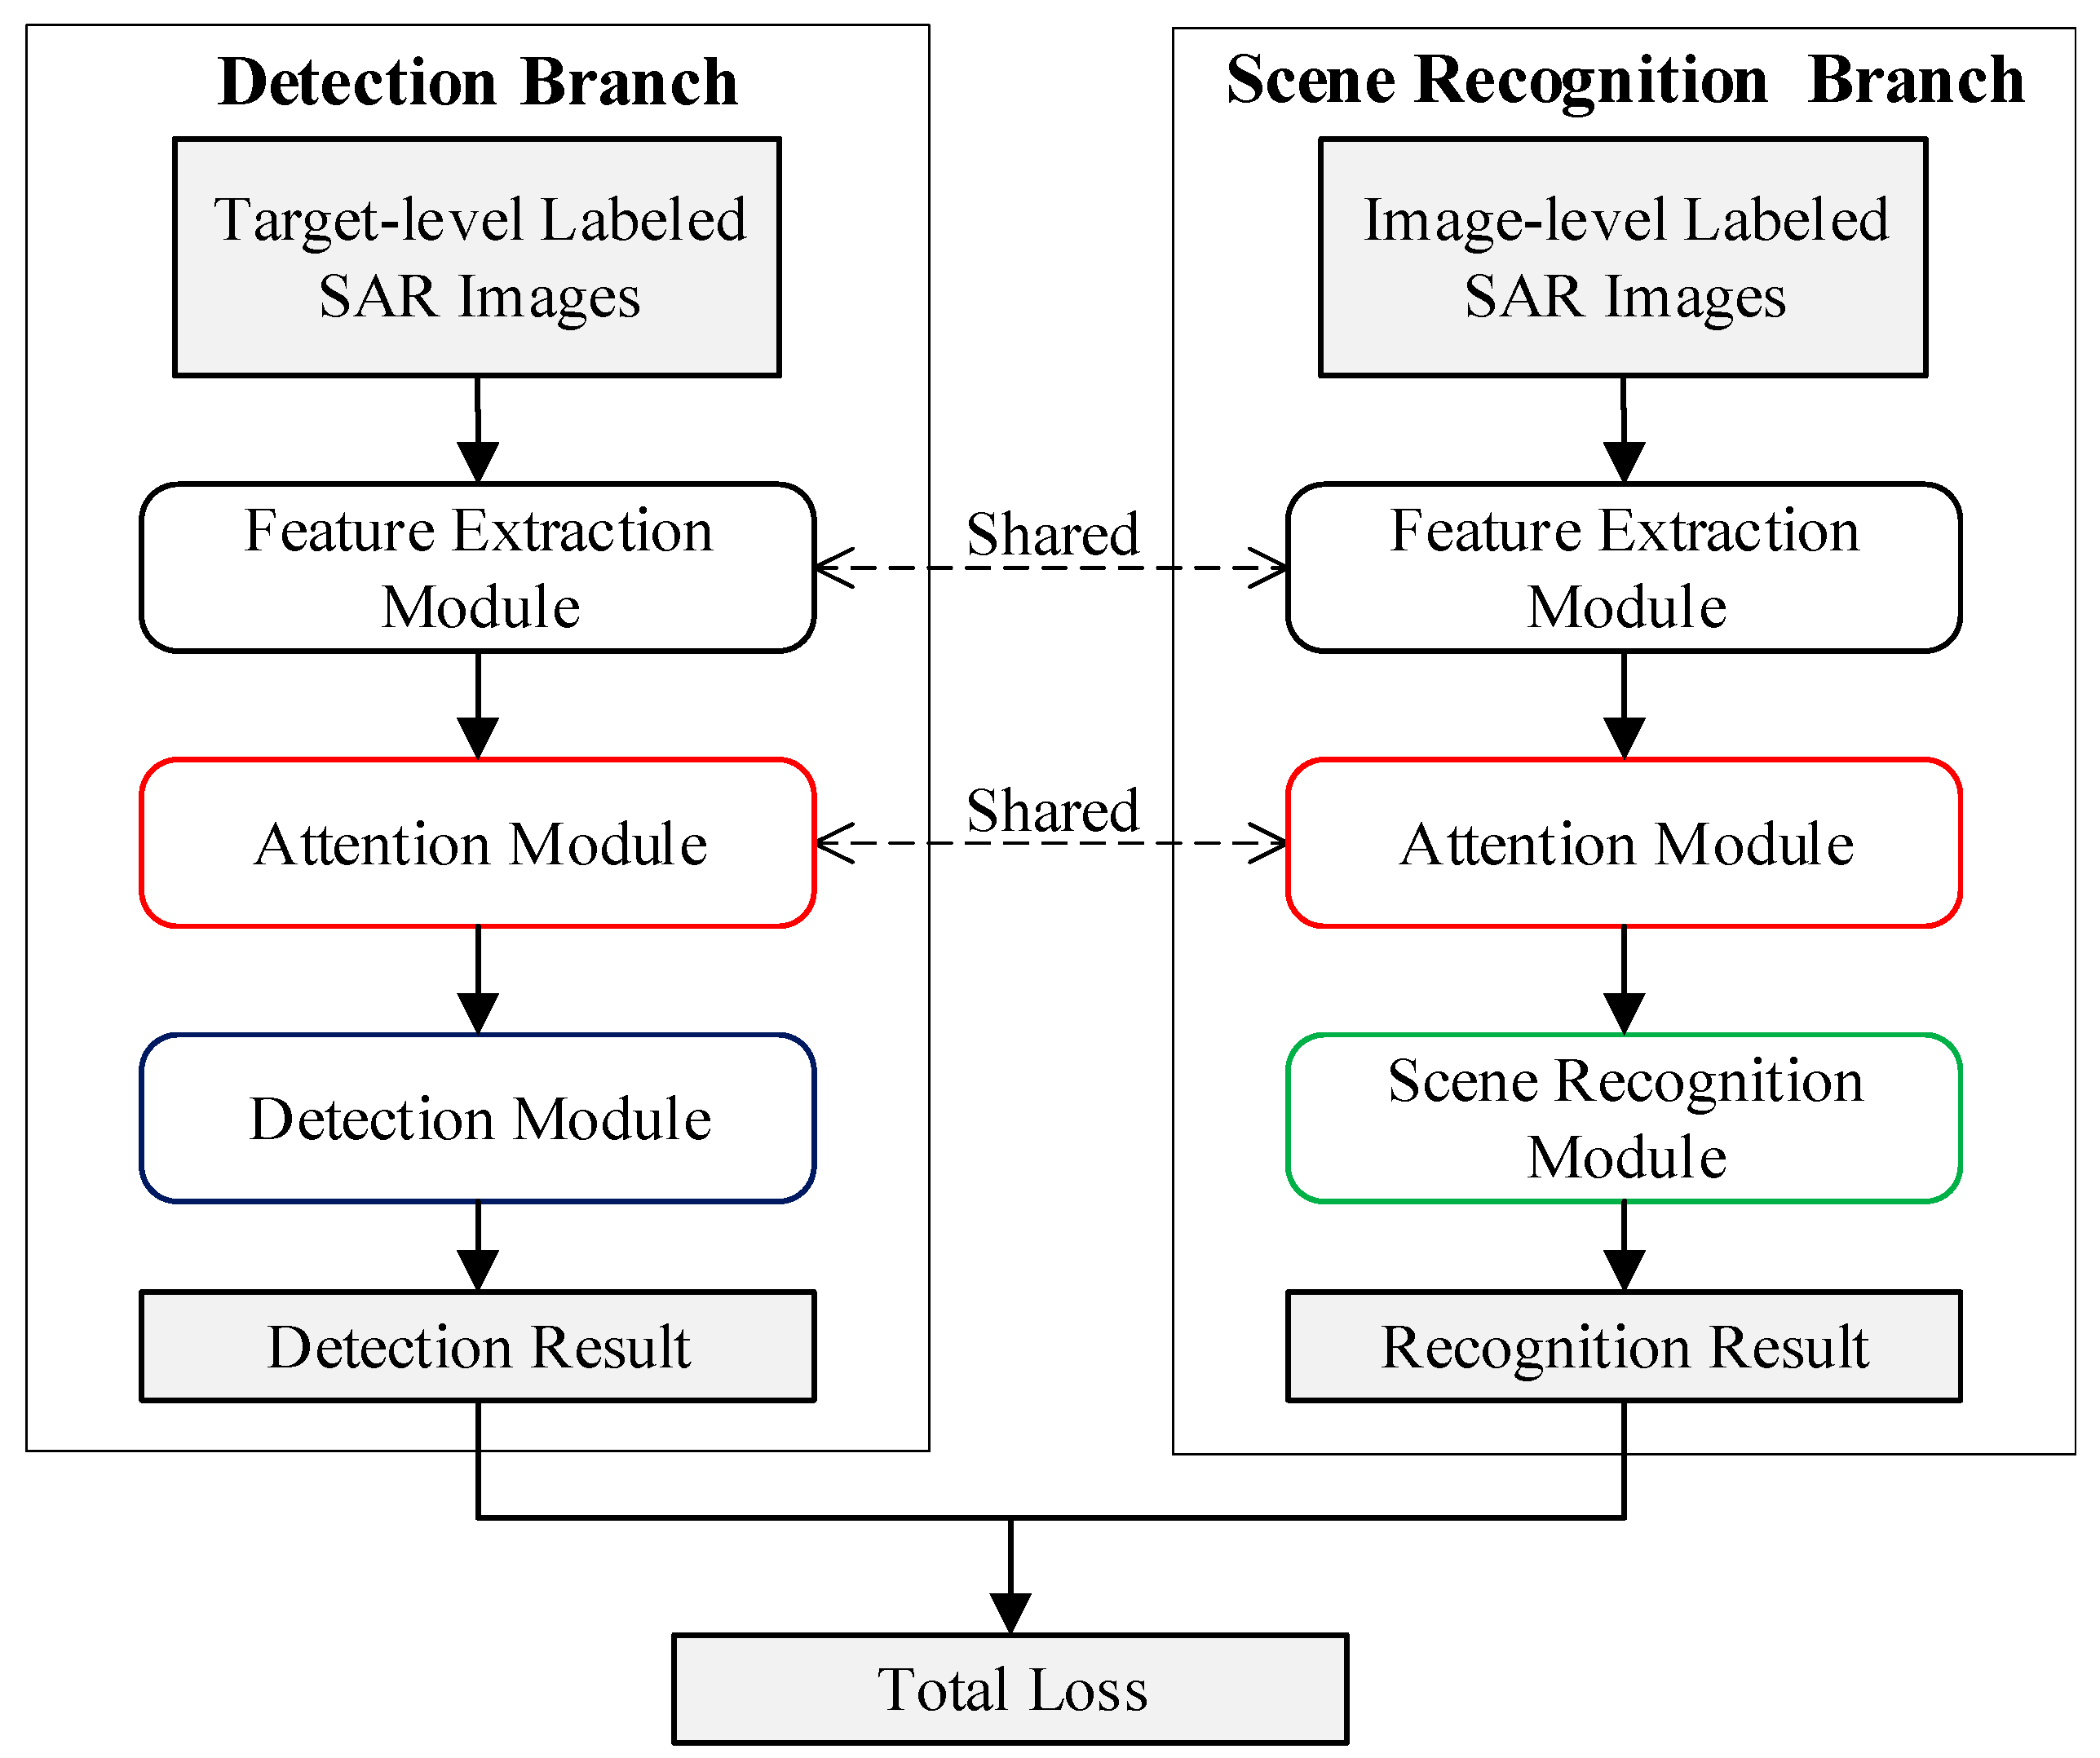
3.1. Semi-Supervised Learning

Figure 3 shows the flowchart of the proposed semi-supervised learning method. The entire network can be divided into detection branch and scene recognition branch. The detection branch includes feature extraction module, attention module, and detection module; the scene recognition branch includes feature extraction module, attention module, and scene recognition module. The feature extraction module and attention module are shared across the two branches. During training, the input of the detection branch is the target-level labeled SAR images, and the output is the detection results of these images. The detection loss function is calculated by the detection results and the ground truth bounding boxes. Specifically, the detection loss function is defined as follows:
L ( { p i } , { t i } ) = 1 N cls i L cls ( p i , p i ) + λ 1 N reg i p i L reg ( t i , t i )
where i is the index of an example in a minibatch, p i and p i are predicted probability and ground truth label, respectively. Similarly, t i and t i are the predicted bounding box and ground truth bounding box, respectively. The classification loss and regression loss are represented by L cls and L reg , and the two terms are normalized by N cls and N reg .
The classification loss L cls is the cross-entropy loss. The definition is as follows:
L cls ( p i , p i ) = [ p i log ( p i ) + ( 1 p i ) log ( 1 p i ) ]
The regression loss is L reg is defined as:
L r e g ( t i , t i ) = smooth L 1 ( t i t i )
where:
smooth L 1 ( x ) = { 0.5 x 2 i f | x | < 1 | x | 0.5 otherwise
The scene recognition branch takes the image-level labeled SAR images as input and outputs the classification results of these images. The scene recognition loss function is a binary classification cross-entropy loss function, which is calculated by the classification results and the ground truth category. The overall loss function of the network is the sum of the loss function of the two branches.
The two branches are jointly trained with SAR images of different label types, and the entire network can achieve end-to-end semi-supervised learning. The proposed semi-supervised method can reduce the demand for the number of target-level labeled SAR images in the network training process.

3.2. Coarse-to-Fine SAR Target Detection

During the test, in order to take advantage of the global feature of the SAR image, a coarse-to-fine SAR target detection procedure is proposed. For the SAR image, it is difficult to predict the target very accurately only by the features of the target area itself. By using the global feature of SAR image, the global context information of SAR image can be fully considered during prediction, which can allow better detection resultsto be obtained. Since the scene recognition module uses global features to classify the input SAR image, this module can be used to classify the SAR image coarsely before fine target detection.
Figure 4 shows the proposed coarse-to-fine SAR target detection procedure. First, we apply the coarse scene recognition to the test SAR image. The test SAR image is fed into the feature extraction module and the attention module to extract deep features and attention map, and the scene recognition result of the test SAR image is obtained by the scene recognition module. Then, we apply the fine target detection to the image based on the scene recognition result. If the scene recognition result is the target class, indicating that the test SAR image may contain the target of interest, we use the detection module to further predict the specific location of the targets. If the scene recognition result is a clutter background class, it means that the SAR image does not contain targets.
Using coarse-to-fine SAR target detection, the scene recognition module may incorrectly recognize the test SAR images that have the targets as no targets, so then the few missing alarms may be added. However, due to the fact that the large number of test SAR images that do not have the targets can be removed, the false alarms of the detection results can be greatly reduced. Therefore, the comprehensive detection performance will be improved.

4. Experimental Results and Analysis

4.1. Description of the Dataset and Experimental Settings

The proposed method was verified with the measured miniSAR dataset [24], which was acquired by U.S. Sandia National Laboratories in 2005. The image size in the miniSAR dataset is 1638 × 2510 and the resolution is 0.1 m × 0.1 m. Nine SAR images in the miniSAR dataset were selected for the experiment, seven of which were used for training and two for test. Please note that, for the split of training and test data, our method was consistent with that in [11,12,13]. Figure 5 shows two SAR images of miniSAR dataset. From Figure 5 we can see that the SAR images contain many vehicle targets and complex background, including man-made clutter such as buildings and roads, and natural clutter such as trees and grasslands.
The original SAR image had a large size, which was not suitable for being the input in the network. Therefore, when training, the original training SAR images were cropped into many SAR sub-images with a fixed size of 300 × 300, according to the input size of the network. These sub-images consist of sub-images that contain the targets and sub-images that do not contain the targets and only contain background clutter. Then these sub-images were used as training images for the network. When used in the test, the original test SAR images were also cropped into many test SAR sub-images with the size of 300 × 300 using a sliding window. There was overlap when moving one sliding window to the next, which was 100. Then, all of the test SAR sub-images were input to the target detection network, and the prediction results of all sub-images were restored to the original SAR image. Finally, the NMS deduplication algorithm was employed to obtain the final detection results.
In our experiment, for each image-level labeled training sample, we only marked whether it contains the targets, while for each target-level labeled training sample, it must contain the targets, and the positions of the targets must be marked. The image-level labeled training samples are composed of all training sub-images, and they were only marked at image-level. The target-level labeled training samples are only composed of the training sub-images that contain the targets, and they were marked at target-level. The proposed method uses only 30% target-level labeled training samples (except for the Section 4.4.2) and all image-level labeled training samples, in which the 30% target-level labeled training samples were randomly selected from all the target-level labeled training samples ten times, and their results were averaged over the ten different choices as the final test result. Please note that the 30% here is relative to the target-level labeled training samples, but not relative to all the training samples. For Section 4.4.2, which analyzes the variations of detection performance with the percentage of target-level labeled training samples, the percentage of target-level labeled training samples increased from 10% to 100%.
The experiments are implemented with the Caffe [25] deep learning framework, using a personal computer with Intel Xeon E5-2630 v4 CPU of 2.2 GHz, NVIDIA GeForce GTX 1080Ti GPU, and 128 GB of memory on Ubuntu 18.04 Linux system.

4.2. Evaluation Criteria

We quantitatively evaluated different detection methods via precision, recall, and F1-score. The calculation formulas are as follows:
Precision = TP TP + FP
Recall = TP NP
F 1 - score = 2 × Precision × Recall Precision + Recall
where TP is the number of correctly detected vehicle targets, FP is the number of false alarms, and NP is the number of ground truth vehicle targets. The precision measures the fraction of true positives over all detected results. The recall measures the fraction of true positives over the ground truths. The F1-score is the harmonic mean between precision and recall, which is the main reference index to evaluate the detection performance comprehensively.

4.3. Comparison with Other Detection Methods

In order to demonstrate the excellent performance of the proposed method, we compared it with other famous target detection methods. Figure 6 and Table 1 exhibit the target detection results of the proposed method and other detection methods on test SAR images in miniSAR dataset. In Figure 6 and Table 1, Gaussian-CFAR denotes the conventional unsupervised detection method in [1]; Faster R-CNN [3], FPN [4], SSD1, and SSD2 are the fully supervised methods based on deep learning. SSD1 denotes SSD trained with all target-level labeled training samples; SSD2 denotes SSD trained with only 30% target-level labeled training samples, which is the same as the number of target-level labeled training samples used in the proposed method; Rosenberg’s method and Zhang’s method denotes the semi-supervised method in [14,15], respectively; Rosenberg’s method, Zhang’s method, and the proposed method were trained with 30% target-level labeled training samples and all image-level labeled training samples.
Figure 6 exhibits the intuitional target detection results of the proposed method and other detection methods on two test SAR images. As shown in Figure 6, there were many false alarms in the detection results of Gaussian-CFAR, the number of correct detections was low, and the method couldn’t accurately locate the targets. There were a few missing alarms and false alarms in the detection results of Faster R-CNN, FPN and SSD1. The detection result of SSD2 had more false alarms than SSD1, because SSD2 uses fewer training samples than SSD1. Both Rosenberg’s method and Zhang’s method had a large number of false alarms, but Rosenberg’s method had fewer missing alarms. The proposed method had fewer of missing alarms and false alarms, and its detection result was the best.
For quantitative analysis, we counted the missing alarms and false alarms of the detection results of different methods and evaluated the overall target detection results in terms of precision, recall, and F1-score in Table 1. From Table 1 we can see that the proposed method had the fewest false alarms, and the number of false alarms was less. The precision, recall, and comprehensive criterion F1-score of Gaussian-CFAR were very low, at only 0.3789, 0.7966, and 0.5135, respectively. This is because Gaussian-CFAR is an unsupervised detection method, and its detection performance would be reduced in complex scenes. Faster R-CNN, FPN, and SSD have higher precision, recall, and F1-score, and those criteria of SSD2 were lower than SSD1 because SSD2 used fewer training samples. Although the recall of Rosenberg’s method was very high, its precision was very low, and its comprehensive criterion F1-score was low. The precision, recall, and comprehensive criterion F1-score of Zhang’s method were also low. The proposed method had the highest precision and F1-score. Among all CNN-based methods, namely the proposed method, Zhang’s method, SSD1, and SSD2, the proposed method had the highest precision, recall, and F1-score. In the case of a small number of target-level labeled training samples, the proposed method was 5.17% higher in terms of precision, 5.69% higher in terms of recall, and 5.43% higher in terms of F1-score than SSD2. Therefore, under the premise of using fewer target-level labeled training samples, the performance of the proposed method still outperformed the other detection methods.

4.4. Model Analysis

4.4.1. Analysis of Attention Map

In order to analyze the attention map of the proposed method more intuitively, the original sub-images, the corresponding attention maps, and detection results are presented here. Figure 7 shows four sub-images, their attention maps, and detection results. The red color in the attention map indicates that the value is higher, and the feature at the corresponding location will be enhanced. On the contrary, the blue color in the attention map indicates that the value is lower, and the feature at the corresponding location will be suppressed.
We can see in Figure 7 that the highlights in the attention maps can correspond to the actual vehicle target area in the SAR images, and the areas with lower values can correspond to the background clutter area, including buildings and grass areas. The detection results of the sub-images are also excellent. Therefore, the attention maps of the proposed method can highlight the target of interest area and suppress the background clutter area.

4.4.2. Analysis of The Variations of Detection Performance with the Percentage of Target-Level Labeled Training Samples

In order to illustrate the performance of our proposed detection method, we compare the proposed method with SSD trained only by target-level labeled training samples in different percentages of target-level labeled training samples. Figure 8 shows the variations of F1-score with the percentage of target-level labeled training samples. In Figure 8, “all target-level labeled training samples + SSD” denotes that all the target-level labeled training samples are used to train the SSD, “part of target-level labeled training samples + SSD” denotes that only part of target-level labeled training samples, same as those used in the proposed method, are used to train the SSD. The proposed method is trained with part of the target-level labeled training samples and all image-level labeled training samples. The x-axis denotes the percentage of target-level labeled training samples. Please note that the proposed method uses all image-level training samples in all of the percentage values of x-axis, and the percentage here is relative to the target-level labeled training samples, but not relative to all of the training samples.
It can be seen in Figure 8 that the performance of the proposed method is higher than the SSD in all percentage values. The proposed method yields at least 5% higher in terms of F1-score than SSD trained with part of target-level labeled training samples in all percentage values. When the percentage of target-level labeled training samples is only 10%, the detection results of the proposed method are already equivalent to the SSD trained with all the target-level labeled training samples via the fully supervised learning method. When the percentage is 100%, the proposed method is extended to a fully supervised algorithm. At this time, the proposed method is 6.89% higher in terms of F1-score than SSD. Therefore, we can conclude that SSD requires a larger number of target-level labeled training samples to obtain high detection performance, and the proposed method can reduce the demand for the number of target-level labeled training samples and can achieve better detection performance.

4.4.3. Ablation Study

In order to analyze the different modules of the proposed method, we designed and implemented an ablation study using the miniSAR dataset. By analyzing the results of the ablation study, we can understand the impact of different modules on the detection performance more comprehensively. The results of the ablation study are shown in Table 2, where scene recognition, attention, and coarse-to-fine denote whether to use the scene recognition module, attention mechanism, and the coarse-to-fine detection procedure, respectively.
From analysis of the information in Table 2, we can conclude that the scene recognition module, the attention module, the coarse-to-fine detection can all improve the detection performance. Specifically, from the comparison of columns 3 and 5 (or columns 4 and 7) of Table 2, we can conclude that the F1-score can be increased by about 1% and 2% when only adding the scene recognition module in two experiments, respectively. From the comparison of columns 3 and 4 (or columns 5 and 7, or columns 6 and 8), we can conclude that the number of false alarms and missed alarms are both decreased, and the F1-score can be increased by at least 1% when only adding the attention module. From the comparison of columns 5 and 6 (or columns 7 and 8), we can conclude that although few missing alarms are added, the false alarms can be greatly reduced, and the F1-score can be increased by an average of 2% when only adding the coarse-to-fine detection procedure. From all of the information in Table 2 we can conclude that the detection results of the proposed method can achieve the best detection performance by using the scene recognition module, attention module, and coarse to fine detection procedure at the same time.

4.4.4. Analysis of Randomly Splitting Training and Test Data

In order to analyze the generality of the proposed method we repeated the experiments with randomized training and test splits of the miniSAR dataset four more times and verified the detection performance of the proposed method. For each split, we randomly selected two large SAR images for the test, and the remaining seven large SAR images for training. Figure 9 shows the detection performance of the proposed method and SSD2 for each split, and we can conclude that for these five splits, the F1-score of the proposed method fluctuates within 5%, and it is always higher than the F1-score of SSD2. It shows that the proposed method is not only applicable to a particular split of training and test data. Therefore, the proposed method is not sensitive to the split of training and test data, which proves the generality of the proposed method.

4.4.5. Computational Complexity and Runtime Analysis

By analyzing the calculation principle of CNN [26], the computational complexity of CNN is:
O ( S ( l c = 1 L C C i n , l c C o u t , l c K l c 2 M l c 2 + l f = 1 L F N i n . l f N o u t , l f ) )
where l c = 1 L C C i n , l c C o u t , l c K l c 2 M l c 2 denotes the computational complexity of all convolutional layers in the network, L C is the total number of convolutional layers, l c is the index of the current convolutional layer, C i n , l c and C o u t , l c are the number of channels in the input and output feature map of layer l c . The size of the convolution kernel of the l c layer is K l c × K l c , and the size of the output feature map of the l c layer is M l c × M l c . l f = 1 L F N i n . l f N o u t , l f denotes the computational complexity of all fully connected layers in the network, where L F is the total number of fully connected layers, l f is the index of the current fully connected layer, N i n . l f and N o u t . l f are the number of input and output nodes of layer l f . S is the total number of test samples entered in the network, while it denotes the number of sliding windows on the original test SAR images in our experiment.
According to the above, we can get the computational complexity of the three CNN-based methods, i.e., Zhang’s method, SSD, and the proposed method. The computational complexity of Zhang’s method is:
O ( S 1 ( l c = 1 L C 1 C i n , l c C o u t , l c K l c 2 M l c 2 + l f = 1 L F 1 N i n . l f N o u t , l f ) )
In the network of Zhang’s method, there are 5 convolutional layers and 2 fully connected layers. The convolutional kernel sizes in convolutional layers are 3 × 3 , 3 × 3 , 3 × 3 , 8 × 8 , and 1 × 1 , the output channels of the convolutional layer are 128, 192, 192, 420, and 2 respectively, and the nodes in fully connected layers are 420 and 2. Since Zhang’s method transforms the detection task into a sliding window area classification task, and in order to cover all targets as much as possible, the number of sliding windows of Zhang’s method on one test SAR image is much large. In our experiments, the number of sliding windows is 41,164, i.e., S 1 = 41,164 . By substituting the number of sliding windows and the relevant parameters of the model into the formula of computational complexity, we can get that the floating-point operations (FLOPs) of Zhang’s method are 2.52 × 10 13 . The computational complexity of SSD is:
O ( S 2 ( l c = 1 L C 2 C i n , l c C o u t , l c K l c 2 M l c 2 ) )
According to the details of its network structure from [8] and the number of sliding windows, i.e., S 2 = 52 , in our experiments, the FLOPs of SSD are 3.15 × 10 12 . The computational complexity of the proposed method is:
O ( S 3 ( l c = 1 L C 2 C i n , l c C o u t , l c K l c 2 M l c 2 + l c = 1 L C 3 C i n , l c C o u t , l c K l c 2 M l c 2 + l f = 1 L F 3 N i n . l f N o u t , l f ) )
Compared with SSD, the proposed method adds attention module and scene recognition module. The computational complexity of the additional attention module and scene recognition module is:
O ( S 3 ( l c = 1 L C 3 C i n , l c C o u t , l c K l c 2 M l c 2 + l f = 1 L F 3 N i n . l f N o u t , l f ) )
According to the details of its network structure in Section 2 and the number of sliding windows, i.e., S 3 = 52 , in our experiments, the corresponding FLOPs of the proposed method are 3.16 × 10 12 . In Table 3, we list the computational complexity, the FLOPs, and the runtime on per test SAR image of the three CNN-based methods.
In Table 3, we can see that Zhang’s method has the largest FLOPs and it has a long runtime. Compared with SSD, the proposed method has two more summation terms in the formula of computational complexity, and we can see that the FLOPs of the proposed method is a little larger than that of SSD, and its runtime is a little longer. In conclusion, the proposed method can greatly improve the detection performance, by adding a little FLOPs and runtime.

5. Discussions

The experimental results shown in Section 4 illustrate that the proposed method achieves better detection performance for SAR images than compared state-of-the-art methods. The reasons include three main points. First, although we used part of target-level labeled training samples, only 30%, the designed scene recognition module can use all image-level labeled training samples. The weakly supervision information brought by the image-level labeled training samples is conducive to improving the detection performance. Second, for SAR images with more complex scenes, the attention module designed can generate an attention map to suppress the clutter area and highlight the target area, and the attention map will act on the scene recognition module and the detection module simultaneously, which will help to improve the accuracy of scene recognition and detection performance. Third, the coarse-to-fine SAR target detection procedure can significantly reduce the number of false alarms. Although a few missing alarms may be added, the comprehensive detection performance can be improved.
From the experimental results of multiple random splits of training and test data in Section 4.4.4, we can conclude that how the training and test data are split has little impact on the proposed method. This shows the generality of the proposed method. In addition to the measured miniSAR data, we can also generalize the proposed method to other datasets, as long as the following conditions are met: the images in the dataset must be the SAR images with large scenes, and the images should include both the targets of interest and the background clutter. The reasons are as follows. We need to crop the SAR sub-images in the SAR images with large scenes to make the target-level labeled and image-level labeled training samples, in which the target-level labeled training samples must include the targets, and the positions of the targets must be labeled, and as for the image-level labeled training samples, they are composed of the samples that contain the targets and the samples that do not contain the targets and only contain the background clutter. Therefore, the images in the dataset must be the large scene SAR images including both targets of interest and background clutter. As long as the dataset satisfies the above conditions, our method is applicable, and it is reasonable to generalize the performance of the proposed method to it.

6. Conclusions

In this paper, a SAR target detection network based on semi-supervised learning and attention mechanism is proposed. The proposed method takes SSD as a detection branch and constructs an auxiliary scene recognition branch for semi-supervised learning. Using the attention mechanism, the network can automatically highlight the target of interest and suppress the background clutter. By the coarse-to-fine SAR target detection procedure, the global scene information of SAR images can be considered during the test process, and the comprehensive detection performance can be improved. The experimental results based on the measured miniSAR dataset demonstrate that the proposed method can achieve better performance than other semi-supervised methods and even the fully supervised learning methods.
Although the proposed method can significantly improve the performance of target detection, the computational complexity and runtime are increased. In the future, we will explore a lightweight network structure to reduce the computational complexity of the network and increase the detection speed.

Author Contributions

Conceptualization, D.W.; methodology, D.W.; software, D.W.; validation, D.W.; data curation, D.W.; writing—original draft preparation, D.W.; writing—review and editing, Y.D., L.D. and L.L.; supervision, L.D.; All authors have read and agreed to the published version of the manuscript.

Funding

This work was funded in part by the National Science Foundation of China, grant number 61771362, in part by the 111 Project, grant number B18039.

Institutional Review Board Statement

Not applicable.

Informed Consent Statement

Not applicable.

Data Availability Statement

Not applicable.

Conflicts of Interest

The authors declare there is no conflict of interest.

References

  1. Novak, L.; Burl, M.; Irving, W. Optimal polarimetric processing for enhanced target detection. IEEE Trans. Aerosp. Electron. Syst. 1993, 29, 234–244. [Google Scholar] [CrossRef]
  2. Liu, W.; Wang, Z.; Liu, X.; Zeng, N.; Liu, Y.; Alsaadi, F.E. A survey of deep neural network architectures and their applications. Neurocomputing 2017, 234, 11–26. [Google Scholar] [CrossRef]
  3. Girshick, R.; Donahue, J.; Darrell, T.; Malik, J. Rich feature hierarchies for accurate object detection and semantic segmen-tation. In Proceedings of the EEEE Conference on Computer Vision and Pattern Recognition, Columbus, OH, USA, 23–28 June 2014; pp. 580–587. [Google Scholar]
  4. Ren, S.; He, K.; Girshick, R.; Sun, J. Faster R-CNN: Towards real-time object detection with region proposal networks. IEEE Trans. Pattern Anal. Mach. Intell. 2017, 39, 1137–1149. [Google Scholar] [CrossRef] [PubMed] [Green Version]
  5. Lin, T.Y.; Dollár, P.; Girshick, R.; He, K.; Hariharan, B.; Belongie, S. Feature pyramid networks for object detection. In Proceedings of the 30th IEEE Conference on Computer Vision and Pattern Recognition, Honolulu, HI, USA, 21–26 July 2017; pp. 2117–2125. [Google Scholar]
  6. Redmon, J.; Divvala, S.; Girshick, R.; Farhadi, A. You only look once: Unified, real-time object detection. In Proceedings of the 2016 IEEE Conference on Computer Vision and Pattern Recognition, Las Vegas, NV, USA, 27–30 June 2016; pp. 779–788. [Google Scholar]
  7. Liu, W.; Anguelov, D.; Erhan, D.; Szegedy, C.; Reed, S.; Fu, C.-Y.; Berg, A.C. SSD: Single shot multibox detector. In Proceedings of the European Conference on Computer Vision (ECCV), Amsterdam, The Netherlands, 8–16 October 2016; pp. 21–37. [Google Scholar] [CrossRef] [Green Version]
  8. Li, L.; Du, L.; Wang, Z. Target Detection Based on Dual-Domain Sparse Reconstruction Saliency in SAR Images. IEEE J. Sel. Top. Appl. Earth Obs. Remote. Sens. 2018, 11, 4230–4243. [Google Scholar] [CrossRef]
  9. Li, J.; Qu, C.; Shao, J. Ship detection in SAR images based on an improved faster R-CNN. In Proceedings of the 2017 SAR in Big Data Era: Models Methods and Applications (BIGSARDATA), Beijing, China, 13–14 November 2017; pp. 1–6. [Google Scholar]
  10. Chen, Z.; Gao, X. An Improved Algorithm for Ship Target Detection in SAR Images Based on Faster R-CNN. In Proceedings of the 2018 Ninth International Conference on Intelligent Control and Information Processing (ICICIP), Wanzhou, China, 9–11 November 2018; pp. 39–43. [Google Scholar]
  11. Wang, Z.; Du, L.; Mao, J.; Liu, B.; Yang, D. SAR Target Detection Based on SSD With Data Augmentation and Transfer Learning. IEEE Geosci. Remote. Sens. Lett. 2018, 16, 150–154. [Google Scholar] [CrossRef]
  12. Du, L.; Li, L.; Wei, D.; Mao, J. Saliency-Guided Single Shot Multibox Detector for Target Detection in SAR Images. IEEE Trans. Geosci. Remote. Sens. 2020, 58, 3366–3376. [Google Scholar] [CrossRef]
  13. Du, L.; Liu, B.; Wang, Y.; Liu, H.; Dai, H. Target Detection Method Based on Convolutional Neural Network for SAR Image. J. Electron. Inf. Technol. 2016, 38, 3018–3025. [Google Scholar]
  14. Rosenberg, C.; Hebert, M.; Schneiderman, H. Semi-Supervised Self-Training of Object Detection Models. In Proceedings of the Seventh IEEE Workshops on Applications of Computer Vision (WACV), Washington, DC, USA, 5–7 January 2005; pp. 29–36. [Google Scholar]
  15. Zhang, F.; Du, B.; Zhang, L.; Xu, M. Weakly Supervised Learning Based on Coupled Convolutional Neural Networks for Aircraft Detection. IEEE Trans. Geosci. Remote. Sens. 2016, 54, 5553–5563. [Google Scholar] [CrossRef]
  16. Woo, S.; Park, J.; Lee, J.-Y.; Kweon, I.S. Cbam: Convolutional block attention module. In Proceedings of the 15th European Conference on Computer Vision (ECCV), Munich, Germany, 8–14 September 2018; pp. 3–19. [Google Scholar]
  17. Jetley, S.; Lord, N.; Lee, N.; Torr, P.H.S. Learn to pay attention. arXiv 2018, arXiv:1804.02391. [Google Scholar]
  18. Li, C.; Du, L.; Deng, S.; Sun, Y.; Liu, H. Point-wise discriminative auto-encoder with application on robust radar automatic target recogni-tion. Signal Process. 2020, 169, 107385. [Google Scholar] [CrossRef]
  19. Neubeck, A.; Van Gool, L. Efficient non-maximum suppression. In Proceeding of the 18th International Conference on Pattern Recognition (ICPR’06), Hong Kong, China, 20–24 August 2006; pp. 850–855. [Google Scholar]
  20. Simonyan, K.; Zisserman, A. Very deep convolutional networks for large-scale image recognition. arXiv 2014, arXiv:1409.1556. [Google Scholar]
  21. Krizhevsky, A.; Sutskever, I.; Hinton, G.E. Imagenet classification with deep convolutional neural networks. Commun. ACM 2017, 60, 84–90. [Google Scholar] [CrossRef]
  22. Liu, J.-J.; Hou, Q.; Cheng, M.-M.; Wang, C.; Feng, J. Improving Convolutional Networks with Self-Calibrated Convolu-tions. In Proceedings of the IEEE Conference on Computer Vision and Pattern Recognition (CVPR), Seattle, WA, USA, 16–20 June 2020; pp. 10093–10102. [Google Scholar]
  23. Hou, Q.; Zhang, L.; Cheng, M.-M.; Feng, J. Strip Pooling: Rethinking Spatial Pooling for Scene Parsing. In Proceedings of the IEEE Conference on Computer Vision and Pattern Recognition (CVPR), Seattle, WA, USA, 16–20 June 2020; pp. 4002–4011. [Google Scholar]
  24. SANDIA Mini SAR Complex Imagery. Available online: http://www.sandia.gov/radar/complex-data/index.html (accessed on 15 April 2021).
  25. Jia, Y.; Shelhamer, E.; Donahue, J.; Karayev, S.; Long, J.; Girshick, R.; Guadarrama, S.; Darrell, T. Caffe: Convolutional architecture for fast feature embedding. In Proceedings of the 22nd ACM international conference on Multimedia, Orlando, FL, USA, 3–7 November 2014; pp. 675–678. [Google Scholar]
  26. He, K.; Sun, J. Convolutional neural networks at constrained time cost. In Proceedings of the IEEE Conference on Computer Vision and Pattern Recognition (CVPR), Boston, MA, USA, 7–12 June 2015; pp. 5353–5360. [Google Scholar]
Figure 1. Flowchart of the proposed SAR target detection network.
Remotesensing 13 02686 g001
Figure 2. Flowchart of the attention module.
Remotesensing 13 02686 g002
Figure 3. Flowchart of the proposed semi-supervised learning method.
Remotesensing 13 02686 g003
Figure 4. Flowchart of the proposed coarse-to-fine SAR target detection procedure.
Remotesensing 13 02686 g004
Figure 5. Two images of miniSAR dataset: (a) image I (b) image II.
Remotesensing 13 02686 g005
Figure 6. The target detection results compared with other methods for two test SAR images, where green rectangles represent the correctly detected target chips, red rectangles represent false alarms, and blue rectangles represent the missing alarms. (a) and (b) Gaussian-CFAR. (c) and (d) Faster R-CNN. (e) and (f) FPN. (g) and (h) SSD1. (i) and (j) SSD2. (k) and (l) Rosenberg’s method. (m) and (n) Zhang’s method. (o) and (p) proposed method.
Remotesensing 13 02686 g006aRemotesensing 13 02686 g006bRemotesensing 13 02686 g006c
Figure 7. Original SAR sub-images and their corresponding attention maps and the detection results. (a,d,g,j) Original SAR sub-images. (b,e,h,k) Corresponding attention maps. (c,f,i,l) Corresponding detection results.
Remotesensing 13 02686 g007aRemotesensing 13 02686 g007b
Figure 8. The detection performance against the percentage of target-level labeled training samples.
Remotesensing 13 02686 g008
Figure 9. The detection performance of the proposed method and SSD2 for each split.
Remotesensing 13 02686 g009
Table 1. Overall evaluation of different target detection methods.
MethodSupervision ModePrecisionRecallF1-Score
Gaussian-CFARUnsupervised0.37890.79660.5135
Faster R-CNNFully supervised0.83700.91060.8723
FPN0.86510.88620.8755
SSD10.86290.88620.8744
SSD20.85590.85370.8548
Rosenberg’s methodSemi-supervised0.58140.92680.7145
Zhang’s method0.46990.74800.5772
Proposed method0.90760.91060.9091
Table 2. Ablation study.
ComponentsScene Recognition
Attention
Coarse-to-fine
Quantitative EvaluationPrecision0.85590.86440.83460.86780.84620.9076
Recall0.85370.86180.90240.89430.91870.9106
F1-score0.85480.86310.86720.88090.88100.9091
Table 3. Complexities of the proposed method and other CNN-based detection methods.
MethodComputational ComplexityFLOPsRuntime (Seconds/Per Test Image)
Zhang’s method O ( S 1 ( l c = 1 L C 1 C i n , l c C o u t , l c K l c 2 M l c 2 + l f = 1 L F 1 N i n . l f N o u t , l f ) ) 2.52 × 10 13 38.12
SSD O ( S 2 ( l c = 1 L C 2 C i n , l c C o u t , l c K l c 2 M l c 2 ) ) 3.15 × 10 12 1.55
Proposed method O ( S 3 ( l c = 1 L C 2 C i n , l c C o u t , l c K l c 2 M l c 2 + l c = 1 L C 3 C i n , l c C o u t , l c K l c 2 M l c 2 + l f = 1 L F 3 N i n . l f N o u t , l f ) ) 3.16 × 10 12 2.04
Publisher’s Note: MDPI stays neutral with regard to jurisdictional claims in published maps and institutional affiliations.

