Abstract
This contribution focuses on the utilization of very-high-resolution (VHR) images to identify construction areas and their temporal changes aiming to estimate the investment in construction as a basis for economic forecasts. Triggered by the need to improve macroeconomic forecasts and reduce their time intervals, the idea arose to use frequently available information derived from satellite imagery. For the improvement of macroeconomic forecasts, the period to detect changes between two points in time needs to be rather short because early identification of such investments is beneficial. Therefore, in this study, it is of interest to identify and quantify new construction areas, which will turn into build-up areas later. A multiresolution segmentation followed by a kNN classification is applied to WorldView images from an area around the southern part of Berlin, Germany. Specific material compositions of construction areas result in typical classification patterns different from other land cover classes. A GIS-based analysis follows to extract specific temporal “patterns of life” in construction areas. With the early identification of such patterns of life, it is possible to predict construction areas that will turn into real estate later. This information serves as an input for macroeconomic forecasts to support quicker forecasts in future.
1. Introduction
Macroeconomic forecasts are well-known instruments to quantify the economic development for a country and for a certain time period. These forecasts are based on facts or indicator variables (that indicate the macroeconomic activity) that stem from official reports and statistics, which are published in certain intervals at specific fixed dates []. If no amended information is published by these sources, one is not able to give an updated forecast on the macroeconomic development for the following period in time. To reduce the time lag between data analysis and the forecasting period, economists look for alternative datasets. They are to provide innovative indicators that facilitate the needed forecasts in even shorter time intervals. One indicator for those forecasts are investments in the construction sector. Advantageously, buildings are objects that can be seen and mapped using satellite images. Due to the high temporal revisit rate of earth observation satellites, it is possible to detect changes at almost every location on Earth. Beyond identifying buildings in satellite imagery, it is also possible to detect and precisely locate construction areas. For this, the imagery needs to meet specific requirements regarding their temporal, spectral, or spatial resolution. Little cloud cover is vital for an unimpeded view of all targets.
In urban remote sensing, many approaches exist to map cities and urban areas (e.g., [,,,,,]), attaining high spatial precision and accuracy. For many applications, the recognition of built-up structures is of major interest (e.g., [,]). Besides optical aerial or satellite imagery, LiDAR images (e.g., [,,]) are also used. Varol et al. [] combine LiDAR images and stereo KOMPSAT-3 data to detect illegal buildings in a part of Istanbul. In addition to the versatile image acquisition, many change-detection approaches exist with different case studies on urban areas based on a variety of image sources and using various methodological approaches (e.g., [,,,,,,,]). An aspect that all of these studies have in common is a long time interval between two image acquisition dates—for the majority, in fact, some years. For macroeconomic forecasts, this is too long to show the growth of an urban area by a change detection analysis. For that purpose, images need to be acquired at high revisit rates. It allows tracking changes within a year or even shorter periods. Considering this, the approach presented here is an innovative topic for urban remote sensing analysis.
Due to the nature of forecasts, the simple detection of ready-to-use buildings is not the target of interest, but the detection of construction sites. Construction sites represent an even earlier indicator of real estate investments. Therefore, this study focusses on the early detection of construction activities in satellite imagery.
2. Materials and Methods
2.1. Satellite Image Data
In a case study [], an area from the southern part of the German capital Berlin was selected to test the suitability of VHR earth observation data for the identification and quantification of construction activities. It appeared suitable due to the high level of construction activity during the past years. Images of a time period between 2015 and 2020 were used to determine the reliability of the new robust extraction workflow to be developed. The determination of new construction areas turns out to be especially difficult, since one can hardly recognize the development of a building before its completion.
In this project, ortho-rectified pan-sharpened VHR WorldView satellite imagery is used (Table 1) with four bands (red-green-blue-infrared) and a geometric resolution of 0.3–0.5 m.

Table 1.
WorldView scenes used (DigitalGlobe Inc., a Maxar company []).
2.2. Classification for Construction Area Detection
A simple and efficient way to identify construction activities in satellite imagery lies in mono-temporal land cover classification approaches that are based upon spectral values. Such a classification approach assumes that construction areas differ spectrally from other land cover types. Possible misclassifications might occur if other surfaces are spectrally similar to construction areas. Here, each scene is classified using object-based image analysis (OBIA) and a machine learning classifier (k-nearest neighbours), both implemented in eCognition 9.4.
During the training of the classifier, samples are collected in each scene individually to gather representative surface information for each land cover category (Table 2). By sampling areas and filling these with points in a 4 m grid, approximately 38,000 samples per scene are generated. eCognition’s multiresolution segmentation creates nearly homogenous objects of spectrally similar pixels. Here, it takes into account all spectral bands and is set to scale = 42, shape = 0.1, compactness = 0.5. The objects derived are classified afterwards using a kNN (k-nearest neighbors) classifier that gets trained on the image features listed in Table 3. Basically, the mono-temporal classification results for all individual scenes are used to refine the result by a GIS-based analysis.
Table 2.
Classification nomenclature.
Table 3.
Overview of the image features that were used for the classification.
2.2.1. Mono-Temporal Classification Patterns
In this approach, a construction site is described as an area with a unique classification pattern resulting from a typical material composition. This is based on the observation that construction sites are comprised of many small objects like construction equipment, flattened ground, as well as completed or uncompleted building elements (Figure 1). It is envisaged to analyze whether construction areas can be distinguished from rather homogeneous types of settlements, such as residential or industrial areas. Furthermore, the aim was to examine if different types of construction sites can be identified (e.g., for residential or industrial buildings).
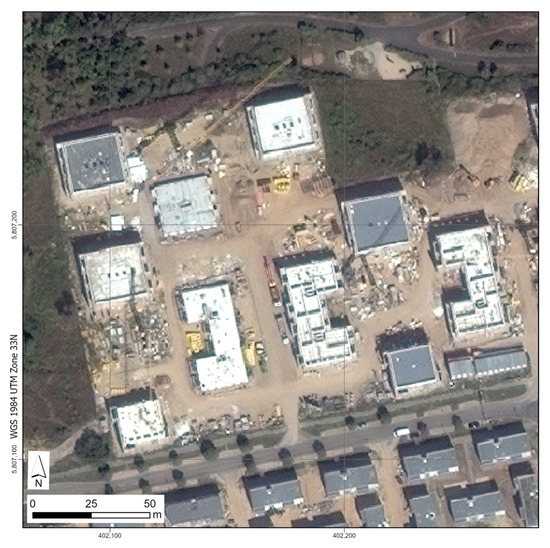
Figure 1.
Construction area in a WorldView-2 Scene from the 8 August 2020. It consists of buildings in different stages of construction, different surface types, machinery, and other very small elements that lead to many different class assignments. Source: WorldView Image ©2021, DigitalGlobe Inc., a Maxar company [].
2.2.2. Multi-Temporal Approaches for Construction Area Detection
For this exploratory study, six VHR images of different dates and seasons are used. For the further exploitation of the individual mono-temporal classification results, a strategy was developed to follow the “pattern of life” of construction sites. The basic idea is the detection of frequent temporal changes within certain land-cover classes. Typical construction areas stem from one “regular” land cover, then turn into a construction area for a certain period of time and finally end up with some type of real estate. With the search for such temporal land cover patterns, three successive classification results are compared to find characteristic patterns of Type A and B (Table 4). For the comparison, the classified objects are analyzed in their temporal behavior. Once the pattern of Type A or B is detected in a set of three successive images, it gets categorized as such.
Table 4.
Multi-temporal approaches for construction area identification.
The first approach, shown in Table 4 (Type A), detects construction areas in three different stages: In the first image, the area appears unsealed and represents one of the natural land covers. In the successive image, the construction area appears. It gets verified in the third image, which shows its completion.
The second approach in Table 4 (Type B) identifies construction areas in two consecutive images. They end up in a completed construction site in the third image. This type refers to construction areas with multi-year activities.
3. Results
The classification of VHR WorldView images revealed great potential to identify construction areas. Based on a selection of available ortho-rectified scenes for an area in Berlin, Germany, one could test the suitability of those images as well as an appropriate classification strategy.
3.1. Mono-Temporal Classification Results
Basically, the material composition of construction areas can be discriminated from other land cover classes quite well even using the applied mono-temporal classification approach with limited spectral resolution. Figure 2 depicts many active construction areas. On this basis, the acreage can be calculated and summed up for every class (Figure 3 and Table 5).
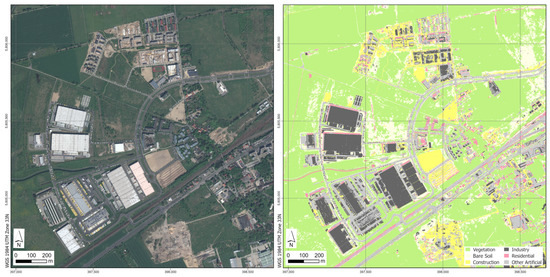
Figure 2.
Detailed view of the classification results from the 29 April 2018. Source: WorldView Image ©2021, DigitalGlobe Inc., a Maxar company [].
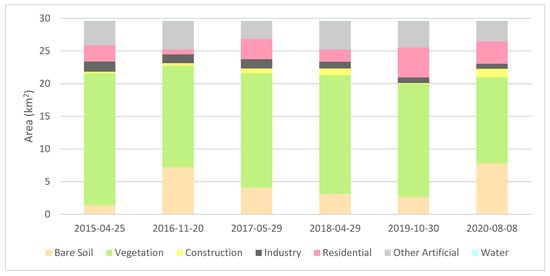
Figure 3.
Classification results of the study area based on the WorldView images.
Table 5.
Numeric classification result of the WorldView images (km2).
In all the VHR scenes used, one can identify different kinds of sealed areas, such as industrial areas or residential areas. Some potential confusion between residential areas and other sealed surfaces remains due to the spectral similarity of construction materials.
One challenge is the recognition of water, which often gets classified as a sealed surface. This probably occurs due to the limited number of water samples present in the scenes.
For the mono-temporal classification pattern approach, eight examples of the following types are compared: Residential areas, industrial areas, and construction sites (Figure 4). The aim is to discriminate those types by their class composition. The class compositions reveal that construction areas appear significantly different from residential or industrial areas. However, it is not possible to work out distinct discrimination between different types of construction sites. In Figure 5, one can see the result for the 29 April 2018.
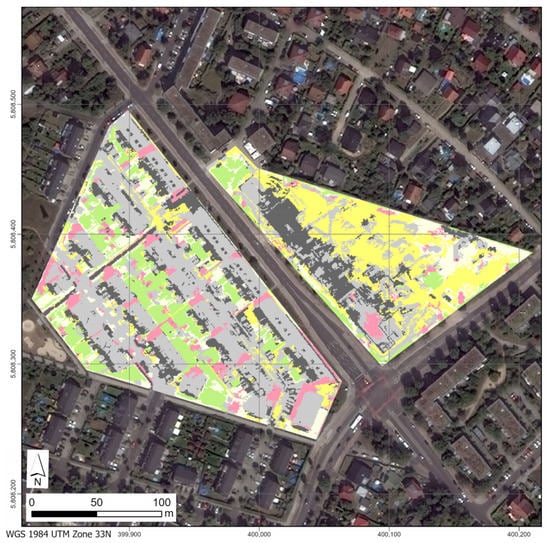
Figure 4.
One residential (left) area and one construction site (right) for which the respective classification of the WV-3 scene from the 29 April 2018 was extracted. Source: WorldView Image ©2021, DigitalGlobe Inc., a Maxar company [].
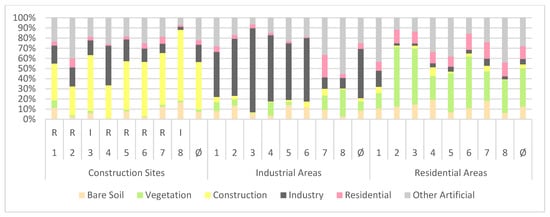
Figure 5.
Material/Land cover composition pattern of all extracted areas from Figure 4 (29 April 2018). The color of the soil class was adjusted for better visibility. R indicates construction sites for residential buildings and I indicates construction sites for industry buildings.
Construction sites are characterized by a composition of approximately 47% construction and approximately 43% sealed surfaces with a slight tendency towards industry and other artificial surfaces. It is impossible to identify significant differences between construction sites for residential (R) or industrial buildings (I). That is because of the similar material appearance of construction sites. It is hardly possible to recognize the envisaged use of buildings.
In industrial areas, the corresponding class occurs most frequently by an average of 49%. Large buildings with white flat roofs stand out due to their spectral characteristics. They are easy to classify. Other artificial surfaces also play an important role by a share of 25%. They cover large, paved areas around the buildings as well as roads. The higher proportion of the vegetation class compared to that for construction sites represents lawns and roadside vegetation.
In residential areas, the average proportion of green space (38%) is nearly as large as the proportion of total sealed area (46%). The residential building class, as expected, plays only a minor role due to the smaller houses compared to industrial structures. That is also evident with the districts on the southern edge of Berlin that mainly consist of single-family homes.
Open soils appear evenly distributed over all areas at approximately 10%. Hence, they are of little importance.
3.2. Multi-Temporal Approaches
Two multi-temporal approaches are tested (Table 4). Figure 6 shows areas of Type A, that are unsealed in the first year of observation, classified as construction sites in the second year and appear as sealed in the third year. Figure 7 shows few areas of Type B, that are under construction for two years and sealed in the third year.
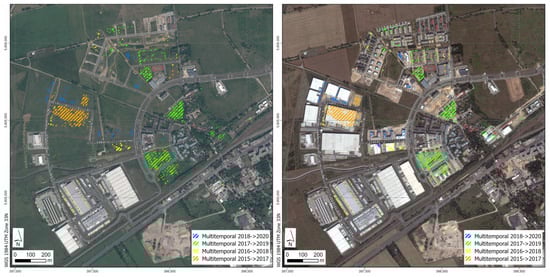
Figure 6.
Multi-temporal classification results of Type A, displayed on two WorldView scenes (24 May 2015 (left) and 8 August 2020 (right). One can identify areas that were not sealed in the first year of observation, were under construction in the second year, and ended up as completed construction or sealed surfaces in the third year. Data source: WorldView Image ©2021, DigitalGlobe Inc., a Maxar company [].
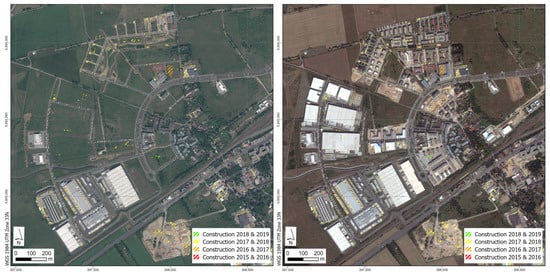
Figure 7.
Multi-temporal classification results of Type B, displayed on two WorldView scenes (24 May 2015 (left) and 8 August 2020 (right). One can identify areas that were under construction in two years. Data source: WorldView Image ©2021, DigitalGlobe Inc., a Maxar company [].
The change detection results get compared with the areal extent of successive new buildings and their surrounding sealed area in order to be able to roughly calculate the accuracy of construction area determination by the different approaches. Due to the temporary or respectively transitory nature of construction areas, there is no independent retrospective reference data source other than remote sensing. Consequently, it is not possible to calculate true or false negatives. The accuracy of the tested approaches differs. It is dependent on the season as well as on the type and size of the construction area. The results are listed in Table 6.
Table 6.
Verification results.
4. Discussion
VHR satellite images can be used to identify construction areas via land cover classification. The analysis of classification results reveals certain characteristics of construction areas. These findings support a more timely generation of economic forecasts.
Specific material compositions of construction areas result in typical classification patterns. It is possible to separate construction areas from industrial and residential areas. The areas classified differ from year to year, depending upon the construction activity. In addition, the rate of true positives varies a lot, so it can be concluded that this identification option based on individual scenes is not the most reliable.
The GIS-based multi-year analysis focuses on the life cycle of construction areas between successive years and considers more than one classification result. It is possible to distinguish between single-year and biennial construction areas. The verification is performed with subsequent images. For realistic support of economic forecasts, this last step of verification by completed construction sites would be too late (after the forecast). One seeks to gain a time benefit by early integration of image-based construction area information.
The multi-temporal patterns of life reveal that most construction areas exist for about a year (Type A) and only a few for two years (Type B). Consequently, construction areas of Type A dominate the areal statistics. Type B construction areas complement Type A construction areas. The reliability of Type A is very high according to the true positives. It is likely that the temporal pattern of Type B is much harder to catch with the available images.
One should overlay the results of different analysis steps to see where the result appears to be most reliable. That helps to make sure that the identification of construction sites is robust and correct so far. It should happen even in the early stages of construction despite all difficulties of mono-temporal classification approaches. In Figure 8, the two multi-temporal approaches are overlaid on the full scene of 29 April 2018. One can clearly see their complementary nature.
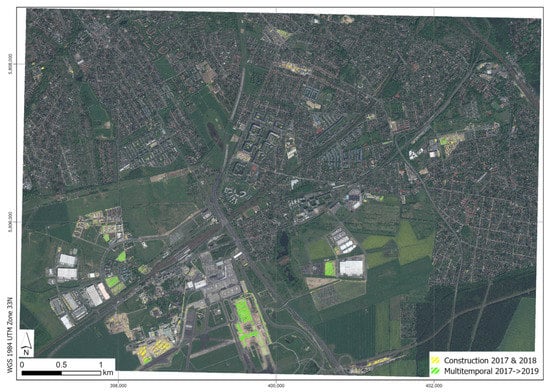
Figure 8.
Combination of construction area detection in the full WorldView-3 scene of the 29 April 2018 using both multi-temporal approaches. Data source: WorldView Image ©2021, DigitalGlobe Inc., a Maxar company [].
In spring and early summer scenes, construction sites get classified as such without the need to evaluate later imagery. However, in winter scenes or under drought-like conditions, the corresponding classes (especially construction and open soil) become more congruent, and the number of misclassifications rises.
Due to the different seasons and the resulting appearance of the landscape, one has to experiment with more images and additional methodological approaches to come to better results. As a result of this study, a first step has been taken, but it needs to be complemented by more in-depth studies.
Independent from the imagery used, areas with tall vegetation suffer from the effect of tree crowns shielding the area underneath. This might influence the area statistics between vegetated and non-vegetated scenes because areas underneath the crowns cannot be classified.
Another challenge in this urban investigation area is view direction distortion of high buildings in non-nadir scenes (Figure 9). Vertical facades become visible and hide the actual land cover, leading to seemingly overlapping areas that are not congruent in reality. In the worst case, facades hide green areas such as gardens, which then get classified as areas with an increasing degree of sealing. In the case of another viewing direction of the satellite for a follow-up mage, this phenomenon could lead to errors in the area statistic, since other areas are then hidden by the same building but in another direction.
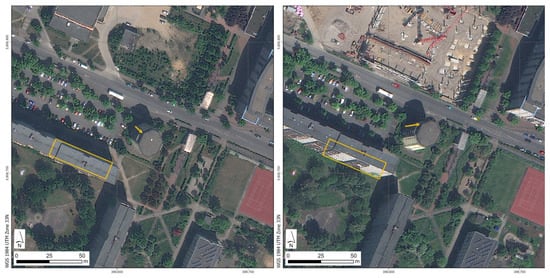
Figure 9.
Comparison of the WorldView-3 scenes from the 24 May 2015 (left) and the 29 April 2018 (right) to illustrate the radial offset (arrows) with the associated vertical tilt of buildings (facades become visible) and the resulting occlusion of surfaces (exemplified by a base rectangle for reference). Data source: WorldView Image ©2021, DigitalGlobe Inc., a Maxar company [].
Another matter for discussion is the availability of cloud-free scenes. In case of unfavorable weather conditions images might suffer from high cloud cover and thus be useless. That can affect the detection of construction areas. One could even miss a construction stage because of too little available cloud-free or slightly cloudy images. For such conditions one could augment the experiment with SAR-data.
The next step after gaining the site-specific knowledge of construction areas will be the proper integration of the spatial information into the economic model domain. Here, robust structures are needed to be able to consider even weak spatial results. Further research can find out how spatial incompleteness or spatial incorrectness affects these economic forecasts. In other words, from which scenario or input data do these models benefit and under what conditions can additional information be considered useless or even harmful. Hopefully, this gets considered in a follow-up project.
5. Conclusions
VHR satellite images have been successfully utilized to discriminate construction areas from other land cover classes by image classification. Despite rather systematic problems (like radial distortion), the results are promising. The characteristic “pattern-of-life” assists in the detection of frequent temporal changes of land-cover and land-use. This study reveals that it is possible to analyze the land cover composition for specified areas. Areas with a high percentage of sealed surfaces and construction areas and almost no vegetation cover are very likely areas with new buildings at a later stage, when construction has finished. With the early identification of such “patterns-of-life”, one can forecast construction areas that will turn into buildings later. This information serves as an input for macroeconomic forecasts to support timelier forecasts in the future.
Despite these promising results, there is a lot of potential for improvement regarding other image sources and other classification approaches. Hopefully, satellite images will enhance macroeconomic forecasts in the future on a routine basis.
Funding
This research was funded by the German Federal Ministry for Economic Affairs and Energy.
Institutional Review Board Statement
Not applicable.
Informed Consent Statement
Not applicable.
Data Availability Statement
Not applicable.
Acknowledgments
The project cooperation and the discussions with Thorsten Schmidt (RWI—Leibniz Institute for Economic Research (formerly Rheinisch-Westfälisches Institut für Wirtschaftsforschung)) is highly appreciated.
Conflicts of Interest
The authors declare no conflict of interest.
References
- RWI—Leibniz-Institut für Wirtschaftsforschung (Ed.) Big Data in der Makroökonomischen Analyse. Fachlos 3: Machbarkeitsstudie: Prognose von Ausrüstungsinvestitionen, Bauinvestitionen, Exporten mit Unkonventionellen Datenquellen und Methoden; Vorläufiger Endbericht: Essen, Germany, 2021; pp. 79–125. [Google Scholar]
- Rashed, T.; Jürgens, C. Remote Sensing of Urban and Suburban Areas, 1st ed.; Springer Book Series Remote Sensing and Digital Image Processing; Springer: London, UK, 2005; Volume 10. [Google Scholar] [CrossRef]
- Weng, Q.; Quattrochi, D. Urban Remote Sensing; CRC Press: Boca Raton, FL, USA, 2006. [Google Scholar] [CrossRef]
- Henits, L.; Jürgens, C.; Mucsi, L. Seasonal multitemporal land-cover classification and change detection analysis of Bochum, Germany, using multitemporal Landsat TM data. Int. J. Remote Sens. 2016. [Google Scholar] [CrossRef]
- Li, H.; Wang, C.; Zhong, C.; Su, A.; Xiong, C.; Wang, J.; Liu, J. Mapping Urban Bare Land Automatically from Landsat Imagery with a Simple Index. Remote Sens. 2017, 9, 249. [Google Scholar] [CrossRef] [Green Version]
- Shi, L.; Taubenböck, H.; Zhang, Z.; Liu, F.; Wurm, M. Urbanization in China from the end of 1980s until 2010—Spatial dynamics and patterns of growth using EO-data. Int. J. Digit. Earth 2019, 12, 78–94. [Google Scholar] [CrossRef]
- Ghazaryan, G.; Rienow, A.; Oldenburg, C.; Thonfeld, F.; Trampnau, B.; Sticksel, S.; Jürgens, C. Monitoring of Urban Sprawl and Densification Processes in Western Germany in the Light of SDG Indicator 11.3.1 Based on an Automated Retrospective Classification Approach. Remote Sens. 2021, 13, 1694. [Google Scholar] [CrossRef]
- Durieux, L.; Lagabrielle, E.; Nelson, A. A method for monitoring building construction in urban sprawl areas using object-based analysis of Spot 5 images and existing GIS data. ISPRS J. Photogramm. Remote Sens. 2008, 63, 399–408. [Google Scholar] [CrossRef]
- Awrangjeb, M.; Hu, X.; Yang, B.; Tian, J. Editorial for Special Issue: “Remote Sensing based Building Extraction”. Remote Sens. 2020, 12, 549. [Google Scholar] [CrossRef] [Green Version]
- Hermosilla, T.; Ruiz, L.A.; Recio, J.A.; Estornell, J. Evaluation of automatic building detection approaches combining high resolution images and LiDAR data. Remote Sens. 2011, 3, 1188–1210. [Google Scholar] [CrossRef] [Green Version]
- Hermosilla, T.; Ruiz, L.A.; Recio, J.A.; Balsa-Barreiro, J. Land-use mapping of Valencia city area from aerial images and LiDAR data. In GEOProcessing 2012: The Fourth International Conference in Advanced Geographic Information Systems, Applications and Services; International Academy, Research, and Industry Association (IARIA): Wilmington, MA, USA, 2012; pp. 232–237. [Google Scholar]
- Yan, W.Y.; Shaker, A.; El-Ashmawy, N. Urban land cover classification using airborne LiDAR data: A review. Remote Sens. Environ. 2015, 158, 295–310. [Google Scholar] [CrossRef]
- Varol, B.; Özlem Yılmaz, E.; Maktav, D.; Bayburt, S.; Gürdal, S. Detection of illegal constructions in urban cities: Comparing LIDAR data and stereo KOMPSAT-3 images with development plans. Eur. J. Remote Sens. 2019, 52, 335–344. [Google Scholar] [CrossRef] [Green Version]
- Lunetta, R.; Johnson, D.; Lyon, J.; Crotwell, J. Impacts of imagery temporal frequency on land-cover change detection monitoring. Remote Sens. Environ. 2004, 89, 444–454. [Google Scholar] [CrossRef]
- Blaschke, T. Towards a framework for change detection based on image objects. In Remote Sensing & GIS for Environmental Studies; Erasmi, S., Cyffka, B., Kappas, M., Eds.; Göttinger Geographische Abhandlungen: Göttingen, Germany, 2005; Volume 113, pp. 1–9. [Google Scholar]
- Martinez, L.; Pala, V.; Arbiol, R.; Pineda, L.; Joaniquet, M. Urban Change Detection on Satellite Images Series. Application to Catalunya Area. In Proceedings of the 2007 Urban Remote Sensing Joint Event, Paris, France, 11–13 April 2007; pp. 1–5. [Google Scholar] [CrossRef] [Green Version]
- Taubenböck, H.; Esch, T.; Wurm, M.; Roth, A.; Dech, S. Object-based feature extraction using high spatial resolution satellite data of urban areas. J. Spat. Sci. 2010, 55, 117–133. [Google Scholar] [CrossRef]
- De Vecchi, D.; Galeazzo, D.A.; Harb, M.; Dell’Acqua, F. Unsupervised change detection for urban expansion monitoring: An object-based approach. In Proceedings of the 2015 IEEE International Geoscience and Remote Sensing Symposium (IGARSS), Milan, Italy, 26–31 July 2015; pp. 350–352. [Google Scholar] [CrossRef]
- Ma, L.; Li, M.; Blaschke, T.; Ma, X.; Tiede, D.; Cheng, L.; Chen, Z.; Chen, D. Object-Based Change Detection in Urban Areas: The Effects of Segmentation Strategy, Scale, and Feature Space on Unsupervised Methods. Remote Sens. 2016, 8, 761. [Google Scholar] [CrossRef] [Green Version]
- Benedetti, A.; Picchiani, M.; Latini, D.; Del Frate, F.; Schiavon, G. COSMO-SkyMed for Unsupervised Urban Change Detection using Radar Backscattering and Interferometric Coherence. In Proceedings of the IGARSS 2019—2019 IEEE International Geoscience and Remote Sensing Symposium, Yokohama, Japan, 28 July–2 August 2019; pp. 485–488. [Google Scholar] [CrossRef]
- Mao, W.; Lu, D.; Hou, L.; Liu, X.; Yue, W. Comparison of Machine-Learning Methods for Urban Land-Use Mapping in Hangzhou City, China. Remote Sens. 2020, 12, 2817. [Google Scholar] [CrossRef]
- DigitalGlobe. 2020. Available online: http://www.digitalglobe.com/ (accessed on 10 September 2020).
Publisher’s Note: MDPI stays neutral with regard to jurisdictional claims in published maps and institutional affiliations. |
© 2021 by the authors. Licensee MDPI, Basel, Switzerland. This article is an open access article distributed under the terms and conditions of the Creative Commons Attribution (CC BY) license (https://creativecommons.org/licenses/by/4.0/).