1. Introduction
The traditional geochemical exploration method generally plays a major role in the advance mapping and surveying by providing a large amount of qualitative data for a prospective area. However, this technique itself could not fulfill the expectations of modern exploration programs due to its high cost of data collection over a long period. The development of remote sensing imagery offers helpful exploration databases by producing vast amounts of high-quality spatial and spectral resolution images, which have further revolutionized the traditional geochemical method. Thus, the combination of remote sensing imagery and geochemical technique can provide useful guidance information for regional-scale prospecting mineral deposits and delineate the distribution of mineralized and barren zones [
1,
2,
3,
4]. On the other hand, such a combination can be helpful to detect local-scale hydrothermal alteration zones associated with mineralization in the visible and near-infrared (VNIR) and short-wave infrared (SWIR) regions [
5,
6,
7,
8]. Hydrothermal alteration minerals are generally linked with the ore deposits (e.g., Au, Cu, and Fe), and can be well assessed through remote sensing imagery (advanced multispectral and hyperspectral imaging) [
6,
8,
9]. However, when geochemical prospecting is combined with surface reflection spectrum [
10,
11,
12,
13,
14], such a combination often has low accuracy for the mapping model.
Additionally, the use of remote sensing imagery data (e.g., advanced multispectral and hyperspectral images) for effective geochemical modeling is a challenge in desert regions. Quantitative remote sensing inversion can obtain information of earth’s surface based on electromagnetic wave reflection, together with geochemical exploration data for specific sampling points [
15,
16,
17]. Then, mathematical modeling through traditional model accuracy testing methods such as the Pearson correlation coefficient (R) and root mean square error (RMSE) can be performed for generating satellite-based mineral prospectivity maps at local-scale [
9,
18]. However, geomorphological variations are challenging in the field and spatial heterogeneity exists for the content of metallic elements at different sampling points. This implies that the traditional model testing methods have some limitations. Moreover, the point scale cannot accurately reflect the spatial and temporal changes information on the Earth's surface at a large scale [
19]. Thus, the authenticity of previous studies determines the accuracy of modeling up to some extent. In mineral prospectivity modeling, some errors exist when discrete sampling points are used to replace the continuous surface data since the sampling point area is much smaller than the pixel resolution of remote sensing image [
19,
20,
21]. Thus, the scale inconsistency can further affect the accuracy for the mapping model.
With regard to the limitations of traditional test methods and the low accuracy of the existing mapping model, this paper proposes a geochemical anomaly model test method and scale transformation based on the quantitative remote sensing inversion study of metallic elements in order to improve the accuracy for mapping model at local-scale. Therefore, this study investigates a new approach for mineral prospecting by integrating geochemical data and multispectral/multi-sensor satellite imagery (ASTER and WorldView-2 remote sensing data) for the Qishitan polymetallic deposit. This research aims to perform point-to-point matching and statistical calculation errors by integrating the content of metallic elements for geochemical sampling points and the remote sensing modeling data for the corresponding points.
2. Geological Background
The Qishitan area is located in central Asia, in the southeast of Shanshan County, Turpan City, Xinjiang Uygur Autonomous Region, NW China. The geographical coordinates are 90°59′–91°04′ east longitude and 42°00′–42°03′ north latitude (
Figure 1a). The study area is about 26.5 km
2, and the altitude is about 1200 m. This area belongs to the South Lake Gobi Desert low hills, which exhibit gentle terrain and little vegetation cover. In the study area around the Qishitan region, the volcanic and magmatic activities are frequent and well-developed stratigraphic folds and faults. Furthermore, this area has strong ductile shear tectonic zones and obvious dynamic metamorphism. The distribution of gold and polymetallic minerals is controlled by the regional structures such as ductile shear zones. To the north of the Qishitan area, it is 42 km away from the Kangguer deep fault and 20 km away from the Yamansu large fault. In the north and east of the study area, there are large nappe faults in Aqikkuduk [
22]. Exposed Formation in the area mainly includes the Lower Carboniferous Kushui Group, Gandun Group, Aqishan Formation, Yamansu Group, and Quaternary System (
Figure 1b) [
23]. The formations are mainly composed of gray calc-alkaline intermediate-acid volcanic rocks, clastic rocks, carbonates, and hemi-abyssal island-arc complex sandstones. Gray semi-cementing conglomerates and mud-calcareous cementation are also exposed in the mine area [
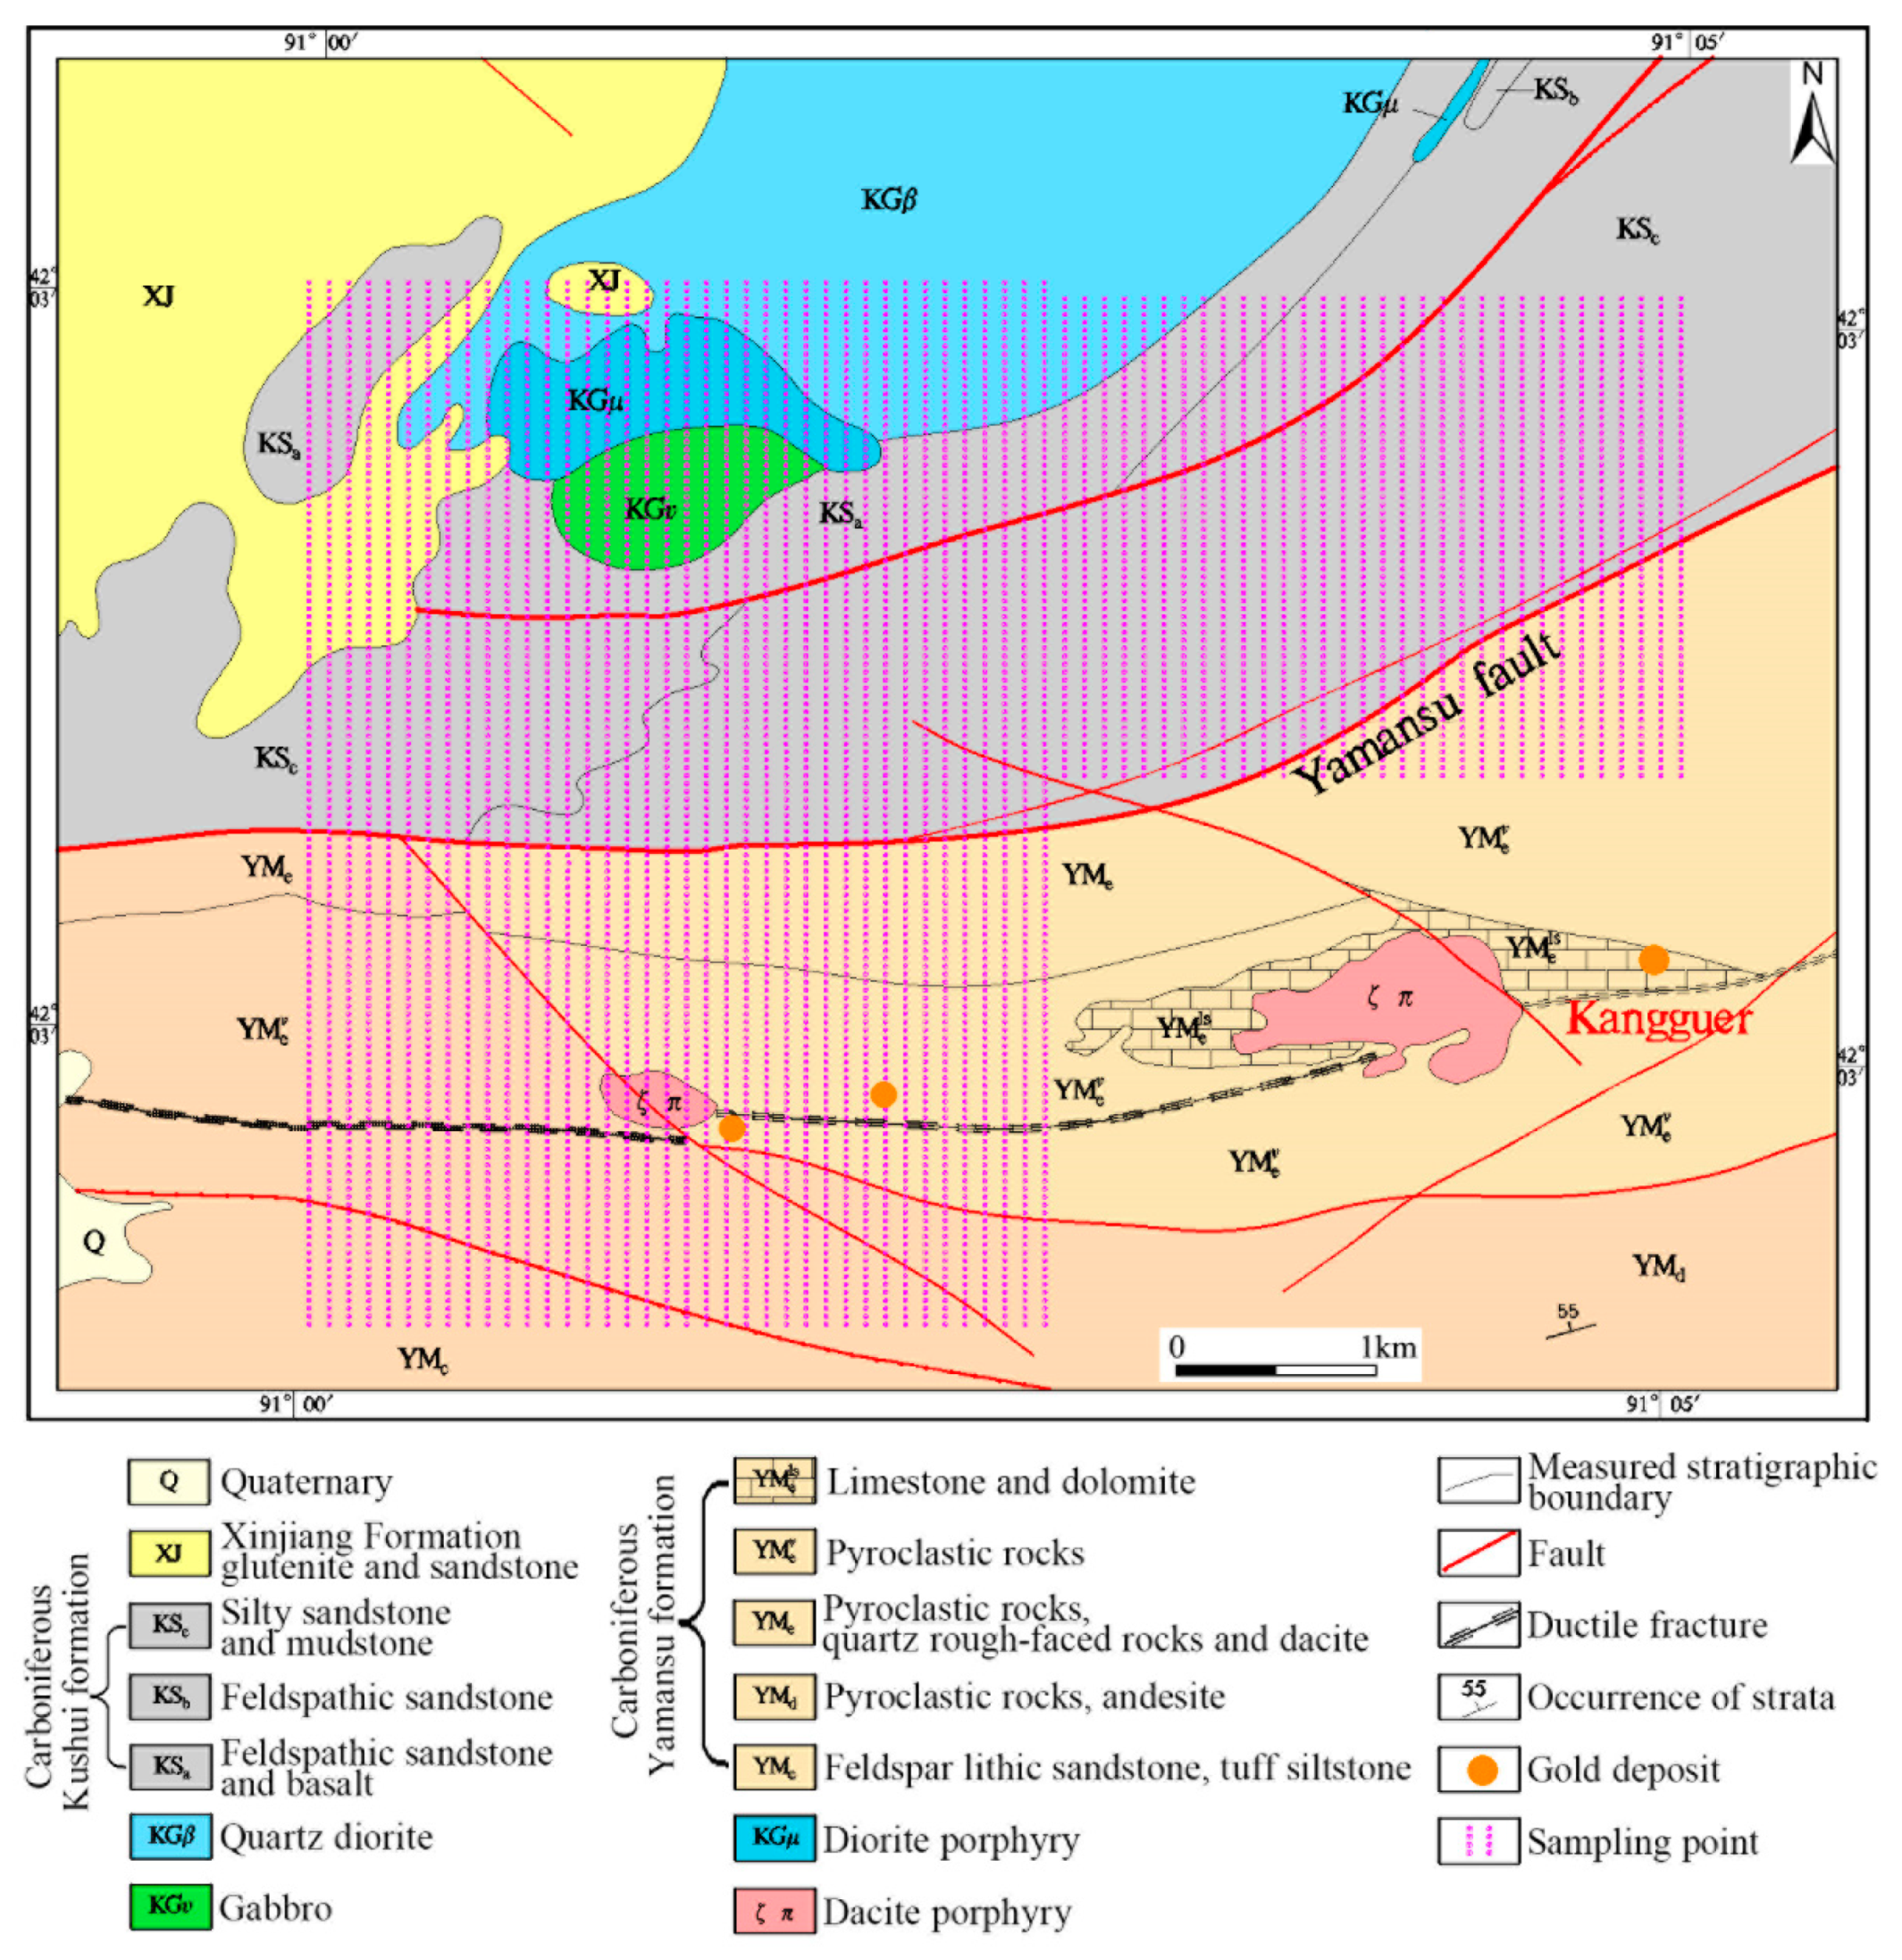
22]. The formation of metallic minerals in this region was related to the filling and alteration of hydrothermal fluids. A series of east–west tectonic fracture zones occurred in the mining area and the surrounding rock was subjected to the north-south tectonic stress. The acidic magma in the deep crust intruded continuously, and these ore-bearing hydrothermal fluids carried a large number of ore-forming metallic elements in the surrounding area during their upward migration along the tectonic fracture zones, and then enriched, filled, and deposited in the surrounding cracks to make ore bodies under certain conditions (
Figure 1b).
The Qishitan area hosts a total of four gold, four copper, and eight lead-zinc mines [
23]. The main resources in this region are Au, As, Sb, Cu, Pb, Zn, Bi, Mo, and W. These elements have advantages of good combination, high strength, and obvious zoning. In this area, ore bodies of the Kangguer deposit (
Figure 2) are trending in the E-W direction and dipping with an angle of 38–63° towards the north. The ore bodies in the study area are distributed along the mylonite in the middle of the crushing zone, with a length of 600 m and a width of 10–20 m, interspersed with quartz veins [
29]. The alteration in the area mainly includes pyritization, silicification, and malachite petrification, and contains Au and Cu in a certain scale. Another two gold deposits, which are located to the west of the Kangguer deposit, have been found recently (
Figure 2), which have a potential of gold polymetallic prospecting [
22].
3. Data Sources and Methodology
3.1. Data Acquisition and Processing
3.1.1. Acquisition and Processing of Geochemical Data
Geochemical sampling was carried out in the Qishitan polymetallic mining area according to a grid division of 100 m × 40 m (
Figure 2). The sampling points were selected within the 1/10 grid distance from the surrounding point line. The aeolian cap above the bedrock regolith was initially removed to expose the bedrock layers. Then surface samples were collected from the top of the bedrock regolith. After collecting them 3–5 times, they were combined into one sample and weight of each sample was ensured to be greater than 200 g. A total number of 2774 surface samples were collected for this study. All the samples were dried and ground to a size of 200 meshes after the initial processing, such as 4–20 mesh sieving. Geochemical analyses were performed for the selected metallic elements (As, Au, Cu, Hg, Mo, Pb, and Zn) at the Institute of Geophysical Exploration of the General Administration of Metallurgical Geology of China. We randomly selected 200 samples out of the 2774 analyzed samples for the establishment of a regression model (
Table 1).
3.1.2. Satellite Remote Sensing Data
In the visible near infrared (VNIR) region, ASTER data has three bands and a reflected radiation ranging between 0.52 μm and 0.86 μm. The spatial resolution of the VNIR data is up to 15 m and can be useful to assess vegetation and iron oxide minerals on soil and rock surfaces [
8,
30,
31]. In the short-wave infrared (SWIR) region, ASTER data has six bands with a spatial resolution of 30 m and a reflected radiation of 1.6–2.43 μm [
32], which reflects the spectrum characteristics of clay minerals and carbonate minerals and helps for the identification of such minerals. In the thermal infrared (TIR) region, ASTER data has five bands with a spatial resolution of 90 m and a wavelength ranging from 8.125 to 11.65 μm, which is useful for determining the surface temperature and silica content [
8,
33]. Overall, ASTER VNIR, SWIR, and TIR spectra are powerful tools for the identification of minerals and lithology. An ASTER level 1 B scene [
8] covering the studied area was acquired on 29 April 2015 through the methods mentioned in [
6,
8]. This image has been geometrically corrected and rotated to a north UTM projection. Digital Globe Incorporated from Vandenberg Air Force Base [
6] launched the WorldView-2 satellite in October 2009. This satellite provides two types of data: (i) commercial panchromatic images with a resolution of 0.48 m, and (ii) multi-spectral images with an eight-band resolution of 1.84 m [
34]. Besides four typical bands (red band, green band, blue band, and near-infrared band), this satellite further provides four new bands (coastal band, yellow band, red edge band, and near-infrared 2 band), which are helpful for conducting accurate change detection and mapping. The WorldView-2 data used in this study were acquired on 20 December 2011. Technical characteristics of the WorldView-2 and ASTER sensors are shown in
Table 2.
3.1.3. Remote Sensing Data Pre-Processing
It is necessary to pre-process the remote sensing data in order to remove the interference on data and better reflect the reflectivity of ground objects. The ASTER and WorldView-2 images were georeferenced to UTM zone 33 North map projection using the WGS84 datum [
35,
36]. The Environment for Visualizing Images (ENVI) software version [
8] was used to perform radiometric calibration on both remote sensing data, followed by atmospheric correction using Fast Line-of-sight Atmospheric Analysis of Spectral Hypercube (FLAASH) [
37] algorithm along with Mid-Latitude Summer atmospheric and Tropospheric aerosol models (Research Systems, Inc., HongKong, China, 2008). Geometric fine correction was further applied to the WorldView-2 data using the geological map of the studied area. Then, the calibrated WorldView-2 image was used to perform geometric fine correction on the ASTER image.
3.2. Feature Band Selection
A correlation analysis between the band and the content of metallic element is commonly needed for the multispectral remote sensing data. This involves calculating the correlation between the content values of each metallic element for a sample point and the reflectance values of ASTER and WorldView-2 remote sensing image bands. In this work, the choice of a strong correlation between bands is to optimize the inversion results of regression model. The poor correlations between bands or non-positive effects of the target element and inversion prediction with useless information are not introduced in the model calculation. This is because to reduce their impact on accuracy and push the inversion results closer to the real geochemical model.
3.3. Remote Sensing Modeling and Inversion Methods
3.3.1. Multiple Linear Regression Modeling
Regression analysis can accurately predict the response of dependent variables with respect to the change in the number of independent variables by judging the interdependent relationship between variables. In multiple regression analysis, the multiple linear regression plays an important role, which is widely used in various research fields.
The Equation (1) represents an n-element linear regression model, in which there are
n independent variables. Y corresponds to the dependent variable, also known as the response variable or the explanatory variable, whereas ε is the value of random error, also known as the residual value. The latter is the remaining value after the dependent variable Y is explained by the independent variables (
X1⋯
Xn).
β0 is the regression constant, while
β1⋯
βn is called the regression coefficient. In this study, a correlation analysis was made between independent variables to eliminate those dependent variables that are not strongly correlated. Then, a stepwise regression modeling method was introduced, in which independent variables related to dependent variables were substituted into the regression model one by one and the significance test was carried out sequentially. When the original import was no longer significant due to the introduction of a later variable, the original import was removed. This was repeated until the optimal variable factor was obtained [
38].
3.3.2. Model Accuracy Test
In this study, the regression model of each element was established by taking the reflectance data of the remote sensing image for a sampling point as an independent variable and the content of metallic element for a sampling point as a dependent variable. Then, Pearson correlation coefficient (R) and root mean square error (RMSE) were introduced to test the fitting degree of the model as well as to evaluate and determine the final prediction model. The closer the absolute value of correlation coefficient is to 1, the stronger the linear correlation between the two variables. Additionally, the smaller the root-mean-square error, the higher the precision of the model.
3.3.3. Interpolation of Geochemical Anomalies
In order to better describe and express the macroscopic anomaly information reflected by the geochemical sampling data, this paper uses 6768 sample data to carry out ordinary Kriging interpolation operation for each element and gets the geochemical anomaly interpolation map of each element sampling data.
4. Results and Analysis
4.1. Remote Sensing Modeling and Inversion Methods
Based on the multiple linear regression method, Y
Au, Y
Cu, Y
Pb, Y
Zn, Y
Mo, Y
As, and Y
Hg are the predicted content values of Au, Cu, Pb, Zn, Mo, As, and Hg. The equation models established by combining the geochemical data and the eliminated spectrum are shown as follows (
Table 3):
4.2. ASTER Data Modeling Accuracy Test
Pearson correlation coefficient (R) and root mean square error (RMSE) accuracy tests of the model established with ASTER data for the metallic elements are shown in
Table 4. These elements display R varying from 0.2881 (Mo) to 0.5477 (Zn). Other metallic elements (Au, Cu, As, Hg, and Pb) have R ≈ 0.4 (
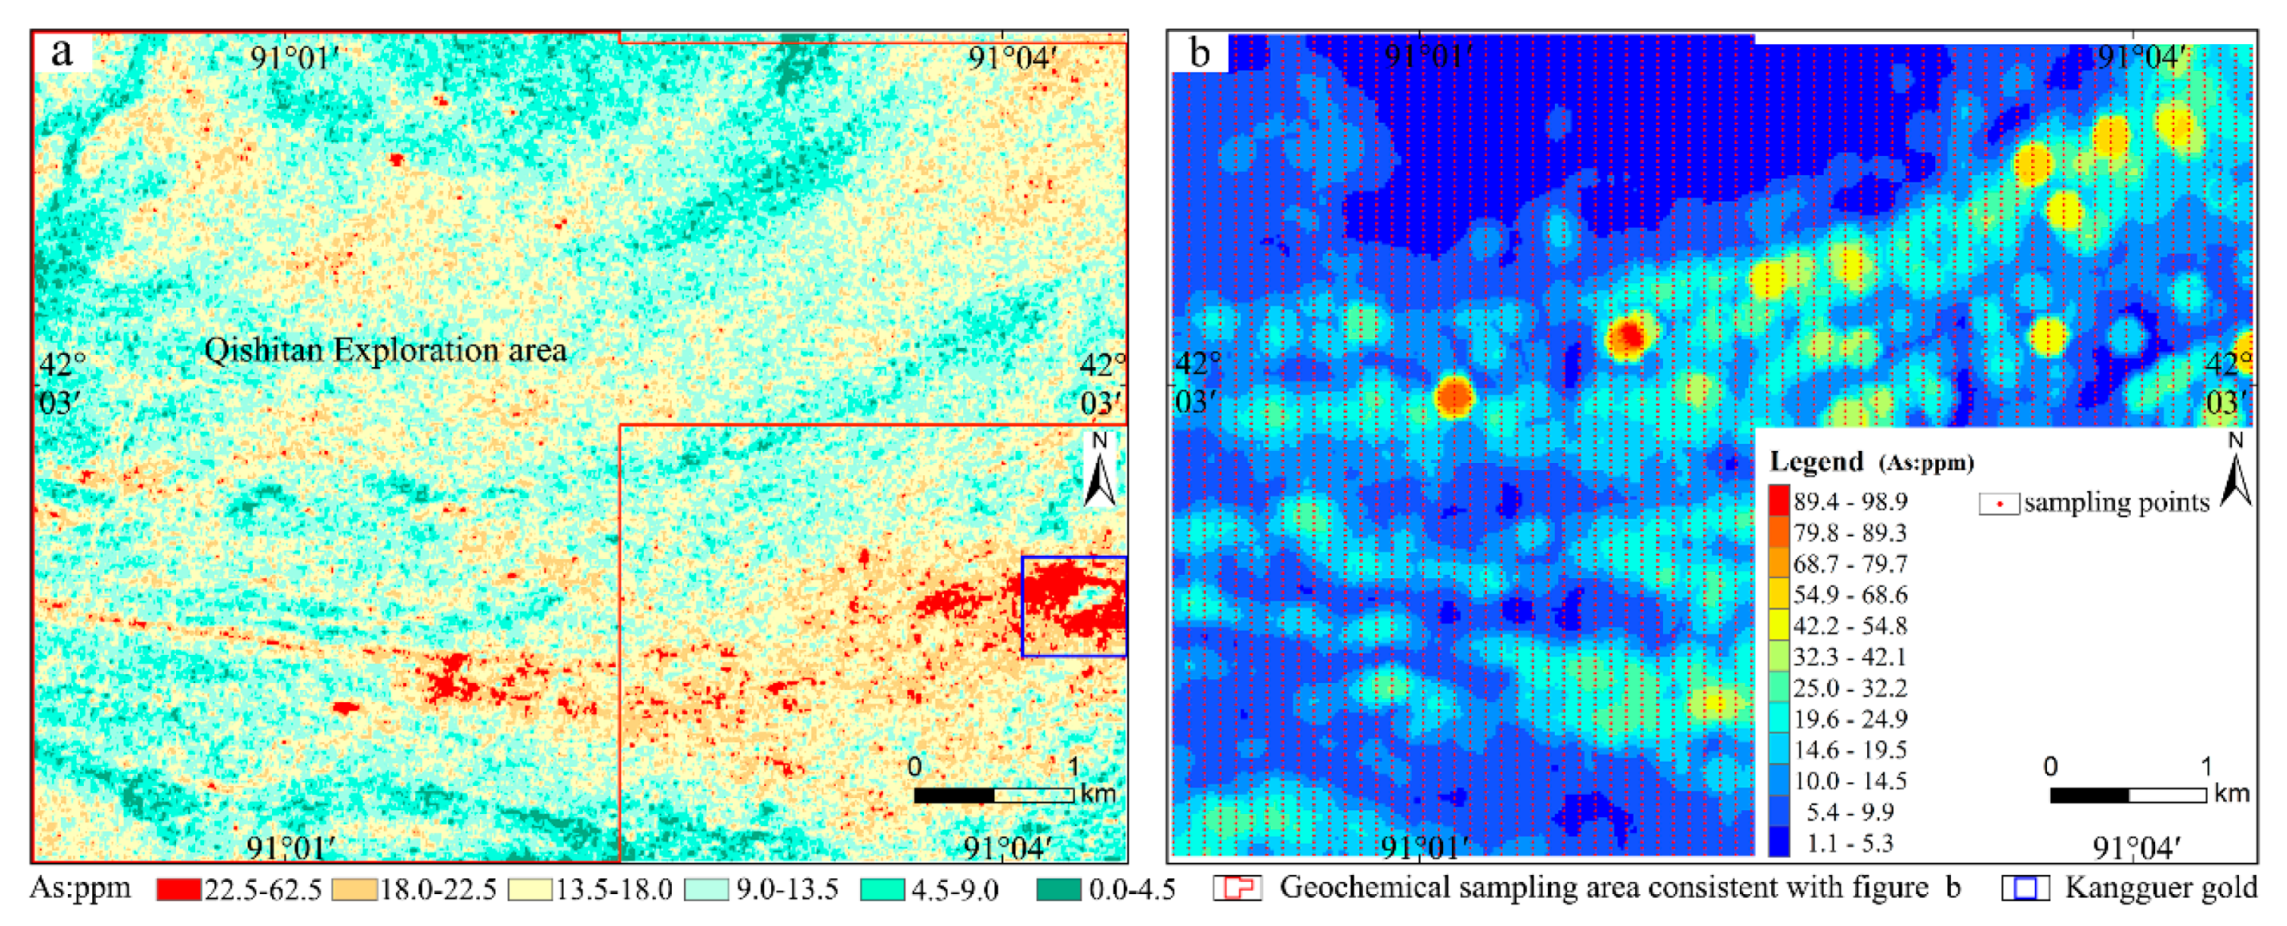
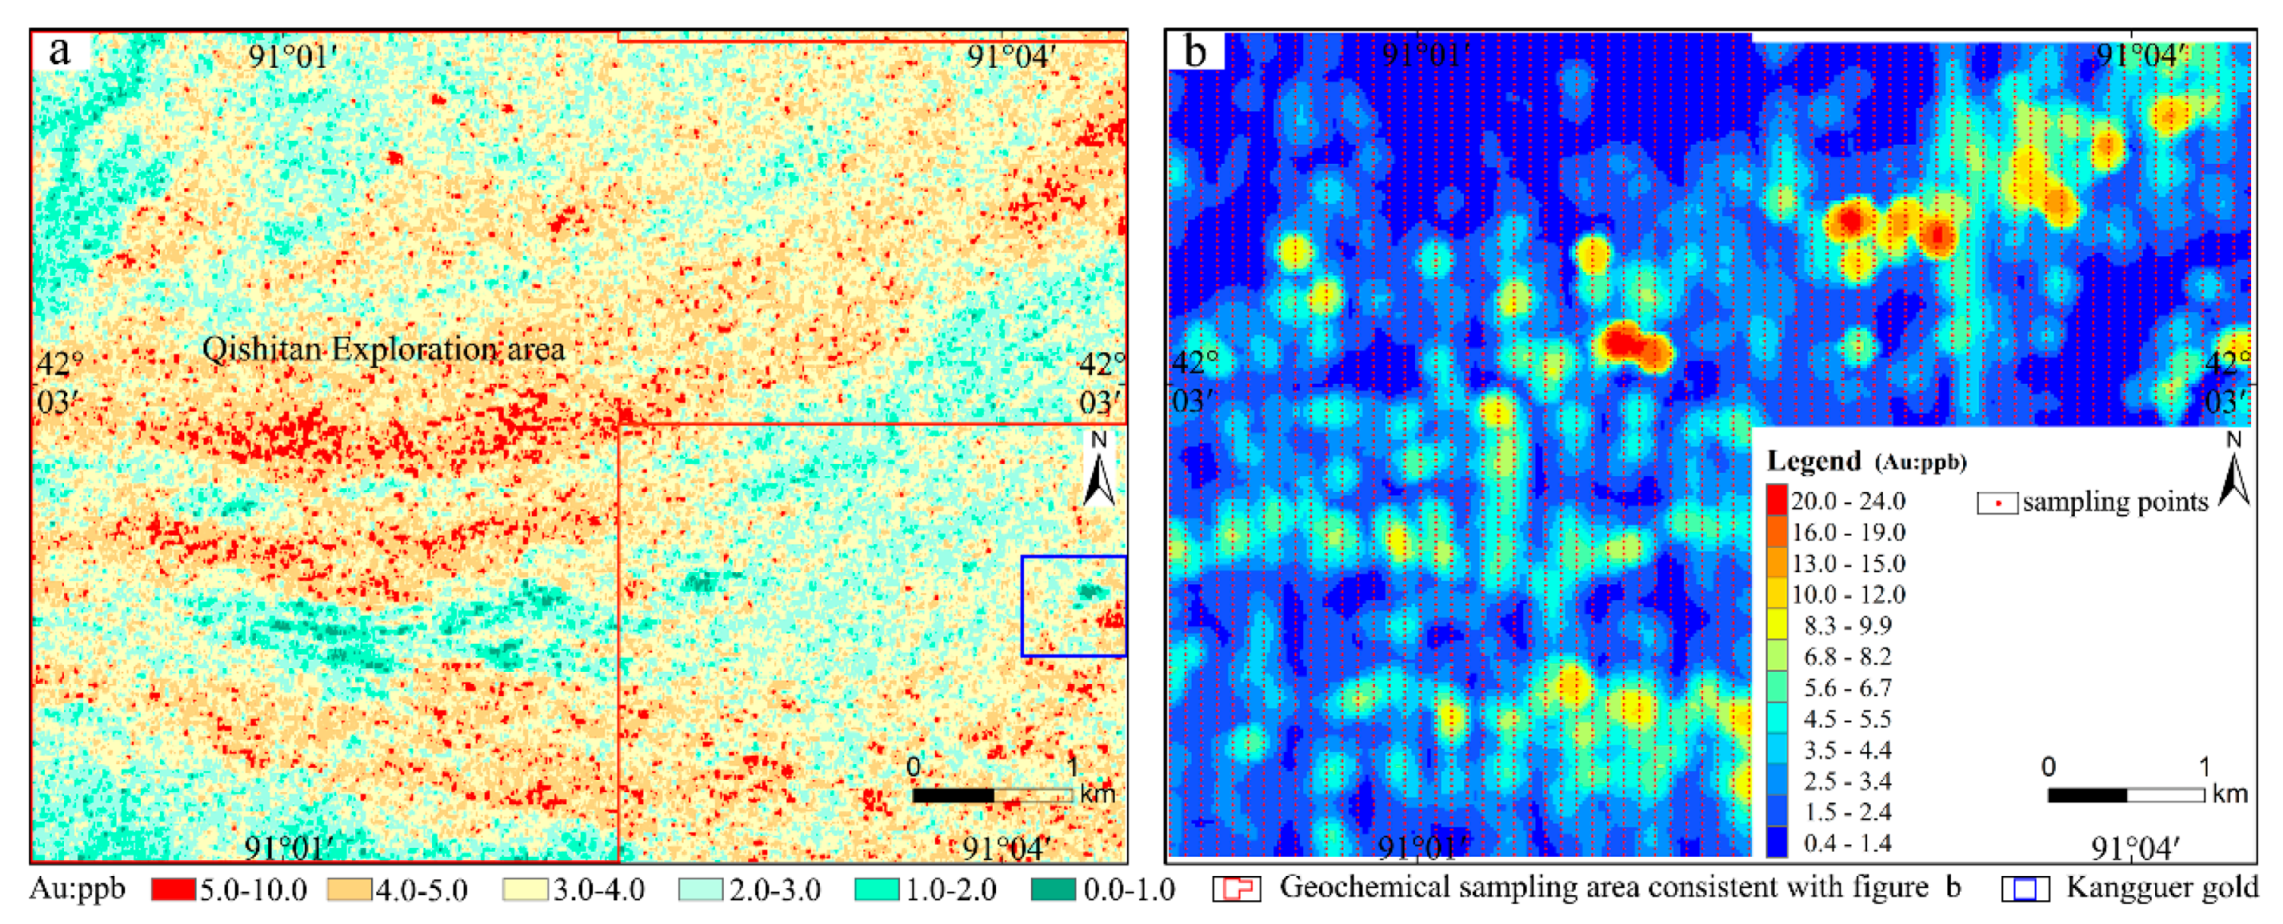
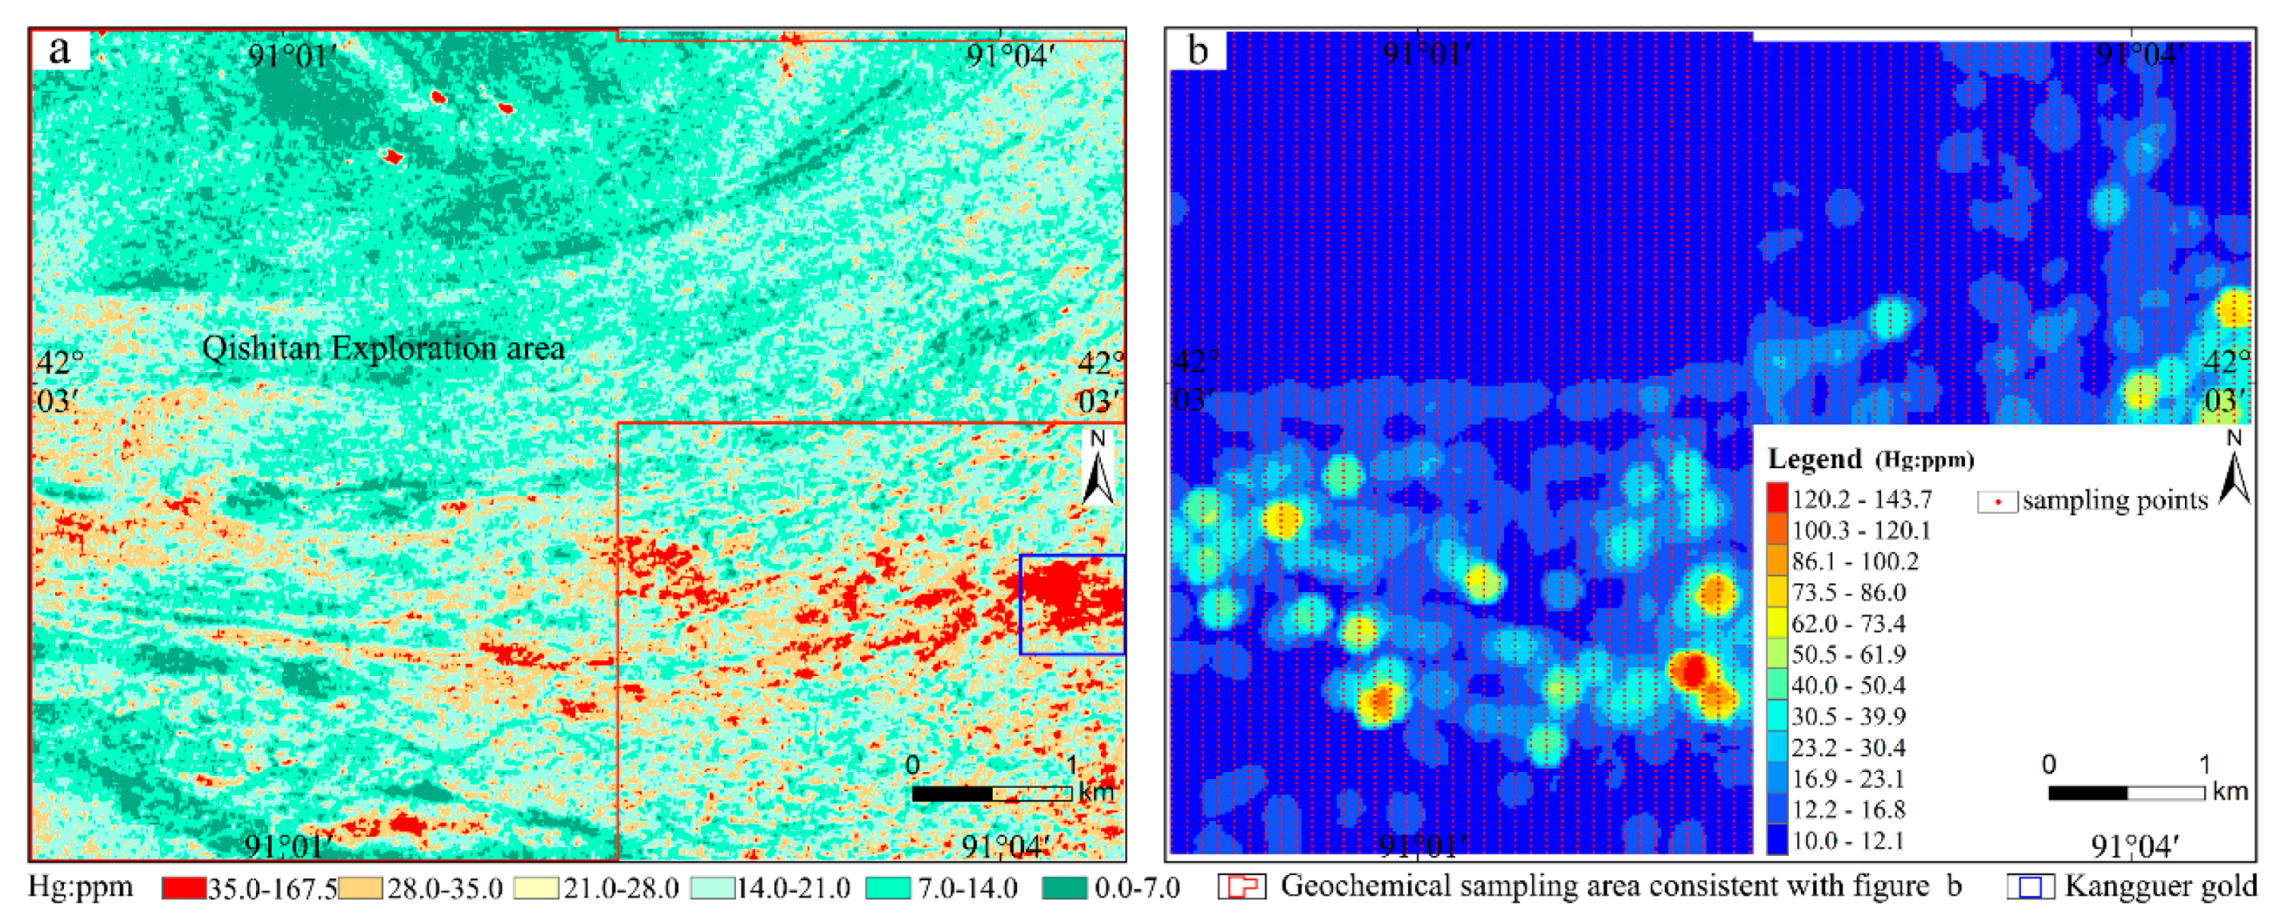
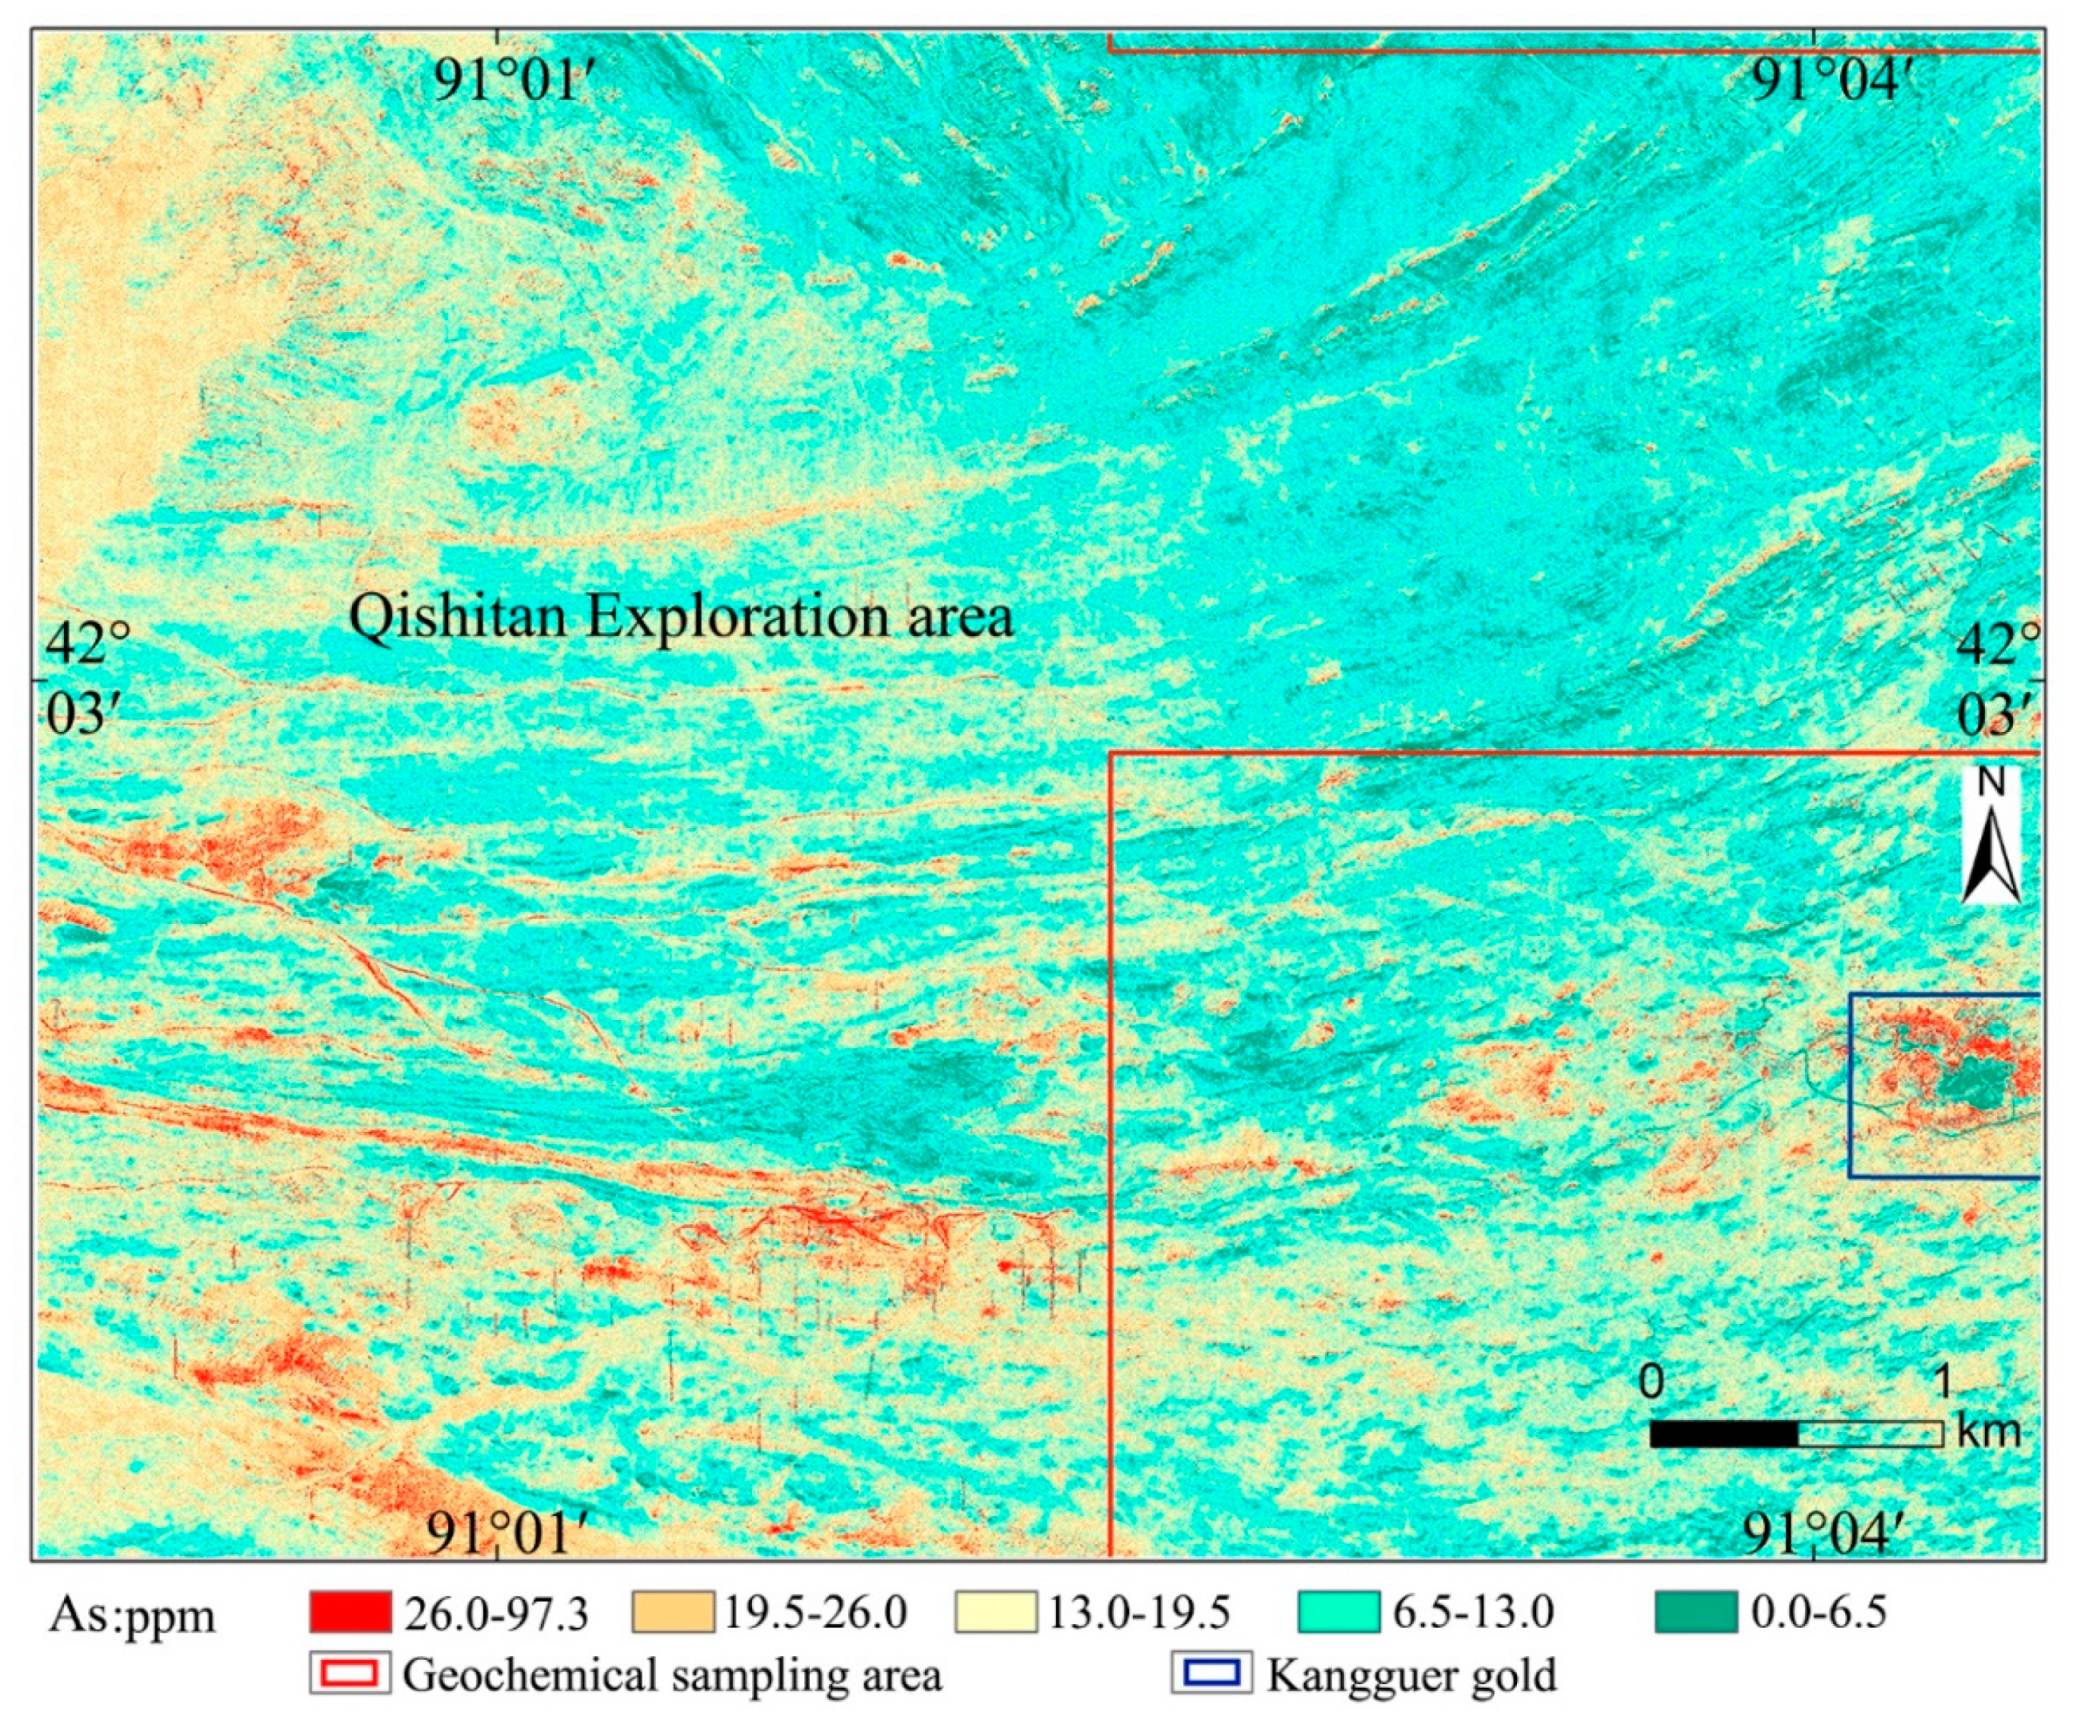
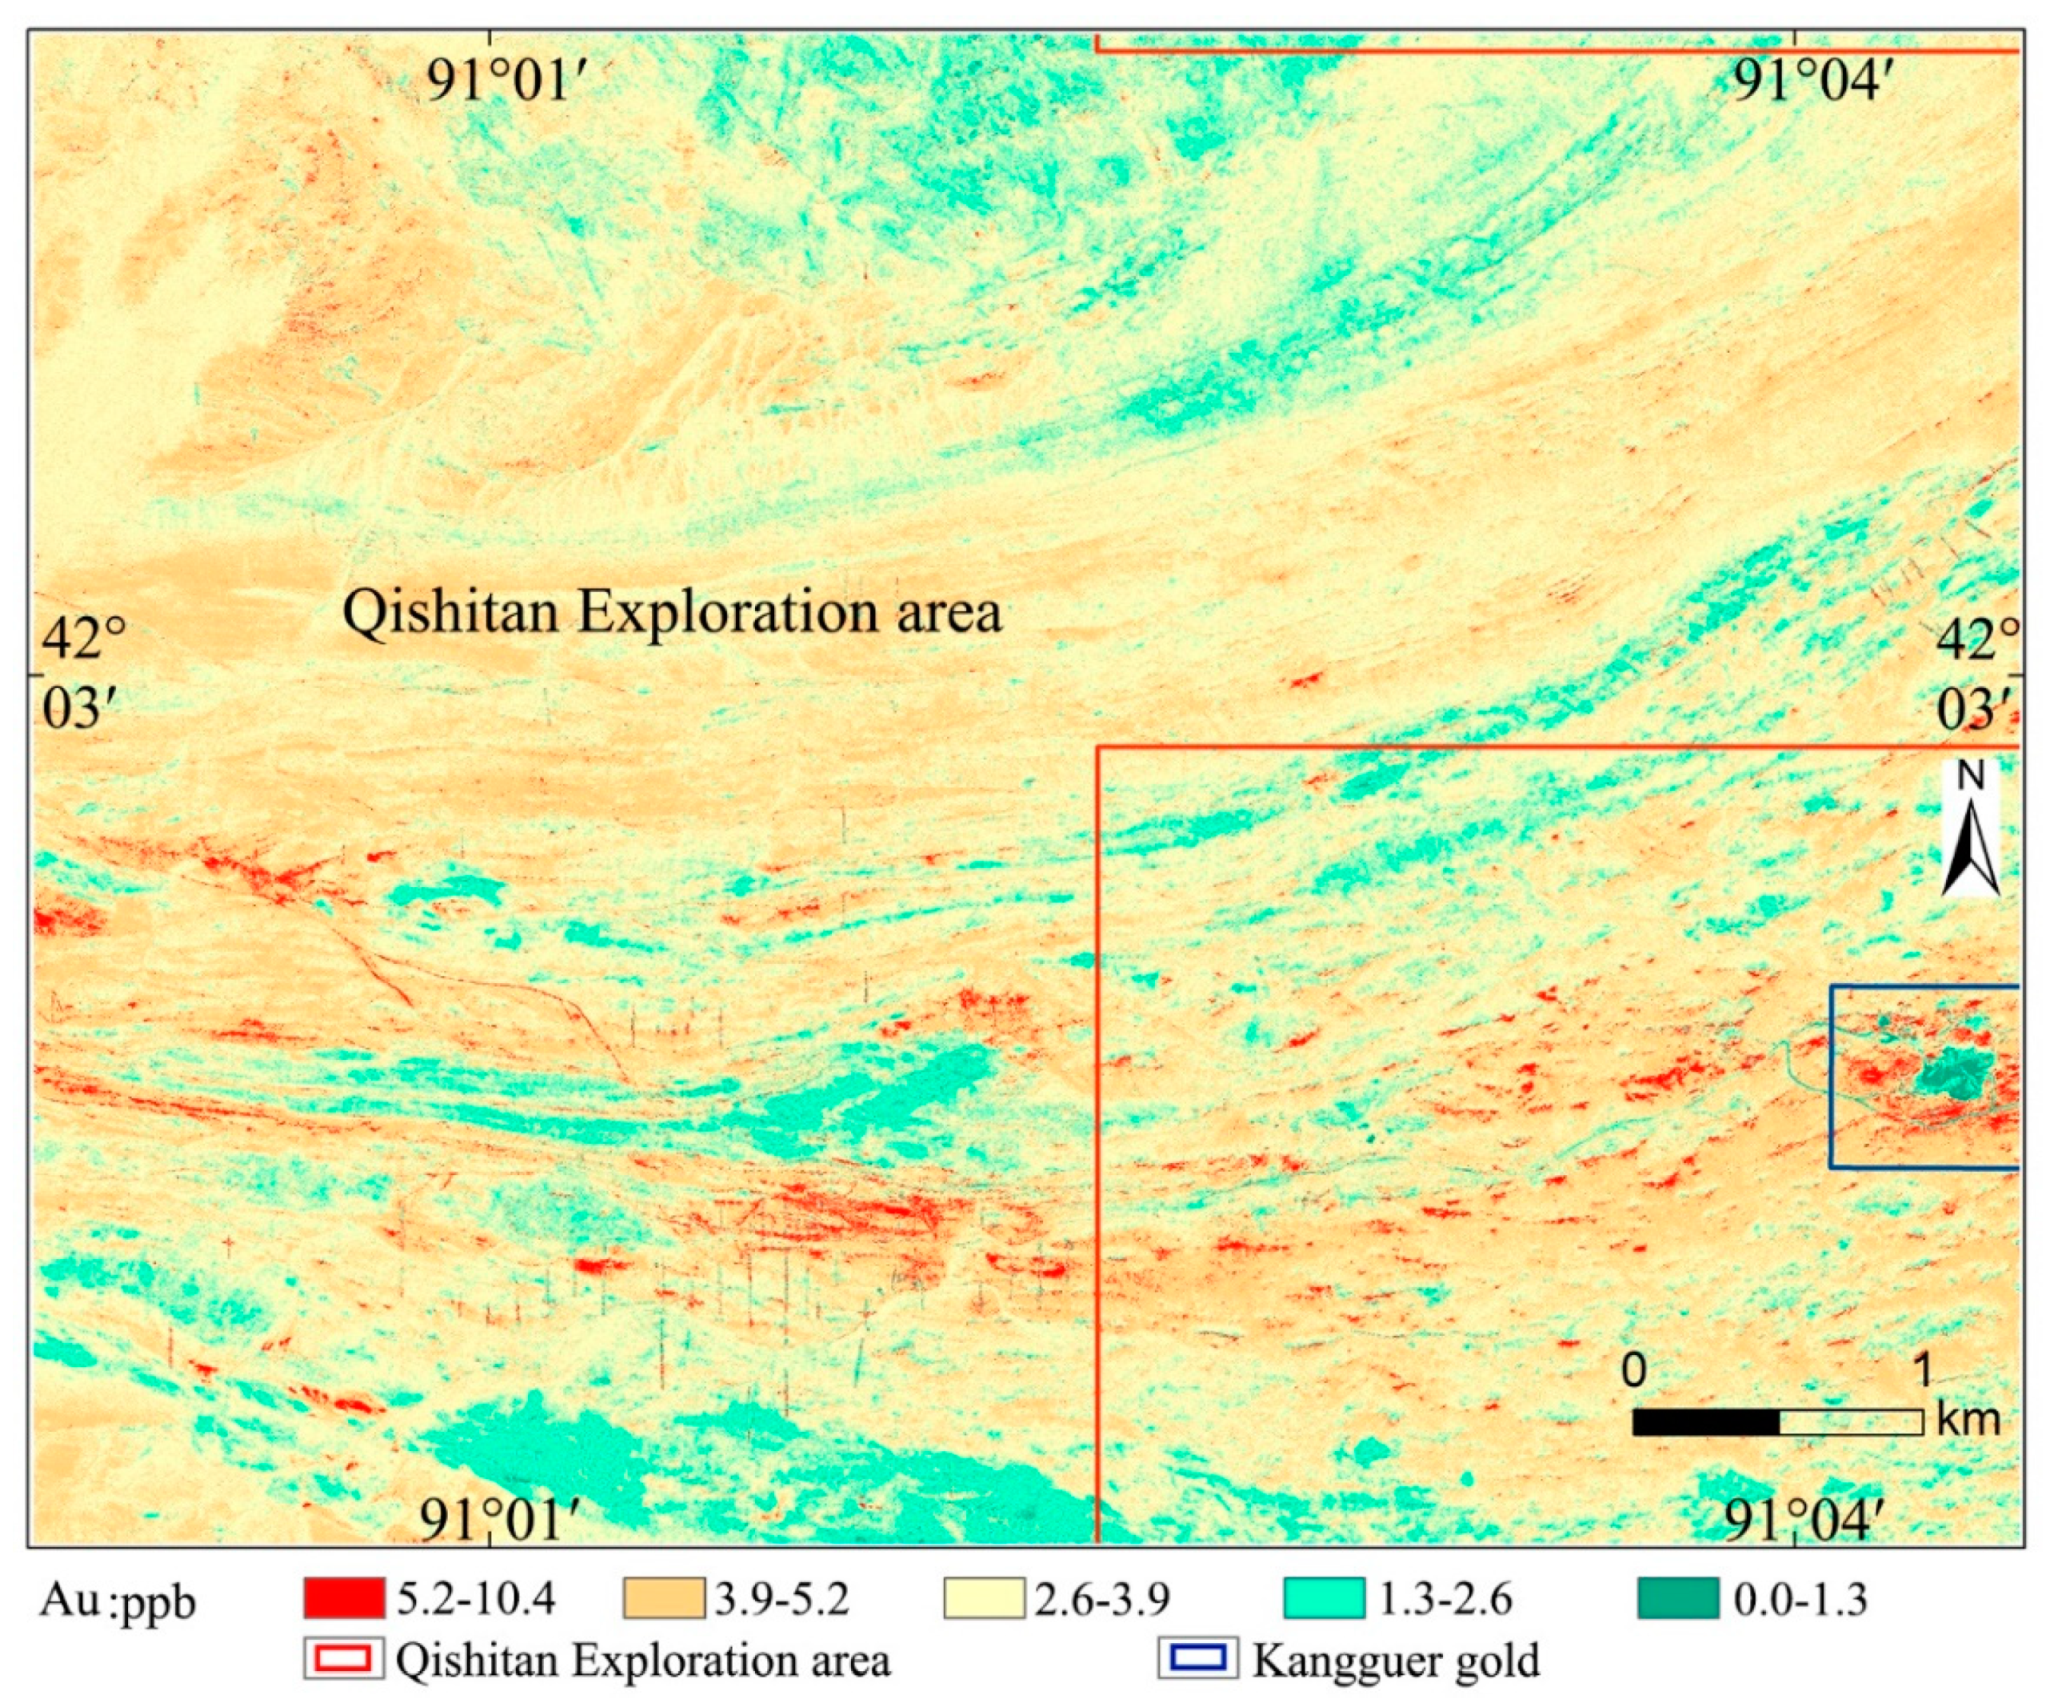
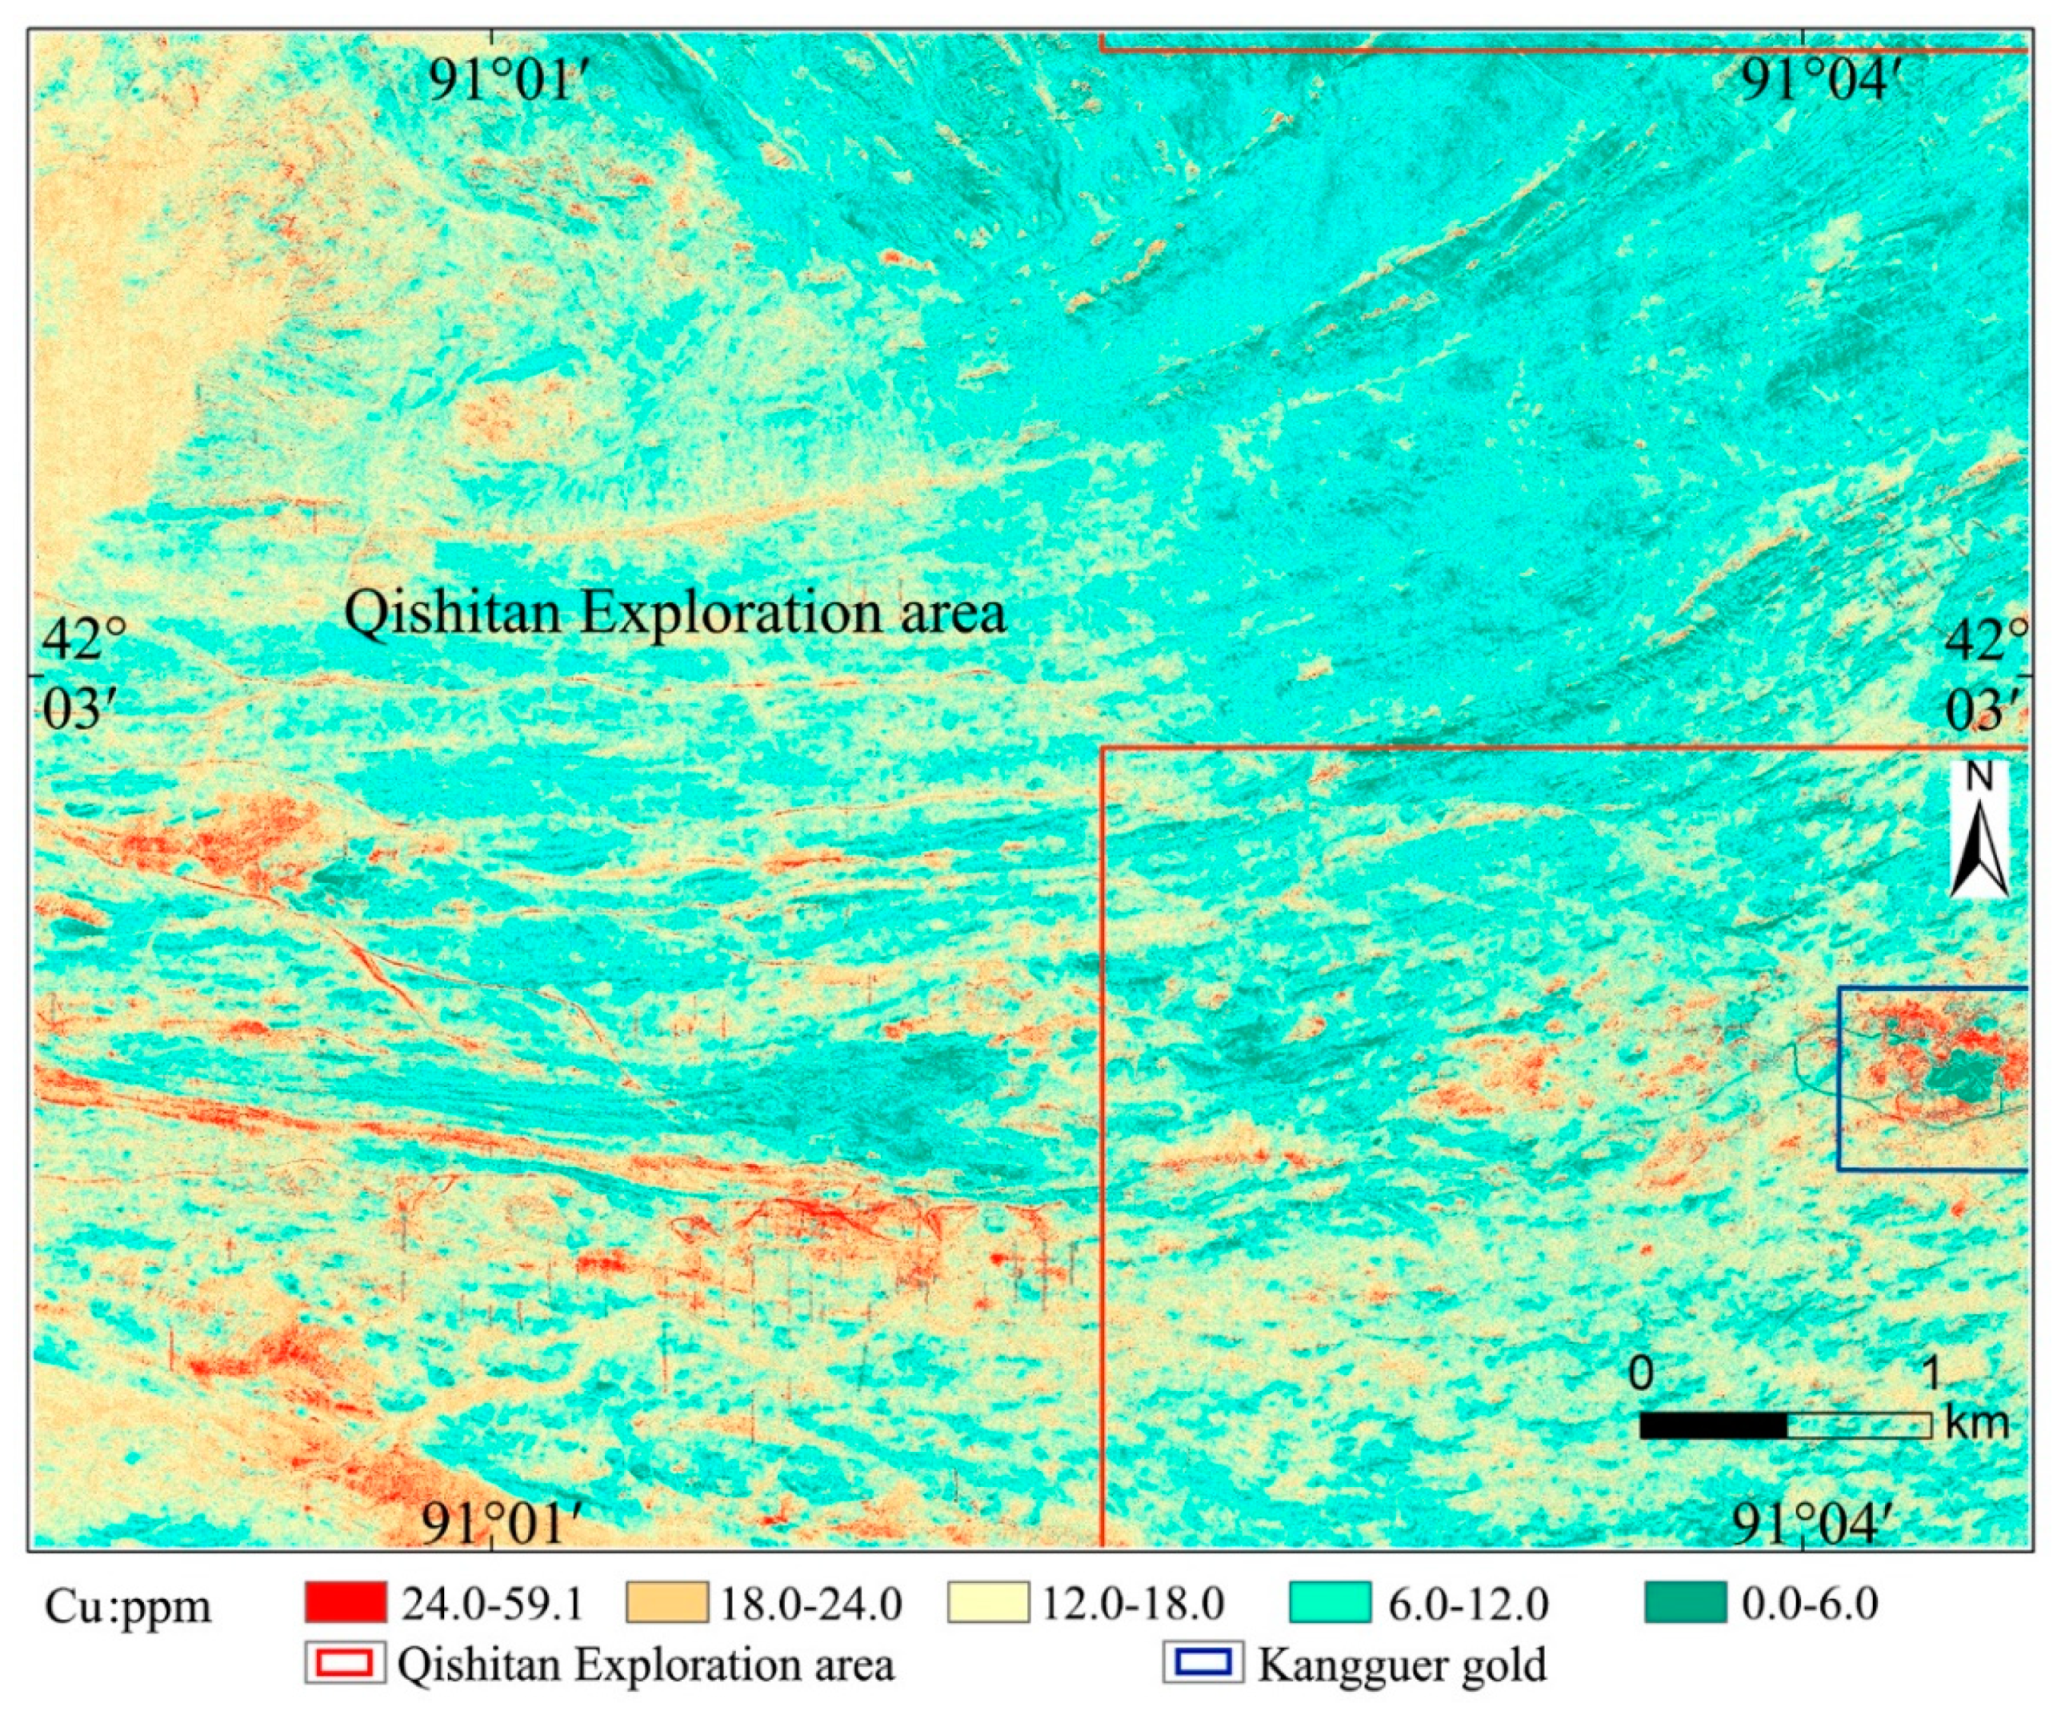
Table 4). In contrast, the analyzed elements show variable RMSE ranging from 3.706 (Au) to 65.9341 (Pb). The RMSE order for these elements is Au < Mo < Zn < As < Cu < Hg < Pb, whereas their R order is Zn > As > Hg > Pb > Cu > Au > Mo. By integrating above results, these elements were classified based on high (Zn, As, and Au), moderate (Hg and Cu), and low (Mo and Pb) accuracy. Thus, seven inversion model maps were drawn using the three accuracy types, and shown in
Figure 3,
Figure 4,
Figure 5,
Figure 6,
Figure 7,
Figure 8 and
Figure 9. It is noteworthy that the ASTER remote sensing images are not strongly correlated with the content of the metallic elements, and the RMSE of these elements is quite variable. Comprehensive analysis of remote sensing data reveals that the pixel resolution of ASTER image is low (30 m), which implies that the surface details cannot be well described. On the other hand, if the content of metallic elements is low at the surface and the surface morphology is complex, the predicted results are certain to be unsatisfactory. Moreover, the accuracy of inversion of the analyzed elements can also be different at the same scale due to the large variation in the content of these elements.
5. Discussion
5.1. Test Method Based on Geochemical Anomaly Contrast
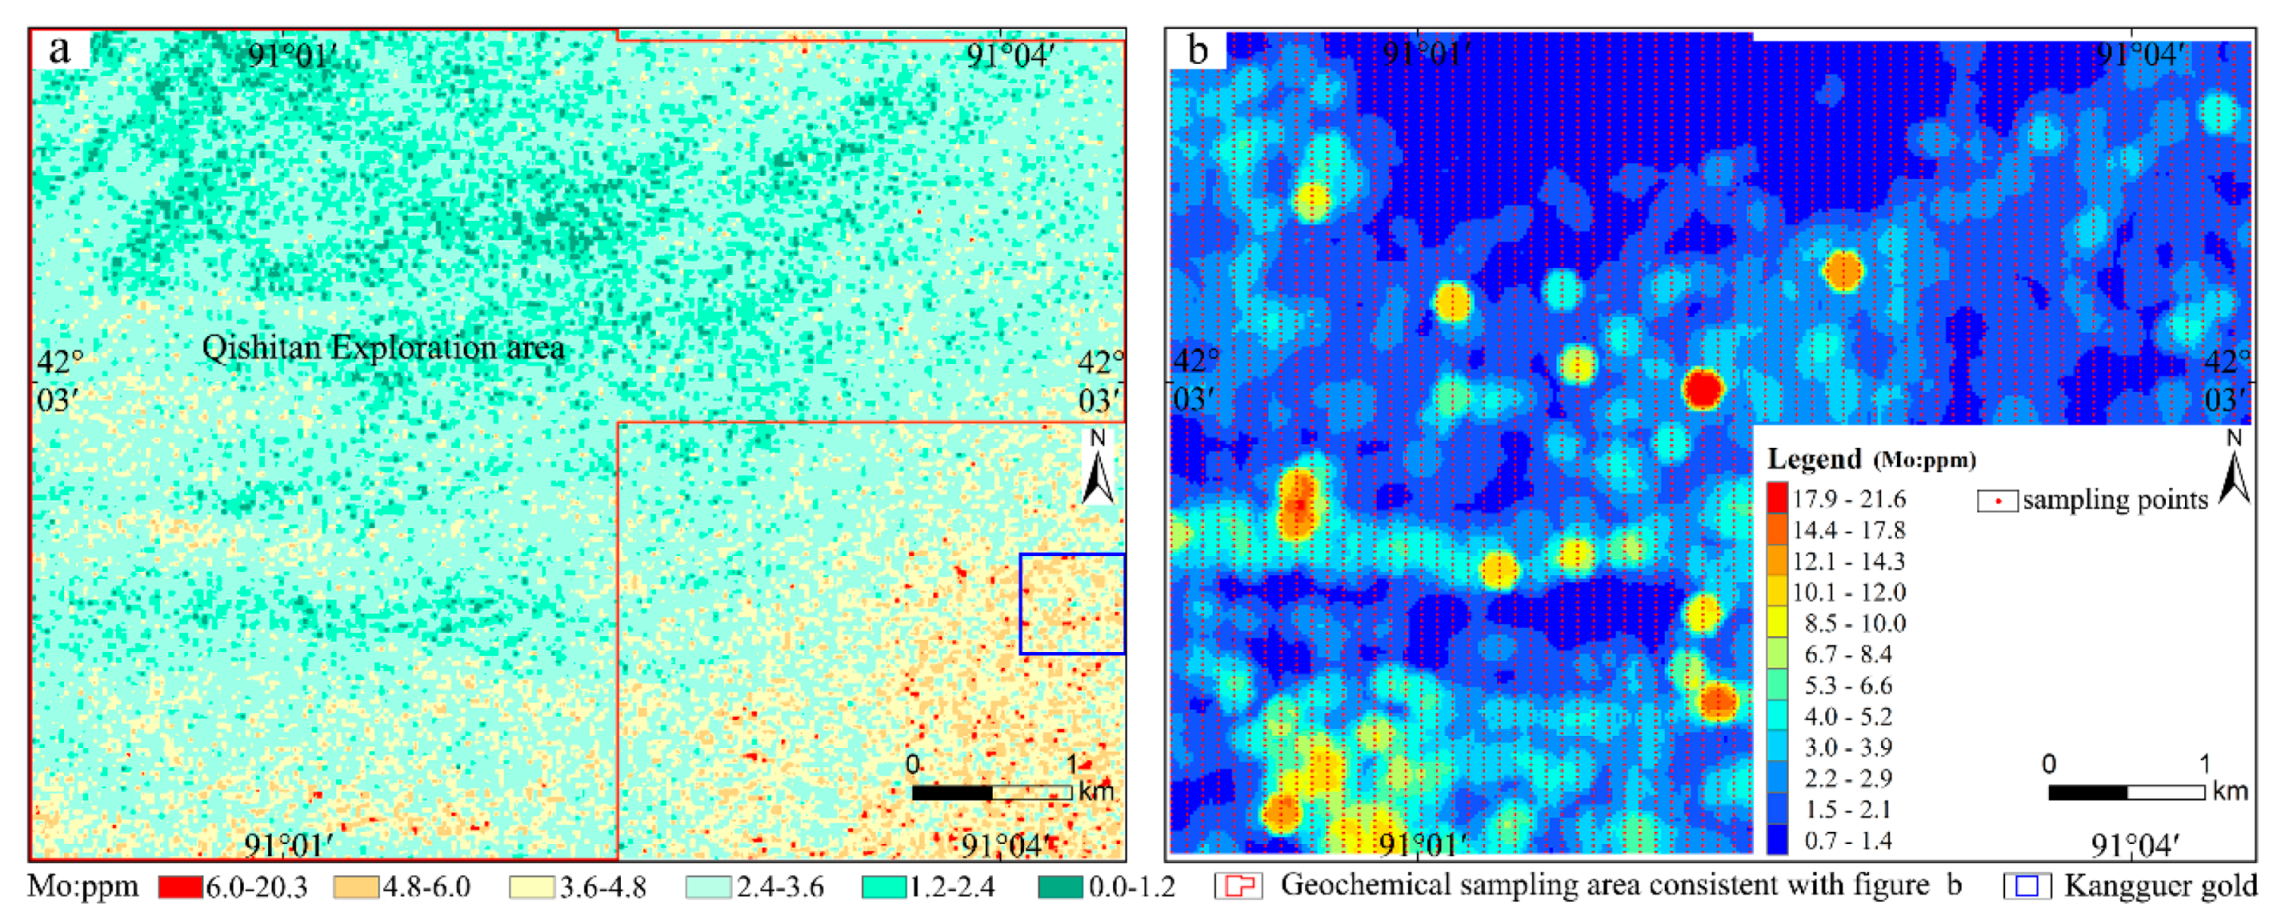
The test of inversion model cannot only depend on the accuracy of the content value for small-scale sampling points. Therefore, this study compares the element inversion map generated by ASTER with the geochemical anomaly map for the corresponding element (
Figure 3,
Figure 4,
Figure 5,
Figure 6,
Figure 7,
Figure 8 and
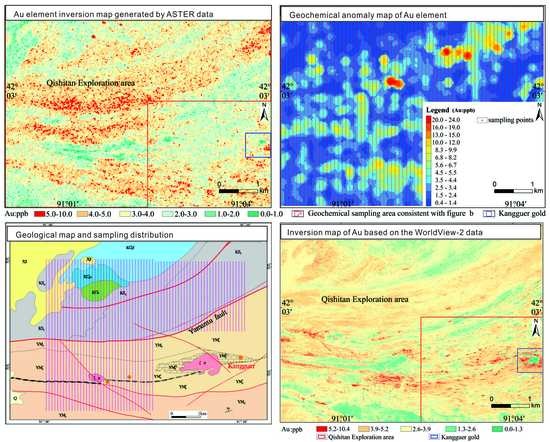
Figure 9). This is helpful to analyze the accuracy of the modeling results in terms of the number of anomalies, the location of the anomaly center, the size of the anomaly range, and the shape of the anomaly center. On the Au inversion and geochemical maps (
Figure 4), the high anomalies are mostly located from the northeast to the central part of the Qishitan mining area. Similarly, Au anomalies are found in the Kangguer gold deposit map (
Figure 4a). Due to the low resolution of ASTER data, the inversion anomaly is not obvious in the central part of the studied area. The southern part of the studied area also displays medium Au anomalies, which are consistent with the linear Au anomaly in the geochemical anomaly map. On the Pb inversion and geochemical maps (
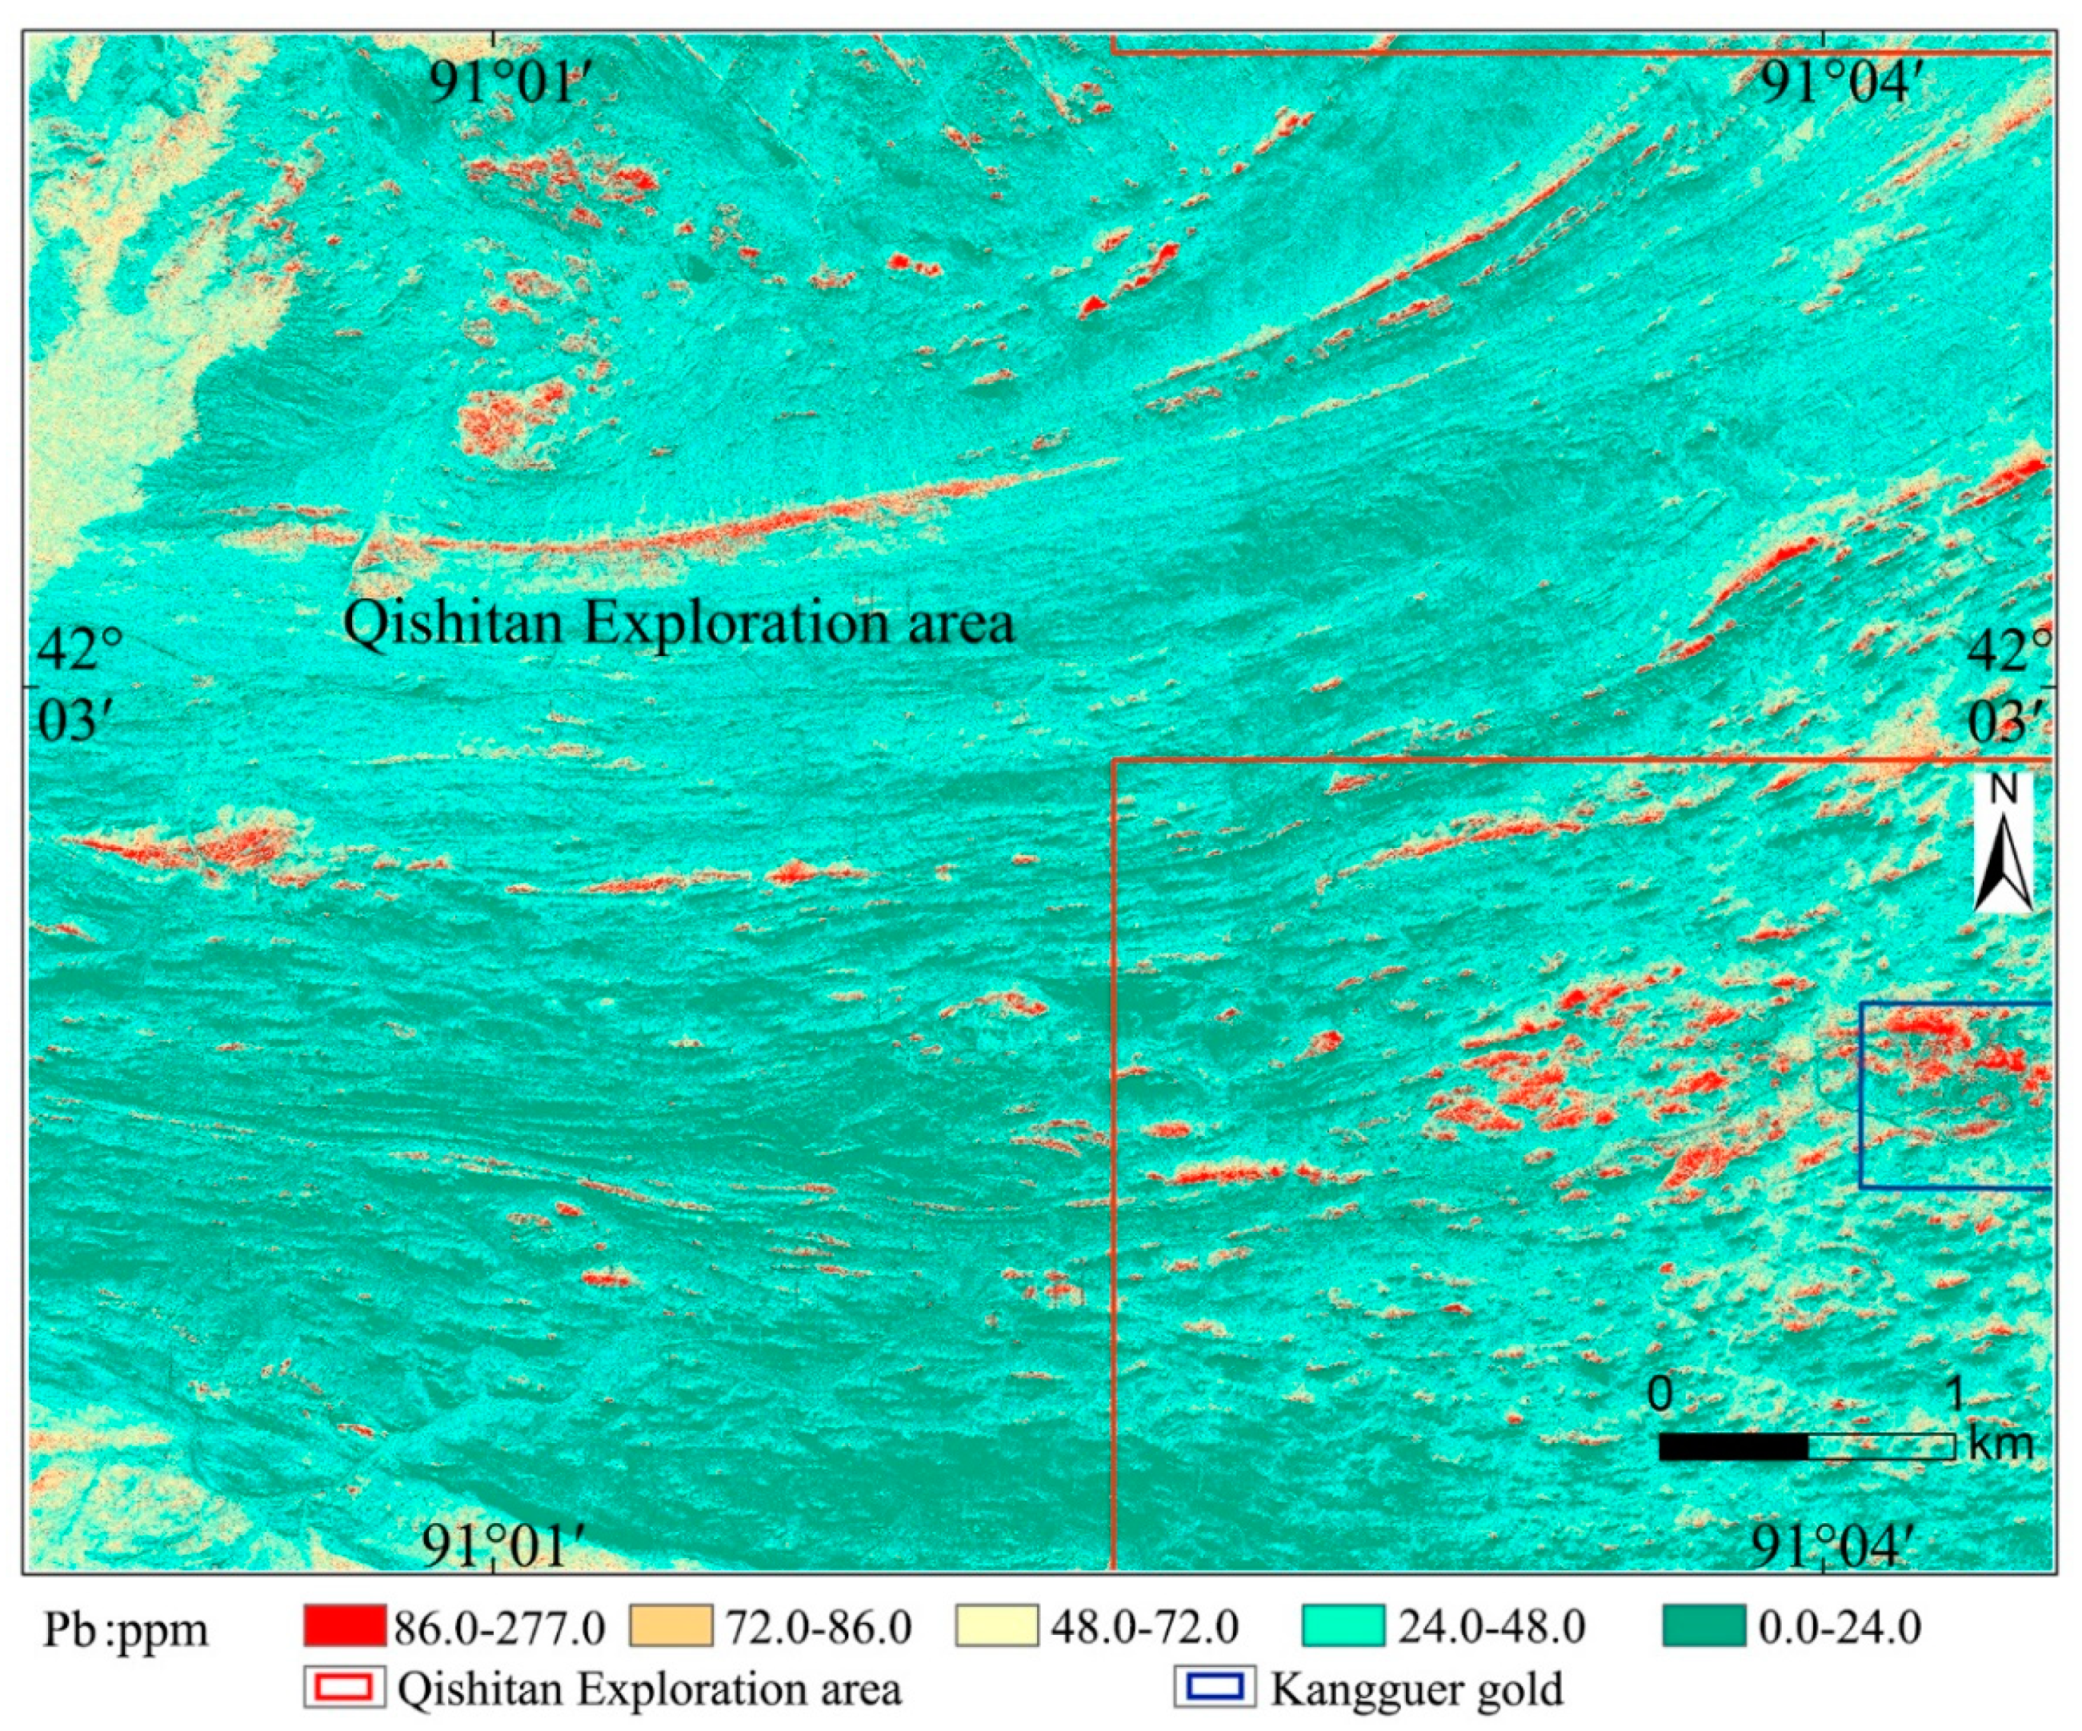
Figure 8), there are six aggregation points with high anomalies (150–510 ppm), which are located in the southwest part of the mining area. The shape of abnormal aggregation was round and elliptic. The anomalous location is mainly concentrated in the southwest and the northwest corner of the study area. The geochemical anomaly map shows that there are 5 anomalies with Pb element values above 150 ppm, which are mainly located in the southwest of the study area, and the shape is mainly circular and stripy. The inversion results are consistent with geochemical anomalies, so the ASTER data obtained from remote sensing inversion modeling has high accuracy on the macro level.
5.2. The Modeling Precision Is Improved by Scaling Transformation
For the purpose of this study, the ground sampling density will always be limited [
39]; ground geochemical sampling data are point data in a small range, and each sampling point is about 20 × 20 cm
2. Samples were taken at 100 m × 40 m intervals. However, remote sensing data can be considered similar to surface data with continuous surface characteristics compared with ground sampling points. If ground sampling point data is simply used to represent the surface data of remote sensing image, large errors can be caused [
40]. Hence, this results in low accuracy prediction of the established model. According to
Table 4, compared with other elements, the inversion model of Cu content established based on ASTER image has moderate accuracy. In the southwest of the study area, high Cu anomaly is noticeable. The Cu content and anomaly are used to verify whether the scale conversion is effective or not and has a good expression effect. Thus, this paper takes Cu as an example for further discussion based on the scale inconsistency.
5.2.1. The Experimental Idea and Process of Scaling Transformation
ASTER data has a resolution image of 15 m, while the sampling point spacing is 100 m × 40 m. In practice, the effective range represented by geochemical sampling sites is uncertain. Therefore, the resolution can be constantly scaled down to match the unknown range in order to make the pixel range match with the effective range represented by the point and improve the predicted accuracy of the inversion model [
40,
41]. Specific operations are as follows: 6 square sizes of 15 × 15 m
2, 30 × 30 m
2, 45 × 45 m
2, 60 × 60 m
2, 75 ×75 m
2, and 90 × 90 m
2 were set between 15 and 100 m. After increasing the scale through pixel re-sampling method, then interpolating 2741 geochemical sampling points in the region, we combined both steps to perform remote sensing inversion and record the inversion results.
5.2.2. Modeling Results of Scaling Transformation and Inversion
The total number of original sampling sites is 2774. After successive interpolation of 15 × 15 m
2, 30 × 30 m
2, 45 × 45 m
2, 60 × 60 m
2, 75 × 75 m
2, and 90 × 90 m
2 sizes, a total of 47,424, 11,808, 5248, 2976, 1911, and 1312 new sampling points and its coordinates were obtained. Then, the original 2741 samples without interpolation were compared with these six groups of data and there were three groups for testing. Since the sample size of each group was large, 100 samples were randomly selected from each group of data. Then, 75 samples out of 100 were selected as modeling sample points and 25 samples were used as test sample points in a ratio of 3:1. It can be seen from the results in
Table 5 that the inversion model after scale transformation has high accuracy compared to that of the direct inversion modeling with the original geochemical exploration data. Compared with
Table 4, the RMSE of Cu element modeling is relatively high at the initial pixel scale of the original geochemical sampling point. The average RMSE of the original modeling sample point in the three testing groups is 17.4291, and the average RMSE of the verified modeling sample point is 11.1796. When the square size expands from the initial size of the pixel to the size of the sampling interval, the RMSE and the standard estimation error gradually decrease and then increase. In the scaling process, the RMSE modeled within the square size range of 45–60 m is the smallest, and the R
2 coefficient and R
2 adjusted are the largest, indicating that the model precision is high. When the 60 m2 size is exceeded, the RMSE of the model increases, whereas the R
2 coefficient and R
2 adjusted decrease. Among the 7 scale modeling methods, the interpolation results are the best and the accuracy is highly improved. Compared with the models obtained without scale transformation, both modeling accuracy and predicted accuracy are significantly improved.
5.3. Research on Downscaling Transformation
5.3.1. Downscaling Study Based on Worldview-2 Data
Compared with ASTER data, WorldView-2 data has a higher image resolution, more standard bands, and smaller corresponding scales. This can provide accurate change detection and mapping. Therefore, this study uses the WorldView-2 and ASTER data for comparison to explore the effect of downscaling on modeling accuracy. Y
Au, Y
Cu, Y
Pb, Y
Zn, Y
Mo, Y
As, Y
Hg are the predicted content values of Au, Cu, Pb, Zn, Mo, As, and Hg. The inversion model for the band operation of the WorldView-2 data is shown as follows (
Table 6).
5.3.2. Inverse Modeling Results
After color segmentation and median filtering, the fast inversion results of each metallic element from the studied area were obtained. In the inversion maps of metallic elements (
Figure 3,
Figure 4,
Figure 5,
Figure 6,
Figure 7,
Figure 8 and
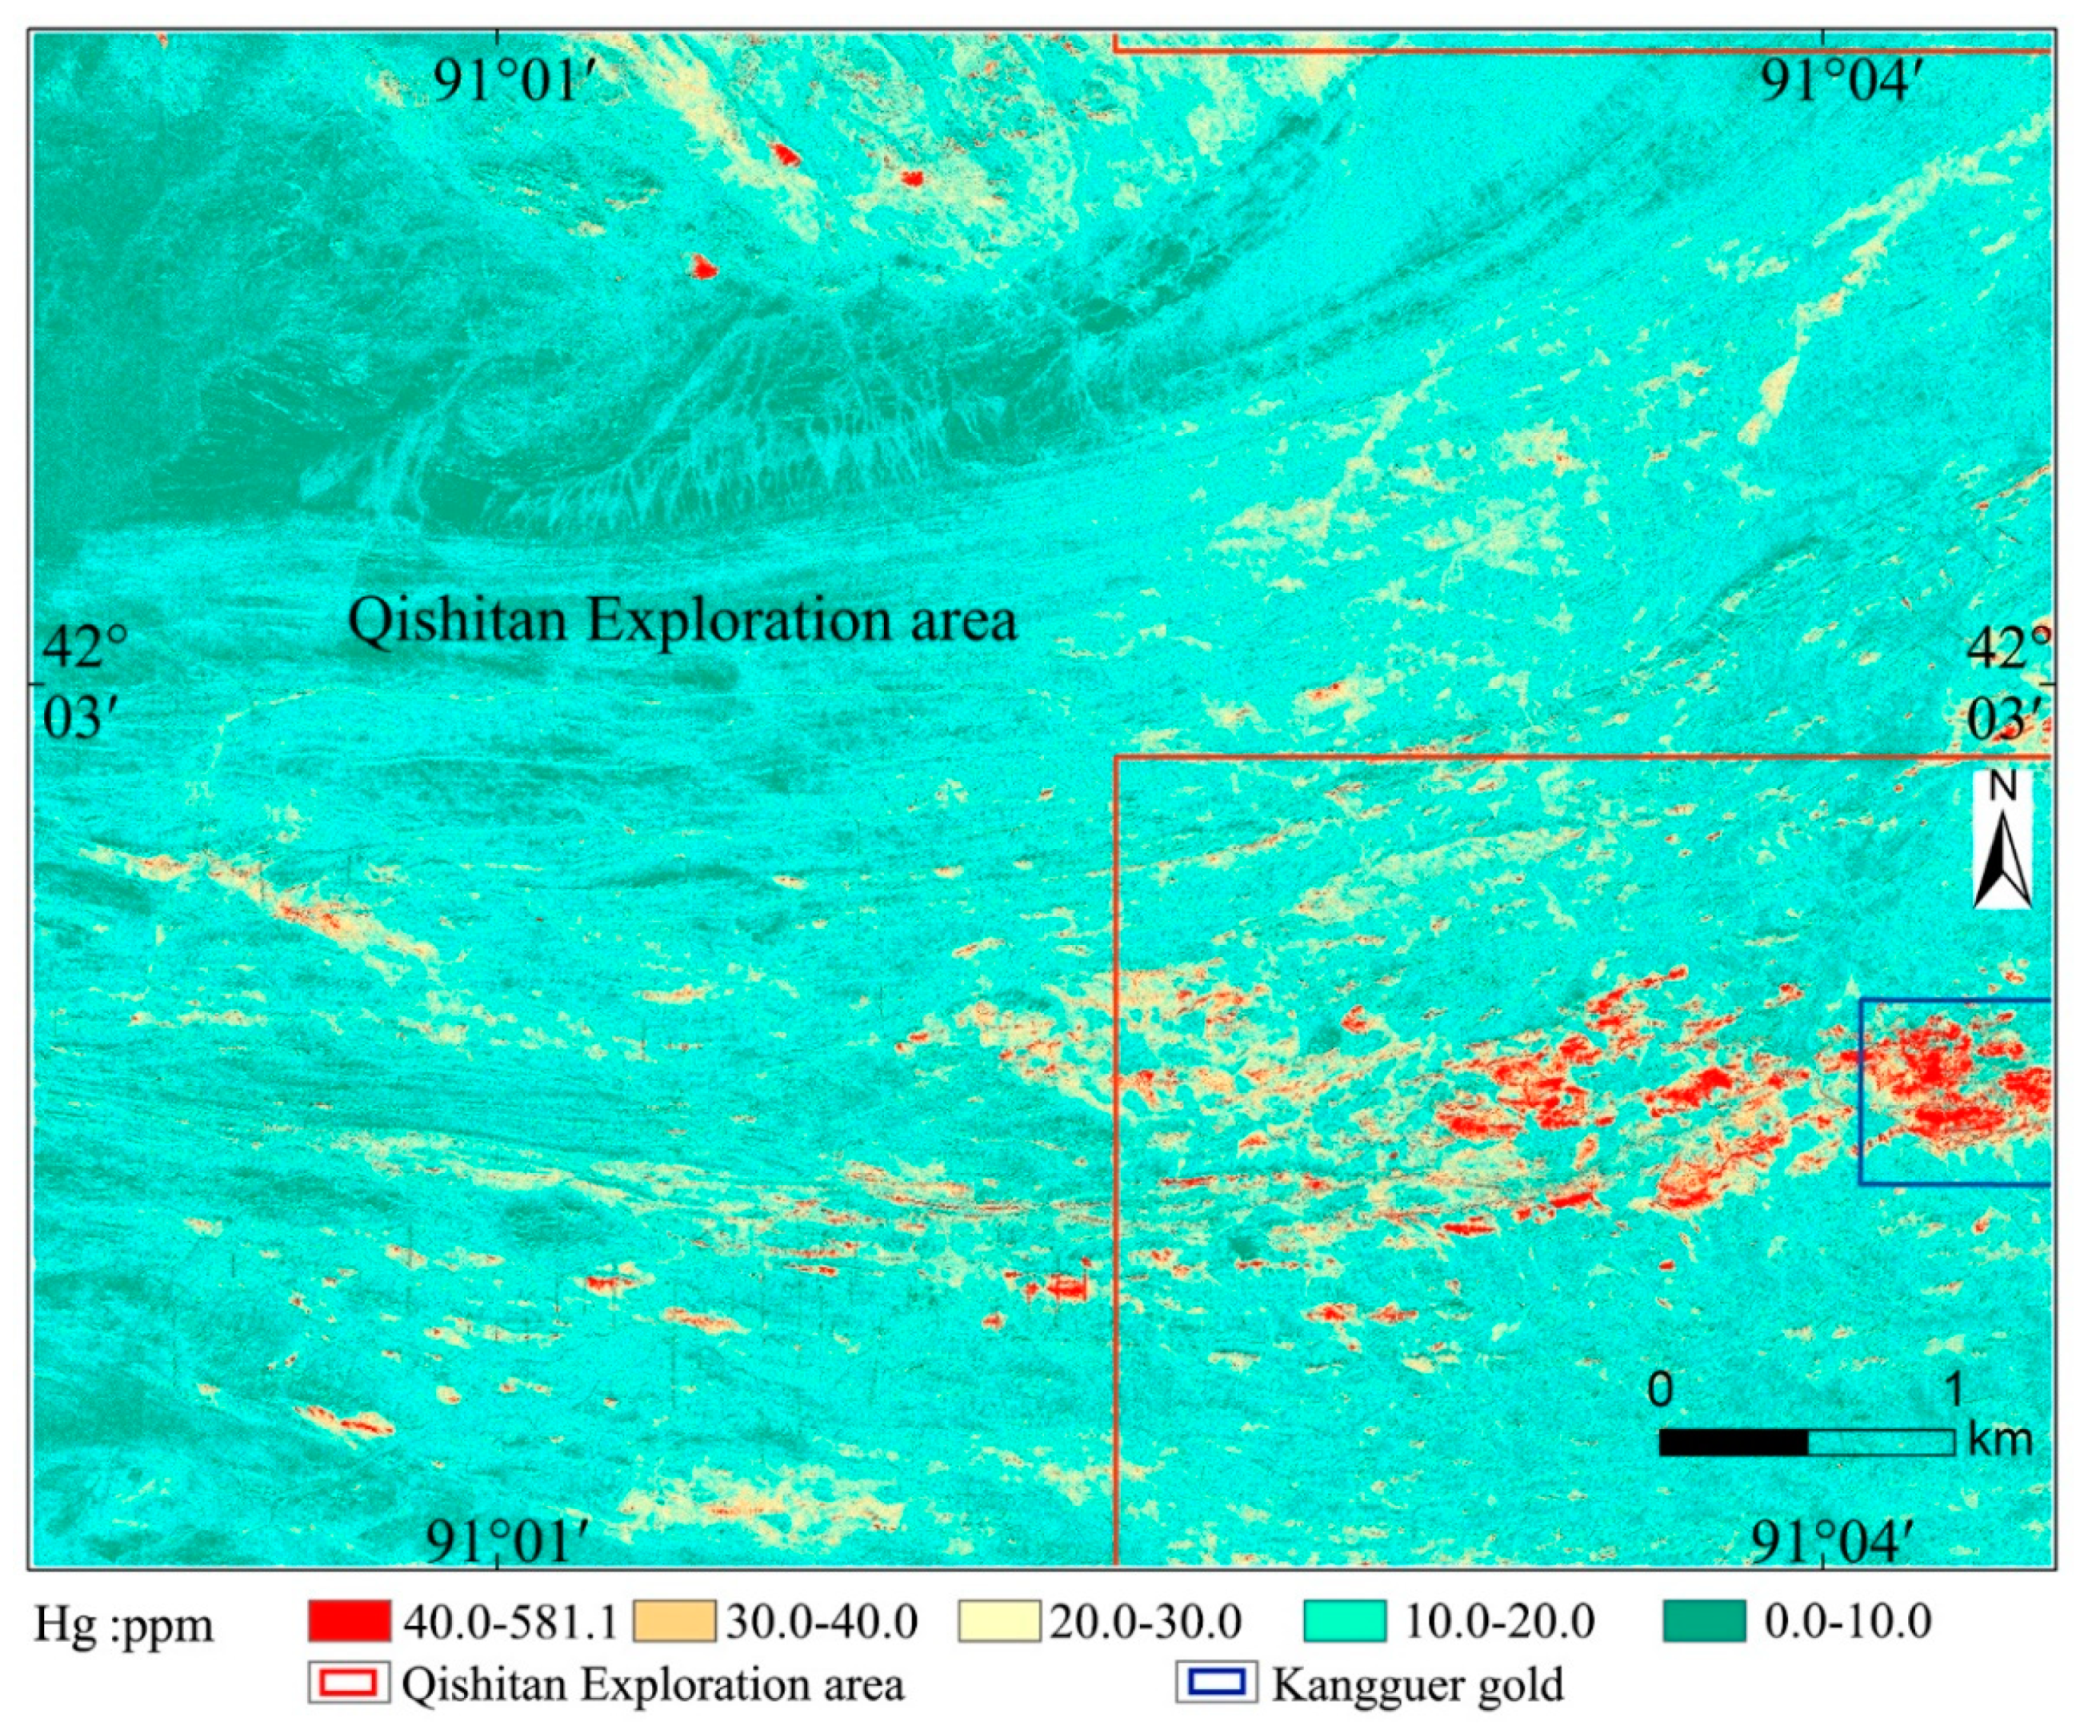
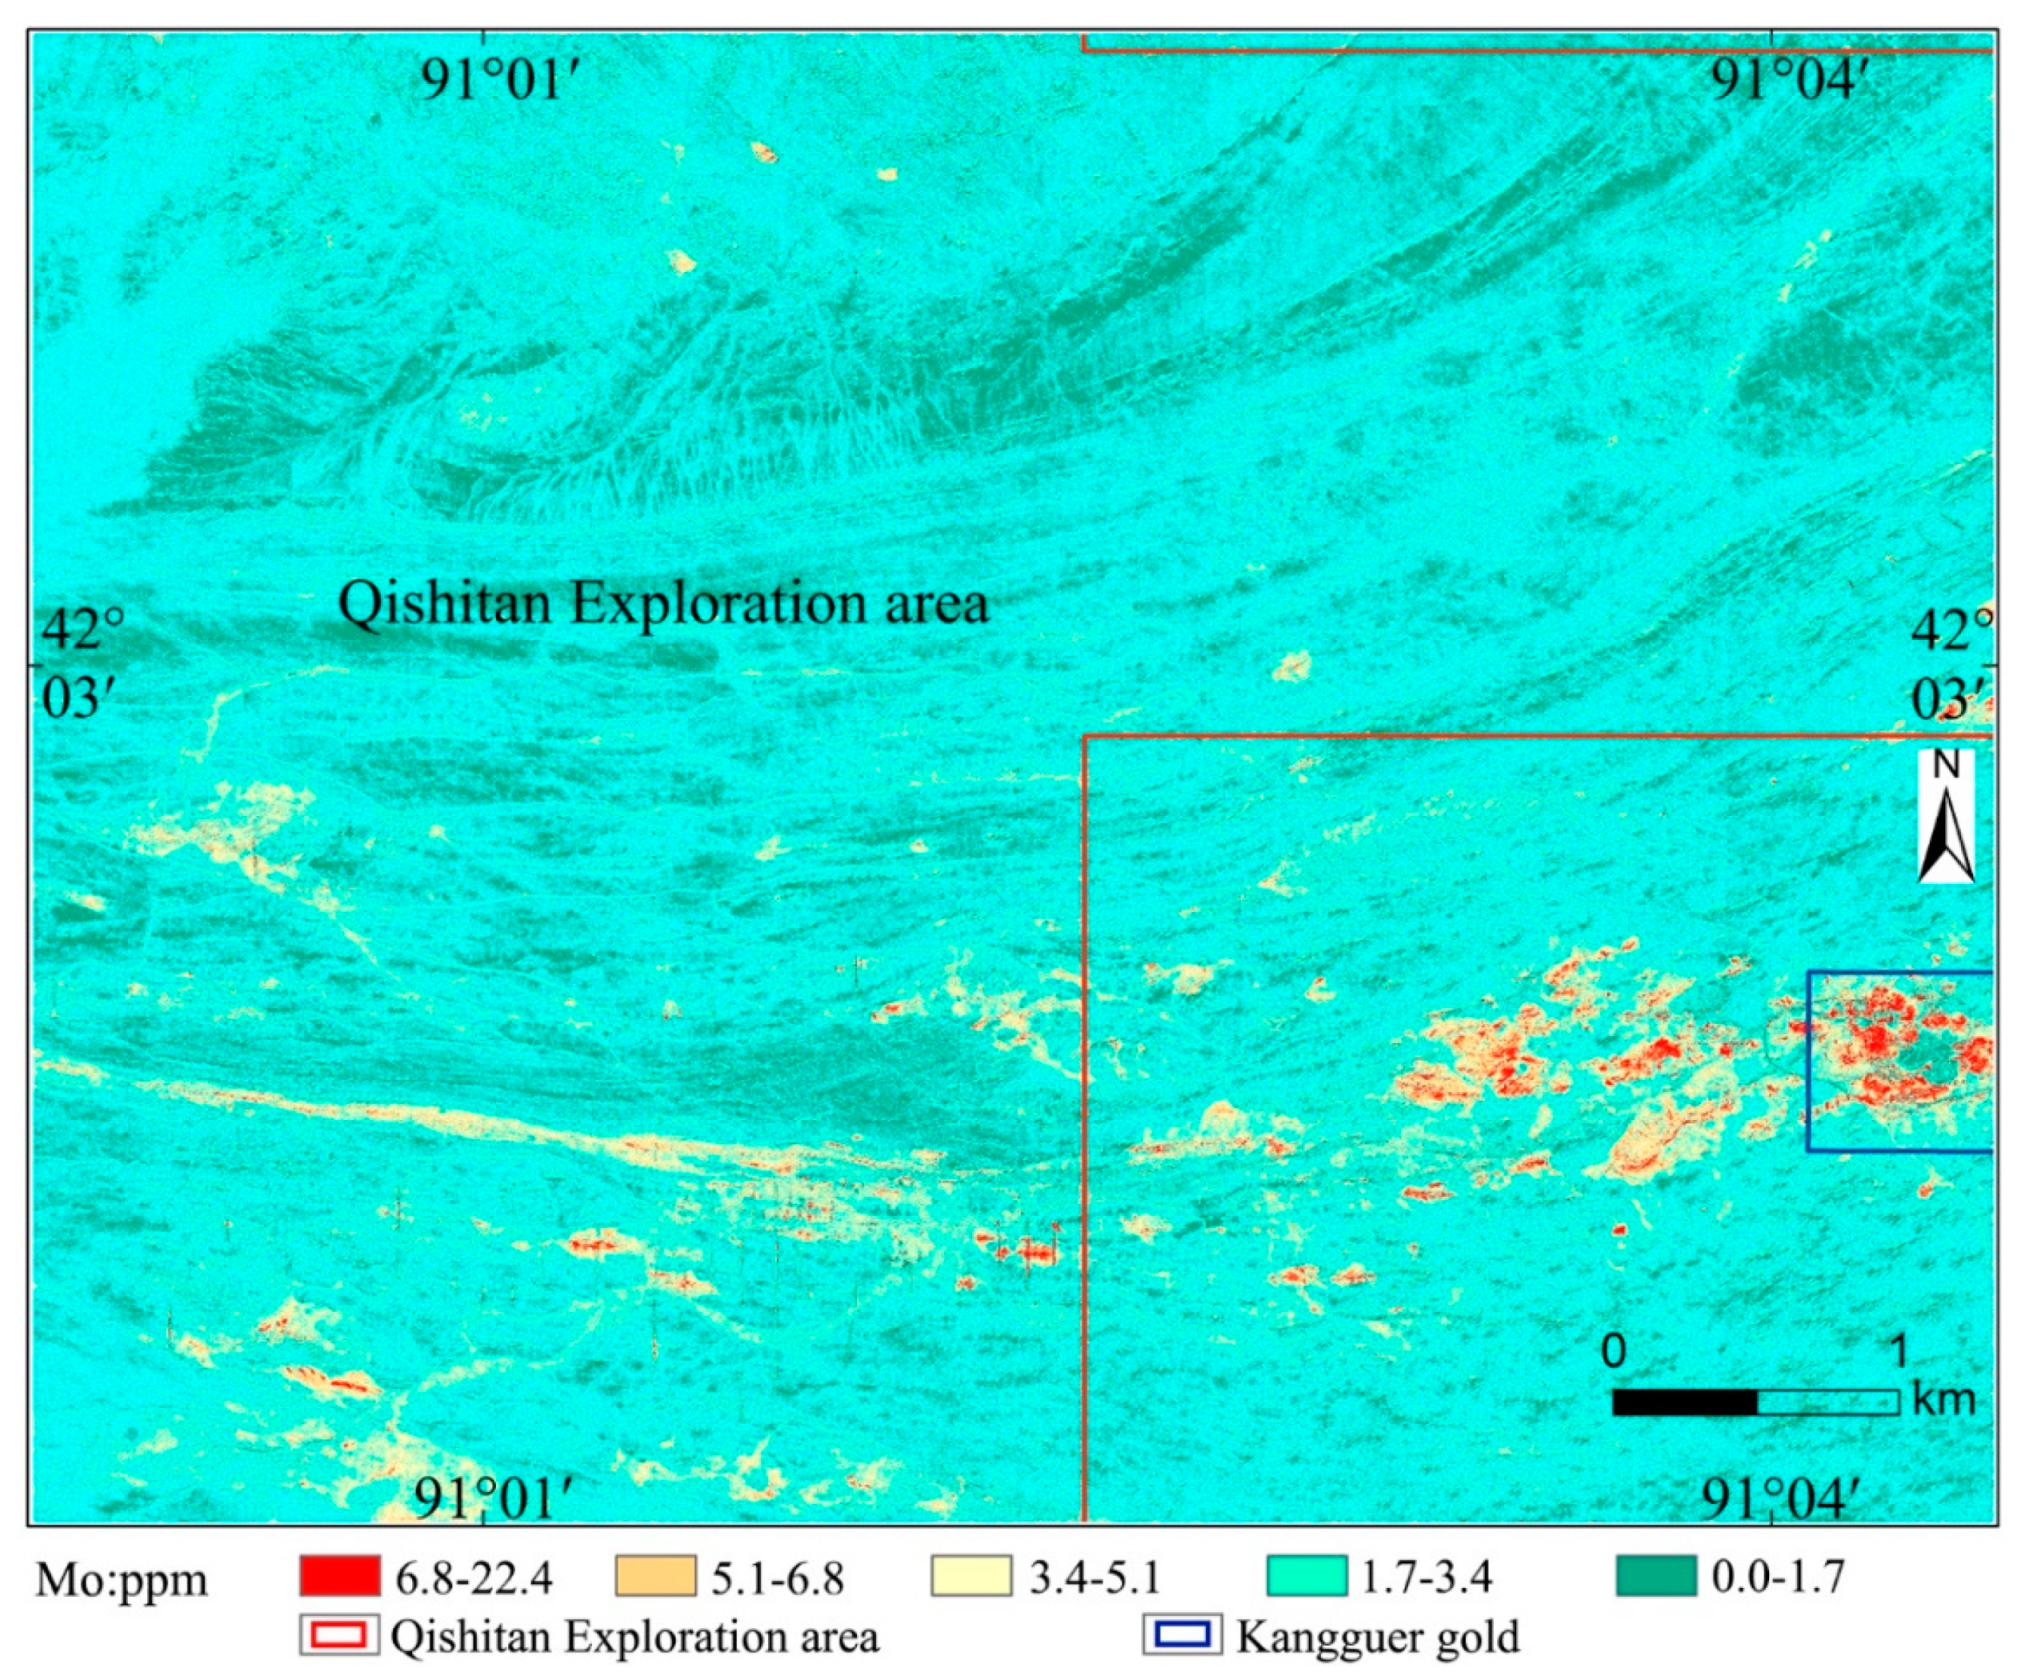
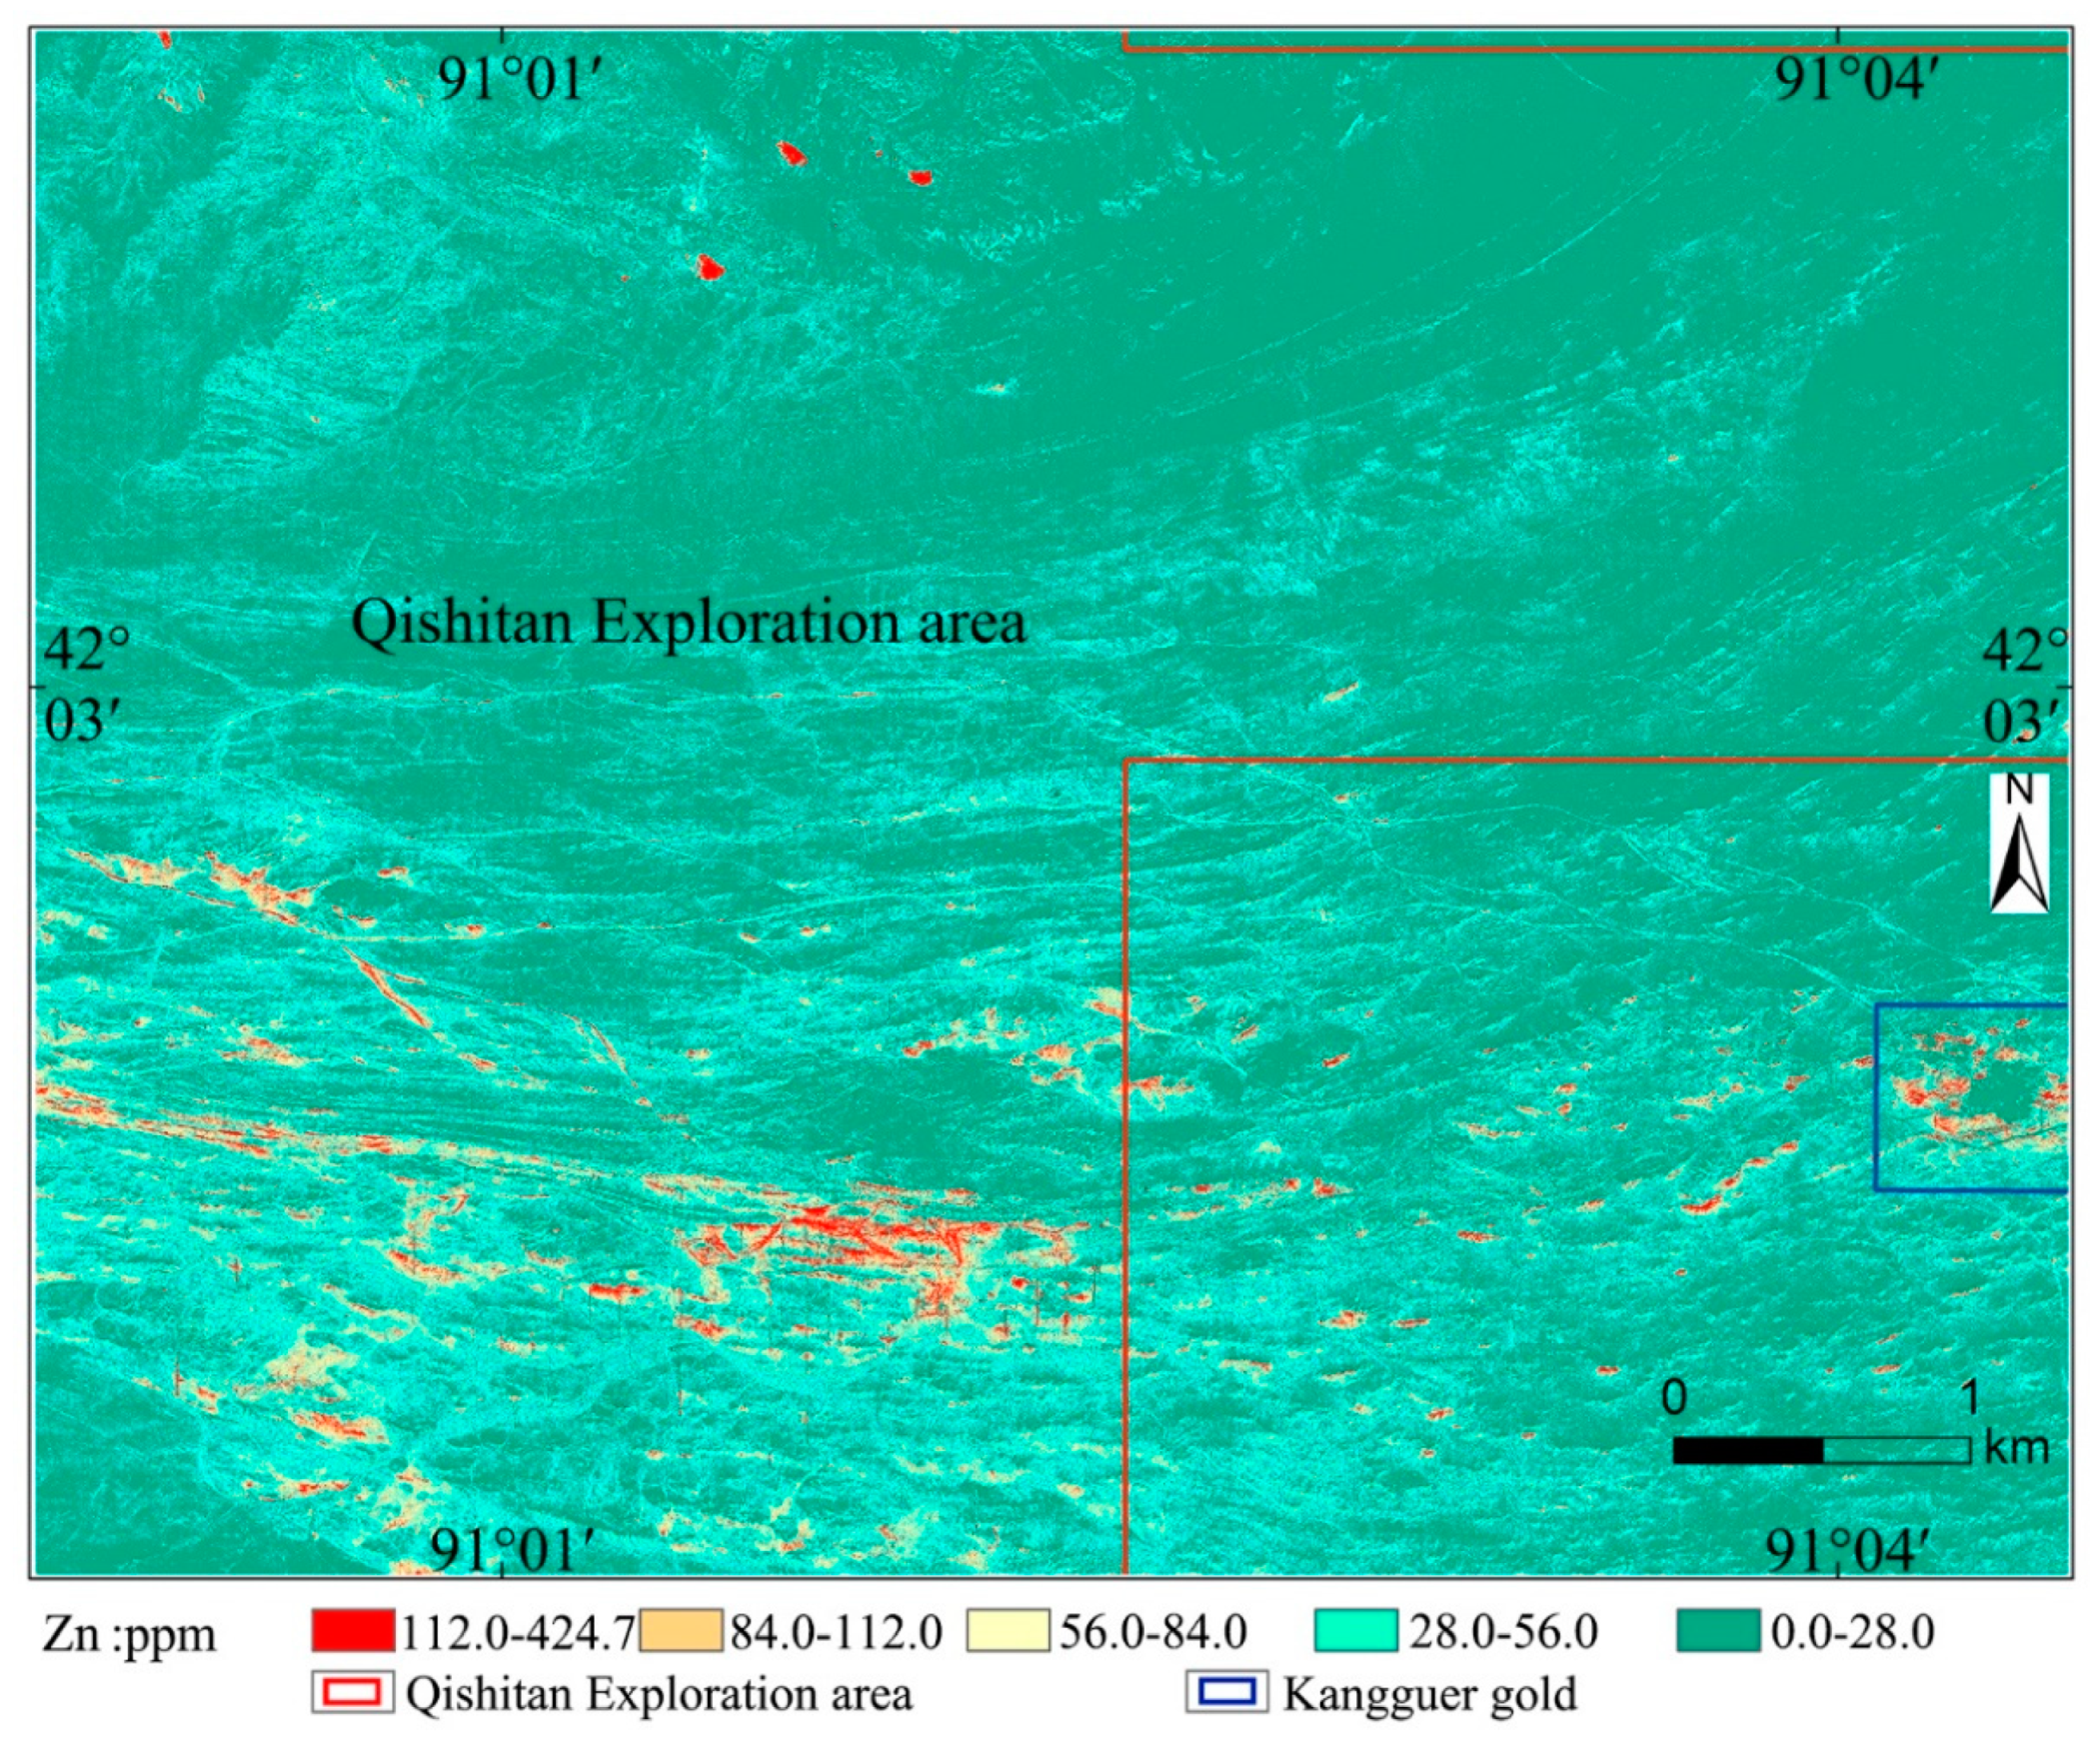
Figure 9), the color changes from dark green to dark red. Warm color corresponds to the positive anomaly of elements, indicating the existing of ore bodies. In these inversion maps, dark red color represents highly positive anomaly of the element and the mostly like existence of ore bodies. In contrast, dark blue color represents the negative anomaly. The Qishitan polymetallic deposit is located in the southwest proton of the inversion map, and the sampling points are uniformly distributed, while the sampling points are not set in other parts of the map. It can be seen from the inversion maps that As, Au, Hg, and Pb elements show anomaly distribution in the study area. These elements have strong anomalies in the southeast part. According to previous data [
24], it can be seen that the southeast corner of the inversion maps is the Kangguer polymetallic ore deposit. The model established by the known sampling points can reflect the level of anomaly for a metal element in the unknown region, indicating that the inversion accuracy is relatively ideal. By comparing the inversion map obtained from ASTER and WorldView-2 data (
Figure 10,
Figure 11,
Figure 12,
Figure 13,
Figure 14,
Figure 15 and
Figure 16), it can be noticed that the inversion maps for the same element in ASTER and WorldView-2 are generally consistent with the anomaly centers (high anomalies), which are mostly located in the southwest of Qishitan and in the southeast of Kangguer gold deposit. Some of the anomaly centers are located in the northeast of Qishitan. As the spatial resolution of ASTER data is too low (
Figure 3,
Figure 4,
Figure 5,
Figure 6,
Figure 7,
Figure 8 and
Figure 9), the inversion accuracy is relatively low and the corresponding map is poor compared to the inversion map obtained with WorldView-2 data (
Figure 10,
Figure 11,
Figure 12,
Figure 13,
Figure 14,
Figure 15 and
Figure 16).
5.3.3. ASTER and WorldView-2 Data Modeling Accuracy Comparison Results
The models mentioned in
Section 4.1 and
Section 5.3.1 were tested by the RMSE and R methods. The accuracy of the multivariate linear regression model established with the ASTER and WorldView-2 data were removed from the less correlated bands (
Table 4).
From the comparison results of multiple linear regression modeling indexes of the two types of data, it can be observed that the correlation of the regression model based on ASTER data is higher than that of the model based on WorldView-2 data, and the RMSE is lower. This is because ASTER data has more bands and more abundant spectral information.WV-2 data has a total of 8 bands; the band range includes visible and near-infrared parts, while ASTER data has a wider spectral range and higher radiation resolution. The spectrum ranges from 0.52 to 11.6 microns, with 14 bands, including visible, near-infrared, short-wave infrared, and thermal infrared. Wide band range means more abundant ground feature information and stronger ground feature identification ability.
On the other hand, from the perspective of space, WV2 data is more helpful for prospecting work in actual engineering because of its higher spatial resolution and more detailed description. Compared with ASTER data with low spatial resolution, WV2 data can better depict the surface mineralized bodies or mineralized zones with relatively narrow width. Therefore, different data have different application characteristics and can be combined or selected according to the actual needs of the appropriate data.
5.4. The Inversion Experiment Is Supplemented by Adding New Modeling Methods
It is possible to improve the modeling accuracy by changing the modeling method. In this paper, the multiple linear regression method was used for the quantitative remote sensing inversion of metallic elements. Although this method provides ideal accuracy, it still has some insufficiency. For example, the interpretation ability is weak when there is not necessarily a linear relationship between the spectral bands of the current geochemical exploration data. However, based on machine learning methods such as b-t neural network and random forest methods, it is possible to solve this deficiency. When there are high spectral bands in the image and with a certain degree of data redundancy, partial least squares method can provide a better solution. Therefore, the appropriate modeling methods need to be applied flexibly, and one needs to consider selecting the current ground-based and space-based data. This requires a lot of experimental verification to get the optimal results.
6. Conclusions
In this paper, ASTER and WorldView-2 remote sensing images were processed, interpreted, and integrated with geochemical data in the Qishitan polymetallic deposit, NW China. The quantitative inversion models of the contents of Cu, Pb, Zn, Mo, As, and Hg were established, respectively. The inversion maps of the contents of each element were calculated according to the established models. At the same time, the effects of the resolution of remote sensing image and the existing scale problem on the modeling accuracy were further discussed. The results show that:
(1) The inversion map is consistent with the geochemical anomaly map. By comparing the geochemical interpolation anomaly map and remote sensing inversion map of each metal element in the study area, it is obvious that Au, As, Cu, Hg, Mo, Pb, Zn, and other elements have a high coincidence degree with the anomaly map. Moreover, in the southeast of Qishitan deposit, where there is no geochemical data, there are high anomalies of metal elements, and the anomaly range is close to that of the known mining area, which comprehensively indicates that the reliability of this inversion effect is high.
(2) The two types of resolution images have their specific advantages, and the comprehensive utilization of the two datasets can meet different needs. When the reflectance is modeled in the same band range of two image types, the accuracy of the model based on the WorldView-2 data is better than that based on ASTER data. In contrast, when all the bands are modeled, the accuracy of the model based on ASTER data is better than that based on WorldView-2 data. The latter has very high spatial resolution, and the corresponding inversion map is more detailed.
(3) Scale transformation can reduce the problem of scale inconsistency between remote sensing images and geochemical data. Experimental results show that the resolution of geochemical sampling data through resampling and Kriging interpolation is closer to that of remote sensing data used in inversion; compared with other interpolation methods, the interpolation model has higher accuracy in modeling and prediction.
Author Contributions
Conceptualization, G.C. and H.L.; methodology, G.C. and X.D.; software, H.H. and R.K.; validation, A.A. and X.D.; formal analysis, G.C. and H.H.; investigation, G.C., H.H., X.L. and X.G.; data curation, H.H. and G.C.; writing—original draft preparation, G.C. and H.H.; writing—review and editing, H.L., R.K. and L.S.; visualization, H.H. and R.K.; supervision, G.C. and H.L.; project administration, G.C.; funding acquisition, G.C. and H.L. All authors have read and agreed to the published version of the manuscript.
Funding
This research was funded by Department of Natural Resources of Hunan Province (grant number: 2020-04) and China National Key Research and Development Plan (grant number: 2019YFC1805905). The APC was funded by Central South University.
Institutional Review Board Statement
Not applicable.
Informed Consent Statement
Not applicable.
Data Availability Statement
Not applicable.
Acknowledgments
The authors want to thank Qian-Hong Wu for project management, and Xiaoshuang Xi and Biao Liu for their field work assistance.
Conflicts of Interest
The authors declare no conflict of interest.
References
- Wambo, J.D.T.; Ganno, S.; Lahe, Y.S.D.; Nono, G.D.K.; Fossi, D.H.; Tchouatcha, M.S.; Nzenti, J.P. Geostatistical and GIS analysis of the spatial variability of alluvial gold content in Ngoura-Colomines area, Eastern Cameroon: Implications for the exploration of primary gold deposit. J. Afr. Earth Sci. 2018, 142, 138–157. [Google Scholar] [CrossRef]
- Caruso, A.S.; Clarke, K.D.; Tiddy, C.J.; Lewis, M.M. Integrating hyperspectral and radiometric remote sensing, spatial topographic analysis and surface geochemistry to assist mineral exploration. ASEG Ext. Abstr. 2019, 2019, 1–3. [Google Scholar]
- Kazimoto, E.O.; Mshiu, E.E. Reconnaissance assessment of the Stenian-Tonian granitoids of southern Tanzania for metal resources by using geological remote sensing and geochemical techniques. Geochemistry 2020, 80, 125533. [Google Scholar] [CrossRef]
- Wu, Y.Z.; Tian, J.Q.; Chen, J.; Ji, J.F.; Chen, J. Study on the remote-sensing geochemistry (in Chinese with English abstract). Adv. Earth Sci. 2003, 18, 228–235. [Google Scholar]
- Gabr, S.S.; Hassan, S.M.; Sadek, M.F. Prospecting for new gold-bearing alteration zones at El-Hoteib area, South Eastern Desert, Egypt, using remote sensing data analysis. Ore Geol. Rev. 2015, 71, 1–13. [Google Scholar] [CrossRef]
- Pour, A.B.; Hashim, M.; Hong, J.K.; Park, Y. Lithological and alteration mineral mapping in poorly exposed lithologies using Landsat-8 and ASTER satellite data: North-eastern Graham Land, Antarctic Peninsula. Ore Geol. Rev. 2019. [Google Scholar] [CrossRef]
- Pirouei, M.; Kolo, K.; Kalaitzidis, S.P. Hydrothermal listvenitization and associated mineralizations in Zagros Ophiolites: Implications for mineral exploration in Iraqi Kurdistan. J. Geochem. Explor. 2020, 208, 106404. [Google Scholar] [CrossRef]
- Wambo, J.D.T.; Pour, A.B.; Ganno, S.; Asimow, P.D.; Zoheir, B.; dos Reis Salles, R.; Nzenti, J.P.; Pradhan, B.; Muslim, A.M. Identifying high potential zones of gold mineralization in a sub-tropical region using Landsat-8 and ASTER remote sensing data: A case study of the Ngoura-Colomines goldfield, eastern Cameroon. Ore Geol. Rev. 2020, 122, 103530. [Google Scholar] [CrossRef]
- Chen, Y.G.; Liu, G.G.; Lu, Y.M.; Wang, M.J.; Hang, X.J.; Zhang, H.Y.; Chang, C.J. Remote sensing geochemical anomaly information extraction research. Procedia Earth Planet. Sci. 2010, 3, 103–112. [Google Scholar]
- Paarma, H.; Vartiainen, H. Utilization of remote snsing methods in prospecting of alkaline rocks in Finland. Bull. Soc. Finl. 1996, 68, 25–33. [Google Scholar] [CrossRef]
- Yao, F.J.; Fu, B.H. Application of remote sensing information related to mineralization alteration and new discovery in geological prospecting work. In IOP Conference Series: Earth and Environmental Science; IOP Publishing: Bristol, UK, 2017; Volume 74, p. 12014. [Google Scholar]
- Feizi, F.; Mansouri, E.; Ramezanali, A.K. Prospecting of Au by remote sensing and geochemical data processing using fractal modelling in Shishe-Botagh, Area (NW Iran). J. Indian Soc. Remote Sens. 2016, 44, 539–552. [Google Scholar] [CrossRef]
- Ren, Y.; Deng, L.Y.; Zuo, S.D.; Song, X.D.; Liao, Y.L.; Xu, C.D.; Chen, Q.; Hua, L.Z.; Li, Z.W. Quantifying the influences of various ecological factors on land surface temperature of urban forests. Environ. Pollut. 2016. [Google Scholar] [CrossRef] [Green Version]
- Zhang, S.; Wang, H.; Fan, Y.; Hu, N.; Liu, H.; Yang, C.; Liao, Y. Application of high resolution remote sensing image in the exploration of skarn-type iron deposit in Hutouya area of East Kunlun. In IOP Conference Series: Earth and Environmental Science; IOP Publishing: Bristol, UK, 2018; Volume 170, p. 22094. [Google Scholar]
- Wu, X.; Xiao, Q.; Wen, J.; You, D.; Hueni, A. Advances in quantitative remote sensing product validation: Overview and current status. Earth Sci. Rev. 2019, 196, 102875. [Google Scholar] [CrossRef]
- Zhang, Z.; Zhang, J.; Wang, G.; Carranza, E.J.M.; Pang, Z.; Wang, H. From 2D to 3D modeling of mineral prospectivity using multi-source geoscience datasets, Wulong Gold District, China. Nat. Resour. Res. 2020, 29, 345–364. [Google Scholar] [CrossRef]
- Wang, G.H.; Zhang, H.; Wei, Y.S. Implementation of Partial Least Squares Regression in SPSS Soft-ware (in Chinese with English abstract). Stat. Decis. 2017, 7, 67–71. [Google Scholar] [CrossRef]
- Xu, H.; Chen, C.; Zheng, H.; Luo, G.; Yang, L.; Wang, W.; Wu, S.; Ding, J. AGA-SVR-based selection of feature subsets and optimization of parameter in regional soil salinization monitoring. Int. J. Remote Sens. 2020, 41, 4470–4495. [Google Scholar] [CrossRef]
- Wan, C.J.; Wu, X.D.; Lin, X.W. The influence of remote sensing data space-time scale on the analysis of space-time changes in geographical features. Int. J. Geo-Inform. 2019, 8, 72. [Google Scholar] [CrossRef] [Green Version]
- Jong, R.D.; Verbesselt, J.; Schaepman, M.; Bruin, S.D. Trend changes in global greening and browning: Contribution of short-term trends to longer-term change. Environ. Sci. Glob. Chang. Biol. 2012, 18, 642–655. [Google Scholar] [CrossRef]
- Coppin, P.R.; Bauer, M.E. Digital change detection in forest ecosystems with remote sensing imagery. Remote Sens. Rev. 1996, 13, 207–234. [Google Scholar] [CrossRef]
- Pan, Y.Q. Analysis of the geological characteristics and mineralization conditions of Qishitan gold deposit in Yanshan County, Xinjiang. Minerals 2009, 28, 100–104. [Google Scholar]
- Wen, C.G.; Qiao, H.; Xue, W.L. The geological features and prospecting direction of jin polymetallic deposits in Qishitan, Xinjiang. Minerals 2015, 9, 249. [Google Scholar]
- Sun, Z.; Jingbin, W.; Wang, Y.; Long, L.; Luo, Z.; Deng, X.; Hu, Q.; Wang, M. Sodium-rich volcanic rocks and their relationships with iron deposits in the Aqishan-Yamansu belt of Eastern Tianshan, NW China. Geosci. Front. 2020, 11, 697–713. [Google Scholar] [CrossRef]
- Zhao, L.; Chen, H.; Hollings, P.; Han, J. Late Paleozoic magmatism and metallogenesis in the Aqishan-Yamansu belt, Eastern Tianshan: Constraints from the Bailingshan intrusive complex. Gondwana Res. 2018, 65, 68–85. [Google Scholar] [CrossRef]
- Han, J.; Chen, H.; Jiang, H.; Zhao, L.; Zhang, W.; Lai, C. Genesis of the Paleozoic Aqishan-Yamansu Arc-Basin System and Fe (-Cu) Mineralization in the Eastern Tianshan, NW China. Ore Geol. Rev. 2019, 105, 55–70. [Google Scholar] [CrossRef]
- Du, L.; Zhang, Y.; Huang, Z.; Li, X.; Yuan, C.; Wu, B.; Long, X. Devonian to Carboniferous Tectonic Evolution of the Kangguer Ocean in the Eastern Tianshan, NW China: Insights from Three Episodes of Granitoids. Lithos 2019, 350, 105243. [Google Scholar] [CrossRef]
- Jahn, B.; Wu, F.; Chen, B. Granitoids of the Central Asian Orogenic Belt and continental growth in the Phanerozoic. Earth Environ. Sci. Trans. R. Soc. Edinb. 2000, 91, 181–193. [Google Scholar]
- Liu, B.; Wu, J.-H.; Li, H.; Mathur, R.; Wu, Q.-H.; Han, Z.; Jiang, J.-B. Late Paleozoic Tectonic Evolution of the Kangguer Shear Zone and Yamansu Arc Belt. Lithos 2021, 380, 105821. [Google Scholar] [CrossRef]
- Morris, R.V.; Lauer, H.V., Jr.; Lawson, C.A.; Gibson, E.K., Jr.; Nace, G.A.; Stewart, C. Spectral and other physicochemical properties of submicron powders of hematite (α-Fe2O3), maghemite (γ-Fe2O3), magnetite (Fe3O4), goethite (α-FeOOH), and lepidocrocite (γ-FeOOH). J. Geophys. Res. Solid Earth 1985, 90, 3126–3144. [Google Scholar] [CrossRef]
- Sherman, D.M.; Waite, T.D. Electronic spectra of Fe3+ oxides and oxide hydroxides in the near IR to near UV. Am. Miner. 1985, 70, 1262–1269. [Google Scholar]
- Drusch, M.; Del Bello, U.; Carlier, S.; Colin, O.; Fernandez, V.; Gascon, F.; Hoersch, B.; Isola, C.; Laberinti, P.; Martimort, P.; et al. Sentinel-2: ESA’s Optical High-Resolution Mission for GMES Operational Services. Remote Sens. Environ. 2012. [Google Scholar] [CrossRef]
- Abrams, M.; Tsu, H.; Hulley, G.; Iwao, K.; Pieri, D.; Cudahy, T.; Kargel, J. The Advanced Spaceborne Thermal Emission and Reflection Radiometer (ASTER) after fifteen years: Review of global products. Int. J. Appl. Earth Obs. Geoinform. 2015. [Google Scholar] [CrossRef]
- Segal-Rozenhaimer, M.; Li, A.; Das, K.; Chirayath, V. Cloud detection algorithm for multi-modal satellite imagery using convolutional neural-networks (CNN). Remote Sens. Environ. 2020, 237, 111446. [Google Scholar] [CrossRef]
- van der Meer, F.D.; van der Werff, H.M.A.; van Ruitenbeek, F.J.A.; Hecker, C.A.; Bakker, W.H.; Noomen, M.F.; van der Meijde, M.; Carranza, E.J.M.; de Smeth, J.B.; Woldai, T. Multi- and hyperspectral geologic remote sensing: A review. Int. J. Appl. Earth Obs. Geoinform. 2012, 14, 112–128. [Google Scholar] [CrossRef]
- Roy, D.P.; Wulder, M.A.; Loveland, T.R.; Woodcock, C.E.; Allen, R.G.; Anderson, M.C.; Helder, D.; Irons, J.R.; Johnson, D.M.; Kennedy, R.; et al. Landsat-8: Science and product vision for terrestrial global change research. Remote Sens. Environ. 2014. [Google Scholar] [CrossRef] [Green Version]
- Cooley, T.; Anderson, G.P.; Felde, G.W.; Hoke, M.L.; Ratkowski, A.J.; Chetwynd, J.H.; Gardner, J.A.; Adler-Golden, S.M.; Matthew, M.W.; Berk, A. FLAASH, a MODTRAN4-based atmospheric correction algorithm, its application and validation. In Proceedings of the IEEE International Geoscience and Remote Sensing Symposium, Toronto, ON, Canada, 24–28 June 2002; Volume 3, pp. 1414–1418. [Google Scholar]
- Yuan, Z.H. MODIS Image Based Estimation of Zhejiang Provincial Forest Carbon Storage (in Chinese with English Abstract). Master’s Thesis, Zhejiang Agriculture & Forestry University, Lin’an, China, 2016; pp. 1–74. [Google Scholar]
- Charlie, K.; Mark, C.; David, B.; Stephen, G.; Antonio, F.A. Machine learning approach to geochemical mapping. J. Geochem. Explor. 2016, 167, 49–61. [Google Scholar]
- Hao, D.L.; Xiao, Q.; Wen, J.G.; You, D.Q.; Wu, X.D.; Lin, X.W.; Wu, S.B. Advances in upscaling methods of quantitative remote sensing. Phys. Rev. 2018, 54, 5. [Google Scholar]
- Yao, Y.; Chen, X.; Qian, J. A review on the methodology of scale issues in quantitative remote sensing. Renew. Sustain. Energy Rev. 2019, 103, 140–150. [Google Scholar]
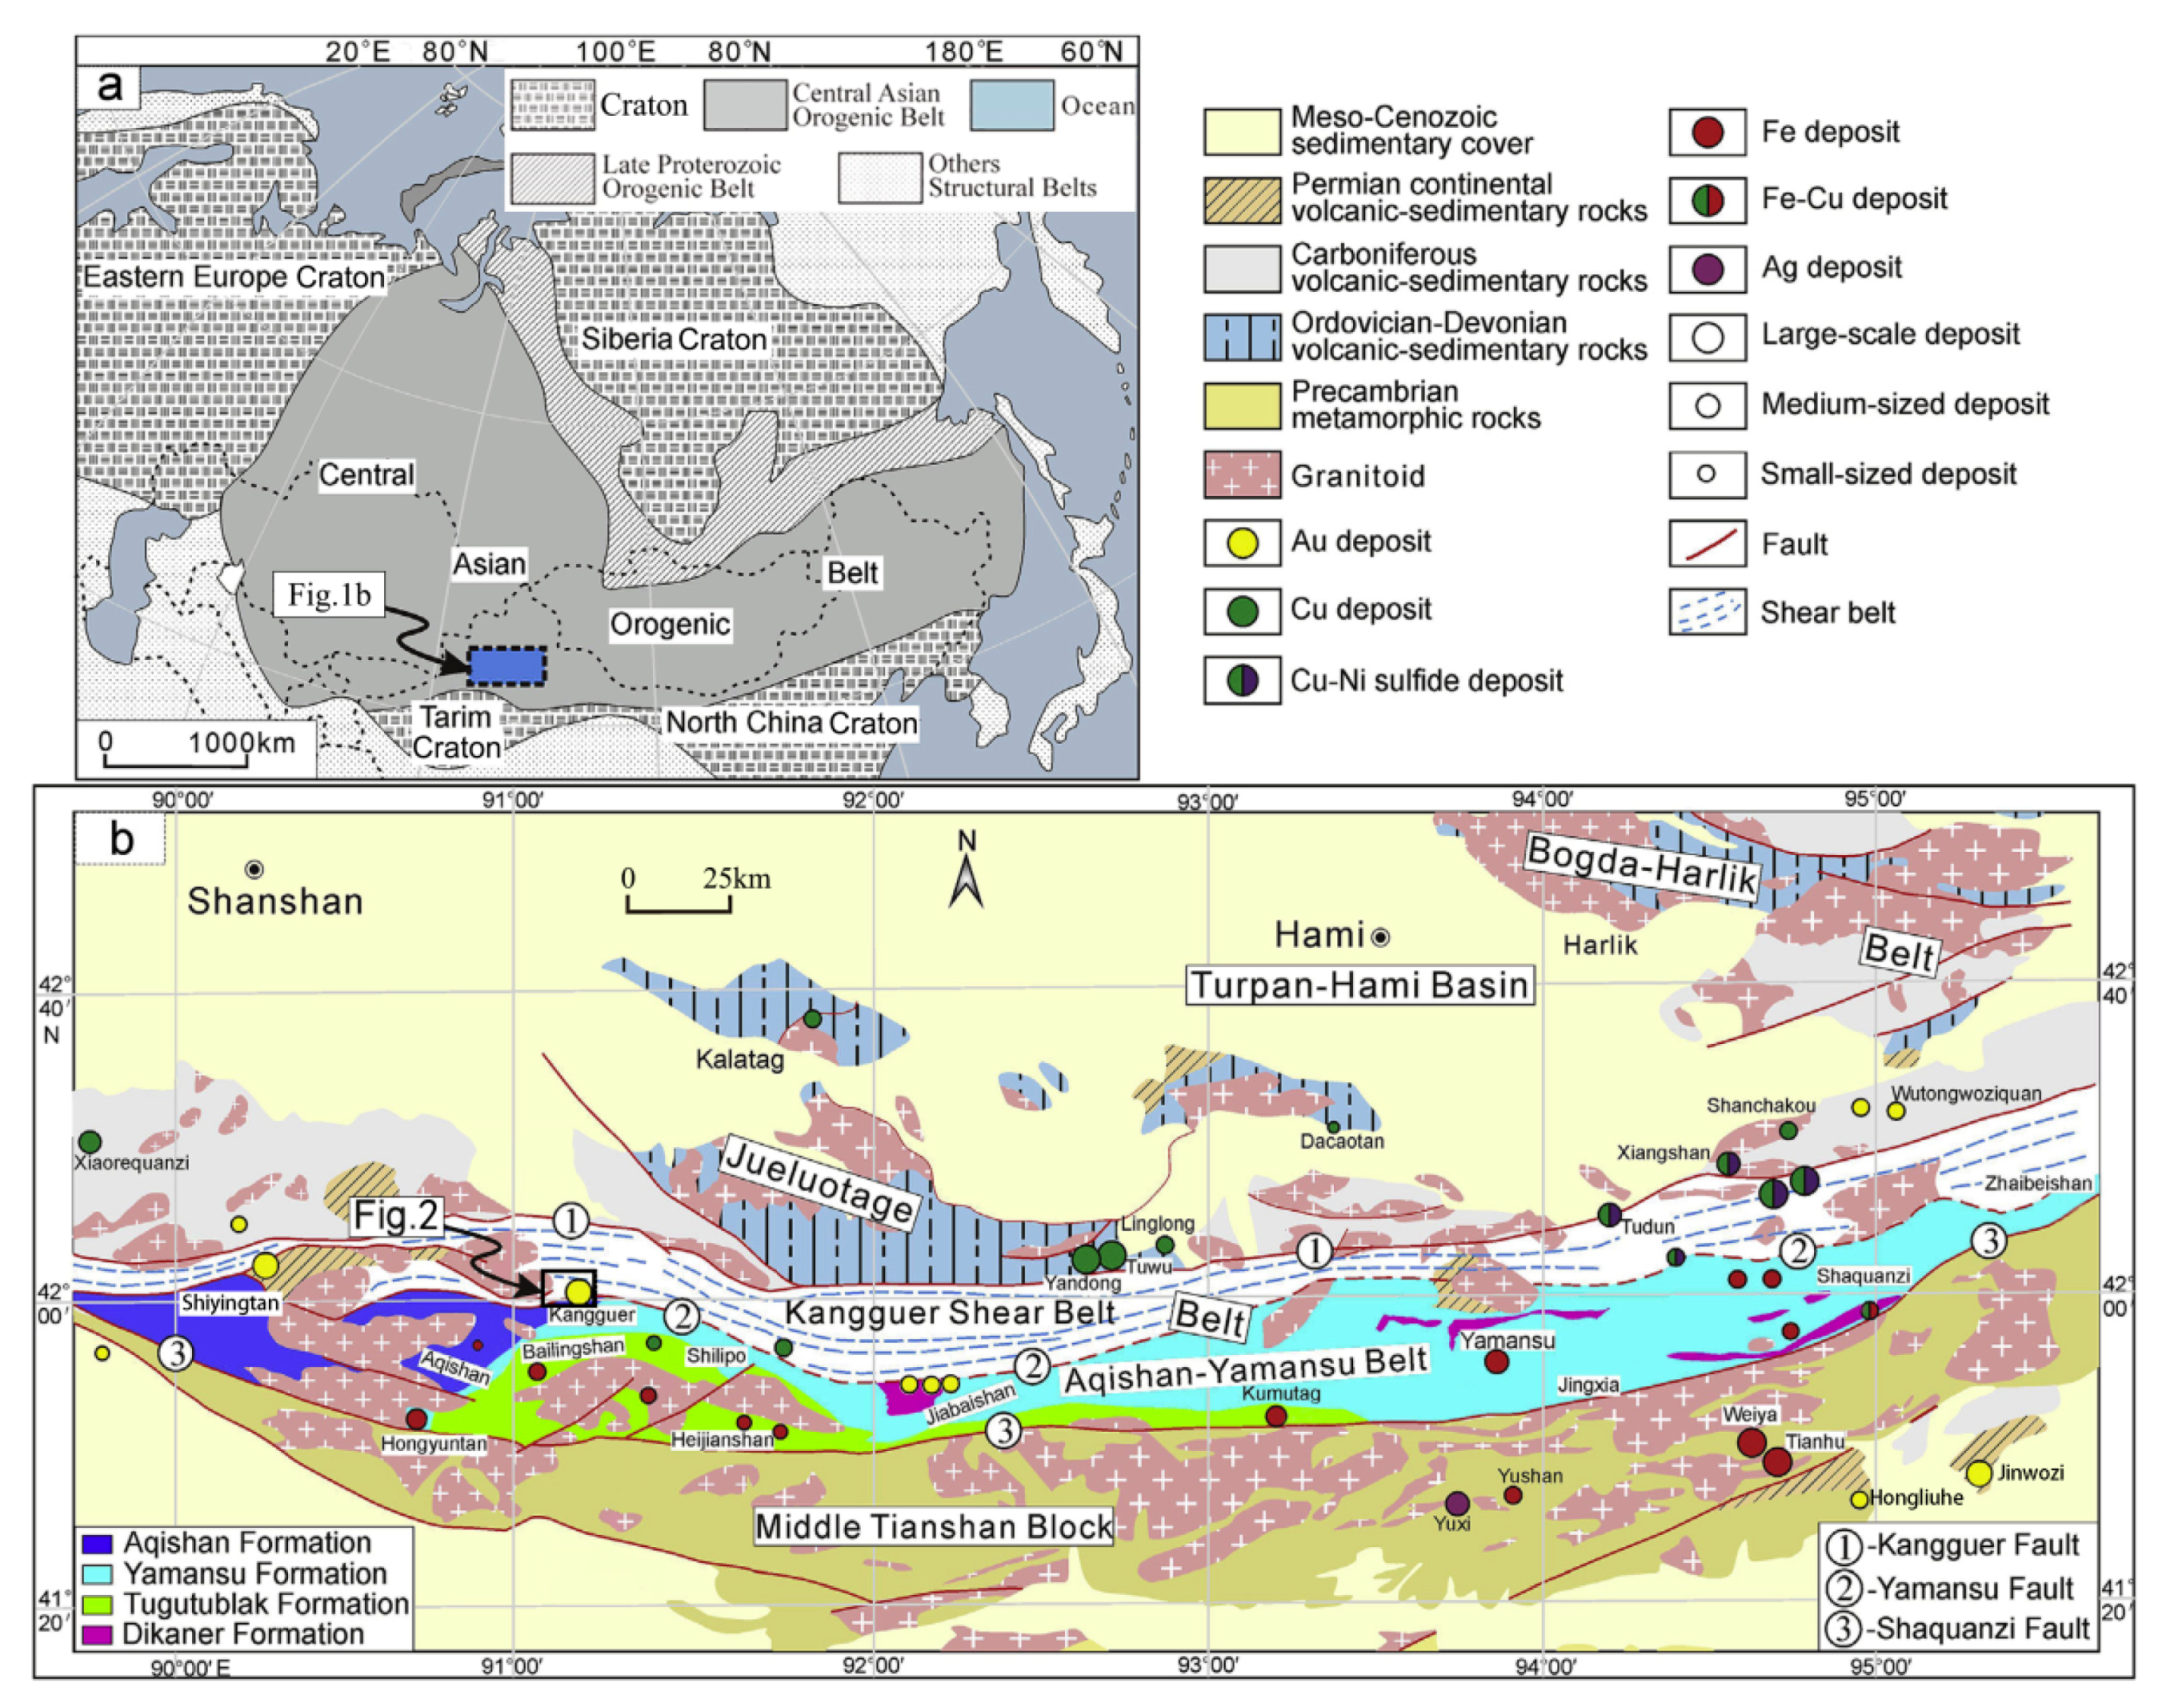
Figure 1.
(
a) Tectonic sketch map of the Central Asia Orogenic Belt [
24,
25,
26,
27]. (
b) Geological map and ore deposits distribution of the Eastern Tianshan [
24,
28].
Figure 1.
(
a) Tectonic sketch map of the Central Asia Orogenic Belt [
24,
25,
26,
27]. (
b) Geological map and ore deposits distribution of the Eastern Tianshan [
24,
28].
Figure 2.
Geological map and sampling distribution of the Qishitan gold polymetallic mining area.
Figure 2.
Geological map and sampling distribution of the Qishitan gold polymetallic mining area.
Figure 3.
(a) As element inversion map generated by ASTER data, and (b) geochemical anomaly map of As element.
Figure 3.
(a) As element inversion map generated by ASTER data, and (b) geochemical anomaly map of As element.
Figure 4.
(a) Au element inversion map generated by ASTER data, and (b) geochemical anomaly map of Au element.
Figure 4.
(a) Au element inversion map generated by ASTER data, and (b) geochemical anomaly map of Au element.
Figure 5.
(a) Cu element inversion map generated by ASTER data, and (b) geochemical anomaly map of Cu element.
Figure 5.
(a) Cu element inversion map generated by ASTER data, and (b) geochemical anomaly map of Cu element.
Figure 6.
(a) Hg element inversion map generated by ASTER data, and (b) geochemical anomaly map of Hg element.
Figure 6.
(a) Hg element inversion map generated by ASTER data, and (b) geochemical anomaly map of Hg element.
Figure 7.
(a) Mo element inversion map generated by ASTER data, and (b) geochemical anomaly map of Mo element.
Figure 7.
(a) Mo element inversion map generated by ASTER data, and (b) geochemical anomaly map of Mo element.
Figure 8.
(a) Pb element inversion map generated by ASTER data, and (b) geochemical anomaly map of Pb element.
Figure 8.
(a) Pb element inversion map generated by ASTER data, and (b) geochemical anomaly map of Pb element.
Figure 9.
(a) Zn element inversion map generated by ASTER data, and (b) geochemical anomaly map of Zn element.
Figure 9.
(a) Zn element inversion map generated by ASTER data, and (b) geochemical anomaly map of Zn element.
Figure 10.
Inversion map of As based on the WorldView-2 data.
Figure 10.
Inversion map of As based on the WorldView-2 data.
Figure 11.
Inversion map of Au based on the WorldView-2 data.
Figure 11.
Inversion map of Au based on the WorldView-2 data.
Figure 12.
Inversion map of Cu based on the WorldView-2 data.
Figure 12.
Inversion map of Cu based on the WorldView-2 data.
Figure 13.
Inversion map of Hg based on the WorldView-2 data.
Figure 13.
Inversion map of Hg based on the WorldView-2 data.
Figure 14.
Inversion map of Mo based on the WorldView-2 data.
Figure 14.
Inversion map of Mo based on the WorldView-2 data.
Figure 15.
Inversion map of Pb based on the WorldView-2 data.
Figure 15.
Inversion map of Pb based on the WorldView-2 data.
Figure 16.
Inversion map of Zn based on the WorldView-2 data.
Figure 16.
Inversion map of Zn based on the WorldView-2 data.
Table 1.
Statistics of geochemical sampling data from the Qishitan area.
Table 1.
Statistics of geochemical sampling data from the Qishitan area.
Elements | Au | Cu | Pb | Zn | Mo | As | Hg |
---|
Number of samples | 200 | 200 | 200 | 200 | 200 | 200 | 200 |
Mean value | 3.495 | 14.858 | 25.922 | 31.044 | 2.705 | 12.574 | 15.620 |
Standard error of the mean | 0.284 | 1.374 | 7.563 | 9.694 | 0.306 | 0.821 | 1.260 |
Mid-value | 1.700 | 8.850 | 6.600 | 15.050 | 1.495 | 8.800 | 10.000 |
Mode | 1.000 | 5.000 | 5.000 | 5.000 | 1.160 | 4.200 * | 10.000 |
Standard deviation | 4.018 | 19.430 | 106.952 | 137.097 | 4.332 | 11.612 | 17.825 |
Variance | 16.148 | 377.529 | 11,438.798 | 18,795.615 | 18.766 | 134.829 | 317.724 |
Overall spread | 23.00 | 207.00 | 1361.50 | 1813.50 | 44.99 | 75.60 | 169.00 |
Table 2.
Technical characteristics of the Advanced Spaceborne Thermal Emission and Reflection Radiometer (ASTER) and WorldView-2 sensors.
Table 2.
Technical characteristics of the Advanced Spaceborne Thermal Emission and Reflection Radiometer (ASTER) and WorldView-2 sensors.
ASTER | WorldView-2 |
---|
No. of Bands | Wavelength (μm) | Resolution (m) | No. of Bands | Wavelength (μm) | Resolution (m) |
---|
B1 | 0.52–0.60 | 15 | Pan | 0.450–1.040 | 0.5 |
B2 | 0.63–0.69 | 15 | B1 | 0.450–0.510 | 1.8 |
B3 | 0.76–0.86 | 15 | B2 | 0.510–0.580 | 1.8 |
B4 | 1.600–1.700 | 30 | B3 | 0.630–0.690 | 1.8 |
B5 | 2.145–2.185 | 30 | B4 | 0.770–0.895 | 1.8 |
B6 | 2.185–2.225 | 30 | B5 | 0.585–0.625 | 1.8 |
B7 | 2.235–2.285 | 30 | B6 | 0.400–0.450 | 1.8 |
B8 | 2.295–2.365 | 30 | B7 | 0.705–0.745 | 1.8 |
B9 | 2.360–2.430 | 30 | B8 | 0.860–1.040 | 1.8 |
B10 | 8.125–8.475 | 90 | | | |
B11 | 8.475–8.825 | 90 | | | |
B12 | 8.925–9.275 | 90 | | | |
B13 | 10.25–10.95 | 90 | | | |
B14 | 10.95–11.65 | 90 | | | |
Table 3.
Multivariate linear regression inversion model of remote sensing geochemistry of each element.
Table 3.
Multivariate linear regression inversion model of remote sensing geochemistry of each element.
Predicted Elements | Models | Annotation |
---|
Au | YAu = 2.454 − 0.004 * b1 − 0.001 * b3 + 0.004 * b4 − 0.009 * b5 + 0.012 * b6 − 0.006 * b7 + 0.1 * b8 − 0.006 * b9 | Among them, b1, b2, b3, b4, b5, b6, b7, b8, and b9 correspond to the reflectivity of the first, second, third, fourth, fifth, sixth, seventh, eighth, and ninth bands of the ASTER image. |
Cu | YCu = 23.404 + 0.036 * b1 − 0.118 * b2 + 0.096 * b3 − 0.008 * b4 − 0.011 * b5 + 0.113 * b6 − 0.045 * b7 |
Pb | YPb = 87.989 + 0.271 * b2 − 0.02 * b3 + 0.08 * b4 − 0.069 * b5 + 0.087 * b6 − 0.134 * b7 + 0.115 * b8 − 0.102 * b9 |
Zn | YZn = −6.27 − 0.133 * b1 − 0.112 * b3 − 0.012 * b4 + 0.087 * b5 − 0.013 * b6 − 0.162 * b7 + 0.141 * b8 − 0.008 * b9 |
Mo | YMo = 21.286 − 0.011 * b1 + 0.024 * b2 − 0.015 * b3 + 0.003 * b4 − 0.009 * b5 + 0.013 * b6 − 0.007 * b7 − 0.018 * b9 |
As | YAs = 53.34 − 0.029 * b1 + 0.05 * b3 + 0.035 * b4 − 0.066 * b5 + 0.023 * b6 − 0.014 * b7 + 0.007 * b8 − 0.003 * b9 |
Hg | YHg = 34.608 + 0.016 * b1 − 0.072 * b2 + 0.047 * b3 + 0.04 * b4 − 0.082 * b6 + 0.025 * b7 + 0.127 * b8 − 0.118 * b9. |
Table 4.
Multiple linear regression modeling indicators with ASTER and WorldView-2.
Table 4.
Multiple linear regression modeling indicators with ASTER and WorldView-2.
Metallic Element | Remote Sensing Data | Correlation Coefficient (R) | Root Mean Square Error (RMSE) |
---|
As | ASTER | 0.4970 | 9.7049 |
WorldView-2 | 0.3178 | 11.7641 |
Au | ASTER | 0.3688 | 3.7060 |
WorldView-2 | 0.2898 | 4.1520 |
Cu | ASTER | 0.4359 | 15.3130 |
WorldView-2 | 0.4290 | 15.0366 |
Hg | ASTER | 0.4472 | 19.2390 |
WorldView-2 | 0.3000 | 32.7280 |
Mo | ASTER | 0.2881 | 4.2876 |
WorldView-2 | 0.3332 | 3.3931 |
Pb | ASTER | 0.4450 | 65.9341 |
WorldView-2 | 0.4848 | 18.8064 |
Zn | ASTER | 0.5477 | 7.4552 |
WorldView-2 | 0.3178 | 23.7206 |
Table 5.
Modeling and precision of different square sizes.
Table 5.
Modeling and precision of different square sizes.
Modeling Type | R | R2 | Adjustment of R2 | Standard Estimate Error | RMSE (Modeling Samples) | RMSE (Test Samples) |
---|
Original | 0.2427 | 0.0593 | 0.0007 | 13.8601 | 17.4291 | 11.1798 |
15 m Modeling | 0.4853 | 0.2423 | 0.1373 | 11.5146 | 10.7196 | 12.2857 |
30 m Modeling | 0.4303 | 0.1877 | 0.0750 | 12.8802 | 11.9906 | 12.0169 |
45 m Modeling | 0.4673 | 0.2200 | 0.1120 | 10.7719 | 10.0278 | 11.6456 |
60 m Modeling | 0.4397 | 0.2060 | 0.0960 | 11.4800 | 10.6875 | 10.0813 |
75 m Modeling | 0.3627 | 0.1317 | 0.0117 | 13.1094 | 12.2041 | 10.6881 |
90 m Modeling | 0.4683 | 0.2267 | 0.1197 | 12.6265 | 11.7546 | 14.0108 |
Table 6.
The inversion model for the band operation of the WorldView-2 data.
Table 6.
The inversion model for the band operation of the WorldView-2 data.
Predicted Elements | Models | Annotation |
---|
Au | YAu = −0.49582 + 0.00396 * b1 + 0.00253 * b2 − 0.01642 * b3 + 0.01081 * b4 + 0.01059 * b5 − 0.00596 * b6 − 0.00688 * b7 + 0.00395 * b8 | Among them, b1, b2, b3, b4, b5, b6, b7, and b8 correspond to the reflectivity of the first, second, third, fourth, fifth, sixth, seventh, and eighth bands of the WordView-2image. |
Cu | YCu = 29.37829 − 0.00836 * b1 − 0.07866 * b2 + 0.05617 * b3 + 0.08459 * b4 − 0.01616 * b5 − 0.01923 * b6 − 0.06784 * b7 + 0.02992 * b8 |
Pb | YPb = 44.57155 − 0.09794 * b2 + 0.20719 * b3 − 0.21651 * b4 + 0.05417 * b5 + 0.24541 * b6 − 0.10542 * b7 − 0.06244 * b8 |
Zn | YZn = 36.57033 + 0.02811 * b1 + 0.18157 * b3 + 0.09715 * b4 − 0.17465 * b5 + 0.02874 * b6 + 0.06305 * b7 − 0.03995 * b8 |
Mo | YMo = 7.25795 − 0.00484 * b1 + 0.00060 * b2 − 0.00308 * b3 − 0.00797 * b4 − 0.01103 * b8 |
As | YAs = 19.46359 − 0.04767 * b3 − 0.04955 * b4 + 0.02080 * b5 + 0.07710 * b6 − 0.01323 * b7 − 0.01897 * b8 |
Hg | YHg = 2.31494 + 0.01885 * b1 + 0.00425 * b2 − 0.08809 * b3 − 0.00980 * b4 + 0.06119 * b5 + 0.10195 * b6 − 0.03692 * b7 − 0.04869 * b8 |
| Publisher’s Note: MDPI stays neutral with regard to jurisdictional claims in published maps and institutional affiliations. |
© 2021 by the authors. Licensee MDPI, Basel, Switzerland. This article is an open access article distributed under the terms and conditions of the Creative Commons Attribution (CC BY) license (https://creativecommons.org/licenses/by/4.0/).