Article

Continuously Vegetation Greening over Inner Mongolia for the Past Three Decades

1
School of Geographical Sciences, Nanjing University of Information Science and Technology, Nanjing 210044, China
2
State Key Laboratory of Remote Sensing Science, Aerospace Information Research Institute, Chinese Academy of Sciences, Beijing 100094, China
3
School of Atmospheric Physics, Nanjing University of Information Science and Technology, Nanjing 210044, China
4
Water and Agriculture Program (WEAP), Department of Infrastructure Engineering, The University of Melbourne, Melbourne 3010, Australia
5
Department of Hydraulic Engineering, Tsinghua University, Beijing 100084, China
6
Leibniz Institute of Agricultural Development in Transition Economies (IAMO), 06120 Halle, Germany
*
Author to whom correspondence should be addressed.
Remote Sens. 2021, 13(13), 2446; https://doi.org/10.3390/rs13132446
Submission received: 10 May 2021 / Revised: 18 June 2021 / Accepted: 19 June 2021 / Published: 23 June 2021

Abstract

:
The warming climate has rapidly altered vegetation growth in drylands, and consequently, has put great pressure on sustainable livelihoods. Various datasets have been applied from local to global scale to study vegetation dynamics and there is a lack of solid comparison among multiple datasets. Note that vegetation growth might shift over time and the greening and browning components over a long-time span might be masked by a linear trend. Here, we aim to monitor the long-term and nonlinear dynamics in vegetation greenness for Inner Mongolia (an important part of dryland Asia). As a useful tool that indicates vegetation greenness, NDVI (Normalized Difference Vegetation Index) and LAI (Leaf Area Index) integrals derived from the GIMMS (Global Inventory Modelling and Mapping Studies) NDVI3g and the GIMMS LAI3g products are applied. During the period of 1982-2016, NDVI/LAI integrals have an overall acceptable consistency in characterizing the trends of vegetation greenness, with NDVI large/small integrals and LAI large/small integrals increase at a rate of 0.96, 1.72, 2.23, and 3.13 per decade, respectively. Inner Mongolia experienced a noticeable greening process (71% and 82% greening area in NDVI large/small integrals, 67% and 73% greening area in LAI large/small integrals), despite the fragmentally distributed browning trends in eastern and partial northern Inner Mongolia. As inferred from nonlinear trend analysis, we found the greening process is still prevalent. The browning of eastern Inner Mongolia under the linear analysis was actually transferring from browning to greening, while the greening trend in northern Inner Mongolia was changing to browning. Increased occurrences in the frequency of breakpoints after 1999 suggest that previously stable vegetation ecology is more sensitive to external disturbances such as altered climatic impact and anthropogenic intervention.

1. Introduction

Vegetation provides valuable ecosystem services to various terrestrial ecosystems, e.g., carbon sequestrations, resources for livestock grazing, and water resources regulations [1,2]. The Intergovernmental Panel on Climate change Fifth Assessment Report (IPCC AR5) suggested that a 0.85 °C increase in global temperature has already been observed during the period of 1880–2012 [3]. The future warming of the climate is predicted to greatly influence the terrestrial ecosystems, including grassland degeneration and desertification [4,5]. A shift toward more variable rainfall also leads to a general decrease in the biomass of grass resources and increased dryland vegetation vulnerability to loss [6]. Considerable attention has been directed towards understanding how vegetation greenness has changed (i.e., greening or browning) over the past few decades [7,8].
Due to the rapid development of observed instrumental technologies, satellite data could generally provide temporally continuous and spatially explicit information on vegetation dynamics through vegetation indices, such as Normalized Difference Vegetation Index (NDVI) and derived Leaf Area Index (LAI) [9,10]. Especially, seasonal vegetation information (e.g., the start, the end, and the length of the growing season, and vegetation biomass) derived from these indices provides key parameters for the understanding of how vegetation has responded to climate change and human activities over time [11,12]. Current remotely sensed datasets such as the global inventory modeling and mapping studies (GIMMS) NDVI3g data set from Advanced Very High-Resolution Radiometer (AVHRR), which have existed for over 30 years and provide an unprecedented opportunity to examine long-term vegetation growth dynamics [13]. However, the use of linear trends to characterize vegetation greening or browning over the period of three decades (since the 1980s) may mask the potential breakpoint and step changes due to continuous global warming, CO2 enrichment, and intensive human activity, thus hiding the identification of underlying causes and ecological indication [14,15].
Climate constraints were found to relax with increasing temperature and solar radiation, allowing an upward trend in vegetation greenness in the world from 1982–1999 [16]. Note that the warming hiatus confirmed since 2001 has also caused a negative influence on global vegetation growth [17,18]. Nonlinear trend analysis has improved the understanding of the vegetation greenness dynamics significantly [19,20]. In general, global greening is evident [21,22,23], however, whether such a trend exists globally or sporadically in some specific regions remains controversial. For example, expanded global browning areas are hidden by the overall vegetation greening, and the browning areas have increased since the 1994s [24]. The warming temperature was predicted to induce a drying climate trend and a decline in vegetation greenness in the Southern Hemisphere, while a slight increase in vegetation greenness has occurred in Northern Hemisphere, leading to a net global reduction in greening [25]. These findings indicate a major change in the global greening regime, while the change in vegetation greenness in drylands will induce serious economic and ecological consequences. Such a shift poses a serious threat to both ecosystem functioning and the provision of ecosystem services [26].
Inner Mongolia is a typical arid and semi-arid ecologically vulnerable region in China. The region has faced the pressures of climate change and human activity for nearly a century directly undermining agriculture development and animal husbandry. Under the context of global climate change, the warming rate in Inner Mongolia (0.37 °C/decade) is higher than the global level (0.14 °C/decade) during the period of 1961–2012 [27]. The dry climate system leads to an increased drought intensity in Inner Mongolia [28]. The frequency and amplitude of the extreme climate events (e.g., extreme winters and summer droughts) have also increased during 2000-2010 compared to the few decades prior to 2000 [29]. The response of the arid ecosystem to these external disturbances in Inner Mongolia may have reduced the area of vegetation greenness. Previous studies used three LAI datasets with a time scale of nearly 30 years to analyze the trend of vegetation greenness in China and found that China as a whole was greening, while the hotspots of browning were observed in Inner Mongolia [23]. Nonetheless, recent studies have analyzed the impact of grazing intensity on vegetation greenness in Inner Mongolia and found that despite a high grazing intensity, Inner Mongolia presents an overall grassland greening trend, which challenges the common belief that increased drought intensity and grazing intensity is the key driver for grassland degeneration [30]. At present, there is no consensus among the scientific community whether the vegetation in Inner Mongolia is becoming greening or browning. The reason for such inconsistencies may be ascribed to the differences in linear analysis caused by the different study time scales and the choice of proxy for vegetation greenness. The correct characterization of vegetation trends and inherent shifts are potentially important for a better understanding of the impact of altered climate change and human activity on terrestrial ecosystems in Inner Mongolia. To fill that gap, we used NDVI and LAI from Global Inventory Modeling and Mapping Studies (GIMMS) (the longest time series to date), to investigate the long-term evolution of vegetation greenness in Inner Mongolia. In particular, we used annual seasonal large/small integrals extracted from NDVI and LAI to serve as proxies of vegetation greenness in the region [31]. The comprehensive results from the multiple indicators will increase the confidence of the results. Given that vegetation greenness can vary from the micro to the mesoscale periods in the past, the linear trend just shows the overall trend of the entire period and give no hints, whether different sub-periods with no or opposite trends exist within the study period. Hence, detecting nonlinear changes within the time series have the potential to show both micro-scale (annual) to mesoscale (decadal) impacts on environmental services provided by land. As a result, long-term trends (i.e., time scales of decades) in vegetation greenness are likely to be composed of more extreme shorter-term changes (i.e., several years) which may consist of an alternating sequence of increase (greening) and/or decrease (browning) of vegetation periods [32].
In this study, we used Breaks For Additive Season and Trend (BFAST) [33], an iterative breakpoint detection algorithm for time series, to capture major trend shifts in large integrals (LI) and small integrals (SI) of the vegetation index. The main objectives of this study are two: (1) to compare whether the LI and SI of NDVI and LAI have a consistent representation towards the spatiotemporal pattern of the linear trend of vegetation greenness during 1982–2016 in Inner Mongolia; (2) to detect how and when a major trend shift occurred in LI and SI.

2. Materials and Methods
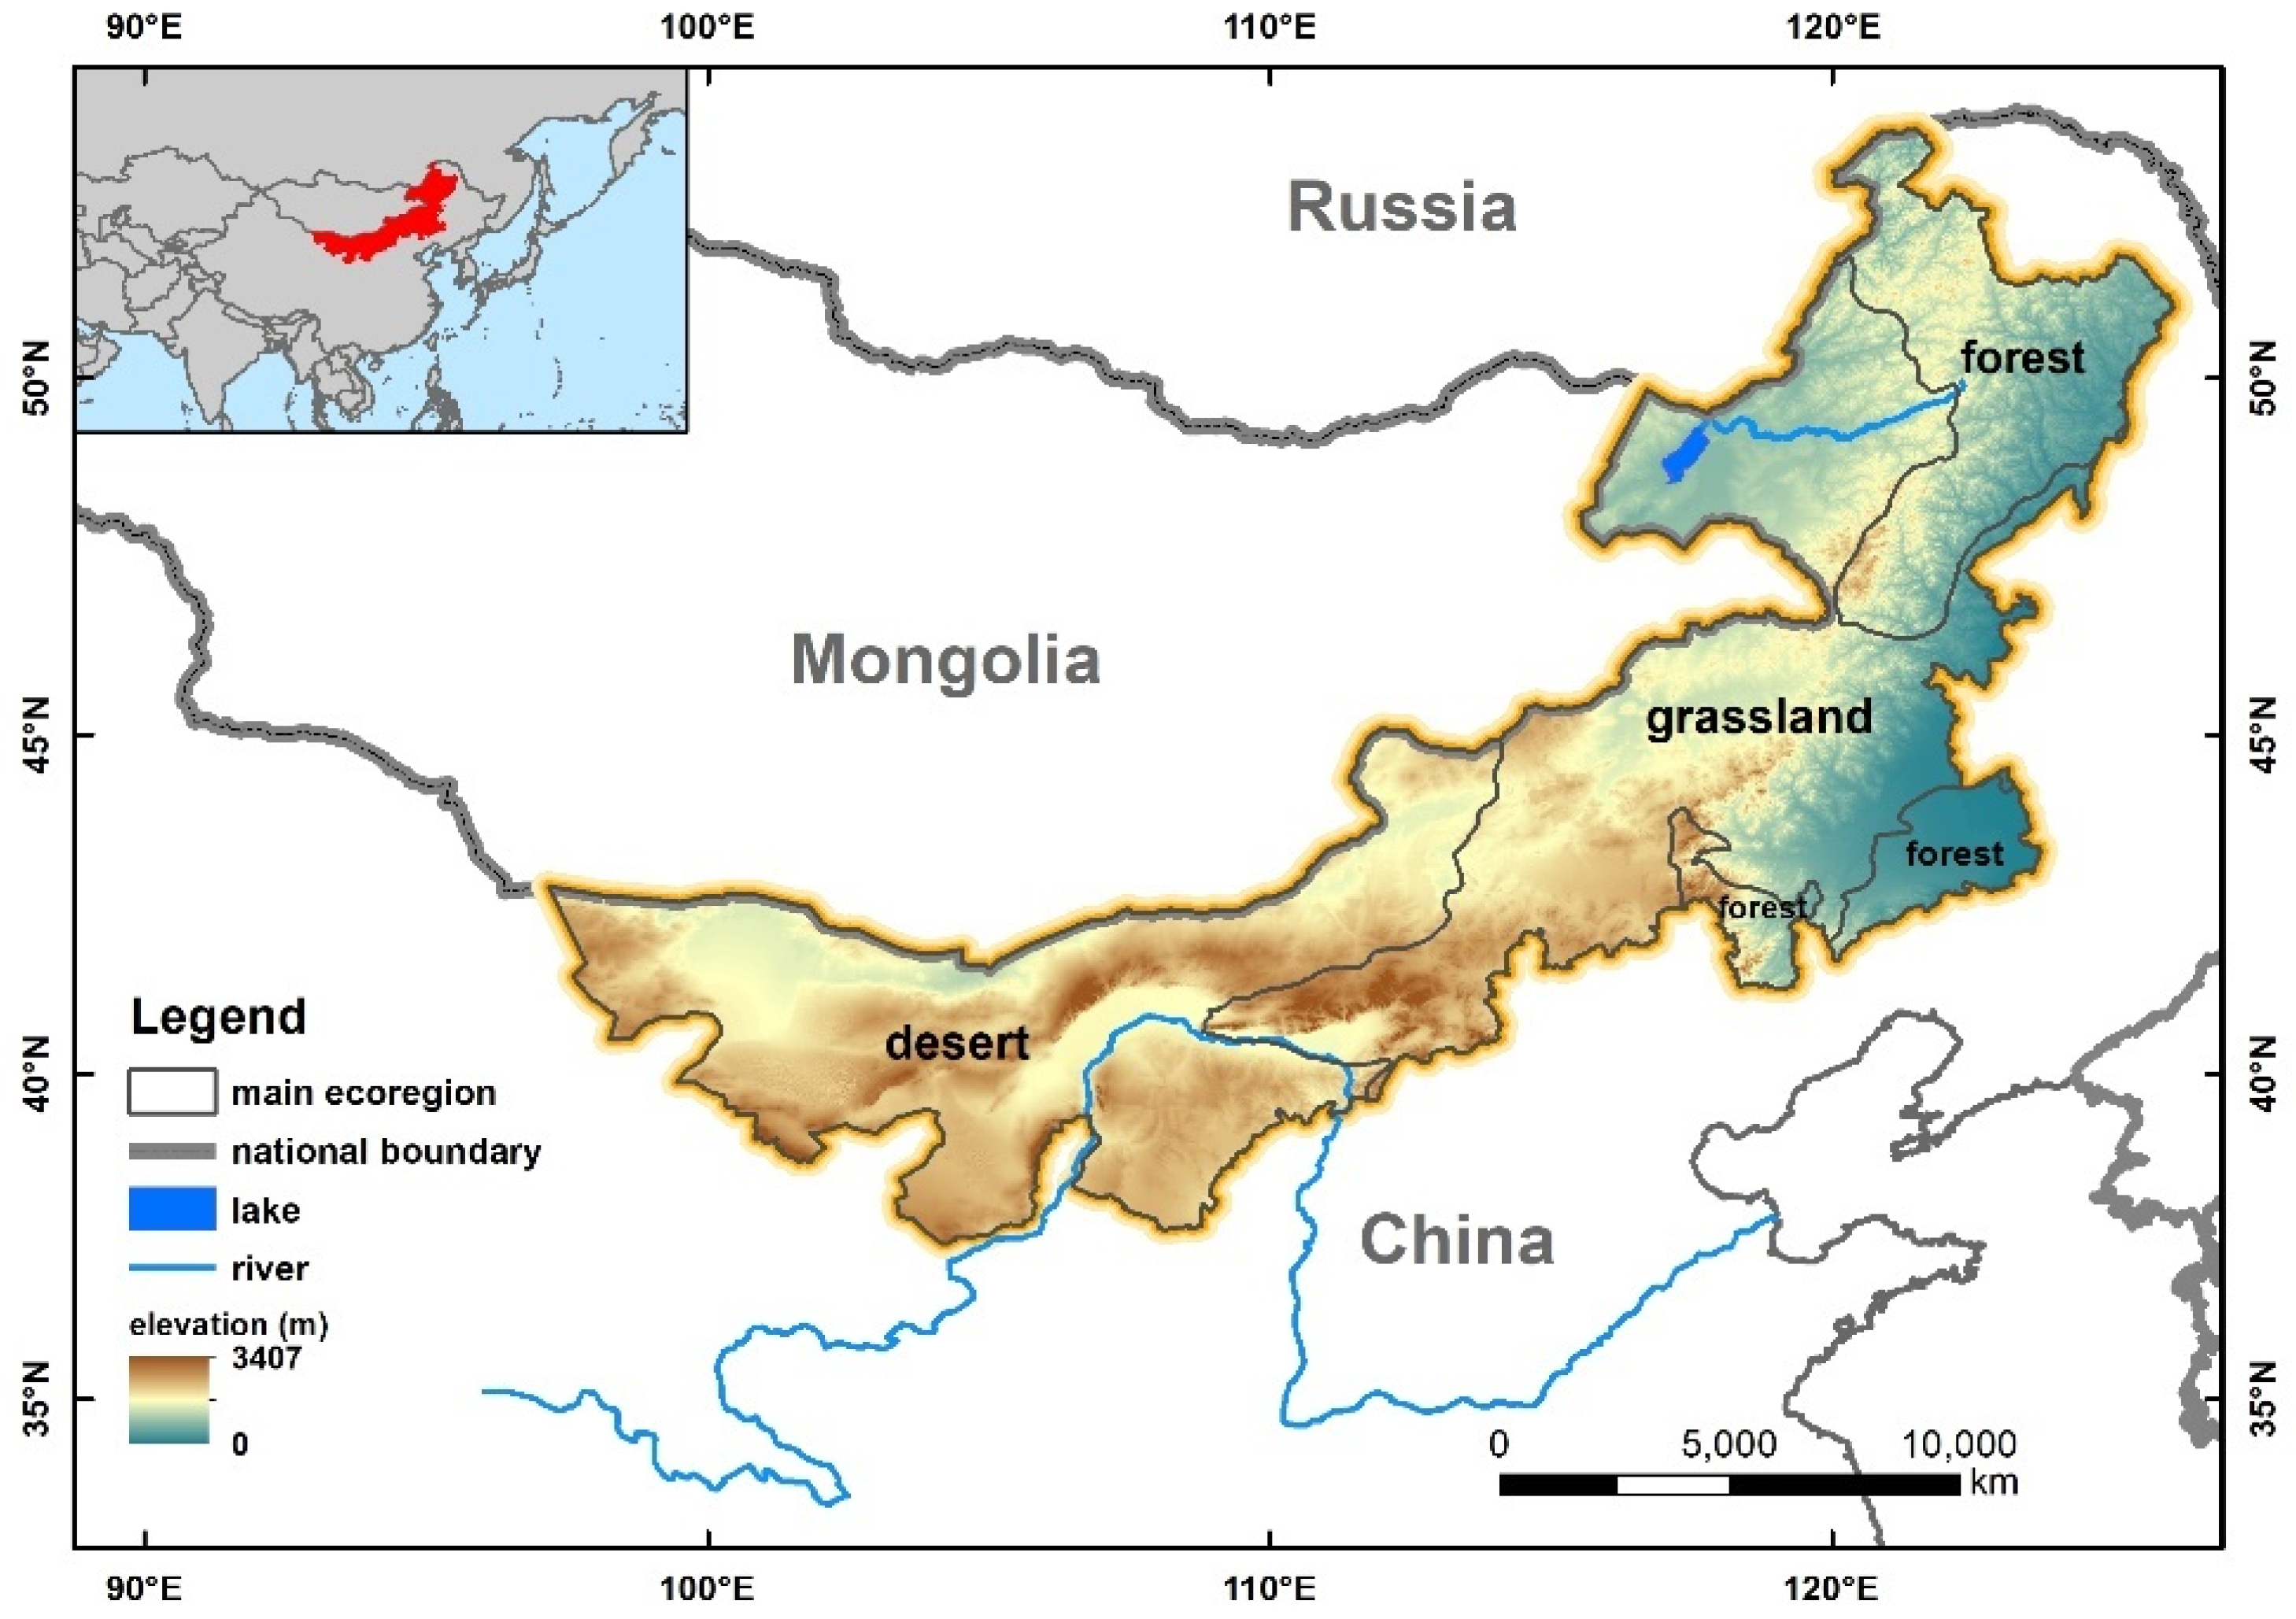
2.1. Study Area

Located in China’s northern frontier, Inner Mongolia (37°24′N–97°12′E and 53°23′N–126°04′E) is the third-largest province [34], accounting for 12% of China’s national territory (ca. 1.18 million km2). Inner Mongolia comprises a typically temperate continental monsoon climate, with relatively low precipitation ranging from 35 to 530 mm annually [35]. The climate transients from a semi-humid in the east to a semi-arid and arid in the middle and the west. Rising temperature and low precipitation coupled with high evapotranspiration lead to its lower vegetation biomass [36]. The region is divided into three main biomes, e.g., the wet forest in the northeast, the semi-arid and arid grassland in the center, and the arid desert in the west (Figure 1).

2.2. Datasets

2.2.1. GIMMS NDVI3g

The NDVI data from GIMMS (Global Inventory Modeling and Mapping Studies) group provides a radiometric measure of chlorophyll abundance and energy absorption of vegetation, with an 8km spatial resolution and a 15-day temporal resolution (downloaded from: https://ecocast.arc.nasa.gov/data/pub/gimms/3g.v1/, accessed on 7 May 2021) [37]. NDVI was calculated from the red (0.55–0.68 μm) and near-infrared (NIR; 0.73–1.1 μm) bands (NDVI = (NIR − Red)/(NIR + Red)) of AVHRR imageries [38]. Atmospheric effect and sensor factors influence the quality of the NDVI by mixing atmosphere-scattered and surface-reflected radiation into data recordings or overlapping an atmospheric water vapor absorption band [39,40,41]. The raw data has been thoroughly corrected for satellite orbital drift, unstable atmospheric conditions, such as clouds and aerosols, and noise in non-vegetated areas [42,43]. Throughout the whole time span, an assessment of the prevalence of valid data points (i.e., flag value zero) in Inner Mongolia ensured the availability of data. Compared with other products, GIMMS NDVI3g is featured with the longest temporal coverage of 35 years from 1982 to 2016 and the highest time consistency, which meets the need of monitoring long-term changes of vegetation in this research. This dataset has been proven to be effective for representing vegetation productivity and has been widely used in dynamic vegetation monitoring programs at regional and global scales [44,45].

2.2.2. GIMMS LAI3g

The GIMMS LAI3g dataset is generated from the combination of GIMMS NDVI3g, the Terra Moderate Resolution Imaging Spectroradiometer (MODIS) LAI, and the FPAR products using a trained neural network algorithm [46] (see: https://drive.google.com/open?id=0BwL88nwumpqYaFJmR2poS0d1ZDQ, accessed on 7 May 2021). It is consistent with GIMMS NDVI3g in its spatiotemporal resolutions (e.g., an 8 km spatial resolution and a 15-day temporal resolution). In particular, compared with NDVI, LAI is a readily described and interpreted variable (defined as the green leaf area on the ground) within an ecological context, while NDVI itself exclusively is a ratio of spectral reflectance [47]. In this sight, we added this information in characterizing vegetation dynamics, which could further increase the robustness and confidence of the vegetation growth detection.

2.3. Methods

Figure 2 shows the framework of the proposed method applied in this research. It includes two parts: (1) the extraction of vegetation greenness indicators and the further comparison of whether these indicators are consistent in characterizing the long-term trend of vegetation growth; if the characterization of multiple indicators in the linear analysis is consistent, we believe that these indicators can be robust to characterize the change of vegetation growth in Inner Mongolia; (2) then we add further consideration of a nonlinear change to detect the potential breakpoint.

2.3.1. Extracting the Seasonality Parameters of Vegetation Growth

NDVI/LAI integrals have been widely used in vegetation dynamics studies [48,49]. In this study, firstly, we smoothed the 15-days NDVI composites and interpolated them to a daily resolution (Figure S1, take NDVI as an example) using the Adaptive Savitzky-Golay filtering function [31]. The result can obtain the fitted functions to the upper envelope of vegetation data, which further reduces the uncertainties caused by the negatively biased noise of vegetation data and leads to more stable measures [50]. Then, 30% of the seasonal amplitude was applied to define the onset and the end of the growing season from individual years’ smoothed NDVI curve [51]. NDVI large integral (g + h in Figure S1) is the smoothed NDVI integral between the start and end of the growing season. NDVI small integral (i.e., g in Figure S1) is the large integral minus the area below the base level e (i.e., h in Figure S1). The median start and end of the growing season were applied in case of a failure to extract seasonality parameterization, respectively [52]. NDVI large integral is a proxy of the total vegetation productivity, whereas NDVI small integral represents productivity or the sum of the “greenness” within the growing season [31,51]. Note that pixels with mean annual NDVI lower than 0.1 were excluded from further analysis, as it is hard to extract correct seasonal indicators due to sparse vegetation or lack of conspicuous seasonal cycle [53]. LAI integrals are also calculated according to the process of Figure S1 and over pixels where NDVI data is available.

2.3.2. Detection of Breakpoints and Characterization of the Trend Shift

To detect and characterize the type of abrupt changes (i.e., breakpoints) in the NDVI/LAI integrals time series, the Breaks For Additive Season and Trend (BFAST) method was adopted. BFAST is constructed based on an iterative algorithm that includes two steps: 1) decomposing the time series into seasonal, trend, remainder components, and 2) detecting structural changes in both of the trend and seasonal components based on moving sums (MOSUMs) test [33]. Given the detection of a significant structural change, the associated breakpoint was estimated. BFAST enables the detection of trend shift within time series of vegetation index based on the assumption that the nonlinearity can be approximated by fitting piecewise linear model [32]. In this study, we only considered zero or one breakpoint existed in the influential trend shift. The trend shift could be classified into six types (Figure S2): (a) the monotonic increase (i.e., greening with a positive breakpoint), (b) the monotonic decrease (i.e., browning with a negative breakpoint), (c) the interruption increase (i.e., greening with setback), (d) the interruption decrease (i.e., browning with burst), the trend reversals (i.e., greening to browning or vice versa) [54]. Here, pixels with no substantial change (p < 0.05; MOSUMs test) detected (i.e., the monotonic changes with no breakpoints) were omitted [54]. After categorizing different combinations of the two segments before and after the breakpoint, the variation of a single segment may be significant, or the reverse. Therefore, to better understand whether vegetation greenness changes significantly over time in a single period, four significance types were used to characterize the significance of two segments of various combinations. Given that greenness change in vegetation is a long-term process, a major breakpoint occurring very early or late is not reasonable, since one of the two segments might solely reflect a short-lived process [54]. No breakpoints were detected before 1991 or after 2006 in our study.

3. Results

3.1. Linear Changes of NDVI/LAI Integrals

The annual mean trends of the NDVI/LAI integrals show that there was an overall greening trend and a consistent interannual variations direction for these indicators from 1982 to 2016 (Figure 3). To be specific, we found the averaged NDVI large integral of the vegetated area in Inner Mongolia increased by 3.26 (5.5%) from 1982 to 2016, with a rate of 0.96 per decade (p < 0.01; t-test) (Figure 3a), while the mean NDVI small integral increased by 5.85 (17%) in the same period, with a rate of 1.72 per decade (p < 0.01; t-test) (Figure 3b). Although the numerical range of LAI is different from NDVI, they could collectively represent the productive capacity and greenness of vegetation [55]. Here, we found the averaged large and small integral of LAI exhibited quite similar trends (Figure 3a,b), with increases of 2.23 (p < 0.05; t-test) and 3.13 (p < 0.01; t-test) per decades, respectively.
The spatial trends of large/small integrals derived from NDVI and LAI are roughly similar (Figure 4). As shown in Figure 4a, approximately 71% of the vegetated area exhibited an increasing trend in NDVI large integral during 1982–2016, 54% of which were statistically significant at p < 0.05 (t-test) (mainly located in the northeast and southwest of Inner Mongolia). The remaining vegetated area experienced a decreasing trend in NDVI large integral, and 33% of them were statistically significant (p < 0.05; t-test). The most obvious decreasing trend was mainly distributed in central and eastern Inner Mongolia. Compared with NDVI large integral, NDVI small integral is featured with relatively larger areas with greening trends, with increasing trends accounting for 82% of the vegetated area, while regions with significant changes accounted for 66% (Figure 4c). These regions were distributed in northeastern and southwestern Inner Mongolia while decreasing trends were minorly found in the eastern part of Inner Mongolia.
We find the spatial patterns of changes in LAI integrals are consistent with NDVI over most regions of Inner Mongolia, both for the large integral and small integral (Figure 4). Area with increasing LAI integrals accounted for 67% and 73% of the vegetated area, and around half of these areas were statistically significant (Figure 4b,d). However, although the spatial trend of NDVI/LAI integrals was similar for most regions, the opposite trends were minor, as in the northeastern part of Inner Mongolia, which was dominated by forest biomes.

3.2. The Non-Stationarity Characteristics of Vegetation Greenness

3.2.1. Breakpoints and Trends of NDVI/LAI Integrals

The breakpoints of NDVI’s large and small integral have roughly similar results (Figure 5a,c). About 37% (368,320 km2) and 39% (382,272 km2) of the vegetated area presented statistically significant (p < 0.05; MOSUMs test) breakpoints in NDVI large and small integrals respectively from 1982 to 2016. In terms of the timing of breakpoints, we found that breakpoints that occurred after 1999 were the dominant ones (Figure 6a). The number of breakpoints of LI and SI derived from NDVI after 1999 accounted for 78.1% and 79.1% of the pixels with breakpoints respectively (the histograms in Figure 5a,c), and the breakpoints were distributed in all vegetated areas, especially in the eastern and central parts of Inner Mongolia. After 1999, the occurrence and frequency of breakpoints increased significantly and remained relatively stable, and reached a peak in 2005, mainly distributed in the eastern and central grassland of Inner Mongolia. This suggests that vegetation activity in this region has become more susceptible to external disturbance (i.e., natural, or man-made influences) in recent years than in earlier periods when vegetation regimes were relatively stable. Consistently, we found that LAI integrals showed roughly similar results to NDVI integrals towards the timing of breakpoint (Figure 5b,d).
In general, the spatial distribution of the detected breakpoints is featured with a certain aggregation. Breakpoints extensively occurred between 1999 and 2002, which were notably observed in forest biomes distributed in the southeast of Inner Mongolia (Figure 6a) while the breakpoints that occurred mainly in forest biomes distributed in the northeast of Inner Mongolia were later than 2002 (Figure 5). For grassland biomes in central Inner Mongolia, the most prevalent shifts occurred in the latest period (after 2002), with the most breakpoints occurring in 2005–2006. The breakpoints of desert biomes in western Inner Mongolia mainly occurred after 1999, and the proportion of the breakpoints in each period to all the breakpoints of the biome was roughly identical to that of the grassland.
Based on detected breakpoints, we calculated the trend of NDVI/LAI integrals in two periods to detect the existence of abrupt change in vegetation greenness. As shown in Figure S3a–d, in the period before the breakpoint, a considerable number of vegetation browning areas were consistently detected in all indicators (NDVI large/small integrals accounted for 24.8% and 22.7% respectively, and LAI large/small integrals accounted for 21.2% and 22.4% respectively), mainly in eastern and western regions of Inner Mongolia (i.e., grassland and desert biomes), while the vegetation greening is common in the northeast of Inner Mongolia (i.e., forest biomes). In comparison, after the breakpoint (Figure S3e–h), the browning area of grassland and desert biomes decreased conspicuously, while the browning area of forest biome in northeast Inner Mongolia increased (i.e., the greening trend is reversed or stalled). In the period after the breakpoint that occurred after 1999, the area of vegetation greening increased, and finally, a noticeable total greening was observed after 2006 (the latest breakpoint) in Inner Mongolia. Both before and after the breakpoints, LI and SI derived from NDVI and LAI showed almost identical spatial patterns in terms of variation in the trend of vegetation greenness.

3.2.2. Characteristics of Trend Shifts in Vegetation Greening

Overall, the four indicators consistently show that vegetation greening is the main type of change in Inner Mongolia (Figure 7). According to the NDVI large integral, about 37% of vegetated areas detected statistically significant breakpoints, of which the dominant types of breakpoints were “interrupted increase” (i.e., greening with setback), accounted for 58.2% of the whole pixels with breakpoints in NDVI large integral and mainly distributed in the three main biomes in Inner Mongolia (Figure 6b). The second-largest type was “positive reversal” (i.e., browning to greening; 20.3%), mainly distributed in the east and west of Inner Mongolia. Another substantial part of the greening trends recently changed into browning in north Inner Mongolia (i.e., negative reversal; 14.4%), but it still reflects the early period of greening. Besides, “monotonic increase/decrease” and “interruption decrease” show minor changes (3.4%, 0.2%, and 3.5% respectively), indicating that most regions of Inner Mongolia were more likely to experience a setback or a reversal in vegetation growth despite the overall greening trends.
LAI integrals and NDVI small integral (Figure 7b–d) follow a similar spatial pattern as NDVI large Integral. Compared with the NDVI/LAI large integrals, a more greening area is found by the NDVI/LAI small integrals. Noticeably, by comparing with the results under the simple linear trend (Figure 4 in Section 3.1), the results obtained under the breakpoint detection analysis were not consistent, which implied that these relatively short-term changes may be masked by a long-term linear trend. According to the linear analysis, the vegetation browning area experienced in the eastern part of Inner Mongolia (Figure 4) was found reversed towards the direction of greening by the nonlinear analysis (Figure 7). However, partial areas in north Inner Mongolia were changing from greening to browning (Figure 7).

3.2.3. Spatial Pattern of Significance of Trend Shift

NDVI/LAI integrals have relatively consistent results in the spatial pattern of trend significance types, although there is a mixed phenomenon of various types in many areas (Figure 8). Taken together, almost all pixels that detect breakpoints contain significant trends for at least one segment. Moreover, for the case with only one of the two periods showing a significant change in large and small integrals derived from the two vegetation indices, the second period (after the break) shows more frequent and significant changes (NDVI large and small integrals accounted for 37.2% and 46.8%, LAI large and small integrals accounted for 42.2% and 49.1% respectively) and the spatial distribution of such characteristics has a certain agglomeration (i.e., hotspots), which is mainly distributed in the grassland biome of eastern Inner Mongolia. These regions were mainly characterized by “positive reversal” (browning to greening) and by a mixture of “interruption increase” (greening with setbacks) respectively and coincided with greening in the second period. This means that the area has been affected by external factors after the breakpoint, which makes the grassland growth condition significantly improved to some extent. The forest biomes in northern Inner Mongolia were found to be changing from greening to browning, but this change was not obvious from the significance of the change in this area, that is, the decrease of vegetation greenness was slight under the influence of external factors including recent warming and increased human interventions. In comparison, the forest biomes in southeastern Inner Mongolia showed significant changes in two segments before and after the breakpoint. The main characteristics of the trend shift in this area were “Interruption increase” (Figure 7). Moreover, the breakpoint was detected in this region around the year 2000 (Figure 5). This difference implies that there are variable ecological indications of the response of similar biomes to external disturbances.

4. Discussion

We quantified the vegetation greenness trends for three biomes (grassland, forest, desert) in Inner Mongolia using NDVI/LAI integrals during the period 1982–2016. The results of these integrals consistently revealed that the vegetation experienced an overall greening process over this period, which is in line with the greening trend of global vegetation growth [56,57]. As inferred from the previous studies, NDVI large/small integrals have also been widely used in the estimation of biomass and other vegetation studies [58,59]. Besides, satellite-derived LAI datasets have also served as key indices for monitoring terrestrial vegetation growth at regional and global scales [47]. Therefore, to reduce the uncertainty in our estimation of vegetation greenness, NDVI and LAI were selected to jointly assess the long-term trend of vegetation growth in Inner Mongolia. Our results suggested that NDVI and LAI have a little difference in reflecting the long-term trend of vegetation growth, which increases the reliability of the results.
Additionally, in our study, the increase of vegetation greenness over the 35 years was basically consistent with previous regional-scale studies [60,61,62]. Compared with the estimation from Piao et al. [23], our results show fewer vegetation browning areas in Inner Mongolia. In their research, growing season LAI decreased significantly in northeastern Inner Mongolia. Such discrepancy may become less apparent if the study period is close because the differences in trend estimation across studies were partly related to the study period or time interval [14]. In addition to that, recent studies also reported an overall greening trend in Inner Mongolia since 2000 [63]. Moreover, the different definitions of vegetation growing season are also the possible reasons for such differences. Previous studies usually fixed the growing season when quantifying the annual vegetation greenness [64], which is different from the relative threshold we used to determine the growing season; thus, the results can reflect the influence of the length of the growing season. Recent studies on vegetation phenology in Inner Mongolia also show that the significant advancement in the onset of spring plant emergence increased the length of the growing season [65], which in turn can lead to an increase in vegetation greenness.
Global lands have been greening since the 1980s under the context of climatic warming [22,57], meanwhile, global vegetation phenology has undergone significant changes in the past three decades [21]. While the greening trend is clear on a global scale, its regional difference is still debatable. Inner Mongolia has experienced significant warming in recent decades, and the widely distributed temperate steppe is sensitive to climate change [66]. Besides, the forest protection policy in China (e.g., ecological restoration projects) has undergone rapid and extensive changes since the 2000s. For example, the “Three-North” shelterbelt projects established in 1978 are conducted to control the sand and wind erosion, to improve the quality of the ecological environment, and to produce multiple forest products until 2050 [67]. Inner Mongolia belongs to one of the key provinces in China executing these restoration projects. As a result, the annual desertification land area decreased by 3211km2 from 1999 to 2004 and by 934km2 from 2004 to 2009, respectively [68]. Another related research by Tian et al. [69] also showed a 15.38% significant increase of NDVI in Inner Mongolia from 2000 to 2012, of which 5.67% was influenced by ecological restoration programs. For up to 35 years, our study assumed that the reversal in vegetation greenness and the ecological indication of Inner Mongolia due to climate change and human intervention may be masked by linear analysis. A similar conclusion has been made by Iler et al. [15], who argued that the linear trend of long-term vegetation data can mask substantial variation in vegetation phenology through time. Thus, changes in vegetation greenness may be better characterized by separating the time series into individual segments and capturing specific vegetation dynamics through time. Since a monotonicity-assumption may overlook a possible interruption or cause the average out of two trend segments with a significant change in the opposition direction, in turn, resulting in stable qualification or relatively low variation [54,70]. It should be noted that there are little researches being carried out on nonlinear changes in vegetation growth in Inner Mongolia. Ding et al. [19] used a polynomial fitting method to detect nonlinear changes in vegetation in East Inner Mongolia, which provide preliminary insights into the land degradation and recovery process in this ecologically vulnerable area, but still has the limitation of not being able to determine the exact timing of the occurrence of breakpoints. While in this study, the application of the BFAST algorithm has played a robust and auxiliary role, and the results have revealed the temporal and spatial variation in the characteristics of vegetation greenness over the past 35 years could compensate for the existence of the gap in the characteristics of non-stationary changes of vegetation greenness in Inner Mongolia.
Based on the distribution of the times when the breakpoints occurred, we observed an obvious increase in the frequency of breakpoints, especially after 1999 (Figure 6a), which suggests that the stable vegetation dynamics of the early period (before 1999) were increasingly sensitive to external disturbances. Moreover, we compared the ESA-CCI land cover (version 2.0.7 available at http://maps.elie.ucl.ac.be/CCI/viewer/, accessed on 7 May 2021) map between the years 1999 and 2002 (Figure S4), where our results delivered no obvious changes in land cover. In other words, land cover change in Inner Mongolia may not be the primary reason for the detected breakpoints. The detected breakpoints, therefore, are likely to tie in with the worst consecutive summer drought-dzud of the last 50 years on the Mongolian plateau, which occurred between 1999 and 2002 [71]. The NDVI/LAI integrals indicate that the overall consistent regime of vegetation greening (Figure 7), but the setbacks and reversals (especially in the second segment) were difficult to be captured and even ignored by linear analysis. This implied that the complexity of vegetation greenness dynamics has increased. Before the breakpoint, a considerable part of the NDVI/LAI integrals trend decreased, mainly located in the eastern and western regions of Inner Mongolia, while after the breakpoint, these browning areas significantly decreased and reversed to greening (Figure S3). The opposite shift occurred partially in the northeast region of Inner Mongolia, that is, the greening stalled or even reversed, although the process was not significant (p < 0.05) (Figure 8). Unlike the greening reversal of the northern forest, a continuous greening process was detected in the forest area located in the southeastern part of Inner Mongolia, where large-scale afforestation was carried out under the Three Norths program [69,72]. Thus, the causes of different variations in similar vegetation areas at a regional scale may be more attributable to human factors. Apart from the disturbance from altered climatic impacts and human intervention, trend shifts may also be induced by data artifacts, such as differences between AVHRR-2 and AVHRR-3 or by NOAA platform changes [73]. However, related research from de Jong et al. [54] did not find a clear relationship with AVHRR sensor changes, and there is a sound foundation to assume that such events have been effectively corrected [42,74].
The reliable detection and attribution of changes in vegetation greenness are imperative to our understanding of the scientific basis of global change [75]. The response of regional vegetation greenness to climate change and anthropogenic activities is a complicated process for researchers. The current study starts from observation and reveals actual dynamics recorded by satellite to explore how and when vegetation greenness changes under external disturbance, providing a more sophisticated insight into the way vegetation greenness has varied during the past three decades. However, there is no detailed inquiry into the drivers that accompany these changes. Previous studies have greatly improved understanding of the response of vegetation to climate change (e.g., temperature, precipitation, and potential evapotranspiration) and anthropogenic disturbance (e.g., land use/cover change and grazing intensity) in Inner Mongolia [62,76]. Thus, further research is needed to determine the causal relationship between detected trend changes and these drivers.

5. Conclusions

In this study, we combined NDVI and LAI integrals derived from the remotely-sensed datasets to explore the spatiotemporal patterns in vegetation greenness changes over Inner Mongolia from 1982 to 2016. The results showed that NDVI/LAI integrals have an acceptable level of consistency in characterizing the long-term trends of vegetation greenness in Inner Mongolia. The increasing (greening) trend in annual mean NDVI/LAI integrals was observed in most areas and decreasing (browning) partially in locations of East Inner Mongolia. The increasing number of breakpoints indicates that the areas of vegetation greenness changes have conspicuously elevated under the influence of external disturbances such as altered climatic impact and anthropogenic intervention implying that the stable vegetation growth pattern is more sensitive to these external disturbances. The observed six types of trend shifts in our study turned out to be the limited steady process associated with greening and strongly reflects a setback or reversal in the vegetation greening in the region. The vegetation browning experienced before the breakpoint was found to be shifting towards greening after the breakpoint since 1999. We emphasize the need to apply a trend shift detection algorithm to the analysis of vegetation growth change in long time series, since the stable trend obtained from the linear analysis may mask hidden trend shifts.

Supplementary Materials

The following are available online at https://www.mdpi.com/article/10.3390/rs13132446/s1, Figure S1: The calculation process of NDVI (large/small) integrals. Figure S2: Examples of six trend shifts based on NDVI large integral. Figure S3: Spatial distribution of trends before and after the breakpoints. Figure S4: Land cover map provided by ESA-CCI. (a) Land cover in 1999. (b) Land cover in 2002.

Author Contributions

Conceptualization, X.Z. and L.M.; methodology, H.Z. and L.M.; supervision, L.M.; writing—original draft, H.Z., X.Z., Y.S., and L.M.; writing—review and editing, Y.S. and G.K. All authors have read and agreed to the published version of the manuscript.

Funding

This work was financially supported by the Open Fund of State Key Laboratory of Remote Sensing Science (OFSLRSS202001).

Data Availability Statement

All data resources are provided in the manuscript with links.

Conflicts of Interest

The authors declare no conflict of interest.

References

  1. Pakeman, R.J.; Fielding, D.A.; Everts, L.; Littlewood, N.A. Long-term impacts of changed grazing regimes on the vegetation of heterogeneous upland grasslands. J. Appl. Ecol. 2019, 56, 1794–1805. [Google Scholar] [CrossRef]
  2. Tang, G.; Carroll, R.W.H.; Lutz, A.; Sun, L. Regulation of precipitation-associated vegetation dynamics on catchment water balance in a semiarid and arid mountainous watershed. Ecohydrology 2016, 9, 1248–1262. [Google Scholar] [CrossRef]
  3. Pachauri, R.K.; Allen, M.R.; Barros, V.R.; Broome, J.; Cramer, W.; Christ, R.; Church, J.A.; Clarke, L.; Dahe, Q.; Dasgupta, P. Climate Change 2014: Synthesis Report; Contribution of Working Groups I, II and III to the fifth assessment report of the Intergovernmental Panel on Climate Change; IPCC: Geneva, Switzerland, 2014. [Google Scholar]
  4. Liu, W.; Wang, G.; Yu, M.; Chen, H.; Jiang, Y.; Yang, M.; Shi, Y. Projecting the future vegetation–climate system over East Asia and its RCP-dependence. Clim. Dyn. 2020, 55, 2725–2742. [Google Scholar] [CrossRef]
  5. Miao, L.; Ye, P.; He, B.; Chen, L.; Cui, X. Future Climate Impact on the Desertification in the Dry Land Asia Using AVHRR GIMMS NDVI3g Data. Remote Sens. 2015, 7, 3863–3877. [Google Scholar] [CrossRef] [Green Version]
  6. Williams, C.A.; Albertson, J.D. Dynamical effects of the statistical structure of annual rainfall on dryland vegetation. Glob. Chang. Biol. 2006, 12, 777–792. [Google Scholar] [CrossRef]
  7. Lucht, W.; Prentice, I.C.; Myneni, R.B.; Sitch, S.; Friedlingstein, P.; Cramer, W.; Bousquet, P.; Buermann, W.; Smith, B. Climatic control of the high-latitude vegetation greening trend and Pinatubo effect. Science 2002, 296, 1687–1689. [Google Scholar] [CrossRef] [PubMed] [Green Version]
  8. Lü, Y.; Zhang, L.; Feng, X.; Zeng, Y.; Fu, B.; Yao, X.; Li, J.; Wu, B. Recent ecological transitions in China: Greening, browning and influential factors. Sci. Rep. 2015, 5, 8732. [Google Scholar] [CrossRef] [PubMed]
  9. Tong, X.; Brandt, M.; Yue, Y.; Ciais, P.; Jepsen, M.R.; Penuelas, J.; Wigneron, J.P.; Xiao, X.; Song, X.P.; Horion, S. Forest management in southern China generates short term extensive carbon sequestration. Nat. Commun. 2020, 11, 129. [Google Scholar] [CrossRef]
  10. Zhang, W.; Brandt, M.; Penuelas, J.; Guichard, F.; Tong, X.; Tian, F.; Fensholt, R. Ecosystem structural changes controlled by altered rainfall climatology in tropical savannas. Nat. Commun. 2019, 10, 671. [Google Scholar] [CrossRef] [PubMed]
  11. Zhang, Q.; Kong, D.; Shi, P.; Singh, V.P.; Sun, P. Vegetation phenology on the Qinghai-Tibetan Plateau and its response to climate change (1982–2013). Agric. For. Meteorol. 2018, 248, 408–417. [Google Scholar] [CrossRef]
  12. Li, Y.; Zhang, Y.; Gu, F.; Liu, S. Discrepancies in vegetation phenology trends and shift patterns in different climatic zones in middle and eastern Eurasia between 1982 and 2015. Ecol. Evol. 2019, 9, 8664–8675. [Google Scholar] [CrossRef] [Green Version]
  13. Gim, H.J.; Ho, C.H.; Jeong, S.; Kim, J.; Feng, S.; Hayes, M.J. Improved mapping and change detection of the start of the crop growing season in the US Corn Belt from long-term AVHRR NDVI. Agric. For. Meteorol. 2020, 294, 108143. [Google Scholar] [CrossRef]
  14. Fu, Y.H.; Piao, S.; Ciais, P.; Huang, M.; Menzel, A.; Peaucelle, M.; Peng, S.; Song, Y.; Vitasse, Y.; Zeng, Z.; et al. Long-term linear trends mask phenological shifts. Int. J. Biometeorol. 2016, 60, 1611–1613. [Google Scholar] [CrossRef] [Green Version]
  15. Iler, A.M.; Hoye, T.T.; Inouye, D.W.; Schmidt, N.M. Long-term trends mask variation in the direction and magnitude of short-term phenological shifts. Am. J. Bot. 2013, 100, 1398–1406. [Google Scholar] [CrossRef] [PubMed] [Green Version]
  16. Nemani, R.R.; Keeling, C.D.; Hashimoto, H.; Jolly, W.M.; Piper, S.C.; Tucker, C.J.; Myneni, R.B.; Running, S.W. Climate-driven increases in global terrestrial net primary production from 1982 to 1999. Science 2003, 300, 1560–1563. [Google Scholar] [CrossRef] [Green Version]
  17. England, M.H.; McGregor, S.; Spence, P.; Meehl, G.A.; Timmermann, A.; Cai, W.; Gupta, A.S.; McPhaden, M.J.; Purich, A.; Santoso, A. Recent intensification of wind-driven circulation in the Pacific and the ongoing warming hiatus. Nat. Clim. Chang. 2014, 4, 222–227. [Google Scholar] [CrossRef]
  18. Feng, Y.; Zhu, J.; Zhao, X.; Tang, Z.; Zhu, J.; Fang, J. Changes in the trends of vegetation net primary productivity in China between 1982 and 2015. Environ. Res. Lett. 2019, 14, 124009. [Google Scholar] [CrossRef]
  19. Ding, C.; Huang, W.; Li, Y.; Zhao, S.; Huang, F. Nonlinear Changes in Dryland Vegetation Greenness over East Inner Mongolia, China, in Recent Years from Satellite Time Series. Sensors 2020, 20, 3839. [Google Scholar] [CrossRef]
  20. Peters, D.; Havstad, K. Nonlinear dynamics in arid and semi-arid systems: Interactions among drivers and processes across scales. J. Arid Environ. 2006, 65, 196–206. [Google Scholar] [CrossRef]
  21. Buitenwerf, R.; Rose, L.; Higgins, S.I. Three decades of multi-dimensional change in global leaf phenology. Nat. Clim. Chang. 2015, 5, 364–368. [Google Scholar] [CrossRef]
  22. Zhu, Z.; Piao, S.; Myneni, R.B.; Huang, M.; Zeng, Z.; Canadell, J.G.; Ciais, P.; Sitch, S.; Friedlingstein, P.; Arneth, A. Greening of the Earth and its drivers. Nat. Clim. Chang. 2016, 6, 791–795. [Google Scholar] [CrossRef]
  23. Piao, S.; Yin, G.; Tan, J.; Cheng, L.; Huang, M.; Li, Y.; Liu, R.; Mao, J.; Myneni, R.B.; Peng, S.; et al. Detection and attribution of vegetation greening trend in China over the last 30 years. Glob. Chang. Biol. 2015, 21, 1601–1609. [Google Scholar] [CrossRef] [PubMed]
  24. Pan, N.; Feng, X.; Fu, B.; Wang, S.; Ji, F.; Pan, S. Increasing global vegetation browning hidden in overall vegetation greening: Insights from time-varying trends. Remote Sens. Environ. 2018, 214, 59–72. [Google Scholar] [CrossRef]
  25. Zhao, M.; Running, S.W. Drought-induced reduction in global terrestrial net primary production from 2000 through 2009. Science 2010, 329, 940–943. [Google Scholar] [CrossRef] [PubMed] [Green Version]
  26. Feng, X.; Fu, B.; Piao, S.; Wang, S.; Ciais, P.; Zeng, Z.; Lü, Y.; Zeng, Y.; Li, Y.; Jiang, X.; et al. Revegetation in China’s Loess Plateau is approaching sustainable water resource limits. Nat. Clim. Chang. 2016, 6, 1019–1022. [Google Scholar] [CrossRef]
  27. Hu, Q.; Pan, F.; Pan, X.; Zhang, D.; Li, Q.; Pan, Z.; Wei, Y. Spatial analysis of climate change in Inner Mongolia during 1961–2012, China. Appl. Geogr. 2015, 60, 254–260. [Google Scholar] [CrossRef]
  28. Wang, Y.; Liu, G.; Guo, E. Spatial distribution and temporal variation of drought in Inner Mongolia during 1901–2014 using Standardized Precipitation Evapotranspiration Index. Sci. Total Environ. 2019, 654, 850–862. [Google Scholar] [CrossRef]
  29. John, R.; Chen, J.; Ou Yang, Z.T.; Xiao, J.; Becker, R.; Samanta, A.; Ganguly, S.; Yuan, W.; Batkhishig, O. Vegetation response to extreme climate events on the Mongolian Plateau from 2000 to 2010. Environ. Res. Lett. 2013, 8, 035033. [Google Scholar] [CrossRef]
  30. Miao, L.; Sun, Z.; Ren, Y.; Schierhorn, F.; Müller, D. Grassland greening on the Mongolian Plateau despite higher grazing intensity. Land Degrad. Dev. 2021, 32, 792–802. [Google Scholar] [CrossRef]
  31. Jönsson, P.; Eklundh, L. TIMESAT—A program for analyzing time-series of satellite sensor data. Comput. Geosci. 2004, 30, 833–845. [Google Scholar] [CrossRef] [Green Version]
  32. Jong, R.; Verbesselt, J.; Schaepman, M.E.; Bruin, S. Trend changes in global greening and browning: Contribution of short-term trends to longer-term change. Glob. Chang. Biol. 2012, 18, 642–655. [Google Scholar] [CrossRef]
  33. Verbesselt, J.; Hyndman, R.; Newnham, G.; Culvenor, D. Detecting trend and seasonal changes in satellite image time series. Remote Sens. Environ. 2010, 114, 106–115. [Google Scholar] [CrossRef]
  34. Han, J.; Mol, A.P.; Lu, Y.; Zhang, L. Onshore wind power development in China: Challenges behind a successful story. Energy Policy 2009, 37, 2941–2951. [Google Scholar] [CrossRef]
  35. Chen, X.; Wang, H. Spatial and temporal variations of vegetation belts and vegetation cover degrees in Inner Mongolia from 1982 to 2003. Acta Geogr. Sin. 2009, 64, 84–94. [Google Scholar] [CrossRef]
  36. Miao, L.; Muller, D.; Cui, X.; Ma, M. Changes in vegetation phenology on the Mongolian Plateau and their climatic determinants. PLoS ONE 2017, 12, e0190313. [Google Scholar] [CrossRef] [Green Version]
  37. Pinzon, J.E.; Tucker, C.J. A non-stationary 1981–2012 AVHRR NDVI3g time series. Remote Sens. 2014, 6, 6929–6960. [Google Scholar] [CrossRef] [Green Version]
  38. Tucker, C.J. Red and photographic infrared linear combinations for monitoring vegetation. Remote Sens. Environ. 1979, 8, 127–150. [Google Scholar] [CrossRef] [Green Version]
  39. Huang, S.; Tang, L.; Hupy, J.P.; Wang, Y.; Shao, G. A commentary review on the use of normalized difference vegetation index (NDVI) in the era of popular remote sensing. J. For. Res. 2021, 32, 1–6. [Google Scholar] [CrossRef]
  40. Fensholt, R.; Rasmussen, K.; Nielsen, T.T.; Mbow, C. Evaluation of earth observation based long term vegetation trends—Intercomparing NDVI time series trend analysis consistency of Sahel from AVHRR GIMMS, Terra MODIS and SPOT VGT data. Remote Sens. Environ. 2009, 113, 1886–1898. [Google Scholar] [CrossRef]
  41. Cihlar, J.; Tcherednichenko, I.; Latifovic, R.; Li, Z.; Chen, J. Impact of variable atmospheric water vapor content on AVHRR data corrections over land. IEEE Trans. Geosci. Remote Sens. 2001, 39, 173–180. [Google Scholar] [CrossRef]
  42. Tucker, C.J.; Pinzon, J.E.; Brown, M.E.; Slayback, D.A.; Pak, E.W.; Mahoney, R.; Vermote, E.F.; EI Saleous, N. An extended AVHRR 8-km NDVI dataset compatible with MODIS and SPOT vegetation NDVI data. J. Remote Sens. 2005, 26, 4485–4498. [Google Scholar] [CrossRef]
  43. Pizon, J.; Brown, M.E.; Tucker, C.J. Satellite time series correction of orbital drift artifacts using empirical mode decomposition. Hilbert-Huang Transform Introd. Appl. 2005, 167–186. Available online: https://www.scienceopen.com/document?vid=96208531-4d98-43e5-85e8-3980ba573dbe (accessed on 7 May 2021).
  44. Tian, F.; Fensholt, R.; Verbesselt, J.; Grogan, K.; Horion, S.; Wang, Y. Evaluating temporal consistency of long-term global NDVI datasets for trend analysis. Remote Sens. Environ. 2015, 163, 326–340. [Google Scholar] [CrossRef]
  45. Beck, H.E.; McVicar, T.R.; van Dijk, A.I.; Schellekens, J.; de Jeu, R.A.; Bruijnzeel, L.A. Global evaluation of four AVHRR–NDVI data sets: Intercomparison and assessment against Landsat imagery. Remote Sens. Environ. 2011, 115, 2547–2563. [Google Scholar] [CrossRef]
  46. Zhu, Z.; Bi, J.; Pan, Y.; Ganguly, S.; Anav, A.; Xu, L.; Samanta, A.; Piao, S.; Nemani, R.R.; Myneni, R.B. Global Data Sets of Vegetation Leaf Area Index (LAI)3g and Fraction of Photosynthetically Active Radiation (FPAR)3g Derived from Global Inventory Modeling and Mapping Studies (GIMMS) Normalized Difference Vegetation Index (NDVI3g) for the Period 1981 to 2011. Remote Sens. 2013, 5, 927–948. [Google Scholar] [CrossRef] [Green Version]
  47. Cook, B.; Pau, S. A Global Assessment of Long-Term Greening and Browning Trends in Pasture Lands Using the GIMMS LAI3g Dataset. Remote Sens. 2013, 5, 2492–2512. [Google Scholar] [CrossRef] [Green Version]
  48. Davis, C.L.; Hoffman, M.T.; Roberts, W. Long-term trends in vegetation phenology and productivity over Namaqualand using the GIMMS AVHRR NDVI3g data from 1982 to 2011. S. Afr. J. Bot. 2017, 111, 76–85. [Google Scholar] [CrossRef]
  49. Tian, F.; Brandt, M.; Liu, Y.Y.; Verger, A.; Tagesson, T.; Diouf, A.A.; Samanta, A.; Piao, S.; Nemani, R.R.; Myneni, R.B. Remote sensing of vegetation dynamics in drylands: Evaluating vegetation optical depth (VOD) using AVHRR NDVI and in situ green biomass data over West African Sahel. Remote Sens. Environ. 2016, 177, 265–276. [Google Scholar] [CrossRef] [Green Version]
  50. Eklundh, L.; Jönsson, P. TIMESAT 3.1 Software Manual; Lund University: Lund, Sweden, 2012; pp. 1–82. [Google Scholar]
  51. Fensholt, R.; Rasmussen, K.; Kaspersen, P.; Huber, S.; Horion, S.; Swinnen, E. Assessing Land Degradation/Recovery in the African Sahel from Long-Term Earth Observation Based Primary Productivity and Precipitation Relationships. Remote Sens. 2013, 5, 664–686. [Google Scholar] [CrossRef] [Green Version]
  52. Horion, S.; Prishchepov, A.V.; Verbesselt, J.; de Beurs, K.; Tagesson, T.; Fensholt, R. Revealing turning points in ecosystem functioning over the Northern Eurasian agricultural frontier. Glob. Chang. Biol. 2016, 22, 2801–2817. [Google Scholar] [CrossRef]
  53. Zhou, L.; Tucker, C.J.; Kaufmann, R.K.; Slayback, D.; Shabanov, N.V.; Myneni, R.B. Variations in northern vegetation activity inferred from satellite data of vegetation index during 1981 to 1999. J. Geophys. Res. Atmos. 2001, 106, 20069–20083. [Google Scholar] [CrossRef]
  54. De Jong, R.; Verbesselt, J.; Zeileis, A.; Schaepman, M. Shifts in Global Vegetation Activity Trends. Remote Sens. 2013, 5, 1117–1133. [Google Scholar] [CrossRef] [Green Version]
  55. Buitenwerf, R.; Sandel, B.; Normand, S.; Mimet, A.; Svenning, J.C. Land surface greening suggests vigorous woody regrowth throughout European semi-natural vegetation. Glob. Chang. Biol. 2018, 24, 5789–5801. [Google Scholar] [CrossRef] [Green Version]
  56. De Jong, R.; de Bruin, S.; de Wit, A.; Schaepman, M.E.; Dent, D.L. Analysis of monotonic greening and browning trends from global NDVI time-series. Remote Sens. Environ. 2011, 115, 692–702. [Google Scholar] [CrossRef] [Green Version]
  57. Chen, C.; Park, T.; Wang, X.; Piao, S.; Xu, B.; Chaturvedi, R.K.; Fuchs, R.; Brovkin, V.; Ciais, P.; Fensholt, R.; et al. China and India lead in greening of the world through land-use management. Nat. Sustain. 2019, 2, 122–129. [Google Scholar] [CrossRef] [PubMed]
  58. Diouf, A.; Brandt, M.; Verger, A.; Jarroudi, M.; Djaby, B.; Fensholt, R.; Ndione, J.A.; Tychon, B. Fodder Biomass Monitoring in Sahelian Rangelands Using Phenological Metrics from FAPAR Time Series. Remote Sens. 2015, 7, 9122–9148. [Google Scholar] [CrossRef] [Green Version]
  59. Meroni, M.; Rembold, F.; Verstraete, M.; Gommes, R.; Schucknecht, A.; Beye, G. Investigating the Relationship between the Inter-Annual Variability of Satellite-Derived Vegetation Phenology and a Proxy of Biomass Production in the Sahel. Remote Sens. 2014, 6, 5868–5884. [Google Scholar] [CrossRef] [Green Version]
  60. Ma, J.; Xiao, X.; Miao, R.; Li, Y.; Chen, B.; Zhang, Y.; Zhao, B. Trends and controls of terrestrial gross primary productivity of China during 2000–2016. Environ. Res. Lett. 2019, 14, 084032. [Google Scholar] [CrossRef] [Green Version]
  61. Hua, W.; Chen, H.; Zhou, L.; Xie, Z.; Qin, M.; Li, X.; Ma, H.; Huang, Q.; Sun, S. Observational Quantification of Climatic and Human Influences on Vegetation Greening in China. Remote Sens. 2017, 9, 425. [Google Scholar] [CrossRef] [Green Version]
  62. Guo, L.; Wu, S.; Zhao, D.; Yin, Y.; Leng, G.; Zhang, Q. NDVI-Based Vegetation Change in Inner Mongolia from 1982 to 2006 and Its Relationship to Climate at the Biome Scale. Adv. Meteorol. 2014, 2014, 692068. [Google Scholar] [CrossRef]
  63. Zhao, Y.; Liu, H.; Zhang, A.; Cui, X.; Zhao, A. Spatiotemporal variations and its influencing factors of grassland net primary productivity in Inner Mongolia, China during the period 2000–2014. J. Arid Environ. 2019, 165, 106–118. [Google Scholar] [CrossRef]
  64. Piao, S.; Wang, X.; Ciais, P.; Zhu, B.; Wang, T.A.O.; Liu, J.I.E. Changes in satellite-derived vegetation growth trend in temperate and boreal Eurasia from 1982 to 2006. Glob. Chang. Biol. 2011, 17, 3228–3239. [Google Scholar] [CrossRef]
  65. Ren, S.; Yi, S.; Peichl, M.; Wang, X. Diverse Responses of Vegetation Phenology to Climate Change in Different Grasslands in Inner Mongolia during 2000–2016. Remote Sens. 2017, 10, 17. [Google Scholar] [CrossRef] [Green Version]
  66. Niu, S.; Wu, M.; Han, Y.; Xia, J.; Li, L.; Wan, S. Water-mediated responses of ecosystem carbon fluxes to climatic change in a temperate steppe. New Phytol. 2008, 177, 209–219. [Google Scholar] [CrossRef] [PubMed]
  67. Li, M.; Liu, A.; Zou, C.; Xu, W.; Shimizu, H.; Wang, K. An overview of the “Three-North” Shelterbelt project in China. For. Stud. China 2012, 14, 70–79. [Google Scholar] [CrossRef]
  68. State Forestry Administration. A Bulletin of Status quo of Desertification and Sandification in China; State Forestry Administration: Beijing, China, 2011.
  69. Tian, H.; Cao, C.; Chen, W.; Bao, S.; Yang, B.; Myneni, R.B. Response of vegetation activity dynamic to climatic change and ecological restoration programs in Inner Mongolia from 2000 to 2012. Ecol. Eng. 2015, 82, 276–289. [Google Scholar] [CrossRef]
  70. Potter, C.; Tan, P.N.; Steinbach, M.; Klooster, S.; Kumar, V.; Myneni, R.; Genovese, V. Major disturbance events in terrestrial ecosystems detected using global satellite data sets. Glob. Chang. Biol. 2003, 9, 1005–1021. [Google Scholar] [CrossRef] [Green Version]
  71. Fernández-Giménez, M.E.; Batkhishig, B.; Batbuyan, B. Cross-boundary and cross-level dynamics increase vulnerability to severe winter disasters (dzud) in Mongolia. Glob. Environ. Chang. 2012, 22, 836–851. [Google Scholar] [CrossRef]
  72. Wang, X.M.; Zhang, C.X.; Hasi, E.; Dong, Z.B. Has the Three Norths Forest Shelterbelt Program solved the desertification and dust storm problems in arid and semiarid China? J. Arid Environ. 2010, 74, 13–22. [Google Scholar] [CrossRef]
  73. Latifovic, R.; Pouliot, D.; Dillabaugh, C. Identification and correction of systematic error in NOAA AVHRR long-term satellite data record. Remote Sens. Environ. 2012, 127, 84–97. [Google Scholar] [CrossRef]
  74. Kaufmann, R.K.; Zhou, L.; Knyazikhin, Y.; Shabanov, V.; Myneni, R.B.; Tucker, C.J. Effect of orbital drift and sensor changes on the time series of AVHRR vegetation index data. IEEE Trans. Geosci. Remote Sens. 2000, 38, 2584–2597. [Google Scholar] [CrossRef] [Green Version]
  75. Hegerl, G.C.; Hoegh-Guldberg, O.; Casassa, G.; Hoerling, M.P.; Kovats, R.; Parmesan, C.; Pierce, D.W.; Stott, P.A. Good practice guidance paper on detection and attribution related to anthropogenic climate change. In Proceedings of the Intergovernmental Panel on Climate Change, IPCC Expert Meeting on Detection and Attribution Related to Anthropogenic Climate Change 2010, Geneva, Switzerland, 14—16 September 2009. [Google Scholar]
  76. Ren, H.; Schonbach, P.; Wan, H.; Gierus, M.; Taube, F. Effects of grazing intensity and environmental factors on species composition and diversity in typical steppe of Inner Mongolia, China. PLoS ONE 2012, 7, e52180. [Google Scholar] [CrossRef] [PubMed] [Green Version]
Figure 1. The study area and three major terrestrial biomes (e.g., forest, grassland, and desert). The information of biomes is derived from the WWF Terrestrial Eco-region map (available from: http://ecoregions2017.appspot.com/, accessed on 7 May 2021).
Remotesensing 13 02446 g001
Figure 2. Flowchart showing the detailed steps in detecting vegetation greening over Inner Mongolia.
Remotesensing 13 02446 g002
Figure 3. Variations of NDVI/LAI (large/small) integrals in Inner Mongolia from 1982 to 2016. (a) NDVI/LAI large integrals; (b) NDVI/LAI small integrals.
Remotesensing 13 02446 g003
Figure 4. Spatial patterns of NDVI/LAI integrals from 1982 to 2016 in Inner Mongolia. (a) NDVI large integral; (b) LAI large integral; (c) NDVI small integral; (d) LAI small integral. Hatched regions suggest significant changes at the 95% confidence level (t-test). No data (i.e., non-vegetated areas or missing data) are reported in white.
Remotesensing 13 02446 g004
Figure 5. Spatial distributions of the timing of trend shifts, (a) NDVI large integral; (b) LAI large integrals; (c) NDVI small integral; (d) LAI small integral. Pixels with no breakpoint are reported in grey while white areas indicate regions with no data (i.e., non-vegetated areas or missing data). The histograms above each map summarize the distribution of the timing of breakpoints (calculated as the proportion of the number of breakpoints per year to the total pixels of all breakpoints).
Remotesensing 13 02446 g005
Figure 6. Statistic per biome on to the (a) the type, (b) the timing, and (c) the significance of the trend shifts in NDVI and LAI integrals during the period 1982–2016. Statistics are expressed as a percentage of an area within each biome. Pixels without trend breaks are not considered.
Remotesensing 13 02446 g006
Figure 7. Spatial distributions of the trend shift type. (a) NDVI large integral; (b) LAI large integral; (c) NDVI small integral; (d) LAI small integral. Pixels with no breakpoint are reported in grey while white areas indicate regions with no data (i.e., non-vegetated areas or missing data). The histograms above each map summarize the distribution of six trend shift types.
Remotesensing 13 02446 g007
Figure 8. Spatial distributions of the significance of trend shift (p < 0.05), (a) NDVI large integral; (b) LAI large integral; (c) NDVI small integral; (d) LAI small integral. Pixels with no breakpoint are reported in grey while white areas indicate regions with no data (i.e., non-vegetated areas or missing data). The histograms above each map summarize the distribution of four types of significant changes.
Remotesensing 13 02446 g008
Publisher’s Note: MDPI stays neutral with regard to jurisdictional claims in published maps and institutional affiliations.

