Article

Potential Land Use Conflict Identification Based on Improved Multi-Objective Suitability Evaluation

1
School of Architecture, Chang’an University, Xi’an 710061, China
2
School of Water & Environmental, Chang’an University, Xi’an 710061, China
3
Key Laboratory of Subsurface Hydrology and Ecological Effects in Arid Region, Chang’an University, Ministry of Education, Xi’an 710061, China
*
Author to whom correspondence should be addressed.
Remote Sens. 2021, 13(12), 2416; https://doi.org/10.3390/rs13122416
Submission received: 31 May 2021 / Revised: 15 June 2021 / Accepted: 16 June 2021 / Published: 20 June 2021

Abstract

:
Accurately identifying potential land use conflicts (LUCs) is critical for alleviating the ever-intensifying contradictions between humans and nature. The previous studies using the method of suitability analysis did not take full advantage of the current land use and multi-function characteristics of land resources. In this study, an improved model of suitability analysis was realized. In order to explore the LUCs status, including the types, intensity and distribution, a multi-objective suitability evaluation model was constructed from the perspective of production-living-ecological functions. And it was applied to Hengkou District, a typical region of the Qin-Ba mountainous area in the central part of China. The results show that the suitability distribution of living- production-ecological functions vary widely from the center to the periphery with altitude in Hengkou District; 22.03% of the land is at a risk of land use conflict. Among them, the high potential conflict areas account for 55.32%, and the conflicts between production and ecological lands (L2P1E1, L3P1E1) are the largest, which are located at the fringe of the central urban and ecologically dominant area. Therefore, it is necessary to adopt effective strategies to achieve a balance between the differential demands of land use. This research could better reflect the true situation of land use in ecologically sensitive mountainous areas and would provide theoretical and methodological support for the identification and prevention of potential LUCs.

Graphical Abstract

1. Introduction

The pattern of land utilization is a result of various human activities; meanwhile, it is an important restricting factor for human activities [1]. Based on the three dominant functions of “living-production-ecology”, different benefit-oriented practical activities focusing on economic, social and environmental benefits have been carried out [2]. However, the limited land resources lead to competition among different land use modes [3]. It can be seen that land use conflict is the contradictory state of various stakeholders in the process of land resource utilization due to different purposes, while potential land use conflict refers to the accumulation of preconditions that can lead to conflicts among stakeholders. To a certain extent, actual conflicts will appear [4]. The effective identification of potential conflict areas is the key to prevent land use conflict. The Qin-Ba mountainous area is an important ecological barrier in China. Affected by the natural properties of mountainous areas, such as energy gradient, surface fragmentation and spatial heterogeneity, the region is also an unbalanced area of economic and social development. In recent years, with the development of urbanization and the acceleration of countryside construction, the urban-rural land use patterns have shown dramatic changes [5,6,7,8] accompanied by frequently land use conflicts. Unreasonable land use intensifies the conflict among living, production and ecological spaces and offsets sustainable development [9,10,11]. Consequently, scientific identification of the potential land use conflicts is crucial to current land use planning.
Land use conflict is a universal problem. The international community paid attention to it as early as the 1970s [12]. In 1976, the United Nations Food and Agriculture Organization formulated and promulgated the “Land Evaluation Outline”, which proposed that land use plans should be oriented to land suitability. Subsequently, countries around the world established their own evaluation systems based on this outline [13]. Since then, research on land use conflicts related to society [14,15], economy [16], geography [17] and environment [18] has gradually developed. The word “conflict” comes from sociology [19]. However, with the development of social and legal systems, social conflicts characterized by the possession of property rights have been decreasing, and spatial conflicts are increasing and will be the main type of future conflicts [20]. At present, land use conflicts are still receiving attention. There have been numerous studies focusing on the concept [21,22,23], identification methods [24,25,26,27], characteristics [28,29], internal mechanism [30], causes [31,32,33] and impacts [34,35,36] of the conflicts.
The method of land use conflict identification mainly includes participatory survey [37], pressure-state-response conceptual model [38,39], comprehensive index method [40], land use transfer matrix [41], land use suitability evaluation [42,43,44,45], etc. Each of them is driven by a different goal and has its own suitable scenarios [46]. In order to explore the LUCs status, not only to obtain quantitative results, but also to identify the type and intensity of the conflict, a land use suitability evaluation has been selected in this research after a comprehensive comparison. Land suitability means the suitability of a given type of land to support a defined land use, either in its current state or after improvements. Land suitability evaluation means the process of appraisal and the grouping of specific areas of land in terms of their suitability for defined uses [47]. This assessment is always carried out separately for each category of land use [48], for example, suitability evaluation of cultivated land [49], etc. Under the urgent pressure of economic and social development, land use changes frequently, and land use conflicts are inevitable. It is necessary to identify potential conflicts for regional multiple land use. In general, land use is considered to mainly meet the needs of construction land, agricultural land and ecological land [13]. There has been a lot of research from the perspective of construction–agriculture–ecology land in order to determine the optimal distribution of land use [50]. However, regional development tends to be examined from the perspective of cities, neglecting the increasingly fierce land use conflict in rural areas. As rural construction land is scattered and often divided into agriculture land, the result often represents the conflict among urban, agriculture and ecology. Under the background of China’s spatial planning, for regional sustainable development, there is a new classification of land use from the three dimensions of living, production and ecology [51]. It is more comprehensive and more suitable to current regional planning in China. In addition, land suitability evaluation characteristics vary between regions. The factors affecting land use conflict should be goal-oriented and suitable to local conditions. In terms of the Qin-Ba mountainous area, with a large number of scattered villages, a local evaluation system needs to be established.
We adopted the new perspective of living, production and ecological functions in this research. Based on it, an improved multi-objective land use suitability evaluation method was developed and applied in Hengkou District of the Qin-Ba mountainous area. The main objectives of this study are the (1) construction of a multi-objective suitability evaluation model; and (2) the identification of the types, levels and distribution of potential land use conflicts. This study focuses on improving the method for identifying potential LUCs. The result could better reflect the true situation of land use in ecologically sensitive mountainous areas and would provide theoretical and methodological support for the identification and prevention of potential LUCs.

2. Materials and Methods

2.1. Research Area

The Qin-Ba mountainous area, located in the upper reaches of the Yangtze River, is an important ecological barrier in the central part of China. It extends across the six provinces of Gansu, Sichuan, Shaanxi, Chongqing, Henan and Hubei. In this area, the Qinling Mountains lie across the north, the Bashan Mountains are in the south and the Hanjiang River lies between them, forming a unique sandwich landform structure. Hengkou District is in the core of the Qin-Ba mountainous area, and it has a similar sandwich landform structure. The Yue River, a tributary of the Hanjiang River, passes through the area and forms a flat river valley. The entire area is mostly mountainous and hilly with extraordinarily fragmented terrain; therefore, the towns and villages extend along the central Yue River (Figure 1). Hengkou District belongs to Ankang City, Shaanxi Province. In 2012, Hengkou District became a national pilot town for development and reform, which started a new chapter in rapid urbanization. The urbanization rate rose sharply from 15% in 2012 to 56% in 2017. With the increase in urban population and economy, the increasing demand for living land in the future will exert great pressure on the production and ecological lands of the entire region.

2.2. Data Sources and Processing

To ensure the timely identification of the problems in land use planning implementation, it is necessary to take effective measures to monitor and evaluate development activities. Remote sensing technology is used to provide a basis for revising the land use changes’ data, which is not accurate or timely in large-scale land use change surveys. In this study, the land use data of Hengkou District in 2017 from the Second National Land Survey Database of 2010 and the Land Change Survey Database from 2011 to 2017 were updated by remote sensing images using the visual interpretation method.
The remote sensing images used in this study were obtained from Landsat 8 OLI_TIRS satellite data from the Geospatial Data Cloud (http://www.gscloud.cn/ accessed on 15 May 2019). The land use data are from the Second National Land Survey Database and the 2017 Land Change Survey Database (1:50,000 scale); the land management data are from the database of the basic agricultural land protect line, the ecological land protect line and the expansion boundary of construction land in 2017. The DEM data are from the GDEMDEM 30 m resolution elevation dataset in the Geospatial Data Cloud. All the spatial data were unified into the GCS_WGS_1984 coordinate system in ArcGIS V10.2 and transformed into a 30 m × 30 m raster layer. The social and economic data were obtained from the 2017 Statistical Yearbook of Hengkou District and can be linked to the vector data to establish a basic research database after processing.

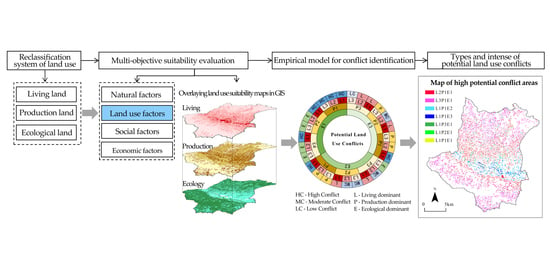
2.3. Research Framework

To identify the land use conflict types and levels, we developed a research framework (Figure 2). First, we constructed a reclassification system of land use based on the living–production–ecological functions. Second, we structured a multi-objective suitability evaluation model. Third, we obtained the distribution maps of living-production-ecological suitability. Finally, we identified the areas with potential land use conflicts and defined the specific conflict types and levels by overlaying the suitability maps.

2.4. Research Methods

2.4.1. Classification System of Land Use Functions

There are different classification systems for land use types in the world. Odum divided land use into four types in his compartment model, including productive areas, protective (natural) areas, compromise areas and urban/industrial areas [52]. Carr and Zwick developed their research on the land use types of agriculture, conversation and urban, which is widely used nowadays [53]. In China, there are two land use classification systems used by planning professionals. One is the Current Land Use Classification (GB/T21010–2007) (The land use data used in this study were consistent with this version; therefore, the latest version GB/T21010–2017 was not used), which has 12 first-class categories and 57 second-class categories; the other is Land Management Law, including construction, agricultural and unused land. The existing studies on potential LUCs were based on them. However, the land has multiple functions with different priorities, which is a reflection of land use suitability [54]. If the difference can be reflected in the suitability evaluation factors, more accurate evaluation results will be obtained.
Based on the intensity of the living-production-ecological functions, we reclassified the land use types based on the Current Land Use Classification (GB/T21010–2007) to three new categories of living, production and ecological lands in the study region by improving the results of Liu et al. [55] and Hu et al. [56]. Specifically, ecological land was divided into the following four categories: complete ecological land (E-a), semi-ecological land (E-b), weak ecological land (E-c) and non-ecological land (E-d). The ecological attributes for E-a are dominant; those for E-b have no obvious priority for other functions; those for E-c play a secondary role; those for E-d are extremely weak. For example, natural grassland not only has ecological functions, but also assumes the function of production. In comparison, the former is more dominant than the latter, which indicates a higher ecological suitability. Thus, it can be classified as E-a and P-c. Similar to the classification of ecological land, production land can be divided into the following four categories: complete agricultural land (P-a), semi-agricultural land (P-b), weak agricultural land (P-c) and non-agricultural land (P-d). Living land can also be divided into the following four categories: complete living land (L-a), semi-living land (L-b), weak living land (L-c) and non-living land (L-d) [57,58].
The new conceptual classification system subdivides the land with two or three functions, to ensure that composite functions, instead of a single function, can be obtained. Compared with the previous classification system, the new one fully reflects the spatial heterogeneity of functions. For example, if the ecology function of agricultural land was considered, the ecological tendency is improved in suitability evaluation, which is conducive to the restoration of ecological function in mountainous areas with poor production conditions. The suitability evaluation results will be more functionally oriented and conducive to the better allocation of land use. The specific differences among them are shown in Table 1.

2.4.2. Construction of Multi-Objective Suitability Evaluation Model

The Land Use Conflict Identification Strategy (LUCIS) model proposed by Carr and Zwick [53] is used to estimate potential land use conflicts by evaluating the suitability of different functions of the same land. The multi-objective suitability evaluation model in this paper is an improved application based on their conceptual basis. Specifically, the “multi-objective” in this study refers to the three main land use functions (living-production-ecology), which is different from agriculture-construction-ecology in most studies using the LUCIS model [41,42,43,44]. The construction of a multi-objective suitability evaluation model includes the selection of evaluation factors, the determination of index weight, the assignment of factors, the score calculation of the evaluation unit and the classification of the suitability level.
(1) Selection of evaluation factors
The multiple suitability and the limited supply of land resources are the root causes of the conflict, while the growth of the population and its demand for land are the main driving forces. Therefore, the factors affecting land use conflict should include natural and socio-economic factors. Based on the principles of comprehensiveness, representativeness, regionality and data availability, the evaluation index system was constructed by factors closely related to the suitability for living-production-ecology functions [59,60].
The living suitability reflects the natural, social and economic feasibility of land for construction. The index factors are selected from natural conditions, land management, current land use and public services. Among them, natural conditions are the basic limiting factors for the expansion of living space. Thus, slope, altitude and the distance from rivers were selected as the main factors for natural conditions. Construction land expansion boundary and natural disasters were selected as the main factors for management. The current land use was classified according to the living function intensity, the stronger the living function was, the better the living suitability was. Public services are composed of population density, distance from main roads, main service facilities and the urban. The larger the index value was, the better the living suitability was (Table 2).
Production suitability is reflected by land efficiency and benefits. The index factors are composed of natural conditions, land management, current land use and utilization level. Natural conditions, which are key factors in evaluating the production suitability, are composed of factors that should be relatively stable in time series, such as slope, altitude, slope aspect, irrigation conditions and soil [61]. In this study, we use the distance from rivers as the basis to judge the irrigation conditions, because the farmland in mountainous areas is highly dependent on rivers. Land management is crucial to ensuring the sustainable development of production land. The two factors of management, the basic farmland protection line and natural disasters, can reflect the sustainable development ability depending on whether it is in a protected or affected area. The current land use was classified according to the function intensity of production. The stronger the production function was, the better the production suitability was. The utilization degree includes two factors of grain yield per unit of cultivated land area and per capita cultivated land area, reflecting the suitability by production efficiency (Table 3).
The evaluation of ecological suitability reflects the intensity of ecological sensitivity. The indicators come from natural conditions, land management and current land use. Natural conditions are prerequisites for ecological lands. As the research area is in the Qin-Ba mountainous area with complex terrain, the slope can reflect the intensity of soil erosion, the altitude can reflect the heat and water conditions, Normalized Difference Vegetation Index (NDVI) is the best indicator of vegetation growth status and vegetation coverage, and the river can influence biodiversity. Therefore, slope, altitude, NDVI and the distance from rivers were selected as the main factors. The land management includes the two factors of the ecological land protection line and natural disasters. If the land is within the scope of ecological protection line or the impact of natural disasters, its ecological sensitivity will be relatively high. The current land use was classified according to the intensity of the ecological function. The more intense the ecological function was, the higher the importance level was (Table 4).
(2) Weight determination
In this study, the analytic hierarchy process was used to determine the weight of each evaluation factor, and a hierarchical model of the target, criterion and index levels was established for the selected factors. Through consultation with 10 experts in relevant fields who are familiar with local conditions, the relative importance of the pairs of indicators was evaluated by the importance of levels 1–9, and a comparison matrix was constructed. The weight of each evaluation factor was calculated using the Yaahp V0.6.0.
(3) Factor assignments
The factor assignments were determined using different methods according to the attributes. For the qualitative description factors, such as the protection line of ecological land, the corresponding scores were assigned according to the characteristics. For the quantitative factors, such as slope and altitude, the grades were divided according to the data distribution, and then the corresponding scores were assigned based on the intensity of influence. For the quantitative factors with large data distribution intervals, such as population density, the natural breakpoint method was used to divide them into five categories in GIS. Finally, all factors were reclassified from high to low in five levels and obtained a score of 9, 7, 5, 3 or1 through the spatial analysis tools in ArcGIS.
(4) Calculation of total score of evaluation unit
The total score of each evaluation unit was calculated using the following exponential weighted model (Equation (1)):
S = Σ i = 1 m Σ k = 1 n ( W k ε k ) E i ,
where S is the comprehensive evaluation score for all factors (the larger the value is, the higher the suitability of the corresponding function is); W k is the indicator value of factor k; ε k is the weight of factor k; and E i is the weight of principal i.
The suitability scores of all factors were superposed by weight using the grid calculator of the Map Algebra Tool in ArcGIS, and the living-production-ecology suitability scores were calculated. Each grid contained the suitability scores of the three targets.
(5) Classification of suitability level
The distribution of suitability scores was analyzed statistically using the frequency distribution histogram method. The scores of all evaluation units were counted by frequency, and the mutation points of the frequency curve were taken as the limit to determine the suitability level division. According to the ecological suitability level, the area was divided into extremely important (E1), important (E2) and general areas (E3); according to production suitability, into highly suitable (P1), moderately suitable (P2) and barely suitable areas (P3); and according to living suitability, into highly suitable (L1), moderately suitable (L2) and barely suitable areas (L3).

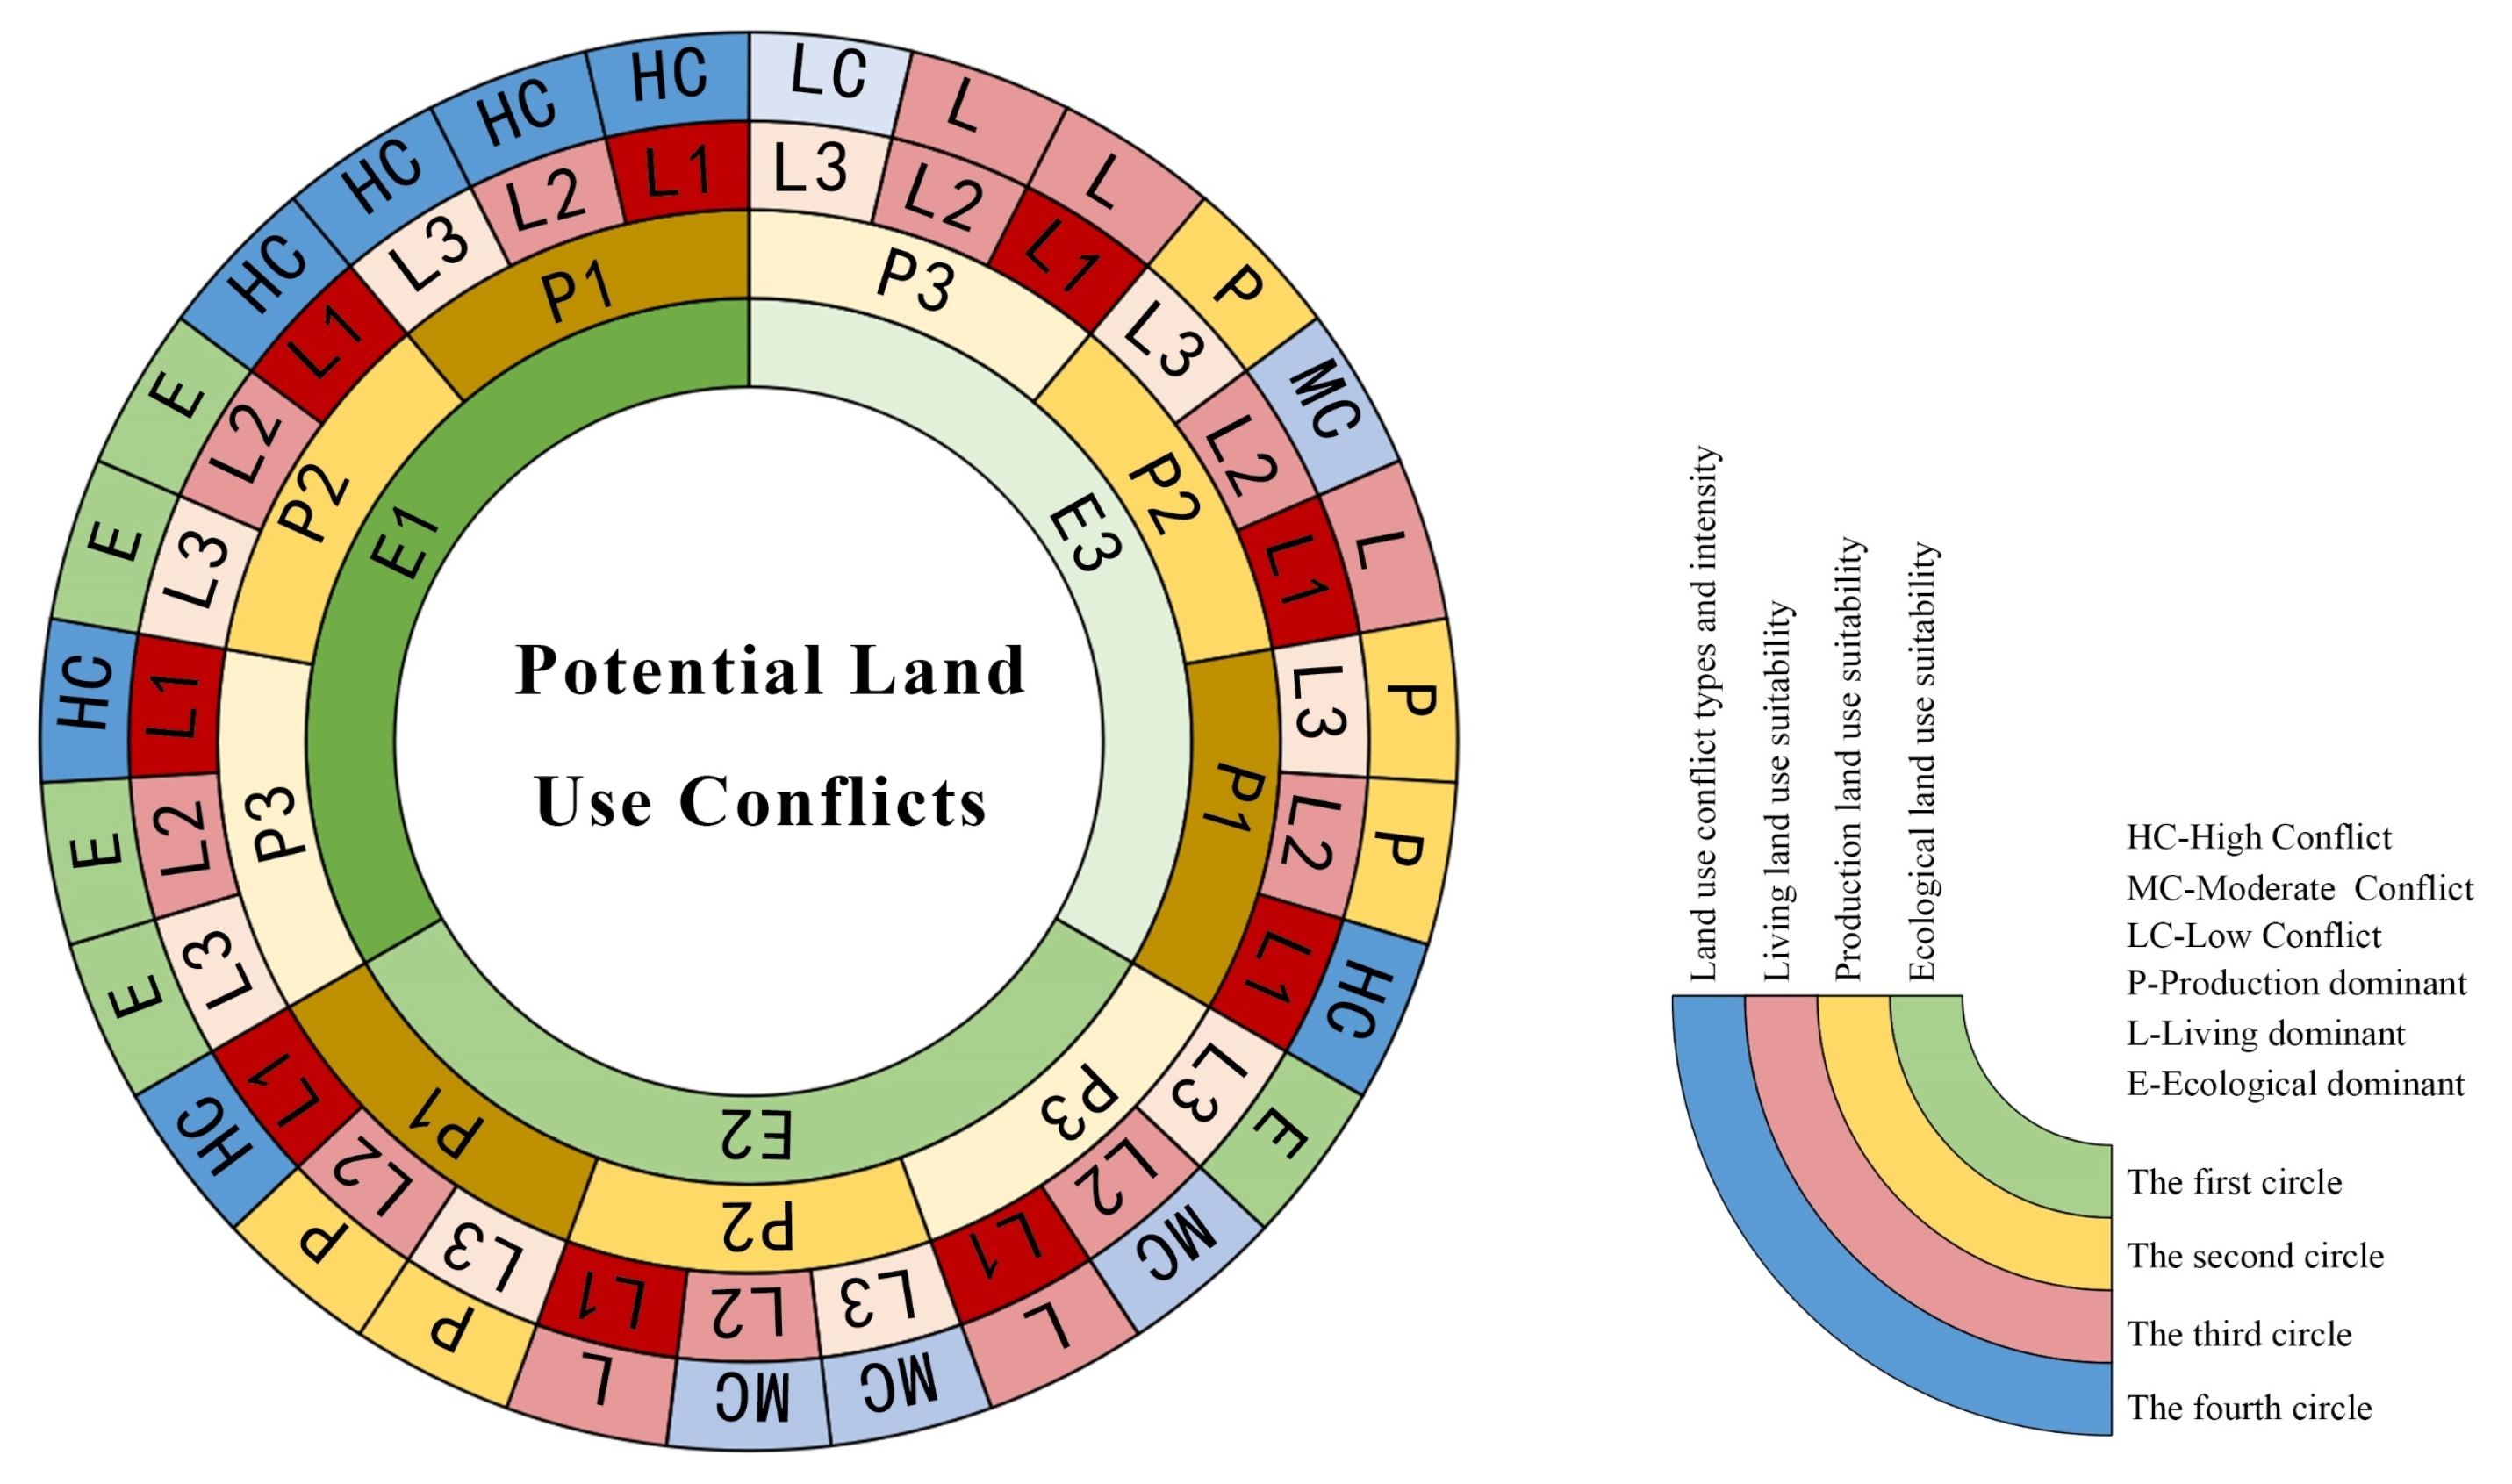
2.4.3. Identification of Potential Land Use Conflicts

The conflict identification and intensity diagnosis of land use were carried out using the empirical model that utilizes the permutation and combination law (Figure 3). First, three types of suitability maps were overlaid through GIS such that each evaluation unit has the attribute of “living-production-ecology”. Further, 27 combinations of suitability intensity were obtained according to the conflict relationship of suitability levels. Second, by comparing the suitability levels that represent the land use preferences among three functions, the land use category with the highest level was selected as the dominant area, including 15 combinations. A land use category with two or three of the same suitable levels was selected as a potential conflict area, and the intensity was divided into three levels (high conflict, moderate conflict and low conflict), including 12 combinations. Finally, the conflict areas were named by the method of “Lx + Px + Ex”, where x is the land use suitability level of living-production-ecology.

3. Results and Analysis

3.1. Single-Factor Spatial Analysis

According to the index and classification system defined in Section 2.4.2 (1) and (3), 18 factors from natural conditions, society and economy and current land use were spatialized using spatial analyst tools in ArcGIS. The results are presented in Figure 4. The settlements are scattered in the valley showing obvious characteristics of vertical gradients and hydrophilic in mountainous areas. Slope, aspect, altitude, rivers and traffic routes play an important role in the scale, shape and distribution of Hengkou’s urban-rural settlements.

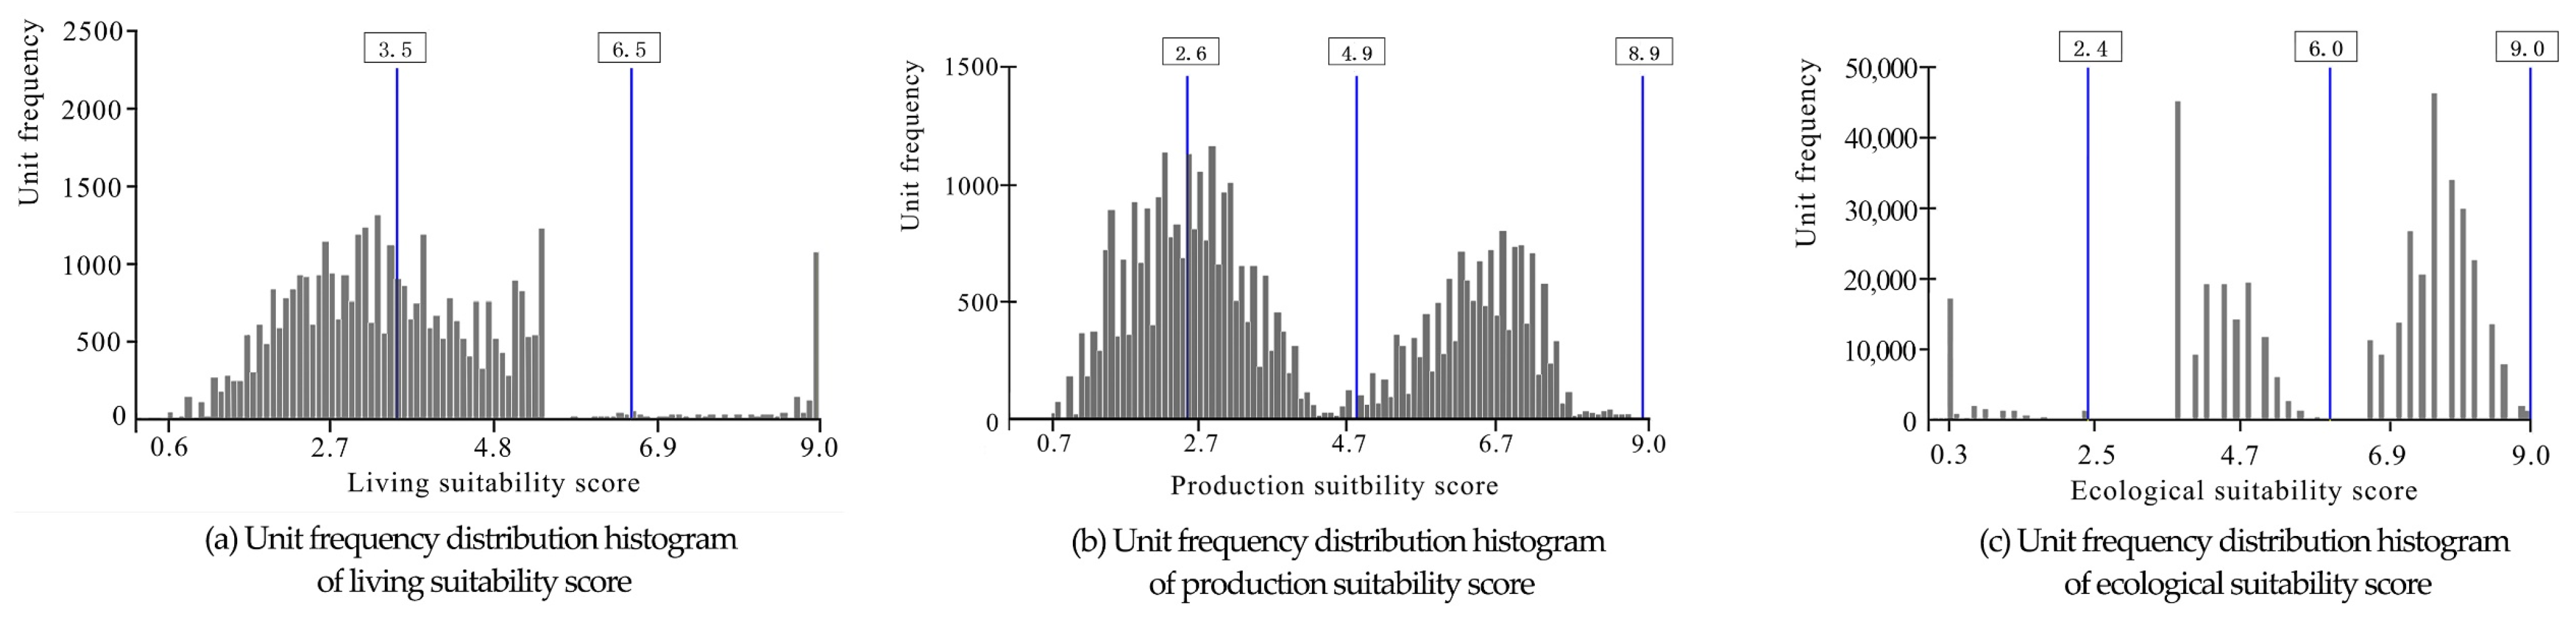
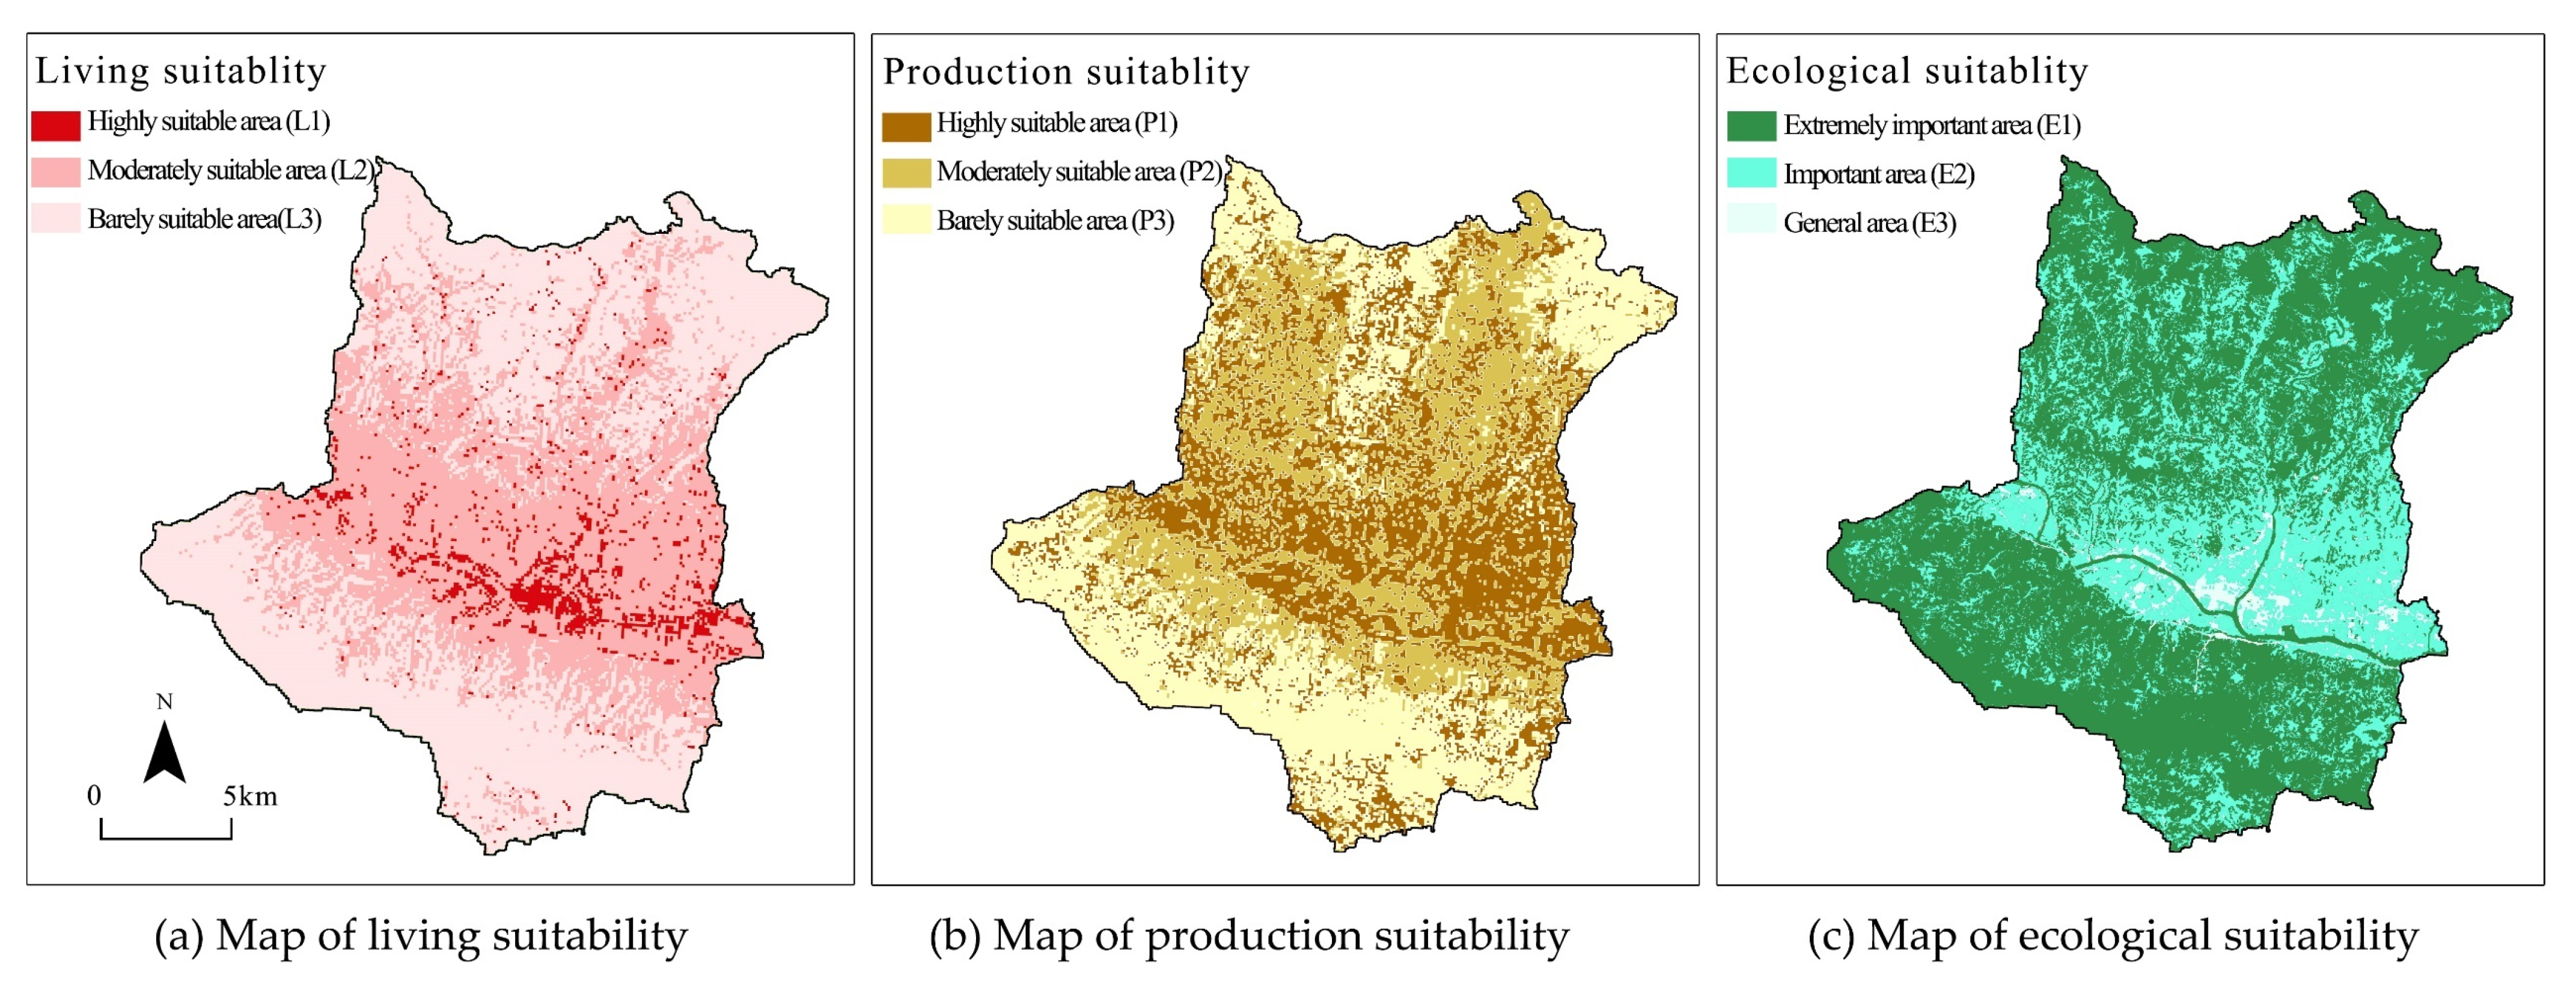
3.2. Land Use Suitability Analysis

According to the evaluation system in Section 2.4.2 (2), (4) and (5), in the analysis of living-production-ecological suitability, 3.5 and 6.5, 2.6 and 4.9, 2.4 and 6.0 were selected, respectively as the breakpoints by using the natural discontinuity classification method (Figure 5).
The living–production–ecological suitability in Hengkou District is divided into three levels, respectively (Figure 6, Table 5).
The living suitability gradually decreases from the middle to the north and south, and the proportion of different suitable areas varies greatly. The middle valley plain area has the highest living suitability and the narrowest space, with the smallest area of 19.78 km2, which only accounts for 5.31% of the total area. This region, with flat land and clusters of settlements, is not only an important immigration resettlement area, but also accommodates lots of industrial enclaves from the surrounding counties with weak construction conditions. It is experiencing significant economic growth and urban expansion. The moderately suitable living area is in the hilly region at the transitional zone from the middle valley to the mountains on both sides, covering an area of 156.86 km2, accounting for 42.13% of the total area. Owing to the broken terrain, the settlements are mostly scattered along rivers and roads, showing a characteristic of a linear layout. With a downgrade of the road and river levels, the density and number of settlements also reduced. The barely suitable living areas are abundant in the high mountains at both ends of the north and south, accounting for 52.56% of the total area (195.71 km2). This area is characterized by undulating mountains, deep valleys and punctiform settlements.
The pattern of production suitability is similar to living suitability. However, the proportion is relatively balanced. The highly suitable area is in the middle valley area and covers 113.92 km2 (30.59% of the total). It is the main agricultural production zone in the whole region, benefited by the convenient irrigation conditions (Yue and Heng rivers flow through) and topographical conditions (below 400 m). There are one to two terraces distributed intermittently along the river, mainly for grain crops (rice) and oil crops (rapeseed). In addition, there are three to four terraces in some wide valley areas, which are dry farming areas. The moderate production area is in the southern and northern hilly areas and covers 122.65 km2 (32.94% of the total), concentrating on gentle slopes along the river. Owing to the poor soil condition, tea plants, mushrooms and other economic crops are planted. The barely suitable production area is in the southern and northern high mountains, covering an area of 135.79 km2 (36.47%). The altitude of this area is higher than 600 m and the slope is more than 25°, leading to many landslides and poor water-heat conditions. Therefore, it is only suitable for a few medicinal crops.
The ecological suitability gradually increases from the middle to the north and south ends, which is the opposite of the living and production land. The proportions of various suitability areas vary greatly. E1, the area with the highest ecological sensitivity, is mainly distributed in the vast northern and southern mountainous areas, covering an area of 215.01 km2 (57.75% of the total area). It is a significant water conservation area and timber forest, where it is densely covered with pine, oak, fir and birch trees. E2, the area with moderate ecological sensitivity, is mainly distributed in the hilly areas, covering an area of 134.99 km2 (36.25% of the total area). There are many economically valuable trees planted artificially in this region, such as walnut trees. E3, the area with low ecological sensitivity is concentrated in the central valley area, covering an area of 22.34 km2 (6.0% of the total area). It is the most densely populated and industrial area in the entire district.

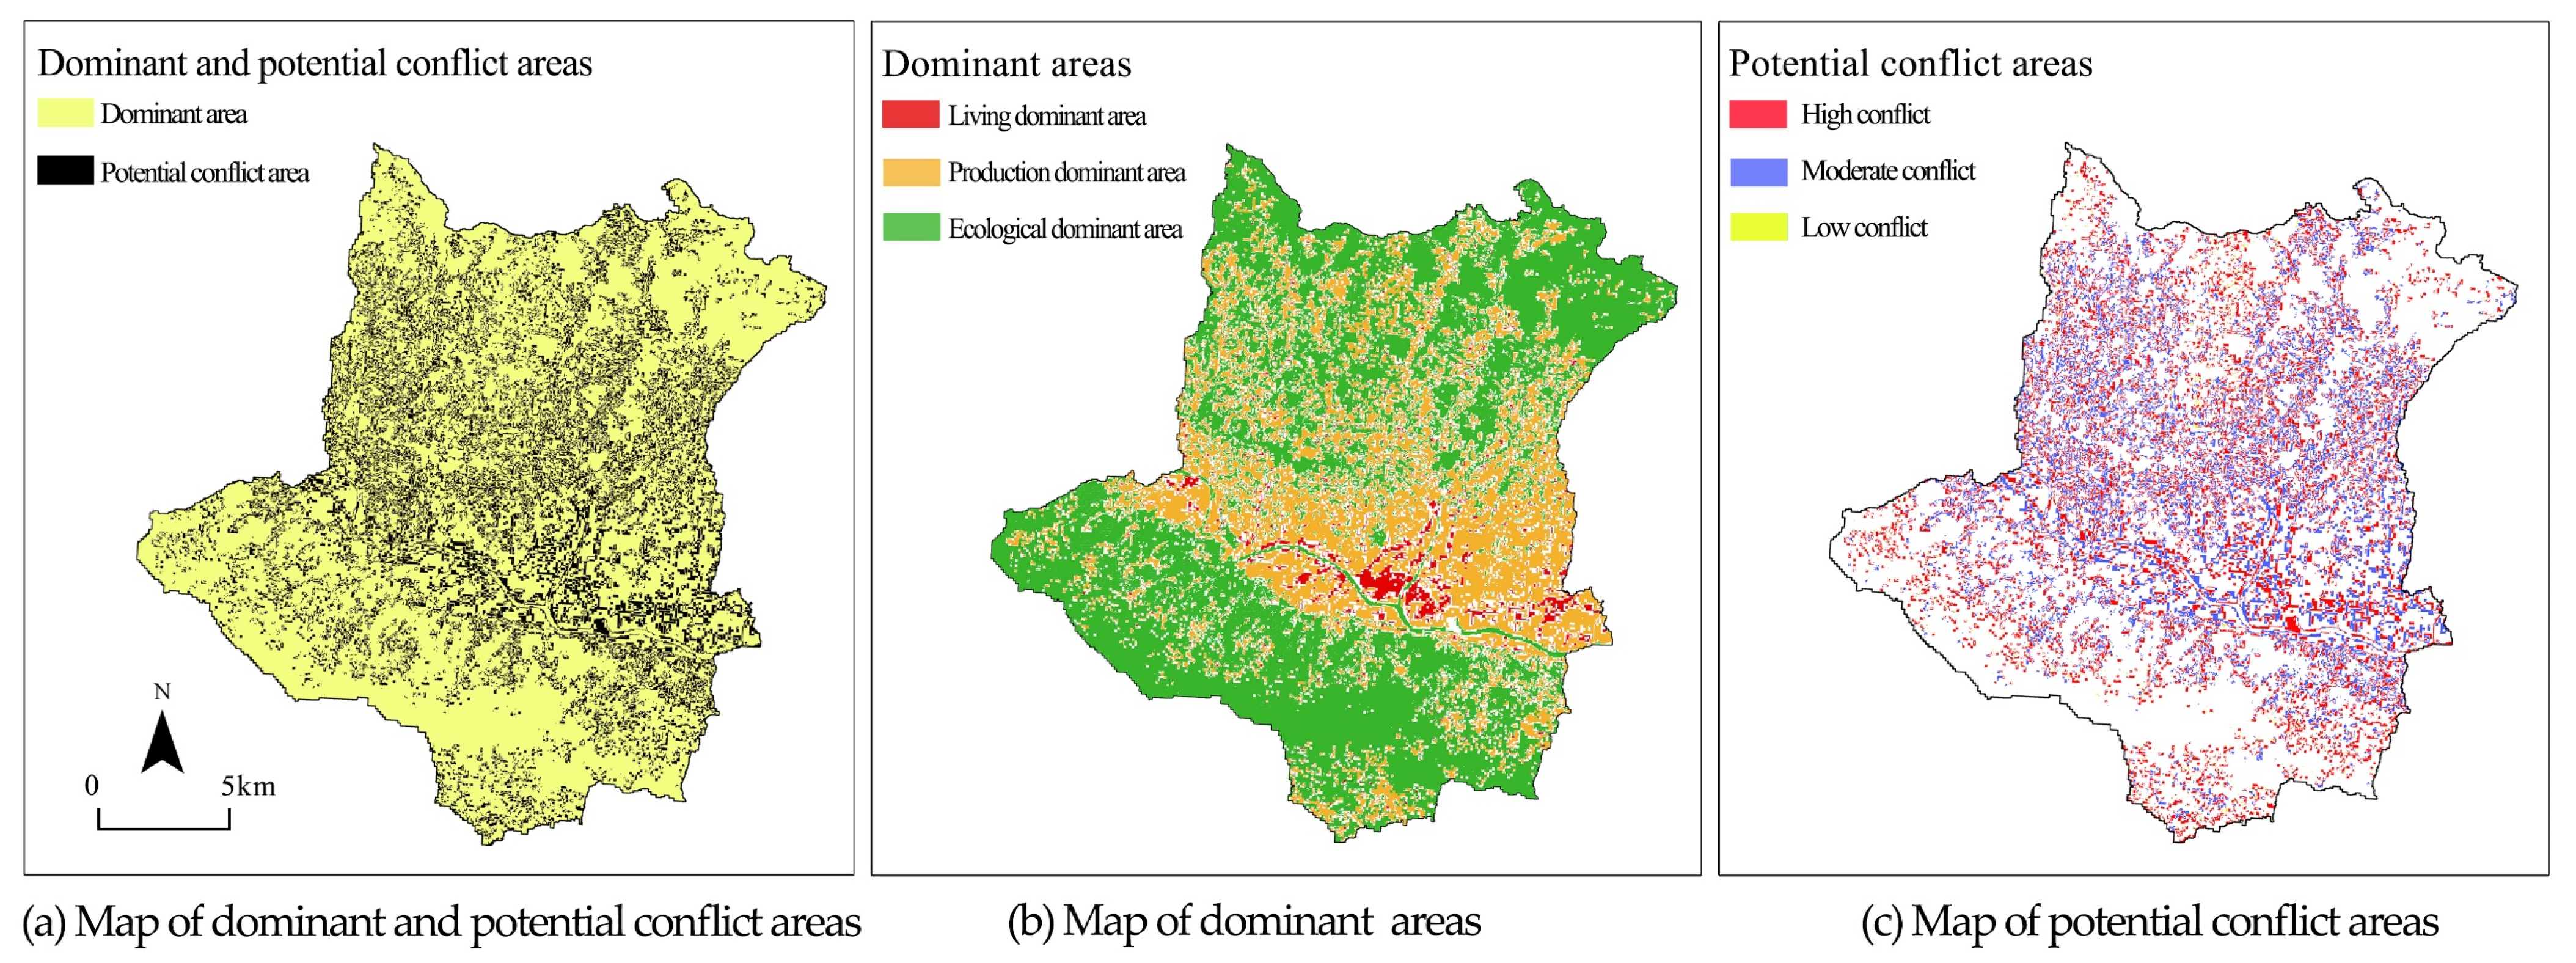
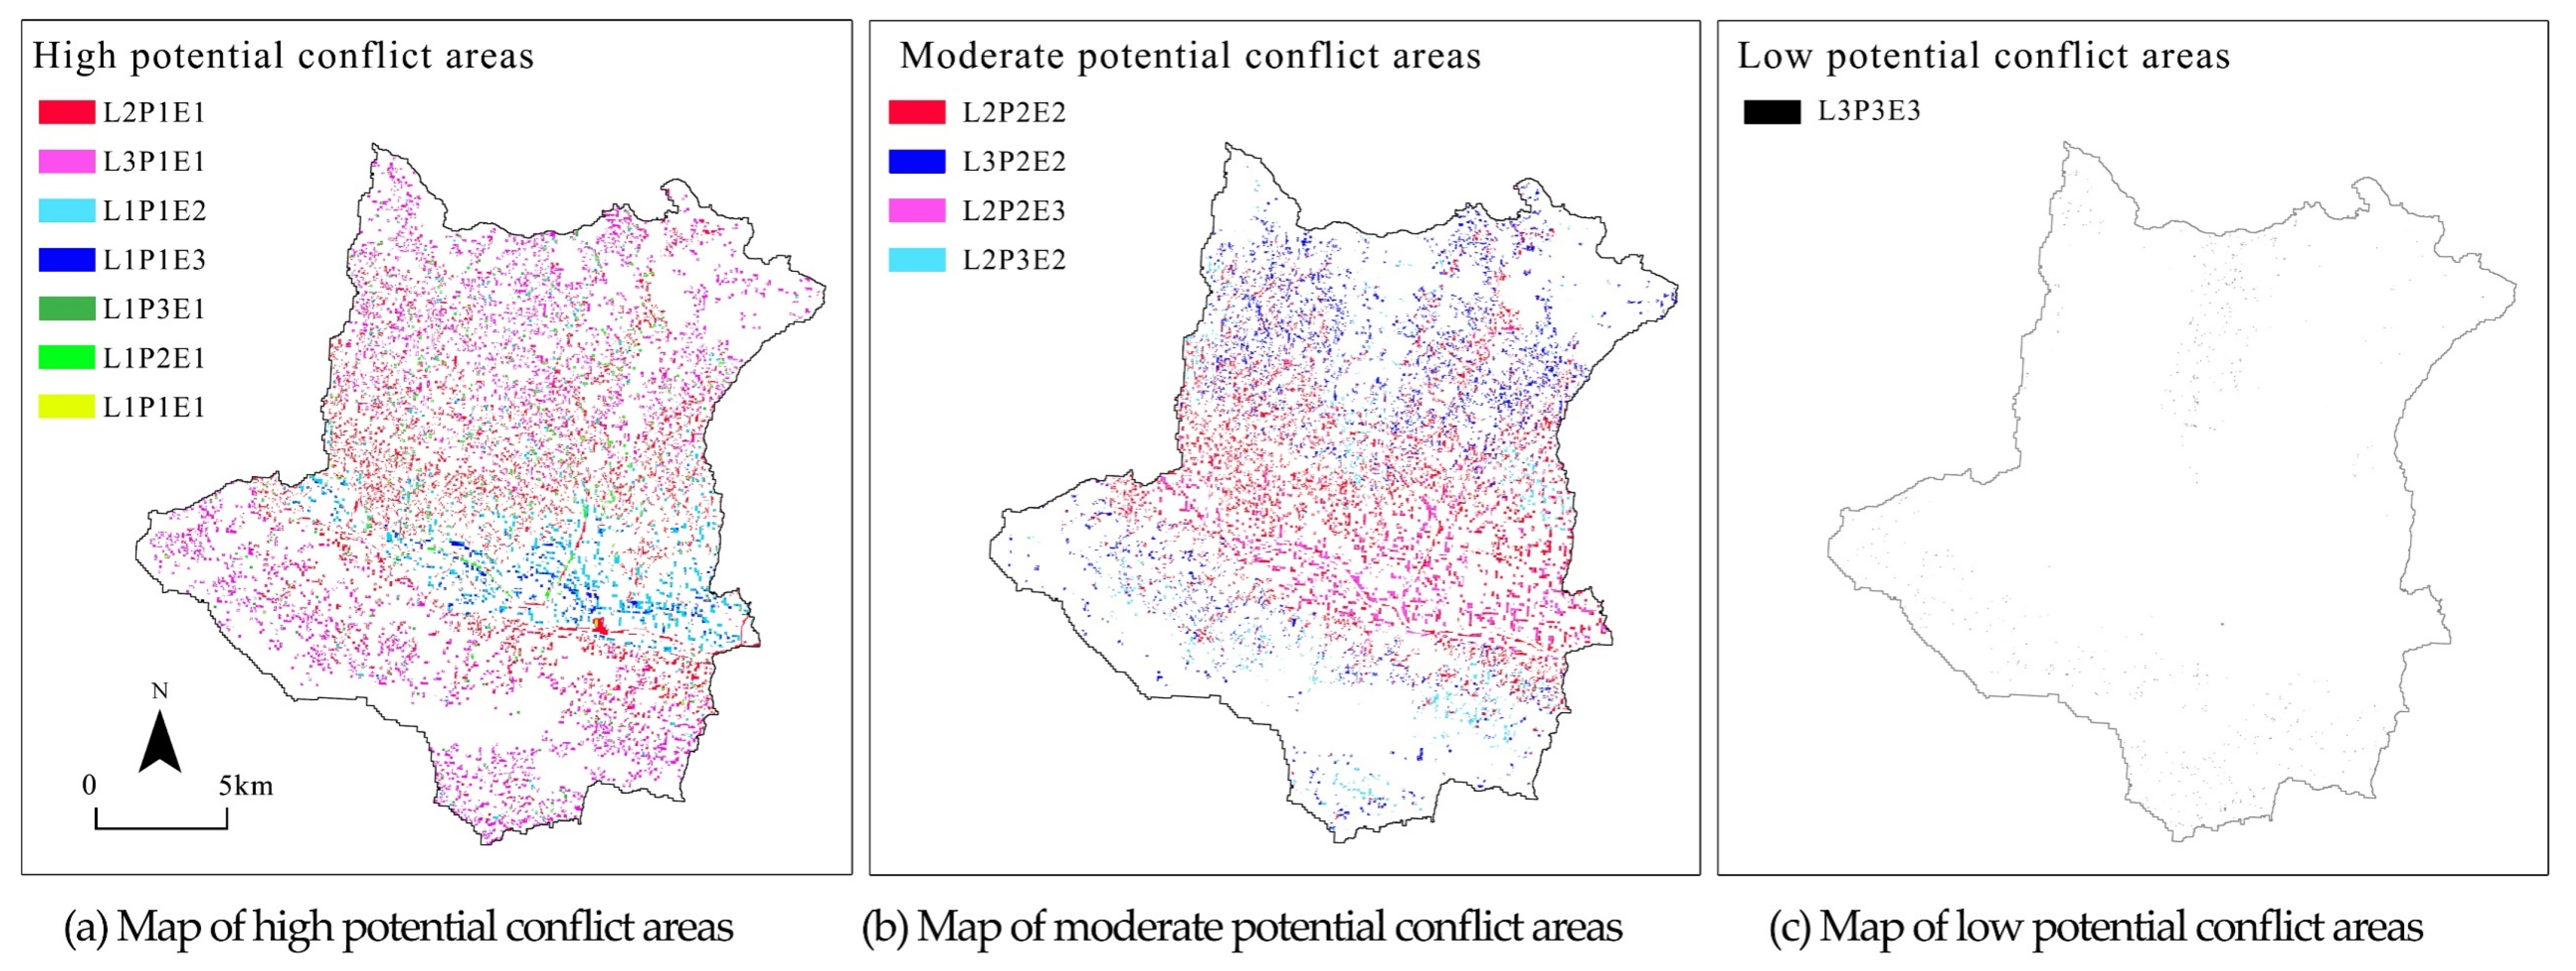
3.3. Diagnosis of Potential Land Use Conflict

In this study, we overlaid suitability maps of living-production-ecology in ArcGIS to ensure that each evaluation unit has the attribute of three functions. Then, the types, intensity and spatial distribution of potential land use conflicts were obtained through the empirical model in Section 2.4.3.
The result shows that 77.97% of the total area is the dominant area where there is no evident conflict in Hengkou District (Figure 7, Table 6). Of this area, the ecologically dominant area accounts for the largest proportion with 55.32%, including L2P2E1, L3P2E1, L2P3E1, L3P3E1 and L3P3E2, which are widely distributed in mountainous and hilly areas. The production dominant area is concentrated in the central valley plain. The living dominant area is the smallest and is concentrated on both sides of the Yue and Heng Rivers, with extremely limited expansion space.
Except for the dominant area, the remaining 22.03% of the land is at risk of potential land use conflict. Of this area, high potential conflict areas account for 55.32% of the total conflict area, covering 45.38 km2, which will most probably change into actual conflict in the future. In this area, the ecological-production land conflict (L2P1E1, L3P1E1) is the most widely distributed one, located at the fringe of the central urban and ecologically dominant area. Owing to the narrow production space in mountainous areas, the demand for increasing agriculture land will drive farmers to occupy ecological land. The conflict between living and production land (L1P1E2, L1P1E3) is also obvious and mainly distributed on both sides of the Yue and Heng rivers, along the important traffic arteries in the central part of Heng District. The excellent natural conditions of water, heat, biology and social-economic base in this area reflect the high suitability of production and living land, which has a strong gathering effect on production and living activities. However, with the acceleration of economic and social development, the demand for living land will grow rapidly, and this area will become crucial for urban expansion and utilization. The agricultural production land will gradually lose its economic advantage in the competition and easily transform into living land. The moderate conflict area accounts for 43.95%, which means severe conflict in a short period is not likely in this zone but risks still existing. First, the area with three types of moderate conflicts (L2P2E2) accounts for the largest proportion, covering 18.21 km2, and is mainly distributed in the middle and northern hilly areas. The region is in the transition zone from plains to mountains, which is not only highly suitable for living and production, but also has certain ecological sensitivity. Thus, it has formed a unique pattern of mixed living–production–ecological land, which indicates the high adaptability of the landform and shows the unique characteristics of mountainous villages. Therefore, in recent years, taking advantage of the geographical environment, countryside tourism has been developed and there is a sharp increase in the construction of housing, infrastructure and public service facilities. Living land is constantly expanding into the surrounding production and ecological land, and the resultant pollution also affects the quality of the ecological environment, leading to conflicts among living, production and ecological lands. Second, the moderate conflict area between the production and ecological land (L3P2E2) accounts for 18.21% and is mainly distributed in the gentle slope area of small streams in the northern and southern mountains. The moderate conflict area between the living and production lands (L3P2E2) concentrates on both sides of the rivers and roads in the middle valley area.
The low conflict area with three types of barely suitable (L3P3E3) is minor and accounts for only 0.73% of the conflict area, which is scattered in the high mountainous areas (Figure 8).

4. Discussion

The study of LUCs is a common concern in academia. The scientific evaluation of regional LUCs is an important basis for predicting the direction of land use development and laying out land use planning. The Qin-Ba mountainous area is not only ecologically fragile, but also economically underdeveloped. To understand the current situation and effectively guide sustainable development, this study established an evaluation model of potential land use conflicts from the perspective of living-production-ecological functions and carried out practical research in Hengkou District.
The evaluation results show that the land use fragmentation degree in Hengkou District was relatively high in 2017. The overlapping characteristics of living, production and ecological functions were significant, where approximately 22.03% of the land has a potential conflict risk. The evaluation model divides the conflict intensity into three levels and twelve types. The high conflict area accounts for more than half of the total conflict area, among them the conflicts between the production and ecological functions (L2P1E1, L3P1E1), and living and production functions (L1P1E2, L1P1E3) are the majority and are mainly located in the periphery of the ecologically dominant area and the boundary zone of the central urban, which will most probably turn into actual conflicts in the future. The significant cause of LUCs is the contradiction between stakeholders with different demands for land use [62]. The land use system has the characteristics of complexity, vulnerability and dynamicity [63]. The impact of land use disorder on the ecologically vulnerable areas is particularly obvious [64,65], which will not only limit the social and economic development, but also seriously threaten the ecological environment. Therefore, it is necessary to adopt measures such as ecological migration, ecological subsidies, industrial support and developing the characteristic agriculture to meet the land use needs from different stakeholders.
The occurrence of conflict is a process of “struggling for land resources”. In terms of the conflict between production and ecological land, the lack of high-quality farmland in mountainous areas is the primary reason. In addition, since the implementation of the Policy of Returning Cultivated Land to Forest in the Qin-Ba mountainous area in 1999, a lot of cultivated land with poor farming conditions has been changed into forest, resulting in the reduction in the grain area and yield. To maintain their livelihood, some farmers are still increasing the area of cultivated land by encroaching on ecological land nowadays. In order to balance environment protection and farmers’ interests, grain planting with low return rate should be replaced with ecological economic crops with high added value, such as flue-cured tobacco, Chinese herbal medicine, tea plants, mushrooms, etc. Further, the government should increase the investment in ecological land and specify relevant policies to alleviate the conflict between agricultural and ecological land. In terms of the conflict between production and living land, owing to the limitation of mountainous terrain, there are multiple overlaps in suitability. On the one hand, affected by the policy of Ecological Migration, the central urban area received lots of villagers from middle and high mountains, making the population and land use scale expand rapidly. In contrast, several economic development zones have been constructed in the central flat agricultural area, converting production land into urban construction land, which makes the high-quality cultivated land more and more scarce. From the results of conflict identification, high and moderate conflicts between living and production land are widespread, showing that the conflict between urban construction and agricultural land needs to be prevented as soon as possible. The land use in urban areas should be more effective, and the protection of high-quality farmland should be given priority.
The research is carried out under the background of China’s spatial planning. Research from the perspective of living-production-ecology is consistent with planning practice, and it is also an improvement on the method of land use suitability evaluation. The current land use is subdivided according to the functional intensity and taken as an indicator in this paper to ensure that the result will be more accurate and closer to the reality. Therefore, the conflict result will be the revision reference of the current land use with a stronger functional orientation. Owing to the differences of natural land resources and socio-economic development among different regions, the performance of land use conflict is different. Throughout the existing research on land use conflict, there are few LUCs studies in the Qin-Ba mountainous area. Therefore, this study could make up for the void in the research on the manifestation, type, intensity and distribution characteristics of land use conflict in this region.
The study has the following limitations: (1) The availability of evaluation factors is limited. As an important basis of land use suitability evaluation, the integrity, accuracy and precision of basic data directly affect the accuracy of the results. Nevertheless, for most regions in China, basic data are difficult to obtain, especially confidential data such as soil pollution data. The data accuracy collected from different departments is uneven, leading to difficulties in processing. Therefore, the 18 indicators adopted in this study are limited, and the results are relatively accurate. In the future, big data should be used to integrate more resources and obtain more accurate evaluation results. (2) The application of suitability evaluation and land use conflict identification results. How can the living-production-ecological space be reasonably delimited? What are the suitable paths for industrial, population and spatial development in the Qin-Ba mountainous area? The LUCs results should be promoted to provide a basis for urban expansion, ecological land protection and production land allocation. Only by carrying out further empirical research on the above issues can the research be more convincing.

5. Conclusions

Under the current situation of contradiction between human and land resources, it is of great practical significance to analyze and diagnose potential conflict areas by using land use suitability to avoid land use risks, predict future land use alternatives and maximize the economic, social and environmental benefits of limited land resources. From the perspective of “living-production-ecology” functions, we constructed a reclassification system of land use and structured a multi-objective suitability evaluation model. Based on the permutation and combination law, an empirical model of conflict type identification and intensity diagnosis was established. Further, the model was carried out in Hengkou District. The results show that the land use fragmentation degree in Hengkou District was relatively high in 2017. A total of 22.03% of the total area belongs to potential land use conflict areas. The high conflict area accounts for more than half of the total conflict area, and the conflict between the production and ecological functions, and the living and production functions are the most widely distributed. They are mainly located in the fringe of the ecologically dominant area and urban area, which will most probably turn into actual conflicts in the future. It is necessary for the government to focus on potential conflict areas and carry out timely interest coordination and land management measures. This research could be used as an effective reference for land use planning and regional sustainable development.

Author Contributions

Conceptualization, W.J.; data curation, W.J.; formal analysis, K.Y. and P.L.; funding acquisition, K.Y.; investigation, K.Y. and P.L.; methodology, W.J.; project administration, L.W.; resources, L.W.; software, W.J.; supervision, K.Y. and L.W.; validation, K.Y.; visualization, W.J. and P.L.; writing—original draft, W.J.; writing—review and editing, W.J., K.Y. and P.L. All authors have read and agreed to the published version of the manuscript.

Funding

This research was supported by the National Natural Science Foundation of China (Grant No. 51808042).

Institutional Review Board Statement

Not applicable.

Informed Consent Statement

Not applicable.

Data Availability Statement

The data that support the findings of this study are available from the author upon reasonable request.

Conflicts of Interest

The authors declare no conflict of interest.

References

  1. Long, H.; Li, X. Cultivated-land Transition and Land Consolidation and Reclamation in China: Research progress and frame. Prog. Geogr. 2006, 25, 67–76. [Google Scholar]
  2. Ran, N.; Jin, X.; Fan, Y.; Xiang, X. Three lines’ delineation based on land use conflict identification and coordination in Jintan District, Changzhou. Resour. Sci. 2018, 40, 284–298. [Google Scholar]
  3. Bohua, Y.; Changhe, L. The progress and prospect of land use conflicts. Prog. Geogr. 2006, 25, 106–115. [Google Scholar]
  4. Campbell, D.J.; Gichohi, H.; Mwangi, A.; Chege, L. Land use conflict in Kajiado district, Kenya. Land Use Policy 2000, 17, 337–348. [Google Scholar] [CrossRef]
  5. Lian, H.; Lejano, R.P. Interpreting institutional fit: Urbanization, development, and China’s “land-lost”. World Dev. 2014, 61, 1–10. [Google Scholar] [CrossRef]
  6. Wei, Y.D.; Ye, X. Urbanization, Land Use, and Sustainable Development in China; Springer: Berlin/Heidelberg, Germany, 2014. [Google Scholar]
  7. Pan, J. From industrial toward ecological in China. Science 2012, 336, 1397. [Google Scholar] [CrossRef] [PubMed] [Green Version]
  8. Ye, L.; Wu, A.M. Urbanization, land development, and land financing: Evidence from Chinese cities. J. Urban Aff. 2014, 36, 354–368. [Google Scholar] [CrossRef]
  9. Zhou, D.; Xu, J.; Lin, Z. Conflict or coordination? Assessing land use multi-functionalization using production-living-ecology analysis. Sci. Total. Environ. 2017, 577, 136–147. [Google Scholar] [CrossRef]
  10. Mu, D.; Luo, P.; Lyu, J.; Zhou, M.; Huo, A.; Duan, W.; Nover, D.; He, B.; Zhao, X. Impact of temporal rainfall patterns on flash floods in Hue City, Vietnam. J. Flood Risk Manag. 2021, 14, e12668. [Google Scholar] [CrossRef]
  11. Luo, P.; Kang, S.; Zhou, M.; Lyu, J.; Aisyah, S.; Binaya, M.; Regmi, R.K.; Nover, D. Water quality trend assessment in Jakarta: A rapidly growing Asian megacity. PLoS ONE 2019, 14, e0219009. [Google Scholar] [CrossRef] [Green Version]
  12. Berry, D.; Plaut, T. Retaining agricultural activities under urban pressures: A review of land use conflicts and policies. Policy Sci. 1978, 9, 153–178. [Google Scholar] [CrossRef]
  13. Zou, L.; Liu, Y.; Wang, J.; Yang, Y.; Wang, Y. Land use conflict identification and sustainable development scenario simulation on China’s southeast coast. J. Clean. Prod. 2019, 238, 117899. [Google Scholar] [CrossRef]
  14. Ishiyama, N. Environmental justice and American Indian tribal sovereignty: Case study of a land–use conflict in Skull Valley, Utah. Antipode 2003, 35, 119–139. [Google Scholar] [CrossRef]
  15. Coyle, D.J. This land is your land, this land is my land: Cultural conflict in environmental and land-use regulation. In Politics, Policy, and Culture; Routledge: Milton Park, UK, 2019; pp. 33–50. [Google Scholar]
  16. Ayhan, Ç.K.; Taşlı, T.C.; Özkök, F.; Tatl, H. Land use suitability analysis of rural tourism activities: Yenice, Turkey. Tour. Manag. 2020, 76, 103949. [Google Scholar] [CrossRef]
  17. Willemen, L.; Hein, L.; van Mensvoort, M.E.; Verburg, P.H. Space for people, plants, and livestock? Quantifying interactions among multiple landscape functions in a Dutch rural region. Ecol. Indic. 2010, 10, 62–73. [Google Scholar] [CrossRef]
  18. Guo, B.; Wang, X.; Pei, L.; Su, Y.; Zhang, D.; Wang, Y. Identifying the spatiotemporal dynamic of PM2.5 concentrations at multiple scales using geographically and temporally weighted regression model across China during 2015–2018. Sci. Total. Environ. 2021, 751, 141765. [Google Scholar] [CrossRef] [PubMed]
  19. Guterbock, T.M. Sociology and the land-use problem. Urban Aff. Q. 1980, 15, 243–267. [Google Scholar] [CrossRef]
  20. Zhou, D.; Xu, J.; Wang, L. Research progress and Prospect of land use conflict in China in recent 15 years. China Land Sci. 2015, 29, 21–29. (In Chinese) [Google Scholar]
  21. Hersperger, A.M.; Ioja, C.; Steiner, F.; Tudor, C.A. Comprehensive consideration of conflicts in the land-use planning process: A conceptual contribution. Carpathian J. Earth Environ. Sci. 2015, 10, 5–13. [Google Scholar]
  22. Reuber, P. Conflict studies and critical geopolitics—theoretical concepts and recent research in political geography. GeoJournal 2000, 50, 37–43. [Google Scholar] [CrossRef]
  23. Nash, N.; Lewis, A.; Griffin, C. Not in our front garden: Land use conflict, spatial meaning and the politics of naming place. J. Community Appl. Soc. Psychol. 2010, 20, 44–56. [Google Scholar] [CrossRef]
  24. Kim, I.; Arnhold, S. Mapping environmental land use conflict potentials and ecosystem services in agricultural watersheds. Sci. Total. Environ. 2018, 630, 827–838. [Google Scholar] [CrossRef] [PubMed]
  25. Zhang, Y.; Li, A.; Fung, T. Using GIS and multi-criteria decision analysis for conflict resolution in land use planning. Procedia Environ. Sci. 2012, 13, 2264–2273. [Google Scholar] [CrossRef] [Green Version]
  26. Brown, G.; Raymond, C.M. Methods for identifying land use conflict potential using participatory mapping. Landsc. Urban Plan. 2014, 122, 196–208. [Google Scholar] [CrossRef]
  27. Gong, J.; Liu, Y.; Chen, W. Land suitability evaluation for development using a matter-element model: A case study in Zengcheng, Guangzhou, China. Land Use Policy 2012, 29, 464–472. [Google Scholar] [CrossRef]
  28. Jensen, D.; Baird, T.; Blank, G. New landscapes of conflict: Land-use competition at the urban–rural fringe. Landsc. Res. 2019, 44, 418–429. [Google Scholar] [CrossRef]
  29. Yusran, Y.; Sahide, M.A.K.; Supratman, S.; Sabar, A.; Krott, M.; Giessen, L. The empirical visibility of land use conflicts: From latent to manifest conflict through law enforcement in a national park in Indonesia. Land Use Policy 2017, 62, 302–315. [Google Scholar] [CrossRef]
  30. Mann, C.; Jeanneaux, P. Two approaches for understanding land-use conflict to improve rural planning and management. J. Rural. Community Dev. 2009, 4(1), 118–141. [Google Scholar]
  31. Peng, J.; Zhao, M.; Guo, X.; Pan, Y.; Liu, Y. Spatial-temporal dynamics and associated driving forces of urban ecological land: A case study in Shenzhen City, China. Habitat Int. 2017, 60, 81–90. [Google Scholar] [CrossRef]
  32. Magsi, H.; Torre, A.; Liu, Y.; Sheikh, M.J. Land use conflicts in the developing countries: Proximate driving forces and preventive measures. Pak. Dev. Rev. 2017, 56, 19–30. [Google Scholar] [CrossRef] [Green Version]
  33. Bohua, L.; Can, Z.; Yindi, D. Change of human settlement environment and driving mechanism in traditional villages based on living-production-ecological space: A case study of lanxi village, Jiangyong County, Hunan Province. Prog. Geogr. 2018, 37, 677–687. (In Chinese) [Google Scholar]
  34. Zhang, J. Reducing Land-Use Conflict: Impacts of Leasing Arrangements on Livestock and Rangelands in Laikipia, Kenya. Senior Thesis, Princeton University, Princeton, NJ, USA, 2019. [Google Scholar]
  35. Petrescu-Mag, R.M.; Petrescu, D.C.; Azadi, H.; Petrescu-Mag, I.V. Agricultural land use conflict management—Vulnerabilities, law restrictions and negotiation frames. A wake-up call. Land Use Policy 2018, 76, 600–610. [Google Scholar] [CrossRef]
  36. Barnaud, C.; Le Page, C.; Dumrongrojwatthana, P.; Trébuil, G. Spatial representations are not neutral: Lessons from a participatory agent-based modelling process in a land-use conflict. Environ. Model. Softw. 2013, 45, 150–159. [Google Scholar] [CrossRef]
  37. Evans, J.D.; Kirkpatrick, J.B.; Bridle, K.L. A reciprocal triangulation process for identifying and mapping potential land use conflict. Environ. Manag. 2018, 62, 777–791. [Google Scholar] [CrossRef]
  38. Yongfang, Y.; Qian, A.; Lianqi, Z. Diagnosis based on the PSR model of rural land-use conflicts intensity. Prog. Geogr. 2012, 31, 1552–1560. [Google Scholar]
  39. Zhao, J.; Luo, Z.; Zhao, Y.; Gao, L.; Ran, F.; Jiang, C. Diagnosis of the intensity of regional land use conflict based on improved grey target model: A case of Nanchang City. Acta Agric. Univ. Jiangxiensis 2017, 39, 1256–1263. [Google Scholar]
  40. Lihong, L.; Wenyuan, D.; Juan, C. Spatial conflict between ecological-production-living spaces on Pingtan Island during rapid urbanization. Resour. Sci. 2017, 39, 1823. [Google Scholar]
  41. Ye, Q.; Wei, R.; Zhang, P. A conflict identification method of Urban, agricultural and ecological spaces based on the space conversion matrix. Sustainability 2018, 10, 3502. [Google Scholar] [CrossRef] [Green Version]
  42. Min, J.; Wang, Y.; Bai, R.; Zhang, J.; Kong, X. The research on identification of land use potential conflict based on multiobjective suitability evaluation on mountainous city: A case study of Qijiang district of Chongqing municipality. J. Chongqing Norm. Univ. (Nat. Sci.) 2018, 35, 83–89. [Google Scholar]
  43. Wei, C.; Xuelu, L. The research on identification of potential land use conflict based on suitability evaluation—A case study on Honghe County of Yunnan Province. J. Gansu Agric. Univ. 2015, 50, 123. [Google Scholar]
  44. Qiaoqin, L.; Huafu, Z.; Kening, W. Identifying potential land use conflict based on competitiveness of different land use types in Beijing. China 2014, 36, 1579–1589. [Google Scholar]
  45. Santé-Riveira, I.; Crecente-Maseda, R.; Miranda-Barrós, D. GIS-based planning support system for rural land-use allocation. Comput. Electron. Agric. 2008, 63, 257–273. [Google Scholar] [CrossRef]
  46. Luo, P.; Mu, D.; Xue, H.; Ngo-Duc, T.; Dang-Dinh, K.; Takara, K.; Nover, D.; Schladow, G. Flood inundation assessment for the Hanoi Central Area, Vietnam under historical and extreme rainfall conditions. Sci. Rep. 2018, 8, 1–11. [Google Scholar] [CrossRef] [PubMed]
  47. Liu, Y.-S.; Wang, J.-Y.; Guo, L.-Y. GIS-based assessment of land suitability for optimal allocation in the Qinling Mountains, China. Pedosphere 2006, 16, 579–586. [Google Scholar] [CrossRef]
  48. Reshmidevi, T.; Eldho, T.; Jana, R. A GIS-integrated fuzzy rule-based inference system for land suitability evaluation in agricultural watersheds. Agric. Syst. 2009, 101, 101–109. [Google Scholar] [CrossRef]
  49. Akıncı, H.; Özalp, A.Y.; Turgut, B. Agricultural land use suitability analysis using GIS and AHP technique. Comput. Electron. Agric. 2013, 97, 71–82. [Google Scholar] [CrossRef]
  50. Fontes, M.P.; Fontes, R.M.; Carneiro, P.A. Land suitability, water balance and agricultural technology as a Geographic-Technological Index to support regional planning and economic studies. Land Use Policy 2009, 26, 589–598. [Google Scholar] [CrossRef]
  51. Huang, A.; Xu, Y.; Lu, L.; Liu, C.; Zhang, Y.; Hao, J.; Wang, H. Research progress of the identification and optimization of production-living-ecological spaces. Prog. Geogr. 2020, 39, 503–518. [Google Scholar] [CrossRef]
  52. Odum, E.P. The strategy of ecosystem development. In The Ecological Design and Planning Reader; Springer: Berlin/Heidelberg, Germany, 2014; pp. 203–216. [Google Scholar]
  53. Carr, M.H.; Zwick, P.D. Smart Land-Use Analysis: The LUCIS Model Land-Use Conflict Identification Strategy; ESRI, Inc.: Redlands, CA, USA, 2007. [Google Scholar]
  54. Liu, Y. Introduction to land use and rural sustainability in China. Land Use Policy 2018, 74, 1–4. [Google Scholar] [CrossRef]
  55. Jilai, L.; Yansui, L.; Yurui, L. Classification evaluation and spatial-temporal analysis of “production-living-ecological”spaces in China. J. Geogr. Sci. 2017, 72, 1290–1304. (In Chinese) [Google Scholar]
  56. Wantai, H.; Liguo, W.; Muhui, S. Reflections on delimiting the three basic spaces in the complication of urban and rural plans. Urban Plan. 2016, 40, 21–26. (In Chinese) [Google Scholar]
  57. Jinchuan, H.; Haoxi, L.; Xiaoxiao, Q. A literature review on optimization of spatial development pattern based on ecological-production-living space. Prog. Geogr. 2017, 36, 378–391. [Google Scholar]
  58. Tu, S.; Long, H.; Zhang, Y.; Ge, D.; Qu, Y. Rural restructuring at village level under rapid urbanization in metropolitan suburbs of China and its implications for innovations in land use policy. Habitat Int. 2018, 77, 143–152. [Google Scholar] [CrossRef]
  59. Iojă, C.I.; Niţă, M.R.; Vânău, G.O.; Onose, D.A.; Gavrilidis, A.A. Using multi-criteria analysis for the identification of spatial land-use conflicts in the Bucharest Metropolitan Area. Ecol. Indic. 2014, 42, 112–121. [Google Scholar] [CrossRef]
  60. Romano, G.; Dal Sasso, P.; Liuzzi, G.T.; Gentile, F. Multi-criteria decision analysis for land suitability mapping in a rural area of Southern Italy. Land Use Policy 2015, 48, 131–143. [Google Scholar] [CrossRef]
  61. Zhu, Y.; Luo, P.; Zhang, S.; Sun, B. Spatiotemporal analysis of hydrological variations and their impacts on vegetation in semiarid areas from multiple satellite data. Remote Sens. 2020, 12, 4177. [Google Scholar] [CrossRef]
  62. Shukui, T. Discussion on classification scheme of land conflict in China. Chin. J. Agric. Resour. Reg. Plan. 2008, 4, 27–30. [Google Scholar]
  63. Bin, P.; Tao, P. Land use system dynamic modeling: Literature review and future research direction in China. Prog. Geogr. 2010, 29, 1060–1066. [Google Scholar]
  64. Zhang, Y.; Luo, P.; Zhao, S.; Kang, S.; Wang, P.; Zhou, M.; Lyu, J. Control and remediation methods for eutrophic lakes in the past 30 years. Water Sci. Technol. 2020, 81, 1099–1113. [Google Scholar] [CrossRef] [PubMed]
  65. da Silva Neves, S.M.A.; Nunes, M.C.M.; Neves, R.J.; Kreitlow, J.P.; dos Santos Galvanin, E.A. Susceptibility of soil to hydric erosion and use conflicts in the microregion of Tangará da Serra, Mato Grosso, Brazil. Environ. Earth Sci. 2015, 74, 813–827. [Google Scholar] [CrossRef]
Figure 1. Research location and land use status map for 2017. (a) Qin-Ba mountainous area in China; (b) Elevation analysis of Qin-Ba mountainous area and the site of Hengkou District; (c) Land use of Hengkou District.
Remotesensing 13 02416 g001
Figure 2. The flowchart of analytical steps of the research.
Remotesensing 13 02416 g002
Figure 3. Empirical model for identification of potential land use conflicts.
Remotesensing 13 02416 g003
Figure 4. Collection of single-factor spatial analysis results. (a) Slope aspect; (b) Slope; (c) Altitude; (d) NDVI; (e) Soil texture; (f) Distance of rivers; (g) Distance of natural disasters; (h) Ecological protection line; (i) Boundary of construction land; (j) Boundary of basic farmland; (k) Grain yield per unit area; (l) Per capita cultivated land area; (m) Population density; (n) Per capita net income; (o) Distance from main traffic routes; (p) Classification of ecological land; (q) Classification of production land; (r) Classification of living land; (s) Distance from main service facilities; (t) Distance from the town.
Remotesensing 13 02416 g004
Figure 5. Unit frequency distribution histogram of Living-Production-Ecological suitability score. (a) Unit frequency distribution histogram of living suitability score; (b) Unit frequency distribution histogram of production suitability score; (c) Unit frequency distribution histogram of ecological suitability score.
Remotesensing 13 02416 g005
Figure 6. Distribution map of Living-Production-Ecological suitability in Hengkou District. (a) Map of living suitability; (b) Map of production suitability; (c) Map of ecological suitability.
Remotesensing 13 02416 g006
Figure 7. Distribution of dominant and potential conflict areas in Hengkou District. (a) Map of dominant and potential conflict areas; (b) Map of dominant areas; (c) Map of potential conflict areas.
Remotesensing 13 02416 g007
Figure 8. Distribution of potential conflict areas based on type and intensity classification in Hengkou District. (a) Map of high conflict areas; (b) Map of moderate potential conflict areas; (c) Map of low potential conflict areas.
Remotesensing 13 02416 g008
Table 1. Comparison of three land use classifications.
Land Management LawCurrent Land Use Classification (GB/T21010–2007)Classification of Living-Production-EcologyDifferences
First-ClassSecond-ClassLivingProductionEcology
Agricultural landCropland-L-dP-bE-bEmphasizing the ecological function of agricultural land
Garden-L-dP-bE-b
GrasslandNatural grasslandL-dP-cE-a
Artificial grasslandL-dP-cE-c
OtherFacility agricultural landL-dP-bE-c
RidgeL-dP-bE-b
Water and conservancy facilities landPondL-dP-cE-c
DitchL-dP-bE-c
Construction landReservoirL-dP-cE-cEmphasizing the production function of construction land
Land for public management and service facilitiesLand for scenic spots and facilitiesL-bP-bE-d
Park and green landL-bP-dE-cEmphasizing the ecological function of urban construction land
Table 2. Evaluation factors and weights of living suitability.
PrincipalWeightIndexWeightGrading and Assignment
13579
Natural conditions0.4133Slope0.6370>3525–3515–258–15<8
Altitude/m0.2853<400400–600600–800800–1000>1000
Distance from river/m0.1047>20001500–20001000–1500500–1000<500
Land management0.1076Construction land expansion boundary0.6667-outside-inside-
Distance from natural disasters (m)0.3333<15001500–25002500–35003500–5500>5500
Current land use0.2922-1.0000L-dL-cL-b-L-a
Public services0.1867Population density0.53960.007–0.1100.110–0.1900.190–0.2760.276–0.4280.428–0.865
Distance from main roads (m)0.2382<100100–500500–10001000–1500>1500
Distance from main service facilities (m)0.1416<10001000–20002000–30003000–4000>4000
Distance from the urban0.16340.008–0.1100.110–0.1900.190–0.2760.276–0.4280.428–0.865
Table 3. Evaluation factors and weights of production suitability.
PrincipalWeightIndexWeightGrading and Assignment
13579
Natural conditions0.3369Slope0.3028>3525–3515–258–15<8
Altitude (m)0.0809<400400–600600–800800–1000>1000
Slope aspect0.0865-shadyhalf shady half sunnysunny
Distance from rivers (m)0.3045>20001500–20001000–1500500–1000<500
Physical clay content of soil (%)0.2254-15
(sandy loam)
-26/28/29
(light loam)
31
(medium loam)
Land management0.1416Basic farmland protection line0.6667-outside-inside-
Distance from natural disasters (m)0.3333<15001500–25002500–35003500–5500>5500
Current land use0.2382--P-dP-c-P-bP-a
Utilization level0.2833Grain yield (tons/ha)0.53960.007–0.1100.110–0.1900.190–0.2760.276–0.4280.428–0.865
Cultivated land (mu/per)0.16340.008–0.1100.110–0.1900.190–0.2760.276–0.4280.428–0.865
Per-capita net income (Yuan/Per)0.2970<68506850–91209120–10,85010,850–12,230>12,230
Table 4. Evaluation factors and weights of ecological suitability.
PrincipalWeightIndexWeightGrading and Assignment
13579
Natural environment0.400Slope0.1921<88–1515–2525–35>35
Altitude/m0.0626<400400–600600–800800–1000>1000
NDVI0.43040.226–0.4120.163–0.2260.116–0.1630.065–0.116−0.087–0.065
Distance from rivers/m0.3147>20001500–20001000–1500500–1000<500
Land management0.200Ecological land Protection line0.6667-outside-inside-
Distance from natural disasters/m0.3333>55003500–55002500–35001500–2500<1500
Current land use0.400--E-dE-cE-b-E-a
Table 5. Results of Living-Production-Ecological suitability evaluation in Hengkou District.
Suitability ClassificationLiving SuitabilityProduction SuitabilityEcological Suitability
L1L2L3P1P2P3E1E2E3
Score range6.5–9.03.5–6.50.6–3.50.7–2.62.6–4.94.9–8.96.0–9.02.4–6.00.3–2.4
Area (km2)19.78156.86195.72113.92122.65135.79215.01135.0122.34
Percent (%)5.3142.1352.5630.5932.9436.4757.7536.256.00
Table 6. Intensity, type and area of potential conflict areas in Hengkou District.
IntensityHighModerateLow
TypeL2P1E1
L3P1E1
L1P1E2
L1P1E3
L1P2E1
L1P3E1
L1P1E1L2P2E2L3P2E2L2P2E3L2P3E2L3P3E3
Area (km2)33.568.911.990.9218.219.456.172.230.59
Sum (km2)45.3836.060.59
Percent (%)55.3243.950.73
Publisher’s Note: MDPI stays neutral with regard to jurisdictional claims in published maps and institutional affiliations.

