Article

Detection of Upper and Lower Planetary-Boundary Layer Curves and Estimation of Their Heights from Ceilometer Observations under All-Weather Conditions: Case of Athens, Greece

by
Harry D. Kambezidis
*,
Basil E. Psiloglou
,
Ariadne Gavriil
and
Kalliopi Petrinoli
Institute of Environmental Research and Sustainable Development, National Observatory of Athens, GR-11810 Athens, Greece
*
Author to whom correspondence should be addressed.
Remote Sens. 2021, 13(11), 2175; https://doi.org/10.3390/rs13112175
Submission received: 26 April 2021 / Revised: 26 May 2021 / Accepted: 28 May 2021 / Published: 2 June 2021
(This article belongs to the Special Issue Feature Papers of Section Atmosphere Remote Sensing)

Abstract

:
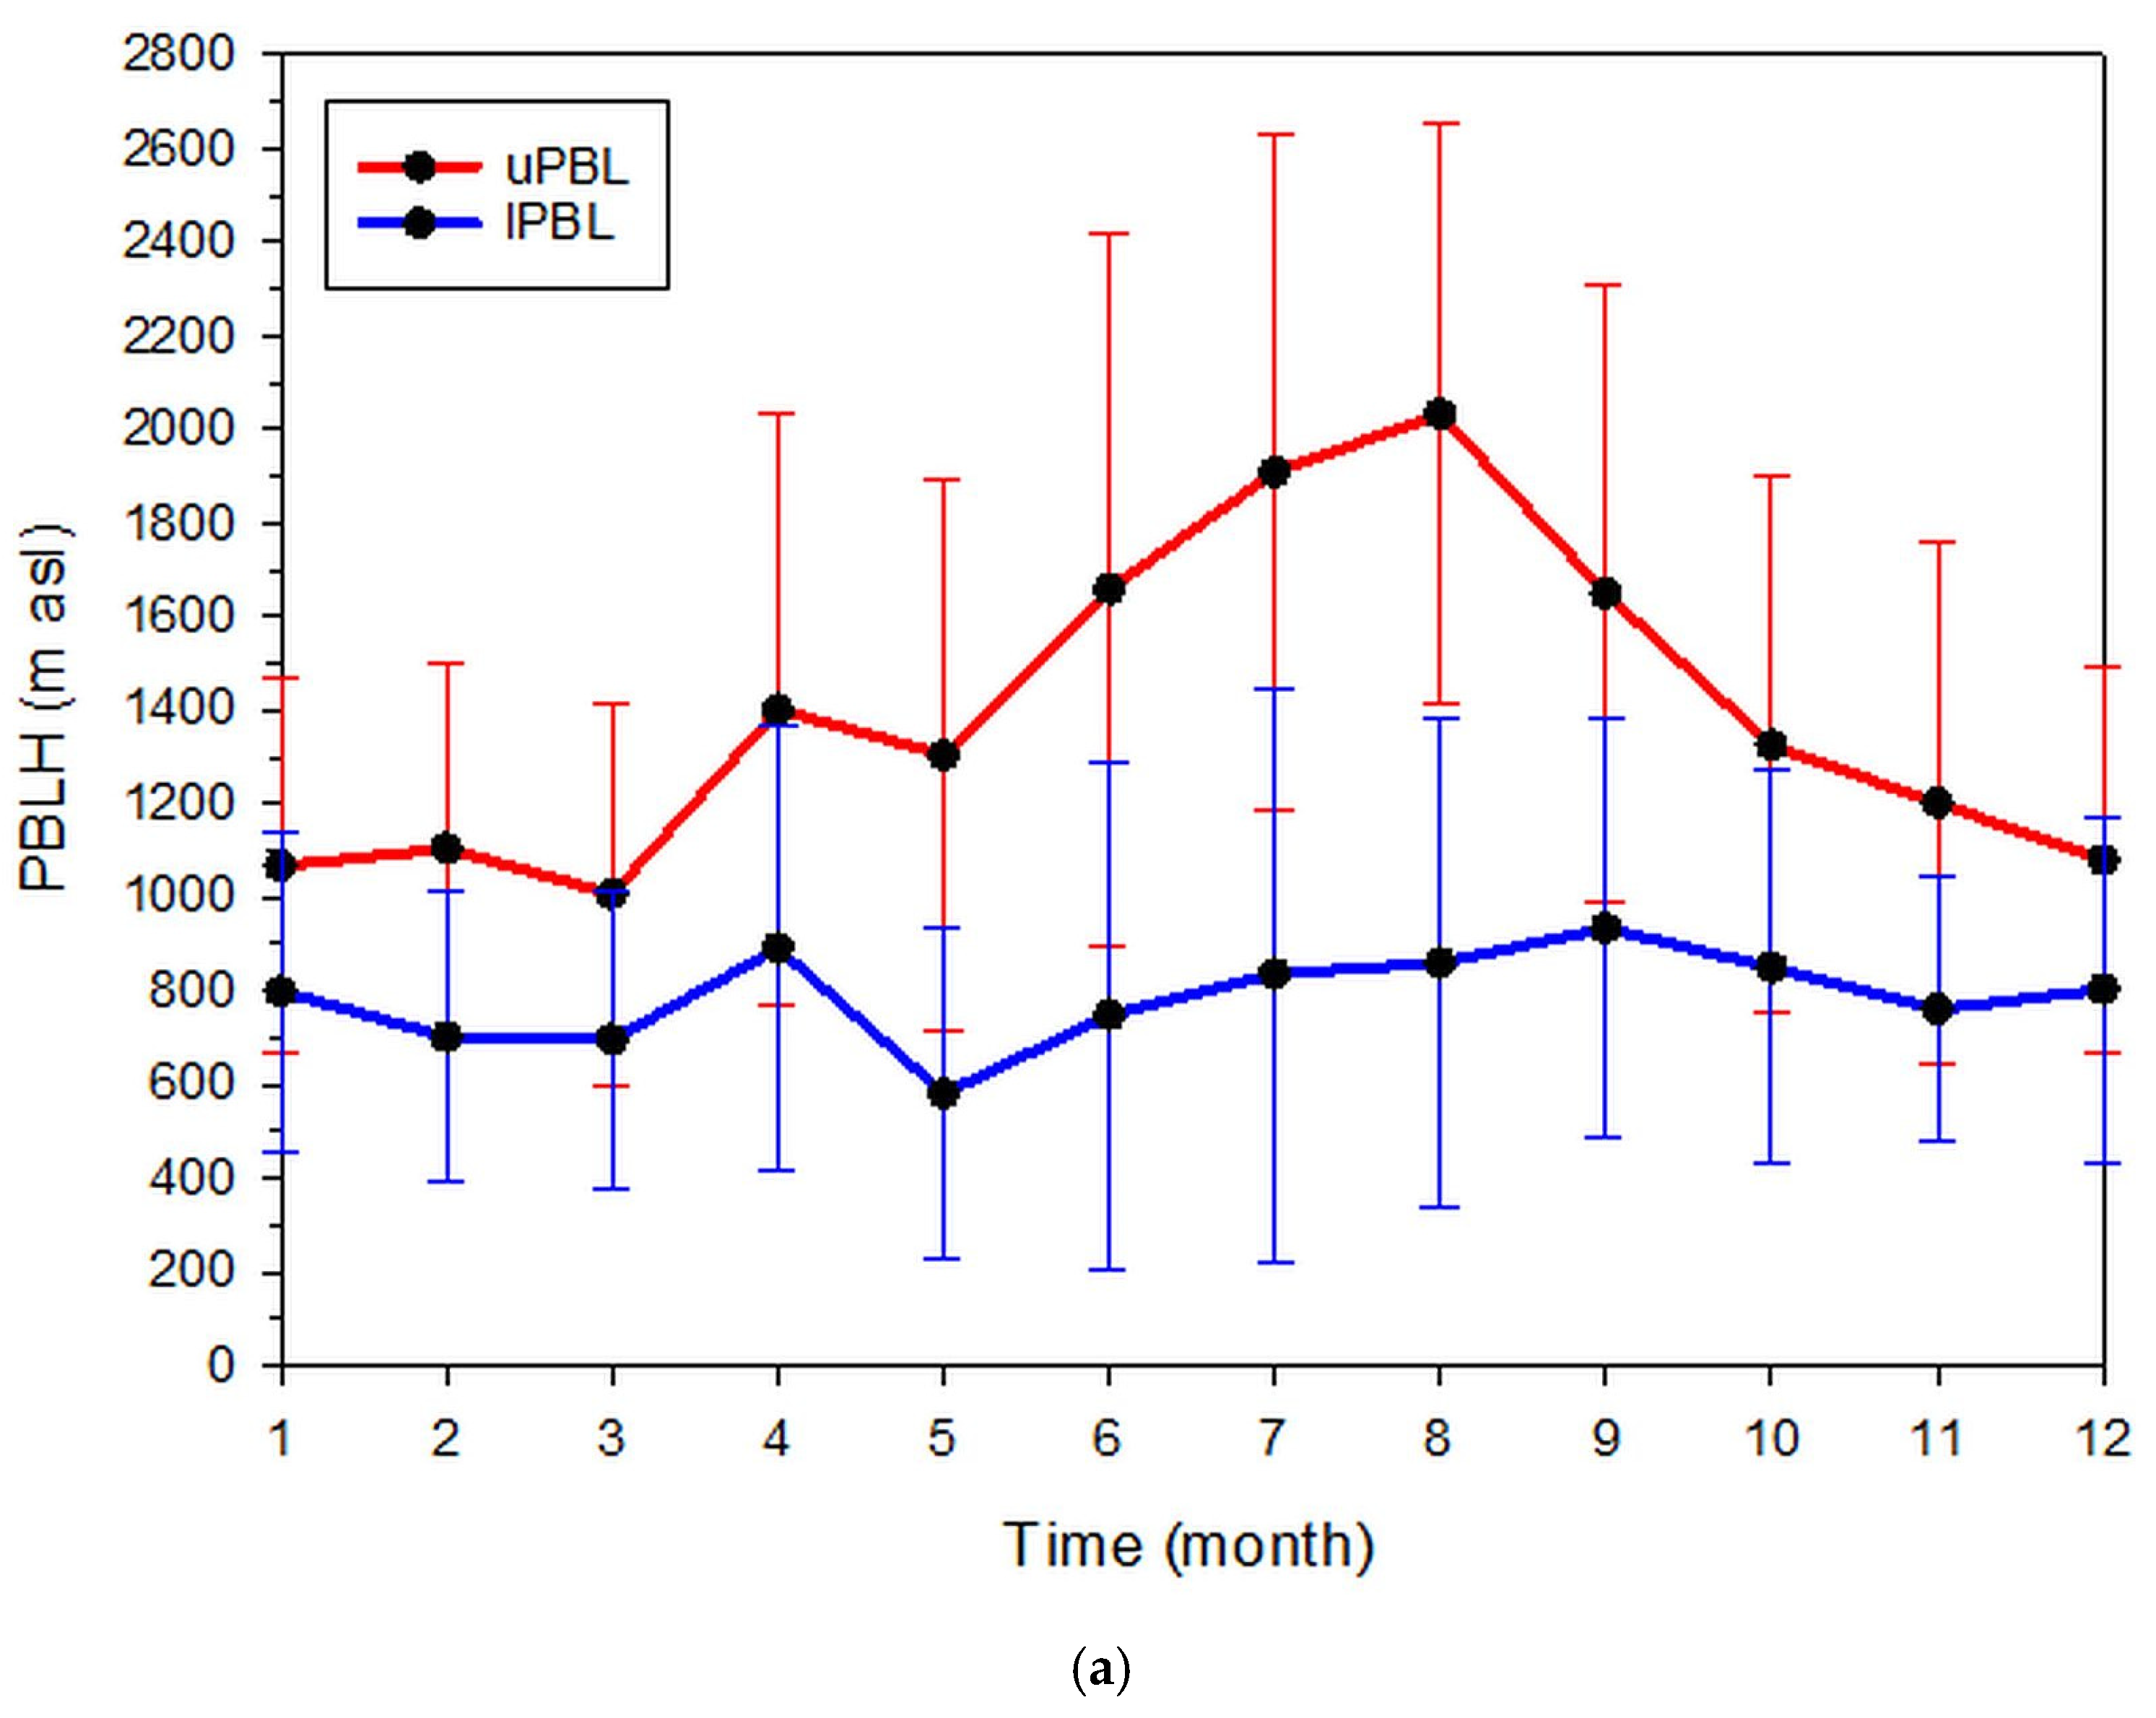
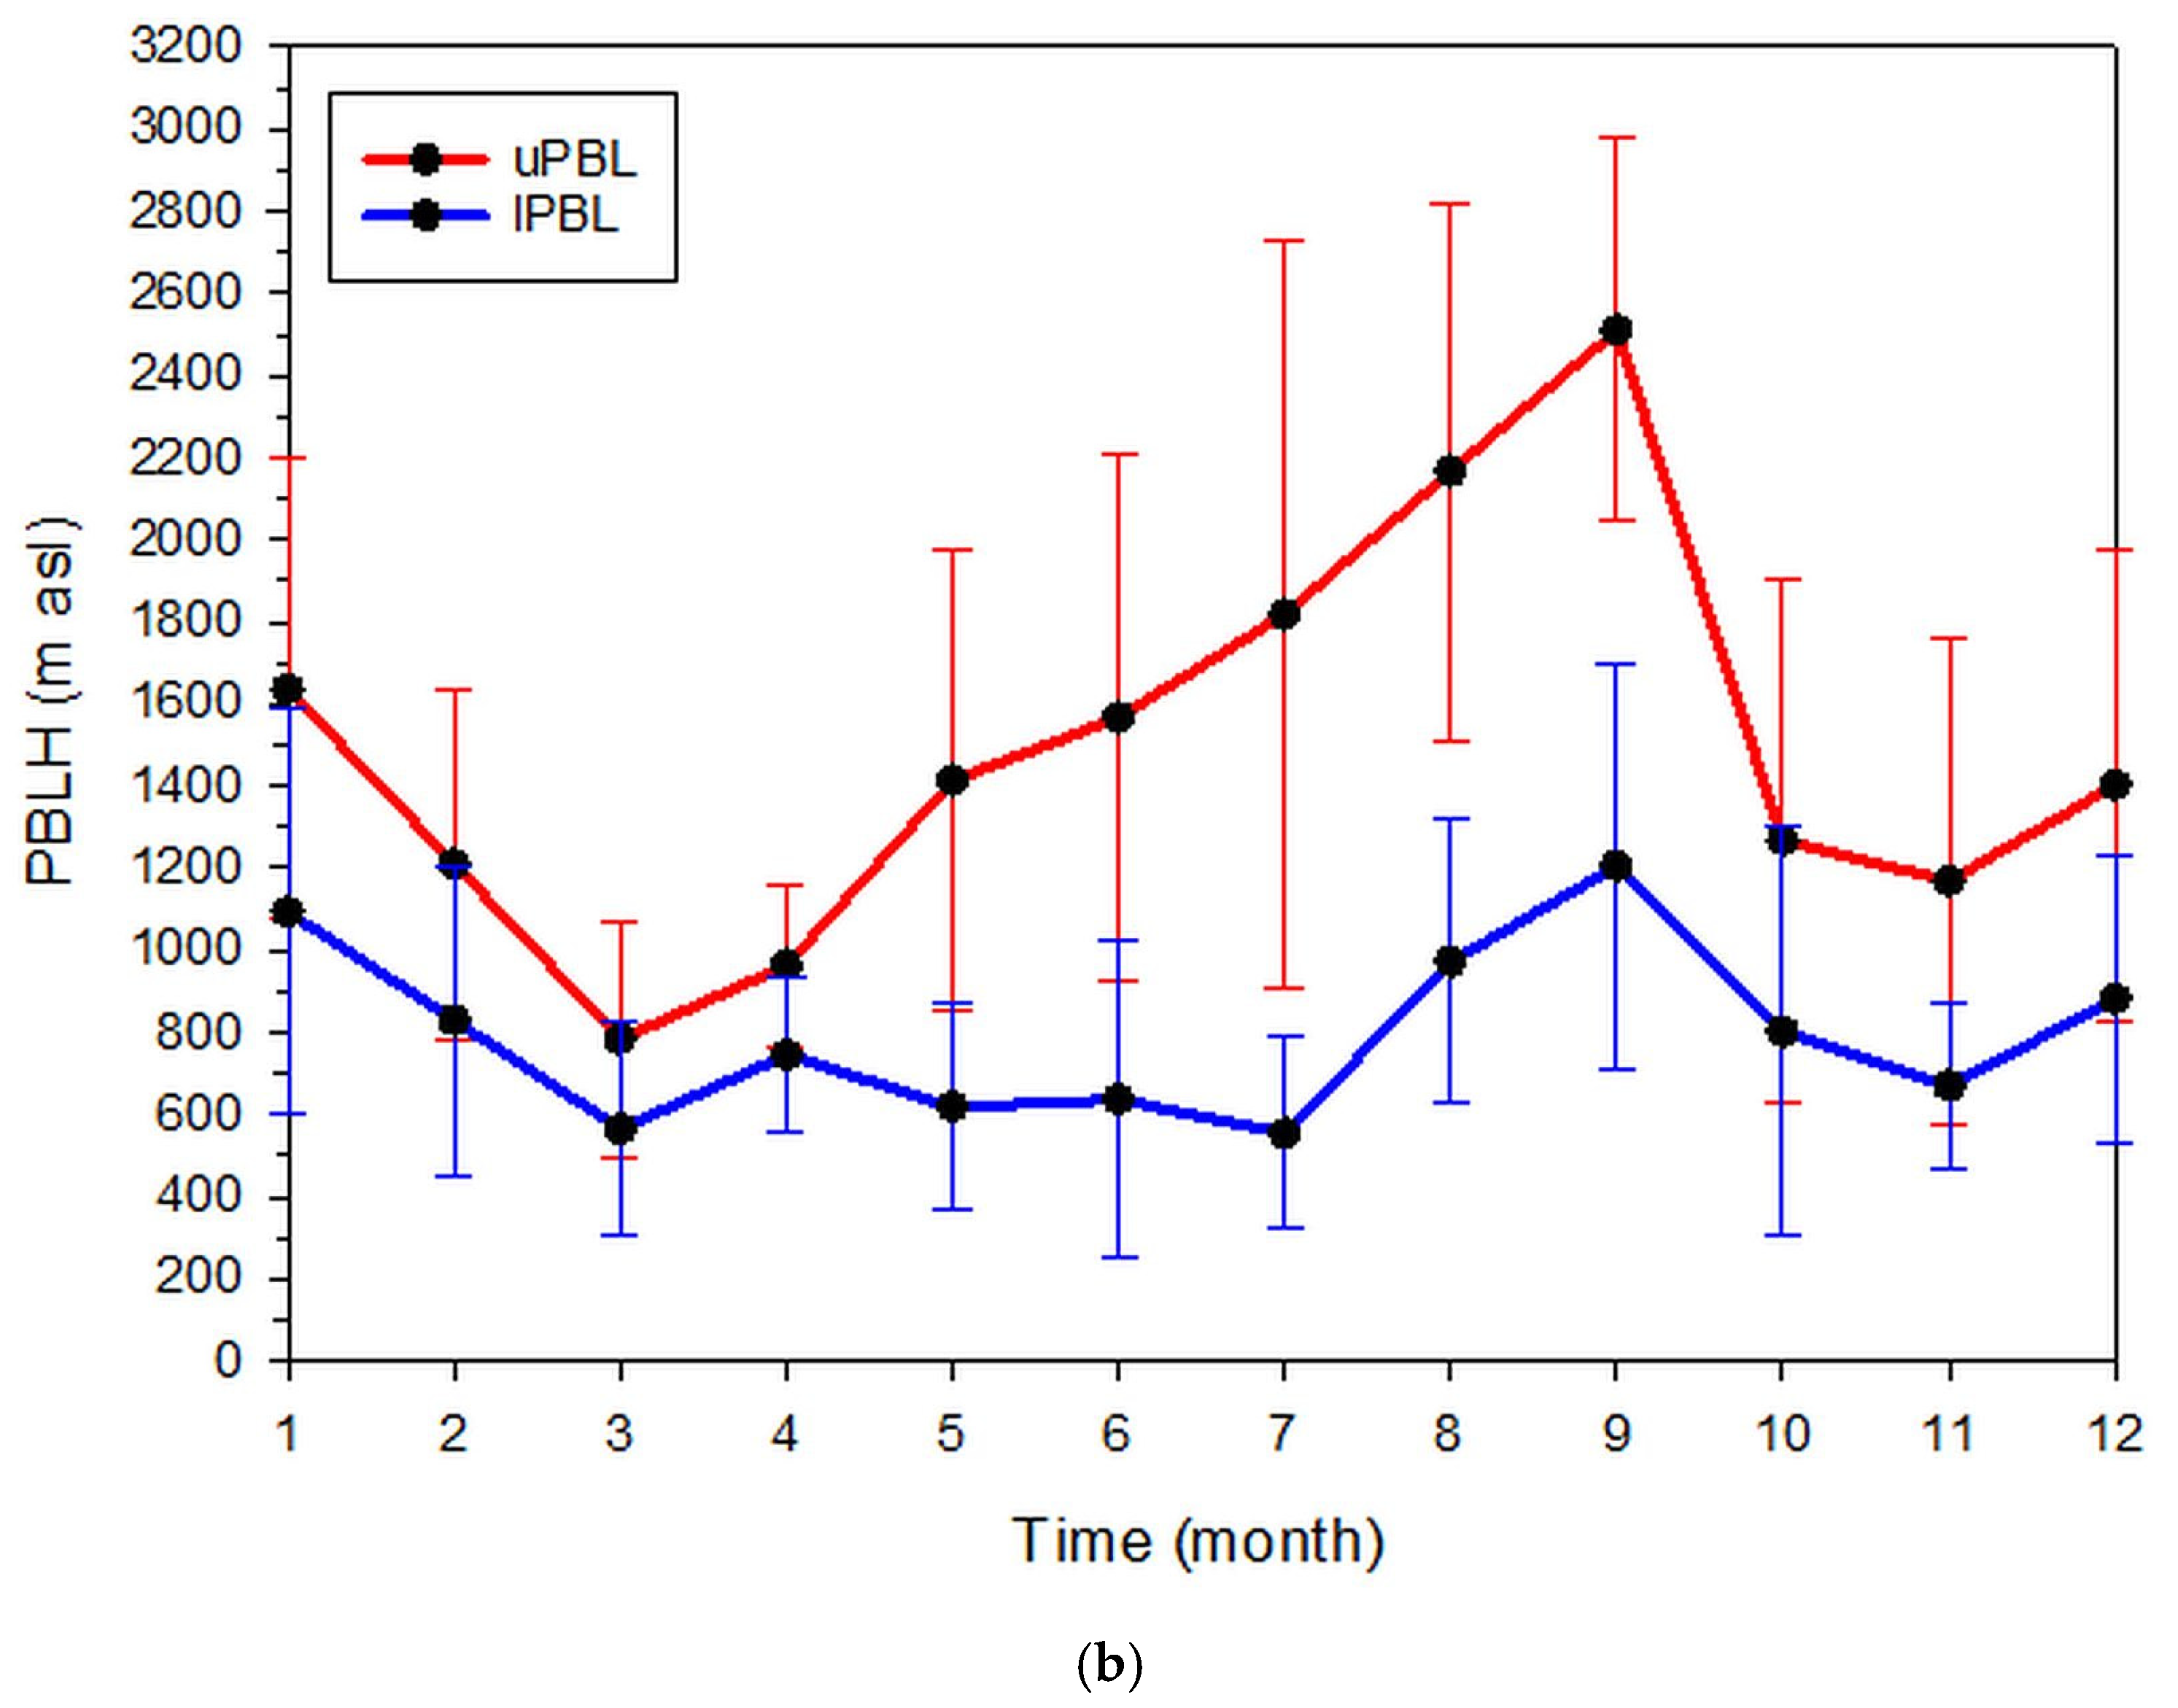
The planetary-boundary layer (PBL) plays an important role in air-pollution studies over urban/industrial areas. Therefore, numerous experimental/modelling efforts have been conducted to determine the PBL height and provide statistics. Nowadays, remote-sensing techniques such as ceilometers are valuable tools in PBL-height estimation. The National Observatory of Athens operates a Vaisala CL31 ceilometer. This study analyses its records over a 2-year period and provides statistics about the PBL height over Athens. A specifically developed algorithm reads the CL31 records and estimates the PBL height. The algorithm detects an upper and a lower PBL curve. The results show maximum values of about 2500 m above sea level (asl)/3000 m asl in early afternoon hours in all months for upper PBL, and particularly the summer ones, under all-/clear-sky conditions, respectively. On the contrary, the lower PBL does not possess a clear daily pattern. Nevertheless, one morning and another afternoon peak can be identified. The intra-annual variation of the upper PBL height shows a peak in August in all-weather conditions and in September under clear-sky ones. Season-wise, the upper PBL height varies showing an autumn peak for all-weather cases, while the lower PBL height shows a winter maximum due to persistent surface-temperature inversions in this season.

1. Introduction

The planetary-boundary layer (PBL) is the lower part of the troposphere where the Earth’s surface interacts with large-scale atmospheric flows. Substances emitted into the PBL disperse through atmospheric turbulence horizontally and vertically in a gradual way. If sufficient time is given, this mixing becomes homogeneous. Provided that sinks and sources are absent in this mixing process, Seibert et al. [1] call this layer the mixing or mixed layer (ML). Compton et al. [2] report that the daytime PBL consists of a near-ground unstable surface layer (SL) with a depth of a few tens of metres, the ML on top of the SL with a thickness of few kilometres, and the ML is capped by the entrainment zone (EZ) of a depth of a few hundred metres. Further, they report that at night, the ML collapses and forms a stable nocturnal-boundary layer (NBL), a few hundred metres thick over the ground. Above the NBL the residual layer (RL) exists, which is the leftover of the previous day’s ML. The RL is covered by a capping inversion (CI). The height of the ML is called the mixing-layer height (MLH).
The MLH is a key parameter in air-pollution studies, because it determines the atmospheric volume that air pollutants can occupy [1]. The MLH can be determined from radiosonde soundings (e.g., [3,4,5]), tethered balloons (e.g., [6]), aircrafts (e.g., [7]), remote-sensing systems (i.e., satellites, lidars, sodars, ceilometers, microwave radiometers, e.g., [8,9,10,11,12,13]), or parameterisation methods (e.g., [14]). Nevertheless, all these methodologies have intrinsic advantages and disadvantages, which are related to the assumed properties of the PBL. The radiosondes are considered reference instruments for MLH detection, but they have disadvantages as their launch is performed twice a day and they are also drifted by the wind. The tethered balloons have the same advantages as radiosondes, but they reach a maximum altitude that depends upon the length of the cable; they are also vulnerable to drifting as radiosondes are. Aircrafts do a good job as they are flexible in sweeping various atmospheric layers in short time periods; nevertheless, their flight cost is sometimes prohibitive. Nowadays, the remote-sensing systems are promising instruments in many aspects of atmospheric science, including detection of the MLH. Their hardware and software development is in continuous progress, which makes them ideal. Atmospheric modelling is another issue for determining the MLH at a site. However, its accuracy is limited by the parameterisation methods introduced; its advantage is the very low cost in comparison with the other methods, but validation of the results is always needed against radiosonde soundings. On the other hand, the MLH (and consequently the formation of the PBL) heavily depends upon synoptic and local weather situations. Over land in central Europe, the MLH can easily reach 2000 m or more above ground during the spring and summer [15]. In fair weather, the PBL height has a well-defined structure and a diurnal cycle [16]; during the daytime (i.e., in the period shortly after sunrise and just before sunset), surface heating from below occurs when the net radiation is positive, which leads to the ML formation or the convective-boundary layer (CBL); during nighttime (i.e., just after sunset and before sunrise) heat loss to space terminates convection and a stable-boundary layer (SBL) is created, which is capped by the RL. The SBL consists of the SL and a thin NBL, which is capped by a surface-temperature inversion (STI, [17]). The height of this inversion is about 300 m above ground. Around noon, the ML and the PBL heights usually coincide.
At the top of the PBL, there is usually a temperature inversion, decrease in humidity, and strong turbulence. Therefore, the Richardson number (Ri) is often used to detect the MLH from radiosonde profiles [18]. However, automatic lidars and ceilometers (ALCs), due to their compact design, low cost, and high-range resolution (≈10 m), are advantageous in this respect. ALCs have been used in aerosol studies within the PBL (e.g., [19]), Saharan-dust transport (e.g., [20]), biomass-burning activities (e.g., [21]), and volcanic-ash events (e.g., [22,23]). ALCs have been developed as cloud-base-height-detection instruments; due to their high spatial resolution, they can identify multiple cloud layers [24]. In particular, the Vaisala CL31 ceilometer [25], which is used in this work, can detect up to 3 layers for low, mid, and high clouds. Nevertheless, besides their advantages, ceilometers are sensitive to water vapour [26] and aerosols [27]. Moreover, another drawback of ceilometers and generally ALCs is the inaccuracy in detecting the MLH in the evening transition period [28]. Wiegner and Gasteiger [26] have provided a correction to the ceilometer-wavelength absorption due to the water-vapour effect. On the other hand, the sensitivity of ceilometers to atmospheric aerosols is fully exploited as a vehicle in the detection of the MLH [15].
Several ceilometers are now in 24-h-basis operation by various national weather services [29], and their number is growing rapidly. Many of these ceilometers belong to ALC networks; such a network is the European PROFILE (E-PROFILE) [30] that is under the European Meteorological Services Network [31] auspices. The National Observatory of Athens’s (NOA) CL31 ceilometer (see Section 2.1 for description) joint the E-PROFILE network in June 2018.
All works and projects up to now having used the above-mentioned techniques for detecting the PBL height refer mostly to case studies (e.g., [15,26,27,32,33,34,35,36]). Few studies, though, give a climatologically based PBL height analysis from ceilometer data recorded in a short period of time (e.g., [3,34,37]). Therefore, there is a lack of applying the retrieval method(s) to long-term ceilometer data for the determination of the PBL climatology at a location. This gap is filled in the present study. The data of the actinometric station of NOA’s (ASNOA) ceilometer have been used in the period October 2008–September 2010 in order to estimate the PBL height over Athens and derive climatological statistics. This new method is fully described in Section 2.
As far as the determination of the ML height from ceilometer observations is concerned, there are quite a few studies. Emeis et al. [38] presented a comparison of the PBL height from Sonic Detection and Ranging (SODAR) system, Radio Acoustic Sounding System (RASS), and ceilometer retrievals; they found that the ceilometer-determined MLH is in agreement with that estimated by the other two techniques. De Haij et al. [39] applied the Haar-wavelet function to a Vaisala LD40 ceilometer operating at the Dutch Royal Meteorological Institute (KNMI), De Bilt, the Netherlands, to derive the MLH over the area. Emeis et al. [40] derived the MLH over Augsburg, Germany, on a single day as a comparison between two Vaisala ceilometers (CL31 and LD40). Lotteraner and Piringer [41] estimated the MLH over Vienna and Obersiebenbrunn, Austria, in the period July 2013–June 2014. Mues et al. [34] investigated the MLH over Kathmandu Valley, Nepal, with a Vaisala CL31 ceilometer during the SusKat-ABC field campaign [42] and related it to local air pollution. Di Giuseppe et al. [43] have presented an automatic detection of the PBL height from ceilometer-backscatter data assisted by a boundary-layer model. Recently, Kokkalis et al. [37] presented an analysis of lidar data and gave statistical results of the PBL height over Athens for a period of 6 years using the extended-Kalman filtering technique. Nevertheless, there is still a lack of applying retrieval method(s) for determining the PBL-height climatology over Athens from ceilometer data alone. Therefore, the aim of the present study is to fill this gap. Further, a new algorithm is presented, which is able to detect the MLH over Athens under all-weather conditions and derive statistics for the PBL properties and dynamics. In addition, the notion of upper and lower PBL curves is introduced in this study.
A ceilometer working on a 24-h basis detects the aerosol anomalies in the atmosphere. Such anomalies come from backscatter of the laser beam by droplets (presence of clouds) or turbulence (varying aerosol concentration). Therefore, a ceilometer “sees” the upper part of the PBL that consists of a CI on top of the RL during nighttime and the CBL (or ML) during daytime. The ceilometer also “sees” the lower part of the PBL that includes the NBL with an STI on top, and low-level jets (LLJs) during nighttime; the depth of the NBL may vary in space and time as a result of strong turbulence or even absence of turbulence [44]. Though wind speeds in the NBL are typically light and variable near the surface in the SBL [45], a wind maximum may occur that results in the development of an LLJ, which is present at the top of the SBL [44].
During fair weather, sea-breeze circulation may develop an internal-boundary layer (IBL) above NOA [46,47,48]; NOA is at a distance of 5000 m from the nearest shoreline. During daytime, this IBL may be of mechanical (synoptic weather situation) and/or thermal origin (temperature difference between land and sea); in the second case, it forms a thermal internal-boundary layer (TIBL). During summertime, the formation of TIBLs is typical [47]. Its depth has been found experimentally during the Athens Internal Boundary-Layer Experiment (ATHIBLEX) campaign [46,47] and from modelling [48] to vary between 250 m above sea level (asl) in the morning and 300 m asl in the afternoon over the ASNOA site. It is frequent that a coastal LLJ interacts with a sea-breeze flow during clear-sky conditions [49]. During nighttime, a return flow occurs (the land-breeze circulation), which has a depth of about 175 m asl above ASNOA [47,48]. Therefore, during a 24-h period, the ceilometer may detect two different layers: An upper (an RL from sunset to sunrise followed by a CBL from sunrise to sunset) and a lower one (a stable NBL from sunset to sunrise together with a TIBL/LLJ/STI/surface-aerosol layer (SAL)) under all-weather conditions.

2. Materials and Methods

2.1. Data Collection

The ASNOA is a unique solar radiation platform in Greece (37.97°N, 23.72°E, 107 m asl) in terms of completeness in radiometric equipment and long-term operation. It is situated on the Hill of Pnyx, very close to the Acropolis of Athens (see Figure 1), within a few kilometres distance from the coastline, the National Technical University of Athens (NTUA), and the Hellenic National Meteorological Service (HNMS) at Elliniko. The ASNOA started operation in 1953; in 1997, it was equipped with automatic meteorological instruments in parallel to the existing NOA meteorological station (World Meteorological Organisation identity number, 16714), situated on the Hill of Nymphs, 150 m away from the ASNOA site. In 2007, a Vaisala CL31 ceilometer was installed on the platform; this apparatus is unique in Greece for research purposes up to date. A full description of this remote-sensing instrument can be found elsewhere [27,50,51].
The ASNOA ceilometer has been operating continuously for two years (from October 2008 until September 2010) with a sampling interval of 2 s. After October 2010, it was in operation for case studies only because of the high cost of the laser-head replacement due to a technical failure. Now in the E-PROFILE network, it is again in continuous operation with a sampling rate of 30 s according to the network’s operation requirements.
The raw-ceilometer data are stored in a dedicated personal computer via the CL-View software [52] accompanying CL31. This software stores the (hexadecimal) raw data as .dat files in the PC, which contain the backscatter coefficients (BSC) in arbitrary units. The .dat files are converted off-line to .txt ones (ASCII format) and afterwards they are imported into Excel to become .xls files; the arbitrary units are multiplied by 10−8 and converted into BSC units (m−1sr−1) in the .xls files. Each Excel sheet contains columns with the following information: Columns A and B (date and time, LST = UTC + 2 h, of the measurement, respectively); column C (0 no clouds, 1 clouds); columns D-F (height for the high, mid, and low clouds, respectively); column G (0 no validity, 1 validity of the measurements in the sampling interval); column H (not used); and columns I-OD (BSCs in proper units (m−1sr−1)). The latter columns correspond to the height above the CL31 level equal to 112.0 m asl = 107.0 m asl (altitude of the Hill of Pnyx) + 4.7 m agl (ASNOA-platform height above ground level) + 0.3 m (height of the CL31 receiver above the ASNOA-platform level). The CL31 starts measuring (theoretically) from as little as 0.3 m above the ASNOA-platform level (0-level for the CL31) and goes up to 7700 m at intervals of 20-m-window heights. With a 2-s sampling interval, the CL31 software creates four 6-h raw-data files per day.
From the available 2-year .dat files, there was a selection of specific dates to be converted to Excel files and then their BSCs would be used for the estimation of the MLHs over Athens. Such a selection of dates was decided by the Atmospheric Research Team of NOA for the following two reasons: (i) It was not possible to find a code for converting the hexadecimal characters in the Vaisala CL31 files into ASCII ones though help from the E-PROFILE staff was asked, and (ii) there was very limited time to complete this task in the time frame of the KRIPIS-THESPIA-II project by applying the time-consuming manual conversion tool of CL-View from hexadecimal to ASCII files. Therefore, 6 days per month (1, 6, 11, 16, 21, and 26) in the 2-year period were selected for further analysis. These 6 days per month were considered satisfactory for climatological (statistical) analysis of the PBL over Athens, because various weather conditions may occur during the 6 days in each month. In case that any of the selected days had gaps in the ceilometer measurements, the measurements of the next or the preceding day were considered. That way, the total number of available days for analysis was 143, instead of 144, because March 2009 had a 10-day gap in the ceilometer measurements and, therefore, 5 dates in that month were selected instead of 6. For the analysis of the final database of 143 days, an algorithm was developed specifically for the study. The algorithm consists of a number of Routines, each devoted to a specific job of processing and analysing BSCs. The purpose of developing this algorithm was to estimate MLH under all-weather conditions. Though various algorithms have been developed for specific purposes (e.g., [43,53,54,55,56]), the distinction with the present one is that our code can be applied at any part of the world with small modifications. On the other hand, Vaisala have produced the BL-View software package [57], which can detect MLH, but it is a commercial product sold separately from the ceilometer itself. Recently, a graph-based approach (named Pathfinder) was developed for the determination of the MLH [12].

2.2. Data Pre-Processing

The 572 Excel files (i.e., 143 days × 4 Excel files/day) were read by the algorithm. The first part of the code made all the available Excel files uniform in terms of units and the same number of columns and rows. Any indication of cloud presence/absence in the Excel files (column C) was read by the code. BSC values up to 3000 m in height were only taken into account. That was adopted because an MLH above this altitude is rare. The next step in the algorithm was to sample the BSC values every 30-s among the 2-s measurements, in order to comply with the E-PROFILE requirements. During the process of the above admissible BSC measurements, smoothing took place according to [15,40]. Average BSC values were computed time- and height-wise; a 15-min running window was used for time smoothing, and an 80-m or a 160-m running window for height smoothing. The first window covered the altitude range [0 m, 500 m], while the latter the altitudes [500 m, 3000 m]. This smoothing process was necessary in order for the noise in the backscatter signal to be minimised or even zeroed. It should be noted that all negative BSC values in the database were retained in the smoothing process, according to the E-PROFILE ALC data-processing requirement. It is also important to mention that [15,40] have used height intervals of 140 m–500 m and 500 m–2000 m instead of our 0–500 m and 500–3000 m height intervals for BSC-altitude smoothing. The next step in the data pre-processing was the estimation of hourly BSC values from their 120 30-s smoothed measurements over all 143 days. Therefore, 24-h BSC values for all 143 days were prepared. A day was classified as clear if the ceilometer’s column C had 0 all day long.

2.3. Methodology

2.3.1. Retrieval of the MLH from Radiosonde Soundings

The European COST Action 710 [58] has defined the daytime PBL (or ML) height as “the height of the layer adjacent to the ground over which pollutants or any constituents emitted within this layer or entrained into it become vertically dispersed by convection or mechanical turbulence within a time scale of 1 h” [14,59,60]. Nevertheless, this definition is related to air-pollution studies or modelling; prior to this, its meteorological definition was the height at which the lower atmosphere undergoes mechanical or turbulent mixing, thus producing a nearly homogeneous layer. The meteorological definition is served by the Holzworth [61], Stull [16], Ri [62], and turbulent-kinetic energy (TKE) (e.g., [63]) methods.
In convective atmospheric conditions, the Holzworth method finds the ML height at the intersection of the potential temperature (θ) profile from a radiosonde sounding with the (theoretical) dry adiabatic one. It is, therefore, also called the θ-based method. The Stull method is similar to the Holzworth’s one, but it instead uses the radiosonde sounding’s virtual potential temperature (θv) with respect to intersecting the sounding’s virtual temperature (T) profile. In stable atmospheric conditions, the Richardson number (Ri) identifies the ML at the altitude where Ri becomes equal or larger than a pre-defined value. In any atmospheric condition, the TKE method defines the MLH as the height where the TKE value falls below the critical value of 0.1 m2s−2.
The (actual) potential temperature, θ (K), of an air parcel at pressure Pz (hPa) at altitude z (m) is the temperature that the parcel would attain if brought adiabatically to a standard reference pressure Po (usually taken at 1000 hPa).
θ = T · ( P o P z ) 0.286
where T is the temperature of the air parcel (K). On the other hand, the virtual potential temperature, θv (K), is the theoretical potential temperature of dry air that would have the same density as moist air; it is calculated as:
θ v = θ · ( 1 + 0.6 · q w q l )
where qw (kg kg−1 or g kg−1) is the mixing ratio of water vapour, i.e., the ratio of the mass of water vapour, mv (kg or g), to the mass of dry air, md (kg), and ql is the mixing ratio of liquid water, i.e., the ratio of the mass of liquid water, ml (kg or g), to the mass of dry air, md (kg).
The Richardson number, Ri, relates the production of turbulence to shear production (generation of TKE caused by wind shear) in an atmospheric layer of depth d (m):
Ri = g · d θ v ¯ · Δ θ v ( Δ u ) 2 + ( Δ v ) 2
where g is the gravity acceleration (typical midlatitude value of 9.81 m s−2), u (m s−1) and v (m s−1) are the (horizontal) longitudinal and latitudinal components of the wind vector, θ v ¯ (K) is the average value of the virtual potential temperature across the layer of depth d; the symbol Δ denotes the difference of the parameter of interest between the bottom and the top of the atmospheric layer; in the case of the MLH, this layer is considered from near-ground level to the PBL height, and, therefore, d = z. This height z is defined as that where Ri reaches the critical value of 0.25 for the first time above the ground [6]; above this height, the flow is considered laminar and below it, turbulent. Nevertheless, the choice of the critical value depends on the stability conditions of the atmospheric layer [64]. Seidel et al. [3] and Tang et al. [65] find the MLH from radiosonde profiles under unstable atmospheric conditions (dθ/dz < 0 in the first 100 m above ground) with the Holzworth method (the altitude where the vertical gradient of θ or q or both is greatest, or the vertical gradient of RH is least). Unstable atmospheric conditions pertain to the daytime. However, Eresmaa et al. [66] and Tang et al. [65] determine the MLH from radiosonde soundings under stable atmospheric conditions (dθ/dz > 0 in the first 100 m above ground) as the top of an LLJ; in the absence of LLJ, the MLH is defined at the altitude where Ri becomes greater than 1 for the first time. These guidelines have been followed in the present study.
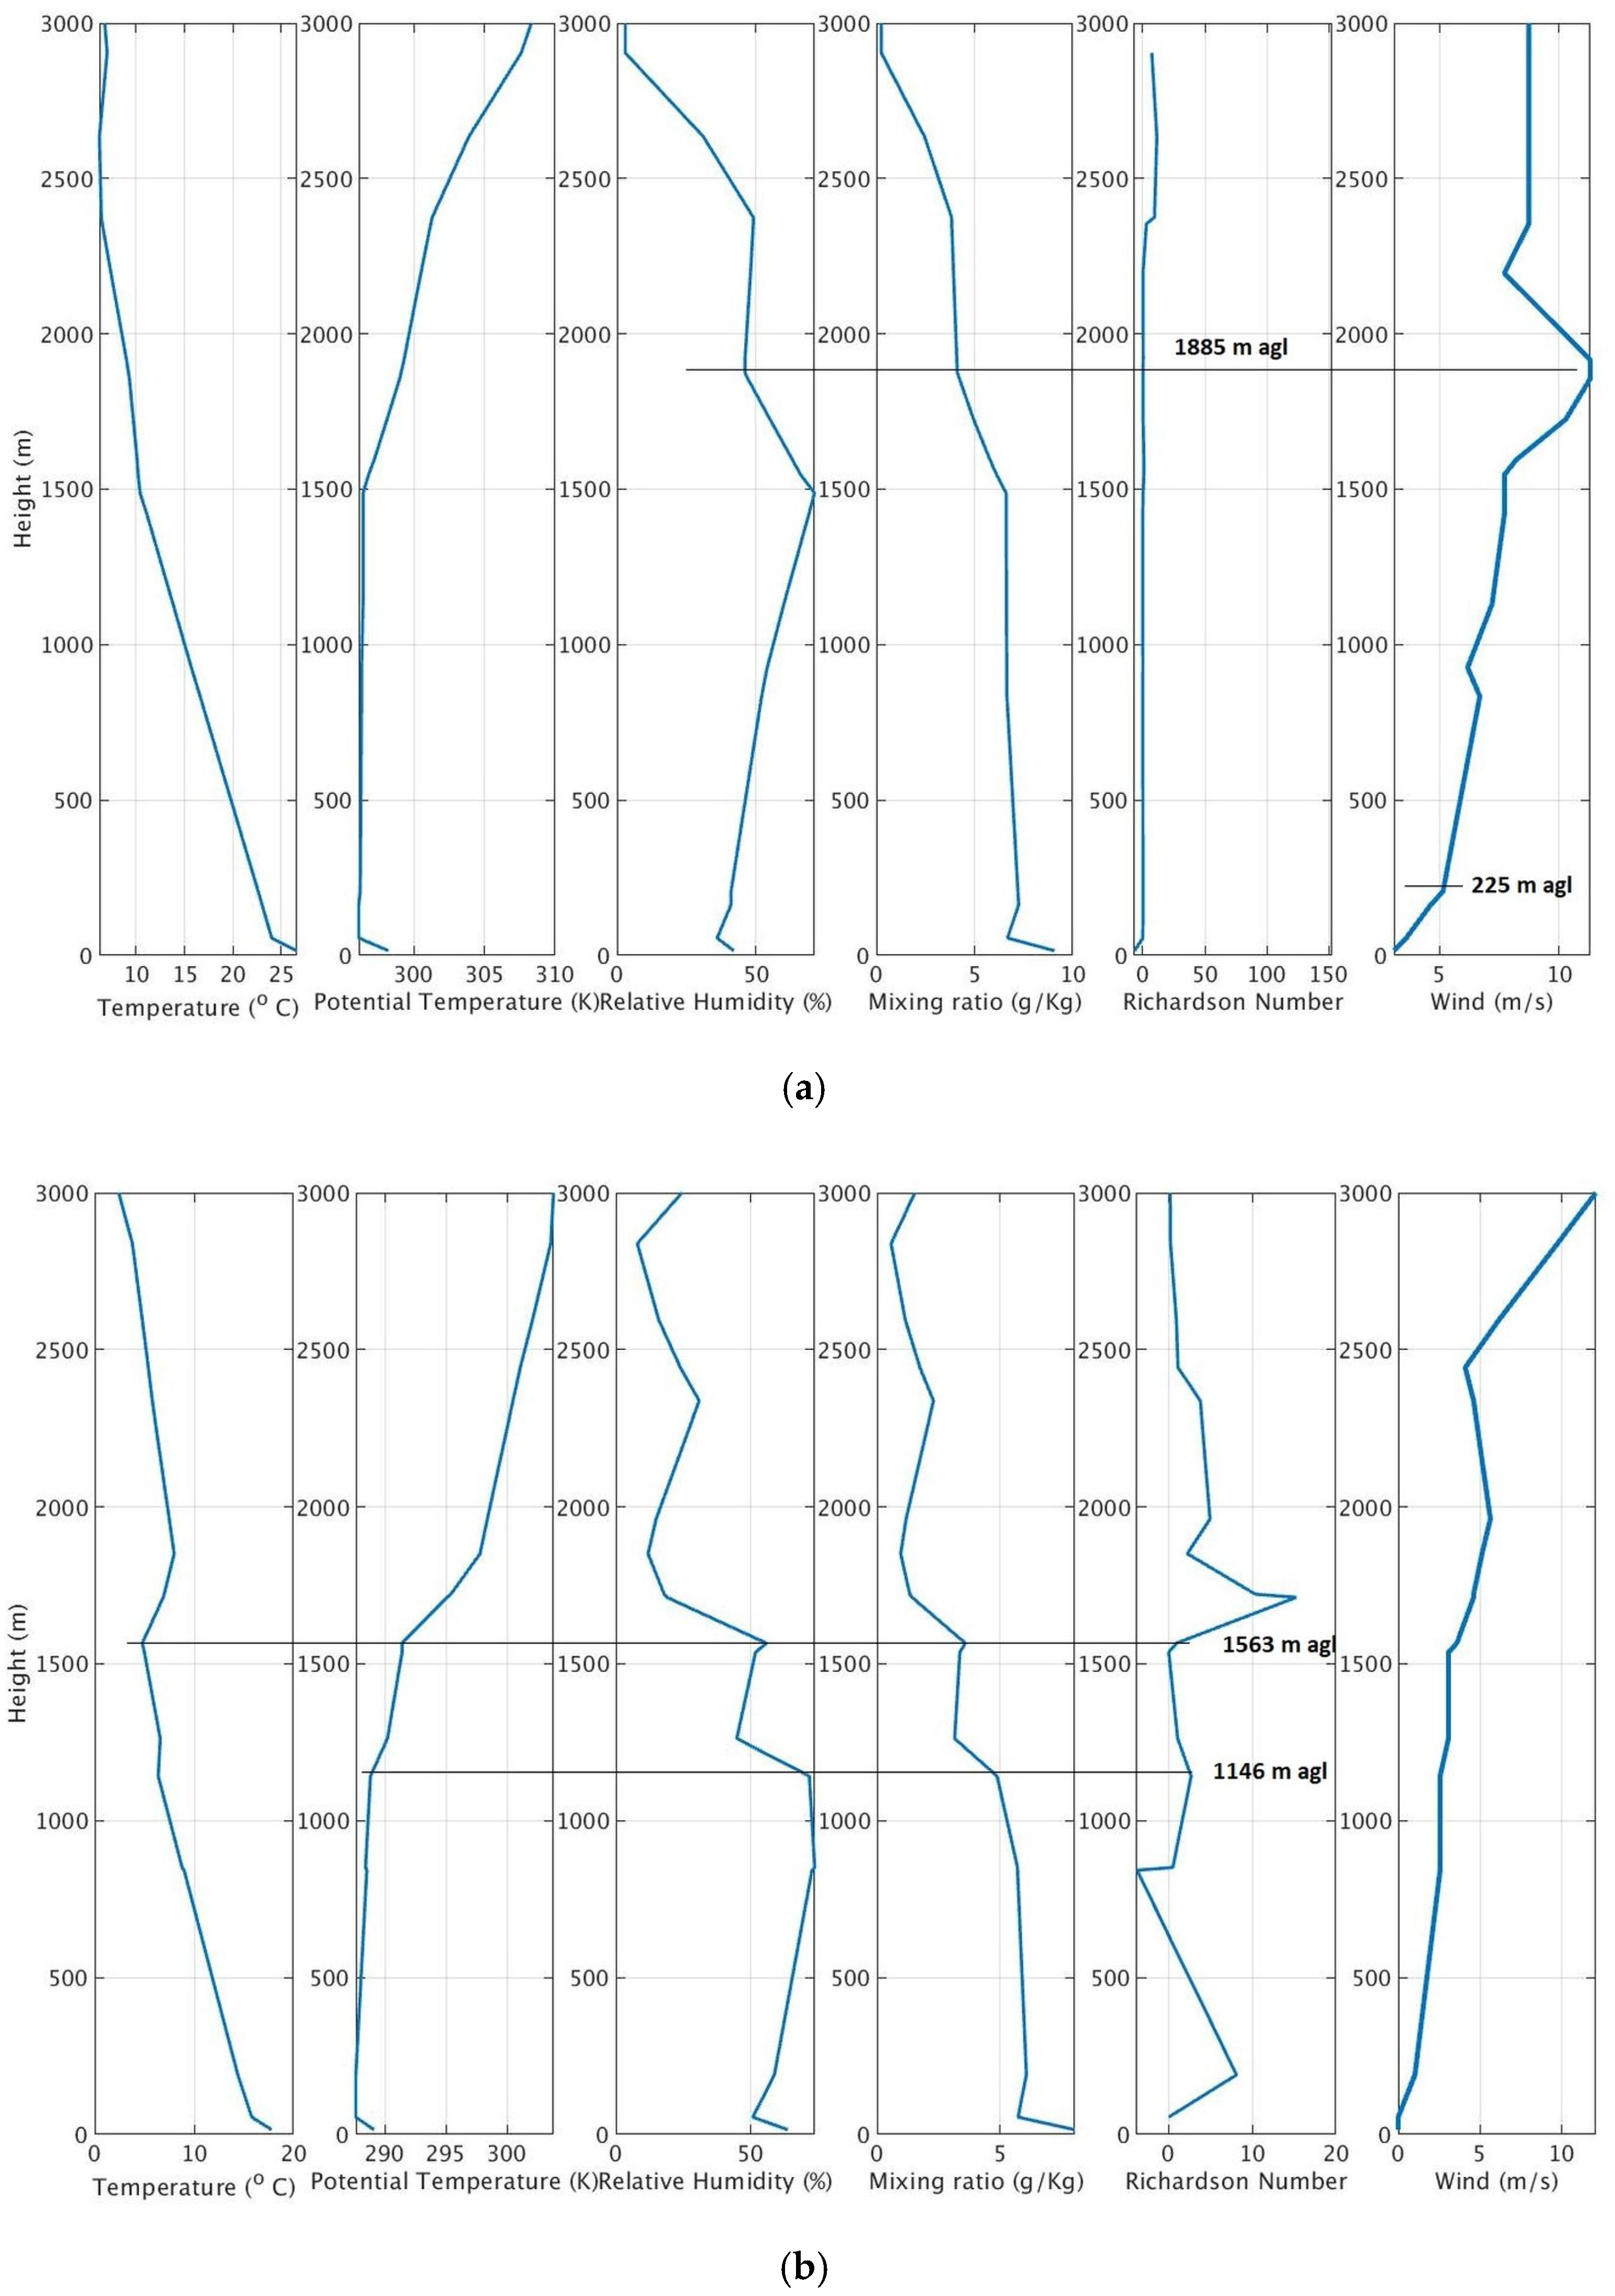
As an example, Figure 2 shows the estimation of the PBL height (PBLH) above Athens on 11 October 2008 and 21 September 2009 from radiosonde soundings performed at the HNMS station of Elliniko at 02:00 LST; the station is located 9.2 km south-southeast of ASNOA. The two stations have an altitude difference of 92 m, which must be taken into account in comparing the estimation of MLHs from the radiosonde and ceilometer data. According to [65,66], the MLH (the RL in this case) is detected in Figure 2a at about 2000 m agl or 2015 m asl, where the θ-gradient (dθ/dz > 0) profile becomes stable from almost neutral in the lower layer. According to the same authors, the MLH is found at almost the same altitude as relative humidity (RH, %) is reduced above 2000 m agl, while Ri becomes approximately equal to 1. According to [65,66], lower layers are detected at 815 m agl (decrease in q) and at 907 m agl (increase in WS). These layers correspond to the transition from the stable NBL to the unstable RL. Therefore, the height of this layer is taken at the mid-point of the two heights, i.e., at 861 m agl or 876 m asl. Finally, Ri reaches the critical value of 1 for the first time at the altitude of 861 m agl or 876 m asl. Therefore, the altitude of 2015 m asl is the height of the uPBL and that of 876 m asl for the lPBL. In the case of Figure 2b, the application of the above methodology indicates a uPBL height of 1276 m agl (1291 m asl), and an lPBL height of 179 m agl (194 m asl) as a turning point in the WS profile.
Figure 3 shows the detection of the MLH on 6 October 2009 and 16 December 2008 at 12:00 UTC (14:00 LST). Figure 3a indicates an MLH at 1885 m agl (1900 m asl) at the turning points in the RH, q, and WS profiles. An lPBL height is found at 225 m agl (240 m asl) as the first altitude where a decrease in WS occurs [16]. It should be noted here that another coarse estimation of the SL depth is 10% of the PBLH. In this case, the PBLH (MLH) was detected at 1885 m and the SL height should be 188.5 m, a value very close to 225 m. Figure 3b finds the MLH at 1563 m agl (1578 m asl) and the lPBL height at 1146 m agl (1161 m asl).
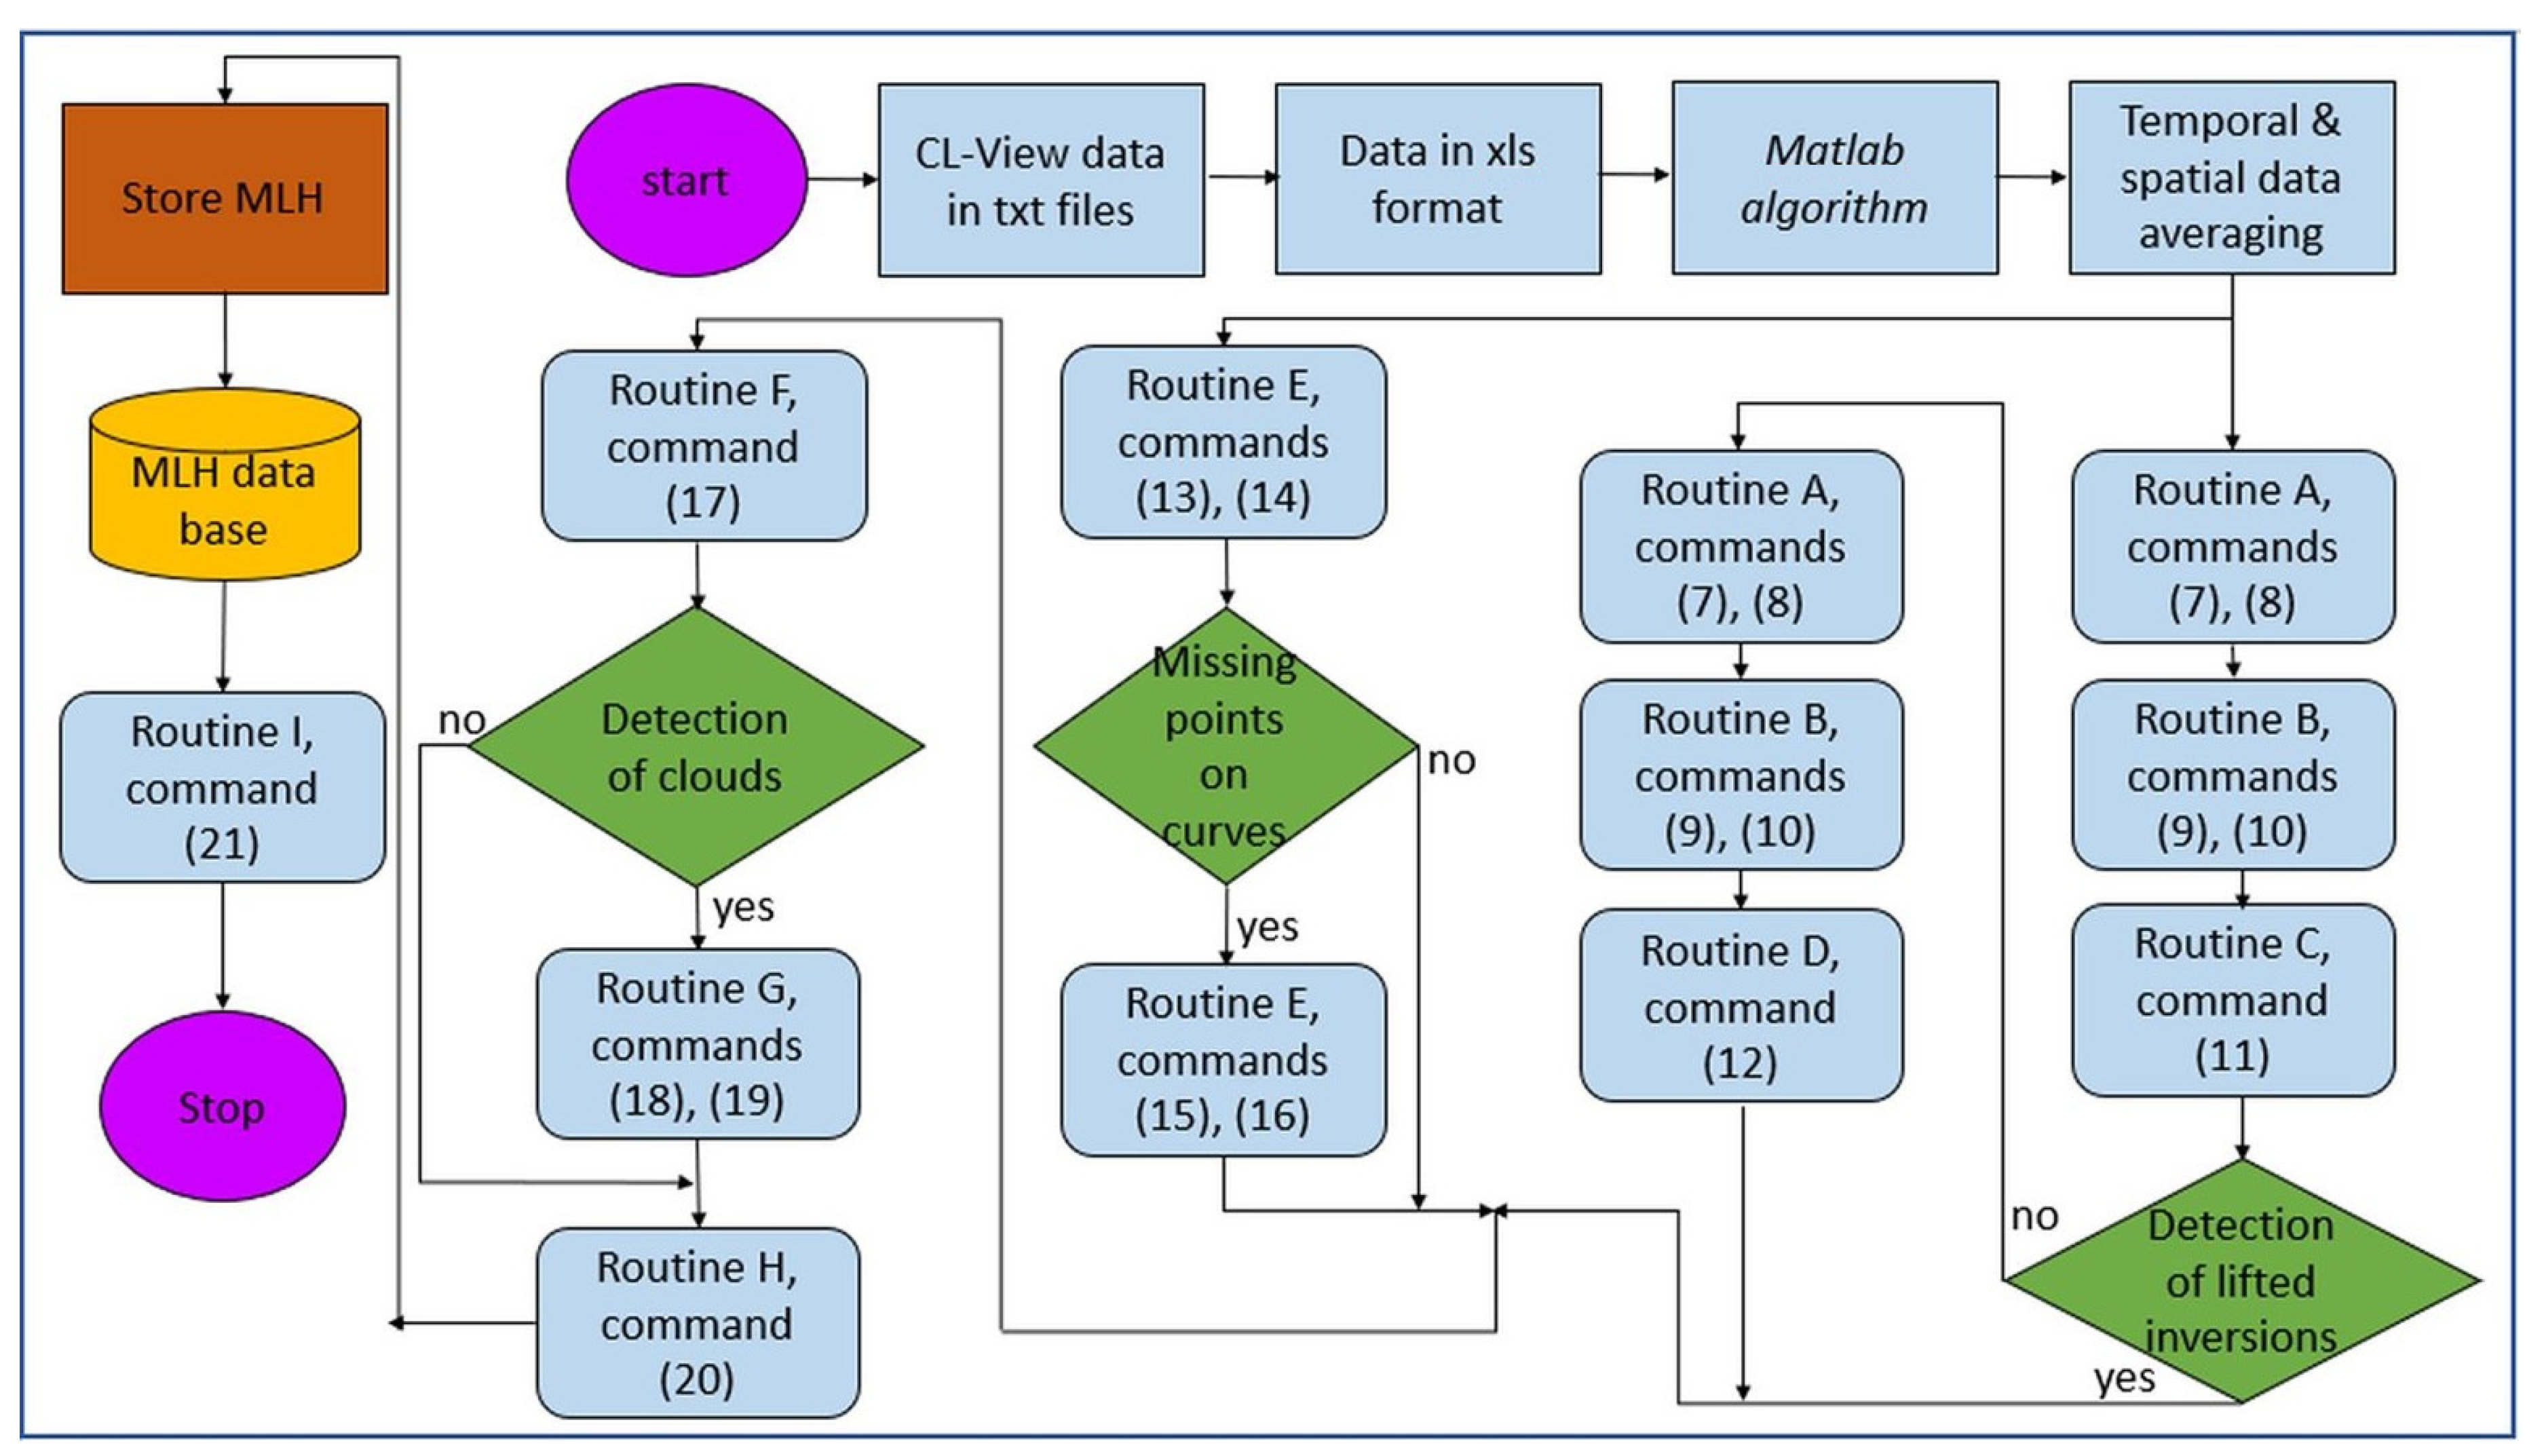
Figure 4 shows the implementation of the algorithm in a flow-chart format.

2.3.2. Methods for Retrieving MLH from Ceilometers

Among the novel remote-sensing methods, ALCs are promising devices for determining MLH; ceilometers are based on the lidar technique that measures the BSC of the optical signal from inhomogeneities in the troposphere (air pollutants, aerosols, raindrops, clouds). The European COST Action 1303 [35] has exclusively dealt with ALCs.
Generally, aerosol concentrations are lower in the free troposphere than in the ML, and it is therefore expected that the MLH is associated with a strong gradient in the vertical BSC profile [8]. For estimating MLH, various retrieval methods from BSC have been reported in the literature. A description of them is given in various publications, e.g., [8,27,50,67,68] and more clearly in [15,40,43]. Nevertheless, a brief description of the methods proposed for the determination of the MLH is repeated here.
The Gradient method (GM)
Hayden et al. [69] and Flamant et al. [70] have identified the MLH at the height where the largest negative value of the first derivative of the BSC exists:
MLH GM = min [ BSC z ]
where z (m agl) is the altitude in the atmosphere.
The Infection-Point method (IPM)
Menut et al. [71] considered the minimum of the second derivative of the BSC for the identification of the MLH:
MLH IPM = min [ 2 BSC z 2 ]
The Logarithmic-Gradient method (LGM)
This method was suggested by [72] and searches for the largest negative gradient in the logarithm of BSC:
MLH LGM = min [ lnBSC z ]
The last approach usually gives the largest value of MLH. According to [73], Equation (5) is closer to the MLH derived from radiosonde soundings via Ri. The other two methods, Equations (4) and (6), give slightly higher values.

2.3.3. New Algorithm for Retrieving the MLH from Ceilometers

The data pre-processing (Section 2.2) precedes the implementation of the main algorithm with the aim of generating the final database. After this step, the code calculates the MLH for each hour following the criteria of Emeis et al. [15,40]. The algorithm is structured in Routines, which are described below.
Routine A. 1st derivative of BSC. The values of the limits in Equations (7) and (8) have been suggested by [15,40]:
BSC min = 20 × 10 8   m 1   sr 1 ,   for   0   m   <   z     500   m
BSC z < 0.06 × 10 8   m 1   sr 1 ,   for   500   m   <   z     3000   m
Routine B. Minimum value of BSC.
BSC min = 20 × 10 8   m 1   sr 1 ,   for   0   m   <   z     500   m
BSC min = 25 × 10 8   m 1   sr 1 ,   for   500   m   <   z     3000   m
Routine C. 2nd derivative of BSC.
2 BSC z 2 > 0 ,   2 BSC ( z 1 ) 2 0
The implementation of the group of Routines A-B-C aims at identifying temperature inversions (TIs) as potential ML heights. The TIs are identified by a change in the gradient of the BSC profile. If this group of Routines fails, the algorithm proceeds to Routine D.
Routine D. Modified 2nd derivative of BSC.
2 BSC ( z + 1 ) 2 > 0 ,   2 BSC z 2 0
The notations z − 1 and z + 1 in Equations (11) and (12), respectively, denote one height window lower and one height window higher than the one represented by z.
As the group of Routines A-B-C failed, Routine C is replaced with Routine D. The application of the A-B-D group of Routines aims again at identifying lifted TIs. According to [15], the methodology identifies up to 5 TIs aloft. The modified 2nd derivative of BSC in Routine D of the algorithm, Equation (11), is now able to detect up to 9 TIs, provided that the criteria (7)–(11) in the group of Routines A-B-C or A-B-D are also met. While Emeis et al. [15] consider the lowest height of the identified TIs as the possible MLH, a new Routine was introduced into the algorithm, Routine E, to be able to select the most appropriate TI as the possible ML. This means that Routine E does not always select the lowest TI as the possible ML as [15] have suggested.
Routine E. Upper-lower Guiding Curves.
This part of the algorithm is implemented as a stand-alone Routine after the temporal and spatial data averaging in parallel operation with the groups of Routines A-B-C or A-B-D. This Routine creates two envelope curves as guiding ones for the selection of the appropriate TIs calculated during the implementation of the groups A-B-C or A-B-D above. These two envelope curves consist of 24 points each, of which the points are chosen using the following criteria. The criteria for selecting the points (heights) that constitute the upper and lower envelope curve are the following:
BSC < 32 × 10 8   m 1   sr 1 ,   for   2   consecutive   heights   ( upper   envelope   curve )
BSC < 55 × 10 8   m 1   sr 1 ,   for   2   consecutive   heights   ( lower   envelope   curve )
The selected BSC values in Equations (13) and (14) are empirical but they are based on (i) the qualitative schematic diagrams of the daily evolution of the PBL (Figure 5), and (ii) a comparison of the estimated PBL heights with the aid of radiosonde soundings at the HNMS site of Elliniko and the implementation of the algorithm. These radiosonde soundings were downloaded from the University of Wyoming, Dept. of Atmospheric Science [74]. Though these BSC limits are empirical, they can be estimated at other locations by inspecting pre-processed (time- and space-averaged) ceilometer observations and comparisons with radiosonde soundings performed at the same or an adjacent site.
If the above criteria in (13) and (14) are not able to detect a point (height) on the upper and/or lower envelope curve, then this height is estimated by the average between the preceding and following temporal points.
If the algorithm cannot estimate a point at the beginning or end of the day (i.e., at 01:00 LST and 24:00 LST, respectively), then it replaces the value of the height with that at 02:00 LST and 23:00 LST, respectively.
Routine F. Upper/lower Envelope Curves.
This is an important part of the algorithm, since Routine F outputs the final upper/lower envelope curves. It compares the TI heights identified by the groups A-B-C or A-B-D with those calculated in Routine E in order to estimate the appropriate TI as the possible PBL height. The Routine selects those TIs that are closer to the envelope curves (upper/lower). If no point (height) is detected or the point is at a distance farther than 200 m from the nearest envelope curve, the algorithm considers that height, which lies on the nearest envelope curve. It is implied that this procedure is implemented twice, once for the upper envelope curve (named upper PBL or uPBL) and a second time for the lower PBL (lPBL) curve. The characterisation of the upper boundary of the PBL implies the combination of the RL and CBL curves in a 24-h period; in the same way, the characterisation of the lower PBL boundary includes the SL and NBL curves in the period of a whole day. The uPBL and lPBL notations are, therefore, introduced for the first time in the literature to depict the above-mentioned situations as shown in an artistic manner in Figure 5 below.
Routine G. Role of Clouds.
There are cases that clouds (cloud bases) are detected by the CL-View for an entire day or part of it; in these circumstances, if the algorithm estimates the uPBL height (MLH during most part of the daytime) above the cloud base using the criteria of Routines A-F, then the height is set equal to the cloud-base altitude [75].
If the estimated uPBL/lPBL height at a certain time stamp is found to be higher than 600 m/300 m from its adjacent time stamps (preceding and following), then the algorithm computes the height as the average of the two altitudes at the adjacent times.
Routine H. Polynomial Approximation.
At this stage, two ensembles of heights are estimated by the algorithm for any day: One set for the upper and another for the lower boundary curves. All these points are detected from the implementation of the Routines A-G. Each set of points (i.e., heights) is then approximated by a 9th-order polynomial fit so that smoother curves are derived. Finally, 24 points are selected for the uPBL curve (CI of the RL and EZ of the CBL), and 24 points for the lPBL curve (TI of the NBL, and SAL). The 24 heights are accommodated at the 24 h of the day. A uPBL-/lPBL-height database is, therefore, created.
Routine I. Visualisation of Results.
The algorithm finally produces 24-h diagrams with the smoothed PBL heights. These results are stored in Excel files and contain the following information: Day, month, year, complete date in the form ddmmyy, cloud base (1 for clouds, 0 for no clouds), 24 heights (m agl) for the lPBL curve, and 24 heights (m agl) for the uPBL curve; all these 24 heights correspond to the 24 h of the day. The time used is LST.
Figure 5 shows a schematic diagram of the daily course of the PBL from an artistic point of view.

2.4. Evaluation of the Algorithm

Before using the derived database containing the estimated PBL heights over Athens for the selected dates in the period October 2008–September 2010, an evaluation of the algorithm must take place. This is done by comparing the PBL heights derived from radiosonde soundings to those estimated by the algorithm. Here, the 4 cases mentioned in Section 2.3.1 are considered. Figure 6 and Figure 7 depict the algorithmic output diagrams (Routine I) for the considered dates in Figure 2 and Figure 3, respectively.
On 11 October 2008 at 02:00 LST, the algorithm detected a uPBL (RL) height at 1865 m agl (1977 m asl), which is comparable with that identified by the radiosonde sounding at 2000 m agl (2015 m asl); the lPBL (NBL) height has been detected at 865 m agl (977 m asl) from CL31 and at 861 m agl (876 m asl) from radiosonde.
On 21 September 2009 at 02:00 LST, the algorithm detected a uPBL (RL) height at 1208 m agl (1320 m asl), while the radiosonde sounding located it at 1276 m agl (1291 m asl). The lPBL (NBL) heights were derived at 146 m agl (258 m asl) from CL31, and at 179 m agl (194 m asl) from the sounding.
On 6 October 2009 at 14:00 LST, the algorithm detected a uPBL (ML or CBL) height at 1730 m agl (1842 m asl), which is comparable with that identified by the radiosonde sounding at 1885 m agl (1900 m asl). The lPBL (unstable SL) height has been detected at 230 m agl (342 m asl) from CL31 and at 225 m agl (240 m asl) from radiosonde.
On 16 December 2008 at 14:00 LST, the algorithm detected a uPBL (ML or CBL) height at 1438 m agl (11,550m asl), while the radiosonde sounding located it at 1563 m agl (1578 m asl). The lPBL heights were derived at 1166 m agl (1278 m asl) from CL31, and at 1146 m agl (1161 m asl) from the sounding. The rather high lPBL heights are due to the presence of clouds.

2.5. Statistics of the Algorithm-Derived PBL Height

As mentioned in Section 2.3.3 (Routine E), radiosonde recordings at the Elliniko HNMS station were downloaded from the University of Wyoming site for all available dates of the 143 days and for both 00:00 UTC (02:00 LST) and 12:00 UTC (14:00 LST) soundings. For the nighttime soundings, 135 cases out of 143 (94.4%), and for the daytime ones, 94 cases out of 143 (66.4%), were available and used. Estimation of the daytime PBL height (PBLH) was made by applying the Holzworth/Stull/Ri/WS methods one-by-one or in a combination of some of them and of the nighttime PBLH from the criteria of [65,66], both mentioned in Section 2.3.1. The absolute-error (AE) statistic was computed for all PBLCL31- and PBLRDS-derived heights. AE is defined as:
AE   = PBLHRDS     PBLHCL 31
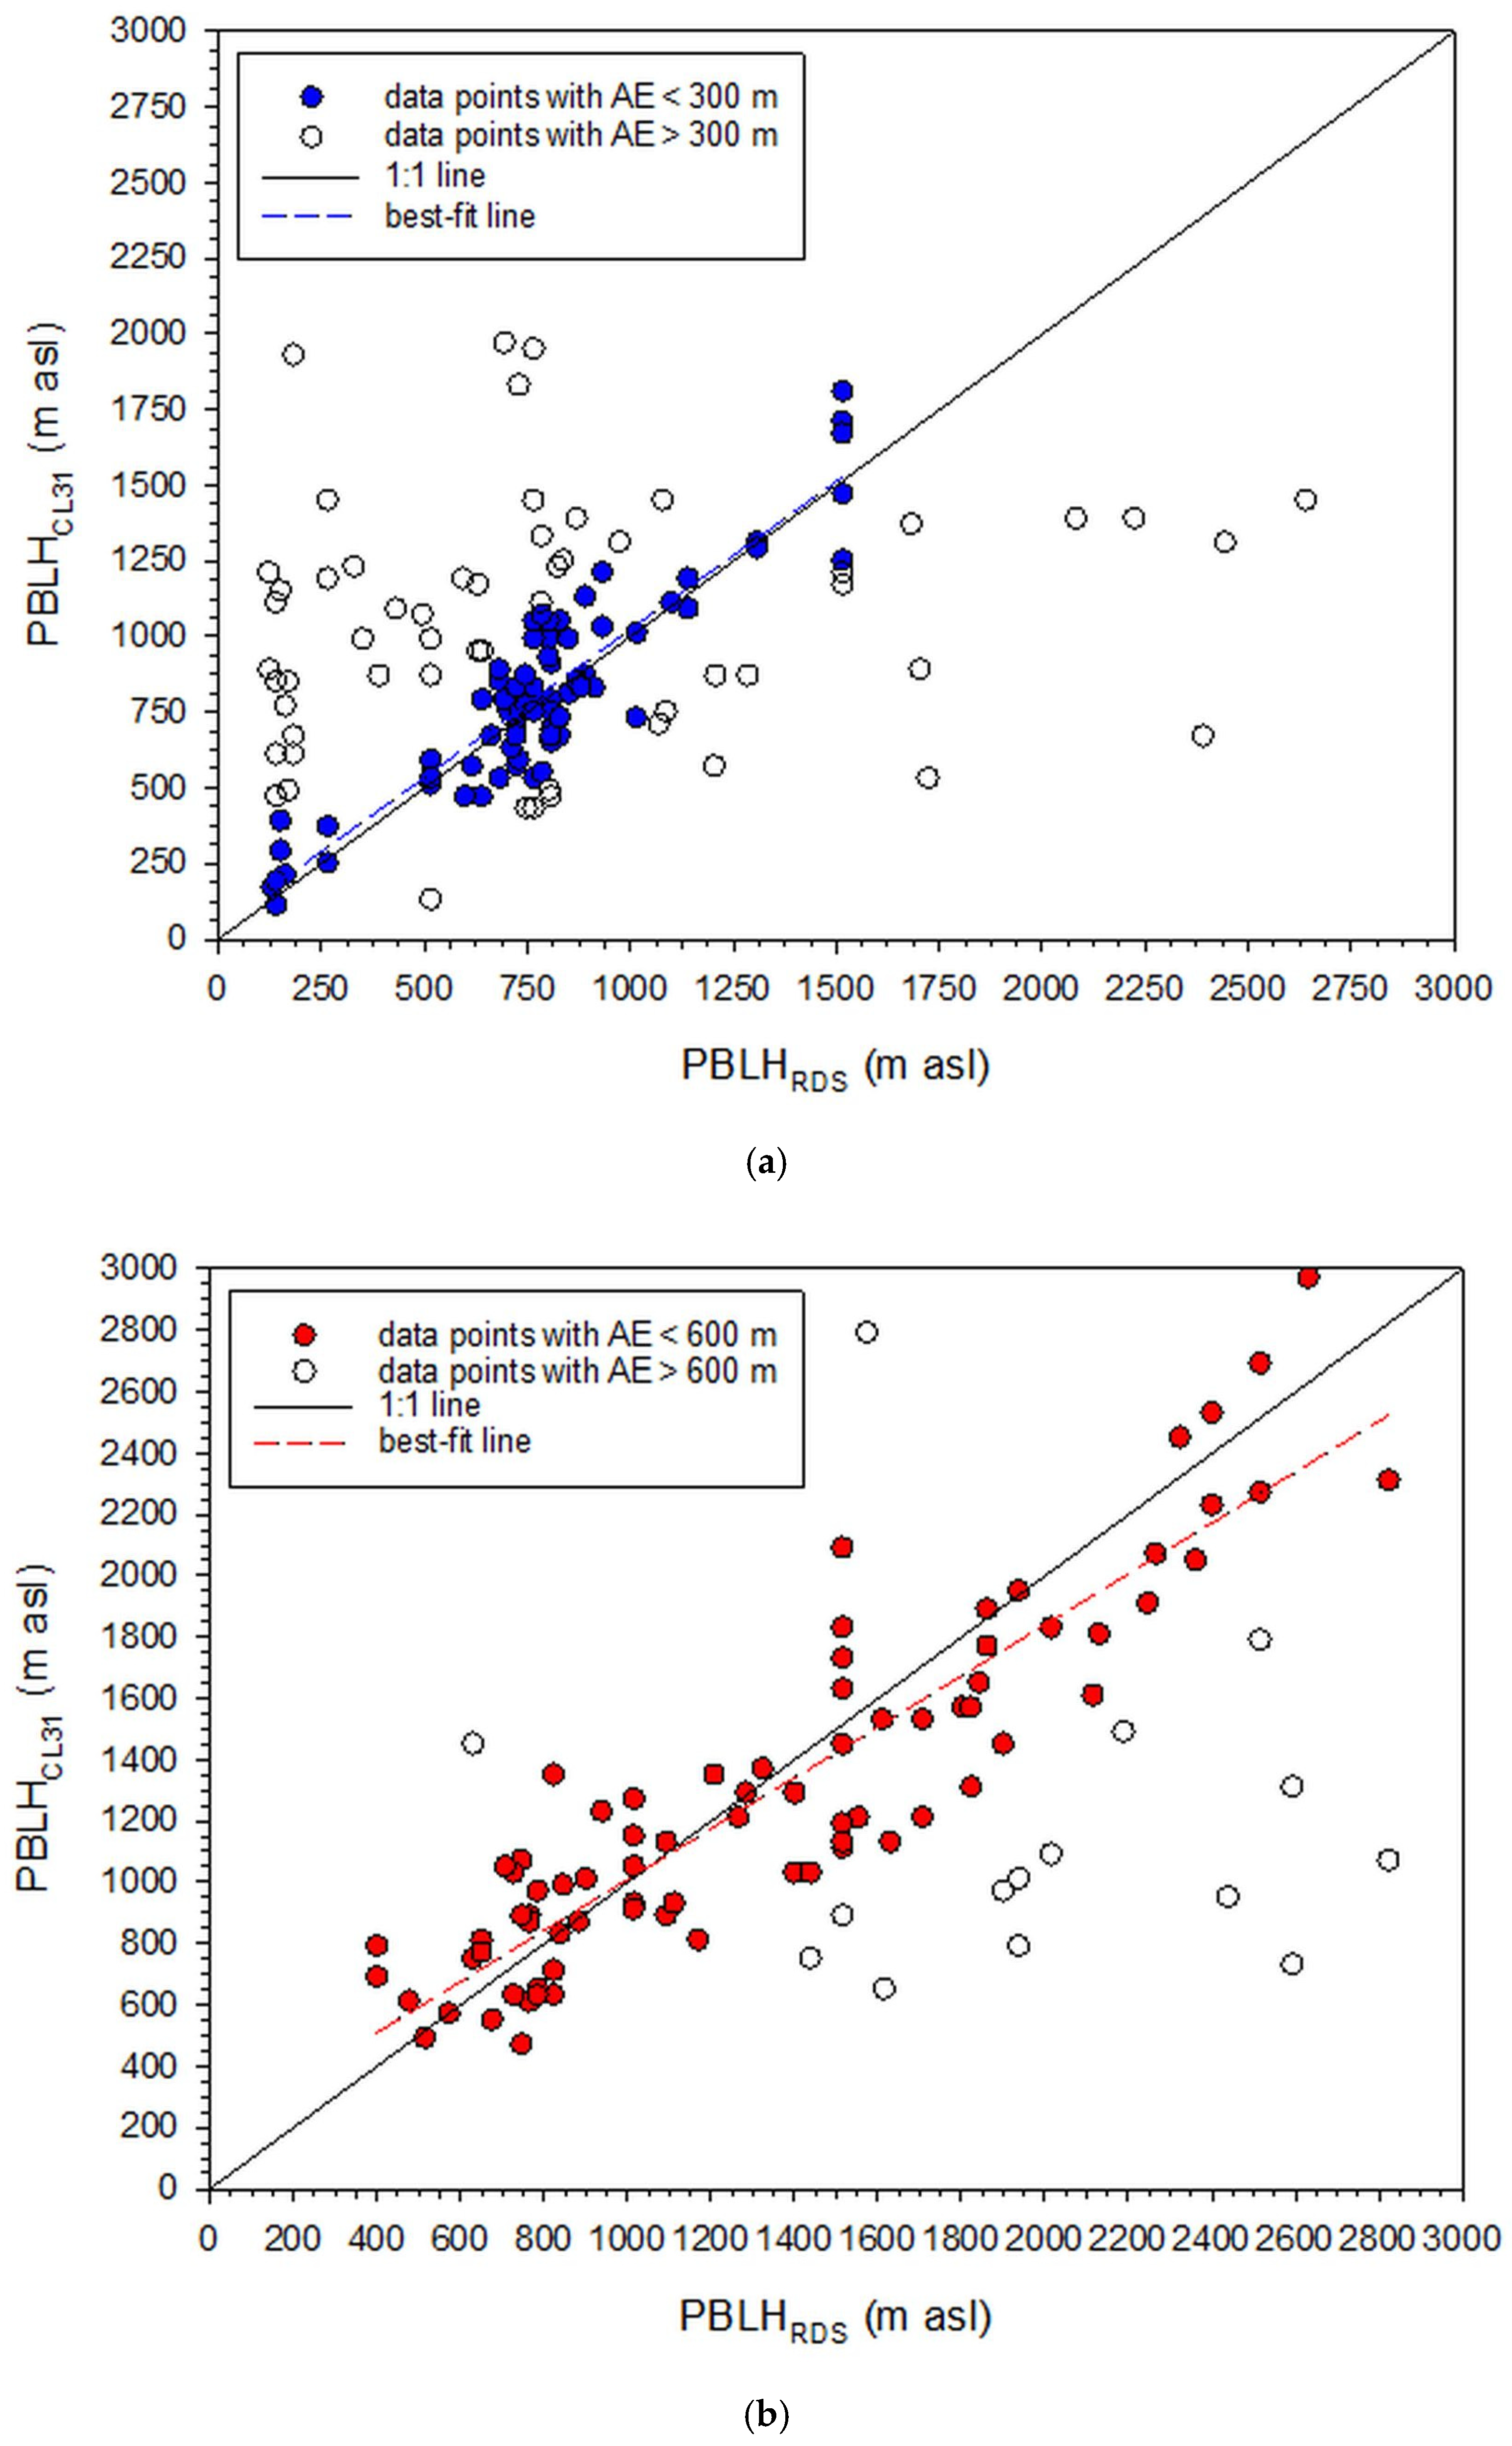
Tang et al. [65] have applied AE to reject extreme MLH estimations. This procedure has been adopted in the present work with AE < 300 m for 02:00 LST and AE < 600 m for 14:00 LST. Figure 8 shows the accepted and rejected PBLH estimations for all cases with available RDS data (135 and 94 days at 02:00 LST and 14:00 LST, respectively). The best-fit lines to the accepted data points are very close to the 1:1 line. Nevertheless, they show coefficients lower than 1 (0.98 and 0.83 for RDS at 02:00 LST and 14:00 LST, respectively). This is not due to an underestimation of the PBLH-derived values from CL31 in comparison to those from RDS. The reason lies in the low number of data points that may create a greater MBE in comparison to that of a large population (as in [65]), as well as the lower concentration of atmospheric particles at night, as explained in the paragraph just after Figure 8. Even in the case of a large population of synchronous PBLH estimations from ceilometer and radiosonde soundings, 100% accuracy cannot be expected because of the two completely different methodologies applied.
The above analysis gives an overall accuracy (the ratio of accepted estimates to all estimates) of the algorithm of 57% at 02:00 LST and 84% at 14:00 LST. The lower efficiency of the algorithm at night is due to the lower concentration of atmospheric particles, which results in a bigger uncertainty in the ceilometer-derived MLHs because of a non-sudden change in the BSC profile [8,77]. Tang et al. [65] report a successful retrieval of PBLHs over Beijing by applying the AE statistic of approximately 80% over a set of 1000 values, much larger than the database of the present study.
In the following analysis of the estimated PBLHs, the accepted data points were used together with the rest of the algorithm-retrieved ones for which radiosonde soundings were not available.

3. Results

3.1. Month-Hour PBL Diagrams

The methodology for the month–hour distribution of a meteorological parameter was first introduced by Kambezidis et al. [78] with application to the daylight levels in Athens. Those researchers gave the advantages in using such an analysis. This methodology was later also applied to solar radiation, illumination as well as atmospheric turbidity studies over Athens [79,80,81] and is applied to the present study too. Figure 9 shows the month–hour graph of the upper (Figure 9a) and lower (Figure 9b) PBL heights over Athens under all-sky conditions. It is seen that the uPBLH (MLH) forms a ridge with higher values across almost the entire day in the warm season of the year (June–September); this ridge becomes wider from midday to early afternoon hours. This broad maximum is clearer in July and August as drier and warmer weather conditions “push” atmospheric turbulence to higher altitudes. On the contrary, the lPBLH does not show such a well-organised pattern due to the various local circulations that may take place near the surface during a year. Such mechanisms are the sea-breeze/land-breeze circulations with associated TIBLs, LLJs, STIs, local precipitation, and anthropogenic activities (aerosols emitted from central heating and traffic). Nevertheless, two distinct ridges of higher values can be identified; one coincides with that of the uPBL and is more apparent in the period July-October, and another weaker ridge occurs in the month of April. These high lPBL values may be due to the fact that in the warm period of the year (late spring–late autumn), the STIs become more persistent, and sea-/land-breeze circulations with associated TIBLs appear in the Athens basin. The minor winter (January) high may be related to the “Halcyon days” discussed in Section 3.4 and the operation of central heating. It is interesting to see that the lPBLH in the period August–October retains rather high evening values, which persist until midnight; this phenomenon may be due to the formation of local nocturnal LLJs associated with land-breeze circulation in open, rather flat coasts, as is the Athens Basin [82].
As none of the selected days in February and in December corresponded to clear skies, the 24-h BSC values for these months were filled in by adopting linear interpolation between the corresponding hourly values of January and March (for February) and of November and January (for December). Therefore, Figure 10 provides the uPBL (Figure 10a) and lPBL (Figure 10b) curves under clear-sky conditions. The pattern of the uPBL curve follows that for all-sky conditions (Figure 9a), but it obtains higher values because of higher turbulence due to higher solar insolation. Furthermore, the minor winter maximum is now more intense; this secondary maximum may be due to clear-sky “Halcyon days” as well as the central heating, which warms the air just above the ground and may “push” the SL and NBL a little higher. This has been demonstrated in Barcelona, Spain by Moreno-Garcia [83]; the researcher found that the downtown area is 0.2 °C cooler for daily maxima and 2.9 °C warmer for nighttime minima than nearby rural areas as a result of the urban heat-island effect. On the contrary, the pattern of the lPBL curve seems very “poor”; it resembles that of Figure 9b, if one drastically reduces the widths of the morning and evening peaks and enhances the PBL height. This happens because some mechanisms present in all-weather conditions are absent in fair weather (i.e., precipitation).

3.2. Inter-Annual PBL-Height Variation

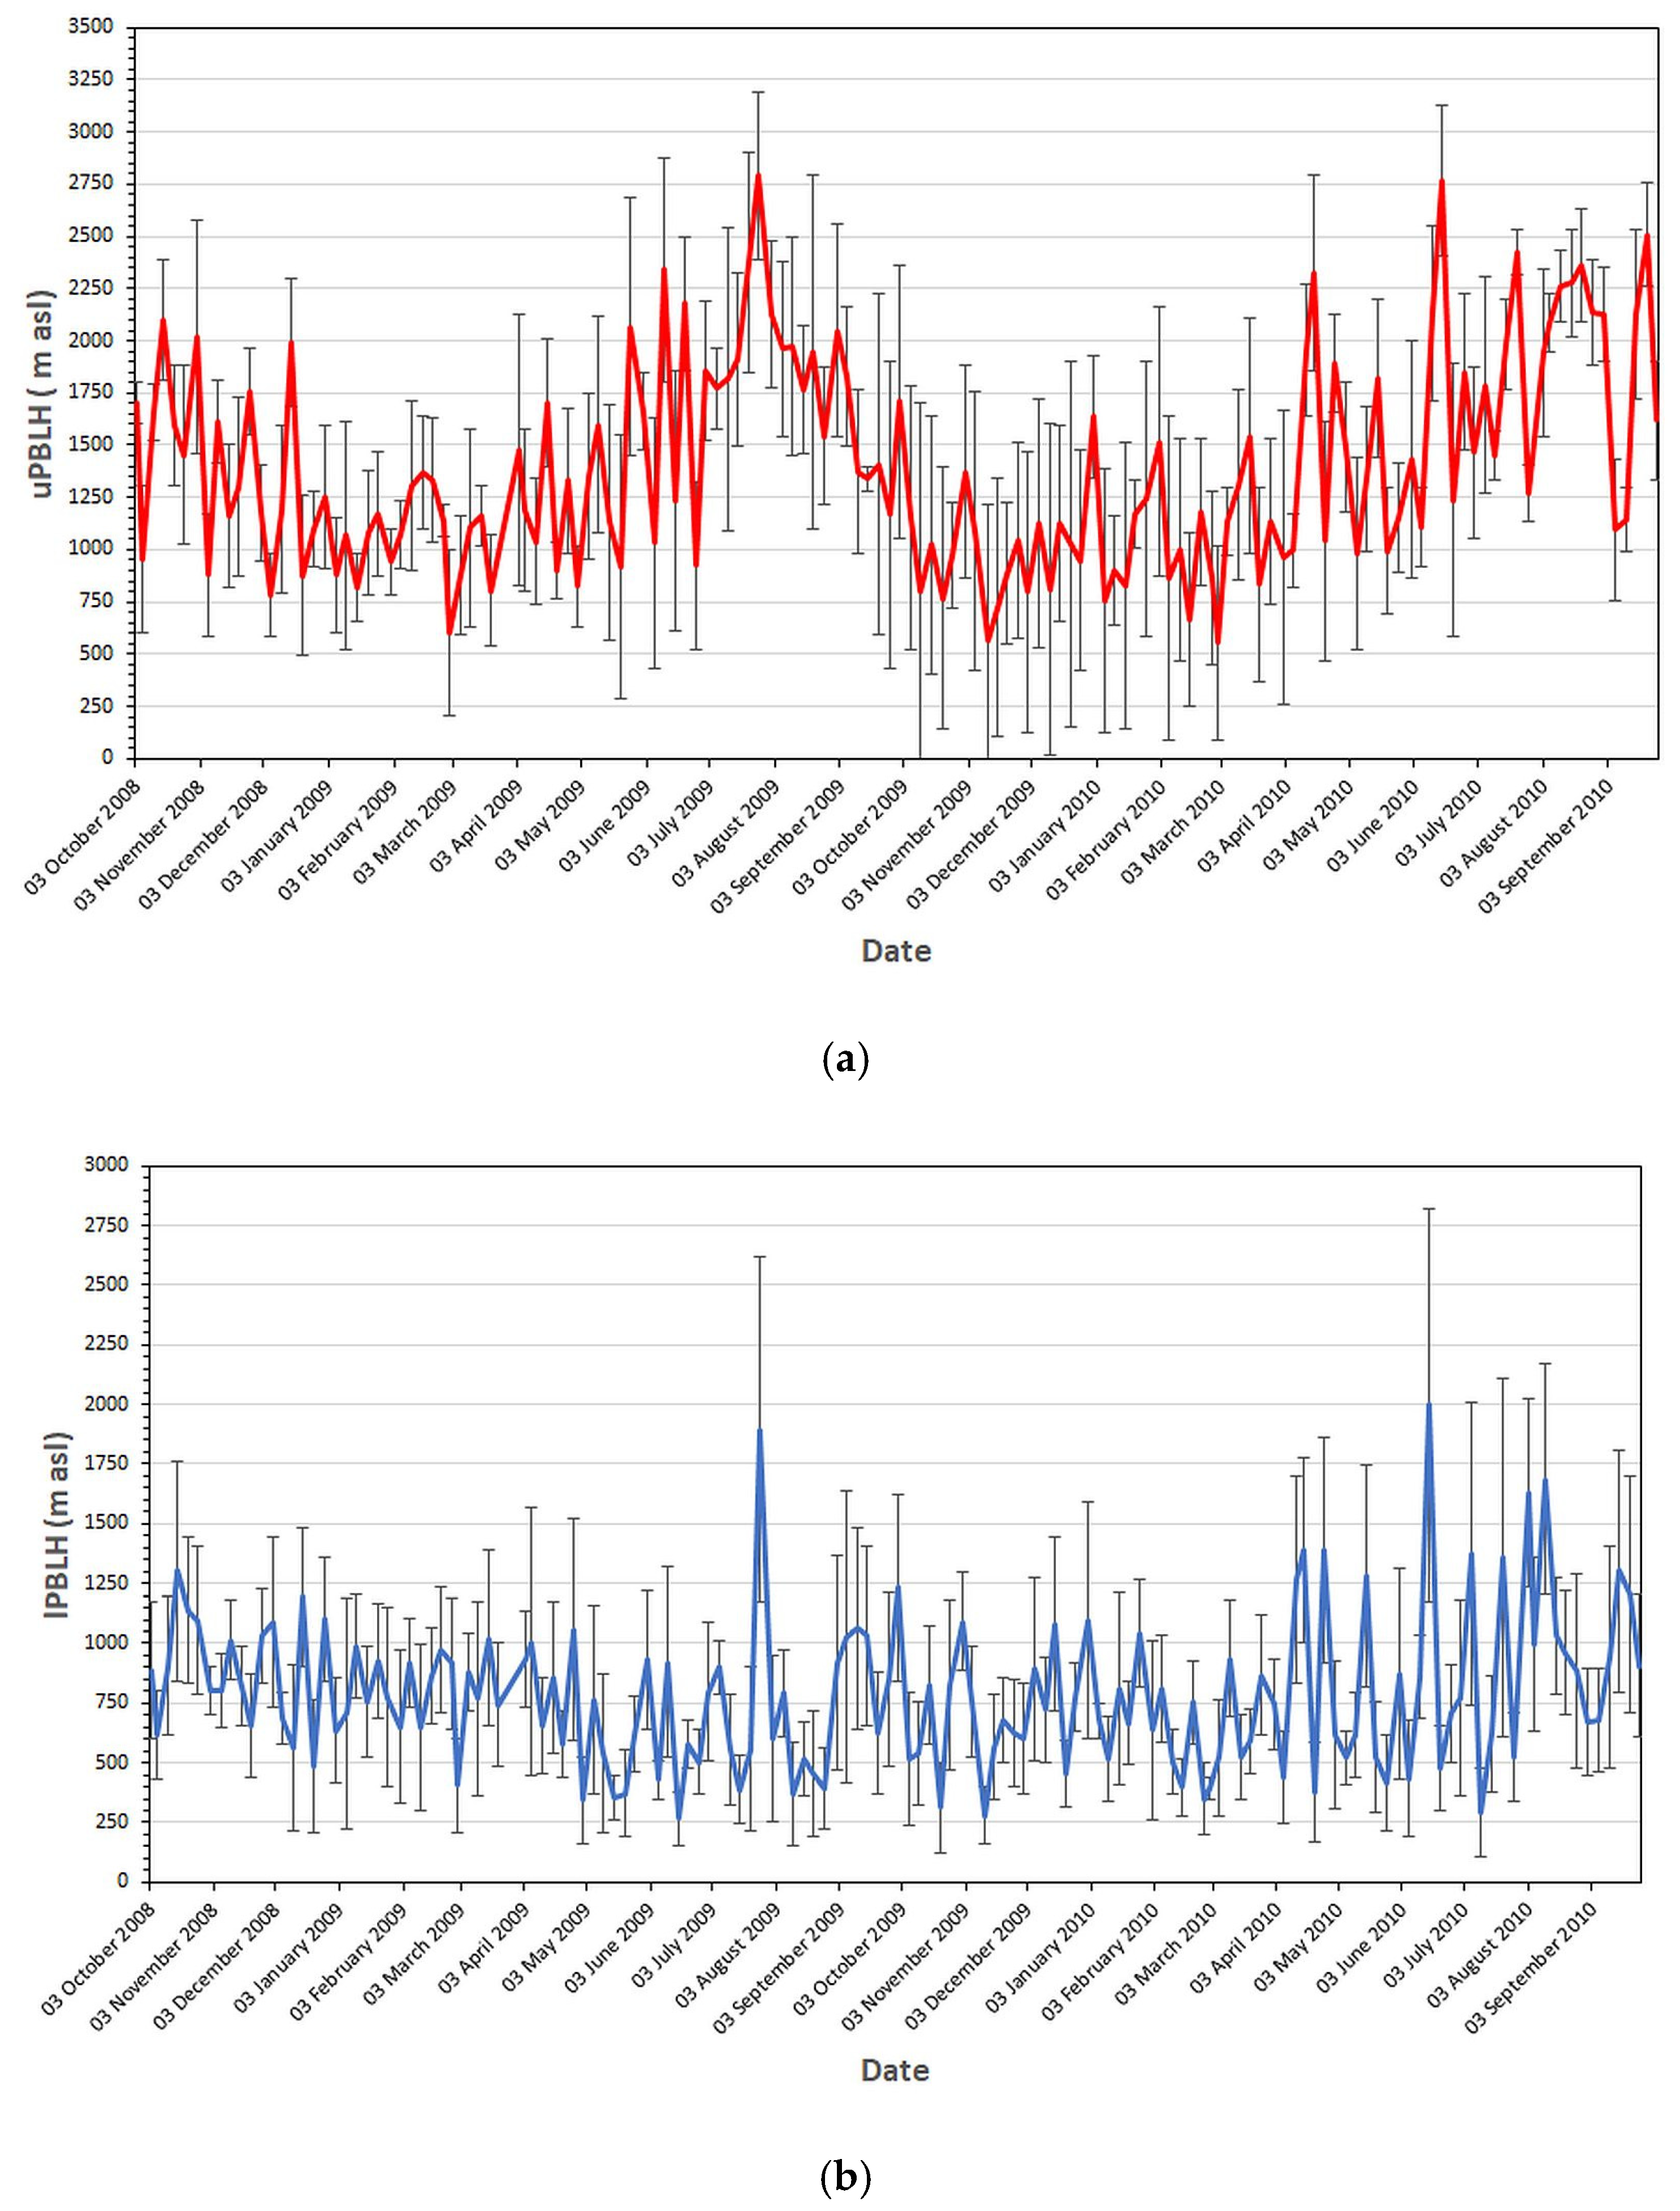
Figure 11 shows the uPBL (Figure 11a) and lPBL (Figure 11b) curves over Athens on the selected days in the period October 2008–September 2010. The heights are estimated as 24-h averages. A cycle in the uPBLHs is observed, with maximum values during the summer in accordance with the results shown in Figure 9a. On the contrary, the lPBL curve does not indicate any specific pattern as also seen in Figure 9b. The error bars (±1 standard deviation from the mean) are large because of very limited data points on the same date as well as the variability in the prevailing atmospheric conditions (prevailing weather conditions), which often change from one day to the next; notice that each date occurs twice in the period of the study.
As mentioned in Section 2.2, a clear day was recognised as such from an all-day long 0-flag provided in the ceilometer record. A frequency-of-occurrence plot (not shown here) for the sky status of the selected 143 days shows a probability in the range of 60%–90% for overcast-sky conditions, and the remaining probabilities in the range of 40%–10% (as the difference of 60%-90% from 100%) belonging to clear skies. February and December include a 100% coverage of cloudy-sky conditions.

3.3. Intra-Annual PBL-Height Variation

To investigate the PBL-height variation in a year, Figure 12 was prepared. An August peak is shown under all-sky conditions and a September one under clear skies. The monthly mean PBLH values in February and December are artificial (derived from linear interpolation between the values of January/March and November/January, respectively) as already mentioned in Section 3.1. Secondary peaks are found in April under all-weather situations in January in the case of clear skies. The error bars in Figure 12 and Figure 13 have the same meaning with those in Figure 11.
Kokkalis et al. [37] have investigated the PBLH evolution throughout a year over Athens using a Raman lidar located in the campus of NTUA at the foothills of Mt. Ymittos (see map in Figure 1). The distance between ASNOA and NTUA is about 5.5 km. It is amazing, though, that the graphs in Figure 12a and Figure 14 of Kokkalis et al.’s study [37] are quite similar in both the shape and amplitude of the upper (their daytime) and lower (their nighttime) PBL curves of the present study. The only difference exists in the missing August maximum of the daytime PBL curve in Kokkalis et al.’s results; the authors recognise this possible discrepancy by admitting that the statistical analysis may not be representative for this month due to limited data. Another interesting point is the coincidence of their nighttime PBL curve with our lower PBL one.

3.4. Seasonal PBL-Height Variation

Figure 13 shows the seasonal variation of the uPBLH (Figure 13a) and lPBLH (Figure 13b) curves under all- and clear-sky conditions. It is interesting to notice the high altitudes of both uPBL and lPBL curves in winter under clear skies, which may be due to a frequent meteorological phenomenon called “Halcyon days”; during the period 15 January–15 February, fair weather predominates over Athens with sunny days and maximum air temperatures around 18–20 °C. Another reason may be the almost double number of STIs during winter days in comparison with that during summertime ones [84]; also, the height of the winter TI bases is fully comparable with that during summer [84]. Elevated STIs may “push” lPBL to higher altitudes. A fourth reason may be central heating during winter that causes an increase in the downtown temperature more at nighttime than daytime, as explained in Section 3.1.

3.5. Intra-Daily PBL-Height Variation

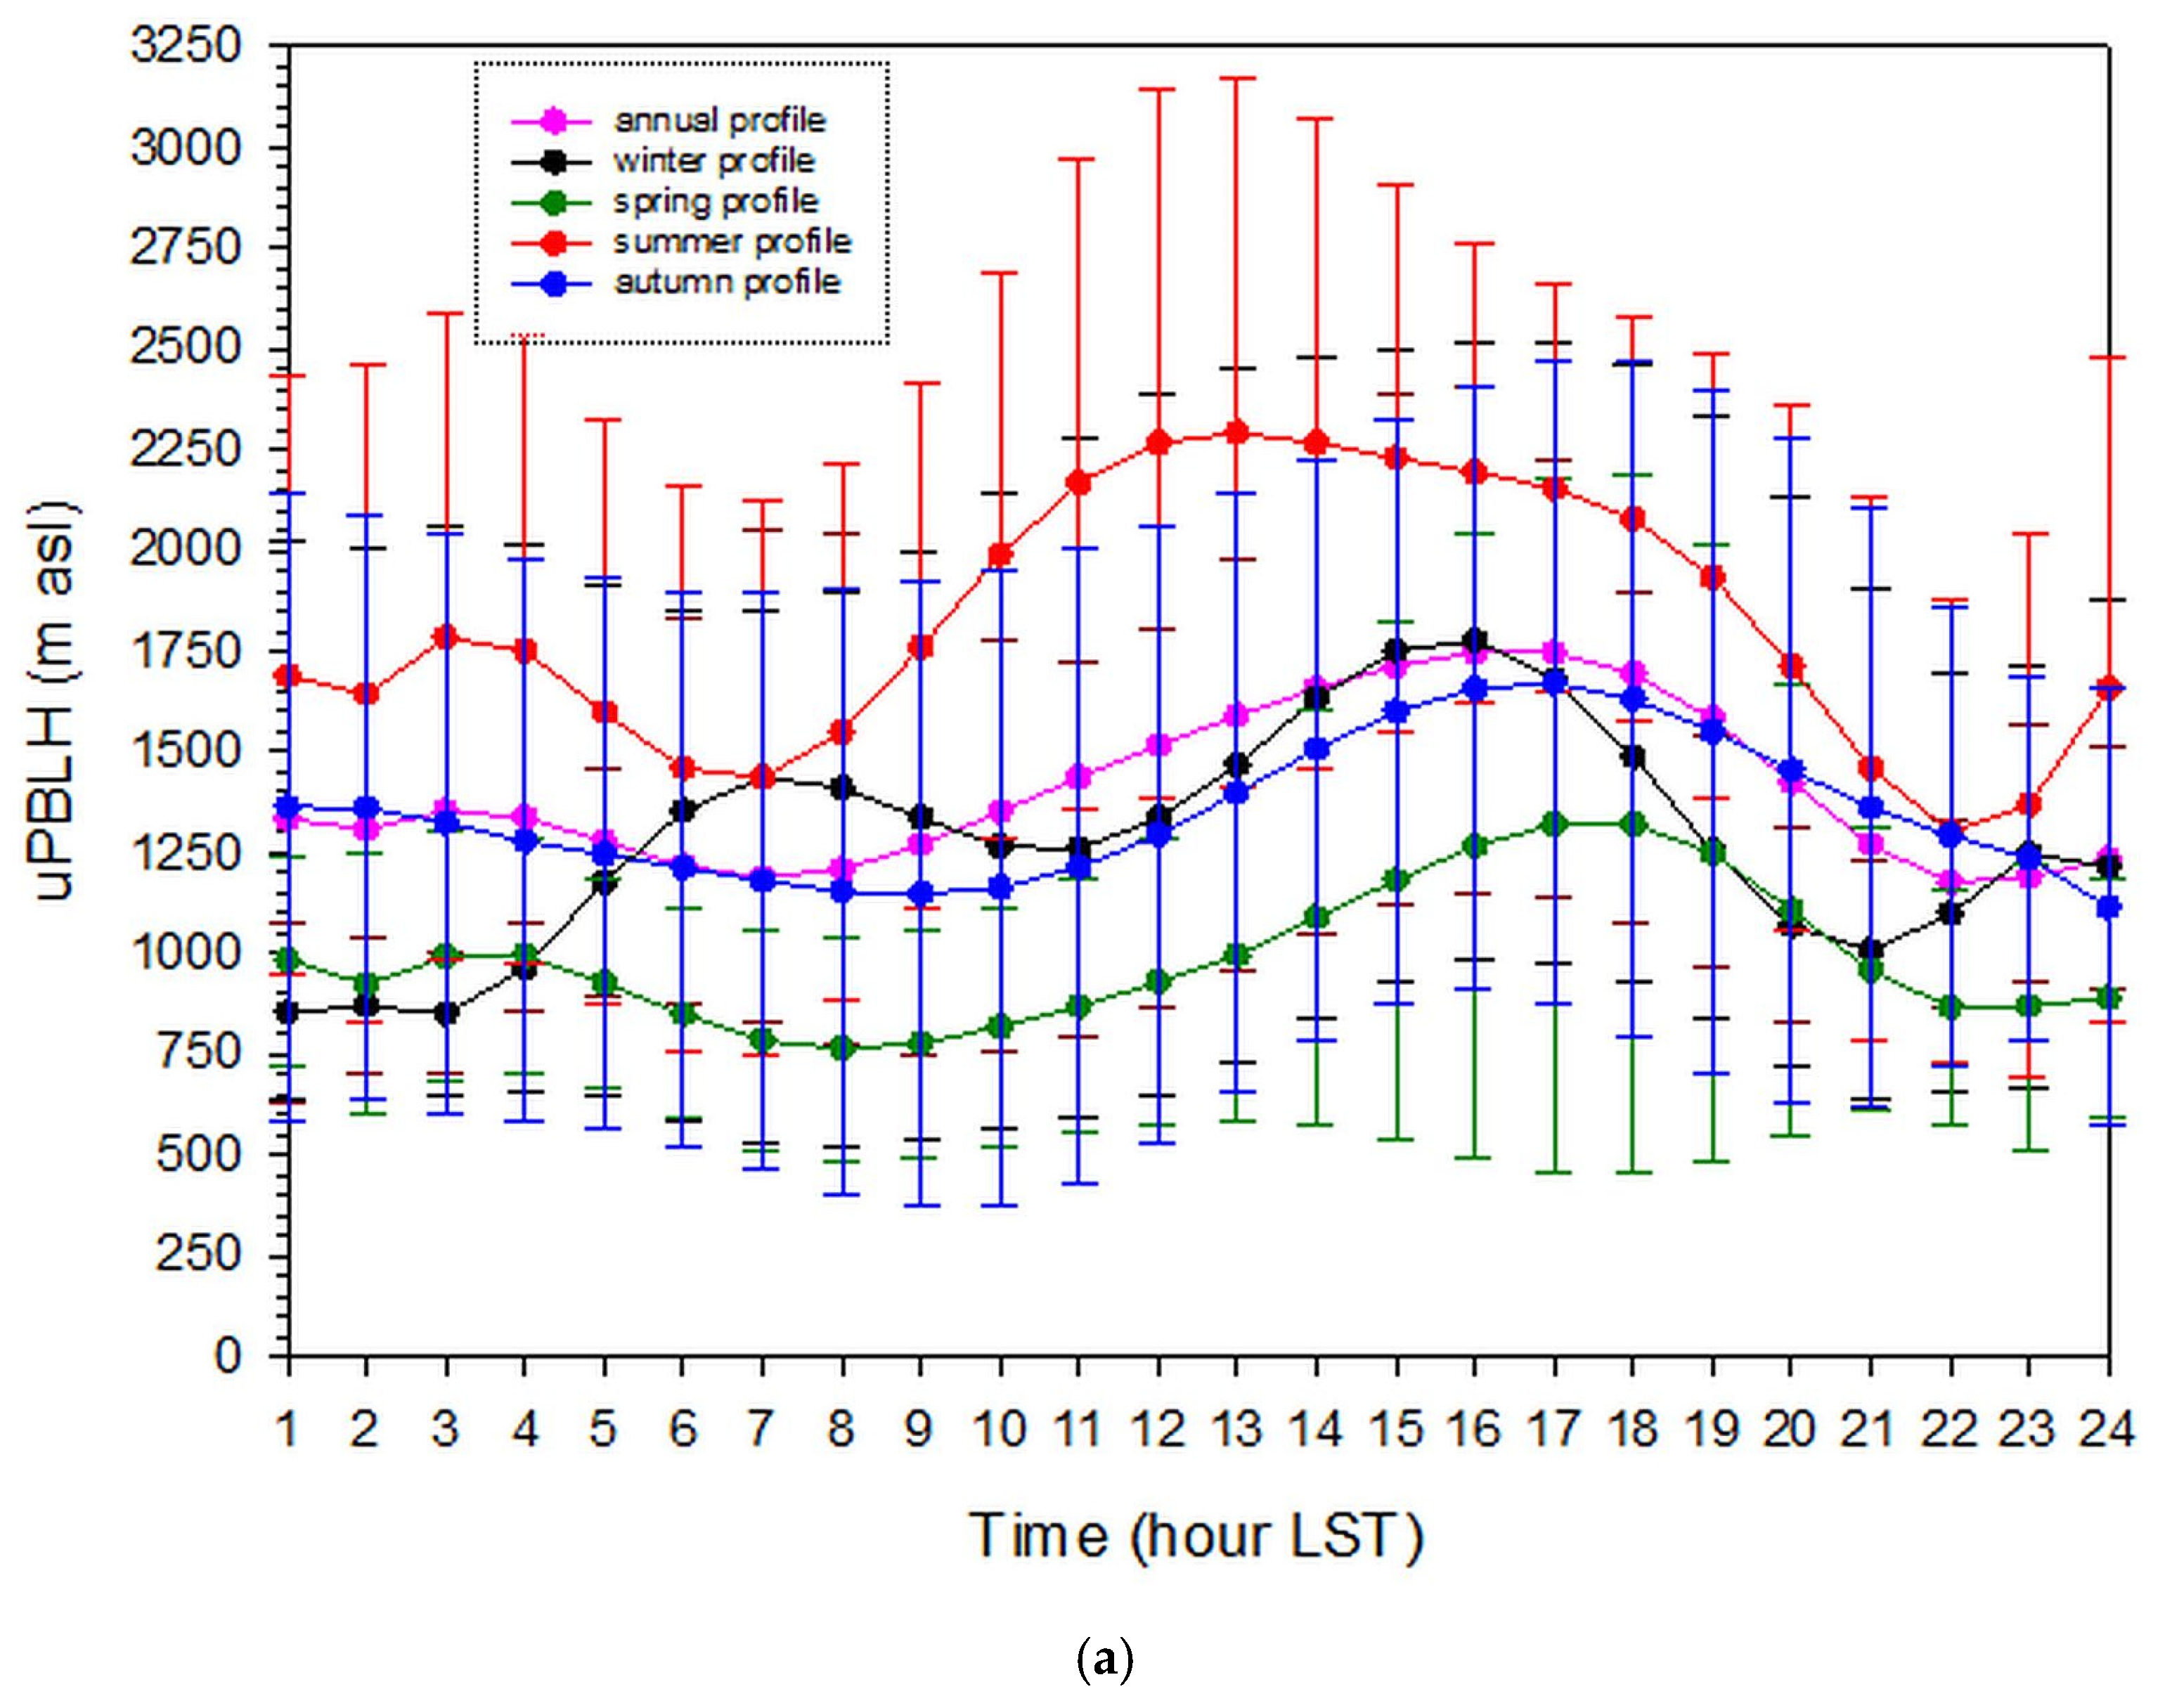
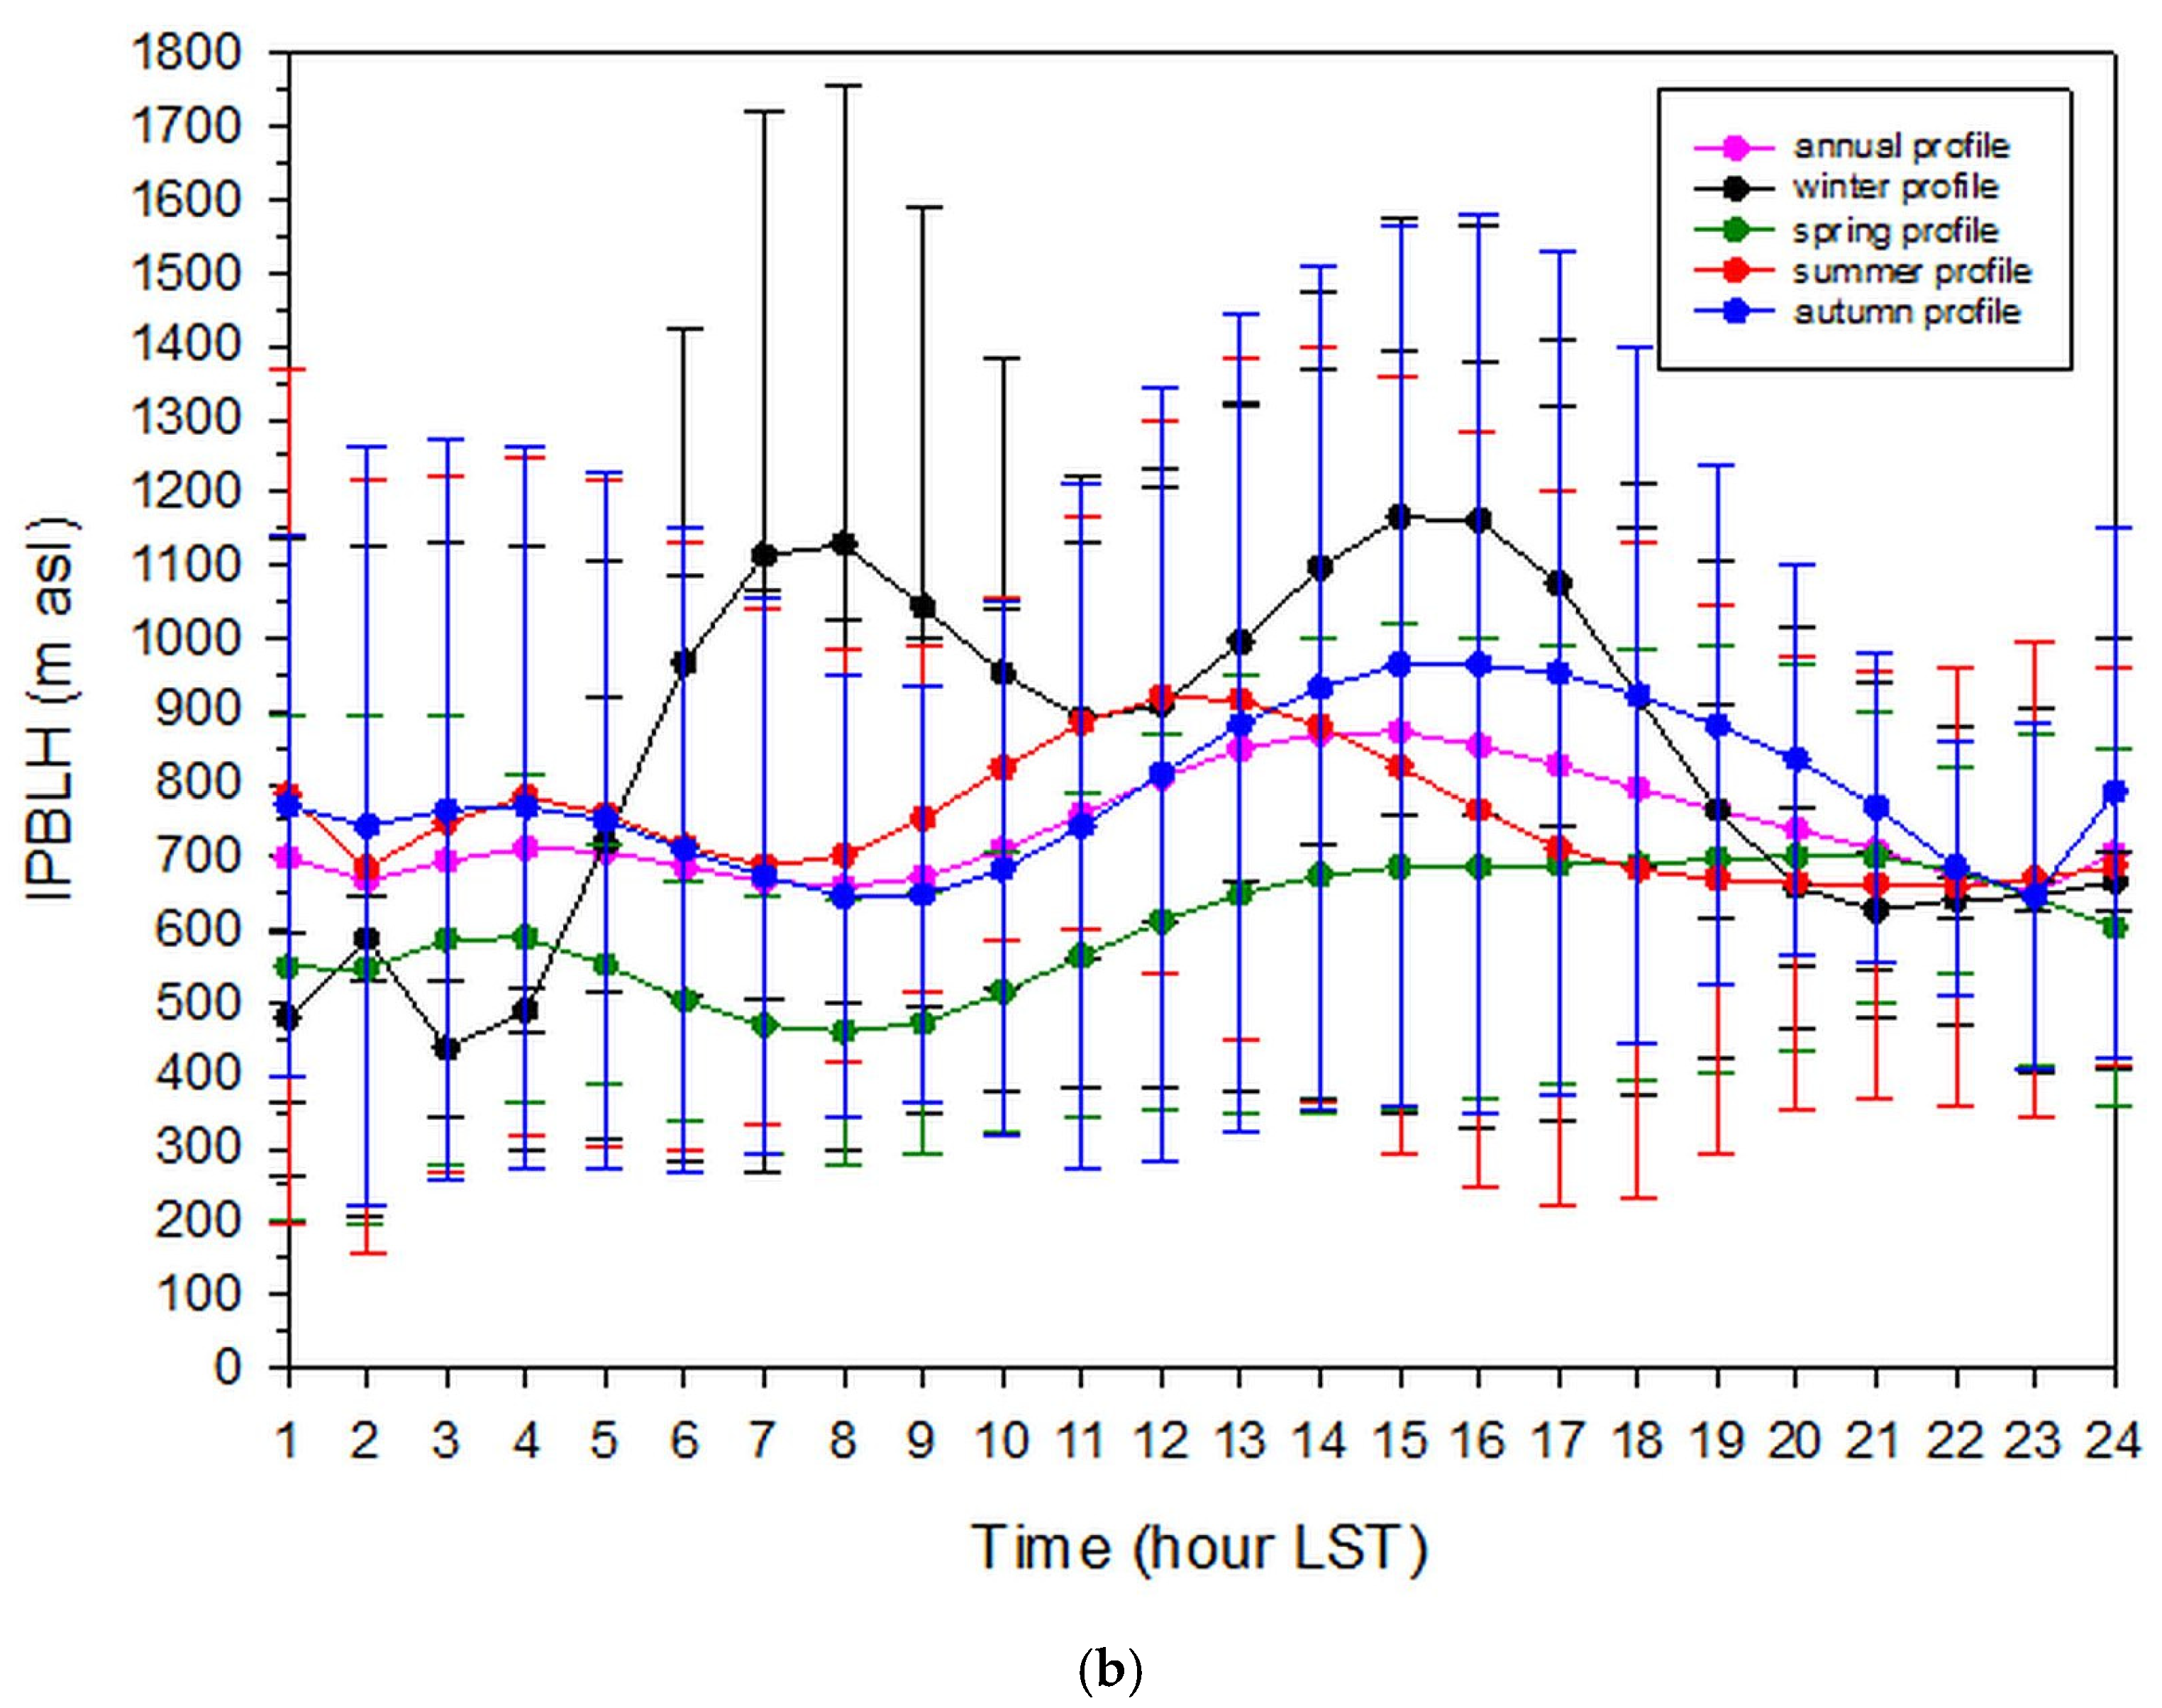
Figure 14 shows the diurnal variation of the uPBLH (Figure 14a) and lPBLH (Figure 14b) curves under all-sky conditions. It is interesting to notice that the uPBL curves are distinct in all seasons, with higher values in the summer and lower during winter. On the contrary, the lPBL curves are mixed in all seasons, not showing a specific amplitude pattern as in the case of the uPBL curves. This would be anticipated from Figure 9b where no organised pattern is shown throughout the year. Another observation may be the higher error bars in comparison to those for uPBL; this might be due to the fact that the lPBL curve is determined by a combination of atmospheric processes (i.e., NBL, SL, STIs, LLJs, TIBL) that occur near the ground but not simultaneously. On the contrary, the uPBL curve is clearly defined by a well-organised atmospheric circulation (i.e., convection with strong turbulence during daytime and weaker turbulence during nighttime).
Figure 15 shows the diurnal variation of the uPBLH (Figure 15a) and lPBLH (Figure 15b) curves under clear-sky conditions. It is interesting to notice that the uPBL profiles follow the anticipated amplitude, i.e., higher in summer, lower in winter. The diurnal lPBL curves are inter-mixed due to the different combination of the near-ground atmospheric circulations occurring in the various seasons.
The error bars in Figure 14 and Figure 15 have the same meaning as those in Figure 11.

4. Conclusions

The present study investigated the height of the PBL top during a 2-year period (October 2008–September 2010) over Athens, Greece, under all-weather conditions. This was done by analysing the ceilometer records from its operation on the ASNOA platform. Six days per month (1, 6, 11, 16, 21, and 26) were selected for subsequent analysis. That was decided for two reasons: (i) It was not possible to find a code for converting the hexadecimal characters in the Vaisala CL31 files into ASCII ones, and (ii) there was very limited time to complete this task in the time frame of the KRIPIS-THESPIA-II project. Despite this day selection, such an analysis from a ceilometer was done for the first time in Greece. A specific code was developed that took into account the available up-to-date ceilometer methodology in deriving the PBL height from the instrument’s backscattered signal. Additional criteria were introduced into the algorithm; this algorithm is, therefore, unique in this context worldwide.
The code identified two types of PBL curves on any day: The upper and the lower. The first coincides with the tops of the RLs and CBLs, while the lower with the tops of various local mechanisms (SLs, NBLs, SALs, STIs, IBLs, and nocturnal LLJs). The definition of the upper PBL (uPBL), which also constitutes the mixing-layer height (MLH), is solid. On the contrary, the definition of the lower PBL (lPBL) curve is rather loose as a result of the combination of all or some of the contributing mechanisms mentioned above. For air-pollution studies, it is the MLH that plays important role in dispersing pollutants at the city scale and beyond in daytime. Nevertheless, the lPBL curve may interact with the urban heat-island effect and provide unforeseen air-pollutant dispersion at the neighbourhood scale (cf. canyon effect).
The analysis showed that the MLH has a clear early-afternoon maximum in the warm period of the year under any type of weather conditions; this maximum becomes broader just before sunset. On the contrary, the lPBL seems to be affected by anthropogenic activities, too. It forms two major peaks, one in the morning and another in early afternoon, that may coincide with the daily activities in Athens (central heating, traffic). This especially apparent in April and in July–October.
The MLH reached altitudes in the studied period of 2100 m asl and 2800 m asl under all- and clear-sky conditions. The lPBL top varied between 800 m asl and 900 m asl. In this respect, the annual mean MLH was 1395 ± 377 m asl, while the lPBL one 788 ± 138 m asl under all-weather conditions. The above figures became 1459 ± 643 m asl for the ML, and 773 ± 314 m asl for the lPBL under fair-weather conditions. These results are in very good agreement with recent ones from lidar recordings in operation at NTUA, located 5.5 km east of ASNOA [37].
The MLH showed a seasonal variation with maximum heights (around 2000 m asl) in August under any type of weather. Similar results were derived in a study about the urban Sofia MLH [28]. In clear-sky conditions, both uPBL and lPBL showed a winter maximum (about 1600 m asl and 1100 m asl, respectively), too; that might be related to the fair-weather conditions (higher maximum winter air temperatures, high solar insolation) pertaining during the “Halcyon-days” period (15 January–15 February), as well as the operation of the central heating that affects the urban heat island. On the contrary, as far as the wintertime PBLH is concerned, Yang et al. [10] found that the urban uPBL over Beijing has a height of between 300 m and 1000 m, while the lPBL extended to altitudes in the range 200 m to 300 m, all quite lower than the case of Athens. Wang et al. [11] reported average seasonal daily PBLHs of 1160 m, 1340 m, 990 m, and 730 m for the seasons of spring, summer, autumn, and winter, respectively, over Warsaw. These values are closer to the ones over Athens. The above demonstrate the influence of local weather on the development of the PBL, as expected [16].
The diurnal variation of the PBL curves showed a regular pattern in the seasonal profiles for the ML and a rather irregular one for the lPBL. The irregularity in the lPBL pattern, as far as the amplitude of its seasonal profiles is concerned, was attributed to the irregular combination of various local atmospheric circulations that can affect it during winter. It is also noticeable that the winter lPBL profile has amplitude greater than the summer one; this was justified by the frequent occurrence of fair weather during the “Halcyon-days” period, and the contribution from the central heating.
The rather large errors (error bars) in the various plots associated with the inter-/intra-annual, seasonal, and diurnal PBLH variation are due to the large variability in the uPBLH and lPBLH values themselves; indeed, these heights are susceptible to the prevailing atmospheric stability (prevailing weather conditions), which often change from one day to the next.
The algorithm developed can be applied to any location by following the Routines (criteria) determined in Section 2.3.3. The only differentiation might be a user modification in removing Routine H (smoothing process of the PBL curves, especially of the uPBL one) in order to avoid possible misses of the actual MLH. In the present study, the only miss in the 143 analysed cases was the one mentioned in Section 2.4, which did not influence the PBL statistics. In the context of algorithms development, Pathfinder is another graph-based method to track the MLH evolution with the aid of lidar [12]. Additionally, Liu et al. [13] developed an adaptive method to estimate BLH from radar wind profilers.
In conclusion, the added value of the present study consists of the following issues: (i) A new algorithm for retrieving the PBL from ceilometer records was developed that may be applied to other parts of the world with slight modifications; (ii) the notion of upper and lower PBL (uPBL, lPBL) curves was introduced in the literature for the first time; (iii) association of these curves was made with particular atmospheric layers comprising the PBL; and (iv) the annual, seasonal, and diurnal variation of the uPBLH and lPBLH was given for Athens, knowledge that may be useful to local air-pollution modellers.

Author Contributions

Conceptualisation, methodology, supervision of work, analysis of radiosonde soundings, writing—original draft preparation, manuscript—review and editing, H.D.K.; manuscript—review and editing, B.E.P.; development of the algorithm, CL31 data analysis, collection of radiosonde soundings, manuscript—review and editing, A.G.; initial CL31 data analysis by using an own developed code, manuscript—review, K.P. All authors have read and agreed to the published version of the manuscript.

Funding

This research was implemented in the frame of the Working Package 6 “Generation of Typical Meteorological Years in Greece” of the KRIPIS-THESPIA-II project (grant MIS 5002517 from the General Secretariat of Research and Innovation in Greece).

Institutional Review Board Statement

Not applicable.

Informed Consent Statement

Not applicable.

Data Availability Statement

Not applicable.

Acknowledgments

The authors are thankful to N. Kappos for the maintenance and data collection from the ASNOA CL31 ceilometer.

Conflicts of Interest

The authors declare no conflict of interest.

References

  1. Seibert, P.; Beyrich, F.; Gryning, S.E.; Joffre, S.; Rasmussen, A.; Tercier, P. Review and inter-comparison of operational methods for the determination of the Mixing Height. Atmos. Environ. 2000, 34, 1001–1027. [Google Scholar] [CrossRef]
  2. Compton, J.C.; Delgado, R.; Berkoff, T.A.; Hoff, R.M. Determination of Planetary Boundary layer height on short spatial and temporal scales: A demonstration of the covariance wavelet transforms in ground-based wind profiler and lidar measurements. J. Atmos. Ocea. Tech. 2013, 30, 1566–1575. [Google Scholar] [CrossRef]
  3. Seidel, D.J.; Ao, C.O.; Li, K. Estimating climatological planetary boundary layer heights from radiosonde observations: Comparison of methods and uncertainty analysis. J. Geophys. Res. 2010, 115, D16113. [Google Scholar] [CrossRef] [Green Version]
  4. Lee, S.-J.; Kim, J.; Cho, C.-H. An automated monitoring of atmospheric mixing height from routine radiosonde profiles over S. Korea using a web-based data transfer method. Environ. Monit. Assess. 2014, 186, 3253–3263. [Google Scholar] [CrossRef]
  5. Wang, X.Y.; Wang, K.C. Estimation of atmospheric mixing layer height from radiosonde data. Atmos. Meas. Tech. 2014, 7, 1701–1709. [Google Scholar] [CrossRef] [Green Version]
  6. Ferrero, L.; Riccio, A.; Perrone, M.G.; Sangiori, G.; Ferrini, B.S.; Bolzacchini, E. Mixing height determination by tethered balloon-based particle soundings and modeling simulations. Atmos. Res. 2011, 102, 145–156. [Google Scholar] [CrossRef]
  7. Dai, C.; Wang, Q.; Kalogiros, J.A.; Lenschow, D.H.; Gao, Z.; Zhou, M. Determining Boundary-Layer Height from aircraft measurements. Bound. Layer Meteorol. 2014, 152, 277–302. [Google Scholar] [CrossRef]
  8. Eremsaa, N.; Karppinen, A.; Joffre, S.M.; Räsänen, J.; Talvitie, H. Mixing layer height determination by ceilometer. Atmos. Chem. Phys. 2006, 6, 1485–1493. [Google Scholar] [CrossRef] [Green Version]
  9. Feng, X.; Wu, B.; Yan, N. A method for deriving the Boundary Layer Mixing height from MODIS atmospheric profile data. Atmosphere 2015, 6, 1346–1361. [Google Scholar] [CrossRef] [Green Version]
  10. Yang, Y.; Fan, S.; Wang, L.; Gao, Z.; Zhang, Y.; Zou, H.; Miao, S.; Li, Y.; Huang, M.; Yim, S.H.L.; et al. Diurnal evolution of the wintertime Boundary Layer in urban Beijing, China: Insights from doppler lidar and a 325-m meteorological tower. Remote Sens. 2020, 12, 3935. [Google Scholar] [CrossRef]
  11. Wang, D.; Stachlewska, I.S.; Song, X.; Heese, B.; Nemuc, A. Variability of the Boundary Layer over an urban continental site based on 10 years of active remote sensing observations in Warsaw. Remote Sens. 2020, 12, 340. [Google Scholar] [CrossRef] [Green Version]
  12. De Bruine, M.; Apituley, A.; Donovan, D.P.; Klein Baltink, H.; Haij, M.J.D. Pathfinder: Applying graph theory to consistent tracking of daytime mixed layer height with backscatter lidar. Atmos. Meas. Tech. 2017, 10, 1893–1909. [Google Scholar] [CrossRef] [Green Version]
  13. Liu, B.; Guo, J.; Gong, W.; Shi, Y.; Jin, S. Boundary Layer Height as estimated from radar wind profilers in four cities in China: Relative contributions from aerosols and surface features. Remote Sens. 2020, 12, 1657. [Google Scholar] [CrossRef]
  14. Seibert, P.; Beyrich, F.; Gryning, S.E.; Joffre, S.; Rasmussen, A.; Tercier, P. Mixing height determination for dispersion modeling. Report of Working Group 2. In Harmonization in the Preprocessing of Meteorological Data for Atmospheric Dispersion Models; Office for Official Publications of the European Communities: Luxembourg, 1998. [Google Scholar]
  15. Emeis, S.; Jahn, C.; Münkel, C.; Münsterer, C.; Schäfer, K. Multiple atmospheric layering and mixing-layer height in the Inn valley observed by remote sensing. Meteorol. Zeit. 2007, 16, 415–424. [Google Scholar] [CrossRef]
  16. Stull, R.B. An Introduction to Boundary-Layer Meteorology; Kluwer Academic Publishers: Dordrecht, The Netherlands, 1998. [Google Scholar]
  17. Garratt, J.R. The Atmospheric Boundary Layer; Cambridge University Press: Cambridge, UK, 1994. [Google Scholar]
  18. Piringer, M.; Joffre, S.; Baklanov, A.; Christen, A.; Doserti, M.; De Ridder, K.; Emeis, S.; Mestayer, P.; Tombrou, M.; Middleton, D.; et al. The surface energy budget and the mixing height in urban areas–activities and recommendations of COST-Action 715. Bound. Layer Meteorol. 2007, 124, 3–24. [Google Scholar] [CrossRef]
  19. Tsaknakis, G.; Papayannis, A.; Kokkalis, P.; Amiridis, V.; Kambezidis, H.D.; Mamouri, R.E.; Georgoussis, G.; Avdikos, G. Inter-comparison of lidar and ceilometer retrievals for aerosol and planetary boundary layer profiling over Athens, Greece. Atmos. Meas. Tech. 2011, 4, 1261–1273. [Google Scholar] [CrossRef] [Green Version]
  20. Knippertz, P.; Stuut, J.-B.W. Mineral Dust: A Key Player in the Earth System; Springer: Cham, The Netherlands, 2014. [Google Scholar]
  21. Mielonen, T.; Aaltonen, V.; Lihavainen, H.; Hyvärinen, A.P.; Arola, A.; Komppula, M.; Kivi, R. Biomass-burning aerosols observed in northern Finland during the 2010 wildfires in Russia. Atmosphere 2013, 4, 17–34. [Google Scholar] [CrossRef] [Green Version]
  22. Wiegner, M.; Gasteiger, J.; Groß, S.; Schnell, F.; Freudenthaler, V.; Forkel, R. Characterization of the Eyjafjallajökull ash-plume: Potential of lidar remote sensing. Phys. Chem. Earth 2012, 45, 79–86. [Google Scholar] [CrossRef]
  23. Nemuc, A.; Stachlewska, I.S.; Vasilescu, J.; Górska, A.; Nicolae, D.; Talianu, C. Optical properties of long-range transported volcanic ash over Romania and Poland during Eyjafjallajökull eruption in 2010. Acta Geophys. 2014, 62, 350–366. [Google Scholar] [CrossRef]
  24. Martucci, G.; Milroy, C.; O’Dowd, C.D. Detection of cloud-base height using Jenoptik CHM15K and Vaisala CL-31 ceilometers. J. Atmos. Ocean. Technol. 2010, 27, 305–318. [Google Scholar] [CrossRef]
  25. Vaisala CL31 Ceilometer. Available online: https://www.vaisala.com/en/products/instruments-sensors-and-other-measurement-devices/weather-stations-and-sensors/cl31 (accessed on 21 May 2021).
  26. Wiegner, M.; Gasteiger, J. Correction to water vapor absorption for aerosol remote sensing with ceilometers. Atmos. Meas. Tech. 2015, 8, 3971–3984. [Google Scholar] [CrossRef] [Green Version]
  27. Münkel, C.; Eresmaa, N.; Räsänen, J.; Karpinen, A. Retrieval of mixing height and dust concentration with lidar ceilometer. Bound. Layer Meteorol. 2007, 124, 117–128. [Google Scholar] [CrossRef]
  28. Danchovski, V. Summertime urban Mixing Layer Height over Sofia, Bulgaria. Atmosphere 2019, 10, 36. [Google Scholar] [CrossRef] [Green Version]
  29. Hirsikko, A.; O’Connor, E.J.; Komppula, M.; Korhonen, K.; Pfüller, A.; Giannakaki, E.; Wood, C.R.; Bauer-Pfundstein, M.; Poikonen, A.; Karppinen, T.; et al. Observing wind, aerosol particles, cloud and precipitation: Finland’s new ground-based remote-sensing network. Atmos. Meas. Tech. 2014, 7, 1351–1375. [Google Scholar] [CrossRef] [Green Version]
  30. E-PROFILE (EUMETNET Profiling Programme). Available online: https://e-profile.eu/#/cm_profile (accessed on 21 May 2021).
  31. EUMETNET (European Meteorological Services Network). Available online: https://www.eumetnet.eu (accessed on 21 May 2021).
  32. Haman, C.L.; Lefer, B.; Morris, G.A. Seasonal variability in the diurnal evolution of the Boundary Layer in a near-coastal urban environment. J. Atmos. Ocean. Technol. 2012, 29, 697–710. [Google Scholar] [CrossRef]
  33. Stachlewska, I.S.; Piądłowski, M.; Migacz, S.; Szkop, A.; Zielińska, A.; Swaczyna, P.L. Ceiloemeter observations of the boundary layer over Warsaw, Poland. Acta Geophys. 2012, 60, 1386–1412. [Google Scholar] [CrossRef]
  34. Mues, A.; Rupakheti, M.; Münkel, C.; Lauer, A.; Bozem, H.; Hoor, P.; Butler, T.; Lawrence, M.G. Investigation of the mixing layer height derived from ceilometer measurements in the Kathmandu Valley and implications for local air quality. Atmos. Chem. Phys. 2017, 17, 8157–8176. [Google Scholar] [CrossRef] [Green Version]
  35. COST Action 1303 (TOPROF). Towards Operational Ground-Based Profiling with Ceilometers, Doppler Lidars and Microwave Radiometers for Improving Weather Forecasts. Available online: https://www.cost.eu/actions/ES1303/#tabs|Name:overview (accessed on 21 May 2021).
  36. Uzan, L.; Egert, S.; Alpert, P. Ceilometer evaluation of the eastern Mediterranean summer BLH–first study at two Israeli sites. Atmos. Meas. Tech. 2016, 9, 4387–4398. [Google Scholar] [CrossRef] [Green Version]
  37. Kokkalis, P.; Alexiou, D.; Papayannis, A.; Rocadenbosch, F.; Soupiona, O.; Raptis, P.I.; Mylonaki, M.; Tzanis, C.G.; Christodoulakis, J. Application and testing of the Extended-Kalman-Filtering Technique for determining the Planetary Boundary-Layer height over Athens, Greece. Bound. Layer Meteorol. 2020, 176, 125–147. [Google Scholar] [CrossRef]
  38. Emeis, S.; Münkel, C.; Vogt, S.; Müller, W.J.; Schäfer, K. Atmospheric boundary-layer structure from simultaneous SODAR, RASS, and ceilometer measurements. Atmos. Environ. 2004, 38, 273–286. [Google Scholar] [CrossRef]
  39. De Haij, M.J.; Wauben, W.M.F.; Baltink, H.K.; Apituley, A. Determination of the mixing layer height by a ceilometer. In S03-P01, Proceedings of the 8th International Symposium on Tropospheric Profiling, Delft, The Netherlands, 19–23 October, 2009; Apituley, A., Russchenberg, H.W.J., Monna, W.A.A., Eds.; KNMI: Delft, The Netherlands, 2009; pp. 1–4. [Google Scholar]
  40. Emeis, S.; Schäfer, K.; Münkel, C. Long-term observations of the urban mixing-layer height with ceilometers. Ser. Earth Environ. Sci. 2008, 1, 012027. [Google Scholar] [CrossRef]
  41. Lotteraner, C.; Piringer, M. Mixing-layer height time series from operational ceilometer aerosol-layer heights. Bound. Layer Meteorol. 2016, 161, 265–287. [Google Scholar] [CrossRef] [Green Version]
  42. Cho, C.; Kim, S.W.; Rupakheti, M.; Park, J.-S.; Panday, A.; Yoon, S.C.; Kim, J.-H.; Kim, H.; Jeon, H.; Sung, M.; et al. Wintertime aerosol optical and radiative properties in the Kathmandu Valley during the SusKat-ABC field campaign. Atmos. Chem. Phys. 2017, 17, 12617–12632. [Google Scholar] [CrossRef] [Green Version]
  43. Di Giuseppe, F.; Riccio, A.; Caporaso, L.; Bonafé, G.; Gobbi, G.P.; Angelini, F. Automatic detection of atmospheric boundary layer height using ceilometer backscatter data assisted by a boundary layer model. Q. J. R. Meteorol. Soc. 2012, 138, 649–663. [Google Scholar] [CrossRef]
  44. Salmond, J.A.; McKendry, I.G. A review of turbulence in the very stable nocturnal boundary layer and its implication for air quality. Prog. Phys. Geogr. 2005, 29, 171–188. [Google Scholar] [CrossRef] [Green Version]
  45. Mahrt, L. Nocturnal boundary-layer regimes. Bound. Layer Meteorol. 1998, 88, 255–278. [Google Scholar] [CrossRef]
  46. Melas, D.; Kambezidis, H.D. The depth of the Internal Boundary Layer over an urban area under sea-breeze conditions. Bound. Layer Meteorol. 1992, 61, 247–264. [Google Scholar] [CrossRef]
  47. Kambezidis, H.D.; Peppes, A.A.; Melas, D. An environmental experiment over Athens urban area under sea-breeze conditions. Atmos. Res. 1995, 36, 139–156. [Google Scholar] [CrossRef]
  48. Levitin, J.; Kambezidis, H.D. Numerical modelling of the Thermal Internal Boundary Layer evolution using Athens field experimental data. Bound. Layer Meteorol. 1997, 84, 207–217. [Google Scholar] [CrossRef]
  49. Savijärvi, H.; Niemelä, S.; Tisler, P. Coastal winds and low-level jets: Simulations for sea gulfs. Q. J. R. Meteorol. Soc. 2005, 131, 625–637. [Google Scholar] [CrossRef]
  50. Münkel, C.; Räsänen, J. Enhanced single lens lidar ceilometer for mixing height and dust concentration retrieval. In Proceedings of the 14th International Conference on Knowledge Technologies and Data-Driven Business, Graz, Austria, 14–17 September 2005. [Google Scholar]
  51. Münkel, C. Boundary layer and air quality monitoring with a commercial lidar ceilometer. In Proceedings of the Lidar Technologies, Techniques, and Measurements for Atmospheric Remote Sensing, Stockholm, Sweden, 11–14 September 2006. [Google Scholar]
  52. Vaisala CL-View Software. Available online: https://www.vaisala.com/en/products/software/cl-view100 (accessed on 21 May 2021).
  53. Morrille, Y.; Haeffelin, M.; Drobinski, P.; Pelon, J. STRAT: An automated algorithm to retrieve the vertical structure of the atmosphere from single-channel lidar data. J. Atmos. Ocean. Technol. 2007, 24, 761–775. [Google Scholar] [CrossRef] [Green Version]
  54. Schween, J.H.; Hirsikko, A.; Löhnert, U.; Crewell, S. Mixing-layer height retrieval with ceilometer and Doppler lidar: From case studies to long-term assessment. Atmos. Meas. Tech. 2014, 7, 3685–3704. [Google Scholar] [CrossRef] [Green Version]
  55. Kotthaus, S.; Grimmond, C.S.B. Atmospheric boundary-layer characteristics from ceilometer measurements. Part 1: A new method to track mixed layer height and classify clouds. Q. J. R. Meteorol. Soc. 2018, 144, 1525–1538. [Google Scholar] [CrossRef] [Green Version]
  56. De Arruda Moreira, G.; Guerrero-Rascado, J.L.; Bravo-Aranda, J.A.; Foyo-Moreno, I.; Cazorla, A.; Alados, I.; Lyamani, H.; Landulfo, E.; Alados-Arboledas, L. Study of the planetary boundary layer height in an urban environment using a combination of microwave radiometer and ceilometer. Atmos. Res. 2020, 240, 104932. [Google Scholar] [CrossRef]
  57. Vaisala BL-View Software Package. Available online: https://www.vaisala.com/en/products/software/bl-view (accessed on 21 May 2021).
  58. COST Action 710. Harmonisation of the Pre-Processing of the Meteorological Data for Atmospheric Dispersion Models. Available online: http://www.dmu.dk/atmosphericenvironment/cost_710.htm (accessed on 21 May 2021).
  59. Fisher, B.E.A.; Erbrink, J.J.; Finardi, S.; Jeanet, P.; Joffre, S.; Morselli, M.G.; Pechinger, U.; Siebert, P.; Thomson, D.J. Harmonisation of the Pre-Processing of Meteorological Data for Atmospheric Dispersion Models; Final Report, COST Action 710; European Communities: Brussels, Belgium, 1998. [Google Scholar]
  60. Coen, M.C.; Praz, C.; Haefele, A.; Ruffieux, D.; Kaufmann, P.; Calpini, B. Determination and climatology of the planetary boundary layer height above the Swiss plateau by in-situ and remote sensing measurements as well as the COSMO-2 model. Atmos. Chem. Phys. 2014, 14, 13205–13221. [Google Scholar] [CrossRef] [Green Version]
  61. Holzworth, G.C. Estimates of mean maximum mixing depths in the contiguous United States. Mon. Weather Rev. 1964, 92, 235–242. [Google Scholar] [CrossRef] [Green Version]
  62. Richardson, L.F. Some measurements of atmospheric turbulence. Philos. Trans. R. Soc. Ser. A 1921, 221, 1–28. [Google Scholar]
  63. Kiefer, M.T.; Heilman, W.E.; Zhong, S.; Charney, J.J.; Bian, X. Mean and turbulent flow downstream of a low-density fire: Influence of canopy and background atmospheric conditions. J. Appl. Meteorol. 2015, 54, 42–57. [Google Scholar] [CrossRef]
  64. Seigneur, C. Air Pollution: Concepts, Theory, and Applications; Cambridge University Press: Cambridge, UK, 2019; pp. 95–124. [Google Scholar]
  65. Tang, G.; Zhang, J.; Zhu, X.; Song, T.; Munkel, C.; Hu, B.; Schafer, K.; Liu, Z.; Zhang, J.; Wang, L.; et al. Mixing layer height and its implications for air pollution over Beijing, China. Atmos. Chem. Phys. 2016, 16, 12459–12475. [Google Scholar] [CrossRef] [Green Version]
  66. Eremsaa, N.; Härkönen, J.; Joffre, S.M.; Schultz, D.M.; Karppinen, A.; Kukkonen, J. A three-step method for estimating the mixing height using ceilometer data from the Helsinki testbed. J. Appl. Meteorol. Climatol. 2012, 51, 2172–2187. [Google Scholar] [CrossRef] [Green Version]
  67. Markowicz, K.M.; Flatau, P.J.; Kardas, A.E.; Remiszewska, J.; Stelmaszczyk, K.; Woeste, L. Ceilometer retrieval of the boundary layer vertical aerosol extinction structure. J. Atmos. Ocean. Technol. 2008, 25, 928–944. [Google Scholar] [CrossRef]
  68. Herrera-Mejía, L.; Hoyos, C.D. Characterization of the atmospheric boundary layer in a narrow tropical valley using remote-sensing and radiosonde observations and the WRF model: The Aburrá Valley case-study. Q. J. R. Meteorol. Soc. 2019, 145, 2641–2665. [Google Scholar] [CrossRef]
  69. Hayden, K.L.; Anlauf, K.G.; Hoff, R.M.; Strapp, J.W.; Bottenheim, J.W.; Wiebe, H.A.; Froude, F.A.; Martin, J.B.; Steyn, D.G.; McKendry, I.G. The vertical chemical and meteorological structure of the boundary layer in the Lower Fraser Valley during Pacific ’93. Atmos. Environ. 1997, 31, 2089–2105. [Google Scholar] [CrossRef]
  70. Flamant, C.; Pelon, J.; Flamant, P.H.; Durand, P. Lidar determination of the entrainment zone thickness at the top of the unstable marine atmospheric boundary layer. Bound. Layer Meteorol. 1997, 83, 247–284. [Google Scholar] [CrossRef]
  71. Menut, L.; Flamant, C.; Pelon, J.; Flamant, P.H. Urban Boundary-Layer Height determination from Lidar measurements over the Paris area. Appl. Opt. 1999, 38, 945–954. [Google Scholar] [CrossRef] [PubMed]
  72. Senff, C.; Bösenberg, J.; Peters, G.; Schaberl, T. Remote sensing of turbulent ozone fluxes and the ozone budget in the convective Boundary Layer with DIAL and Raman-RASS: A case study. Contr. Atmos. Phys. 1996, 69, 161–176. [Google Scholar]
  73. Sicard, M.; Pérez, C.; Rocadenbosch, F.; Baldasano, J.M.; García-Vizcaino, D. Mixed-layer depth determination in the Barcelona coastal area from regular Lidar measurements: Methods, results and limitations. Bound. Layer Meteorol. 2006, 119, 135–157. [Google Scholar] [CrossRef] [Green Version]
  74. University of Wyoming, Department of Atmospheric Science, USA. Available online: http://weather.uwyo.edu/upperair/sounding.html (accessed on 21 May 2021).
  75. Zeng, X.; Brunke, M.A.; Zhou, M.; Fairall, C.; Bond, N.A.; Lenschow, D.H. Marine atmospheric boundary layer height over the eastern Pacific: Data analysis and model evaluation. J. Climatol. 2004, 17, 4159–4170. [Google Scholar] [CrossRef]
  76. Yamada, T.; Mellor, G.L. A simulation of the Wangara atmospheric boundary layer data. J. Atmos. Sci. 1975, 32, 2309–2329. [Google Scholar] [CrossRef] [Green Version]
  77. Muňoz, R.C.; Undurraga, A.A. Daytime mixed layer over the Santiago basin: Description of two years of observations with a lidar ceilometer. J. Appl. Meteorol. Climatol. 2010, 49, 1728–1741. [Google Scholar] [CrossRef]
  78. Kambezidis, H.D.; Muneer, T.; Tzortzis, M.; Arvanitaki, S. Global and diffuse horizontal illuminance: Month-hour distribution for Athens, Greece in 1992. Lighting Res. Technol. 1998, 30, 69–74. [Google Scholar] [CrossRef]
  79. Kambezidis, H.D. The solar radiation climate of Athens: Variations and tendencies in the period 1992–2017, the brightening era. Sol. Energy 2018, 173, 328–347. [Google Scholar] [CrossRef]
  80. Kambezidis, H.D.; Oikonomou, T.I.; Zevgolis, D. Daylight climatology in the Athens urban environment: Guidance for building designers. Lighting Res. Technol. 2002, 34, 297–312. [Google Scholar] [CrossRef]
  81. Kambezidis, H.D.; Psiloglou, B.E. Climatology of the Linke and Unsworth-Monteith turbidity parameters for Greece: Introduction to the notion of a Typical Atmospheric Turbidity Year. Appl. Sci. 2020, 10, 4043. [Google Scholar] [CrossRef]
  82. Hsu, S.A. Mesoscale nocturnal jet-like winds within the Planetary Boundary Layer over a flat, open coast. Bound. Layer Meteorol. 1979, 17, 485–494. [Google Scholar] [CrossRef]
  83. Moreno-Garcia, M.C. Intensity and form of the urban heat island in Barcelona. Int. J. Climatol. 1993, 14, 705–710. [Google Scholar] [CrossRef]
  84. Kassomenos, P.A.; Koletsis, I.G. Seasonal variation of the temperature inversions over Athens, Greece. Int. J. Climatol. 2005, 25, 1651–1663. [Google Scholar] [CrossRef]
Figure 1. Map of part of Greece showing the Attica Region (upper left), map of the Attica Region showing the Athens Basin (bottom centre), and map of the Athens Basin (upper right) indicating the locations of ASNOA, NTUA, and HNMS. The distances (yellow lines) between the locations are: ASNOA-HNMS 9.2 km, ASNOA-nearest coastline 5.0 km, ASNOA-NTUA 5.5 km, NTUA-HNMS 8.7 km.
Remotesensing 13 02175 g001
Figure 2. Profiles of T (°C), θ (K), RH (%), q (g kg−1), Ri, and WS (m s−1) in the first 3000 m agl from radiosondes performed at 00:00 UTC (02:00 LST) at the HNMS station of Elliniko on (a) 11 October 2008 and (b) 21 September 2009. The altitude of the station is 15 m asl.
Remotesensing 13 02175 g002
Figure 3. Profiles of T (°C), θ (K), RH (%), q (g kg−1), Ri, and WS (m s−1) in the first 3000 m agl from a radiosonde performed at 12:00 UTC (14:00 LST) at the HNMS station of Elliniko on (a) 6 October 2009 and (b) 16 December 2008. The altitude of the station is 15 m asl.
Remotesensing 13 02175 g003
Figure 4. Implementation of the algorithm for the estimation of the PBL height. The commands in the various Routines refer to the corresponding equations in this Section.
Remotesensing 13 02175 g004
Figure 5. Diurnal cycle of the PBL over 3 consecutive days (adapted from [76]). On all days, a high-turbulence CBL with an unstable SL during daytime and an unstable (low-turbulence) RL with a stable NBL during nighttime are observed. A TI is seen on top of the NBL. Another TI also exists on top of the RL, while the EZ on top of the CBL may create (cumulus) clouds. The two big arrows at the bottom show the unstable SLs. The outer boundary line (upper envelope curve) consists of the CBL and RL tops, while the inner one (lower envelope curve) consists of the tops of the unstable SL and stable NBL. Those two curves are detected by the NOA CL31 ceilometer. LLJs, TIBLs, and SALs are not presented in this graph.
Remotesensing 13 02175 g005
Figure 6. CL31 graphs of BSC (colour code ×10−8 m−1 sr−1) for the entire day of (a) 11 October 2008 and (b) 21 September 2009 over ASNOA under generally clear-sky conditions, especially during the sounding times. The estimation of the smoothed uPBL and lPBL curves from the algorithm are shown by the solid-dotted black and pink lines, respectively. The horizontal axis is time (h LST), and the vertical is altitude (m agl). The uPBL and lPBL heights at 00:00 UTC (02:00 LST) are indicated by short horizontal red lines and red numbers.
Remotesensing 13 02175 g006
Figure 7. CL31 graphs of BSC (colour code ×10−8 m−1 sr−1) for the entire day of (a) 6 October 2009 under generally clear-sky conditions, especially during the sounding time, and of (b) 16 December 2008 under cloudy-sky conditions, over ASNOA. The estimation of the smoothed uPBL and lPBL curves from the algorithm are shown by the solid-dotted black and pink lines, respectively. The horizontal axis is time (h LST), and the vertical is altitude (m agl). The uPBL (ML) and lPBL heights at 12:00 UTC (14:00 LST) are indicated by short horizontal red lines and red numbers.
Remotesensing 13 02175 g007
Figure 8. Comparison of the CL31-derived PBLHs with the RDS-derived ones over Athens at (a) 02:00 LST, and (b) 14:00 LST, in the period October 2008–September 2010. The best-fit lines have the following expressions and statistics: (a) PBLHCL31 = 0.98 PBLHRDS + 44.32, R2 = 0.83, MBE = 28.62 m, RMSE = 137.98 m, and (b) PBLHCL31 = 0.83 PBLHRDS + 176.64, R2 = 0.83, MBE = -48.03 m, RMSE = 259.38 m. The coloured circles refer to the accepted data points and the open circles to the rejected ones. The correlation coefficient of the data pairs in both cases is high (0.91).
Remotesensing 13 02175 g008
Figure 9. Month–hour diagram of the (a) uPBL, and (b) lPBL heights over Athens in the period October 2008–September 2010 under all-sky conditions. The colour code refers to the PBLH (m asl).
Remotesensing 13 02175 g009
Figure 10. Month–hour diagram of the (a) uPBL, and (b) lPBL heights over Athens in the period October 2008–September 2010 under clear-sky conditions. The colour code refers to the PBLH (m asl).
Remotesensing 13 02175 g010
Figure 11. Daily averages of the (a) uPBLH and (b) lPBLH curves over Athens in the period October 2008–September 2010 under all-sky conditions. The grey vertical bars denote the ±1σ from the daily mean values.
Remotesensing 13 02175 g011
Figure 12. Monthly mean uPBLH and lPBLH curves over Athens in the period between October 2010–September 2010 under (a) all-, and (b) clear-sky conditions. The blue and red vertical bars indicate the ±1σ from the corresponding monthly mean in the upper and lower curves, respectively.
Remotesensing 13 02175 g012aRemotesensing 13 02175 g012b
Figure 13. Seasonal mean uPBLH and lPBLH curves over Athens in the period October 2008–Scheme 2010 under (a) all-, and (b) clear-sky conditions. The blue and red vertical bars indicate the ±1σ from the corresponding seasonal mean in the upper and lower curves, respectively. Winter: December–January–February, spring: March–April–May, summer: June–July–August, autumn: September–October–November.
Remotesensing 13 02175 g013
Figure 14. Hourly mean (a) uPBLH, and (b) lPBLH curves over Athens in the period October 2008-September 2010 under all-sky conditions. The hourly values are mean annual or mean seasonal (winter, spring, summer, autumn) values. The coloured vertical bars indicate the ±1σ from the curve of the same colour. Winter: December–January–February, spring: March–April–May, summer: June–July–August, autumn: September–October–November.
Remotesensing 13 02175 g014aRemotesensing 13 02175 g014b
Figure 15. Hourly mean (a) uPBLH and (b) lPBLH curves over Athens in the period October 2008–Scheme 2010 under clear-sky conditions. The hourly values are mean annual or mean seasonal (winter, spring, summer, autumn) values. The coloured vertical bars indicate the ±1σ from the curve of the same colour. Winter: December–January–February, spring: March–April–May, summer: June–July–August, autumn: September–October–November.
Remotesensing 13 02175 g015aRemotesensing 13 02175 g015b
Publisher’s Note: MDPI stays neutral with regard to jurisdictional claims in published maps and institutional affiliations.