
An Adaptive Human Activity-Aided Hand-Held Smartphone-Based Pedestrian Dead Reckoning Positioning System


Abstract
1. Introduction
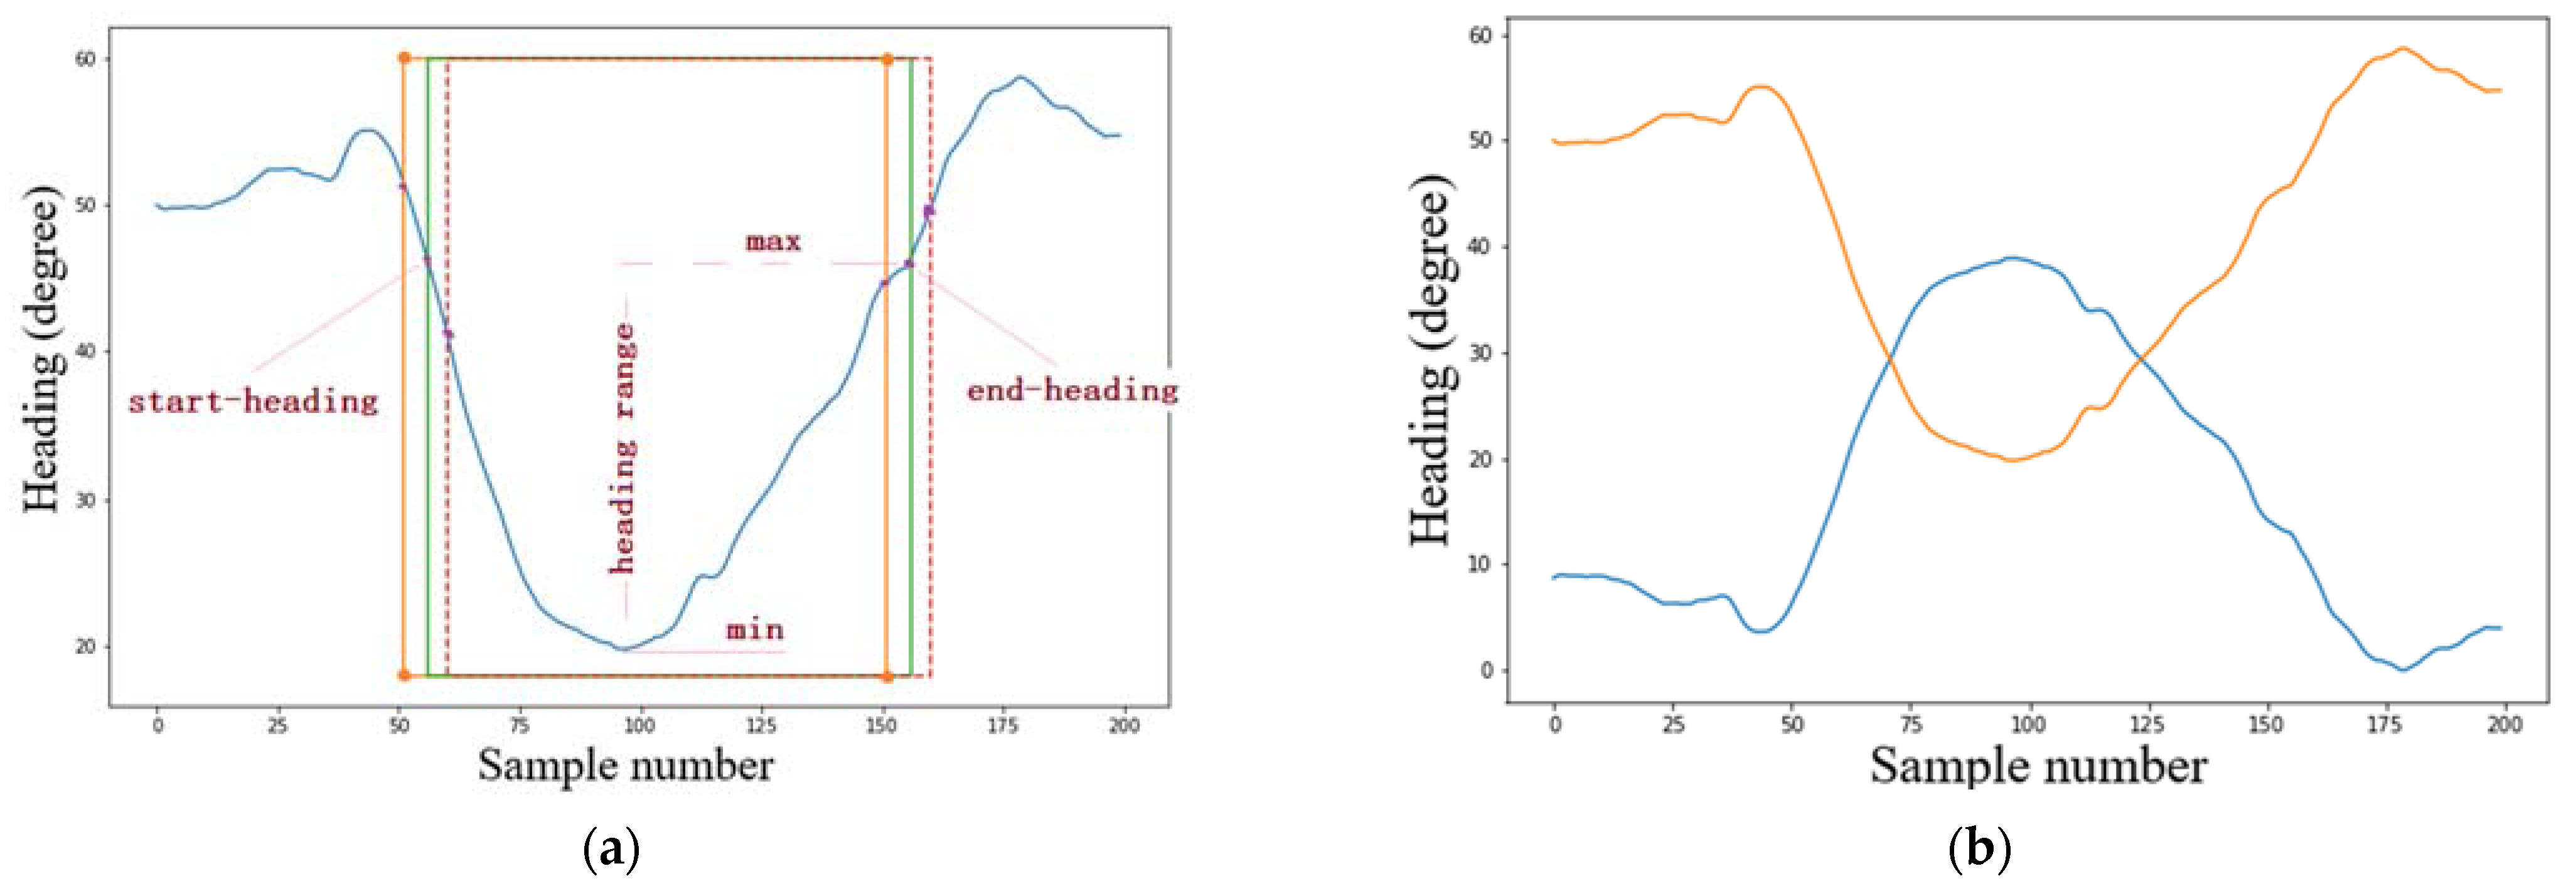
- We define and recognize two categories of human activities under the phone pose of holding, namely, steady-heading activities (including six sub-activities) and non-steady-heading activities (including two sub-activities) to assist the PDR in improving its accuracy and robustness (see Section 3.1). For steady-heading activities’ recognition, a novel hierarchical combination of a support vector machine (SVM) and decision tree (DT) is proposed and demonstrated to improve the recognition performance (see Section 3.2). Two types of non-steady-heading activities are defined and recognized by different methods in parallel and independently, as they have different characteristics. A novel autoencoder-based deep neural network (DNN) is proposed and demonstrated to recognize door opening (see Section 3.3). Meanwhile, a heading range (defined as the difference between the maximum heading and the minimum heading) based method is proposed to recognize (90/180-degree) turning (see Section 3.4).
- Apart from the proposed methods for activity recognition, two types of optimization are designed to improve the robustness and positioning accuracy of our PDR: parameter optimization and trajectory optimization. Steady-heading activities are used to optimize the parameters in the methods of step counting and step length estimation, respectively, to improve the robustness of PDR (see Section 4.1). Furthermore, a novel method of trajectory optimization is proposed to mitigate PDR error accumulation by utilizing non-steady-heading activities. Unlike conventional sequential PDR processing, we break our trajectory into small segments. Then, the trajectory is reconstructed after targeted optimization of the trace of each activity (see Section 4.2).
2. Related Work
2.1. Traditional PDR Technology
2.2. Human Activity Recognition Aided PDR Technologies
3. Human Activities Recognition
3.1. Target Human Activities
3.2. Steady-Heading Activities Recognition
3.3. Non-Steady-Heading Activity Recognition: Door Opening
3.4. Non-Steady-Heading Activities Recognition: Turning
4. Adaptive Human Activity-Aided Pedestrian Dead Reckoning
4.1. Parameter Optimization Based on Steady-Heading Activities
4.1.1. Step Counting
- (1)
- Three thresholds: In the peak detection method, there are three types of thresholds, as shown in Figure 13. The red points are peaks and the green points are valleys. The orange dashed curve is the magnitude of accelerometer readings. The first threshold is the peak threshold (shown by the horizontal line in Figure 13). A peak is detected if its value is above this threshold. The second threshold is the difference between the combined magnitude of acceleration peak and its adjacent valley, . When that difference is more than the threshold, a step is counted [66]. The third threshold is the time interval between two sequential steps, (shown by red points) according to the studies [67,68], when a pedestrians’ step frequency is less than 5 Hz (0.2 s per step). A step is counted only if the time interval is more than this threshold.
- (2)
- Threshold setting for each activity. The activities we focus on are normal walking, lateral walking, ascending stairs, and descending stairs. Since the amount of the change of accelerometer reading is different in each of these four activities, different thresholds are set for each different activity. To find the performance of different threshold sets of values, we collected step data from two young male nominally fit experimenters of differing heights and weights performing normal walking, lateral walking, descending stairs, and ascending stairs. In this experiment, two experimenters held their smartphones (two different phones, Nexus 5 and Google Pixel 2) to collect the steps for the targeted activities. The raw data were processed using a low-pass filter (order = 6, cut-off frequency = 5 Hz) before step counting. The parameters of this low-pass filter were set empirically based on our experimental data. The performance details of step detection are shown in Table 8, where peak, time, and diff are abbreviations for the peak threshold, time interval threshold, and difference threshold, respectively. After setting different thresholds for each activity, the mean step accuracy (the calculation equation refers to the equation (34) in the work of Poulose et al. [24]) achieves 99.25% (from Table 9). We can conclude that setting individual thresholds for different activity patterns gives a very good counting accuracy. Thus, once we recognized these activities, we set corresponding different thresholds for each of the different activities.
4.1.2. Step Length Estimation
- (1)
- Stationary: When a user is stationary, the step length is 0, i.e., .
- (2)
- Combined Walking: It includes normal walking, stationary stepping, and lateral walking. Normal walking and lateral walking have the same step length parameter, . For stationary stepping, there is no displacement even if it has similar accelerometer characteristics as normal walking; thus, .
- (3)
- Ascending or descending stairs: When a user ascends stairs or descends stairs, the step length usually equals the width of the stair. The stair width in the experimental environment is 30 cm. Thus, we set the step length to a constant value of 0.3 m, .
4.2. Trajectory Optimization Based on Non-Steady-Heading Activities
4.2.1. Door Opening
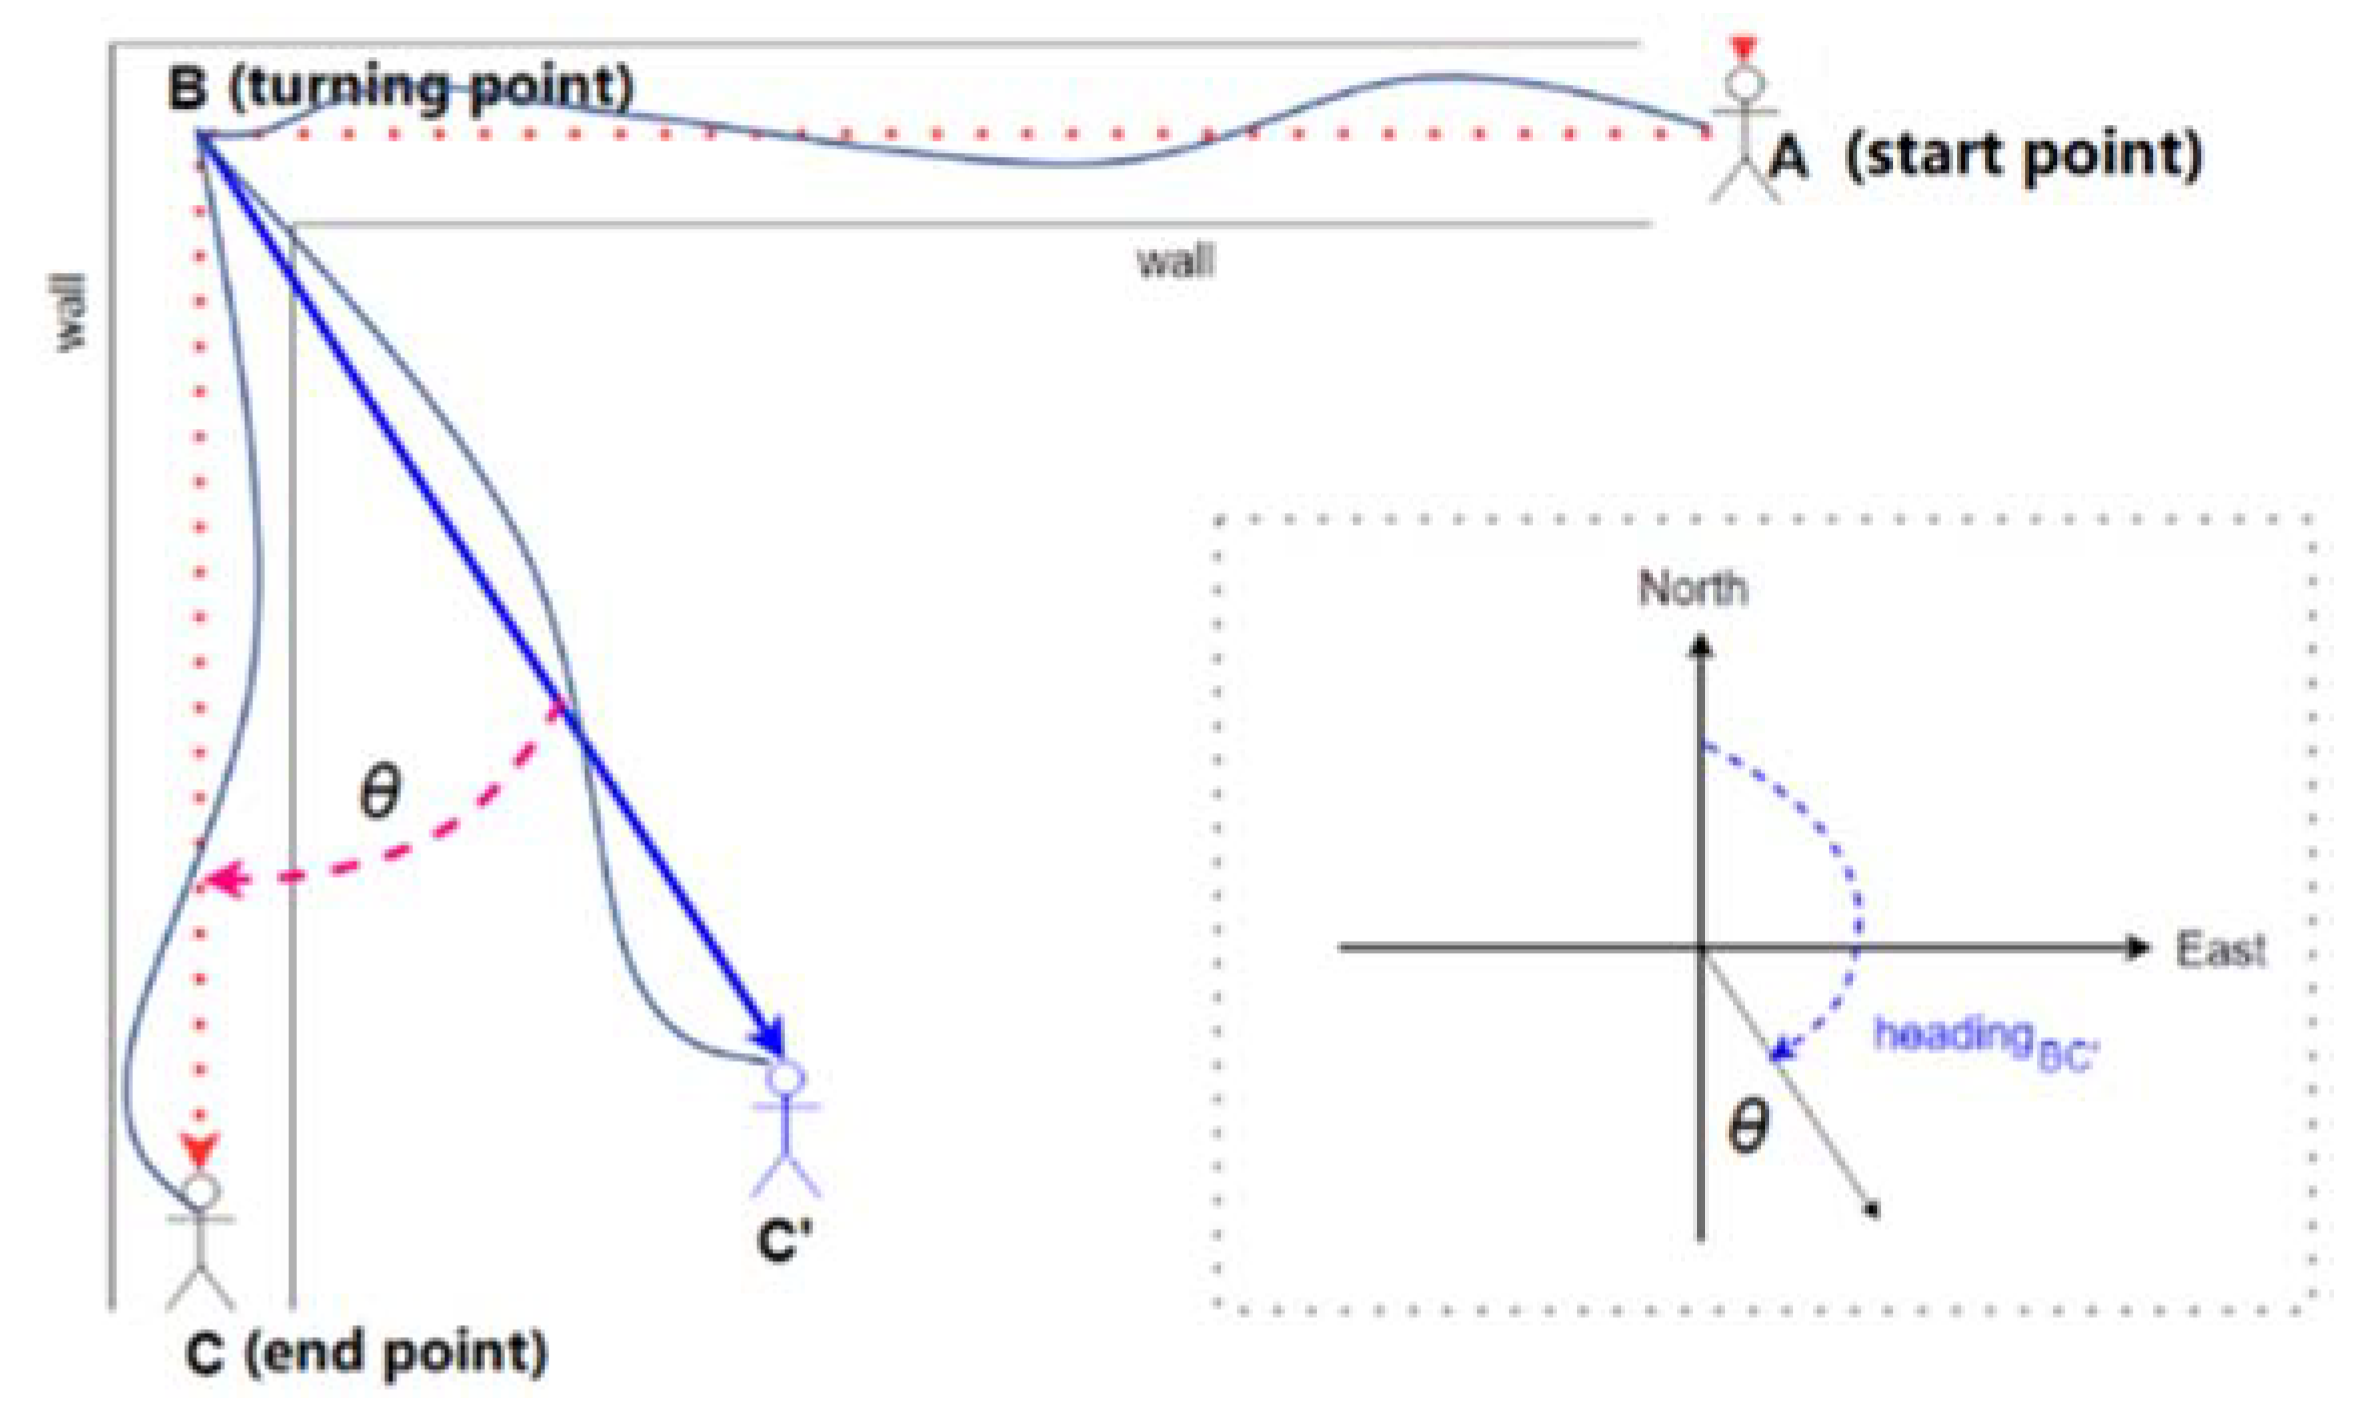
4.2.2. Turning
5. Positioning Experiment and Assessment
5.1. Experimental Methodology
5.2. System Performance Assessment
- (A)
- Abnormal walking recognition test
- (B)
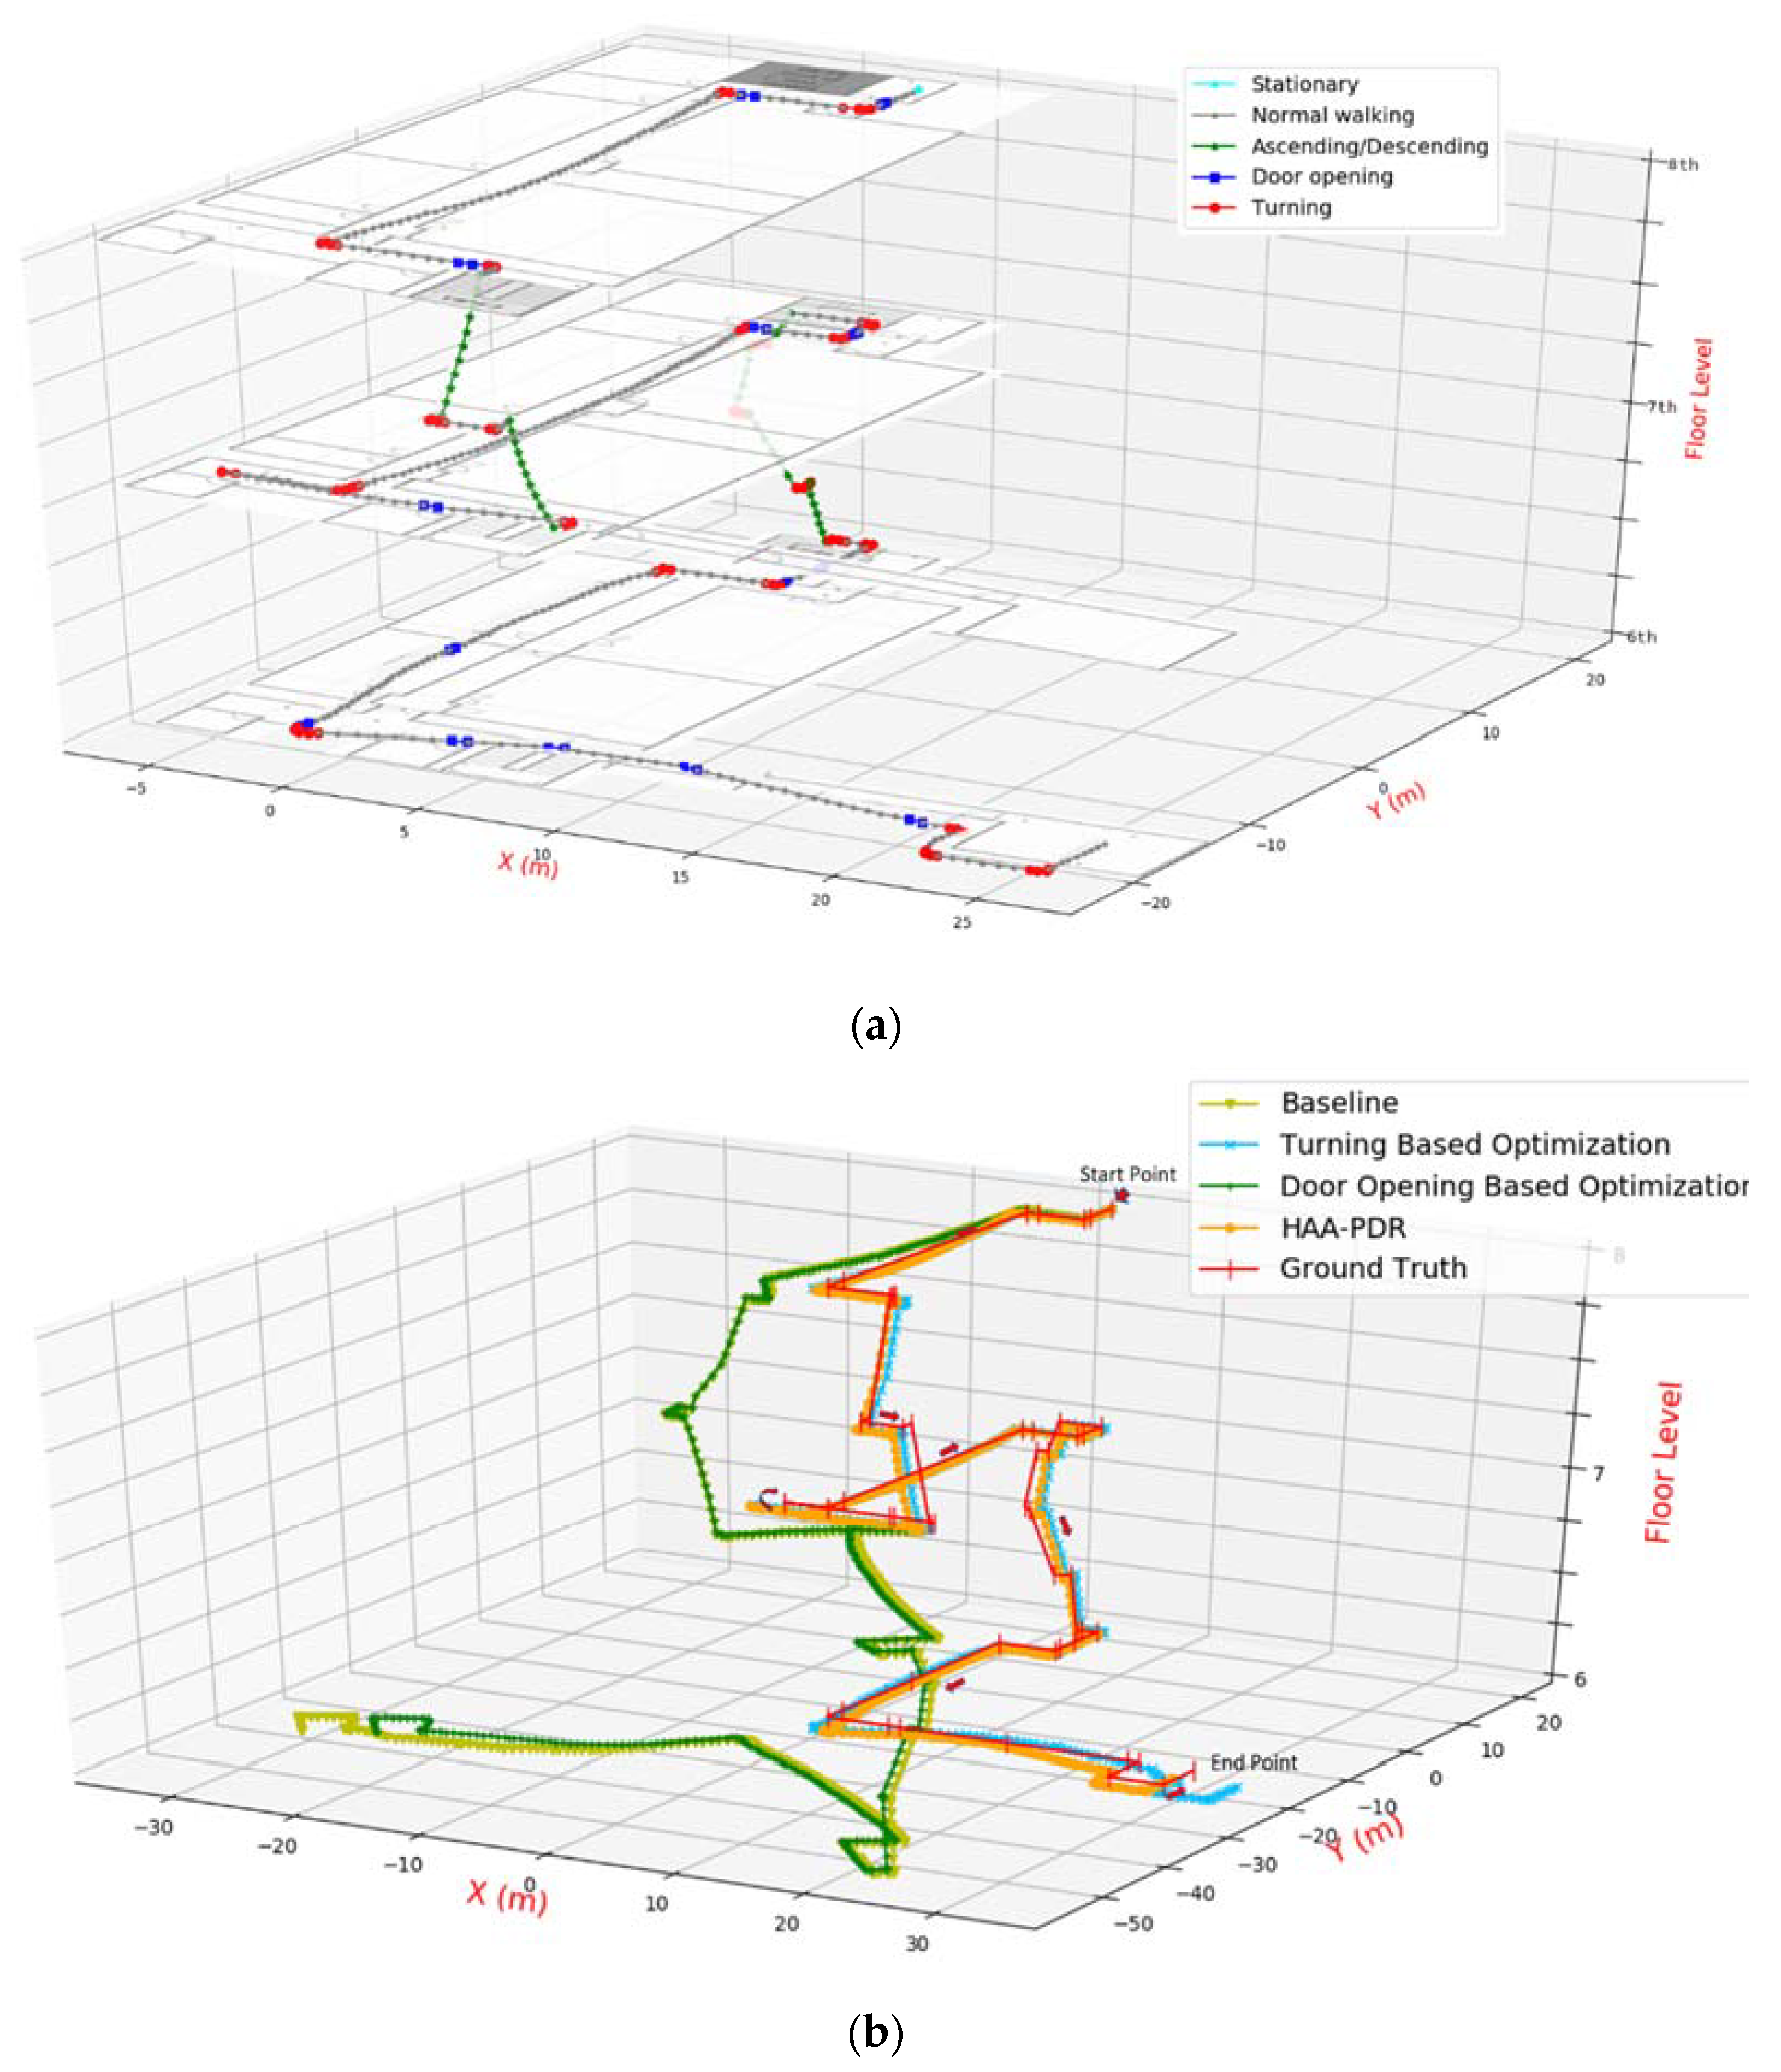
- Experiment over three floors along a designed route
6. Conclusions
Author Contributions
Funding
Institutional Review Board Statement
Informed Consent Statement
Data Availability Statement
Conflicts of Interest
References
- Zhang, W.; Yu, K.; Wang, W.; Li, X. A self-adaptive ap selection algorithm based on multi-objective optimization for indoor wifi positioning. IEEE Internet Things J. 2020, 8, 1406–1416. [Google Scholar] [CrossRef]
- Li, Z.; Liu, C.; Gao, J.; Li, X. An improved wifi/pdr integrated system using an adaptive and robust filter for indoor localization. ISPRS Int. J. Geo Inf. 2016, 5, 224. [Google Scholar] [CrossRef]
- Ma, C.; Wu, B.; Poslad, S.; Selviah, D.R. Wi-Fi RTT ranging performance characterization and positioning system design. IEEE Trans. Mob. Comput. 2020, 21, 8479–8490. [Google Scholar] [CrossRef]
- Ssekidde, P.; Steven Eyobu, O.; Han, D.S.; Oyana, T.J. Augmented CWT features for deep learning-based indoor localization using WiFi RSSI data. Appl. Sci. 2021, 11, 1806. [Google Scholar] [CrossRef]
- Poulose, A.; Han, D.S. Hybrid deep learning model based indoor positioning using Wi-Fi RSSI heat maps for autonomous applications. Electronics 2021, 10, 2. [Google Scholar] [CrossRef]
- Chen, P.; Kuang, Y.; Chen, X. A UWB/improved PDR integration algorithm applied to dynamic indoor positioning for pedestrians. Sensors 2017, 17, 2065. [Google Scholar] [CrossRef] [PubMed]
- Feng, D.; Wang, C.; He, C.; Zhuang, Y.; Xia, X.-G. Kalman-filter-based integration of IMU and UWB for high-accuracy indoor positioning and navigation. IEEE Internet Things J. 2020, 7, 3133–3146. [Google Scholar] [CrossRef]
- Poulose, A.; Han, D. UWB indoor localization using deep learning LSTM Networks. Appl. Sci. 2020, 10, 6290. [Google Scholar] [CrossRef]
- Li, X.; Wang, J.; Liu, C. A Bluetooth/PDR integration algorithm for an indoor positioning system. Sensors 2015, 15, 24862–24885. [Google Scholar] [CrossRef] [PubMed]
- Bai, L.; Ciravegna, F.; Bond, R.; Mulvenna, M. A low cost indoor positioning system using bluetooth low energy. IEEE Access 2020, 8, 136858–136871. [Google Scholar] [CrossRef]
- Potortì, F.; Park, S.; Crivello, A.; Palumbo, F.; Girolami, M.; Barsocchi, P.; Lee, S.; Torres-Sospedra, J.; Jimenez, A.R.; Pérez-Navarro, A. The IPIN 2019 indoor localisation competition-description and results. IEEE Access 2020, 8, 206674–206718. [Google Scholar] [CrossRef]
- Yousif, K.; Bab-Hadiashar, A.; Hoseinnezhad, R. An overview to visual odometry and visual SLAM: Applications to mobile robotics. Intell. Ind. Syst. 2015, 1, 289–311. [Google Scholar] [CrossRef]
- Poulose, A.; Han, D.S. Hybrid indoor localization using IMU sensors and smartphone camera. Sensors 2019, 19, 5084. [Google Scholar] [CrossRef] [PubMed]
- Plets, D.; Almadani, Y.; Bastiaens, S.; Ijaz, M.; Martens, L.; Joseph, W. Efficient 3D trilateration algorithm for visible light positioning. J. Opt. 2019, 21, 05LT01. [Google Scholar] [CrossRef]
- Lachhani, K.; Duan, J.; Baghsiahi, H.; Willman, E.; Selviah, D.R. Correspondence rejection by trilateration for 3D point cloud registration. In Proceedings of the 2015 14th IAPR International Conference on Machine Vision Applications (MVA), Tokyo, Japan, 18–22 May 2015; IEEE: New York, NY, USA, 2015; pp. 337–340. [Google Scholar]
- Lain, J.-K.; Chen, L.-C.; Lin, S.-C. Indoor localization using k-pairwise light emitting diode image-sensor-based visible light positioning. IEEE Photonics J. 2018, 10, 1–9. [Google Scholar] [CrossRef]
- Chen, Y.; Liu, J.; Jaakkola, A.; Hyyppä, J.; Chen, L.; Hyyppä, H.; Jian, T.; Chen, R. Knowledge-based indoor positioning based on LiDAR aided multiple sensors system for UGVs. In Proceedings of the 2014 IEEE/ION Position, Location and Navigation Symposium-PLANS 2014, Monterey, CA, USA, 5–8 May 2014; IEEE: New York, NY, USA, 2014; pp. 109–114. [Google Scholar]
- David, R.S.; Eero, W. Apparatus, Method and System for Alignment of 3D Datasets. U.S. Patent GB2559157A, 1 August 2018. [Google Scholar]
- Xu, Y.; Shmaliy, Y.S.; Li, Y.; Chen, X.; Guo, H. Indoor INS/LiDAR-based robot localization with improved robustness using cascaded fir filter. IEEE Access 2019, 7, 34189–34197. [Google Scholar] [CrossRef]
- Holm, S.; Nilsen, C.-I.C. Robust ultrasonic indoor positioning using transmitter arrays. In Proceedings of the 2010 International Conference on Indoor Positioning and Indoor Navigation, Zurich, Switzerland, 15–17 September 2010; IEEE: New York, NY, USA, 2010; pp. 1–5. [Google Scholar]
- Li, J.; Han, G.; Zhu, C.; Sun, G. An indoor ultrasonic positioning system based on TOA for internet of things. Mob. Inf. Syst. 2016, 2016, 1–10. [Google Scholar] [CrossRef]
- Ma, Z.; Poslad, S.; Hu, S.; Zhang, X. A fast path matching algorithm for indoor positioning systems using magnetic field measurements. In Proceedings of the 2017 IEEE 28th Annual International Symposium on Personal, Indoor, and Mobile Radio Communications (PIMRC), Montreal, QC, Canada, 8–13 October 2017; IEEE: New York, NY, USA, 2017; pp. 1–5. [Google Scholar]
- Xu, L.; Xiong, Z.; Liu, J.; Wang, Z.; Ding, Y. A novel pedestrian dead reckoning algorithm for multi-mode recognition based on smartphones. Remote Sens. 2019, 11, 294. [Google Scholar] [CrossRef]
- Poulose, A.; Eyobu, O.S.; Han, D.S. An indoor position-estimation algorithm using smartphone imu sensor data. IEEE Access 2019, 7, 11165–11177. [Google Scholar] [CrossRef]
- Ma, C.; Wan, C.; Chau, Y.W.; Kang, S.M.; Selviah, D.R. Subway station real-time indoor positioning system for cell phones. In Proceedings of the 2017 International Conference on Indoor Positioning and Indoor Navigation (IPIN), Sapporo, Japan, 18–21 September 2017; pp. 1–7. [Google Scholar] [CrossRef]
- Gebre-Egziabher, D.; Hayward, R.C.; Powell, J.D. A low-cost gps/inertial attitude heading reference system (ahrs) for general aviation applications. In Proceedings of the IEEE 1998 Position Location and Navigation Symposium (Cat. No. 98CH36153), Palm Springs, CA, USA, 20–23 April 1996; IEEE: New York, NY, USA, 1996; pp. 518–525. [Google Scholar]
- Poulose, A.; Senouci, B.; Han, D.S. Performance analysis of sensor fusion techniques for heading estimation using smartphone sensors. IEEE Sens. J. 2019, 19, 12369–12380. [Google Scholar] [CrossRef]
- Tian, Q.; Salcic, Z.; Kevin, I.; Wang, K.; Pan, Y. A multi-mode dead reckoning system for pedestrian tracking using smartphones. IEEE Sens. J. 2015, 16, 2079–2093. [Google Scholar] [CrossRef]
- Wang, B.; Liu, X.; Yu, B.; Jia, R.; Gan, X. Pedestrian dead reckoning based on motion mode recognition using a smartphone. Sensors 2018, 18, 1811. [Google Scholar] [CrossRef] [PubMed]
- Sheu, J.S.; Huang, G.S.; Jheng, W.C.; Hsiao, C.H. Design and implementation of a three-dimensional pedometer accumulating walking or jogging motions. In Proceedings of the 2014 International Symposium on Computer, Consumer and Control, Taichung, Taiwan, 10–12 June 2014; IEEE: New York, NY, USA, 2014; pp. 828–831. [Google Scholar]
- Jang, H.-J.; Kim, J.W.; Hwang, D.-H. Robust step detection method for pedestrian navigation systems. Electron. Lett. 2007, 43, 749–751. [Google Scholar] [CrossRef]
- Rai, A.; Chintalapudi, K.K.; Padmanabhan, V.N.; Sen, R. Zee: Zero-effort crowdsourcing for indoor localization. In Proceedings of the 18th Annual International Conference on Mobile Computing and Networking, Istanbul, Turkey, 22–26 August 2012; ACM: New York, NY, USA, 2012; pp. 293–304. [Google Scholar]
- Gu, F.; Khoshelham, K.; Shang, J.; Yu, F.; Wei, Z. Robust and accurate smartphone-based step counting for indoor localization. IEEE Sens. J. 2017, 17, 3453–3460. [Google Scholar] [CrossRef]
- Kim, J.W.; Jang, H.J.; Hwang, D.-H.; Park, C. A step, Stride and heading determination for the pedestrian navigation system. J. Glob. Position. Syst. 2004, 3, 273–279. [Google Scholar] [CrossRef]
- Weinberg, H. Using the ADXL202 in pedometer and personal navigation applications. Analog Devices 602 Appl. Note 2002, 2, 1–6. [Google Scholar]
- Ladetto, Q. On foot navigation: Continuous step calibration using both complementary recursive prediction and adaptive kalman filtering. In Proceedings of the ION GPS, Salt Lake City, UT, USA, 19–22 September 2000; Volume 2000, pp. 1735–1740. [Google Scholar]
- Fan, B.; Li, Q.; Liu, T. How magnetic disturbance influences the attitude and heading in magnetic and inertial sensor-based orientation estimation. Sensors 2018, 18, 76. [Google Scholar] [CrossRef]
- Madgwick, S.O.H.; Harrison, A.J.L.; Vaidyanathan, R. Estimation of IMU and MARG orientation using a gradient descent algorithm. In Proceedings of the 2011 IEEE International Conference on Rehabilitation Robotics, Zurich, Switzerland, 29 June 2011; IEEE: New York, NY, USA, 2011; pp. 1–7. [Google Scholar]
- Foxlin, E. Inertial head-tracker sensor fusion by a complementary separate-bias kalman filter. In Proceedings of the IEEE 1996 Virtual Reality Annual International Symposium, Santa Clara, CA, USA, 30 March–3 April 1996; IEEE: New York, NY, USA, 1996; pp. 185–194. [Google Scholar]
- Mahony, R.; Hamel, T.; Pflimlin, J.-M. Nonlinear complementary filters on the special orthogonal group. IEEE Trans. Autom. Control 2008, 53, 1203–1217. [Google Scholar] [CrossRef]
- Martinelli, A.; Gao, H.; Groves, P.D.; Morosi, S. Probabilistic context-aware step length estimation for pedestrian dead reckoning. IEEE Sens. J. 2017, 18, 1600–1611. [Google Scholar] [CrossRef]
- Elhoushi, M.; Georgy, J.; Noureldin, A.; Korenberg, M.J. Motion mode recognition for indoor pedestrian navigation using portable devices. IEEE Trans. Instrum. Meas. 2015, 65, 208–221. [Google Scholar] [CrossRef]
- Susi, M.; Renaudin, V.; Lachapelle, G. Motion mode recognition and step detection algorithms for mobile phone users. Sensors 2013, 13, 1539–1562. [Google Scholar] [CrossRef]
- Shin, B.; Kim, C.; Kim, J.; Lee, S.; Kee, C.; Kim, H.S.; Lee, T. Motion recognition-based 3D pedestrian navigation system using smartphone. IEEE Sens. J. 2016, 16, 6977–6989. [Google Scholar] [CrossRef]
- Elhoushi, M.; Georgy, J.; Wahdan, A.; Korenberg, M.; Noureldin, A. Using portable device sensors to recognize height changing modes of motion. In Proceedings of the 2014 IEEE International Instrumentation and Measurement Technology Conference (I2mtc) Proceedings, Montevideo, Uruguay, 11–14 May 2014; IEEE: New York, NY, USA, 2014; pp. 477–481. [Google Scholar]
- Gu, F.; Kealy, A.; Khoshelham, K.; Shang, J. User-independent motion state recognition using smartphone sensors. Sensors 2015, 15, 30636–30652. [Google Scholar] [CrossRef] [PubMed]
- Pei, L.; Liu, J.; Guinness, R.; Chen, Y.; Kuusniemi, H.; Chen, R. Using LS-SVM based motion recognition for smartphone indoor wireless positioning. Sensors 2012, 12, 6155–6175. [Google Scholar] [CrossRef]
- Zebin, T.; Scully, P.J.; Ozanyan, K.B. Human activity recognition with inertial sensors using a deep learning approach. In Proceedings of the 2016 IEEE SENSORS, Orlando, FL, USA, 30 October–3 November 2016; IEEE: New York, NY, USA, 2016; pp. 1–3. [Google Scholar] [CrossRef]
- Xia, K.; Huang, J.; Wang, H. LSTM-CNN architecture for human activity recognition. IEEE Access 2020, 8, 56855–56866. [Google Scholar] [CrossRef]
- Tufek, N.; Yalcin, M.; Altintas, M.; Kalaoglu, F.; Li, Y.; Bahadir, S.K. Human action recognition using deep learning methods on limited sensory data. IEEE Sens. J. 2020, 20, 3101–3112. [Google Scholar] [CrossRef]
- Yu, S.; Qin, L. Human activity recognition with smartphone inertial sensors using bidir-LSTM networks. In Proceedings of the 2018 3rd International Conference on Mechanical, Control and Computer Engineering (ICMCCE), Huhhot, China, 14–16 September 2018; IEEE: New York, NY, USA, 2018; pp. 219–224. [Google Scholar] [CrossRef]
- Rhea, C.K.; Wittstein, M.W. Characteristics of stride behavior during treadmill walking and stationary stepping. J. Appl. Biomech. 2014, 30, 534–541. [Google Scholar] [CrossRef]
- Wang, X.; Jiang, M.; Guo, Z.; Hu, N.; Sun, Z.; Liu, J. An indoor positioning method for smartphones using landmarks and PDR. Sensors 2016, 16, 2135. [Google Scholar] [CrossRef]
- Ghosh, A.; Riccardi, G. Recognizing human activities from smartphone sensor signals. In Proceedings of the 22nd ACM International Conference on Multimedia; MM ’14, Orlando, FL, USA, 3–7 November 2014; Association for Computing Machinery: Orlando, FL, USA, 2014; pp. 865–868. [Google Scholar] [CrossRef]
- He, W.; Guo, Y.; Gao, C.; Li, X. Recognition of human activities with wearable sensors. EURASIP J. Adv. Signal Process. 2012, 2012, 1–3. [Google Scholar] [CrossRef]
- Cornacchia, M.; Ozcan, K.; Zheng, Y.; Velipasalar, S. A survey on activity detection and classification using wearable sensors. IEEE Sens. J. 2016, 17, 386–403. [Google Scholar] [CrossRef]
- Scholkopf, B.; Sung, K.-K.; Burges, C.J.; Girosi, F.; Niyogi, P.; Poggio, T.; Vapnik, V. Comparing support vector machines with gaussian kernels to radial basis function classifiers. IEEE Trans. Signal Process. 1997, 45, 2758–2765. [Google Scholar] [CrossRef]
- Pan, S.J.; Yang, Q. A survey on transfer learning. IEEE Trans. Knowl. Data Eng. 2010, 22, 1345–1359. [Google Scholar] [CrossRef]
- Moreno-Torres, J.G.; Sáez, J.A.; Herrera, F. Study on the impact of partition-induced dataset shift on k-fold cross-validation. IEEE Trans. Neural Netw. Learn. Syst. 2012, 23, 1304–1312. [Google Scholar] [CrossRef]
- Ng, A. Sparse autoencoder. CS294A Lect. Notes 2011, 72, 1–19. [Google Scholar]
- Selviah, D.R.; Midwinter, J.E. Extension of the hamming neural network to a multilayer architecture for optical implementation. In Proceedings of the 1989 First IEE International Conference on Artificial Neural Networks, (Conf. Publ. No. 313), London, UK, 16–18 October 1989; IET: Stevenage, UK, 1989; pp. 280–283. [Google Scholar]
- Selviah, D.R.; Midwinter, J.E.; Rivers, A.W.; Lung, K.W. Correlating matched-filter model for analysis and optimisation of neural networks. In IEE Proceedings F (Radar and Signal Processing); IET: Stevenage, UK, 1989; Volume 136, pp. 143–148. [Google Scholar]
- Kingma, D.P.; Ba, J. Adam: A method for stochastic optimization. arXiv 2014, arXiv:14126980. [Google Scholar]
- Lu, Z.; He, R.; Li, J. Research on Online comment negative emotion warning based on machine learning from the perspective of big data. DEStech Trans. Comput. Sci. Eng. 2019. [Google Scholar] [CrossRef]
- Zhou, B.; Li, Q.; Mao, Q.; Tu, W.; Zhang, X.; Chen, L. ALIMC: Activity landmark-based indoor mapping via crowdsourcing. IEEE Trans. Intell. Transp. Syst. 2015, 16, 2774–2785. [Google Scholar] [CrossRef]
- Fang, L.; Antsaklis, P.J.; Montestruque, L.A.; McMickell, M.B.; Lemmon, M.; Sun, Y.; Fang, H.; Koutroulis, I.; Haenggi, M.; Xie, M. Design of a wireless assisted pedestrian dead reckoning system-the navmote experience. IEEE Trans. Instrum. Meas. 2005, 54, 2342–2358. [Google Scholar] [CrossRef]
- Zhang, M.; Shen, W.; Yao, Z.; Zhu, J. Multiple information fusion indoor location algorithm based on wifi and improved PDR. In Proceedings of the 2016 35th Chinese Control Conference (CCC), Chengdu, China, 27–29 July 2016; IEEE: New York, NY, USA, 2016; pp. 5086–5092. [Google Scholar]
- Oubre, B.; Daneault, J.-F.; Boyer, K.; Kim, J.H.; Jasim, M.; Bonato, P.; Lee, S.I. A simple low-cost wearable sensor for long-term ambulatory monitoring of knee joint kinematics. IEEE Trans. Biomed. Eng. 2020, 3483–3490. [Google Scholar] [CrossRef] [PubMed]


| Paper | Human Activities | Phone Poses | HAR Methods |
|---|---|---|---|
| [41] | 6: stationary, walking, walking sideways, ascending and descending stairs, and running | 1: waist-belt | relevance vector machine (RVM) |
| [28] | 3: walking (at slow, moderate, and fast speed) | 3: holding, pocket, swinging | finite state machine (FSM) |
| [42,45] | 6: walking, stationary, ascending and descending stairs, standing/walking on an escalator/moving walkway | 11: holding, backpack, purse, belt holder, chest/arm strapped, hand still by side, dangling, on ear, pocket, wrist, head mount. | Decision Tree (DT) |
| [46] | 7: stationary, walking, running, ascending and descending stairs down elevator, up elevator | 3: pocket, swinging, holding | DT, KNN, SVM, Naive Bayes (NB), linear discriminant analysis (LDA), and least-squares support vector machine (LS-SVM). |
| [43] | 3: stationary, walking, looking for the mobile phone in a bag | 4: swinging, texting, calling, bag | DT |
| [44] | 3: standing, walking, running | 3: swinging, pocket, calling | artificial neural network (ANN) |
| [47] | 7: stationary, standing, normal/fast walking, U-turning, ascending and descending stairs. | 2: swinging, holding | LS-SVM, Bayesian Network using the Gaussian Mixture Model (BN-GMM), DT, LDA, quadratic discriminant analysis (QDA) |
| [23] | 1: walking | 2: holding, swinging | ANN |
| [29] | 4: walking, running, ascending and descending stairs | 4: holding, calling, swinging, and pocket | SVM, DT, MLP, KNN |
| Classifiers | 5-Fold Cross Validation | Mean | Standard Deviation |
|---|---|---|---|
| SVM | 88.79%, 88.79%, 87.93%, 90.09%, 87.93% | 88.71% | 0.007 |
| Random Forest | 78.02%, 85.34%, 80.60%, 78.88%, 78.45% | 80.26% | 0.026 |
| KNN | 82.76%, 82.33%, 82.33%, 81.90%, 81.90% | 82.24% | 0.003 |
| Predicted Activities | |||||||
|---|---|---|---|---|---|---|---|
| O1 | O2 | O3 | O4 | O5 | O6 | ||
| True activities | O1 | 100% | 0% | 0% | 0% | 0% | 0% |
| O2 | 0% | 91.67% | 0% | 8.33% | 0% | 0% | |
| O3 | 0% | 0% | 100% | 0% | 0% | 0% | |
| O4 | 4.35% | 0% | 0% | 82.61% | 13.04% | 0% | |
| O5 | 0% | 0% | 0% | 26.19% | 71.43% | 2.38% | |
| O6 | 0% | 0% | 0% | 15.38% | 5.13% | 79.49% | |
| Classifiers | 5-Fold Cross Validation | Mean | Standard Deviation |
|---|---|---|---|
| SVM | 98.30%, 98.30%, 98.30%, 98.42%, 98.72% | 98.41% | 0.002 |
| Random Forest | 94.89%, 97.45%, 97.87%, 95.32%, 97.87% | 96.68% | 0.013 |
| KNN | 97.02%, 96.60%, 95.32%, 97.02%, 97.45% | 96.68% | 0.007 |
| Predicted Activities | |||||
|---|---|---|---|---|---|
| O1 | O2 | O3 | Ns | ||
| True activities | O1 | 97.96% | 0% | 0% | 2.04% |
| O2 | 0% | 95.65% | 0% | 4.35% | |
| O3 | 0% | 0% | 100% | 0% | |
| Ns | 0% | 0% | 0% | 100% | |
| Classifiers | 5-Fold Cross Validation | Mean | Standard Deviation |
|---|---|---|---|
| DT | 99.07%, 99.07%, 1.0, 1.0, 99.07% | 99.44% | 0.005 |
| Random Forest | 99.07%, 99.07%, 1.0, 99.07%, 99.07% | 99.25% | 0.004 |
| KNN | 97.33%, 99.07%, 99.07%, 96.32%, 97.19% | 97.79% | 0.011 |
| Metrics | Accuracy | Recall | Precision | F1_Score |
|---|---|---|---|---|
| Value | 99.86% | 99.84% | 99.86% | 99.85% |
| Activities | Thresholds (Peak; Time; Diff) | Real steps | Predicted steps | Accuracy (%) |
|---|---|---|---|---|
| Normal walking | 11; 0.2; 1.5 | 425 | 427 | 99.53 |
| Lateral walking | 10.58; 0.2; 2 | 400 | 406 | 98.5 |
| Ascending stairs | 11.4; 0.2; 1.5 | 198 | 199 | 99.49 |
| Descending stairs | 11.4; 0.2; 1.5 | 198 | 197 | 99.49 |
| Strategies | Mean (m) | Standard Deviation (m) | Error at Final Position (m) | CDF (m) | |
|---|---|---|---|---|---|
| 95% | 85% | ||||
| Baseline | 37.73 | 29.46 | 63.72 | 76.05 | 72.21 |
| Door-Opening-Based Optimization | 36.82 | 28.95 | 58.39 | 75.25 | 71.39 |
| Turning-Based Optimization | 1.92 | 1.49 | 5.27 | 5.27 | 3.00 |
| HAA-PDR | 1.79 | 1.13 | 2.68 | 3.72 | 2.98 |
Publisher’s Note: MDPI stays neutral with regard to jurisdictional claims in published maps and institutional affiliations. |
© 2021 by the authors. Licensee MDPI, Basel, Switzerland. This article is an open access article distributed under the terms and conditions of the Creative Commons Attribution (CC BY) license (https://creativecommons.org/licenses/by/4.0/).
Share and Cite
Wu, B.; Ma, C.; Poslad, S.; Selviah, D.R. An Adaptive Human Activity-Aided Hand-Held Smartphone-Based Pedestrian Dead Reckoning Positioning System. Remote Sens. 2021, 13, 2137. https://doi.org/10.3390/rs13112137
Wu B, Ma C, Poslad S, Selviah DR. An Adaptive Human Activity-Aided Hand-Held Smartphone-Based Pedestrian Dead Reckoning Positioning System. Remote Sensing. 2021; 13(11):2137. https://doi.org/10.3390/rs13112137
Chicago/Turabian StyleWu, Bang, Chengqi Ma, Stefan Poslad, and David R. Selviah. 2021. "An Adaptive Human Activity-Aided Hand-Held Smartphone-Based Pedestrian Dead Reckoning Positioning System" Remote Sensing 13, no. 11: 2137. https://doi.org/10.3390/rs13112137
APA StyleWu, B., Ma, C., Poslad, S., & Selviah, D. R. (2021). An Adaptive Human Activity-Aided Hand-Held Smartphone-Based Pedestrian Dead Reckoning Positioning System. Remote Sensing, 13(11), 2137. https://doi.org/10.3390/rs13112137