A Through-the-Wall Imaging Approach Based on a TSVD/Variable-Exponent Lebesgue-Space Method
Abstract
1. Introduction
2. TWI Approach
- 1.
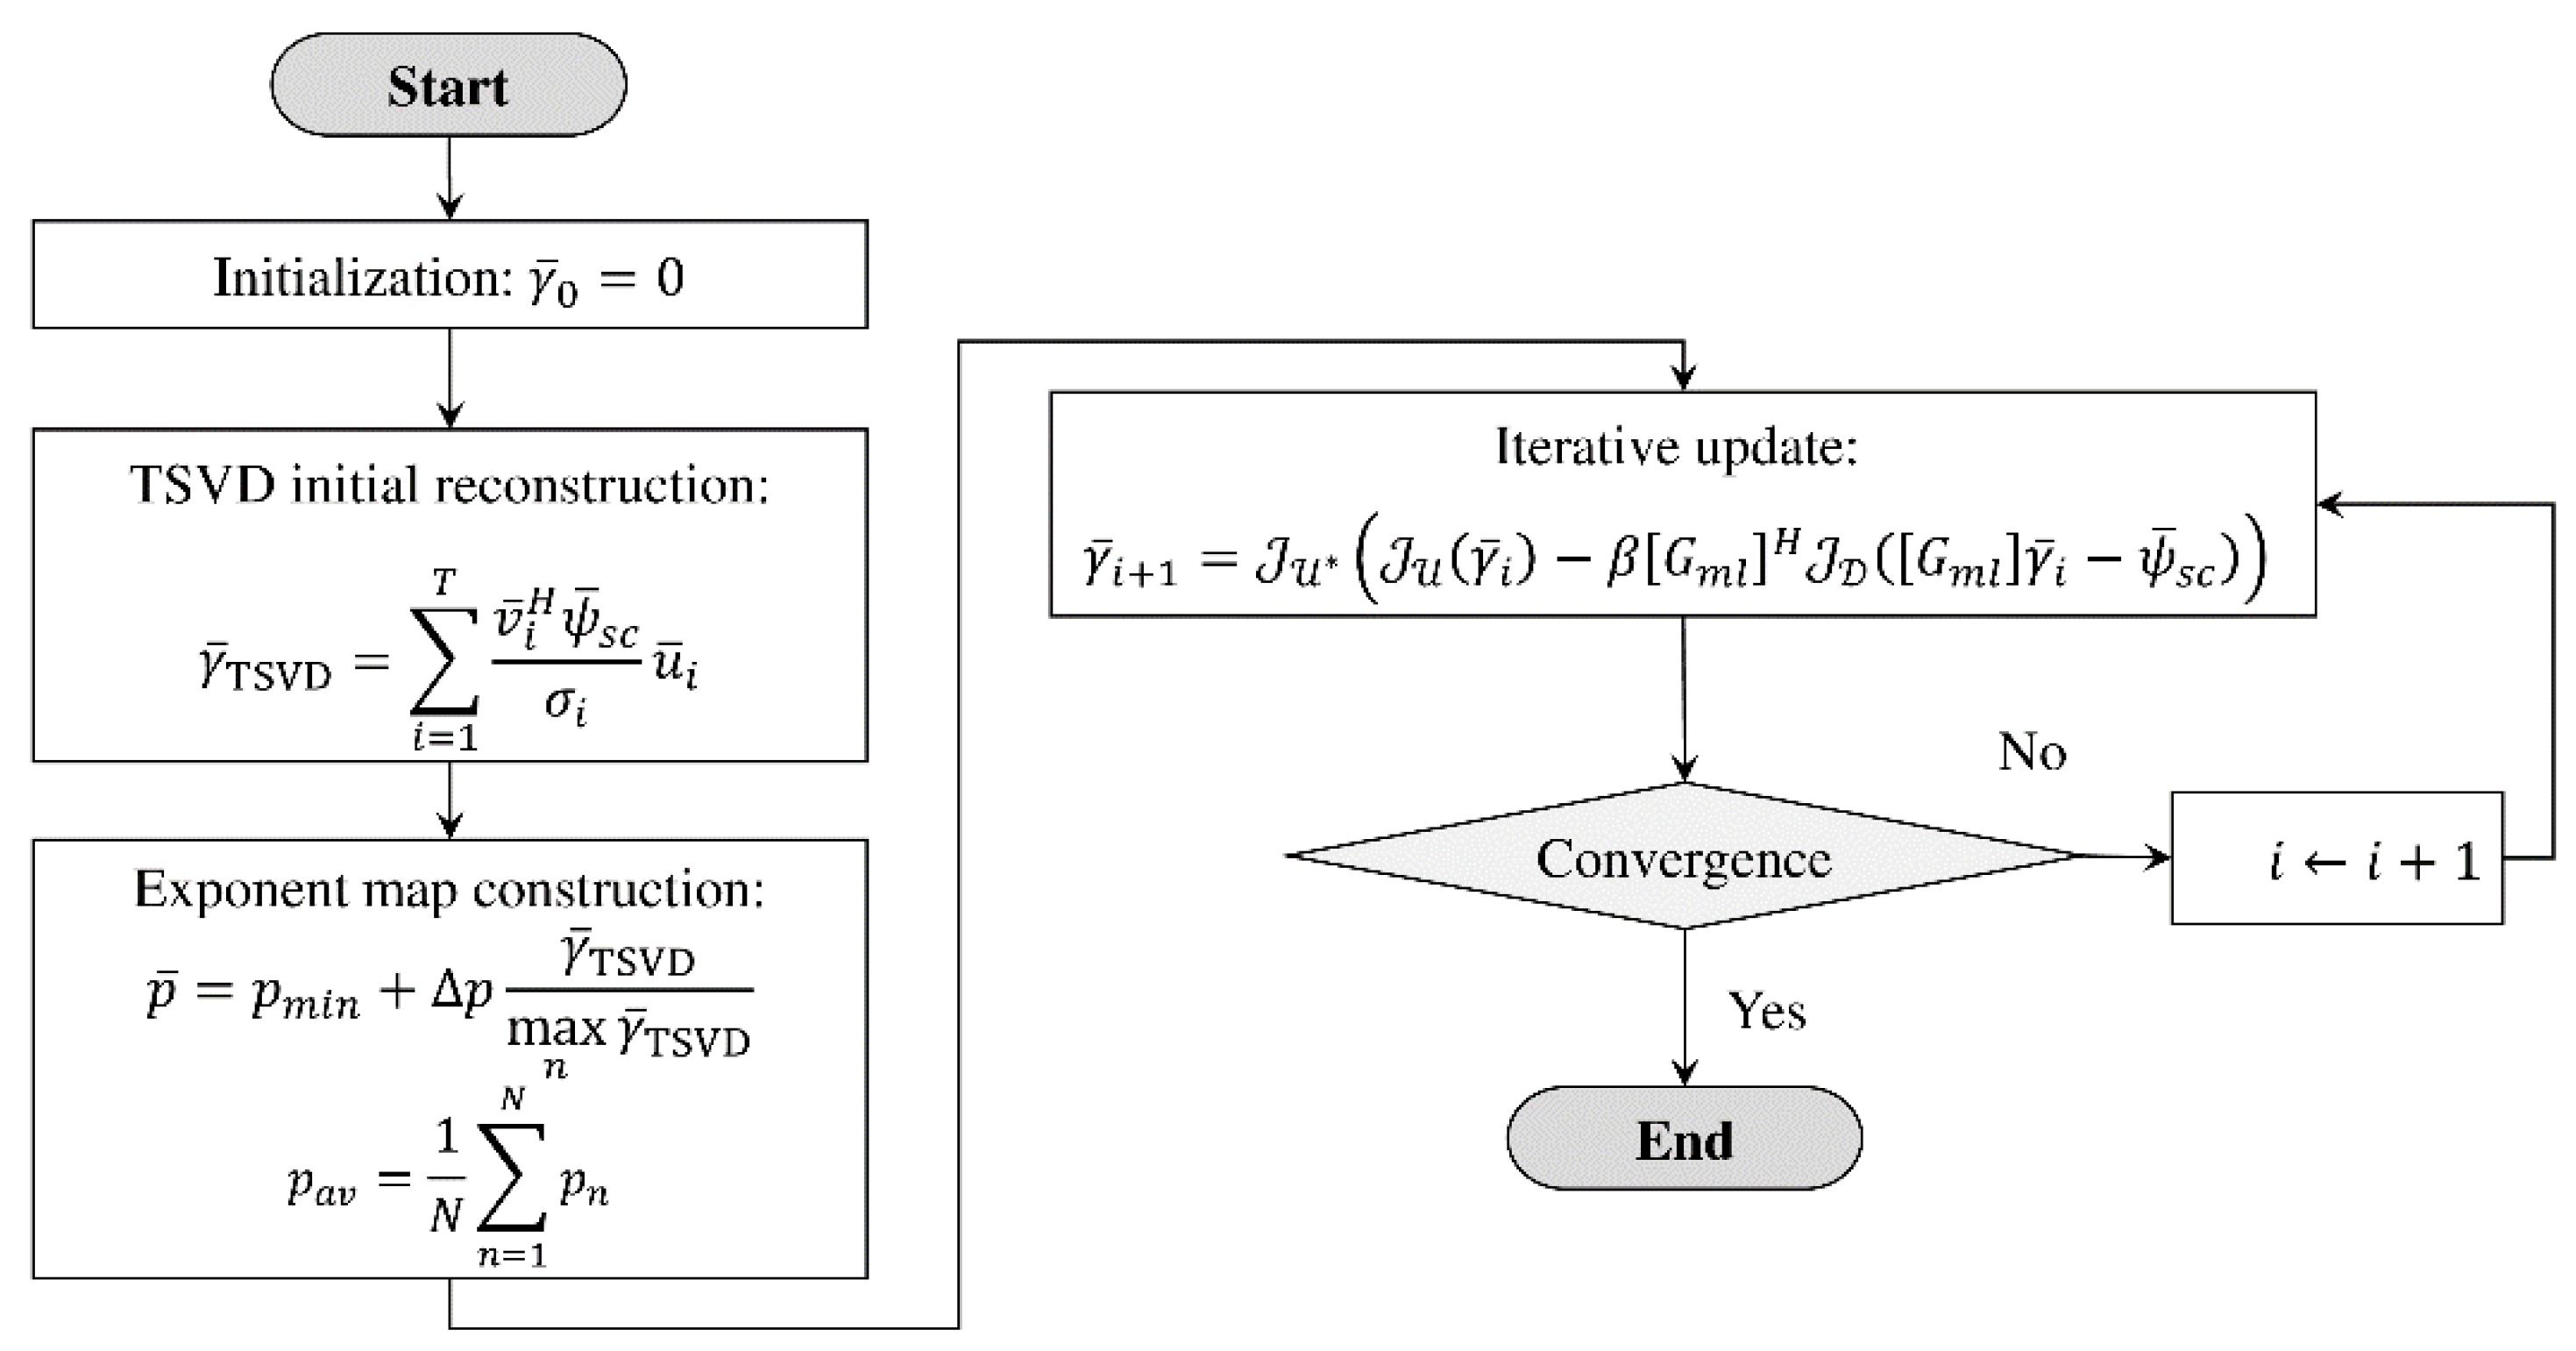
- Initialization. The solution is initialized with a null vector, i.e., and the iteration index is set to ;
- 2.
- TSVD initial reconstruction. An initial preliminary reconstruction is obtained by means of a truncated singular value decomposition asin which are the singular values of the matrix , and are the corresponding (left and right) singular vectors, and is a suitable truncation index;
- 3.
- Exponent map construction. Using the initial TSVD reconstruction, the unknown-space exponent function (in discrete form) is computed aswhere and are the prefixed minimum value and the range of the elements of , respectively. Moreover, the data-space exponent is set equal to the average of according to (6);
- 4.
- Iterative update. The solution is iteratively updated as [47,48,52]:where is the dual space of , with the Hölder conjugate of , is the Hermitian transpose of , and is a relaxation coefficient that is empirically computed asIn (9), and are the duality maps of the spaces and , respectively, which are defined aswhere if and zero otherwise;
- 5.
- Step 4 is iterated, with , until a stopping criterion is fulfilled or a maximum number of iterations is reached.
3. Experimental Results
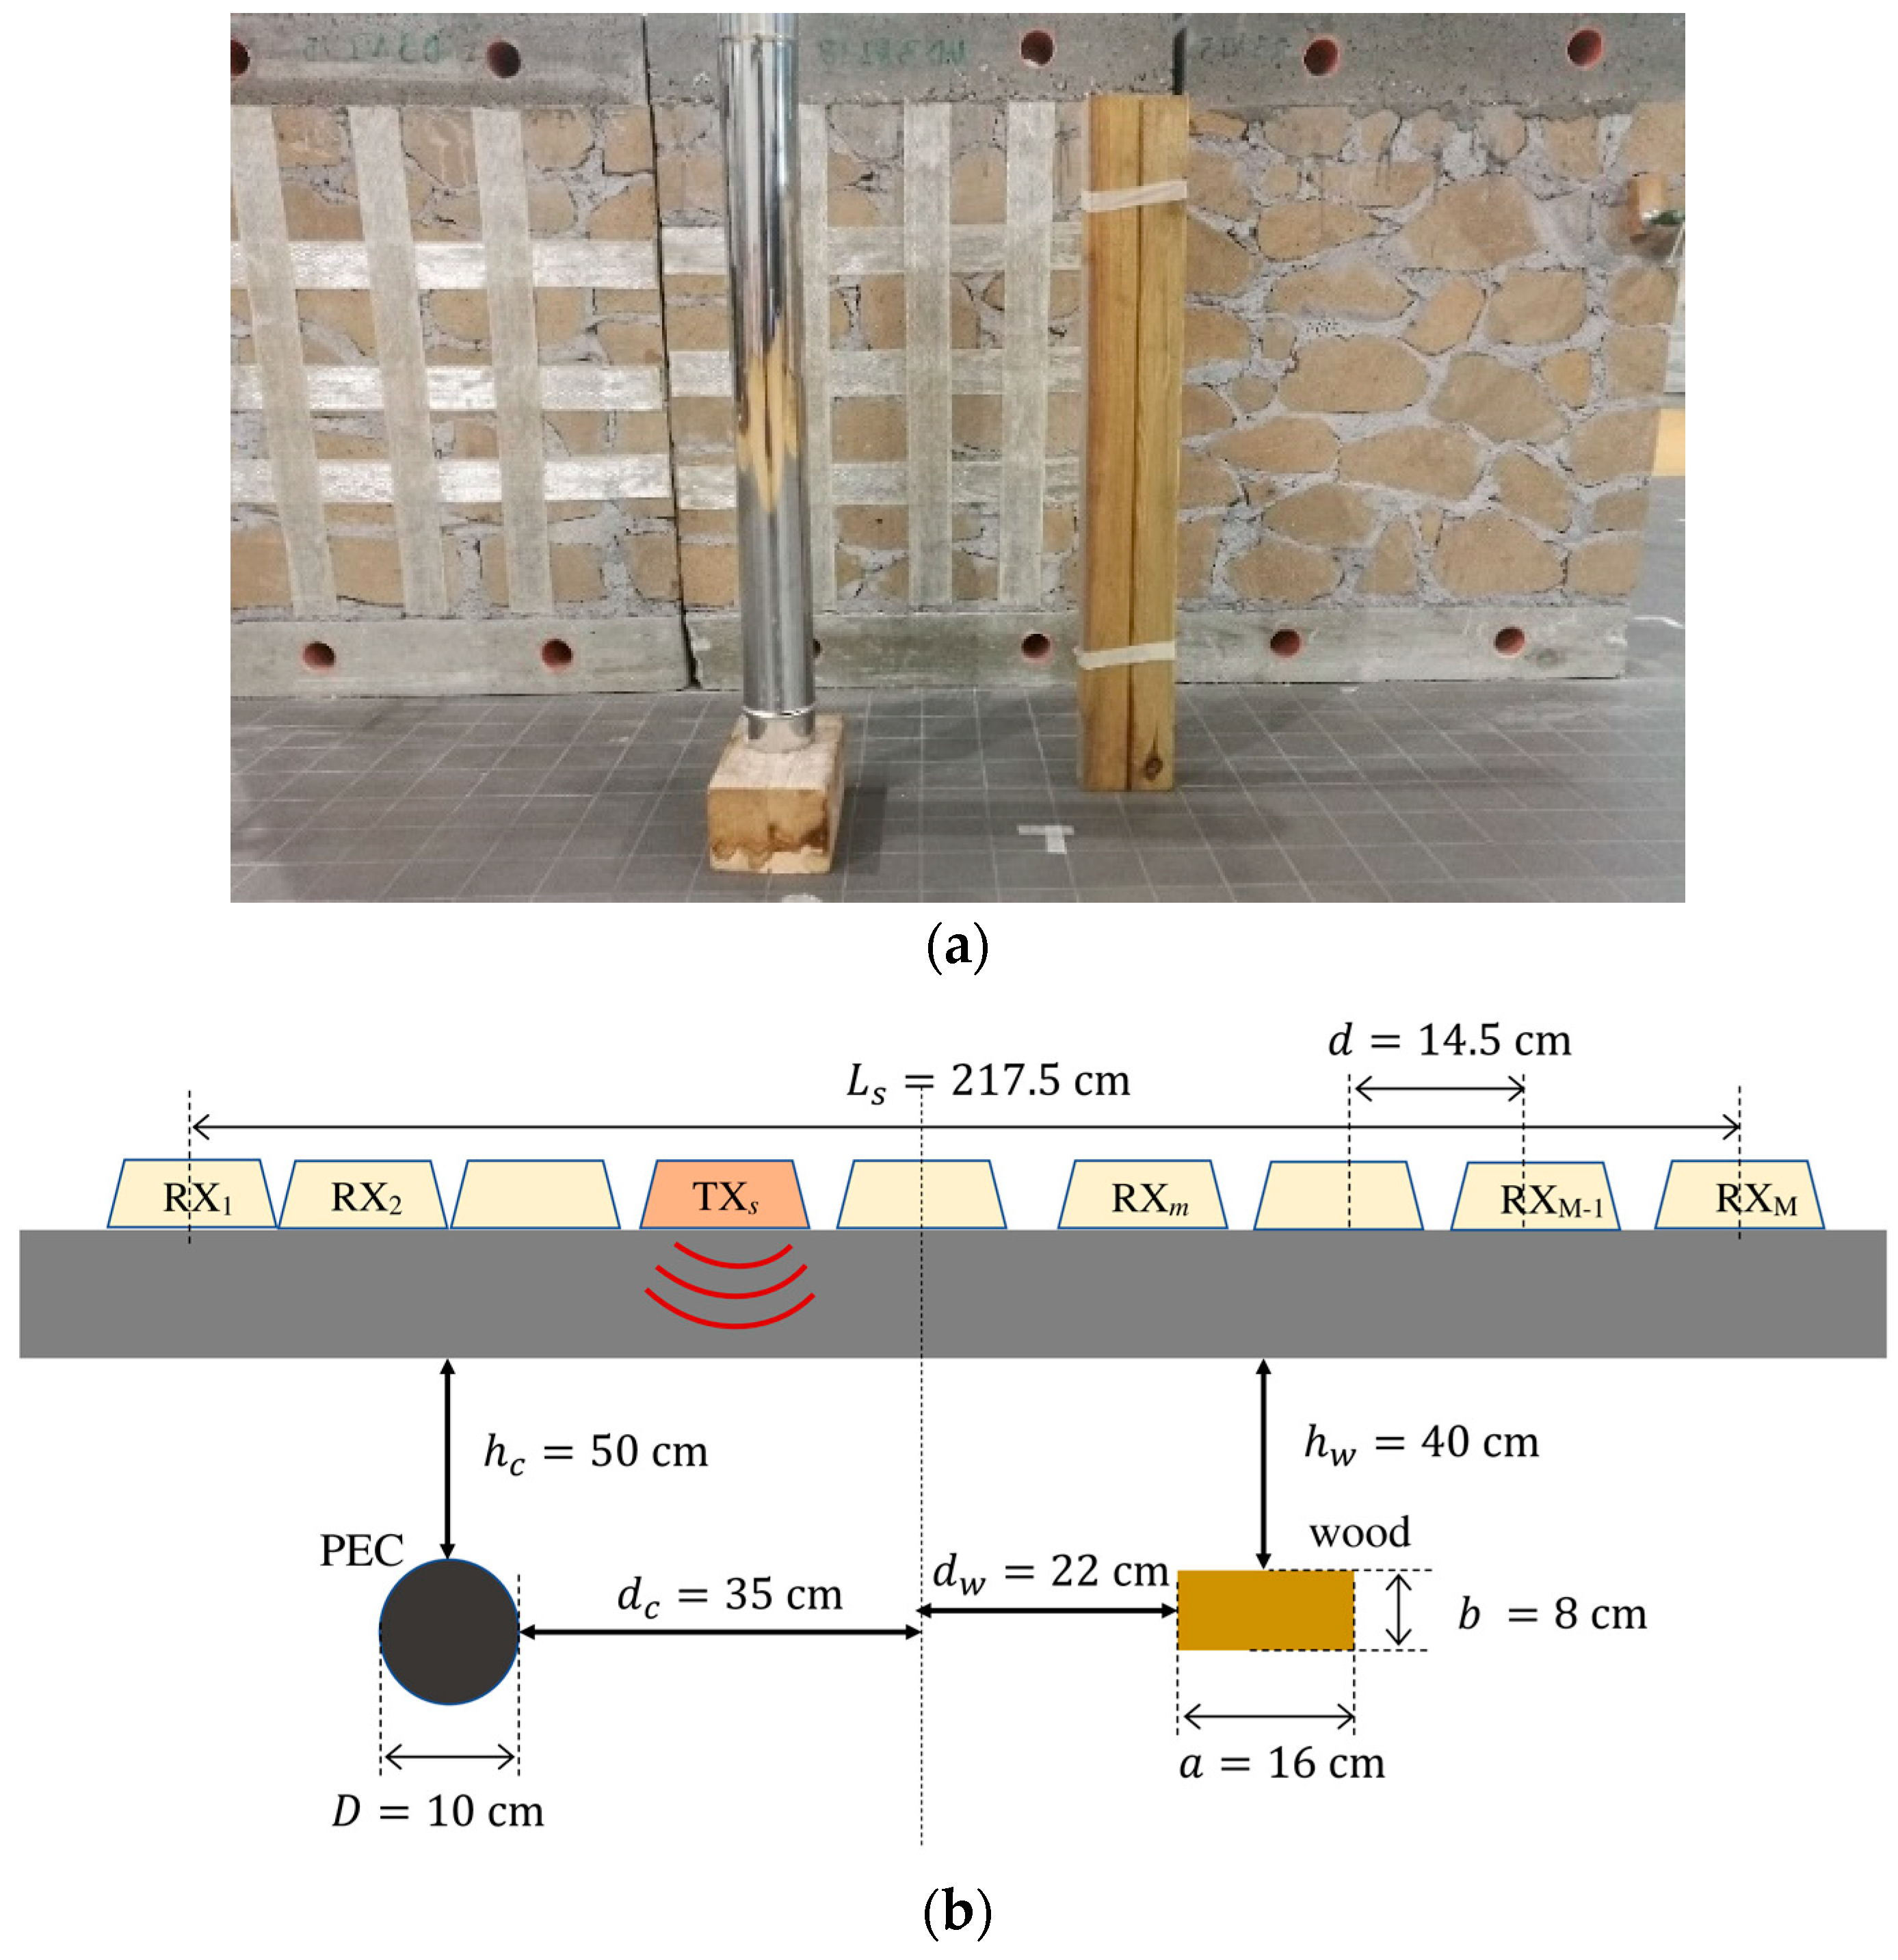
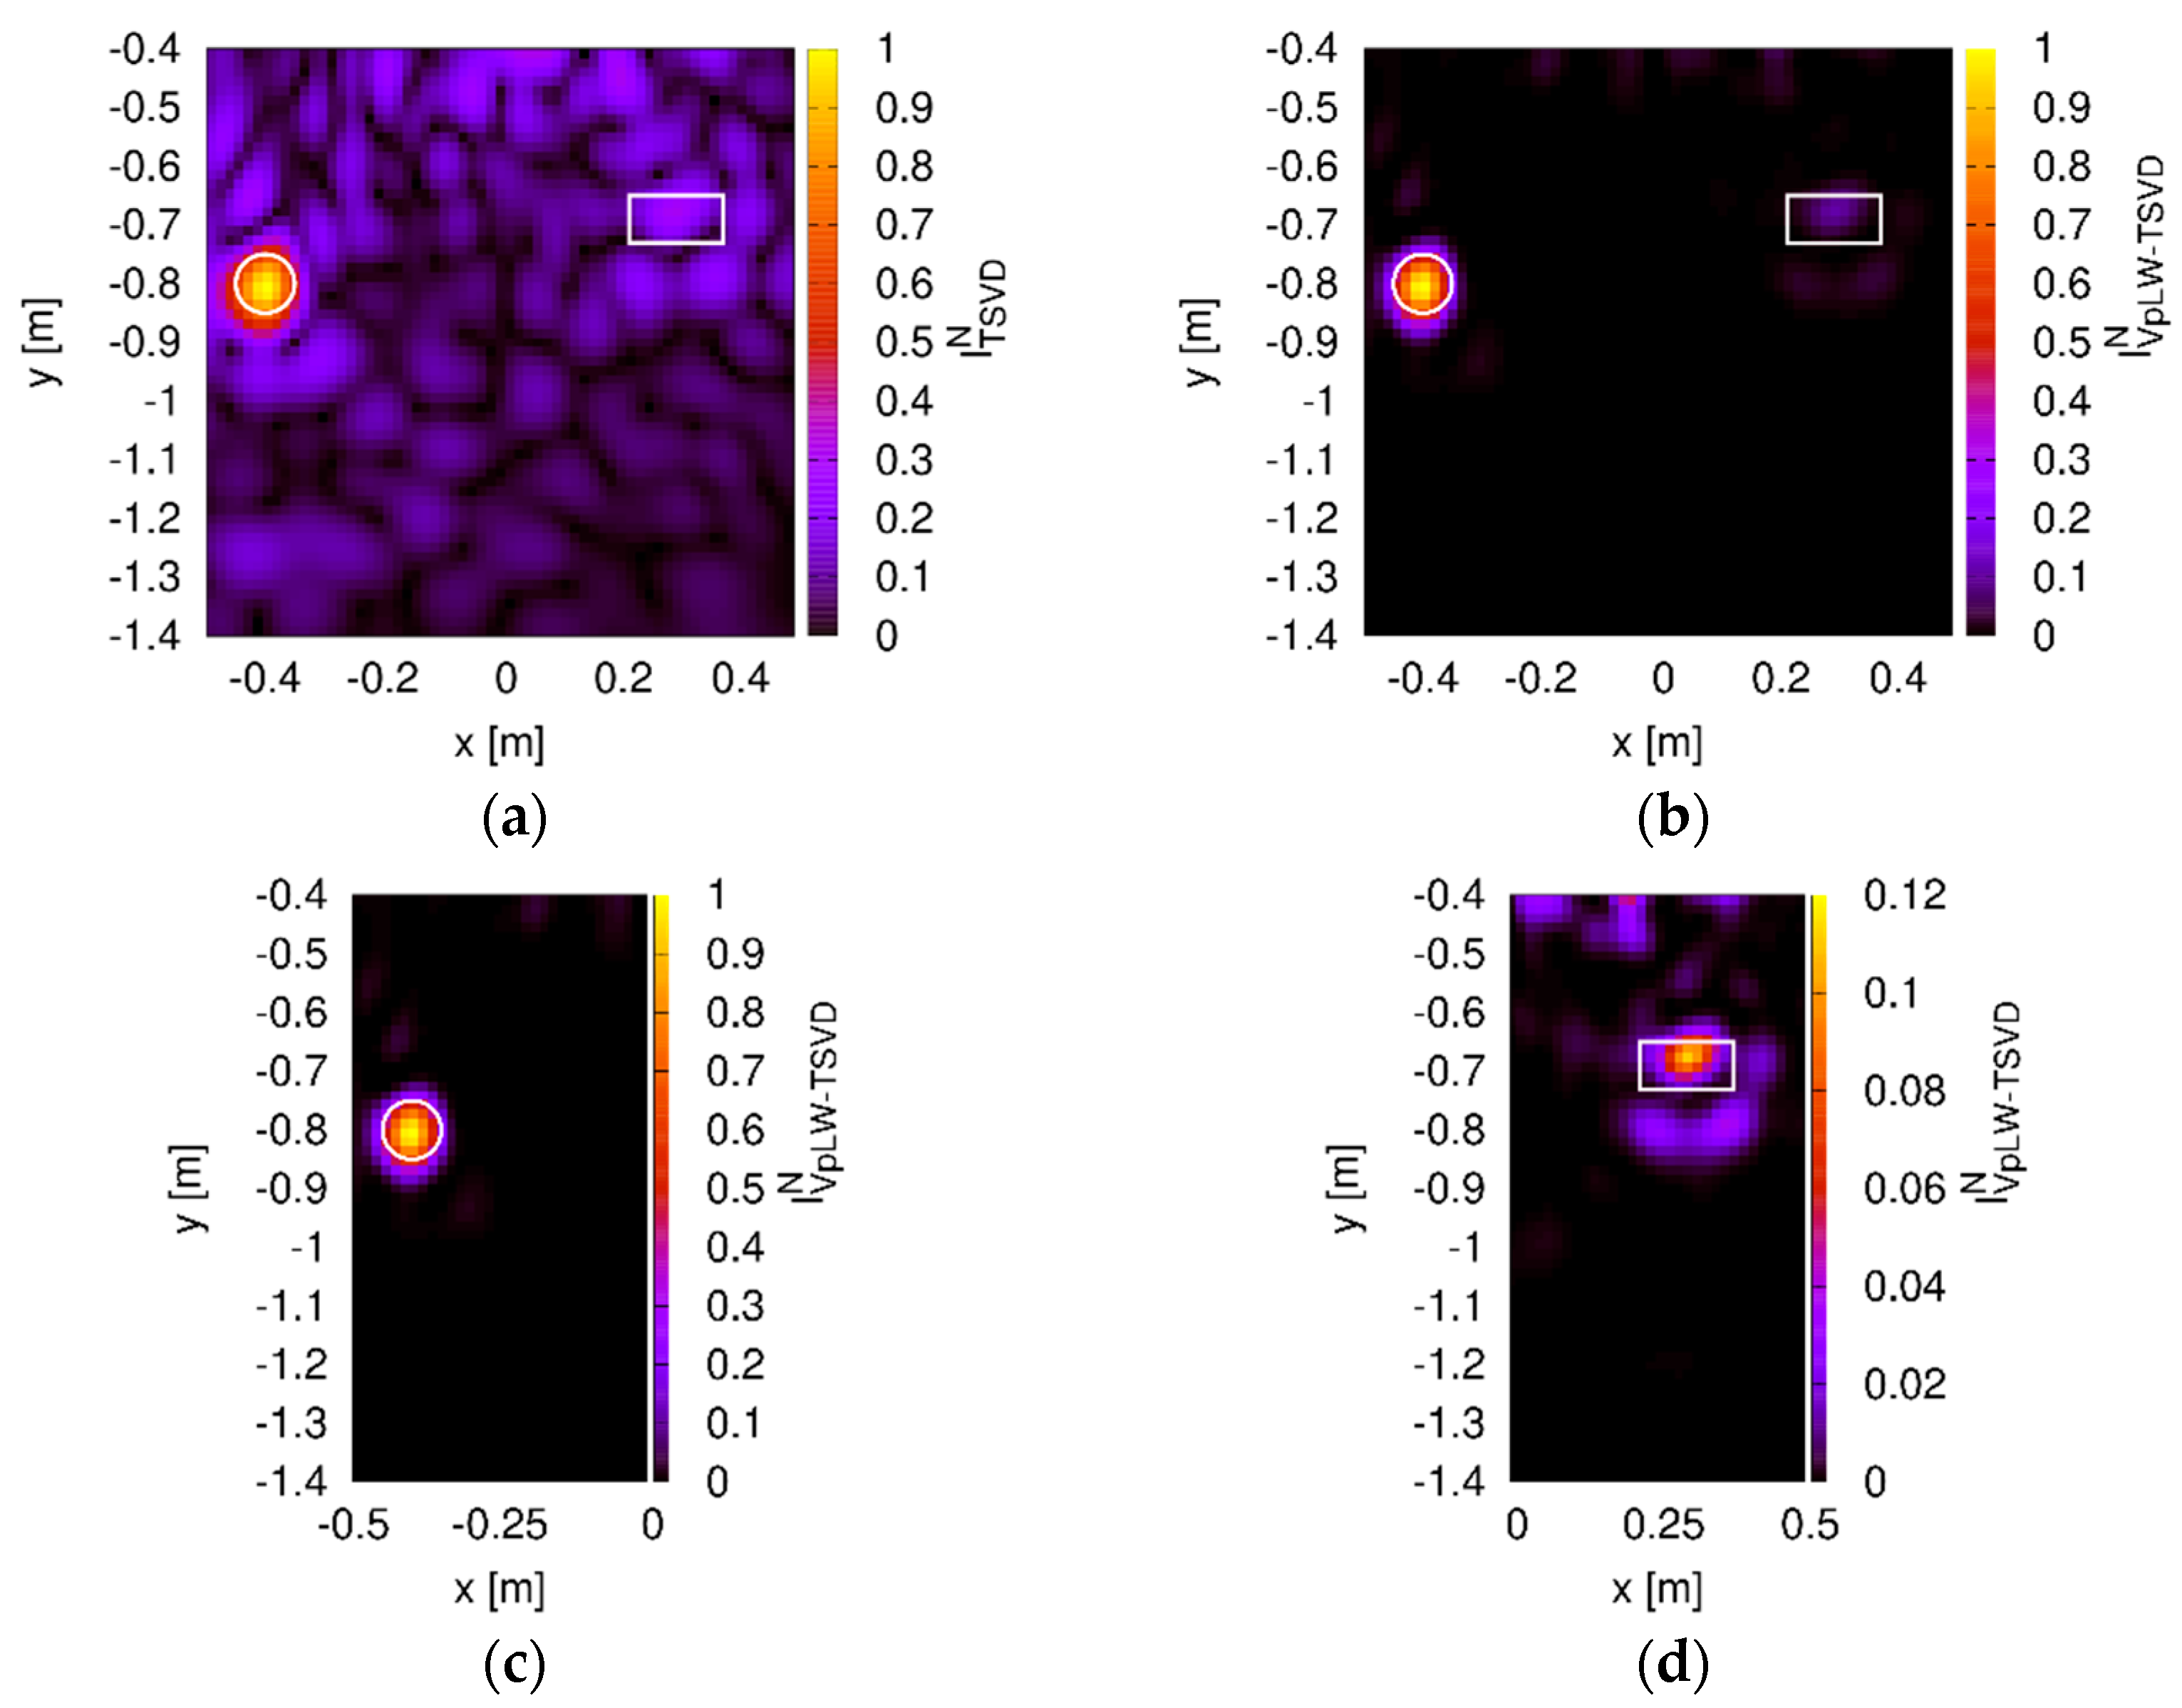
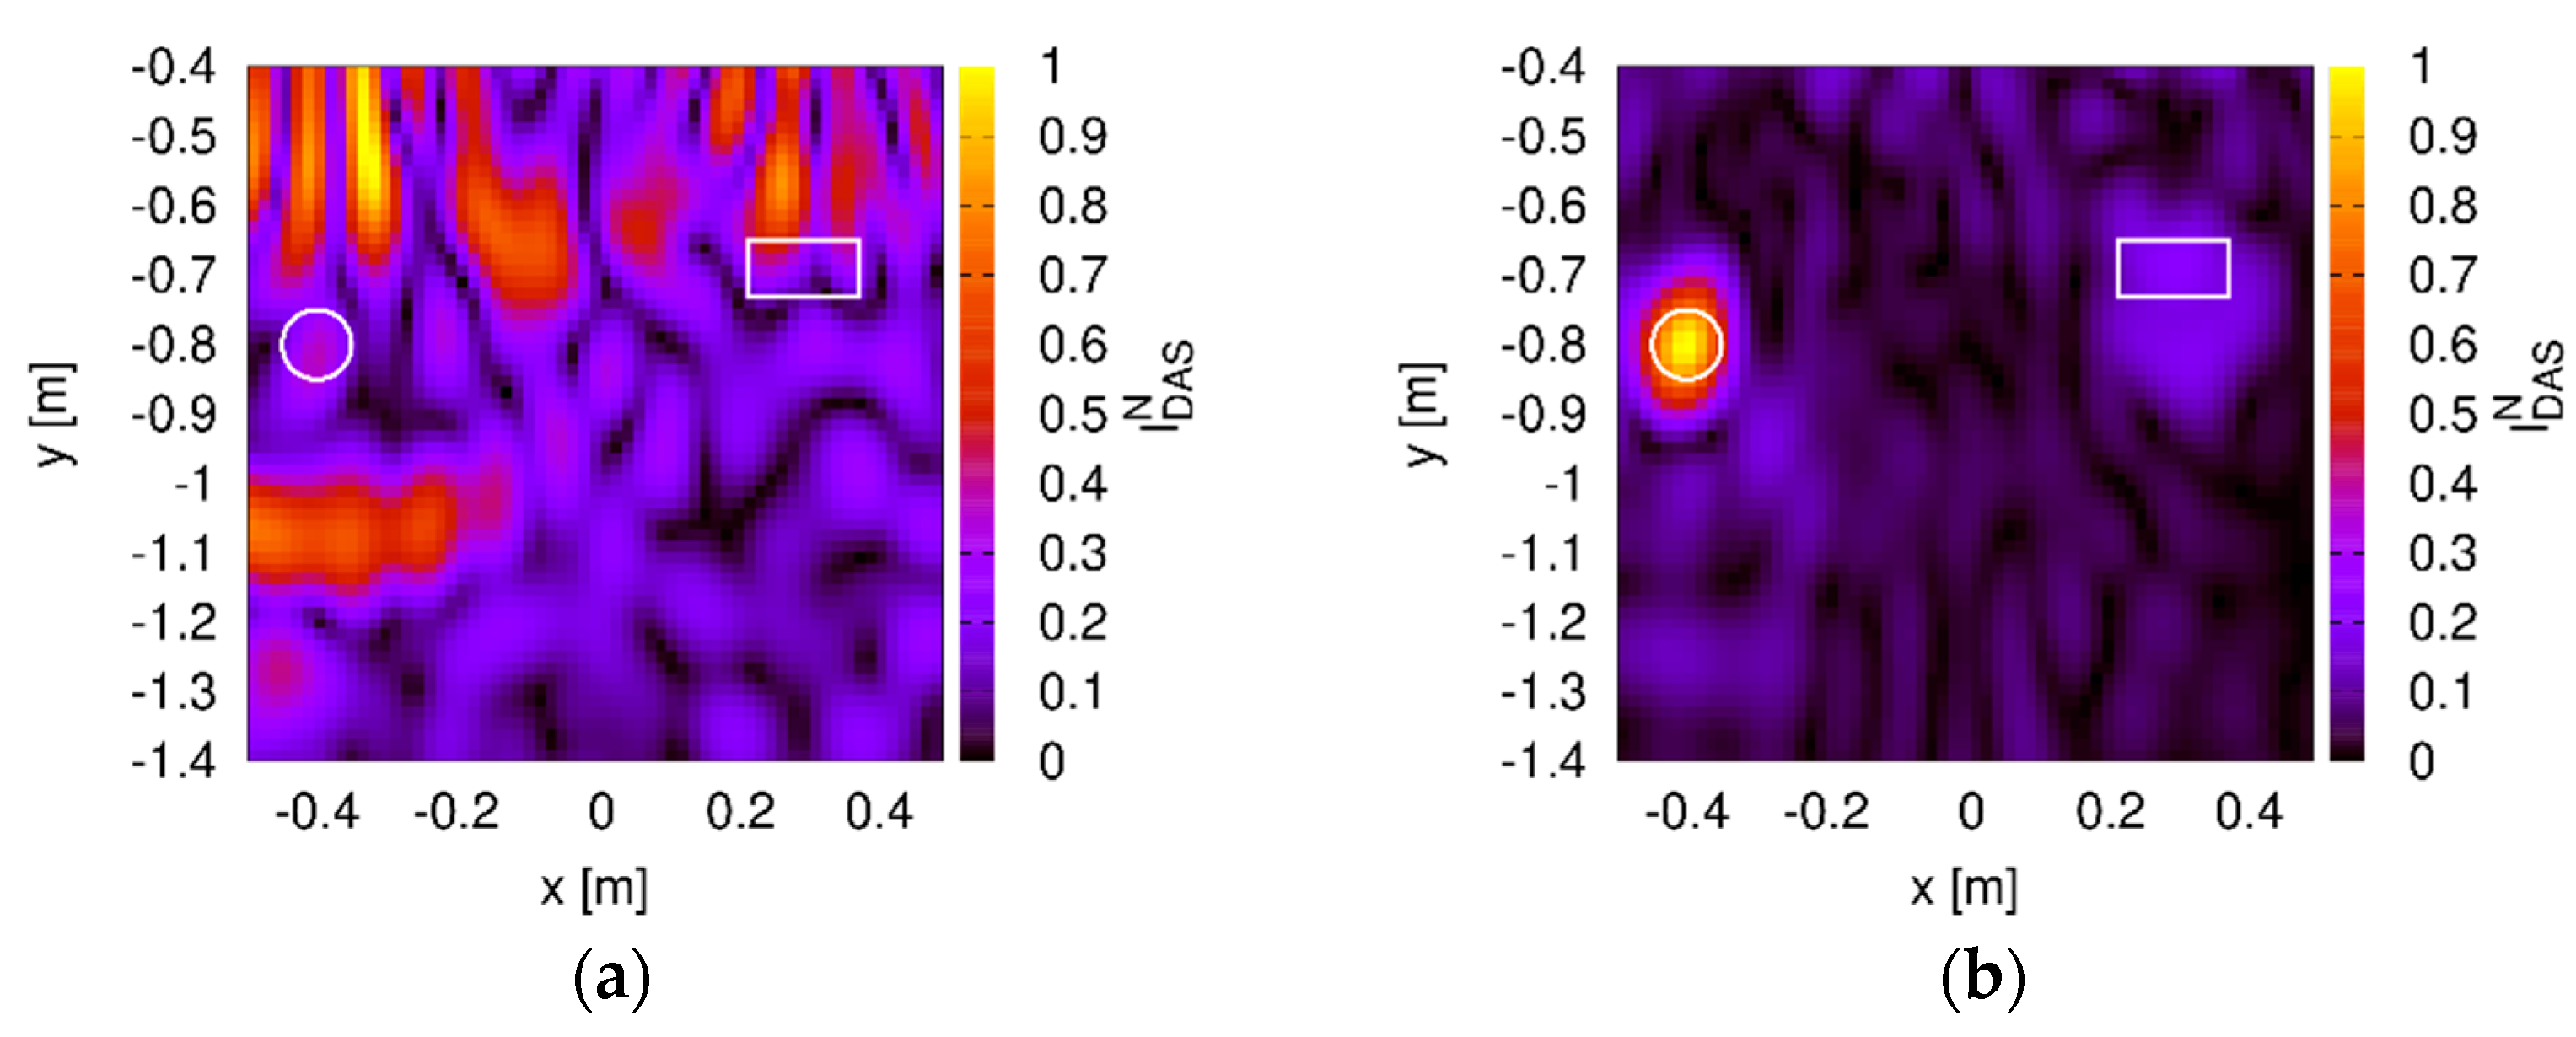
3.1. Single Metallic Target
3.2. Metallic and Dielectric Targets
4. Conclusions
Author Contributions
Funding
Data Availability Statement
Conflicts of Interest
References
- Amin, M.G. (Ed.) Through-the-Wall Radar Imaging; CRC Press: Boca Raton, FL, USA, 2011. [Google Scholar]
- Pastorino, M.; Randazzo, A. Microwave Imaging Methods and Applications; Artech House: Boston, MA, USA, 2018. [Google Scholar]
- Valagiannopoulos, C.A.; Tsitsas, N.L.; Sihvola, A.H. Unlocking’ the ground: Increasing the detectability of buried objects by depositing passive superstrates. IEEE Trans. Geosci. Remote Sens. 2016, 54, 3697–3706. [Google Scholar] [CrossRef]
- Valagiannopoulos, C.A.; Tsitsas, N.L.; Sihvola, A.H. Hiding a bump on a PEC plane by using an isotropic lossless dielectric layer. IEEE Trans. Antennas Propag. 2014, 62, 5706–5714. [Google Scholar] [CrossRef]
- Nkwari, P.K.M.; Sinha, S.; Ferreira, H.C. Through-the-wall radar imaging: A review. IETE Tech. Rev. 2018, 35, 631–639. [Google Scholar] [CrossRef]
- Cicchetti, R.; Cicchetti, V.; Faraone, A.; Foged, L.; Testa, O. A compact high-gain wideband lens vivaldi antenna for wireless communications and through-the-wall imaging. IEEE Trans. Antennas Propag. 2020. [Google Scholar] [CrossRef]
- Ahmad, F.; Amin, M.G.; Kassam, S.A. Synthetic aperture beamformer for imaging through a dielectric wall. IEEE Trans. Aerosp. Electron. Syst. 2005, 41, 271–283. [Google Scholar] [CrossRef]
- Zhang, W.; Hoorfar, A. Three-dimensional synthetic aperture radar imaging through multilayered walls. IEEE Trans. Antennas Propagat. 2014, 62, 459–462. [Google Scholar] [CrossRef]
- Cicchetti, R.; Pisa, S.; Piuzzi, E.; Pittella, E.; D’Atanasio, P.; Testa, O. Numerical and experimental comparison among a new hybrid FT-MUSIC technique and existing algorithms for through-the-wall radar imaging. IEEE Trans. Microw. Theory Tech. 2021. [Google Scholar] [CrossRef]
- Dehmollaian, M.; Thiel, M.; Sarabandi, K. Through-the-wall imaging using differential SAR. IEEE Trans. Geosci. Remote Sens. 2009, 47, 5. [Google Scholar] [CrossRef]
- Klibanov, M.V.; Smirnov, A.V.; Khoa, V.A.; Sullivan, A.J.; Nguyen, L.H. Through-the-wall nonlinear SAR imaging. IEEE Trans. Geosci. Remote Sens. 2021, 1–12. [Google Scholar] [CrossRef]
- Dehmollaian, M.; Sarabandi, K. Refocusing through building walls using synthetic aperture radar. IEEE Trans. Geosci. Remote Sens. 2008, 46, 6. [Google Scholar] [CrossRef]
- Setlur, P.; Amin, M.; Ahmad, F. Multipath model and exploitation in through-the-wall and urban radar sensing. IEEE Trans. Geosci. Remote Sens. 2011, 49, 10. [Google Scholar] [CrossRef]
- Xin, S.; Biying, L.; Pengfei, L.; Zhimin, Z. A multiarray refocusing approach for through-the-wall imaging. IEEE Geosci. Remote Sens. Lett. 2015, 12, 4. [Google Scholar] [CrossRef]
- Liu, H.; Huang, C.; Gan, L.; Zhou, Y.; Truong, T.-K. Clutter reduction and target tracking in through-the-wall radar. IEEE Trans. Geosci. Remote Sens. 2020, 58, 1. [Google Scholar] [CrossRef]
- Tivive, F.H.C.; Bouzerdoum, A.; Amin, M.G. A subspace projection approach for wall clutter mitigation in through-the-wall radar imaging. IEEE Trans. Geosci. Remote Sens. 2015, 53, 2108–2122. [Google Scholar] [CrossRef]
- Zhou, Y.; Huang, C.; Liu, H.; Li, D.; Truong, T.-K. Front-wall clutter removal in through-the-wall radar based on weighted nuclear norm minimization. IEEE Geosci. Remote Sens. Lett. 2020, 1–5. [Google Scholar] [CrossRef]
- Yektakhah, B.; Sarabandi, K. All-directions through-the-wall radar imaging using a small number of moving transceivers. IEEE Trans. Geosci. Remote Sens. 2016, 54, 11. [Google Scholar] [CrossRef]
- Yektakhah, B.; Sarabandi, K. All-directions through-the-wall imaging using a small number of moving omnidirectional bi-static FMCW transceivers. IEEE Trans. Geosci. Remote Sens. 2019, 57, 2618–2627. [Google Scholar] [CrossRef]
- Yektakhah, B.; Sarabandi, K. A method for detection of flat walls in through-the-wall SAR imaging. IEEE Geosci. Remote Sens. Lett. 2020, 1–5. [Google Scholar] [CrossRef]
- Soldovieri, F.; Solimene, R. Through-wall imaging via a linear inverse scattering algorithm. IEEE Geosci. Remote Sens. Lett. 2007, 4, 4. [Google Scholar] [CrossRef]
- Solimene, R.; Soldovieri, F.; Prisco, G.; Pierri, R. Three-dimensional through-wall imaging under ambiguous wall parameters. IEEE Trans. Geosci. Remote Sens. 2009, 47, 5. [Google Scholar] [CrossRef]
- Soldovieri, F.; Solimene, R.; Brancaccio, A.; Pierri, R. Localization of the interfaces of a slab hidden behind a wall. IEEE Trans. Geosci. Remote Sens. 2007, 45, 8. [Google Scholar] [CrossRef]
- Charnley, M.; Wood, A. A linear sampling method for through-the-wall radar detection. J. Comput. Phys. 2017, 347, 147–159. [Google Scholar] [CrossRef]
- Catapano, I.; Crocco, L. A qualitative inverse scattering method for through-the-wall imaging. IEEE Geosci. Remote Sens. Lett. 2010, 7, 685–689. [Google Scholar] [CrossRef]
- Gennarelli, G.; Vivone, G.; Braca, P.; Soldovieri, F.; Amin, M.G. Comparative analysis of two approaches for multipath ghost suppression in radar imaging. IEEE Geosci. Remote Sens. Lett. 2016, 13, 9. [Google Scholar] [CrossRef]
- Chiu, C.-C.; Sun, C.-H. Through-wall imaging for a metallic cylinder. Nondestruct. Test. Eval. 2013, 28, 72–81. [Google Scholar] [CrossRef]
- Dehmollaian, M. Through-wall shape reconstruction and wall parameters estimation using differential evolution. IEEE Geosci. Remote Sens. Lett. 2011, 8, 201–205. [Google Scholar] [CrossRef]
- Rekanos, I.T. Shape reconstruction of a perfectly conducting scatterer using differential evolution and particle swarm optimization. IEEE Trans. Geosci. Remote Sens. 2008, 46, 1967–1974. [Google Scholar] [CrossRef]
- Gennarelli, G.; Vivone, G.; Braca, P.; Soldovieri, F.; Amin, M.G. Multiple extended target tracking for through-wall radars. IEEE Trans. Geosci. Remote Sens. 2015, 53, 12. [Google Scholar] [CrossRef]
- Liu, J.; Kong, L.; Yang, X.; Liu, Q.H. First-order multipath ghosts’ characteristics and suppression in MIMO through-wall imaging. IEEE Geosci. Remote Sens. Lett. 2016, 13, 1315–1319. [Google Scholar] [CrossRef]
- Guo, S.; Yang, X.; Cui, G.; Song, Y.; Kong, L. Multipath ghost suppression for through-the-wall imaging radar via array rotating. IEEE Geosci. Remote Sens. Lett. 2018, 15, 868–872. [Google Scholar] [CrossRef]
- Tan, Q.; Leung, H.; Song, Y.; Wang, T. Multipath ghost suppression for through-the-wall radar. IEEE Trans. Aerosp. Electron. Syst. 2014, 50, 2284–2292. [Google Scholar] [CrossRef]
- Wu, Q.; Zhang, Y.D.; Ahmad, F.; Amin, M.G. Compressive-sensing-based high-resolution polarimetric through-the-wall radar imaging exploiting target characteristics. Antennas Wirel. Propag. Lett. 2015, 14, 1043–1047. [Google Scholar] [CrossRef]
- Huang, Q.; Qu, L.; Wu, B.; Fang, G. UWB through-wall imaging based on compressive sensing. IEEE Trans. Geosci. Remote Sens. 2010, 48, 1408–1415. [Google Scholar] [CrossRef]
- Solimene, R.; Ahmad, F.; Soldovieri, F. A novel CS-TSVD strategy to perform data reduction in linear inverse scattering problems. IEEE Geosci. Remote Sens. Lett. 2012, 9, 881–885. [Google Scholar] [CrossRef]
- Oliveri, G.; Anselmi, N.; Massa, A. Compressive sensing imaging of non-sparse 2D scatterers by a total-variation approach within the Born approximation. IEEE Trans. Antennas Propag. 2014, 62, 5157–5170. [Google Scholar] [CrossRef]
- Tang, V.H.; Bouzerdoum, A.; Phung, S.L. Compressive radar imaging of stationary indoor targets with low-rank plus jointly sparse and total variation regularizations. IEEE Trans. Image Process. 2020, 29, 4598–4613. [Google Scholar] [CrossRef] [PubMed]
- Wu, Q.; Lai, Z.; Amin, M.G. Through-the-wall radar imaging based on Bayesian compressive sensing exploiting multipath and target structure. IEEE Trans. Comput. Imaging 2021, 7, 422–435. [Google Scholar] [CrossRef]
- Fedeli, A.; Pastorino, M.; Ponti, C.; Randazzo, A.; Schettini, G. Through-the-wall microwave imaging: Forward and inverse scattering modeling. Sensors 2020, 20, 2865. [Google Scholar] [CrossRef] [PubMed]
- Randazzo, A.; Ponti, C.; Fedeli, A.; Estatico, C.; D’Atanasio, P.; Pastorino, M.; Schettini, G. A two-step inverse-scattering technique in variable-exponent Lebesgue spaces for through-the-wall microwave imaging: Experimental results. IEEE Trans. Geosci. Remote Sens. 2021. [Google Scholar] [CrossRef]
- Zhang, W.; Hoorfar, A. Three-dimensional real-time through-the-wall radar imaging with diffraction tomographic algorithm. IEEE Trans. Geosci. Remote Sens. 2013, 51, 4155–4163. [Google Scholar] [CrossRef]
- Chu, Y.; Xu, K.; Zhong, Y.; Ye, X.; Zhou, T.; Chen, X.; Wang, G. Fast microwave through wall imaging method with inhomogeneous background based on levenberg–marquardt algorithm. IEEE Trans. Microw. Theory Tech. 2019, 67, 1138–1147. [Google Scholar] [CrossRef]
- Rekanos, I.T.; Raisanen, A. Microwave imaging in the time domain of buried multiple scatterers by using an FDTD-based optimization technique. IEEE Trans. Magn. 2003, 39, 1381–1384. [Google Scholar] [CrossRef]
- Meng, Q.; Ye, D.; Huangfu, J.; Li, C.; Ran, L. Experimental investigation on through-wall imaging based on non-linear inversions. Electron. Lett. 2016, 52, 1933–1935. [Google Scholar] [CrossRef]
- Song, L.-P.; Yu, C.; Liu, Q.H. Through-wall imaging (TWI) by radar: 2-D tomographic results and analyses. IEEE Trans. Geosci. Remote Sens. 2005, 43, 2793–2798. [Google Scholar] [CrossRef]
- Estatico, C.; Fedeli, A.; Pastorino, M.; Randazzo, A. Quantitative microwave imaging method in Lebesgue spaces with nonconstant exponents. IEEE Trans. Antennas Propag. 2018, 66, 7282–7294. [Google Scholar] [CrossRef]
- Bisio, I.; Estatico, C.; Fedeli, A.; Lavagetto, F.; Pastorino, M.; Randazzo, A.; Sciarrone, A. Variable-exponent Lebesgue-space inversion for brain stroke microwave imaging. IEEE Trans. Microw. Theory Tech. 2020, 68, 1882–1895. [Google Scholar] [CrossRef]
- Chew, W.C. Waves and Fields in Inhomogeneous Media; IEEE Press: Piscataway, NY, USA, 1995. [Google Scholar]
- Soldovieri, F.; Brancaccio, A.; Leone, G.; Pierri, R. Shape reconstruction of perfectly conducting objects by multiview experimental data. IEEE Trans. Geosci. Remote Sens. 2005, 43, 65–71. [Google Scholar] [CrossRef]
- Diening, L.; Harjulehto, P.; Hästö, P.; Ruzicka, M. Lebesgue and Sobolev Spaces with Variable Exponents; Lecture Notes in Mathematics; Springer: Heidelberg, Germany; New York, NY, USA, 2011; Volume 2017. [Google Scholar]
- Estatico, C.; Fedeli, A.; Pastorino, M.; Randazzo, A. Microwave imaging by means of Lebesgue-space inversion: An overview. Electronics 2019, 8, 945. [Google Scholar] [CrossRef]
- Estatico, C.; Pastorino, M.; Randazzo, A.; Tavanti, E. Three-dimensional microwave imaging in Lp Banach spaces: Numerical and experimental results. IEEE Trans. Comput. Imaging 2018, 4, 609–623. [Google Scholar] [CrossRef]
- PulseEKKO, Overview, Sensors & Software. Available online: https://www.sensoft.ca/products/pulseekkopro/overview-pulseekko/ (accessed on 12 April 2021).
- Yoon, Y.-S.; Amin, M.G. Spatial filtering for wall-clutter mitigation in through-the-wall radar imaging. IEEE Trans. Geosci. Remote Sens. 2009, 47, 3192–3208. [Google Scholar] [CrossRef]
- Solimene, R.; Catapano, I.; Gennarelli, G.; Cuccaro, A.; Dell’Aversano, A.; Soldovieri, F. SAR imaging algorithms and some unconventional applications: A unified mathematical overview. IEEE Signal Process. Mag. 2014, 31, 90–98. [Google Scholar] [CrossRef]
- Ahmad, F.; Zhang, Y.; Amin, M.G. Three-dimensional wideband beamforming for imaging through a single wall. IEEE Geosci. Remote Sens. Lett. 2008, 5, 176–179. [Google Scholar] [CrossRef]
- Pisa, S.; Piuzzi, E.; Pittella, E.; D’Atanasio, P.; Zambotti, A.; Sacco, G. Comparison between delay and sum and range migration algorithms for image reconstruction in through-the-wall radar imaging systems. IEEE J. Electromagn. RF Microw. Med. Biol. 2018, 2, 270–276. [Google Scholar] [CrossRef]


| SCR [dB] | Offline Time [s] | Online Time [s] | |||||
|---|---|---|---|---|---|---|---|
Precomputation | Precomputation | SVD Inversion | VpLW Inversion | ||||
| 400 | 5 | 7.1 | 42.0 | 23.7 | 17.1 | 2.1 × 10⁻³ | 0.3 |
| 1600 | 2.5 | 10.3 | 46.0 | 139.2 | 34.1 | 3.9 × 10⁻³ | 0.75 |
| 3600 | 1.67 | 10.5 | 49.7 | 281.9 | 123.7 | 2 × 10⁻³ | 0.86 |
| 6400 | 1.25 | 10.8 | 50.6 | 524.0 | 280.9 | 3 × 10⁻³ | 1.28 |
| 10,000 | 1 | 10.8 | 51.5 | 761.3 | 549.9 | 3 × 10⁻³ | 1.37 |
Publisher’s Note: MDPI stays neutral with regard to jurisdictional claims in published maps and institutional affiliations. |
© 2021 by the authors. Licensee MDPI, Basel, Switzerland. This article is an open access article distributed under the terms and conditions of the Creative Commons Attribution (CC BY) license (https://creativecommons.org/licenses/by/4.0/).
Share and Cite
Randazzo, A.; Ponti, C.; Fedeli, A.; Estatico, C.; D’Atanasio, P.; Pastorino, M.; Schettini, G. A Through-the-Wall Imaging Approach Based on a TSVD/Variable-Exponent Lebesgue-Space Method. Remote Sens. 2021, 13, 2028. https://doi.org/10.3390/rs13112028
Randazzo A, Ponti C, Fedeli A, Estatico C, D’Atanasio P, Pastorino M, Schettini G. A Through-the-Wall Imaging Approach Based on a TSVD/Variable-Exponent Lebesgue-Space Method. Remote Sensing. 2021; 13(11):2028. https://doi.org/10.3390/rs13112028
Chicago/Turabian StyleRandazzo, Andrea, Cristina Ponti, Alessandro Fedeli, Claudio Estatico, Paolo D’Atanasio, Matteo Pastorino, and Giuseppe Schettini. 2021. "A Through-the-Wall Imaging Approach Based on a TSVD/Variable-Exponent Lebesgue-Space Method" Remote Sensing 13, no. 11: 2028. https://doi.org/10.3390/rs13112028
APA StyleRandazzo, A., Ponti, C., Fedeli, A., Estatico, C., D’Atanasio, P., Pastorino, M., & Schettini, G. (2021). A Through-the-Wall Imaging Approach Based on a TSVD/Variable-Exponent Lebesgue-Space Method. Remote Sensing, 13(11), 2028. https://doi.org/10.3390/rs13112028


