Article

New Constraints on Slip Behavior of the Jianshui Strike-Slip Fault from Faulted Stream Channel Risers and Airborne Lidar Data, SE Tibetan Plateau, China

1
Institute of Geology, China Earthquake Administration, Beijing 100029, China
2
Key Laboratory of Seismic and Volcanic Hazards, China Earthquake Administration, Beijing 100029, China
*
Author to whom correspondence should be addressed.
Remote Sens. 2021, 13(10), 2019; https://doi.org/10.3390/rs13102019
Submission received: 20 April 2021 / Revised: 15 May 2021 / Accepted: 18 May 2021 / Published: 20 May 2021

Abstract

:
The temporal slip behavior of a fault from displaced landforms when there are no chronological data remains poorly understood. The southern segment of the Xiaojiang fault zone (XJFZ) plays an important role in accommodating the lateral extrusion of the SE Tibetan plateau. However, there are few reports on the evolution of the offset landforms and slip behavior of the fault due to the dense vegetation in the region. Here, offset landforms along the Jianshui fault (JSF) in the southern segment of the XJFZ are systematically interpreted and measured using high-resolution satellite imagery, field investigations, and airborne lidar. The risers on the right banks of three stream channels feature similar left-lateral offset characteristics near the town of Dongshanzhai. The left-lateral offsets consist of multiple inflections produced by seismic events, and the offset of each event is similar. These inflections are distributed downstream in a stair-stepped manner. The newly formed inflections are located close to the fault, and the earlier formed ones are eroded by flowing water and migrate downstream. The difference between the amount of downstream erosion of two adjacent inflections varies. Assuming the stream’s long-term erosion rate remains steady, the estimated time intervals between seismic events are different. Combined with the cumulative offset probability density calculation for 92 offsets, the JSF is considered to show a nonperiodic characteristic earthquake recurrence pattern. We also propose a multistage offset evolution model of the stream channel riser. This provides a new way to analyze the seismic recurrence pattern of the fault over a relative time scale.

1. Introduction

Offset landforms along a fault, such as a stream channel, river terrace, alluvial fan, or glacial moraine, can be used to identify and measure single-event and multi-event cumulative offsets of the fault, reconstruct its slip distribution and kinematics, and provide important information for understanding the seismic recurrence behavior of a fault on the magnitude scale and assessing its seismic hazards (e.g., [1,2,3,4]). Although the landform response to a fault offset and its evolution through space has been studied more frequently [5,6,7,8], the seismic recurrence of a fault from the landforms on a time scale remains poorly understood when there are no chronological data. The temporal slip pattern of a fault needs to be understood by further studying the timing of the paleoseismic events revealed by sedimentary deformation strata and chronological data (e.g., [9,10,11,12]).
Furthermore, offset landforms are often hidden by vegetation in areas with high vegetation coverage, which makes it difficult to identify offsets, analyze offset geomorphic evolution processes, and understand the slip behavior of faults using high-resolution optical images, field investigations, and UAV-based photogrammetry. Studies of fault activity are frequently limited to a few offset microlandforms or several large offset landforms that have been subjected to long-term deformation (e.g., [13,14,15]). The “bare earth” ground surface can be imaged using lidar by omitting points that are reflected off vegetation [4,16,17]. Lidar has been used effectively to map fault traces in detail and study offset microlandforms and the slip behavior of faults in areas with high vegetation coverage [18,19,20,21].
The Xiaojiang fault zone (XJFZ) is located in the southern portion of the Xianshuihe-Xiaojiang fault system (XXFS), which is the main boundary strike-slip fault system between the southeastern margin of the Tibetan Plateau and the South China block (Figure 1 [22,23,24]). Accompanied by the SSE-directed motion of the Sichuan-Yunnan block of the SE Tibetan plateau, the north-central segment of the XJFZ has accommodated a left-lateral strike-slip rate of 10–16 mm/y since the late Quaternary, and several earthquakes of magnitude M ≥ 7.0 have occurred there [25,26,27]. Previous studies have suggested that most of the left-lateral strike-slip motion of the XJFZ is absorbed and accommodated by the NW-striking Qujiang and Shiping faults to the south and that the southern segment of the XJFZ had weak activity during the late Quaternary (Figure 1 [27,28,29,30,31]). However, based on an analysis of regional tectonic deformation, the kinematic models proposed by previous studies [22,32] speculate that the XXFS crosses the Red River fault system to the south and connects with NE-trending faults on the southern side, such as the Dianbianfu fault (Figure 1). The regional GPS velocity field suggests that the slip rate of the XJFZ does not decrease significantly to the south [23,33]. Geological and geomorphic evidence has been found that suggests that the Jianshui fault (JSF) in the southern segment of the XJFZ was active in the Holocene [34]. Thus, studying the activity of the southern segment of the XJFZ contributes to improving our understanding of the range and pattern of southward motion of crustal material on the SE Tibetan Plateau and our ability to assess seismic hazards [26,30,35,36,37].
Due to the dense vegetation coverage along the southern segment of the XJFZ, there are few studies on the faulting activity in that region. The JSF is located in the southernmost section of the XJFZ, close to the Red River fault system (Figure 1). It is a key fault for understanding how the tectonic movement of the XJFZ propagates southward. To understand the slip behavior of the JSF on space and time scales, the fault traces and geometric structures of the JSF were mapped in detail using high-resolution optical image interpretation and field investigations, and sections with well-preserved faulted landforms were selected for fine measurement using airborne lidar to obtain high-resolution three-dimensional topographic data without vegetation. Through detailed interpretation and analysis of these topographic data, we analyzed the evolution of offset geomorphic markers and the slip history and kinematics of the fault. These markers included stream channel and terrace risers, and the stream channel riser was defined by a sloping escarpment on the left and right banks of the stream channel bound by a more gently sloping stream bed and geomorphic surface where the stream incised and formed. Based on the offset characteristics of stream channel risers, a multistage offset evolution model of the stream channel risers is proposed, and this provides a new way to analyze the temporal earthquake recurrence pattern of the fault over a relative time scale.

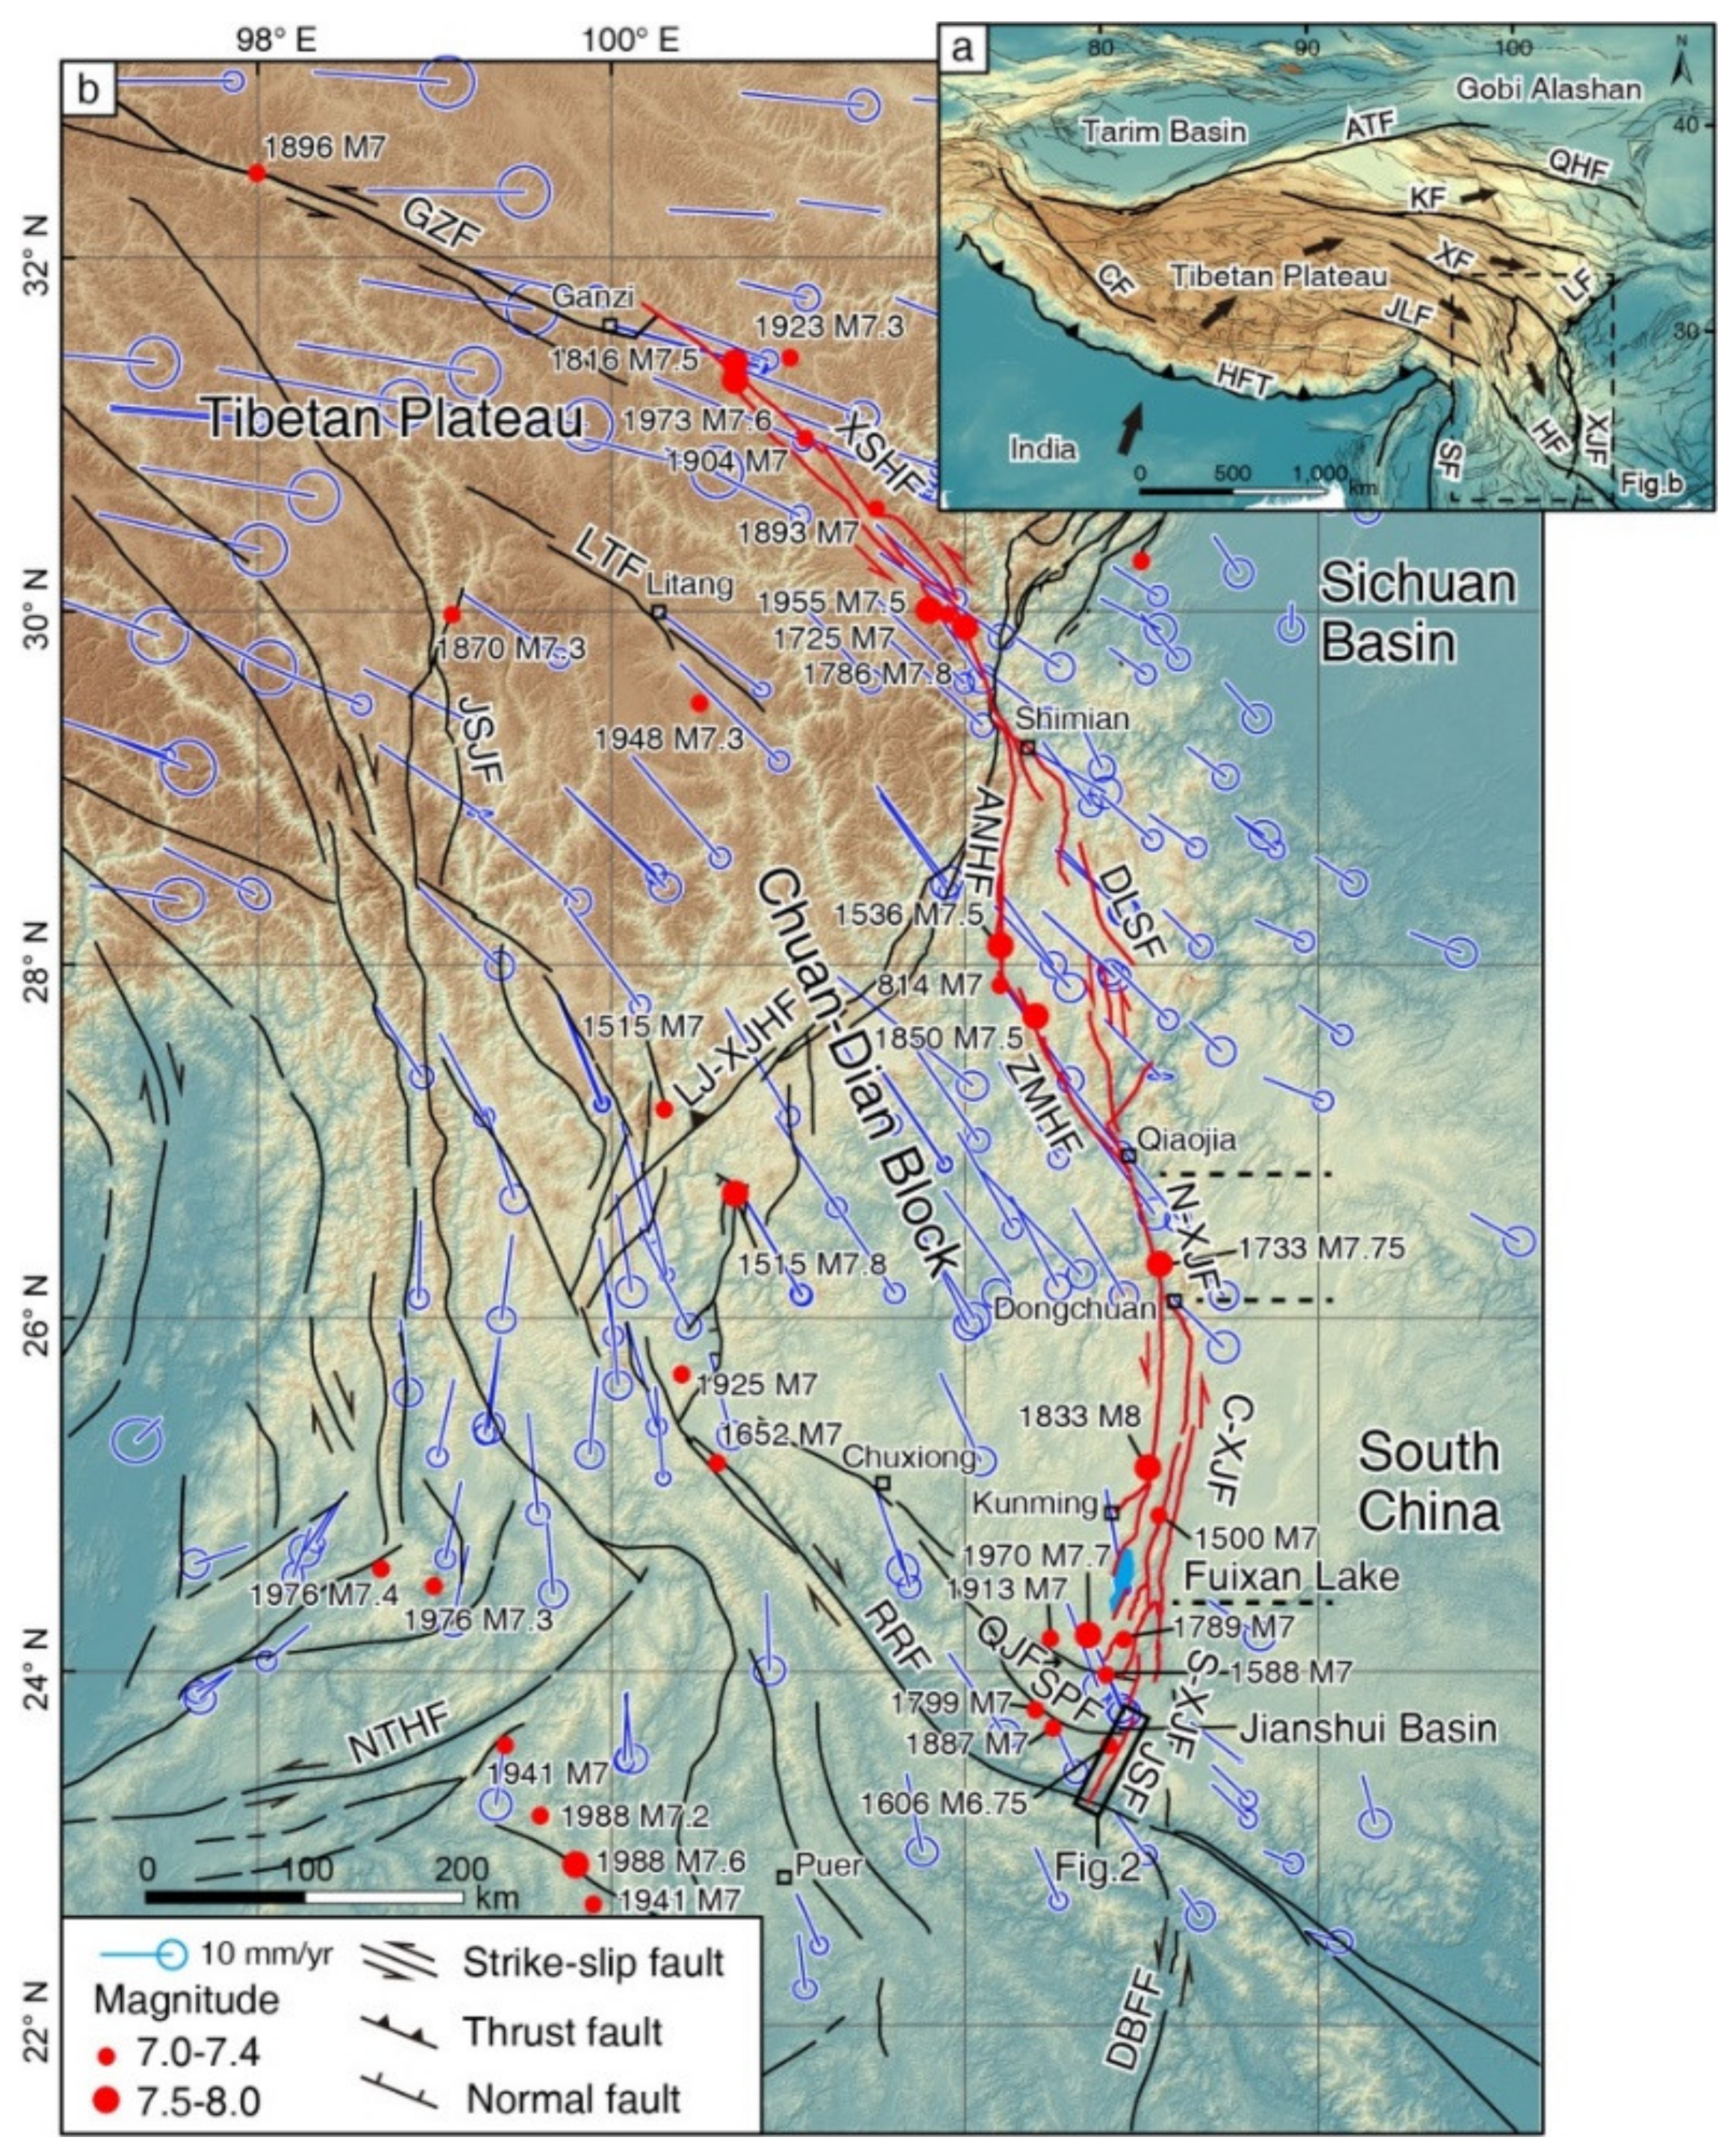
2. Regional Seismotectonic Setting

The NNE-trending convergence and compression of the Indian plate toward the Eurasian plate causes the crustal material in the central Tibetan Plateau to move eastward and westward [38,39,40]. The plateau is blocked by the rigid Sichuan Basin to the east, causing the crustal material in the southeastern part of the plateau to move southeastward along the XXFS (Figure 1 [41,42]). The XJFZ is an important part of the XXFS. The XJFZ is about 400 km long and can be divided into three segments from north to south (Figure 1 [26,27]). The JSF in the southern segment of the XJFZ, to the east and south of the Jianshui Basin, cuts through the NWW-striking Qujiang and Shiping faults and extends to the Red River Valley [34]. The exposed strata along the southern segment of the XJFZ include Proterozoic, Paleozoic, Mesozoic, and Cenozoic strata. In the pre-Cenozoic strata, Sinian, Devonian, and Triassic components are widely distributed, and the lithology is dominated by limestone and dolomitic limestone. In the Cenozoic strata, Neogene and Quaternary components dominate, mainly gravel and clay layers.
Figure 1. Tectonic setting of the Jianshui fault in the southeastern margin of the Tibetan Plateau. (a) Tectonic location of the study area. (b) Main active tectonics in the study area. Fault locations and slip senses are modified from the Seimotectonic map of China and its adjacent regions [37]. Red lines represent the Xianshuihe-Xiaojiang left-lateral strike-slip fault system. The rectangular box represents the location of the Jianshui fault. Earthquake locations and magnitudes were taken from the China Earthquake Information Network. The blue lines indicate GPS velocity field relative to stable Eurasia [43]. The topography data were generated from the SRTM DEM (90 m-resolution), which was provided by International Scientific & Technical Data Mirror Site, Computer Network Information Center, Chinese Academy of Sciences (http://www.gscloud.cn (accessed on 12 June 2020)). Abbreviations: GZF = Ganzi fault, XSHF = Xianshuihe fault, ANHF = Anninghe fault, ZMHF = Zemuhe fault, DLSF = Daliangshan fault, N-XJF = Northern segment of the Xiaojiang fault, C-XJF = Central segment of the Xiaojiang fault, S-XJF = Southern segment of the Xiaojiang fault, JSF = Jianshui fault, QJF = Qujiang fault, SPF = Shiping fault, RRF = Red River fault, DBFF = Dien Bien Phu fault, NTHF = Nantinghe fault, LJ-XJHF = Lijiang-Xiaojinhe fault, JSJF = Jinshajiang fault, LTF = Litang fault, LMSF = Longmenshan fault.
Remotesensing 13 02019 g001
Trench excavations revealed that several paleoseismic events have occurred on the north and central segments of the XJFZ since the late Quaternary, and the earthquake recurrence interval was estimated to be 2000–4000 y [27,44], 2000–2500 y [26], or 340–480 y [36]. Four earthquakes with M ≥ 7.0 occurred in historical times, including the 1733 M7.75 Dongchuan earthquake, the 1833 M8.0 Songming earthquake, the 1500 M7.0 Yiliang earthquake, and the 1789 M7.0 Huaning earthquake [30,45,46,47]. However, no historical earthquakes of M ≥ 7.0 have been reported on the southern segment of the XJFZ. The 1606 M6.75 Jianshui earthquake occurred near Jianshui County on the west side of the JSF (Figure 2).
Satellite images show that the JSF forms a clear linear structure (Figure 2). The length of the fault is about 70 km, and the overall strike is about N20°E. The fault starts near Baiyun in the north, passes through Bagenjiao, Fangmaping, Xinzhai, Liangchahe, and Shanhua to the south, and extends from the west side of Niuguntang village to the Red River Valley. After cutting through the valley, it continues to extend southward (Figure 2b). Some late Quaternary basins are distributed along the fault, such as the Baiyun Basin, Luoshuidong Basin, Xinzhai Basin, and Goujie Basin. Several of these basins, such as Xinzhai Basin, are typical pull-apart basins. However, the most recent fault motion remolded these pull-apart basins. The fault is composed of multiple branch faults with a left-stepped en-echelon pattern, and it has a zigzag-shaped distribution as a whole. The fault ends form horsetail-shaped splaying patterns. The offset characteristics and paleoseismic behavior of the fault remain poorly understood.

3. Methods

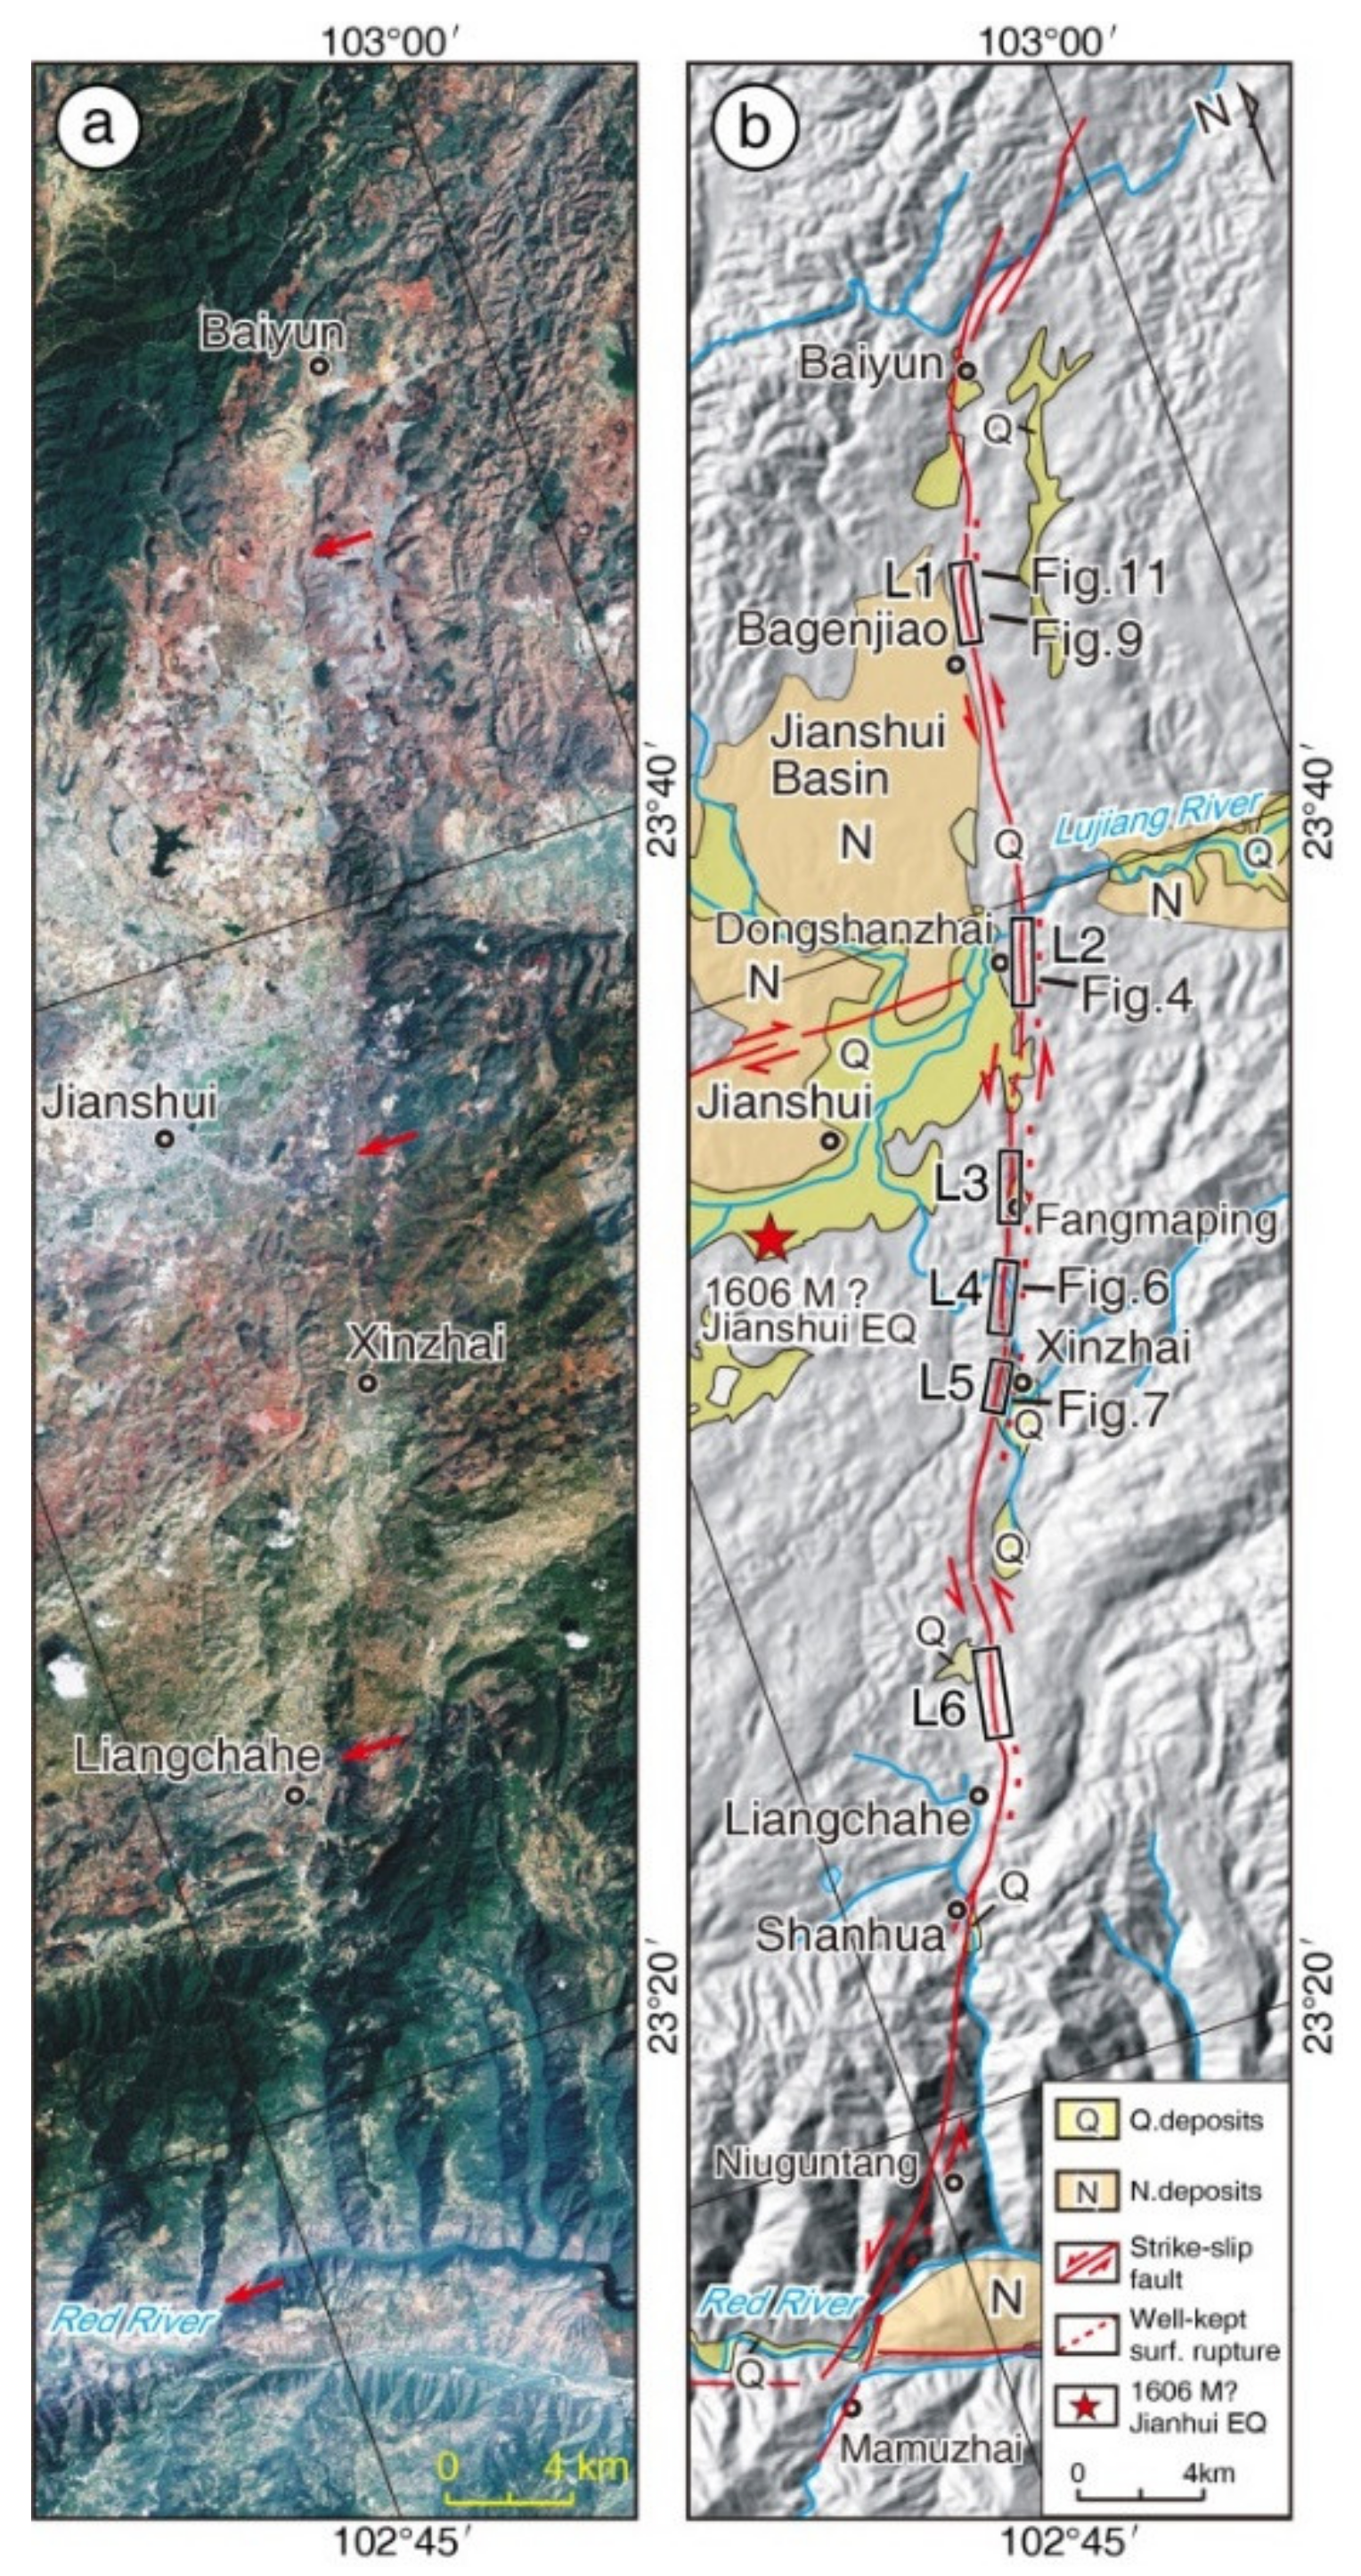
3.1. Data Acquisition and Processing

The fault was mapped in detail to determine the location of the fault trace based on high-resolution Google Earth image interpretation and geological and geomorphic investigations of faulted markers including fault scarps, fault troughs, and left-lateral offset streams, terraces, and ridges. Six sections of well-preserved faulted landforms were selected and imaged using UAV-based photogrammetry. It is regrettable that some offset landforms could not be identified on the orthoimage due to the vegetation coverage. Then, these sections were scanned using airborne lidar. The resulting high-density point cloud data covered a length of 12 km and a width of 200–550 m. Ground and vegetation points were separated by point cloud classification. Vegetation points were removed to obtain high-density point cloud data on the ground surface (no less than 9 pts/m2). Digital elevation models (DEMs) with a resolution of 0.5 m and an accuracy of 0.2 m were generated using the ground points and the inverse distance weighting interpolation method in ArcGIS software (from ESRI, Sacramento, California USA). Finally, three-dimensional geomorphic hillshade maps superimposed with contour lines (interval 0.2–0.3 m) were constructed in ArcGIS software using the DEMs.
To better understand the validity of the lidar data and the broader geomorphology of the landform in our study area, different types of data from an offset stream, including an orthoimage obtained using UAV-based photogrammetry, a field photo, and hillshade maps created from the pre- and post-processed lidar data, were compared (Figure 3). It was observed in the orthoimage and field photo that the hillside is mainly covered with dense, low bushes or tall trees (Figure 3a,b). The stream bed and riser are covered with more bushes and trees, which made the details of their dislocations and bends difficult to identify from the orthoimage and hillshade map with vegetation coverage (Figure 3a,c). Fortunately, the details of the offset stream riser, such as its multiple inflections, could be identified from the hillshade map without vegetation (Figure 3d).

3.2. Identification and Measurement of Offset Markers

Offset geomorphic markers along the fault, including streams and terrace risers, were identified based on visual interpretation of the color differences and contour lines of the landforms in the topographic data. Then, these offset markers were verified in the field. When measuring offset markers, the fault trace and piercing lines of the offset markers were first drawn in ArcGIS software, and the piercing lines were then extended to the fault. The offset and error of the markers were constrained by back-slipping for the left edge, thalweg, and right edge of the stream or the base, center, and crest of the terrace riser [48,49]. The uncertainty of an offset mainly comes from the shape and sinuosity of geomorphic markers, the location of the fault, and the geometry of the intersection between the geomorphic marker and the fault trace. According to the measurement quality, the offsets were classified into grades 1, 2, and 3 (from best to worst). Grade 1 means that the geomorphic markers show low sinuosity and a nearly perpendicular intersection with the fault. Grade 2 indicates that the geomorphic markers feature moderate sinuosity and intersect with the fault at small angles. Grade 3 represents high sinuosity geomorphic markers or that the fault trace is unclear.

3.3. Analysis of the Offset Characteristics

The offset stream channels that showed multiple inflections, indicating that they might record multiple seismic events, were selected for detailed interpretation. We analyzed the evolution process of the offset channels and identified the offset of each event. Assuming that the stream erosion rate remained steady, the relative time of offset occurrence was estimated based on the amount of downstream erosion of the inflections caused by flowing water. Then, we plotted the distribution of all offsets along the fault. A triangular probability was used to represent each offset measurement and its error, where the triangle’s height was the probability of the optimal offset, and the width was the measurement uncertainty defined by the maximum and minimum values [48,50]. The triangular probability areas of the grade 1, 2, and 3 offsets were 1, 0.75, and 0.5, respectively. Then, the cumulative offset probability density (COPD) for all offsets was calculated [2,51,52]. The relationships between the offsets indicated by probability peaks were also evaluated [4,53,54]. Finally, by combining the offset and temporal information revealed by the offset stream channel and the COPD calculation, the temporal and spatial distribution patterns of the fault slip were analyzed.

4. Results

4.1. Faulted Landforms and Offsets

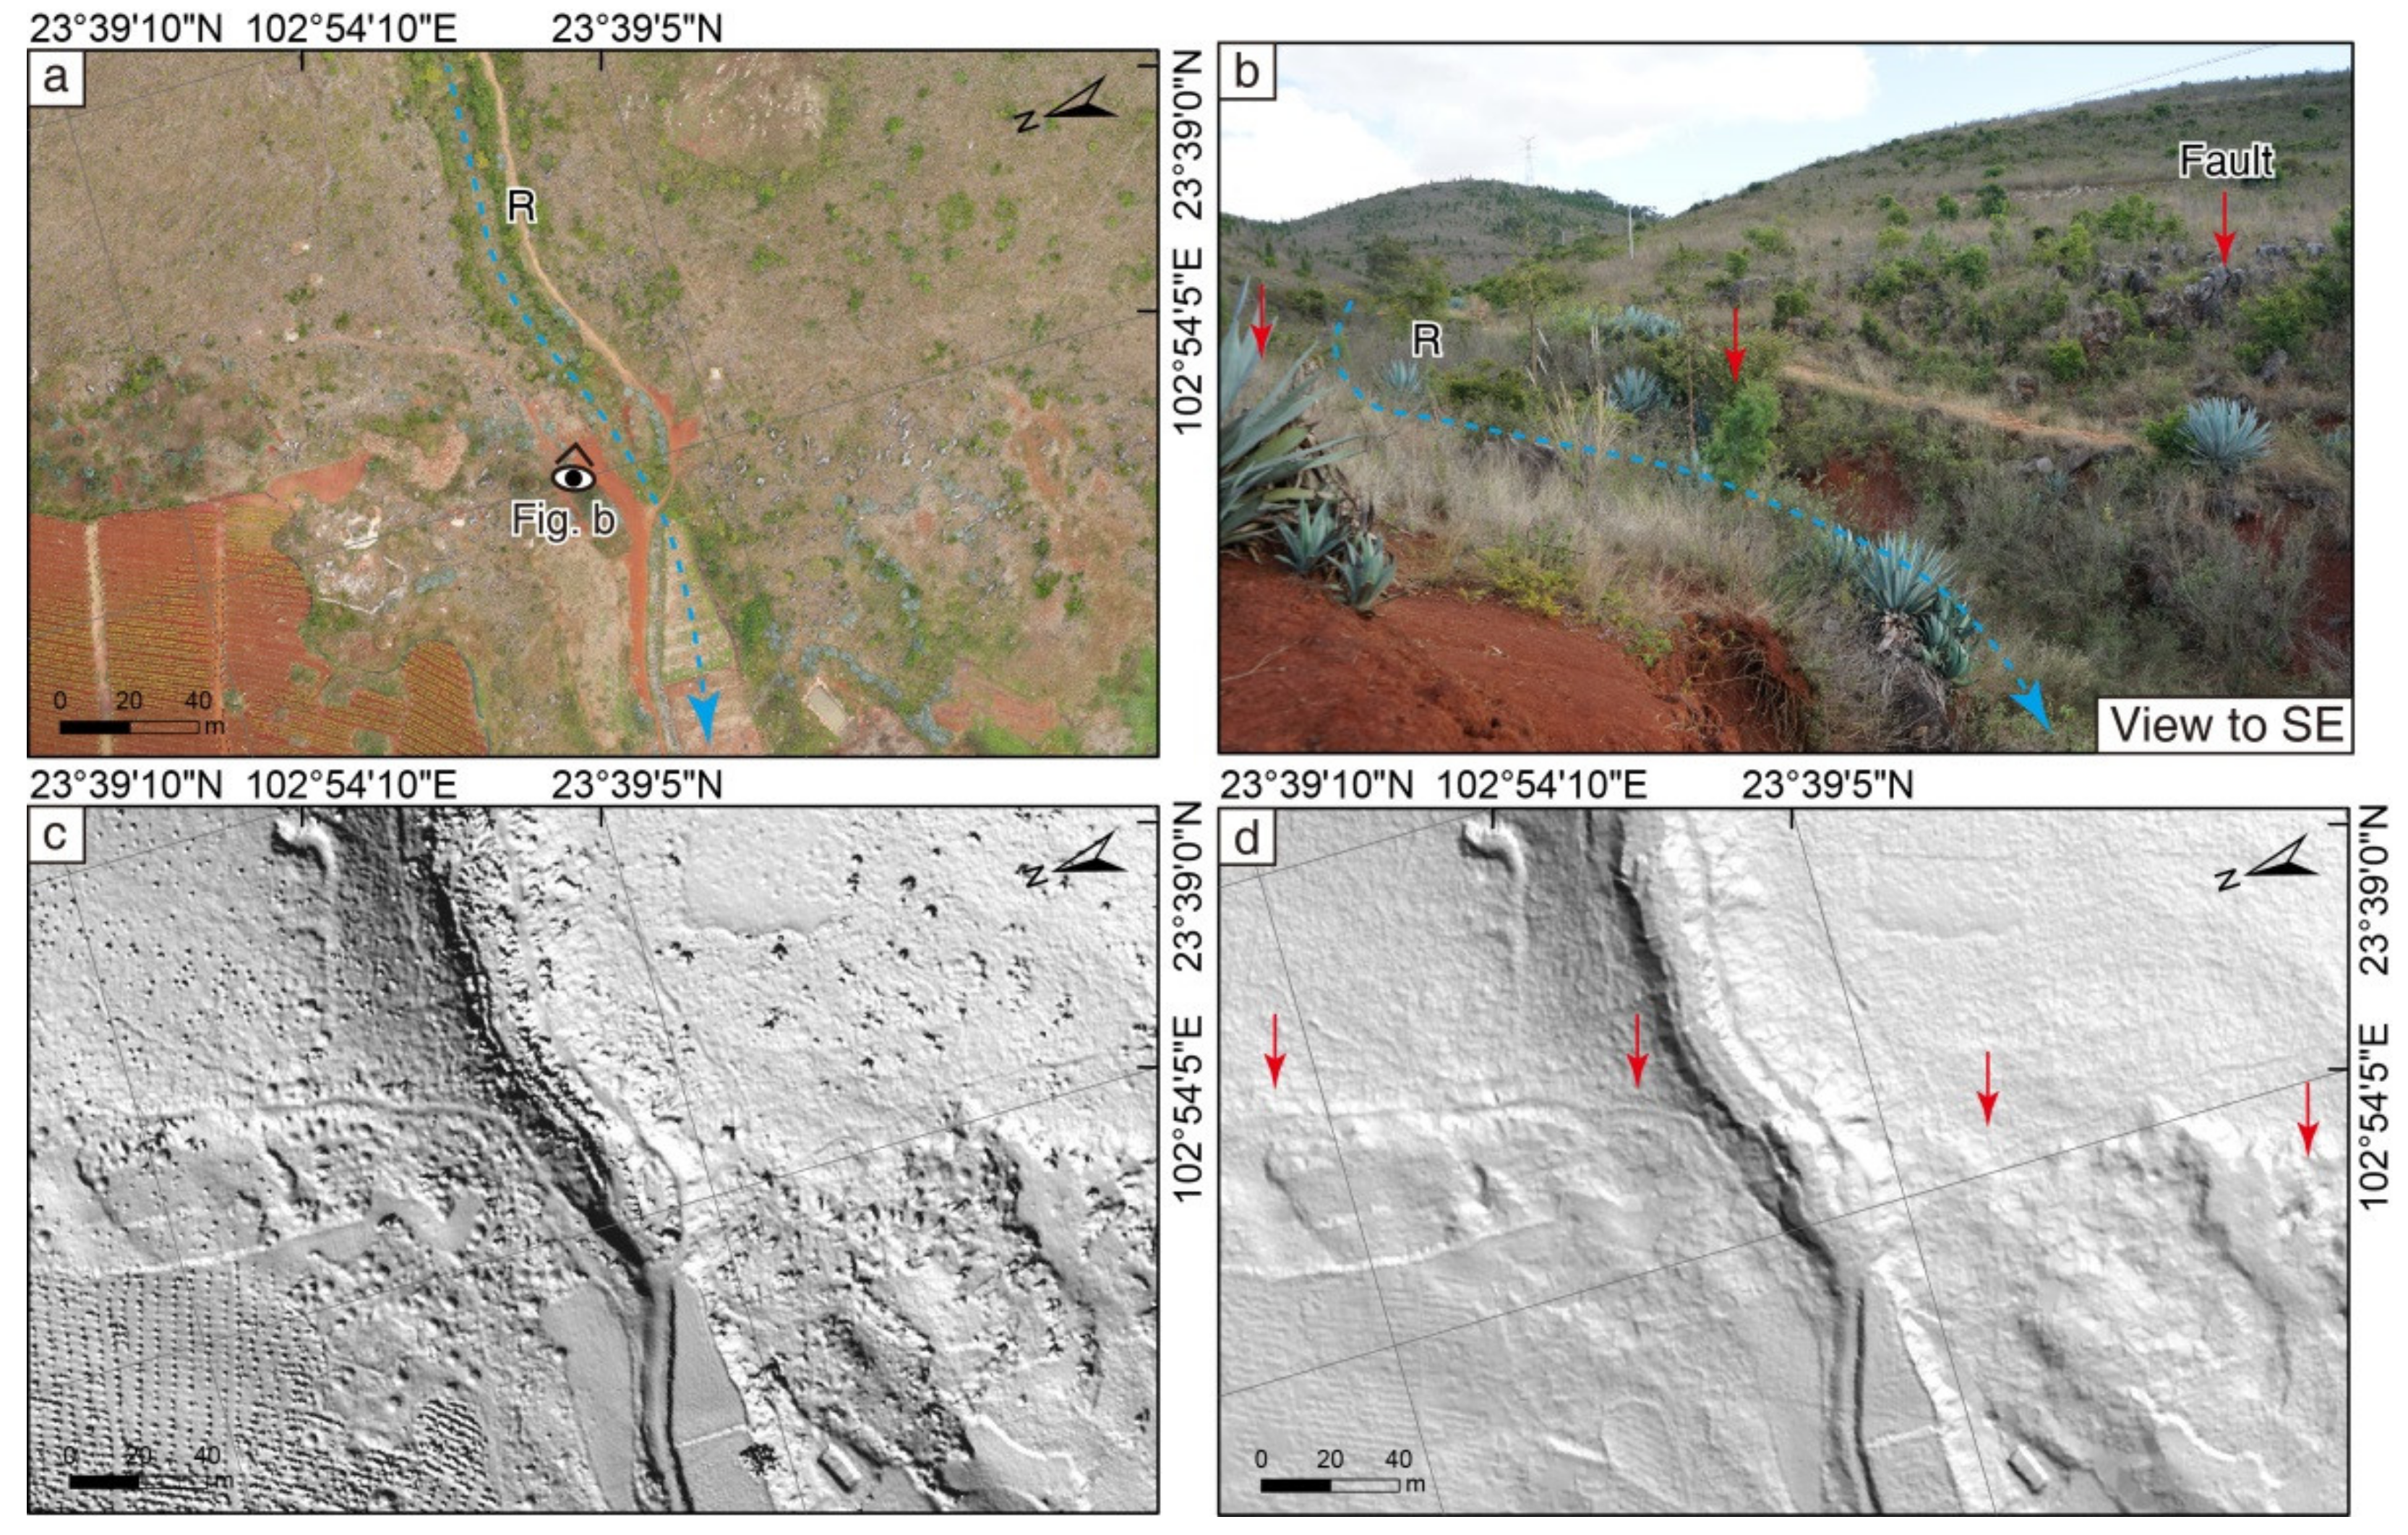
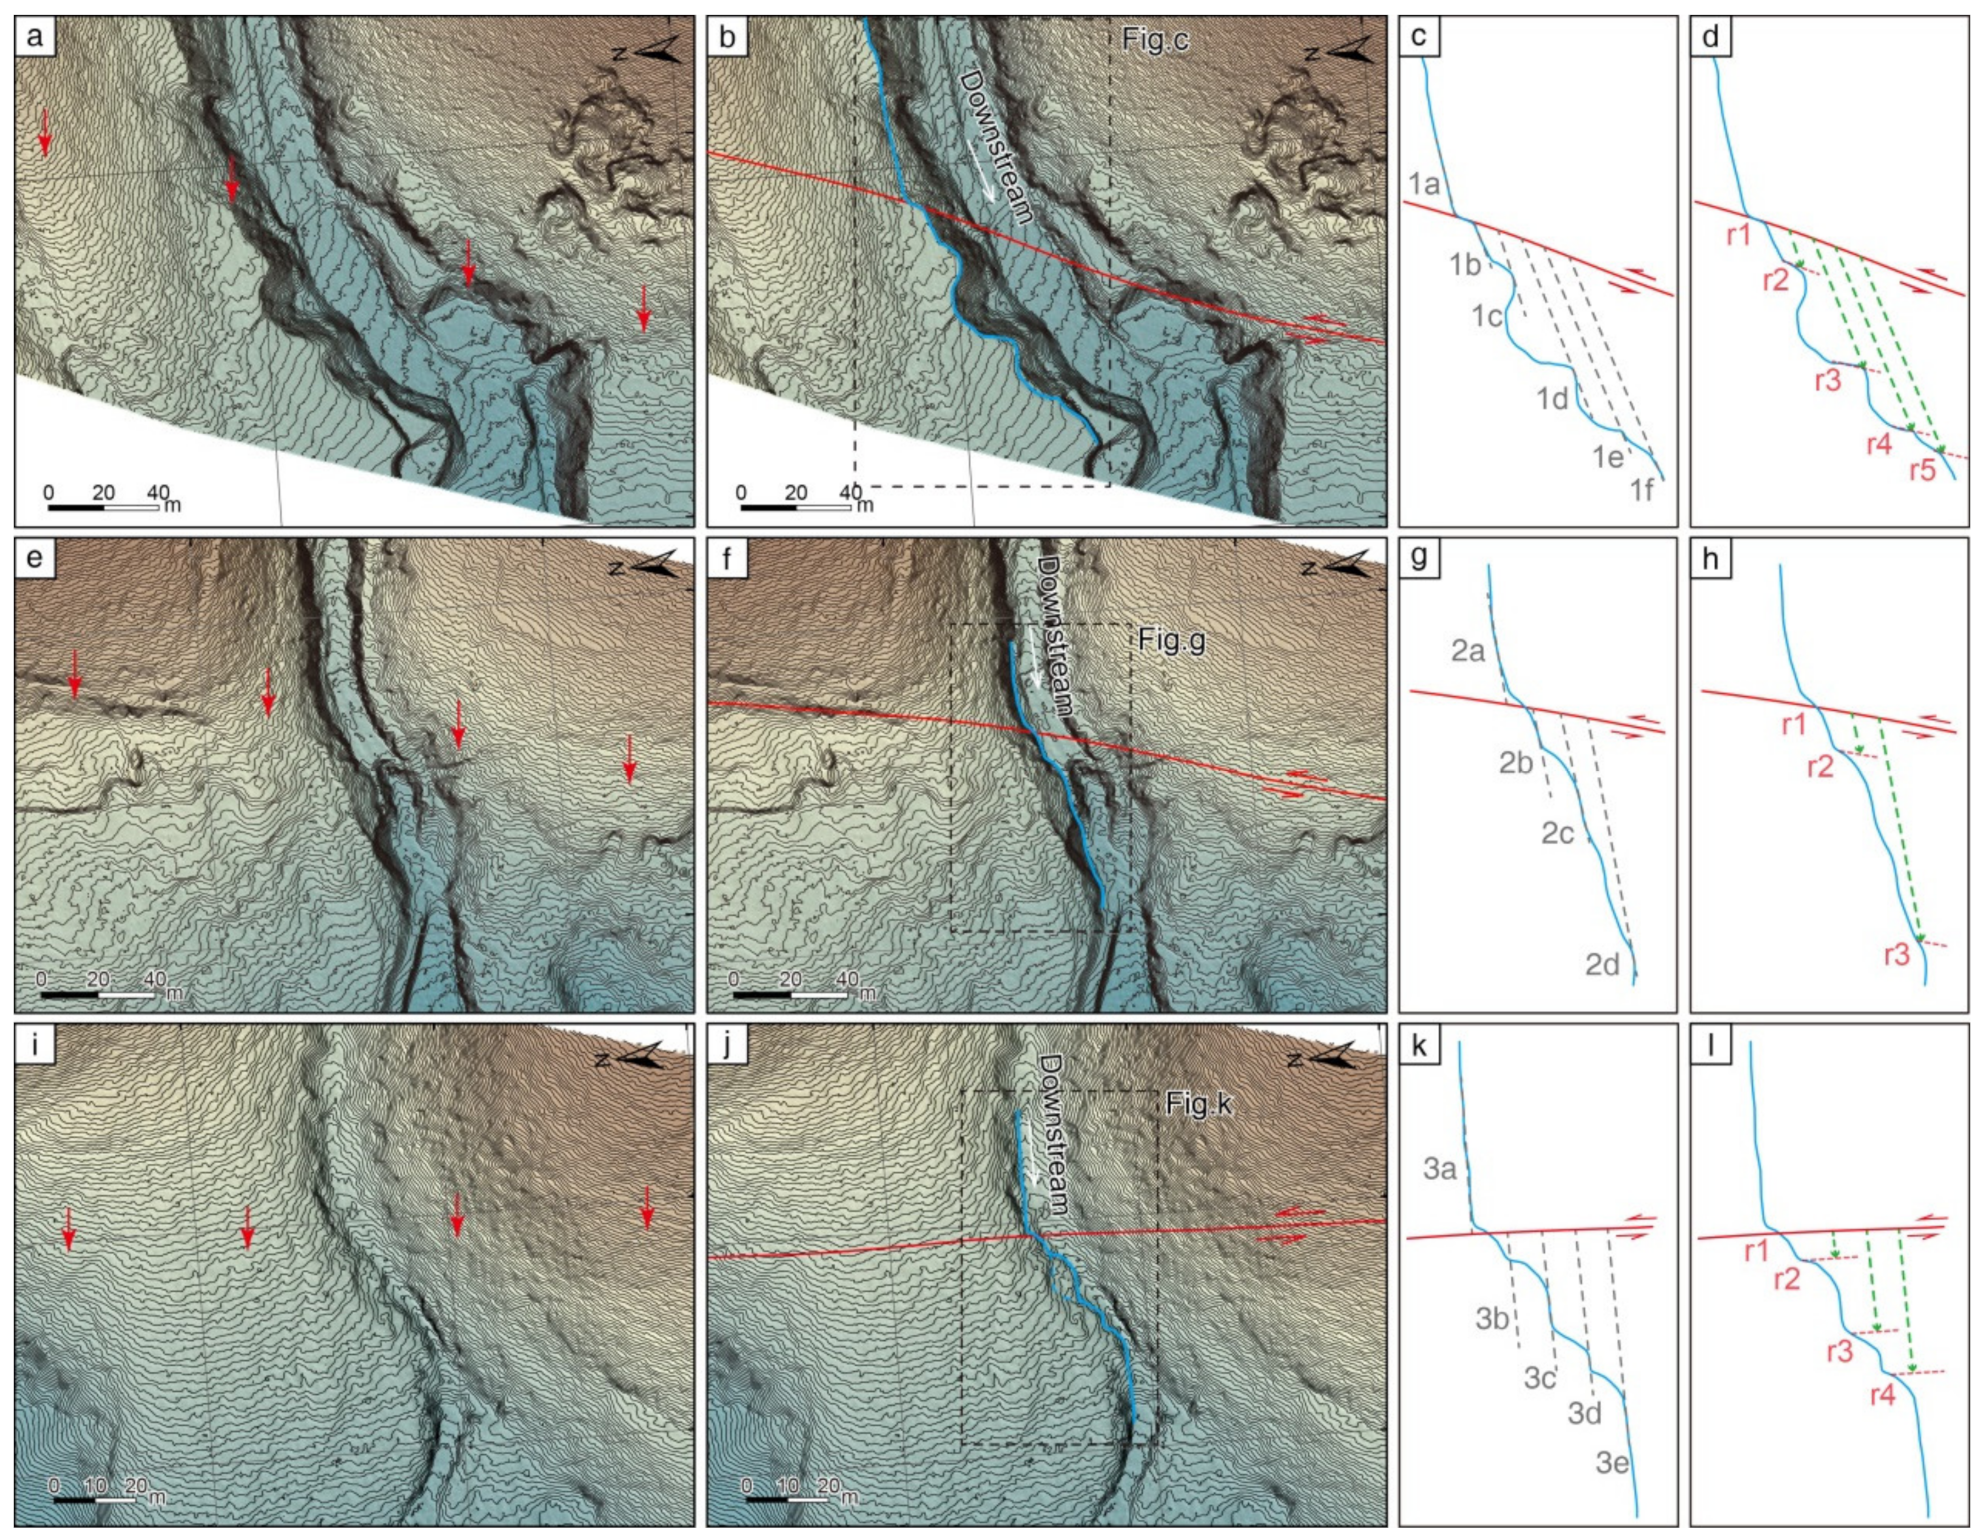
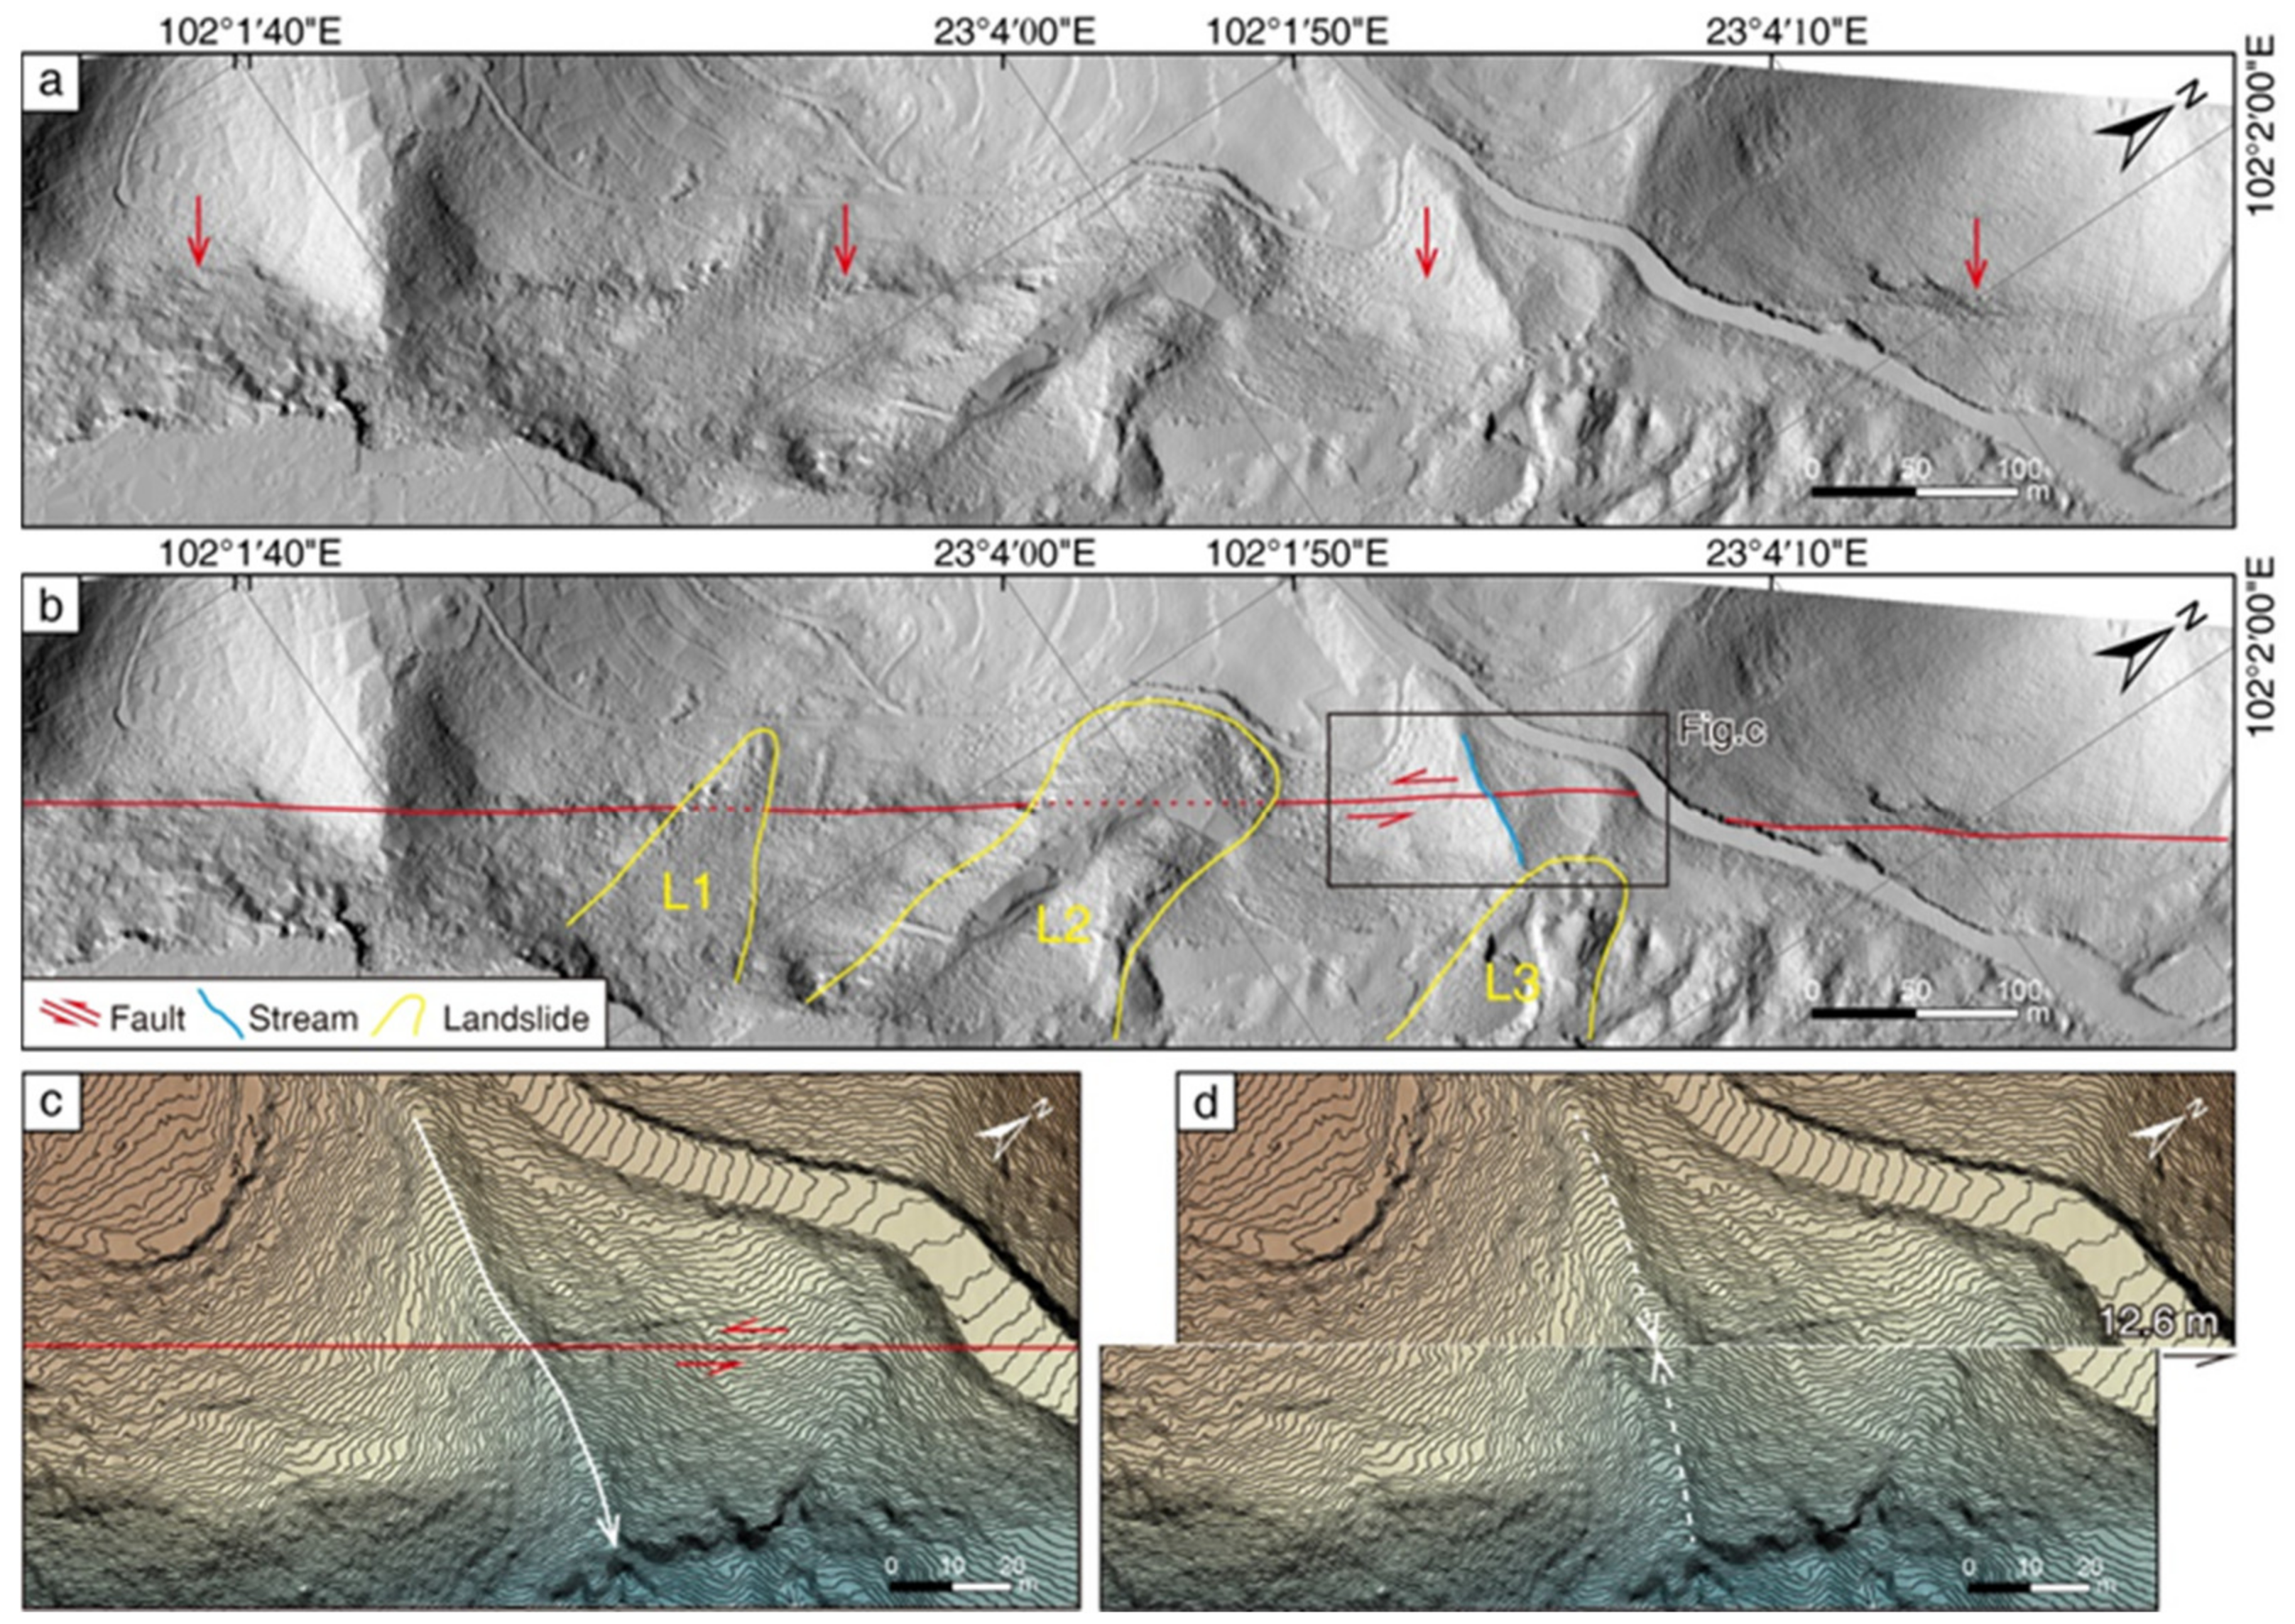
4.1.1. Dongshanzhai Site

The Dongshanzhai site lies in the north-central part of the fault, near the northeast side of Jianshui County (Figure 2b). The fault is located between the Jianshui basin to the west and the low mountain area to the east. Three large streams, marked R1, R2, and R3, flow westward along the slope from the mountainous area to the basin area (Figure 4). They are seasonal streams that developed in the limestone bedrock overlain by thin, weathered red clay. The material carried by the flowing water is mainly red clay. The slope of the stream bed is relatively gentle with a slope angle of about 6°. Although the catchment areas of these three streams are slightly different, they are all small and within one square kilometer. Only one terrace is developed on the left bank of stream R1, and no terraces are present on both banks of streams R2 and R3 (Figure 4), indicating a weak undercut and lateral erosion.
Several small streams are incised into the thin, weathered red clay overlying the bedrock between these large streams. The faulted landforms in this site are well developed. The streams, terraces, and ridges are left-laterally offset by varying amounts by the fault (Figure 4). Based on a detailed interpretation of the lidar images, twelve pairs of offset markers were identified.
The left-lateral offset of the upper edge of the riser on the true right bank of stream R1 is well preserved (Figure 5a,b). The left-lateral offset is composed of five inflections distributed downstream in a stair-stepped pattern. The channel riser sections on both sides of the inflections extend onto the fault to form piercing points. The displacement of offset riser pair 1a/1b was measured to be 6.8 ± 0.6 m, which was attributed to the offset from the latest event. The offsets of four other pairs of offset risers, 1a/1c, 1a/1d, 1a/1e, and 1a/1f, were found to be 13.7 ± 1.7, 21.4 ± 2.6, 30.6 ± 3.5, and 38.5 ± 4.3 m, respectively (Figure 5a–c), and these values were interpreted to represent multievent cumulative offsets. These offsets are multiples of the offset from the latest event. The first inflection, r1, of the stream channel riser is located close to the fault. The four downstream inflections, r2, r3, r4, and r5, sub-parallel with the fault, are about 13, 45, 67, and 75 m away from the fault, respectively (Figure 5d), and these values were interpreted as reflecting the amount of downstream erosion of the inflections caused by flowing water. The distance differences between inflections r1 and r2, r2 and r3, r3 and r4, and r4 and r5 are about 13, 32, 22, and 8 m, respectively.
The riser on the right bank of stream R2 near the fault is well preserved, and the riser far away from the fault has been artificially modified. Similarly, the left-lateral offset of the riser consists of three inflections (Figure 5e,f). The different sections of the offset riser extend onto the fault, and the offsets of offset riser pairs 2a/2b, 2a/2c, and 2a/2d are 6.1 ± 0.6, 12.1 ± 1.4, and 18.6 ± 1.8 m, respectively (Figure 5e–g). The first inflection, r1, of the upstream channel is near the fault, and the inflections r2 and r3 are about 14 and 52 m downstream from the fault (Figure 5h), respectively. The distance difference between the adjacent inflections r1 and r2 and between r2 and r3 is about 13 and 39 m, respectively. The left-lateral offset of the riser on the right bank of stream R3 consists of four inflections, and the offsets of riser markers 3a/3b, 3a/3c, 3a/3d, and 3a/3e are 5.9 ± 0.5, 12.1 ± 1.3, 18.4 ± 2.1, and 24.3 ± 2.6 m, respectively (Figure 5i–k). Three inflections, r2, r3, and r4, sub-parallel with the fault, are about 4, 16, and 22 m downstream from the fault. The distance differences between inflections r1 and r2, r2 and r3, and r3 and r4 are about 4, 12, and 6 m, respectively (Figure 5l).
The three streams, R1, R2, and R3, show similar offset characteristics. The left-lateral offset of the riser on the right bank is composed of multiple continuous inflections produced by the fault offsets, which are distributed downstream in a stair-stepped manner (Figure 4 and Figure 5).

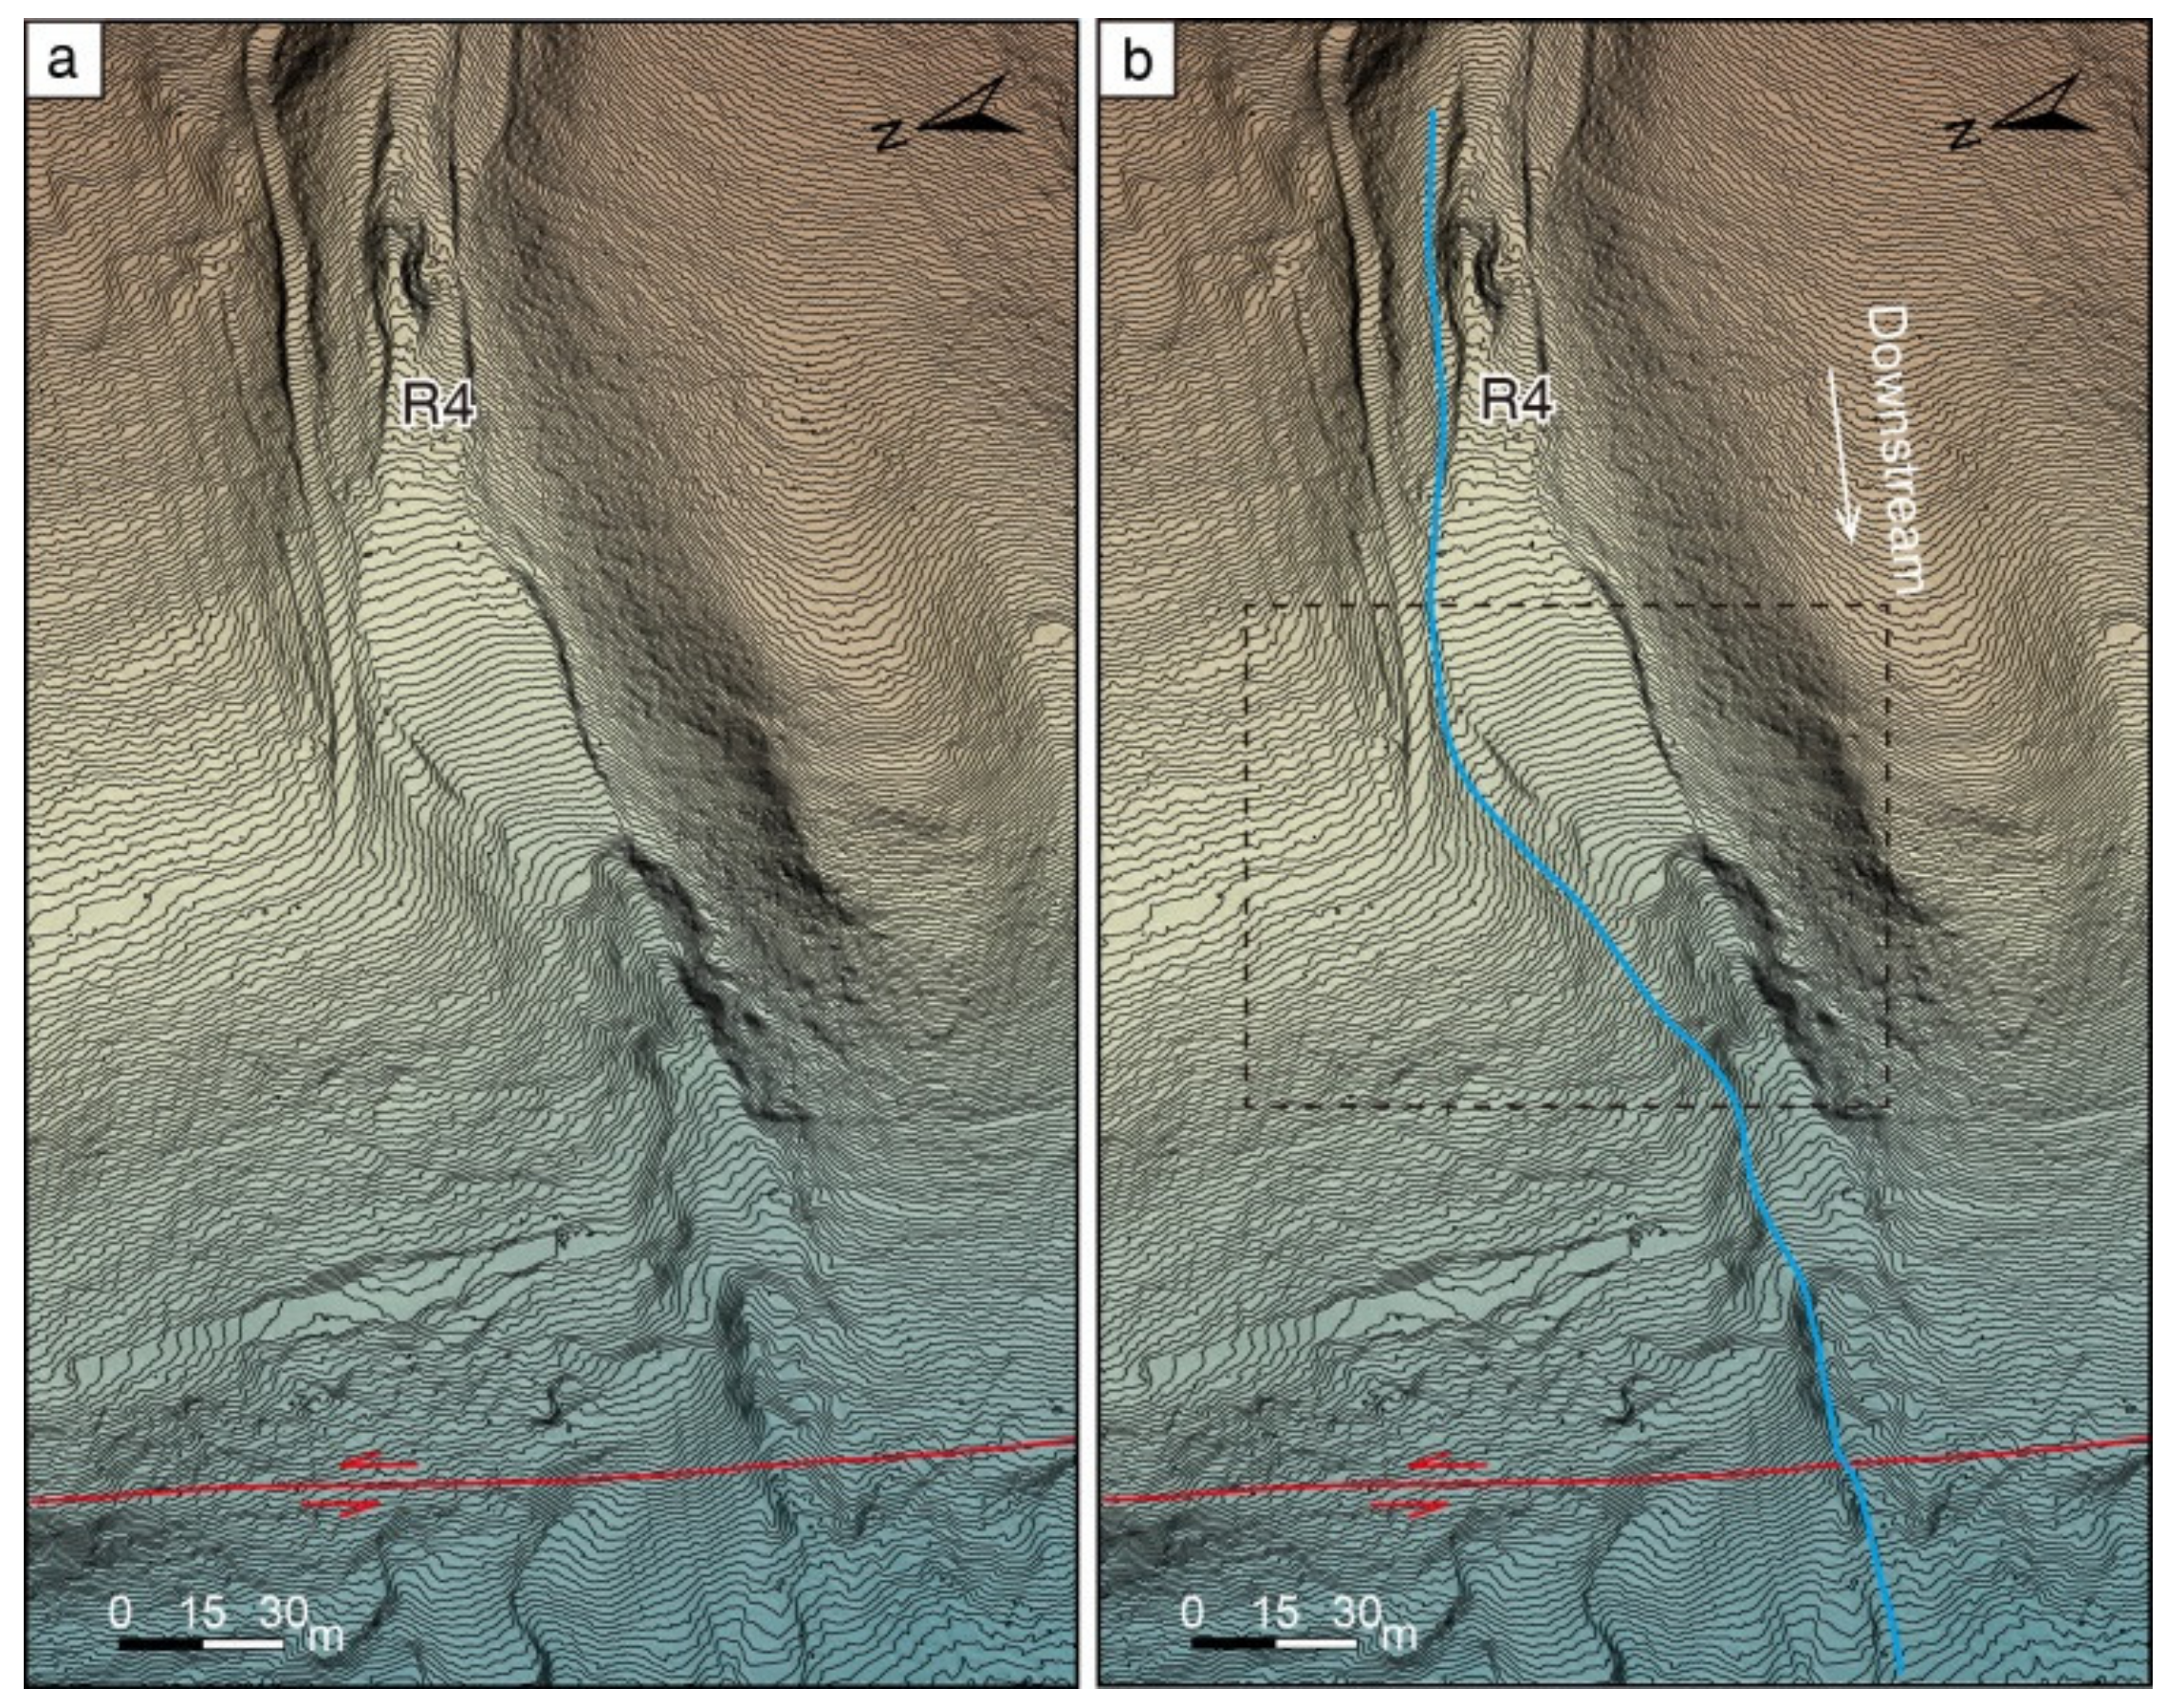
4.1.2. Shenxiandong Site
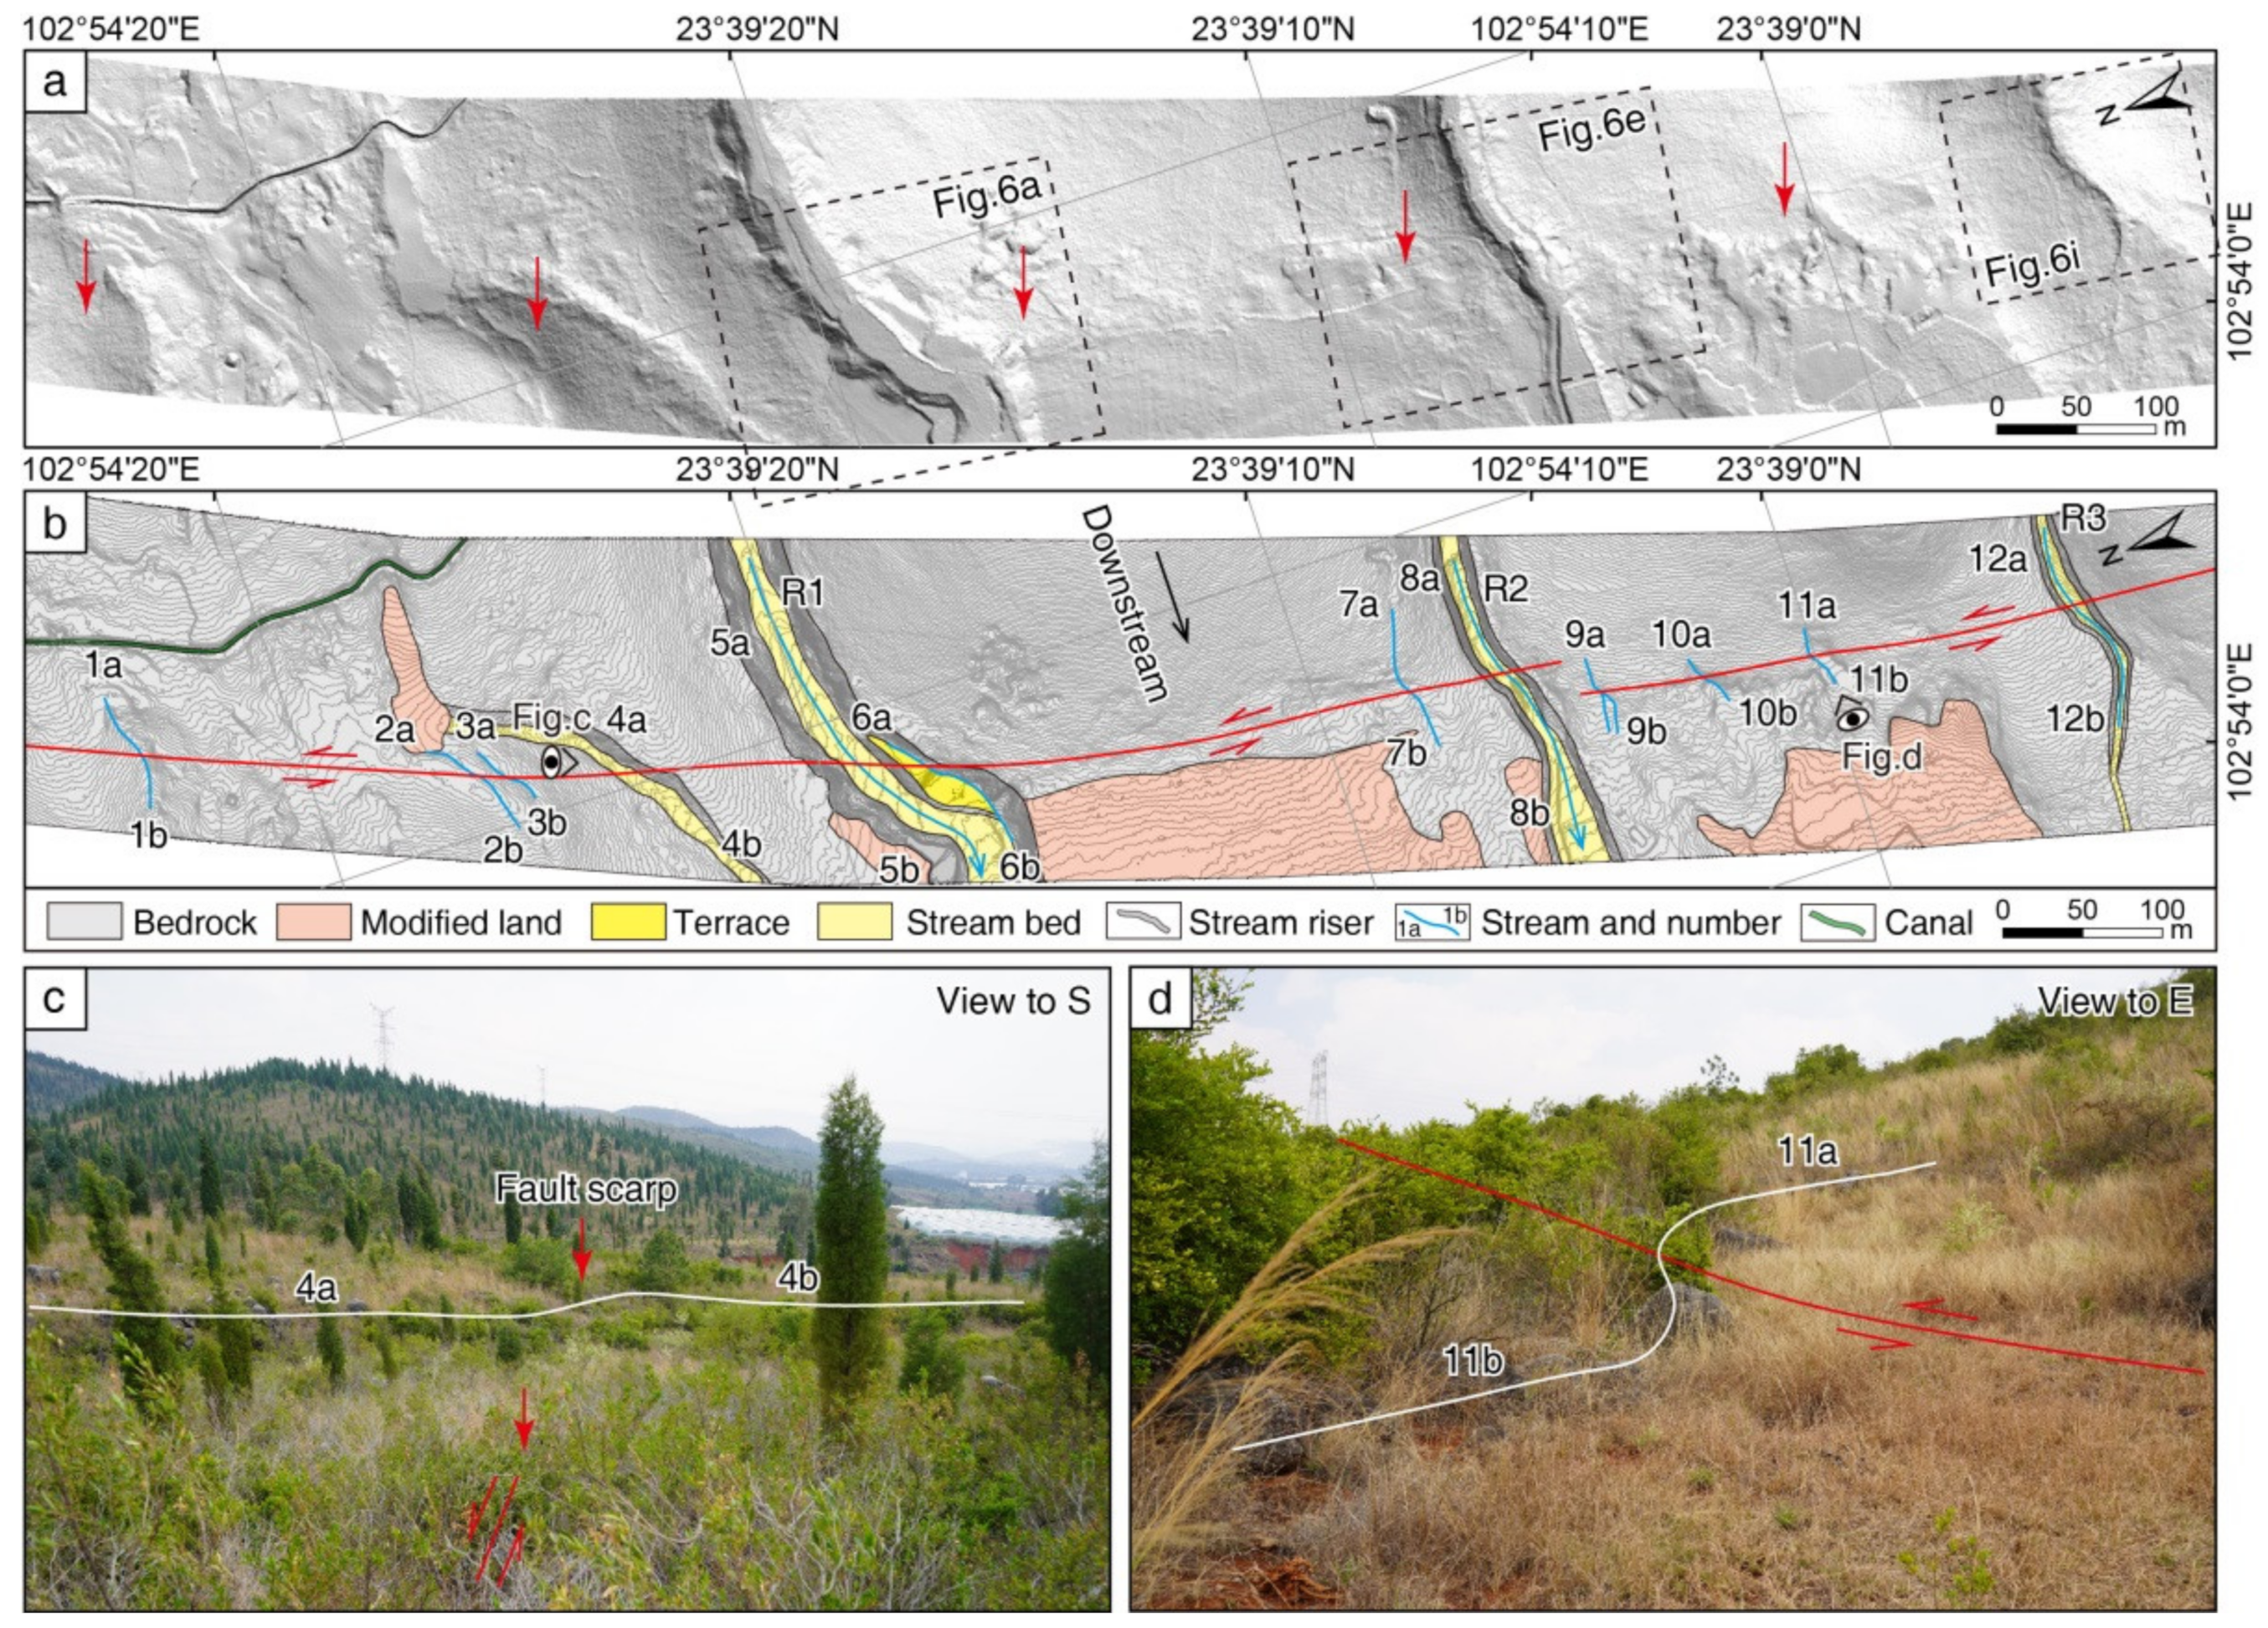
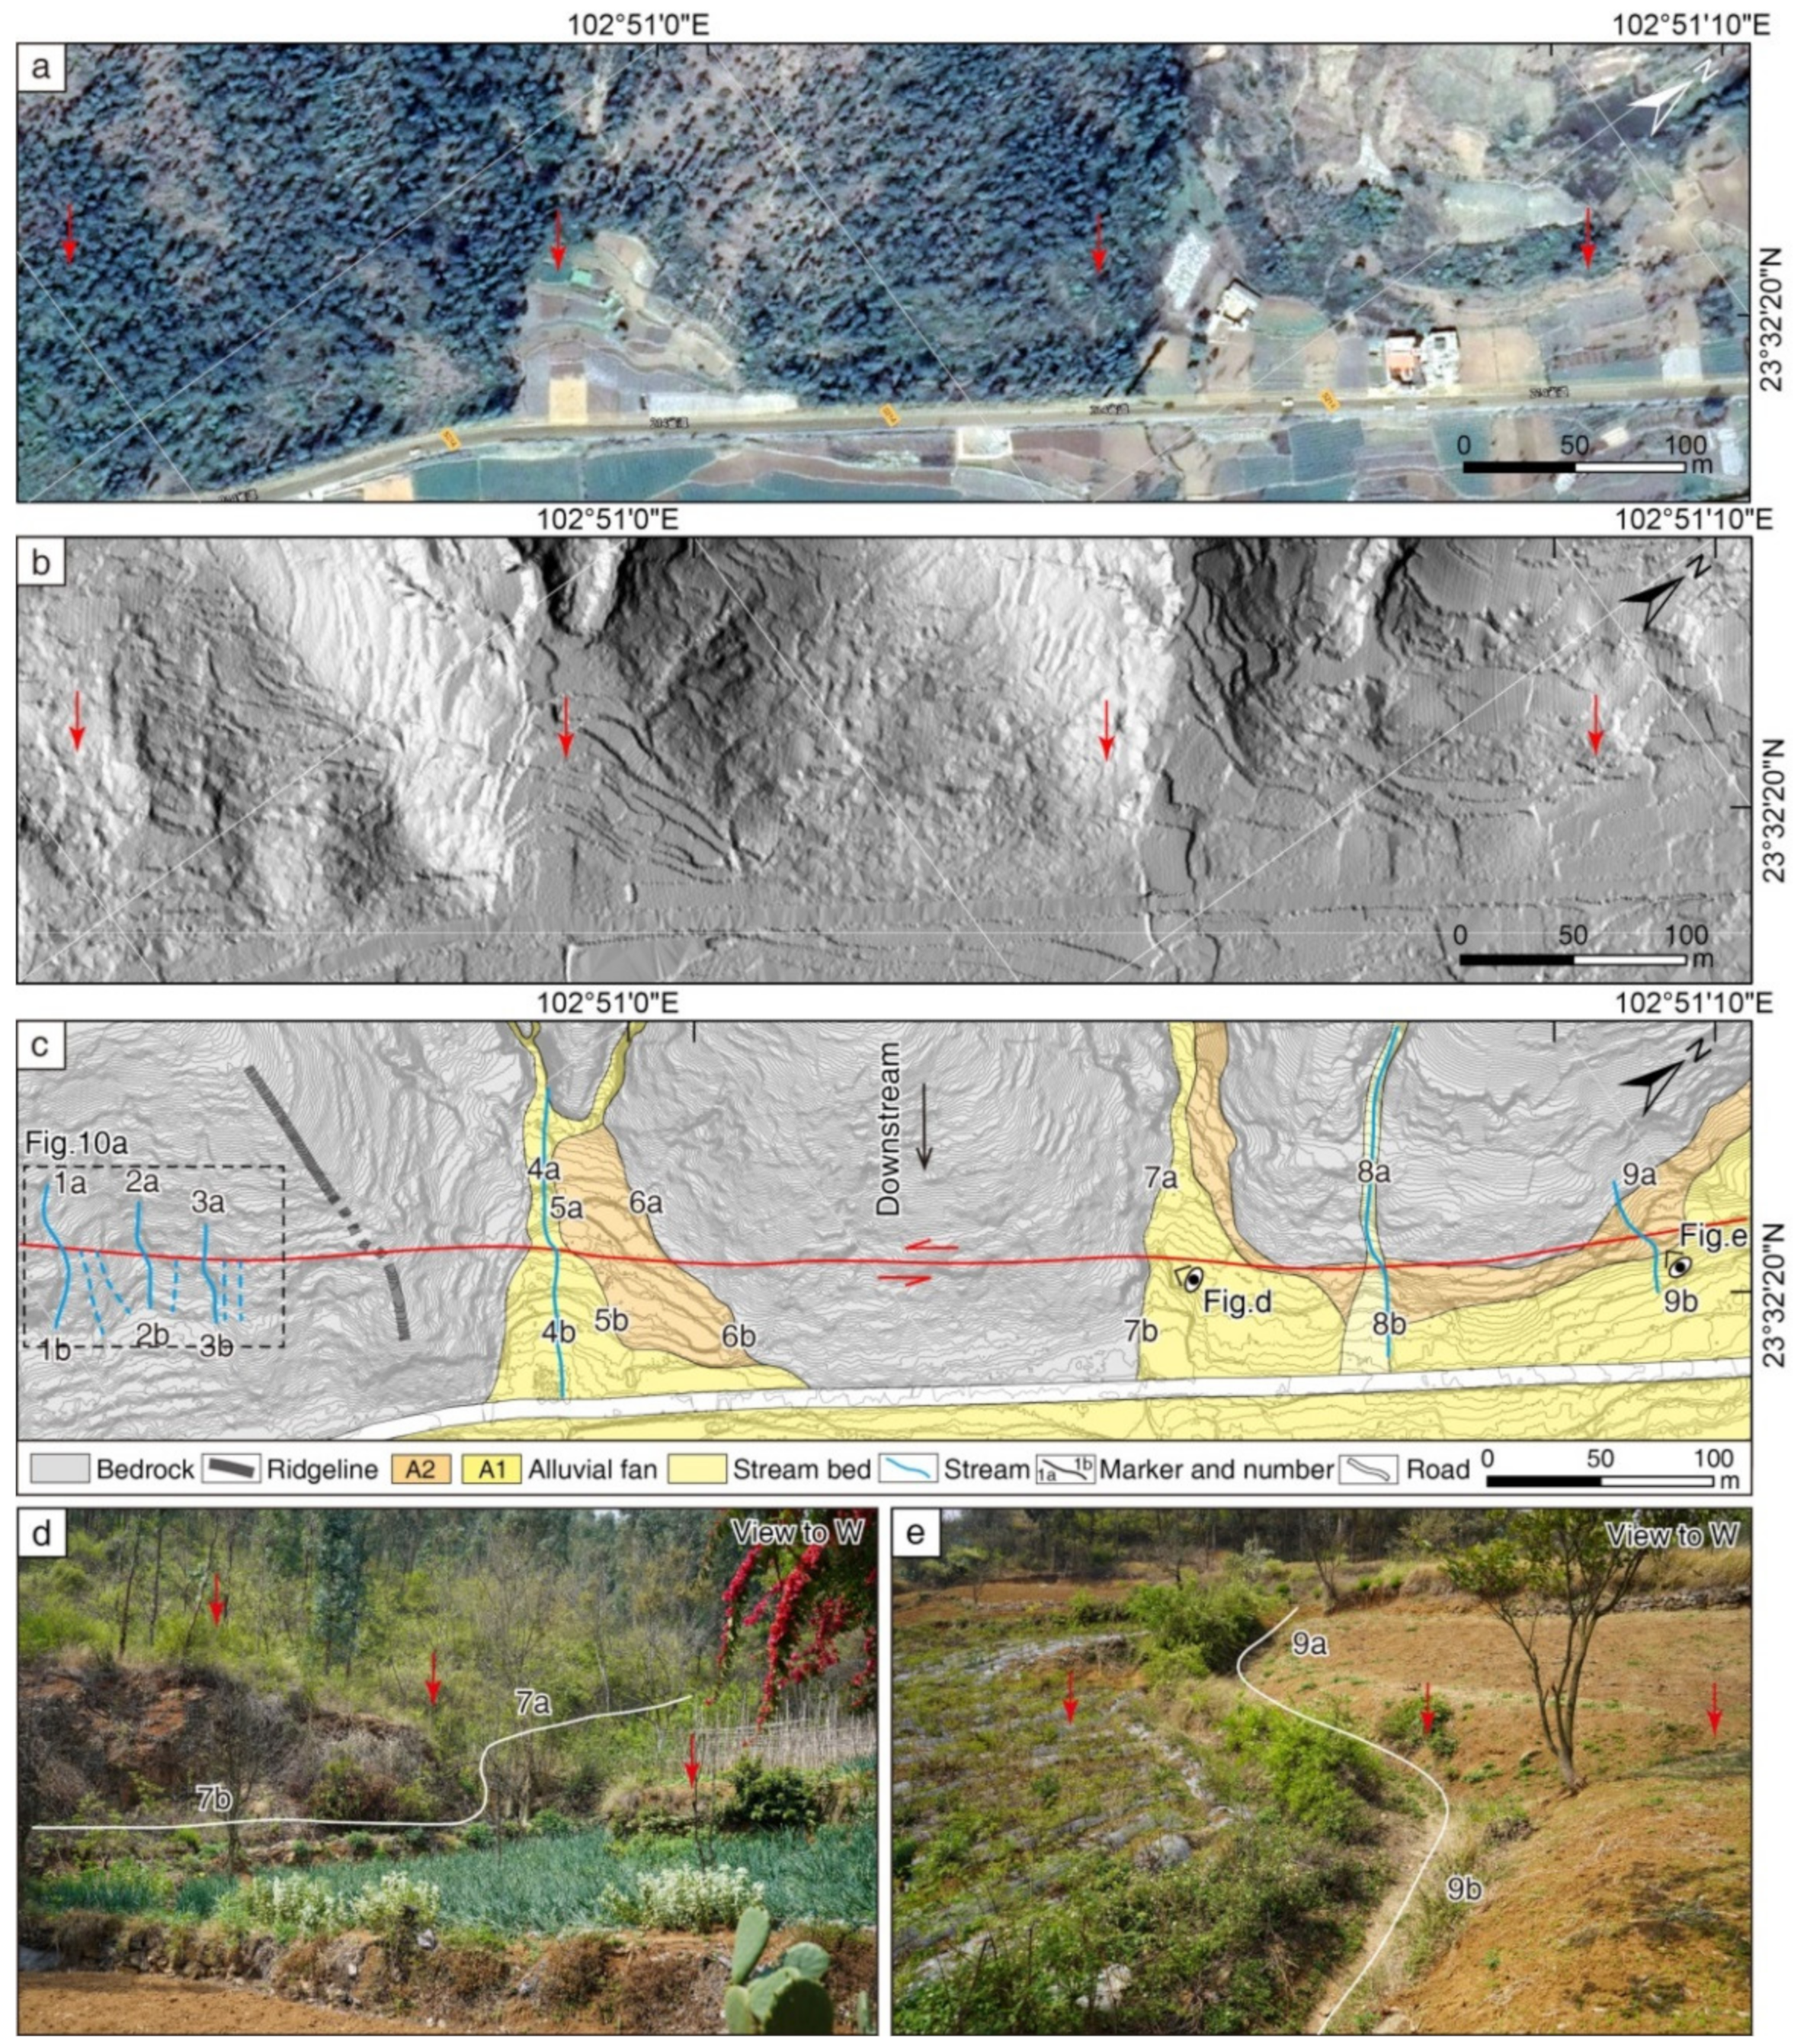
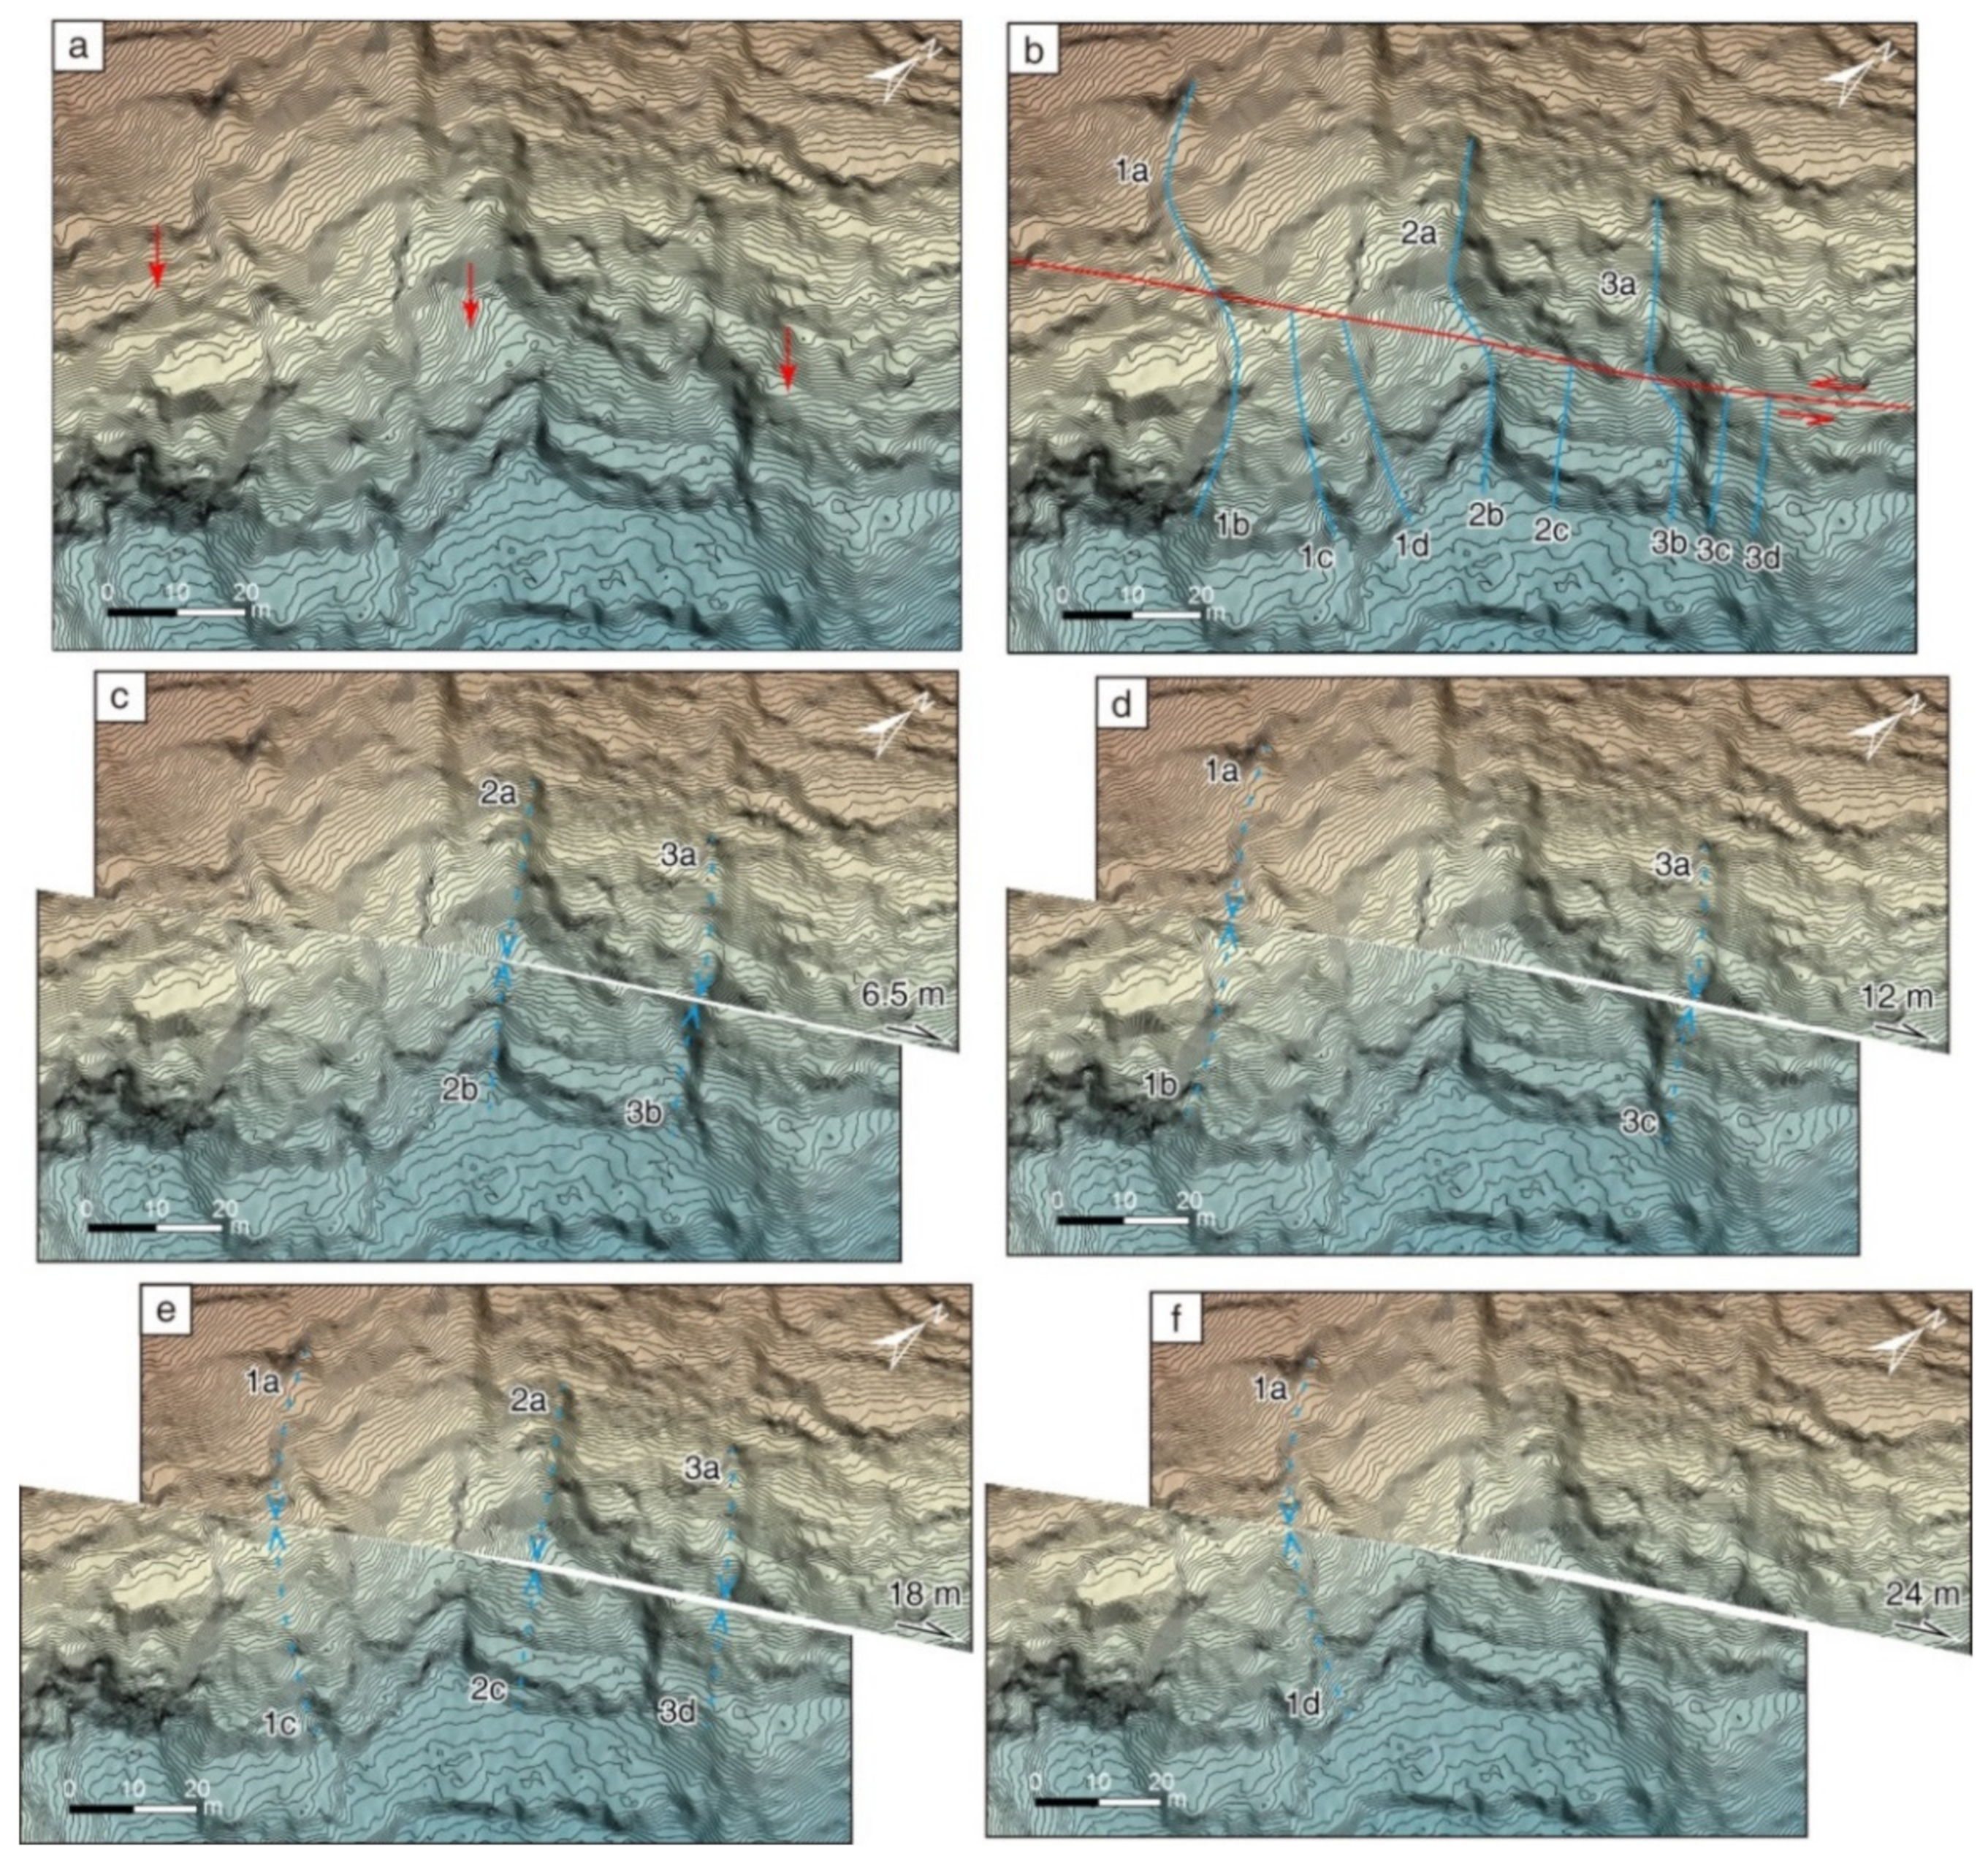
The Shenxiandong site is located in the central part of the fault (Figure 2). The fault appears as a clear seismic surface rupture zone on the hillshade map without vegetation. The linear fault scarps developed along the fault (Figure 6a). Three landslides are distributed along the surface rupture, and there is no deformation of the landslide body (Figure 6b). It is inferred that the landslides might have been earthquake landslides that formed during the latest event. A small stream that developed between landslides L2 and L3 was found to be offset with a displacement of 12.6 ± 1.2 m (Figure 6c,d).

4.1.3. Xinzhai Site

The Xinzhai site is located on the southern side of the Shenxiandong site (Figure 2). The mountain slopes in this area are covered with dense vegetation, and some geomorphic markers, such as streams, were not recognized on the satellite image (Figure 7a). However, a series of streams flowing from northwest to southeast were identified along the slope on the hillshade map without vegetation (Figure 7b,c). The ridges, streams, and alluvial fans were found to be left-laterally offset by the fault. Fourteen pairs of offset markers were identified along the fault (Figure 7c). The offset markers 7a/7b and 9a/9b were also clearly observed on the field photos.
The three streams in the southern part feature typical offsets (Figure 7c and Figure 8a,b). Stream 1 is clearly offset with a left-lateral displacement of 12.1 ± 1.4 m. Two beheaded streams, 1c and 1d, were found on the left bank, downstream of the fault. The topography of the first stream, 1c, can be clearly identified, and that of the second one, 1d, is not as clear as the first one. The two beheaded streams were interpreted as abandoned streams formed after the offset of stream 1a with displacements of 18.6 ± 2.3 and 24.1 ± 3.5 m, respectively. Streams 2 and 3 are synchronously left-lateral offset by 6.9 ± 0.8 and 5.6 ± 0.7 m, respectively. A beheaded stream, 2c, was found on the left bank of stream 2 downstream of the fault and was interpreted as an abandoned stream formed after the offset of stream 2, with a displacement of 18.2 ± 2.1 m. Two beheaded streams, 3c and 3d, were identified on the left bank of stream 3 downstream of the fault and were classified as abandoned streams formed after the offset of stream 3. They are offset by 11.4 ± 1.3 and 17.3 ± 1.9 m, respectively.
When the topographic map was back-slipped with a displacement of 6.5 m along the fault, streams 2a/2b and 3a/3b roughly aligned (Figure 8c). Similarly, streams 1a/1b and 3a/3c aligned when the map was back-slipped 12 m (Figure 8d). The back-slipped displacement of 18 m also made streams 1a/1b, 2a/2c, and 3a/3d align (Figure 8e). Stream 1a/1d could recover its pre-earthquake morphology with a displacement of 24 m (Figure 8f).

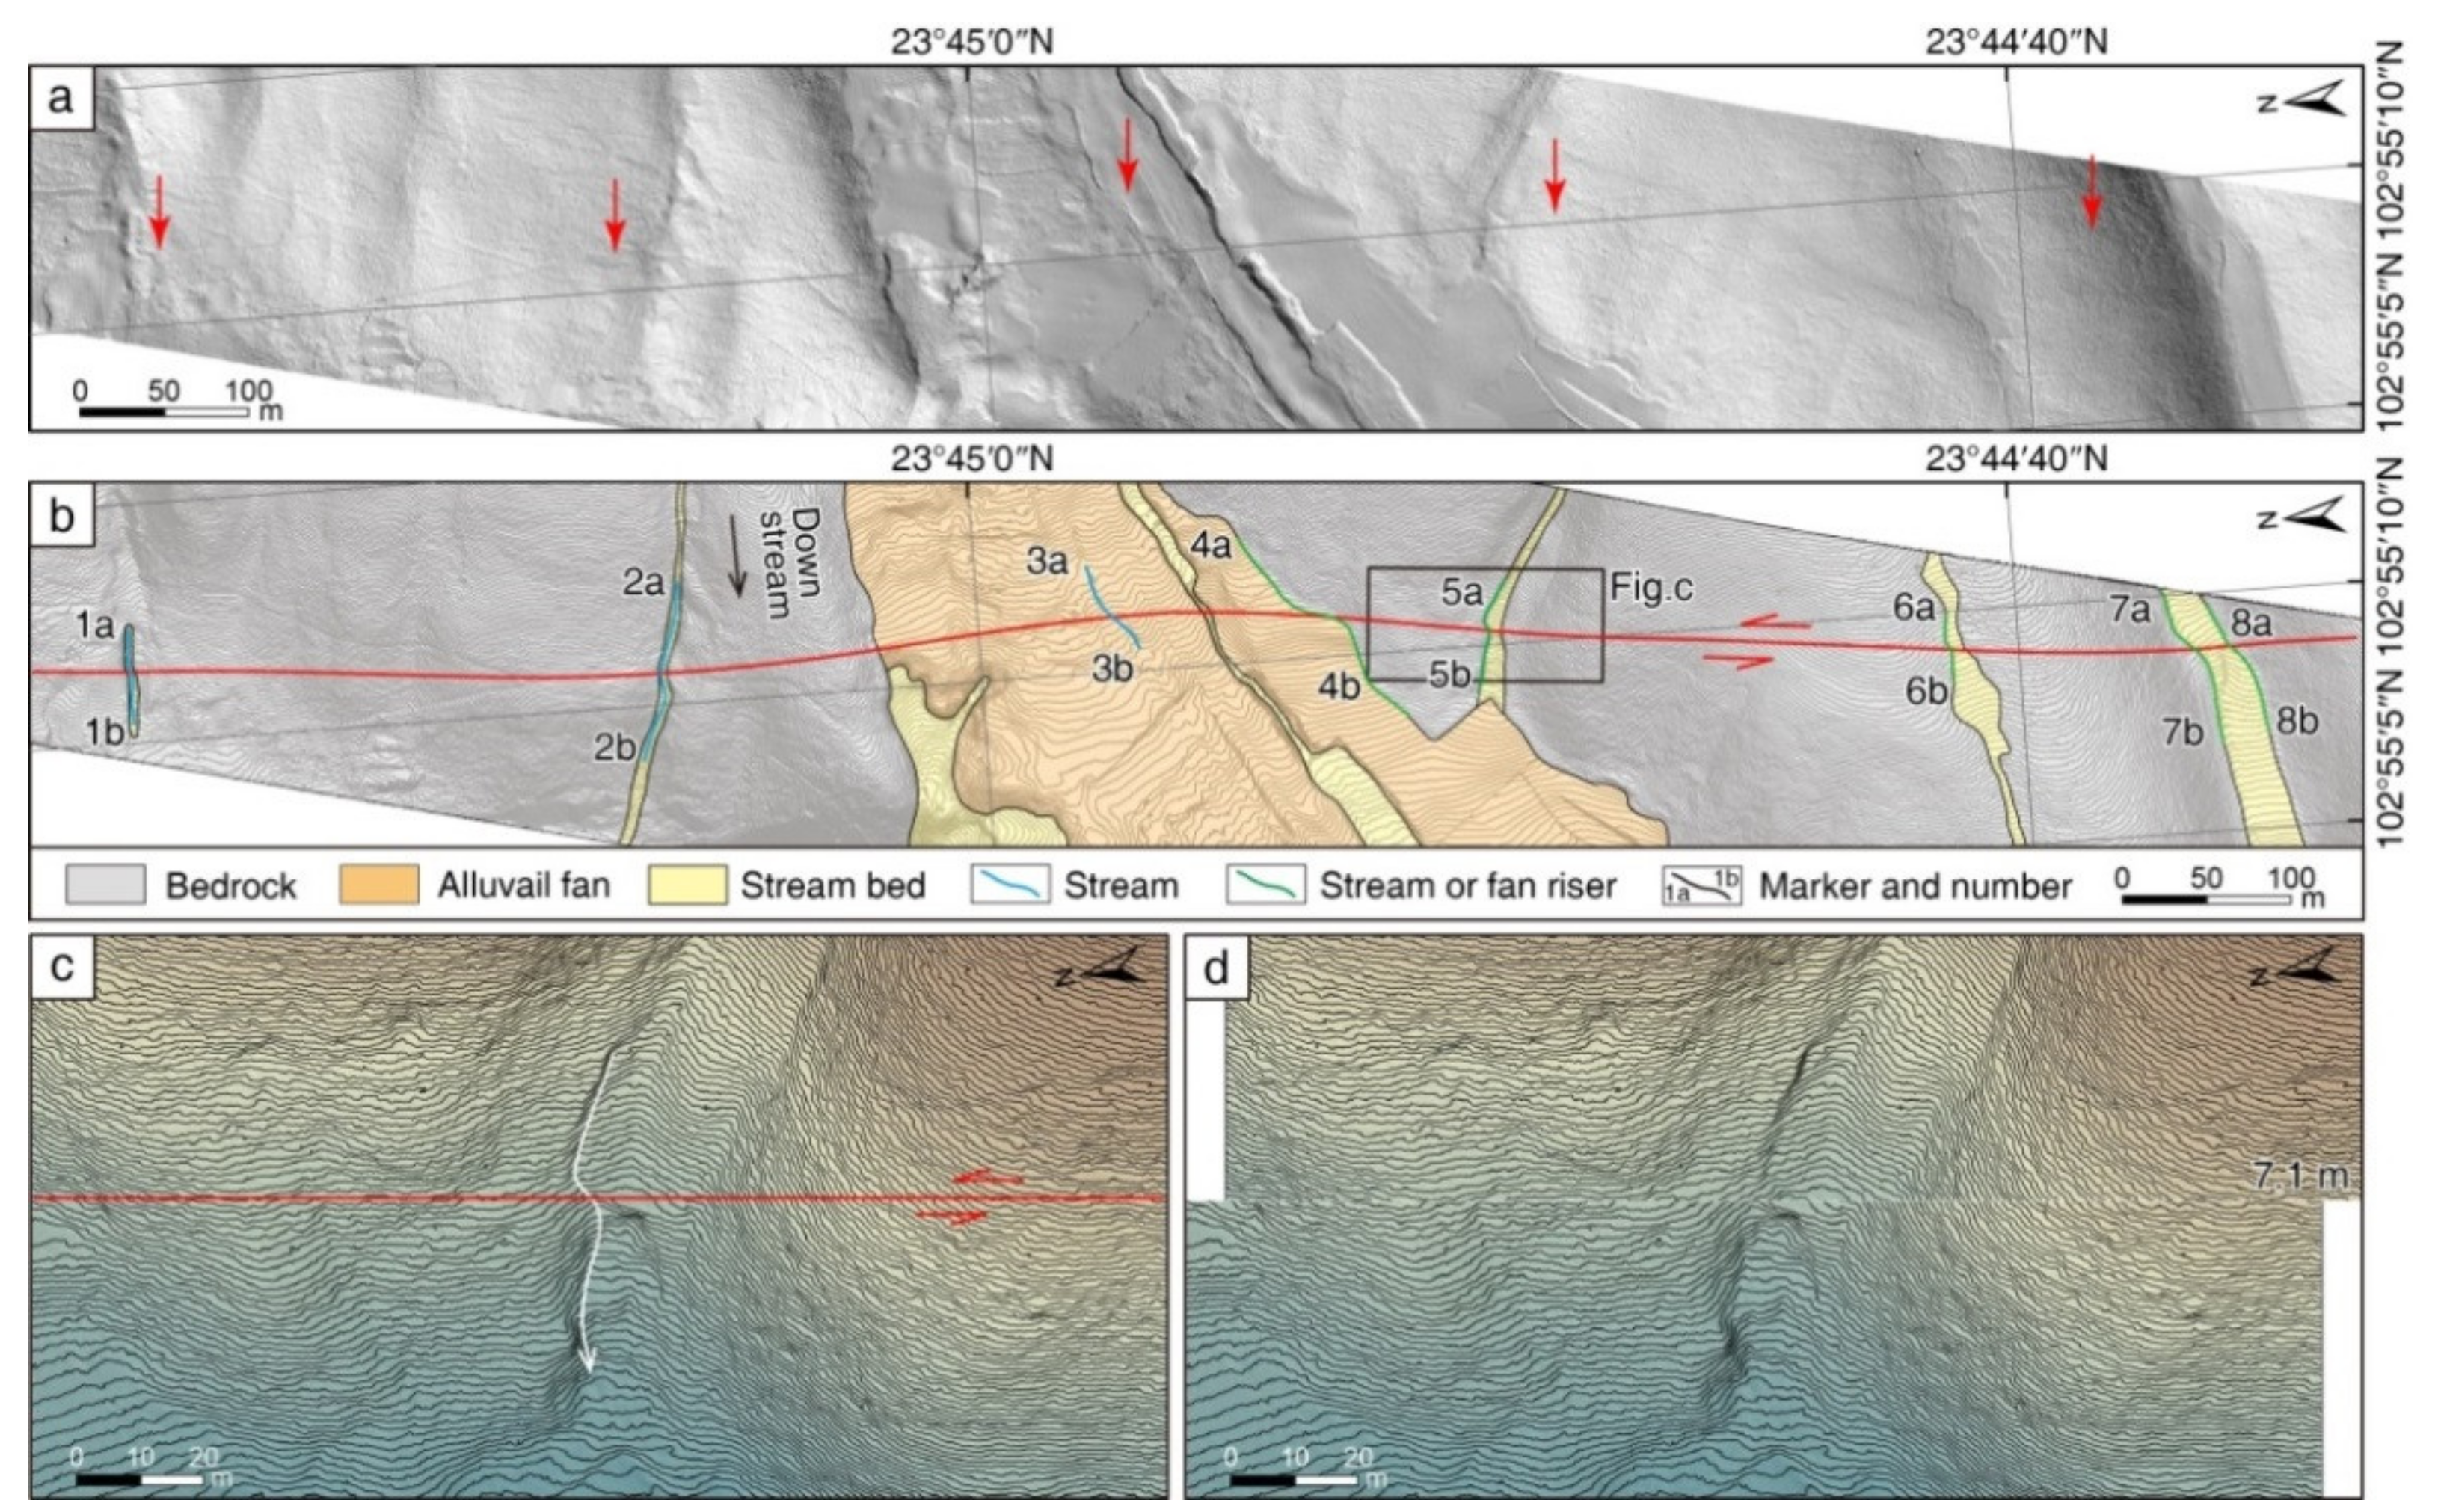
4.1.4. Bagenjiao Site

The Bagenjiao site is located at the northern portion of the fault (Figure 2b). The hillside dips to the west in this area. Several streams flow along the slope from east to west, and one alluvial fan has developed on the central portion of the site (Figure 9a,b). The offset landforms are well developed in this area. The fault cuts the hillside obliquely. The streams, terraces, and ridgelines are left-laterally offset when crossing the fault. By combining high-resolution topographic data interpretation and field investigations, eight pairs of offset markers were identified (Figure 9b). Three streams, 1a/1b, 2a/2b, and 6a/6b, were found to be offset with similar displacements of 4.2 ± 0.3, 4.6 ± 0.5, and 4.3 ± 0.4 m, respectively, and these were classified as offsets of the most recent event (Figure 9a,b). Stream 3a/3b was found to be offset by 9.3 ± 0.7 m. When the topographic map was back-slipped with a displacement of 7.1 ± 0.8 m along the fault, the right riser of stream 5a/5b roughly aligned (Figure 9c,d). The two risers of streams 7a/7b and 8a/8b were found to be offset by 14.2 ± 1.8 and 13.2 ± 1.7 m, respectively. The riser of alluvial fan 4a/4b was found to be offset with a displacement of 19.2 ± 3.4 m.

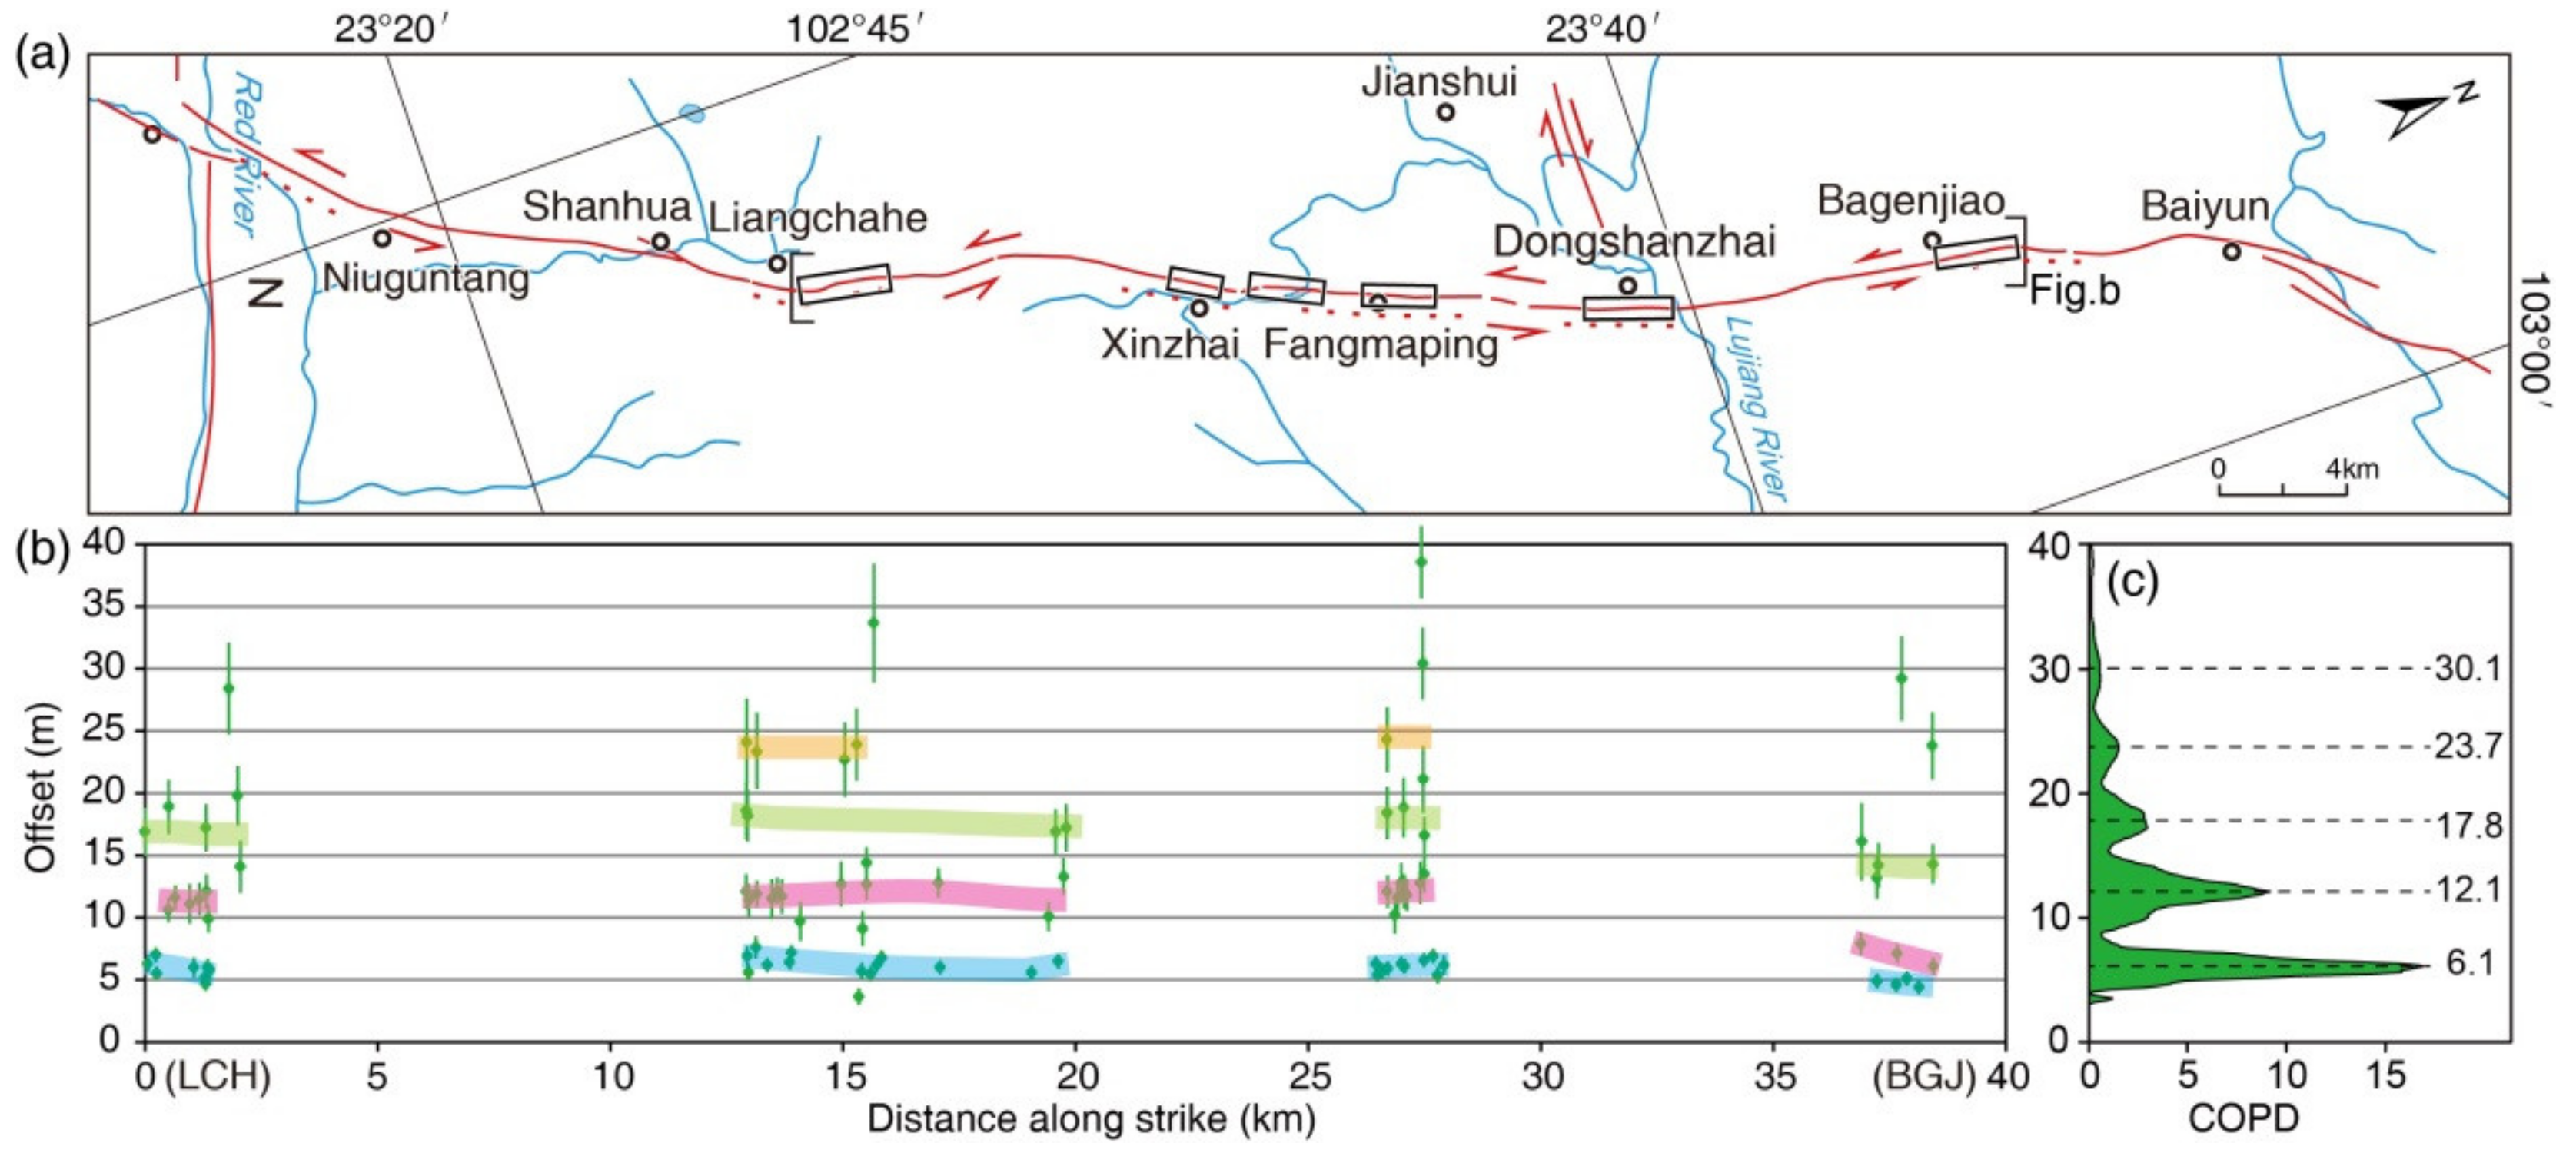
4.2. Offset Distribution

Based on the systematic interpretation and analysis of the lidar images, 92 pairs of offset markers were identified and measured (Figure 10a). The offset ranking grades 1, 2, and 3 accounted for 56.5%, 37.0%, and 6.5% of the total dataset, respectively. Offsets of less than 40 m in different sections of the fault formed clusters on the offset distribution map. The clusters in sections from 0–3 km, 12–20 km, and 26–28 km were relatively obvious, while the offset cluster in the 36–39 km section was not. On the other hand, the lidar images did not cover the two ends of the fault where the slip distribution is not constrained.
In order to further understand the offset clusters of the fault and the relationship between the offset clusters, the cumulative offset probability density (COPD) was calculated for all offsets, and a COPD distribution map was obtained (Figure 10b). The map shows that there are five probability density peaks, and these peaks decrease correspondingly with an increase in displacement, as indicated by the offset clusters. The offsets corresponding to the first, second, third, fourth, and fifth probability peaks are 6.1, 12.1, 17.8, 23.7, and 30.1 m, respectively.

5. Discussion

5.1. Spatial Distribution of the Fault Slip

The risers on the true right banks of the three streams, R1, R2, and R3, show similar offset characteristics at the Dongshanzhai site. The left-lateral offset is composed of multiple continuous inflections that are distributed downstream in a stair-stepped manner (Figure 5). The inflections of the stream risers are likely to have formed due to multiple fault branches, stream hydrology events like floods, or the interaction between the faulting offset and fluvial erosion. The fault was mapped in the field investigations and with high-resolution topographic maps, and it features one fault branch. Thus, the inflections are less likely to be the result of multiple fault branches. The stream risers of R1 resulting from the faulting, r2–r3, r3–r4, and r4–r5, might be eroded by flowing water, causing the risers to bend outwards (Figure 5). However, due to the smaller catchment areas and weaker fluvial erosion, the stream risers of R2 and R3 do not show the phenomenon of outward erosion (Figure 5).
To better understand the impact of faulting on the bend shape, we found a stream, R4, near Bagenjiao town that has a bend that has not crossed a fault (Figure 2b). The stream also developed in the limestone bedrock overlain by thin, weathered red clay (Figure 11). The bends of streams R4 and R2 are situated away from the divide at similar distances. Their catchment areas are also within one square kilometer. However, the bend of stream R4 is smoothly transitioned, and no obvious stair-stepped inflections could be observed in the high-resolution hillshade map without vegetation (Figure 11), which differs from the bend characteristics of the three streams at the Dongshanzhai site. This indicates that the stream hydrology in this area may not produce the bend with multiple inflections. Thus, we believe that the stair-stepped inflections of streams R1, R2, and R3 were most likely formed by the interaction of the faulting offset and fluvial erosion.
Each inflection of the stream channel riser in the Dongshanzhai site is interpreted as corresponding to an offset event. After the inflection forms, it is eroded by flowing water and migrates downstream. The inflection near the fault is considered to be formed by the latest offset. The further away from the fault, the earlier we interpret the inflection to have formed. The spacing of risers on both sides of the inflections is similar along the fault with a distance of 5.9–6.8 m (Figure 5 and Figure 12). Therefore, the offset of each seismic event is similar, indicating that these earthquakes are likely to have been characteristic earthquakes.
Offset clusters were identified in four sections of the fault on the offset distribution map (Figure 10b). Three clusters were identified in the southern and northern sections of the fault, and four clusters were identified in the two sections in the middle of the fault. The offsets of the first cluster decrease from the middle to the north, while the offsets of the second cluster decrease more from the middle to the north. This may be due to the fact that the northern section is close to the northern end of the fault, and the attenuation of the fault slip at the end is different following different rupture events. Another possible interpretation is that the offset data are too sparse to define the offset clusters in the northern section. In general, the first three offset clusters show similar slip distribution patterns, and the offsets of the fourth cluster in the middle two sections are also approximately equal (Figure 10).
Five probability density peaks can be observed on the COPD distribution map (Figure 10c). The first, second, third, fourth, and fifth peaks correspond, from highest to lowest, to offsets of 6.1, 12.1, 17.8, 23.7, and 30.1 m, respectively. It is generally considered that the minimum offset corresponding to the probability peak is the coseismic offset of the latest event and that larger offsets are multievent cumulative offsets [2,48,52,55]. The offset corresponding to the first peak was attributed to the latest event, and the offsets corresponding to the second, third, and fourth peaks were interpreted as being cumulative offsets of the latest two, three, and four events, respectively. Because the fifth peak represents fewer offset measurements, it was not used as a basis for identifying a paleoseismic event.
The offsets corresponding to the second, third, and fourth peaks are approximately two, three, and four times as large as the offset of the latest event, respectively. The coseismic offsets of the latest, penultimate, antepenultimate, and fourth last events were estimated to be about 6.1, 6.0, 5.7, and 5.9 m, respectively. Therefore, it is believed that the JSF follows a characteristic earthquake model based on the analysis of the single offset geomorphic point, the offset cluster distribution, and the COPD of the offsets.
Note that the ~70-km-long JSF seems to be unable to produce characteristic earthquakes with a displacement of ~6 m based on the empirical relationship [56], but this is a distinct characteristic of the fault. A large offset and a relatively short rupture were also observed for the 1992 Mw 7.3 Landers earthquake, which produced an offset of ~6 m and a rupture length of ~85 km [57]. Generally, structurally mature faults can generate a longer surface rupture due to their straighter geometry and lower friction. An example is the Kunlun fault, which produced the 2001 Mw 7.8 Kokoxili earthquake, which had a maximum offset of 7.6 ± 0.4 m and a surface rupture zone of ~426 km [58]. However, the JSF is composed of multiple branch faults with a left-stepped en-echelon pattern, and it has a zigzag-shaped distribution as a whole (Figure 2b). The fault ends form horsetail-shaped splaying patterns. These features indicate that the JSF is likely to be immature [4,59], which results in the rupture characteristic.
The magnitudes of the earthquakes that have occurred on the JSF are estimated to have been about Mw7.4 or Mw7.2 using the empirical relationship between the earthquake magnitude and the coseismic displacement or surface rupture length, respectively [56]. The maximum magnitude of the event that occurred along the JSF is considered to have been Mw7.4. The left-lateral slip rate of JSF was estimated to be 7.02 ± 0.2 mm/a [34]. Combined with the coseismic displacement (~6 m) of paleoearthquakes on the JSF that was identified in this study, the mean recurrence interval of earthquakes was estimated to be approximately ~900 a. The most recent event that occurred on the JSF is likely to have been the 1606 Jianshui earthquake. Thus, the next big event on the JSF is speculated to have occurred after ~500 a.

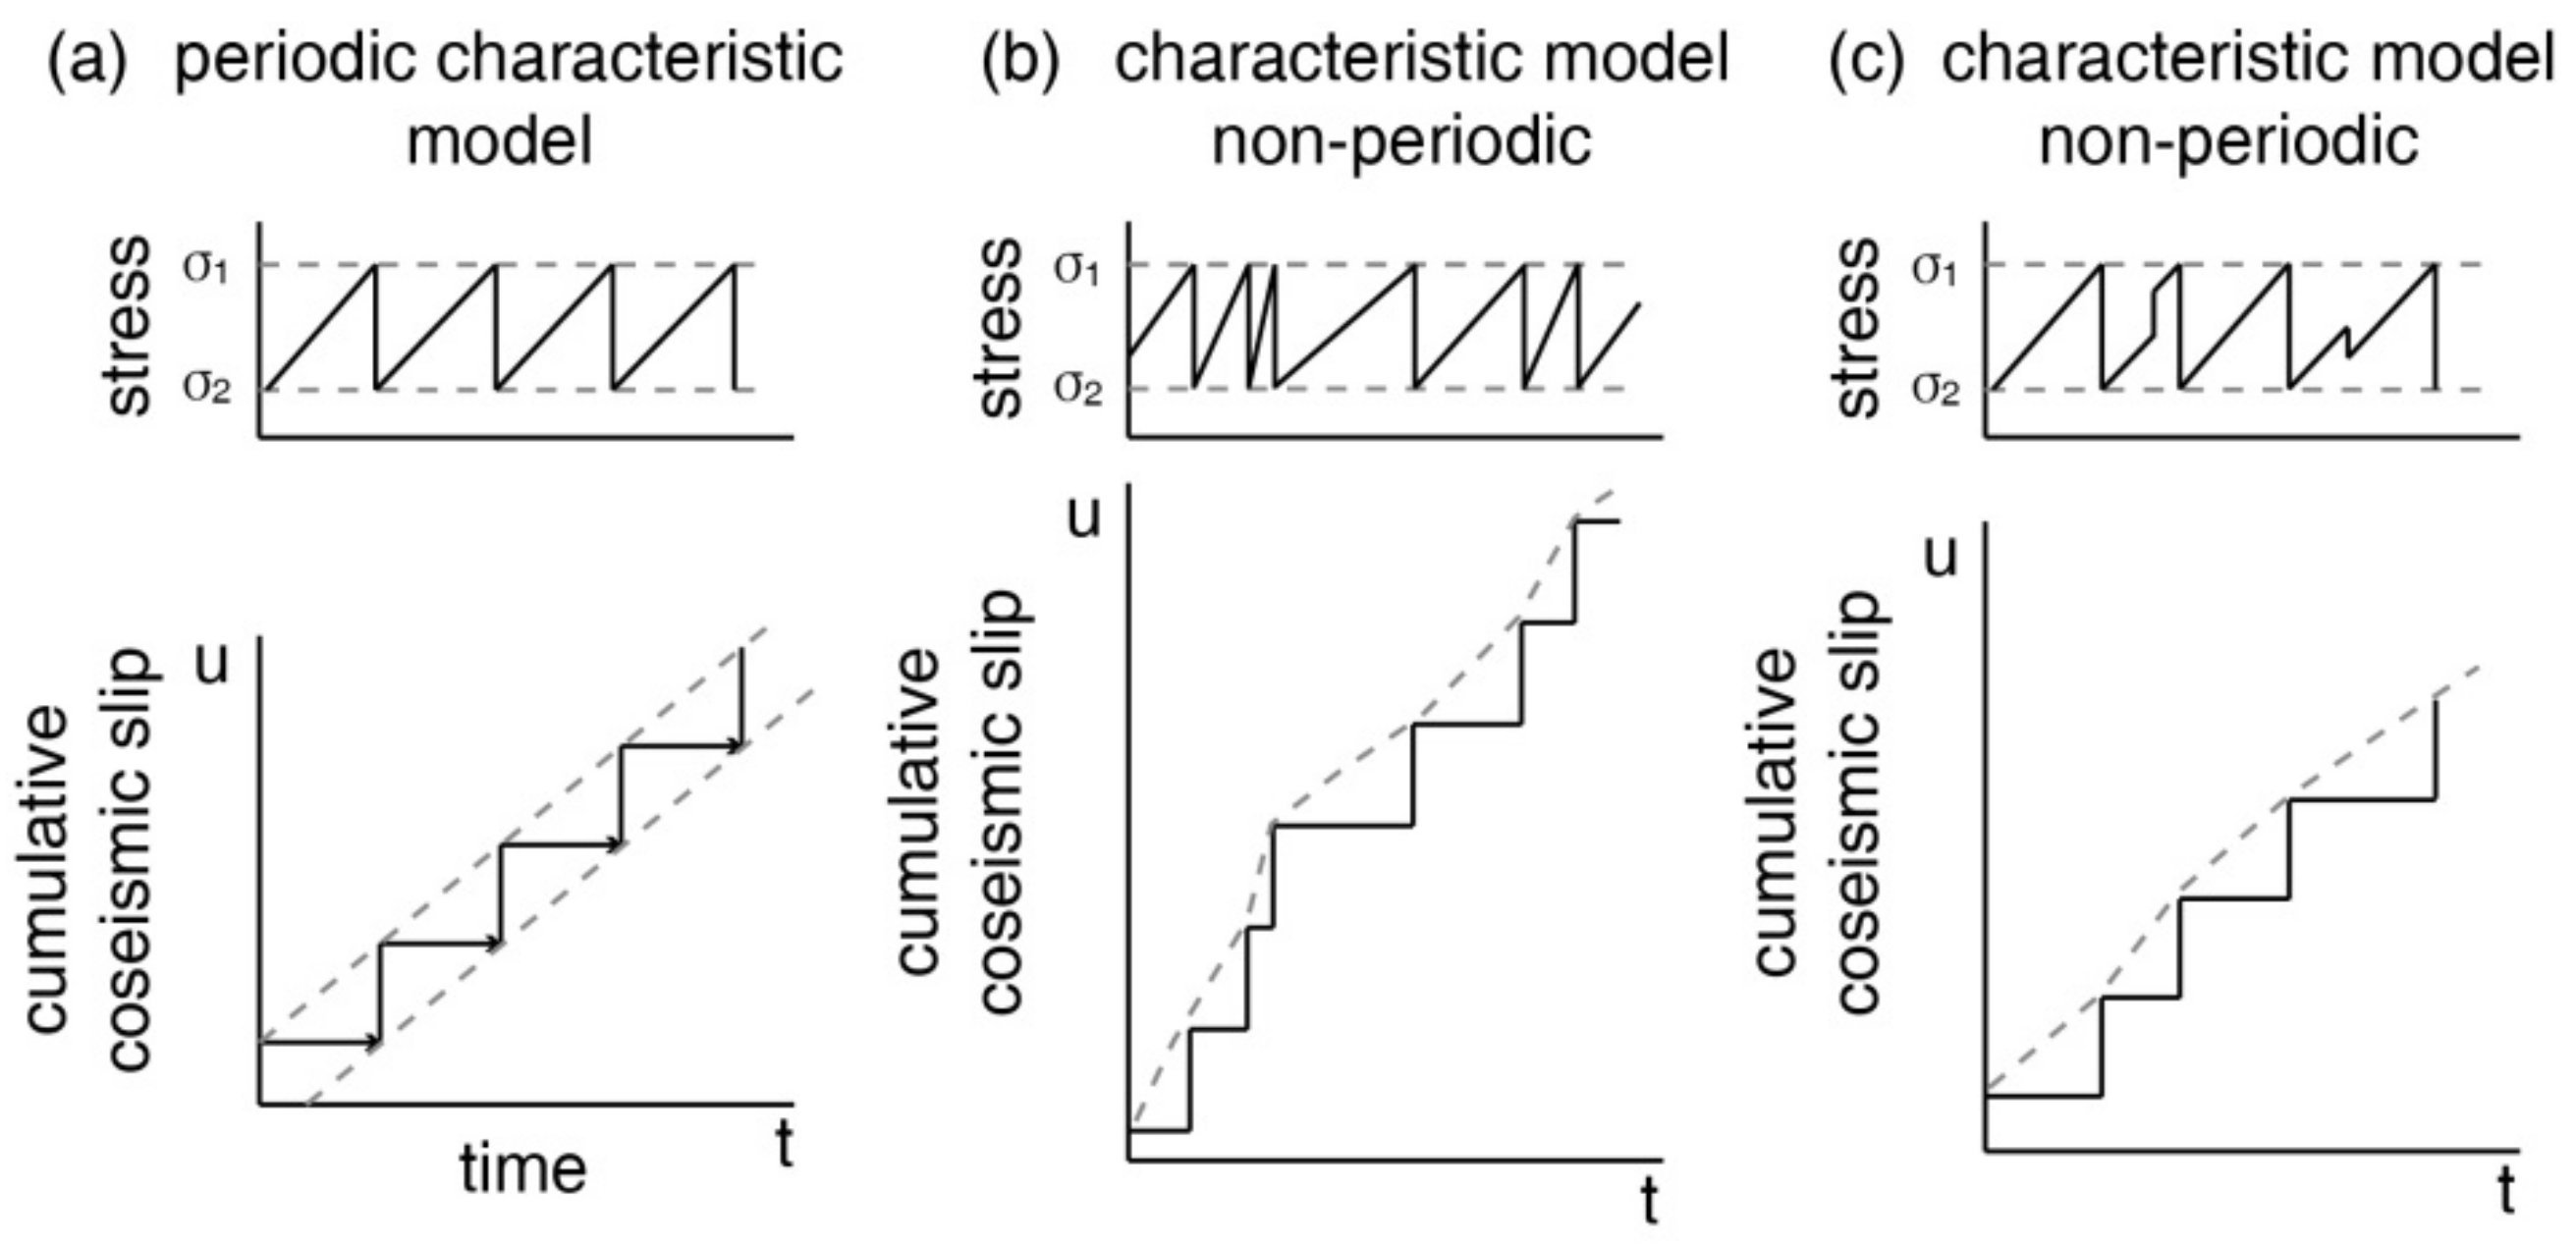
5.2. Temporal Distribution of Fault Slip

The inflections of the risers on the right banks of the three streams, R1, R2, and R3, are distributed downstream in a stair-stepped manner at the Dongshanzhai site. After an inflection forms from the offset of the fault, it migrates downstream due to erosion from flowing water. The amount of migration or erosion of each inflection is different. The erosion rate of a stream is related to the geology, geographical environment, and climate change. For the same area, the change in erosion rate of a stream is mainly related to the difference in precipitation caused by climate change. The three streams are ephemeral and may undergo highly episodic erosion events with variable erosion rates and levels of geomorphic effectiveness. Due to the episodic erosion events, the fluvial erosion rate and amount are variable across a short period of time, such as decades. However, the earthquake cycle of the XJFZ is generally several thousand years. The fluvial erosion across a long period of time, such as millennia, is a long-team process, and the high erosion rate resulting from episodic erosion events will not play a significant role in the long-term average erosion rate. Accordingly, the amount of erosion resulting from episodic erosion events will merge into the long-term erosion amount. In addition, the reconstructed Holocene precipitation record of southwestern China shows that atmospheric precipitation varies in different periods, but it is distributed within a small range of ~1300–1500 mm/y [60,61]. Thus, if we assume that the amount of precipitation is steady over the millennium-scale earthquake cycle, and the erosion rate of the stream is also steady, then the amount of downstream migration of the risers can reflect the formation time of inflections or the occurrence time of seismic events. Although this assumption is considered to be reasonable, we cannot rule out the possibility of an accidental change in erosion rate.
The first inflection, r1, of the riser of stream channel R1 is located close to the fault, and four inflections, r2, r3, r4, and r5, migrate about 13, 45, 67, and 75 m downstream, respectively (Figure 5d). The distance differences along the flow between inflections r1 and r2, r2 and r3, r3 and r4, and r4 and r5 are about 13, 32, 22, and 8 m, respectively (Figure 12a), indicating that the time intervals for inflection formation or seismic events are different. The distance differences between the three inflections of stream channel R2 are about 13 and 39 m, respectively (Figure 12b). Similarly, the distance differences between the four inflections of stream channel R3 are about 4, 12, and 6 m, respectively (Figure 12c). It can be observed that the time variation patterns indicated by the three offset stream channel risers have a good level of correspondence, that is to say, the time intervals of the seismic events are different, and the fault shows nonperiodic earthquake recurrence. Through trench excavations and radiocarbon dating, a recent study revealed that four recent surface-rupturing paleoearthquakes occurred on the JSF, and the estimated time interval of the most recent two events was much shorter than those between the penultimate, the third youngest, and the forth youngest events [62], which is roughly consistent with the nonperiodic earthquake recurrence pattern revealed by this study. Combined with the spatial distribution of the fault slip, it is believed that the fault follows a nonperiodic characteristic earthquake model.
The 1816 M7.5 and 1973 M7.6 earthquakes occurred on the Luhuo segment of the Xianshuihe fault in the past 200 years (Figure 1). The rupture ranges and coseismic offsets of the two earthquakes are similar, so they are considered to be characteristic earthquakes [63]. Trench excavations revealed that six paleoseismic events have occurred on the Luhuo segment in the past 3000 years with recurrence intervals between the events of 1200, 324, 470, 592, and 157 y [64]. Similar nonperiodic characteristic earthquakes have also been observed in the paleoseismic records in the Hog Lake site of the central San Jacinto fault and the Wrightwood site of the San Andreas Fault [65].
With a periodic characteristic earthquake model, it is generally considered that fault loading rates are constant, and that stress and stress drop during fault failure are similar for each earthquake (Figure 13a [66]). If the loading rate varies with time, and the stress and stress drop are similar when the fault ruptures in each earthquake, the fault follows a nonperiodic characteristic earthquake recurrence pattern (Figure 13b [65]). Another possibility is that the loading rate on the fault is constant across several earthquake cycles. Due to the interaction of the local stress from adjacent earthquakes, the stress on the fault may increase or decrease accordingly, leading to an advance or delay of the rupture, so the strain release on the fault is not periodic (Figure 13c). The tectonic loading on the XJFZ in the southeastern margin of the Tibetan Plateau is believed to have linear stress accumulation [67]. Several M ≥ 7 earthquakes have occurred on different sections of the XJFZ and the Qujiang and Shiping faults on the eastern side in the past 500 years. On one section, the earthquakes have had an obvious effect on the stress on the other peripheral sections [67,68]. In particular, the Dongshanzhai site is located in the interaction area of the conjugated strike-slip fault system of the Shiping fault and the JSF. The 1799 M7 and 1887 M7 earthquakes occurred along the Shiping fault. It is possible that the stress on the JSF might have increased due to the big events that happened along the Shiping fault, and some events along the JSF are likely to have been triggered by the events of the Shiping fault. Therefore, the nonperiodic slip behavior of the JSF can be explained by model 13c.

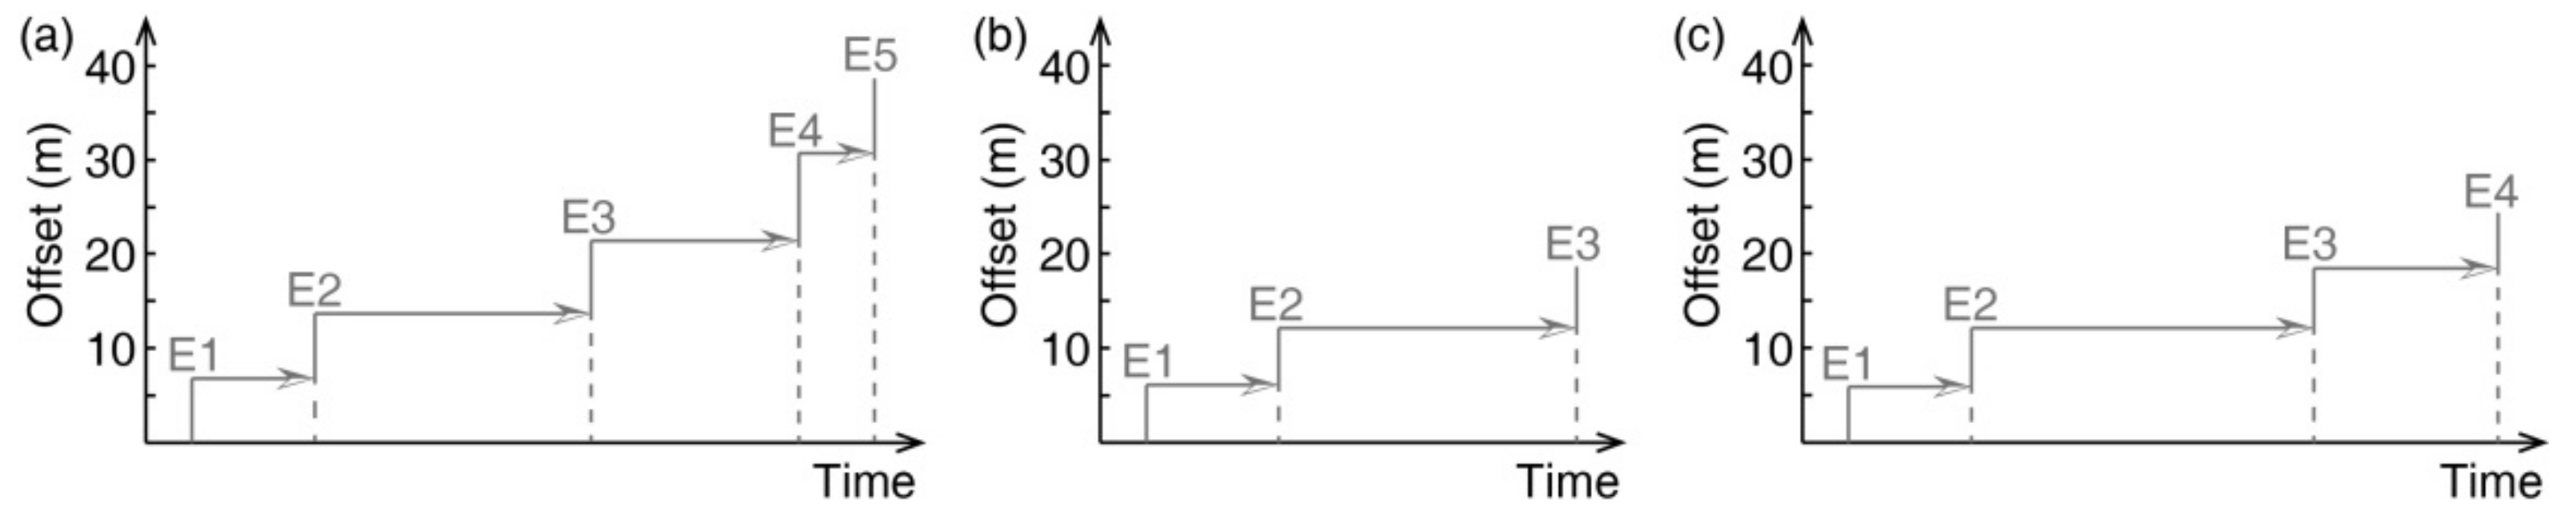
5.3. Multistage Offset Evolution Model of the Stream Channel Riser

Based on the offset geomorphic characteristics of the stream channel risers in the Dongshanzhai site, we propose a geomorphic evolution model to explain the multiphase offset evolution pattern of the stream channel riser (Figure 14). The main evolution processes are as follows: (a) During the rainy season, flowing water downcuts along the slope to form a stream, and the stream subperpendicularly passes through the fault. (b) The fault produces a left-lateral strike-slip motion, and the risers on the left and right banks of the stream channel are synchronously left-laterally offset. (c) Because the riser on the right bank downstream of the fault is offset into the stream channel, the upstream facing part of the riser is eroded by flowing water and migrates downstream. The upstream part of the left bank riser of the fault is also eroded by the flowing water compared with the downstream part, and it bends upstream. (d) After a long time, the fault produces a left-lateral strike-slip displacement again, and the risers on the left and right banks of the stream channel are synchronously left-laterally offset. (e) The new riser facing upstream on the right bank is also eroded by flowing water and migrates downstream. The riser on the left bank upstream of the fault is continuously eroded by flowing water, and the curved part of the riser migrates upstream. (f) After a short period of time, the fault generates a third left-lateral strike-slip offset, and the risers on the left and right banks of the stream channel synchronously experience a left-lateral offset. It can be observed that the three left-lateral offsets on the right bank of the stream channel in the model appear as three stair-stepped inflections distributed downstream. Because the time interval between the first and second events is longer than that of the second and third events, the inflection formed the first time migrates further downstream than that formed the second time.
The above evolution model of the stream channel riser mainly occurs in seasonal bedrock channels, and the width of the channel is greater than the coseismic offset of a single seismic event. Under these conditions, after the stream channel is offset, the water flows along the original stream channel. The stream channel downstream of the fault is not abandoned because the width of the stream channel is greater than the displacement of the riser. The erosion caused by seasonal flowing water is also limited, and the part of the riser facing upstream is more greatly eroded than the part of the riser in the direction of the downstream flow. Thus, the riser facing upstream is eroded by the flowing water and migrates downstream, and the riser in the direction of downstream flow is well preserved due to the relatively weak lateral erosion.
The evolution model of stream channel risers proposed in this paper is different than that proposed for river terrace risers by previous studies. It is believed that under the action of left-lateral shearing, the riser on the left bank that was offset away from the river channel was protected by the upstream riser and underwent less erosion, so it was preserved, while the riser on the right bank that was offset into the river channel was strongly eroded and failed to be preserved in the previous evolution models [5,8]. The previous models are mainly suitable for perennial rivers developed in loose accumulation strata where flowing water carries rich sedimentary materials. At the same time, the downcutting and lateral erosion of the flowing water are strong, while the erosion resistance of the river terrace risers is weak.
Based on high-resolution lidar data, the stream channel riser evolution model proposed in this paper describes the evolution process and pattern of multistage offsets of stream channel risers. This model can be used to identify the exact tectonic location of a fault and to reveal the number of tectonic deformation events and displacements contained in the offset stream channels. It also provides a new way for us to identify fault slip behavior over a relative time scale.

6. Conclusions

The risers on the right banks of three stream channels were found to show similar multiphase offset characteristics near the town of Dongshanzhai. The left-lateral offset consists of multiple continuous inflections produced by seismic events, and the offset of each event is similar. These inflections are distributed downstream in a stepping manner. The newly formed inflections are located close to the fault, and the earlier formed inflections are eroded by flowing water and migrate downstream. The difference between the amount of downstream erosion for two adjacent inflections varies. Assuming that the stream’s long-term erosion rate remains steady, the estimated time interval between seismic events differs. Combined with the cumulative offset probability density calculated for 92 offsets, the JSF is considered to show a nonperiodic characteristic earthquake recurrence pattern.
Based on the analysis of the spatial and temporal distributions of the offsets of the three streams at the Dongshanzhai site, we propose a multistage offset evolution model for the stream channel riser. In the model, the riser on the right bank of the stream channel is left-laterally offset into the stream channel, and the riser facing upstream is eroded by flowing water and migrates downstream accordingly. With the occurrence of seismic events, the multievent offsets of the riser on the right bank appear to be multiple continuous inflections distributed downstream in a stair-stepped manner. This model is mainly suitable for seasonal bedrock stream channels, where the width of the channel is greater than the coseismic offset of a single seismic event. Our model can be used to identify the exact tectonic location of a fault and to identify paleoseismic events and offsets contained in the offset channels. It also provides a new way for us to analyze fault slip behavior over a relative time scale.

Author Contributions

Conceptualization, P.G. and Z.H.; methodology, P.G.; software, F.G. and J.L.; validation, P.G., Z.H. and S.D.; formal analysis, F.G. and J.L.; investigation, P.G., Z.H.; resources, Z.H.; data curation, F.G.; writing—original draft preparation, P.G.; writing—review and editing, Z.H.; visualization, F.G. and J.L.; supervision, S.D.; project administration, Z.H.; funding acquisition, Z.H. All authors have read and agreed to the published version of the manuscript.

Funding

This research was funded by the National Natural Science Foundation of China (Grant Nos 41772218, 41372219, and 42002231) and the National Nonprofit Fundamental Research Grant of China, Institute of Geology, China Earthquake Administration (Grant No. IGCEA1702).

Data Availability Statement

The satellite imageries are accessible in Google Earth, and offset measurements are presented in the supporting information. The topographic data presented are archived in the Mendeley Data repository (Topographic data used in the paper of “Topographic data_xjf”, Mendeley Data, v1, http://dx.doi.org/10.17632/ytwt72jwx6.1).

Acknowledgments

The authors would like to express their sincere appreciation to Editor, Assistant Editor Milos Ilic and three anonymous reviewers for their valuable comments and suggestions which were helpful for improving the manuscript as well as to Ian Pierce for his help with the language used in the manuscript.

Conflicts of Interest

The authors declare no conflict of interest.

References

  1. Haddon, E.K.; Amos, C.B.; Zielke, O.; Jayko, A.S.; Bürgmann, R. Surface slip during large Owens Valley earthquakes. Geochem. Geophys. Geosyst. 2016, 17, 2239–2269. [Google Scholar] [CrossRef] [Green Version]
  2. Klinger, Y.; Etchebes, M.; Tapponnier, P.; Narteau, C. Characteristic slip for five great earthquakes along the Fuyun fault in China. Nat. Geosci. 2011, 4, 389–392. [Google Scholar] [CrossRef]
  3. Sieh, K. Slip along the San Andreas fault associated with the great 1857 earthquake. Bull. Seismol. Soc. Am. 1978, 68, 1421–1448. [Google Scholar]
  4. Zielke, O.; Klinger, Y.; Arrowsmith, J.R. Fault slip and earthquake recurrence along strike-slip faults—Contributions of high-resolution geomorphic data. Tectonophysics 2015, 638, 43–62. [Google Scholar] [CrossRef]
  5. Cowgill, E. Impact of riser reconstructions on estimation of secular variation in rates of strike–slip faulting: Revisiting the Cherchen River site along the Altyn Tagh Fault, NW China. Earth Planet. Sci. Lett. 2007, 254, 239–255. [Google Scholar] [CrossRef]
  6. Harbert, S.A.; Duvall, A.R.; Tucker, G.E. The Role of Near-Fault Relief Elements in Creating and Maintaining a Strike-Slip Landscape. Geophys. Res. Lett. 2018, 45, 11683–11692. [Google Scholar] [CrossRef] [Green Version]
  7. Reitman, N.G.; Mueller, K.J.; Tucker, G.E.; Gold, R.D.; Briggs, R.W.; Barnhart, K.R. Offset Channels May Not Accurately Record Strike-Slip Fault Displacement: Evidence From Landscape Evolution Models. J. Geophys. Res. Solid Earth 2019, 124, 13427–13451. [Google Scholar] [CrossRef]
  8. Van Der Woerd, J.; Tapponnier, P.; Ryerson, F.J.; Meriaux, A.-S.; Meyer, B.; Gaudemer, Y.; Finkel, R.C.; Caffee, M.W.; Guoguang, Z.; Zhiqin, X. Uniform postglacial slip-rate along the central 600 km of the Kunlun Fault (Tibet), from 26Al, 10Be, and 14C dating of riser offsets, and climatic origin of the regional morphology. Geophys. J. Int. 2002, 148, 356–388. [Google Scholar] [CrossRef]
  9. Berryman, K.R.; Cochran, U.A.; Clark, K.J.; Biasi, G.P.; Langridge, R.M.; Villamor, P. Major Earthquakes Occur Regularly on an Isolated Plate Boundary Fault. Science 2012, 336, 1690–1693. [Google Scholar] [CrossRef]
  10. Guo, P.; Han, Z.; Mao, Z.; Xie, Z.; Dong, S.; Gao, F.; Gai, H. Paleoearthquakes and Rupture Behavior of the Lenglongling Fault: Implications for Seismic Hazards of the Northeastern Margin of the Tibetan Plateau. J. Geophys. Res. Solid Earth 2019, 124, 1520–1543. [Google Scholar] [CrossRef]
  11. Sieh, K.; Stuiver, M.; Brillinger, D. A more precise chronology of earthquakes produced by the San Andreas Fault in southern California. J. Geophys. Res. Space Phys. 1989, 94, 603–623. [Google Scholar] [CrossRef] [Green Version]
  12. Weldon, R.; Scharer, K.; Fumal, T.; Biasi, G. Wrightwood and the earthquake cycle: What a long recurrence record tells us about how faults work. GSA Today 2004, 14, 4–10. [Google Scholar] [CrossRef]
  13. Densmore, A.L.; Ellis, M.A.; Li, Y.; Zhou, R.; Hancock, G.S.; Richardson, N. Active tectonics of the Beichuan and Pengguan faults at the eastern margin of the Tibetan Plateau. Tectonics 2007, 26, 3–24. [Google Scholar] [CrossRef] [Green Version]
  14. Schoenbohm, L.M.; Burchfiel, B.C.; Liangzhong, C.; Jiyun, Y. Miocene to present activity along the Red River fault, China, in the context of continental extrusion, upper-crustal rotation, and lower-crustal flow. GSA Bull. 2006, 118, 672–688. [Google Scholar] [CrossRef]
  15. Shi, X.; Weldon, R.; Liu-Zeng, J.; Wang, Y.; Weldon, E.; Sieh, K.; Li, Z.; Zhang, J.; Yao, W.; Li, Z. Limit on slip rate and timing of recent seismic ground-ruptures on the Jinghong fault, SE of the eastern Himalayan syntaxis. Tectonophysics 2018, 734-735, 148–166. [Google Scholar] [CrossRef]
  16. Haugerud, R.A.; Harding, D. Some algorithms for virtual deforestation (VDF) of LIDAR topographic survey data. Int. Arch. Photogramm. Remote. Sens. Spat. Inf. Sci. 2001, 34, 211–218. [Google Scholar]
  17. Liu, J.; Chen, T.; Zhang, P.; Zhang, H.; Zheng, W.; Ren, Z.; Liang, S.; Sheng, C.; Gan, W. Illuminating the active Haiyuan fault, China by Airborne Light Detection and Ranging. Chin. Sci. Bull. 2013, 58, 41–45, (In Chinese with English Abstract). [Google Scholar]
  18. Chen, R.-F.; Lin, C.-W.; Chen, Y.-H.; He, T.-C.; Fei, L.-Y. Detecting and Characterizing Active Thrust Fault and Deep-Seated Landslides in Dense Forest Areas of Southern Taiwan Using Airborne LiDAR DEM. Remote Sens. 2015, 7, 15443–15466. [Google Scholar] [CrossRef] [Green Version]
  19. Cunningham, D.; Grebby, S.; Tansey, K.; Gosar, A.; Kastelic, V. Application of airborne LiDAR to mapping seismogenic faults in forested mountainous terrain, southeastern Alps, Slovenia. Geophys. Res. Lett. 2006, 33, 33. [Google Scholar] [CrossRef] [Green Version]
  20. De Pascale, G.P.; Quigley, M.C.; Davies, T.R.H. Lidar reveals uniform Alpine fault offsets and bimodal plate boundary rupture behavior, New Zealand. Geology 2014, 42, 411–414. [Google Scholar] [CrossRef]
  21. Lin, Z.; Kaneda, H.; Mukoyama, S.; Asada, N.; Chiba, T. Detection of subtle tectonic–geomorphic features in densely forested mountains by very high-resolution airborne LiDAR survey. Geomorphology 2013, 182, 104–115. [Google Scholar] [CrossRef]
  22. Schoenbohm, L.M.; Burchfiel, B.C.; Liangzhong, C. Propagation of surface uplift, lower crustal flow, and Cenozoic tectonics of the southeast margin of the Tibetan Plateau. Geology 2006, 34, 813–816. [Google Scholar] [CrossRef] [Green Version]
  23. Shen, Z.-K.; Lü, J.; Wang, M.; Bürgmann, R. Contemporary crustal deformation around the southeast borderland of the Tibetan Plateau. J. Geophys. Res. Space Phys. 2005, 110, 110. [Google Scholar] [CrossRef] [Green Version]
  24. Wang, E.; Burchfiel, B.C.; Royden, L.H.; Chen, L.; Chen, J.; Li, W.; Chen, Z. Late Cenozoic to Holocene deformation in southwestern Sichuan and adjacent Yunnan, China, and its role in formation of the southeastern part of the Tibetan Plateau. Geol. Soc. Am. Bull. 1998, 112, 413–423. [Google Scholar] [CrossRef]
  25. He, H.L.; Yasutaka, T.; Song, F.M.; Dong, X.Q. Late Quaternary slip rate of the Xiaojiang fault and its implication. Seism. Geol. 2002, 24, 14–26. (In Chinese) [Google Scholar]
  26. Shen, J.; Wang, Y.; Song, F. Characteristics of the active Xiaojiang fault zone in Yunnan, China: A slip boundary for the southeastward escaping Sichuan–Yunnan Block of the Tibetan Plateau. J. Asian Earth Sci. 2003, 21, 1085–1096. [Google Scholar]
  27. Song, F.M.; Wang, Y.P.; Yu, W.X.; Cao, Z.Q.; Shen, X.H.; Shen, J. Xiaojiang Active Fault; Seimological Publishing Press: Beijing, China, 1998; pp. 1–237. (In Chinese) [Google Scholar]
  28. He, H.L.; Fang, Z.; Li, P. A preliminary approach to the fault activity of southern segment on Xiaojiang west branch fault. J. Seismol. Res. 1993, 16, 291–298, (In Chinese with English Abstract). [Google Scholar]
  29. Wang, Y.; Zhang, B.; Hou, J.; Xu, X. Structure and tectonic geomorphology of the Qujiang fault at the intersection of the Ailao Shan–Red River fault and the Xianshuihe–Xiaojiang fault system, China. Tectonophysics 2014, 634, 156–170. [Google Scholar] [CrossRef]
  30. Wen, X.; Du, F.; Long, F.; Fan, J.; Zhu, H. Tectonic dynamics and correlation of major earthquake sequences of the Xiaojiang and Qujiang-Shiping fault systems, Yunnan, China. Sci. China Earth Sci. 2011, 54, 1563–1575. [Google Scholar] [CrossRef]
  31. Zhang, P.; Deng, Q.; Zhang, G.; Jin, M.; Gan, W.; Wei, M.; Mao, F.; Qi, W. Active tectonic blocks and strong earthquakes in the continent of China. Sci. China Earth Sci. 2003, 46, 13–24. [Google Scholar]
  32. Wu, Z.H.; Long, C.X.; Fan, T.Y.; Zhou, C.J.; Feng, H.; Yang, Z.Y.; Tong, Y.B. The arc rotational-shear active tectonic system on the southeastern margin of Tibetan Plateau and its dynamic characteristics and mechanism. Geol. Bull. China 2015, 34, 1–31, (In Chinese in English Abstract). [Google Scholar]
  33. Wang, Y.; Wang, E.; Shen, Z.; Wang, M.; Gan, W.; Qiao, X.; Meng, G.; Li, T.; Tao, W.; Yang, Y.; et al. GPS-constrained inversion of present-day slip rates along major faults of the Sichuan-Yunnan region, China. Sci. China Ser. D Earth Sci. 2008, 51, 1267–1283. [Google Scholar] [CrossRef]
  34. Han, Z.J.; Dong, S.P.; Mao, Z.B.; Hu, N.; Tan, X.B.; Yuan, R.M.; Guo, P. The Holocene activity and strike-slip rate of the southern segment of Xiaojiang fault in the southeastern Yunnan region, China. Seism. Geol. 2017, 39, 1–19, (In Chinese with English Abstract). [Google Scholar]
  35. He, H.; Ran, H.; Yasutaka, I. Uniform strike-slip rate along the Xianshuihe-Xiaojiang fault system and its implications for active tectonics in southeastern Tibet. Acta Geol. Sin. 2006, 80, 376–386. [Google Scholar]
  36. Li, X.; Ran, Y.; Chen, L.; Wu, F.; Ma, X.; Cao, J. Late Quaternary Large Earthquakes on the Western Branch of the Xiaojiang Fault and Their Tectonic Implications. Acta Geol. Sinica 2015, 89, 1516–1530. [Google Scholar]
  37. Xu, X.W.; Han, Z.; Yang, X.; Zhang, S.; Yu, G.; Zhou, B.; Li, F.; Ma, B.; Chen, G.; Ran, Y. Seimotectonic Map of China and Its Adjacent Regions; Seismological Publishing Press: Beijing, China, 2016. [Google Scholar]
  38. Royden, L.H.; Burchfiel, B.C.; Van Der Hilst, R.D. The Geological Evolution of the Tibetan Plateau. Science 2008, 321, 1054–1058. [Google Scholar] [CrossRef] [Green Version]
  39. Tapponnier, P.; Zhiqin, X.; Roger, F.; Meyer, B.; Arnaud, N.; Wittlinger, G.; Jingsui, Y. Oblique Stepwise Rise and Growth of the Tibet Plateau. Science 2001, 294, 1671–1677. [Google Scholar] [CrossRef]
  40. Zhang, P.-Z.; Shen, Z.; Wang, M.; Gan, W.; Bürgmann, R.; Molnar, P.; Wang, Q.; Niu, Z.; Sun, J.; Wu, J.; et al. Continuous deformation of the Tibetan Plateau from global positioning system data. Geology 2004, 32, 809. [Google Scholar] [CrossRef]
  41. Xu, X.W.; Wen, X.Z.; Zheng, R.Z.; Ma, W.T.; Song, F.M.; Yu, G.H. The structural styles and dynamic source of Sichuan–Yunnan Rhombic Block. Sci. China Ser. D-Earth Sci. 2003, 33, 151–162. (In Chinese) [Google Scholar]
  42. Zhang, P.Z.; Deng, Q.D.; Zhang, Z.Q.; Li, H.B. Active faults, earthquake hazards and associated geodynamic processes in continental China. Sci. China Earth Sci. 2013, 43, 1607–1620. (In Chinese) [Google Scholar]
  43. Liang, S.; Gan, W.; Shen, C.; Xiao, G.; Liu, J.; Chen, W.; Ding, X.; Zhou, D. Three-dimensional velocity field of present-day crustal motion of the Tibetan Plateau derived from GPS measurements. J. Geophys. Res. Solid Earth 2013, 118, 5722–5732. [Google Scholar] [CrossRef]
  44. Yu, W.X.; Wang, Y.P.; Wang, B.; Song, F.M.; Xie, Y.Q. Paleoearthquake and the current risk study on the west branch of the Xiaojiang fault in Yunnan. J. Seism. Res. 2004, 27, 29–32, (In Chinese with English Abstract). [Google Scholar]
  45. Min, Z.; Wu, G.; Jiang, Z.; Liu, C.; Yang, Y. Catalog of Chinese Historic Strong Earthquakes from BC 2300 to AD 1911; Seismological Publishing Press: Beijing, China, 1995; p. 514. (In Chinese) [Google Scholar]
  46. Ren, Z. Geometry and deformation features of the most recent co-seismic surface ruptures along the Xiaojiang Fault and its tectonic implications for the Tibetan Plateau. J. Asian Earth Sci. 2013, 77, 21–30. [Google Scholar] [CrossRef]
  47. Wang, S.; Wu, G.; Shi, Z. Catalog of Chinese Modern Earthquakes with M ≥ 4.7 from AD 1912 to 1990; China Science and Technology Press: Beijing, China, 1999; p. 637. (In Chinese) [Google Scholar]
  48. Guo, P.; Han, Z.; Dong, S.; Yuan, R.; Xie, Z. Surface rupture and slip distribution along the Lenglongling fault in the NE Tibetan Plateau: Implications for faulting behavior. J. Asian Earth Sci. 2019, 172, 190–207. [Google Scholar] [CrossRef]
  49. Zielke, O.; Arrowsmith, J.R.; Ludwig, L.; Akciz, S.O. High-Resolution Topography-Derived Offsets along the 1857 Fort Tejon Earthquake Rupture Trace, San Andreas Fault. Bull. Seism. Soc. Am. 2012, 102, 1135–1154. [Google Scholar] [CrossRef]
  50. Madden, C.; Haddad, D.E.; Salisbury, J.B. Appendix R: Compilation of Slip in the Last Event Data and Analysis of Last Event, Repeated Slip, and Average Displacement for Recent and Prehistoric Ruptures; US Geological Survey Open-File Report: Los Angeles, CA, USA, 2013; p. 1165.
  51. McGill, S.F.; Sieh, K. Surficial offsets on the Central and Eastern Garlock Fault associated with prehistoric earthquakes. J. Geophys. Res. Space Phys. 1991, 96, 21597–21621. [Google Scholar] [CrossRef]
  52. Zielke, O.; Arrowsmith, J.R.; Ludwig, L.; Akçiz, S.O. Slip in the 1857 and Earlier Large Earthquakes Along the Carrizo Plain, San Andreas Fault. Science 2010, 327, 1119–1122. [Google Scholar] [CrossRef] [PubMed] [Green Version]
  53. Bi, H.; Zheng, W.; Lei, Q.; Zeng, J.; Zhang, P.; Chen, G. Surface Slip Distribution Along the West Helanshan Fault, Northern China, and Its Implications for Fault Behavior. J. Geophys. Res. Solid Earth 2020, 125, 019983. [Google Scholar] [CrossRef]
  54. Ren, Z.; Zhang, Z.; Chen, T.; Yan, S.; Yin, J.; Zhang, P.; Zheng, W.; Zhang, H.; Li, C. Clustering of offsets on the Haiyuan fault and their relationship to paleoearthquakes. GSA Bull. 2015, 128, B31155.1–18. [Google Scholar] [CrossRef]
  55. Li, H.; Van der Woerd, J.; Sun, Z.; Si, J.; Tapponnier, P.; Pan, J.; Liu, D.; Chevalier, M.-L. Co-seismic and cumulative offsets of the recent earthquakes along the Karakax left-lateral strike-slip fault in western Tibet. Gondwana Res. 2012, 21, 64–87. [Google Scholar] [CrossRef] [Green Version]
  56. Wells, D.L.; Coppersmith, K.J. New empirical relationships among magnitude, rupture length, rupture width, rupture area, and surface displacement. Bull. Seism. Soc. Am. 1994, 84, 974–1002. [Google Scholar]
  57. Sieh, K.; Jones, L.; Hauksson, E.; Hudnut, K.; Eberhart-Phillips, D.; Heaton, T.; Hough, S.; Hutton, K.; Kanamori, H.; Lilje, A.; et al. Near-Field Investigations of the Landers Earthquake Sequence, April to July 1992. Science 1993, 260, 171–176. [Google Scholar] [CrossRef] [Green Version]
  58. Xu, X.; Yu, G.; Klinger, Y.; Tapponnier, P.; Van Der Woerd, J. Reevaluation of surface rupture parameters and faulting segmentation of the 2001 Kunlunshan earthquake (Mw7.8), northern Tibetan Plateau, China. J. Geophys. Res. Space Phys. 2006, 111, 111. [Google Scholar] [CrossRef] [Green Version]
  59. Ward, S.N. Dogtails versus rainbows: Synthetic earthquake rupture models as an aid in interpreting geological data. Bull. Seism. Soc. Am. 1997, 87, 1422–1441. [Google Scholar]
  60. Hu, C.; Henderson, G.M.; Huang, J.; Xie, S.; Sun, Y.; Johnson, K.R. Quantification of Holocene Asian monsoon rainfall from spatially separated cave records. Earth Planet. Sci. Lett. 2008, 266, 221–232. [Google Scholar] [CrossRef] [Green Version]
  61. Xiao, X.; Haberle, S.G.; Shen, J.; Yang, X.; Han, Y.; Zhang, E.; Wang, S. Latest Pleistocene and Holocene vegetation and climate history inferred from an alpine lacustrine record, northwestern Yunnan Province, southwestern China. Quat. Sci. Rev. 2014, 86, 35–48. [Google Scholar] [CrossRef]
  62. Guo, P.; Han, Z.; Dong, S.; Mao, Z.; Hu, N.; Gao, F.; Li, J. Latest Quaternary Active Faulting and Paleoearthquakes on the Southern Segment of the Xiaojiang Fault Zone, SE Tibetan Plateau. Lithosphere 2021, 2021, 1–17. [Google Scholar] [CrossRef]
  63. Qian, H.; Luo, Z.L.; Wen, X.Z. Preliminary study of characteristic earthquakes in the Xianshuihe fault zone. Acta Seisml. Sin. 1990, 12, 22–29, (In Chinese with English Abstract). [Google Scholar]
  64. Liang, M.J. Characteristics of the Late-Quaternary Fault Activity of the Xianshuihe Fault. Ph.D. Thesis, Institute of Geology, China Earthquake Administration, Beijing, China, 2019. [Google Scholar]
  65. Rockwell, T. The non-regularity of earthquake recurrence in California: Lessons from long paleoseismic records from the San Andreas and San Jacinto faults in southern California, and the north Anatolian fault in Turkey. In Proceedings of the International Conferences on Recent Advances in Geotechnical Earthquake Engineering and Soil Dynamics 5, Bengaluru, India, 13–16 July 2020; Missouri University of Science and Technology: San Diego, CA, USA, May 2010. [Google Scholar]
  66. Schwartz, D.P.; Coppersmith, K.J. Fault behavior and characteristic earthquakes: Examples from the Wasatch and San Andreas Fault Zones. J. Geophys. Res. Space Phys. 1984, 89, 5681–5698. [Google Scholar] [CrossRef]
  67. He, J.; Xia, W.; Lu, S.; Qian, H. Three-dimensional finite element modeling of stress evolution around the Xiaojiang fault system in the southeastern Tibetan plateau during the past ~500years. Tectonophysics 2011, 507, 70–85. [Google Scholar] [CrossRef]
  68. Zhu, X.J.; He, J.K. Coulomb Stress Change on the Xiaojiang and the Red River Faults, Southeastern Tibetan Plateau, from the 1970 Tonghai MS7.7 Earthquake. J. Geod. Geodyn. 2019, 39, 1223–1227. (In Chinese) [Google Scholar]
Figure 2. Distribution map and linear landforms of the Jianshui fault. (a) The satellite image shows the clear linear structure of the fault features. The red arrows indicate the location of the fault. (b) Jianshui fault traces and locations of study sites. The rectangular boxes represent the lidar measurement range.
Remotesensing 13 02019 g002
Figure 3. An example of an offset stream showing the validity of the lidar data after filtering the vegetation. High-resolution orthoimage (0.04 m resolution; (a) and field photo (b) showing the offset stream R and the broader geomorphology of the landscape. (c) Hillshade map generated from the pre-processed lidar data. (d) Hillshade map generated from the post-processed lidar data.
Remotesensing 13 02019 g003
Figure 4. Offset geomorphic markers and displacements at the Dongshanzhai site. (a) A hillshade map with a resolution of 0.5 m. The location is shown in Figure 2b. The red arrows indicate the location of the fault. (b) Interpretation map of the offset landforms and markers presented in (a). (c) Field photo showing offset stream riser 4a/4b. The location is shown in (a). (d) Field photo showing offset stream 11a/11b.
Remotesensing 13 02019 g004
Figure 5. Offset markers and inflection distribution of the stream channels at the Dongshanzhai site. The hillshade maps of streams R1 (a), R2 (e), and R3 (i) are superimposed with contour lines (interval 0.3 m). Interpreted riser on the right bank of stream channels R1 (b), R2 (f), and R3 (j). The offsets of channel risers of streams R1 (c), R2 (g), and R3 (k) are composed of inflections. The riser parts on both sides of the inflections are regarded as offset markers. Labels such as 1a represent different sections of an offset riser. The downstream erosion distance for each inflection of streams R1 (d), R2 (h), and R3 (l) is marked with green dotted line. Red labels, such as r1, represent inflections.
Remotesensing 13 02019 g005
Figure 6. Offset landforms and markers in the Shenxiandong site. (a) Hillshade map generated from lidar-derived DEM without vegetation (0.5 m resolution). The red arrows represent the fault location. (b) Interpretation map of landslides and offset landforms for (a). (c) An expanded hillshade map superimposed with contour lines (interval 0.3 m) showing the offset stream. The location is shown in (b). (4) Back-slipped map of the offset stream with a displacement of 12.6 m.
Remotesensing 13 02019 g006
Figure 7. Offset geomorphic landforms and markers at the Xinzhai site. (a) High-resolution Google Earth optical image showing the geomorphology. The red arrows represent the fault locations. (b) Hillshade map with a resolution of 0.5 m. The location is shown in Figure 2b. (c) Interpretation map of the offset landforms and markers shown in (b). (d) Field photo showing offset ridge edge 7a/7b. Location is shown in (c). (e) Field photo showing offset stream 9a/9b. The location is shown in (c).
Remotesensing 13 02019 g007
Figure 8. Back-slipped measurements of the offset markers at the Xinzhai site. (a) A hillshade map superimposed with contour lines (interval 0.2 m) located in Figure 7c. (b) Interpretation map of the offset markers presented in (a). (c) Back-slipped map of offset streams 2a/2b and 3a/3b with a displacement of 6.5 m. (d) Back-slipped map of offset streams 1a/1b and 3a/3c with a displacement of 12 m. (e) Back-slipped map of offset streams 1a/1c, 2a/2c, and 3a/3b with a displacement of 18 m. (f) Back-slipped map of offset stream 1a/1d with a displacement of 24 m.
Remotesensing 13 02019 g008
Figure 9. Offset landforms and markers at the Bagenjiao site. (a) Hillshade map generated from lidar-derived DEM without vegetation (0.5 m resolution). The red arrows represent the fault location. (b) Interpretation map of offset landforms presented in (a). (c) An expanded hillshade map superimposed with contour lines (interval 0.3 m) showing offset stream riser 5a/5b. The location is shown in (b). (4) Back-slipped map of offset stream riser 5a/5b with a displacement of 7.1 m.
Remotesensing 13 02019 g009
Figure 10. Geometric structure and offset distribution of the JSF. (a) The geometric distribution of the JSF and the locations of the measurement range. (b) A scatter plot of the offsets versus the distance along the fault. (c) Cumulative offset probability density distribution map. LCH indicates Liangchahe. BGJ indicates Bagenjiao.
Remotesensing 13 02019 g010
Figure 11. Bend characteristics of stream R4 without the influence of the fault offset. (a) High-resolution hillshade map without vegetation showing stream R4 (0.5 m resolution). (b) Interpretation map of the riser on the right bank of the stream R4.
Remotesensing 13 02019 g011
Figure 12. A plot of the offset of the risers of the three stream channels in the Dongshanzhai site over time. (a) The offset and temporal distribution of the five events revealed by offset stream channel R1. (b) The offset and temporal distribution of the three events revealed by offset stream channel R2. (c) The offset and temporal distribution of the four events revealed by offset stream channel R3.
Remotesensing 13 02019 g012
Figure 13. Periodic and non-periodic characteristic earthquake models. In the periodic characteristic model (a), the loading rate is constant, and the stress and stress drop during fault failure are similar for each earthquake. In the nonperiodic characteristic model (b), the loading rate may vary with time, and the stress and stress drop are similar when the fault ruptures in each earthquake. In the nonperiodic characteristic model (c), the loading rate is constant, and the stress on the fault may increase or decrease due to the influence of local stress from the adjacent earthquake, leading to an advance or delay of the rupture.
Remotesensing 13 02019 g013
Figure 14. Multi-stage offset evolution model of the stream channel riser. (a) The flowing water downcuts along the slope to form a stream. (b) The antepenultimate earthquake occurs, and the risers of the stream channel are left-laterally offset. (c) The upstream facing part of the riser on the right bank is eroded by flowing water and migrates downstream. (d) After a long time, the antepenultimate earthquake occurs, and the risers of the stream channel are left-laterally offset to form a second inflection. (e) The new riser facing upstream on the right bank is also eroded by flowing water and migrates downstream. (f) After a short period of time, the latest earthquake occurs, and the risers of the stream channel synchronously experience a left-lateral offset to form a third inflection.
Remotesensing 13 02019 g014
Publisher’s Note: MDPI stays neutral with regard to jurisdictional claims in published maps and institutional affiliations.

