Article

Spatiotemporal Changes of Coastline over the Yellow River Delta in the Previous 40 Years with Optical and SAR Remote Sensing

1
Institute of Estuarine and Coastal Zone, College of Marine Geosciences, Key Lab of Submarine Geosciences and Prospecting Technology, Ministry of Education, Ocean University of China, Qingdao 266100, China
2
Laboratory of Marine Geology, Qingdao National Laboratory for Marine Science and Technology, Qingdao 266061, China
3
State Key Laboratory of Estuarine and Coastal Research, East China Normal University, Shanghai 200062, China
4
College of Geological Engineering and Geomatics, Chang’an University, Xi’an 710054, China
5
Department of Marine Surveying and Mapping, South GNSS Navigation Co., Ltd., Guangzhou 510630, China
*
Author to whom correspondence should be addressed.
Remote Sens. 2021, 13(10), 1940; https://doi.org/10.3390/rs13101940
Submission received: 18 April 2021 / Revised: 10 May 2021 / Accepted: 13 May 2021 / Published: 16 May 2021
(This article belongs to the Special Issue Remote Sensing of the Aquatic Environments-Part II)

Abstract

:
The integration of multi-source, multi-temporal, multi-band optical, and radar remote sensing images to accurately detect, extract, and monitor the long-term dynamic change of coastline is critical for a better understanding of how the coastal environment responds to climate change and human activities. In this study, we present a combination method to produce the spatiotemporal changes of the coastline in the Yellow River Delta (YRD) in 1980–2020 with both optical and Synthetic Aperture Radar (SAR) satellite remote sensing images. According to the measurement results of GPS RTK, this method can obtain a high accuracy of shoreline extraction, with an observation error of 71.4% within one pixel of the image. Then, the influence of annual water discharge and sediment load on the changes of the coastline is investigated. The results show that there are two significant accretion areas in the Qing 8 and Qingshuigou course. The relative high correlation illustrates that the sediment discharge has a great contribution to the change of estuary area. Human activities, climate change, and sea level rise that affect waves and storm surges are also important drivers of coastal morphology to be investigated in the future, in addition to the sediment transport.

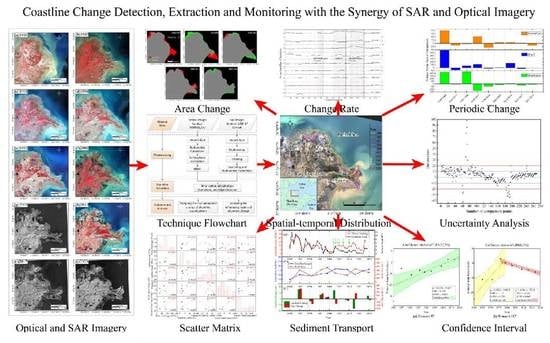
Graphical Abstract

1. Introduction

As one of the most active, complex, and fragile regions in the world, coastal, estuary, and river delta areas that are densely populated and economically developed contribute little to global landmass, where hydrosphere, lithosphere, atmosphere, biosphere, and human society interact very frequently [1]. Therefore, accurate and dynamic monitoring of the changing coastal and delta zone is critical for a better understanding of how the Earth’s surface system responds to human activities.
As one of the most important topographic elements on land and sea maps, coastline is named as one of the 27 most important surface features by the International Geographic Data Committee (IGDC) [2]. Many large river deltas in the world are facing the impacts of shoreline change, and the study of delta erosion and expansion has attracted the attention of the scientific community and policymakers [3,4,5,6,7,8,9,10]. The change of coastline has an extremely important impact on the security of ports, the change of coastal ecological environment, and the erosion of coastal land [11,12]. Coastline changes are affected by many factors and show certain rules under the comprehensive action of many factors. Therefore, analyzing the spatiotemporal dynamics of shorelines in coastal areas and exploring the drivers of shoreline changes are essential to understanding how those shorelines respond to natural and anthropogenic effects [13,14].
The modern Yellow River Delta (hereinafter referred to as YRD) located in the northeast of Shandong Province, China, was formed in 1855 when the Yellow River migrated northward from the Yellow Sea to the Bohai Sea, and now is rich in estuarine wetlands, oil, gas, salt production, and aquaculture [15,16]. As the widest, most intact, and youngest delta both in China and in the world, the YRD is a highly concentrated area of human society and economy, but its ecosystem environment is vulnerable due to its special location and industrial structure [17].
There are five large rivers in East and Southeast Asia (Yellow, Yangtze, Pearl, Red, and Mekong) that are important contributors of terrigenous sediment to the western Pacific Ocean. The Yellow River in China has been widely recognized as having one of the highest sediment loads of approximately 1 × 10⁹ t per year, accounting for 5% of the global river sediment budget [18]. At present, human engineering controls the expansion and shrinking of more and more deltas [19]. Over the past century, intense anthropogenic activities from dam building, agricultural irrigation, groundwater pumping, hydrocarbon extraction, and artificial diversion of the estuary have triggered rapid morphological evolution for the modern YRD and dramatically decreased the terrestrial sediment delivered to the sea [16,19,20,21,22,23,24,25].
Earth observation from a large amount of globally available satellite remote sensing sensors has played a crucial role in providing accurate information on unravelling these processes [1]. For example, Zhang et al. [26] studied the spatial and temporal shoreline changes of the southern YRD in 1976–2016 by utilizing 364 Landsat satellite images. Based on high spatial resolution satellite imagery covering nearly four decades, Kuenzer et al. [27] employed manual feature digitization to present oil-industry-induced river bed changes and overall changes in the appearance of the YRD. However, most existing studies focused on evolutions of the YRD river mouth region with mainly coarse and medium resolution optical and multispectral data [16,20,28]. For the area dynamics of the entire YRD region, there is still a lack of long-term accurate temporal and spatial quantitative description of erosion, accretion, and subsidence.
In recent years, earth observation from moderate resolution (1–20 m) and sub-meter resolution remote sensing images including optical, multispectral, thermal as well as Synthetic Aperture Radar (SAR) data have been widely used for analyses and quantification of land surface dynamics in most of the large river deltas globally [1,7,8]. Time series of optical and multispectral satellite data from, e.g., Landsat and Sentinel series as well as QuickBird and WorldView images, are the preferred choices for detecting, extracting, and monitoring the boundary between land and water, and for quantitatively characterizing land cover and land use [1,8,9,13,29,30,31,32,33].
However, water vapor content is higher all year round in tropical and subtropical coastal areas, whilst cloud and rain weather lasts for a long time. This greatly impedes available high-quality optical and multispectral observations and further affects the extraction of dynamic coastline information. As a microwave remote sensing technology, SAR can penetrate clouds and provide an important complementary data acquisition, which has been successfully used to track coastlines, coastal erosion, and accretion patterns, in addition to various geological hazards [1,32,34,35,36].
A review of the existing literature yields few studies focused on the coastline detection and extraction with SAR images in the YRD except for many previous studies on the analysis of shoreline changes using optical remote sensing data sources [7,16,26,37,38]. The long-term time series fusion of multi-source optical and SAR remote sensing data is expected to provide an accurate quantitative estimate of the coastline geolocation of the YRD in the past 40 years and reveal its dynamic change drivers. Therefore, in this study, we firstly introduce a combination method for extracting the coastline of the YRD with both optical and SAR satellite remote sensing images and then evaluate the accuracy of results. Furthermore, we investigate the influence of annual water discharge and sediment load as well as critical sediment on the changes of the coastline.

2. Datasets and Methods

2.1. Study Area

Originating from the eastern Qinghai–Tibet Plateau, the Yellow River drains a wide basin of >75,000 km2 with a total length of 5464 km [39]. The place where the Yellow River meets the Bohai Sea is the YRD located in Dongying City, Shandong Province, projecting in a fan shape, with a total area of 5943 km2 (Figure 1). There are ecological tourism areas, harbor industrial areas, high-end industrial areas, efficient ecological agriculture areas, and so on in this area.
Meanwhile, on both sides of the estuary of the new Yellow River and the old Yellow River, the YRD National Reserve of Shandong Province dominated by wetland types was established in 1992 and declared Ramsar wetland sites in 2013 [27]. The wetland is composed of two units, with the southern part located along the course of the Yellow River and extending out to the Bohai Sea, while the northern part is located at Diaokou River, referred to as the ‘Ancient Yellow River’. This site is an almost naturally intact estuary wetland composed of marshes, reed swamps, tidal flats, canals and drainage channels, shallow estuarine waters, and aquaculture ponds at the mouth of the Yellow River Estuary (hereinafter referred to as YRE).
In modern times, there were nine major diversions of the river estuary, three of which occurred after the 1950s. Before 1953, the water flowed from the Tianshuigou Course (60%) and Shenxian’gou Course (40%) to the Bohai Sea. In July 1953, Tianshuigou river groove into the Shenxian’gou into the sea alone. On New Year’s Day of 1964, the dike was destroyed and the Yellow River was diverted to the sea by the Diaokou River. After 1972, as silt accumulated, the flow began to branch again. In May 1976, the Yellow River shifted to Qingshuigou Course into the sea. In 1996, artificial diversion made the water flow from Qing 8 Course into the sea. This flow path continues to this day. In this study, the east side of the Tiaohe course to the Qingshuigou course is selected as the study area.

2.2. Datasets

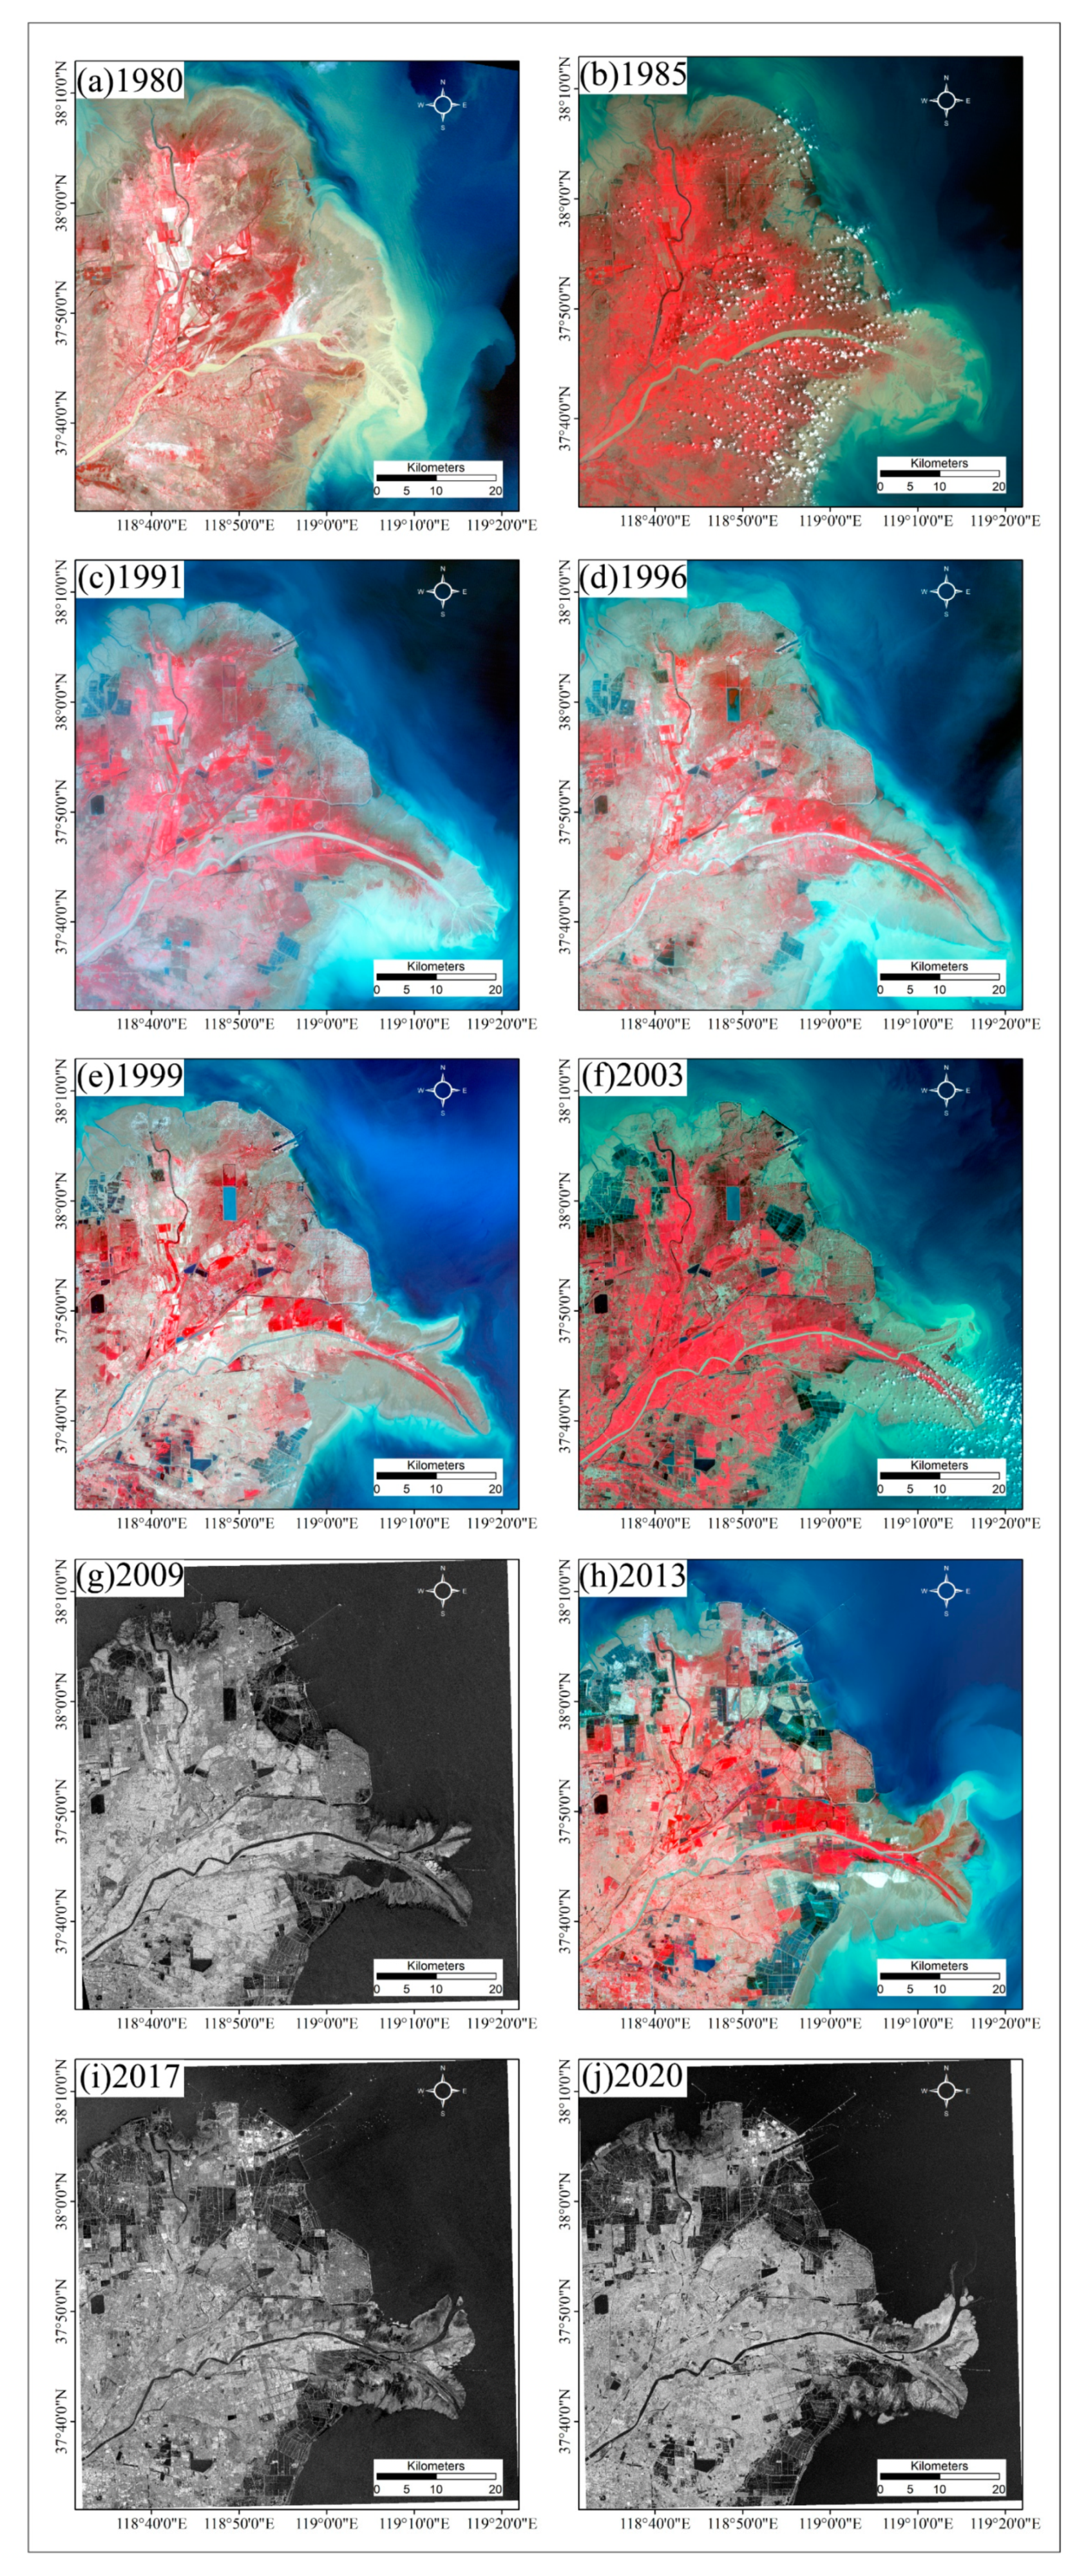
In this study, 10 key years are selected for coastline analysis on the premise that optical and SAR data sources are available, by taking into account the position change of the Yellow River estuary and the principle of uniform time sampling interval. Besides, the characteristics of water flow and sediment transport in the Yellow River basin vary significantly with the seasons [21]. The satellite remote sensing images as shown in Table 1, including Landsat-3 Multispectral Scanner (MSS), Landsat-5 Thematic Mapper (TM), Landsat-8 Operational Land Imager (OLI), Envisat Advanced Synthetic Aperture Radar (ASAR) Image Mode Precision (IMP) L1 Image, Sentinel-1 Interferometric Wide Swath (IWS) mode, and GaoFen-3 (GF-3) Fine Strip (FSII), are mainly focused on June, July, and August of each year. All images were selected with consideration of both spatial coverage and pixel resolution. The optical and SAR images are freely and readily available from United States Geological Survey (USGS), European Space Agency (ESA), and National Satellite Ocean Application Service (NSOAS). The optical false color composite images and SAR intensity images are shown in Figure 2.
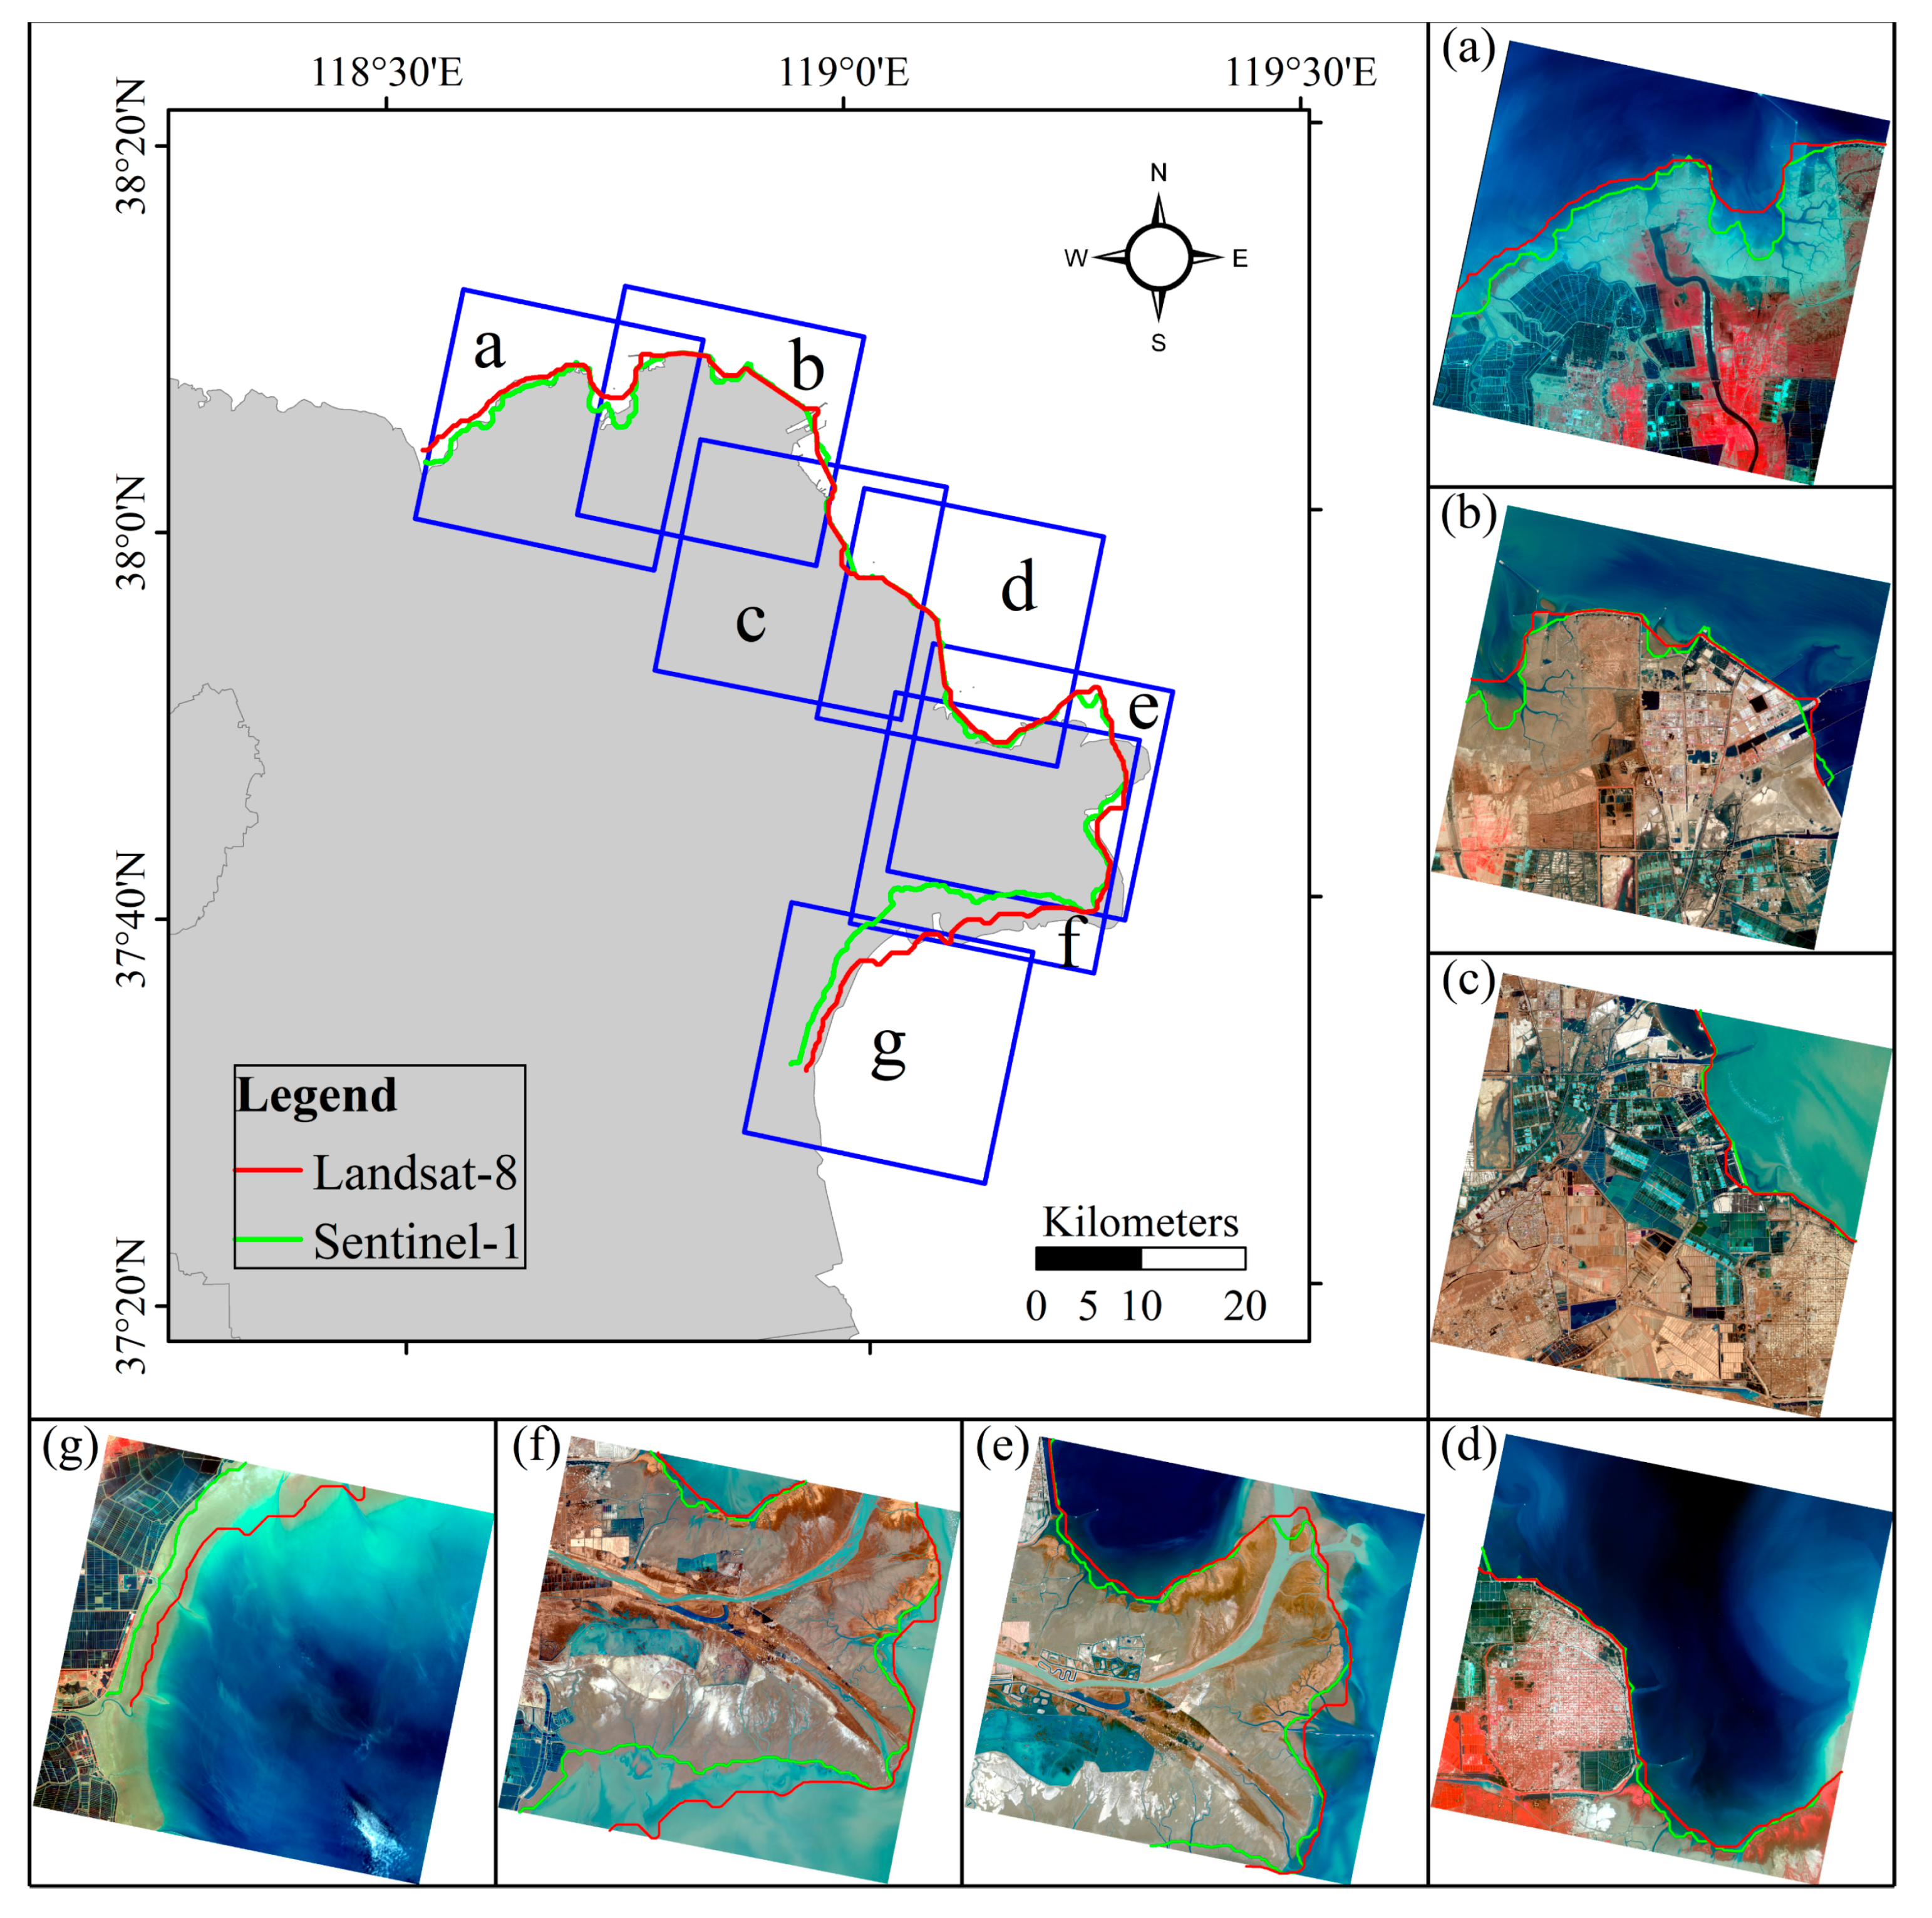
In this paper, SAR intensity information and band operation of optical images are used to carry out land and sea segmentation. To compare the differences in the extraction details between the two kinds of images, we investigated the shoreline extraction results of the YRD derived from the Landsat-8 OLI and Sentinel-1 IWS images by taking the example of the year 2017. The results are superposed on GaoFen-2 (GF-2) images with nadir pixel resolution of 3.2 m (see Figure 3). Due to the limitation of the GF-2 data source, the acquisition time was distributed between 2017 and 2020, leading to the actual distribution of coastlines in 2017 slightly different from those of the Landsat-8 and Sentinel-1.
In Figure 3, we can find that there is a significant difference between the shorelines in those nearshore areas where the slope is very flat and sediment is enriched (a, e, f, g) by visual interpretation. The result extracted from Sentinel-1 is closer inland than the Landsat-8. The biggest difference exists in the southern sediment-rich area of Qingshuigou Course in Figure 3f. In SAR images, the backscattering intensity is used to extract the coastline, which is the boundary between land and water. Therefore, we used existing Sentinel-1, GF-3, and Envisat ASAR images with a higher spatial resolution to replace Landsat images from 2004 onwards, except for that of 2013 (see Table 1).

2.3. Methods

2.3.1. Coastline Detection

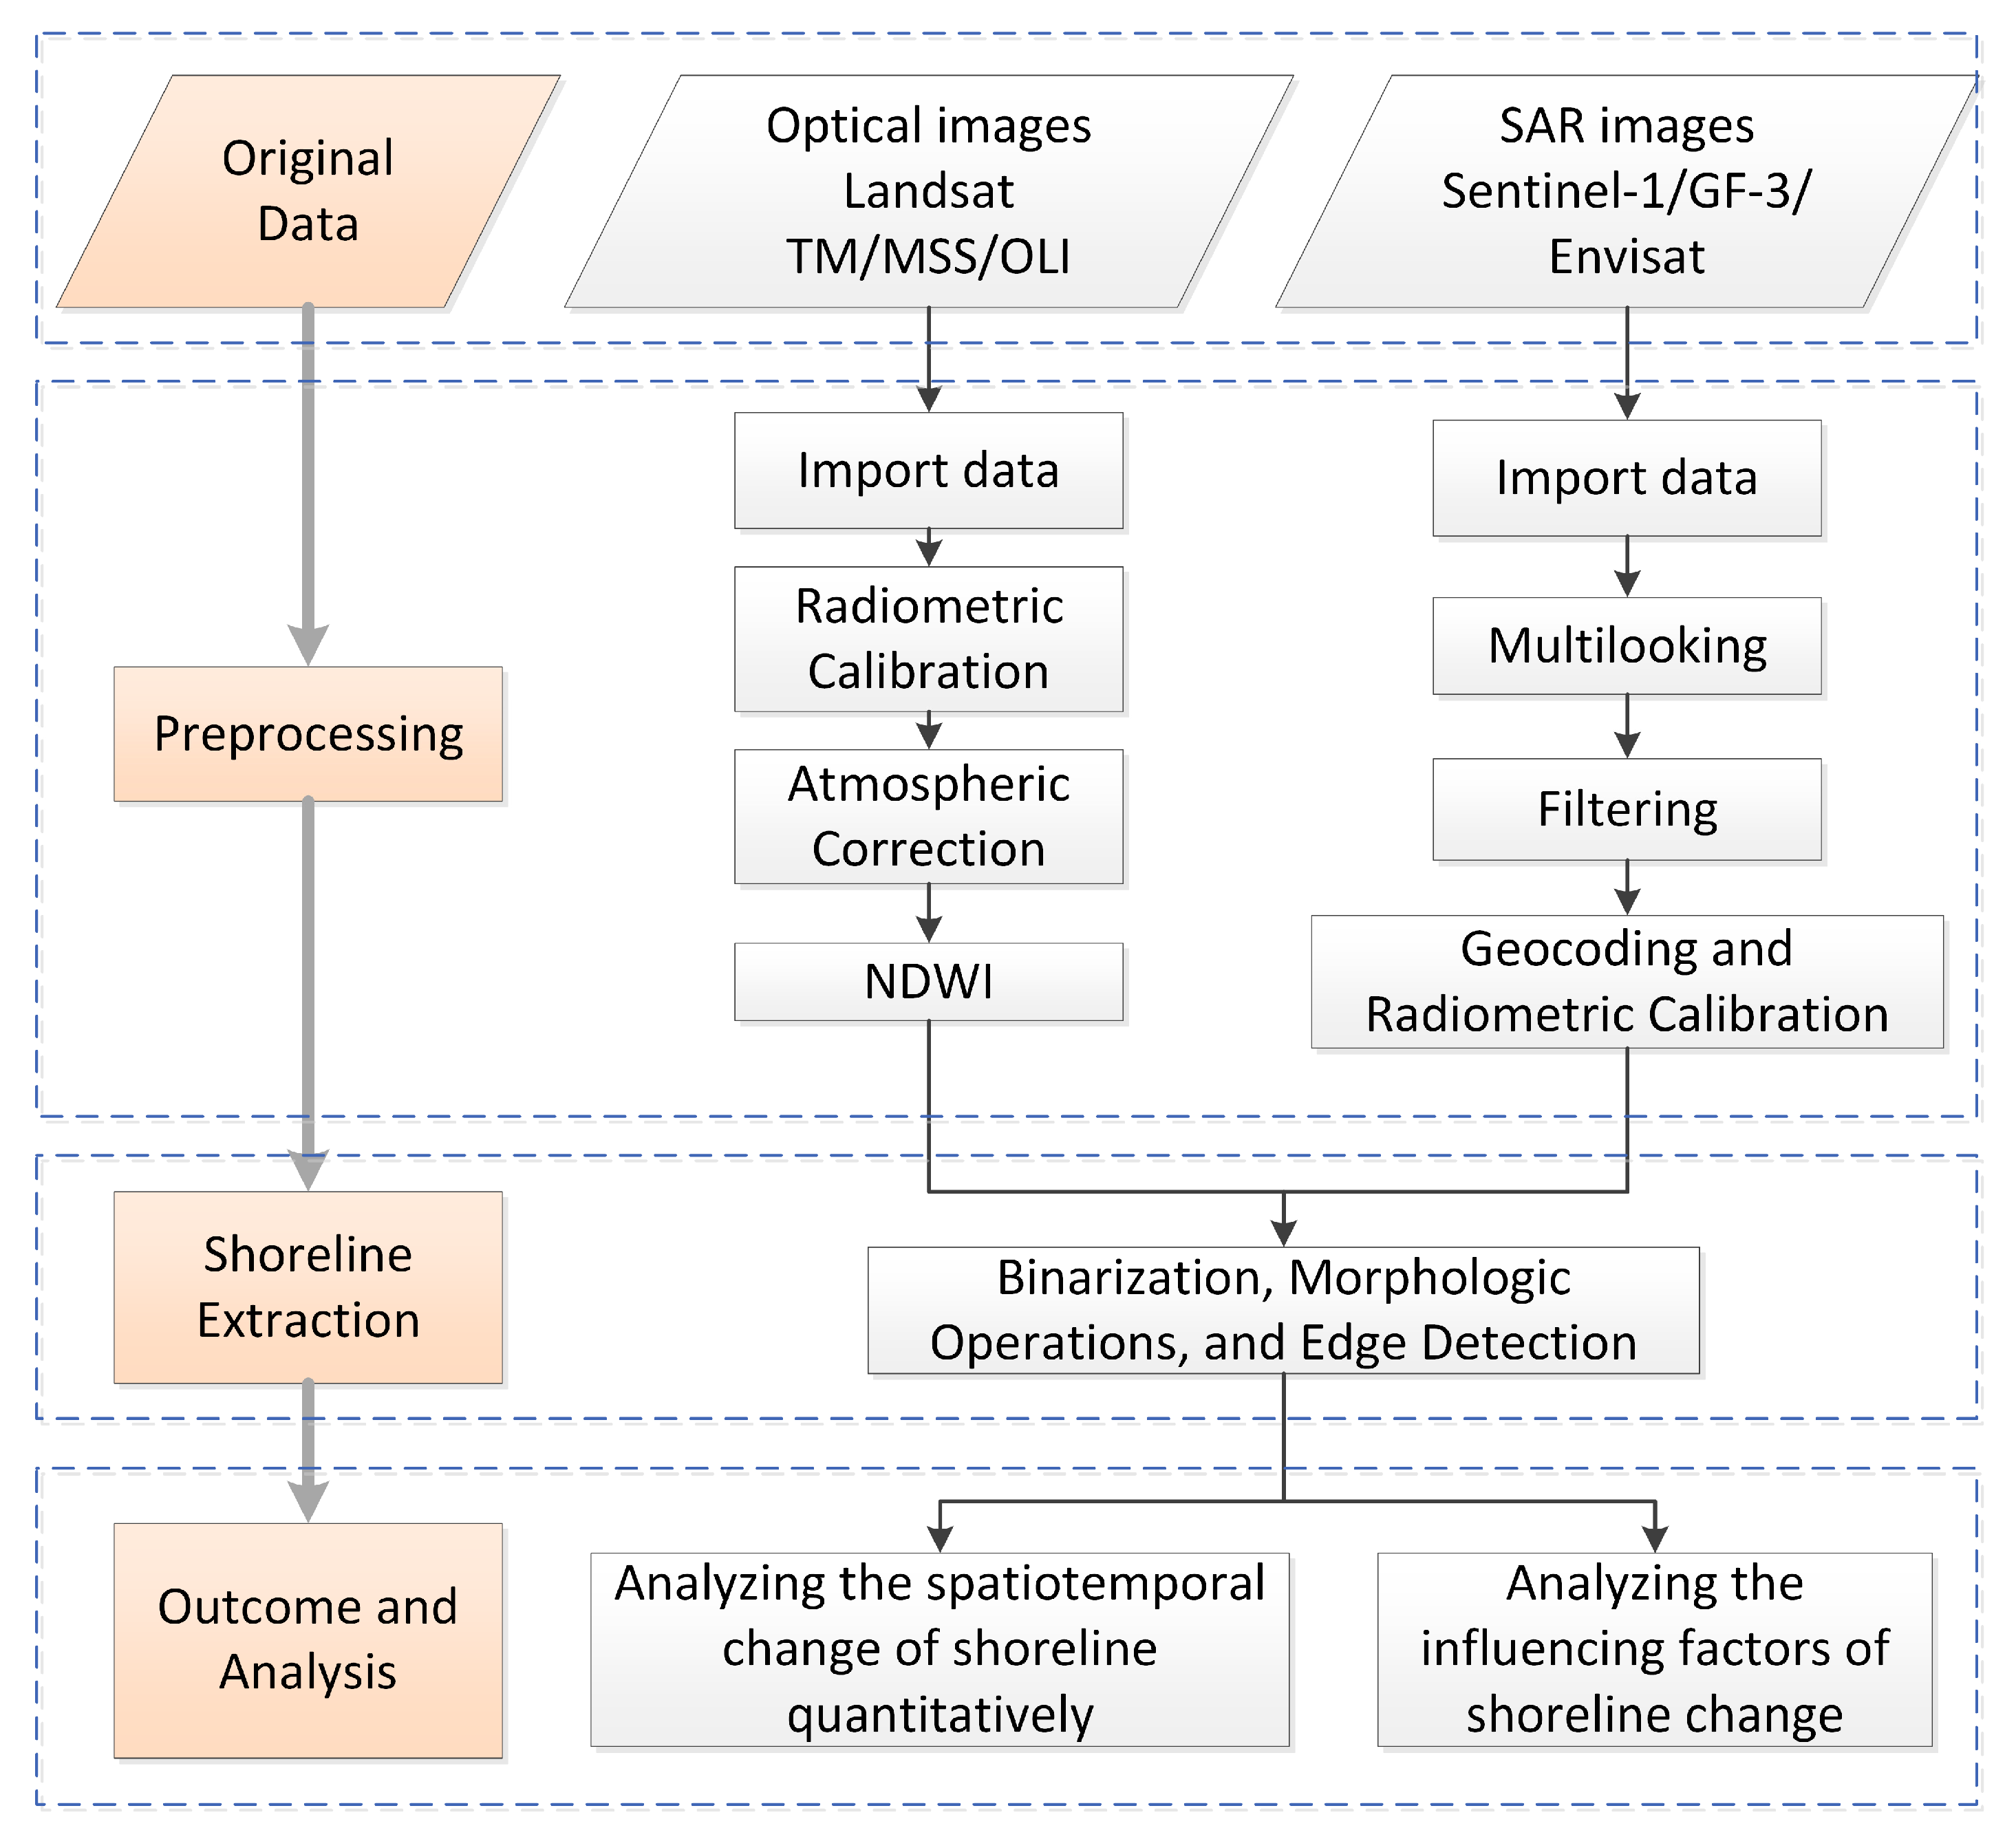
As shown in Figure 4, the preprocessing of Landsat images was firstly performed with ENVI® 5.5, including radiometric calibration and atmospheric correction. As a satellite-derived index derived from the near-infrared (NIR) and Green bands [40] (Equations (1)–(3)), normalized difference water index (NDWI) is usually used to make a preliminary distinction between land and seawater.
N D W I L a n d s a t 3 = ( B a n d   4 G r e e n B a n d   7 N I R ) ( B a n d   4 G r e e n + B a n d   7 N I R )
N D W I L a n d s a t 5 = ( B a n d   2 G r e e n B a n d   5 N I R ) ( B a n d   2 G r e e n + B a n d   5 N I R )
N D W I L a n d s a t 8 = ( B a n d   3 G r e e n B a n d   5 N I R ) ( B a n d   3 G r e e n + B a n d   5 N I R )
The NIR reflectance is affected by leaf internal structure and leaf dry matter content but not by water content [41]. Although the NDWI index was created for Landsat MSS images [30], it has been successfully used with other sensor systems in applications where the measurement of the extent of open water is needed [42]. In this study, we used Landsat-3 band 4/7, Landsat-5 band 2/5, and Landsat-8 band 3/5 to compute the NDWI values.
As for SAR images, GF-3 was preprocessed with the Pixel Information Expert (PIE®) SAR 6.0, while Envisat ASAR and Sentinel-1 were preprocessed with the Sentinel Application Platform (SNAP®) 7.0. After preprocessing, binarization processing was then employed. According to a series of morphological operations, the results showed a clear boundary of water and land. Enhanced Lee filter is used primarily to suppress speckle in radar imagery while simultaneously preserving texture information in heterogeneous areas. This filter that uses local statistics (coefficient of variation) within individual filter windows smooths images without removing edges or sharp features while minimizing the loss of radiometric and textural information. In areas containing isolated point targets, this filter preserves the observed value.
The most widely used threshold segmentation method is the fusion of NDWI and image binarization. Thresholding is a conceptually simple segmentation technique by using a histogram to segment images. At present, the optimal threshold is designed to determine and improve the threshold segmentation method. In this study, we used the threshold segmentation method proposed by Otsu [43], which is considered a gold standard in the field of thresholding.
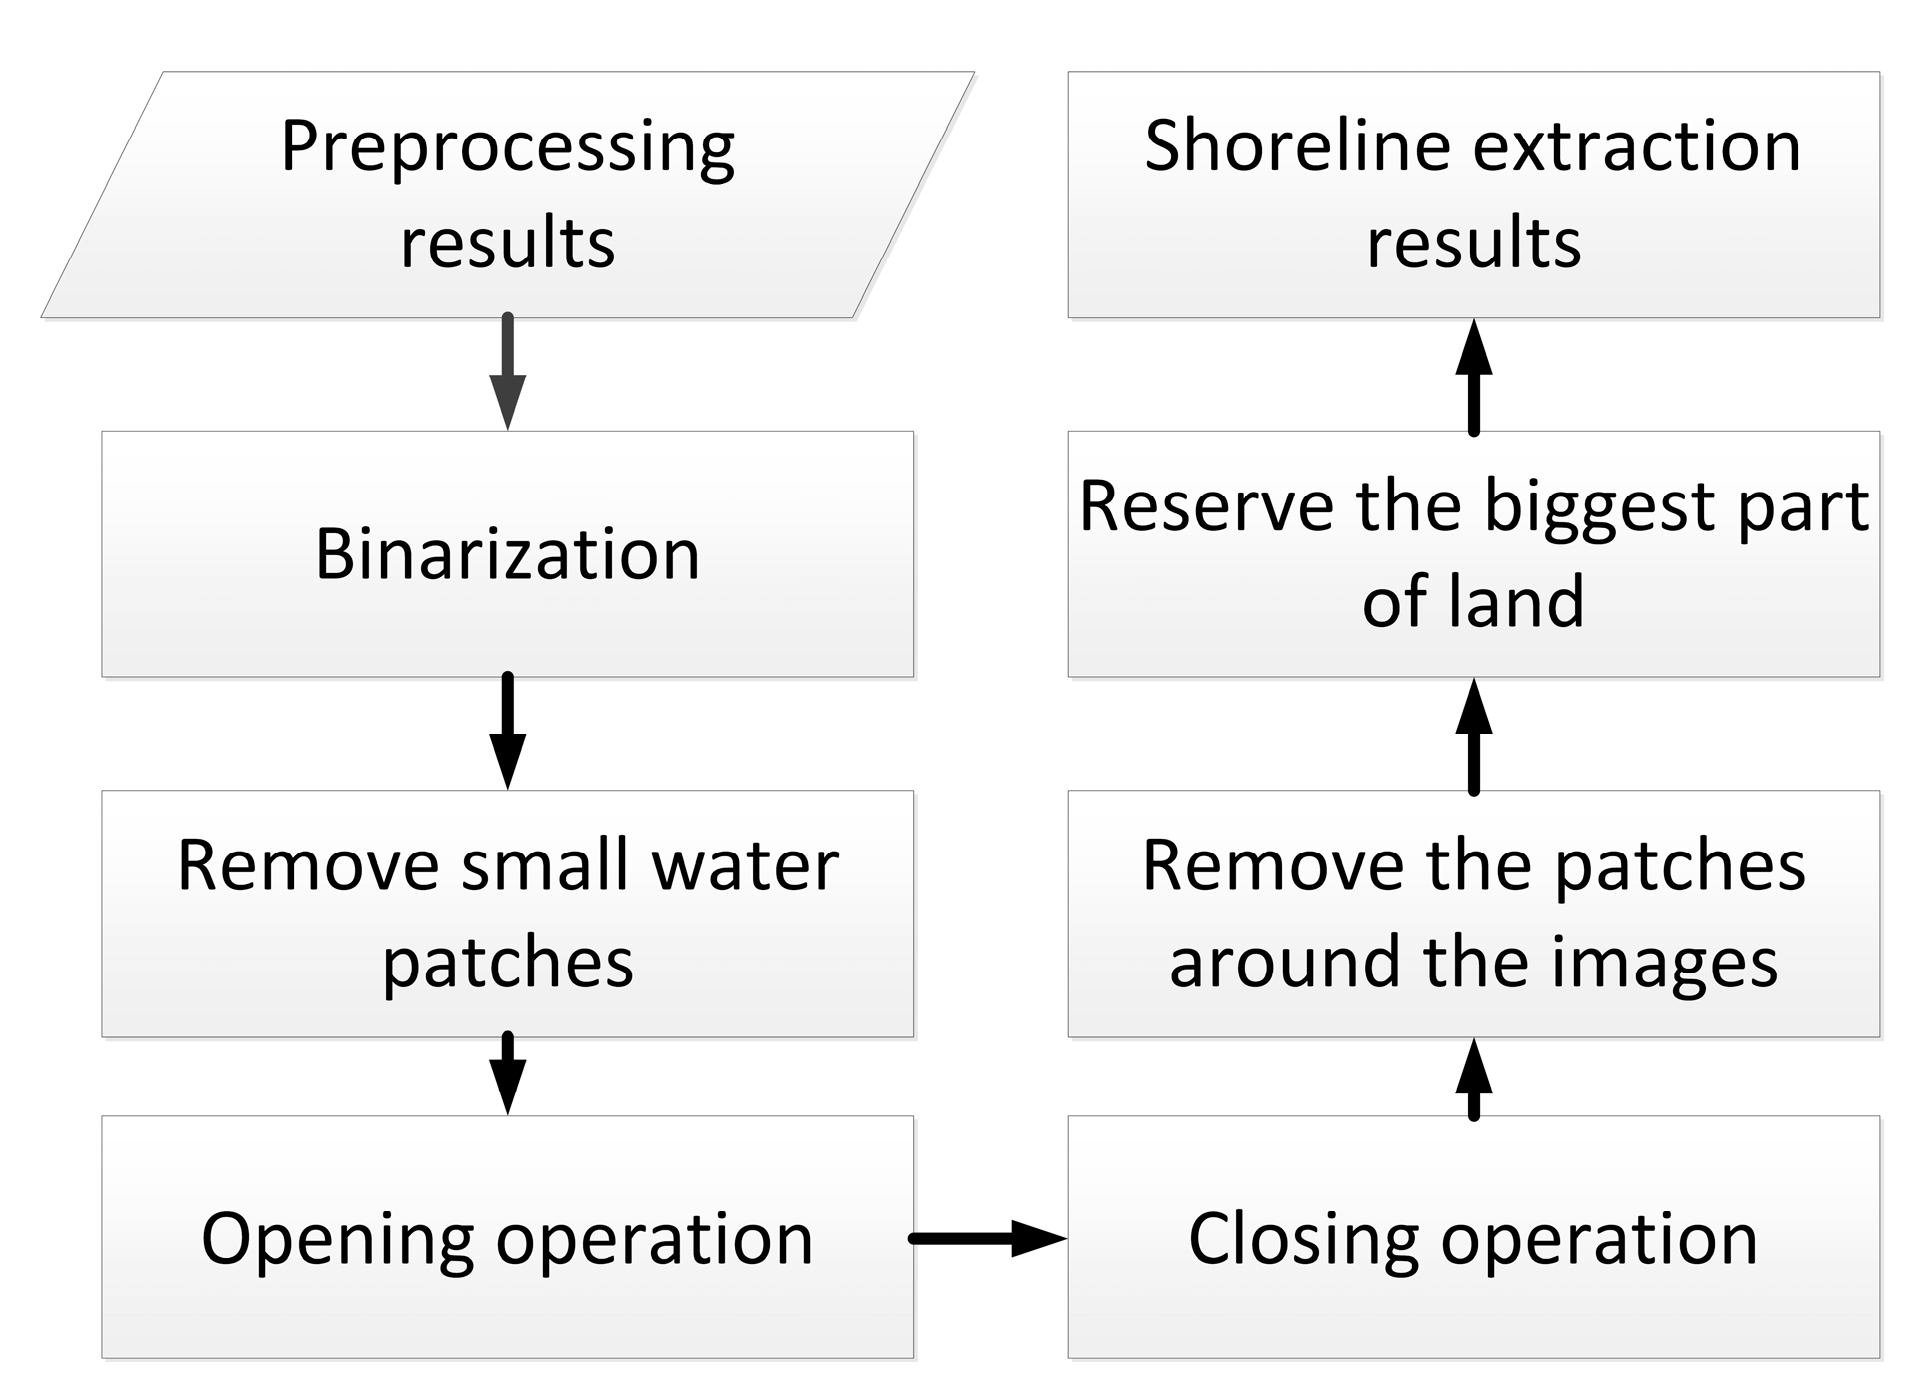
Figure 5 shows the flowchart of detailed water edge extraction. In the binary images obtained above, the gray level of pixels in the image was first converted to 0 or 1. The pixels with gray level 0 are represented by black, while the pixels with gray level 1 are represented by white. Morphology defines the white area with a gray level of 1 as the ‘highlighted part’ and the black part as the ‘background’. Then, small water patches were removed after binarization. Furthermore, opening and closing operations were used to smooth the coastlines.
Opening operation is a dilation after a erosion, using the same structuring element for both dilation and erosion. Closing operation is an erosion followed by a dilation. Expansion and corrosion are usually used in pairs to eliminate small particle noise and make the water edge smoother. Dilation operation process is to highlight the effect of target pixels extend outward into the background, and can splice and combine the fractured object for extracting the main body of the object. It also can be used to fill the patches in the region of interest, eliminate speckle noise in the region of interest. The function of erosion operation is to eliminate the highlighted boundary points. It is the process of boundary shrinking inward, aiming to eliminate the small and meaningless target objects at the boundary. Sobel operator method is simple, fast, and the extracted boundary is smooth and continuous. Therefore, Sobel edge detection operator was used to extract water edges in this paper.
A good overview of the state of the art for coastline and shoreline derivation from remote sensing images is given by Gens [44], who notes that the term ‘coastline’ is customarily used in remote sensing-based studies, while the coastal community commonly refers to it as ‘shoreline’. The definition of the shoreline theoretically is supposed to represent the linear boundary between the maritime. Though its apparent simplicity, for practical purposes, the dynamic nature of this boundary and its dependence on the temporal and spatial scale at which it is being considered results in the use of a range of shoreline indicators as following [30]. Therefore, the chosen definition should consider the shoreline in both a temporal and spatial sense and take account of the dependence of this variability on the time scale by which it is being investigated.
Accurate shoreline extraction is very important to find out the relationship between shoreline change and sediment load. Tidal variation plays a leading role during high resolution aerial survey, whilst it can be safely neglected for satellite data acquisition due to the coarser resolution of the satellite data. The aspect of time averaging can be critical for some remote sensing techniques [44]. Boak and Turner [14] proposed three groups of shoreline indicators as the ‘true’ shoreline positions as shown below.
  • A visually discernible indicator is a feature that can be physically seen, e.g., a previous high-tide line or the wet and dry boundary, usually preferred for photo interpretation, aerial photography, and earth observation data.
  • A specific tidal datum based shoreline indicator is determined by the intersection of the coastal profile with a specific vertical elevation, defined by the tidal constituents of a particular area, for example, mean high water (MHW) or mean sea level.
  • An indicator for the application of image processing techniques to extract proxy shoreline features from digital coastal images that are not necessarily visible to the human eye and the accuracy of all techniques usually rely on the spatial resolution of the images used.
Due to the lack of tidal data for long-term span that could be used for tidal correction to get the mean high water, the second method would not be realizable. Therefore, Kuenzer et al. [27] used the first indicator to derive shorelines of YRD. However, the range of error caused by resolution that lies in the range of half a pixel is much less than the range of shoreline change.
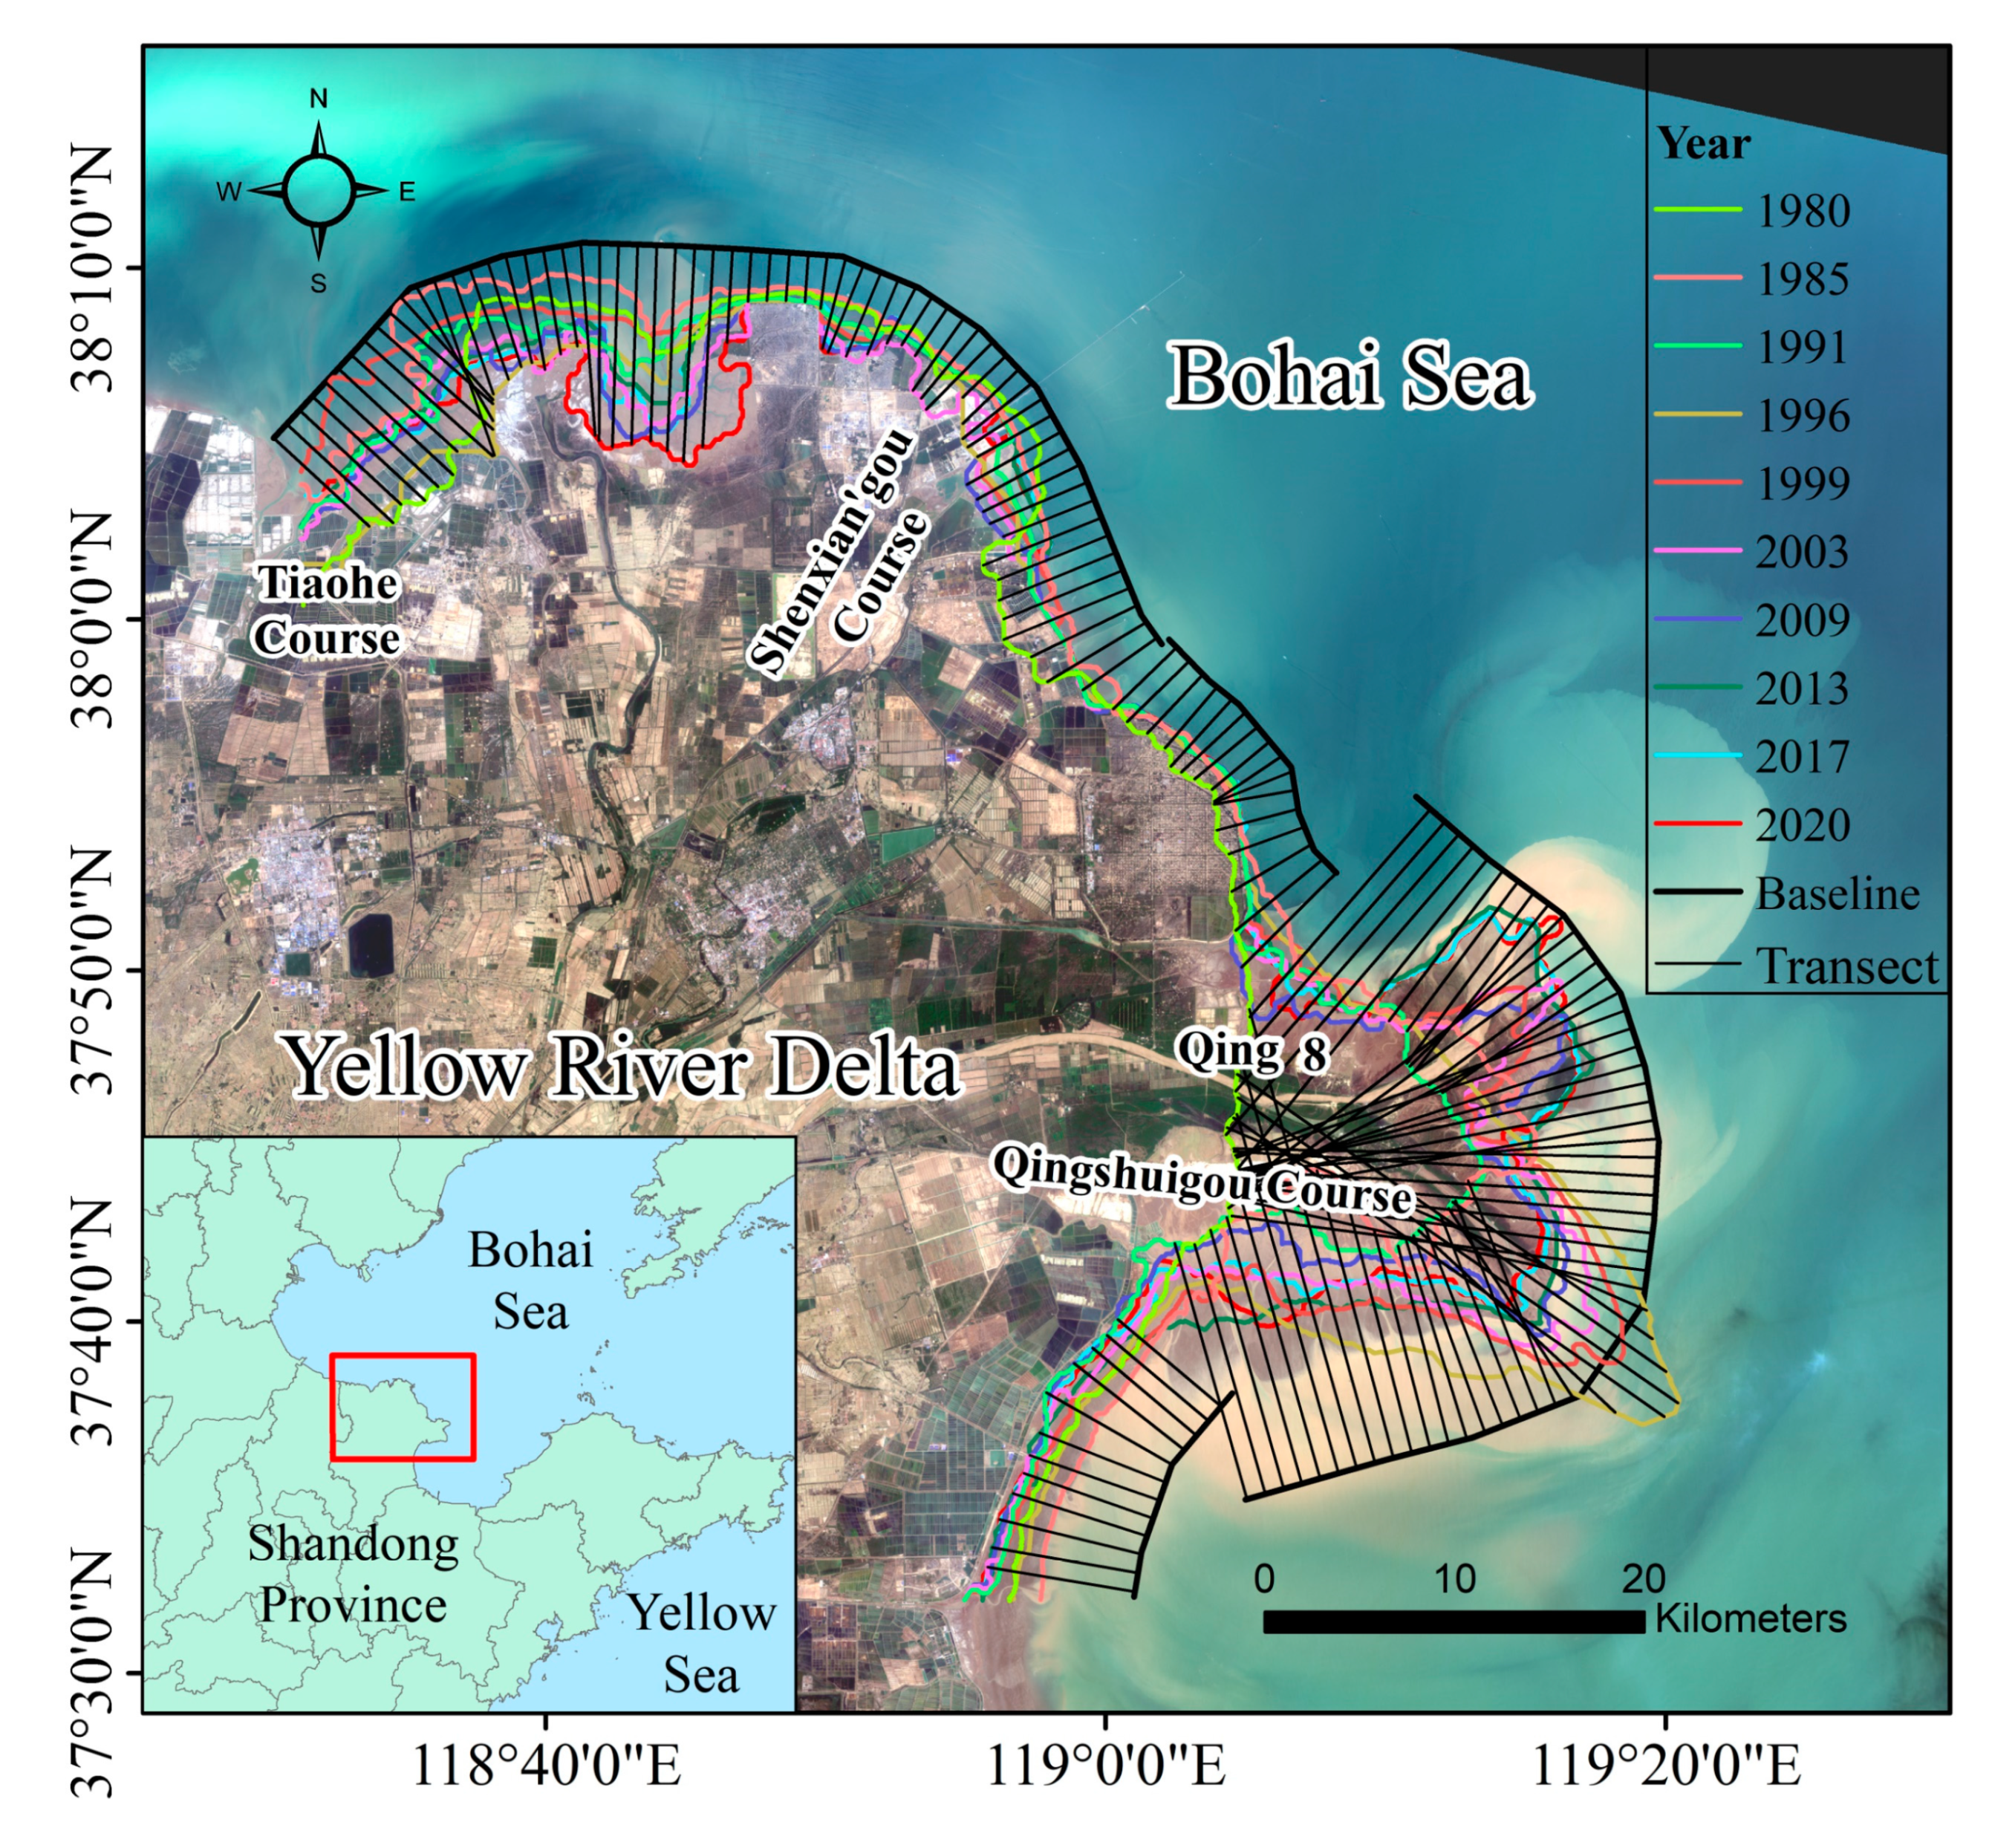
In this study (Figure 6), we mainly used the third indicator group to derive the water–land boundary as the shoreline. For the early low-resolution images in 1980 and 1985, the shoreline extracted were also inspected by combining the visual interpretation.
To evaluate the coastline extraction accuracy, we conducted Global Position System real time kinematic (GPS RTK) measurements of water boundary along the Gudong oilfield artificial coastal dam on 11 January 2020. The Gudong coastal dam, with a length of 12 km, was built in the 1980s to prevent the intrusion of seawater and provide the most important security barrier between the Gudong oilfield and Bohai Sea [15]. The highest point of the dam below the seawall is 4.3 m and the lowest point filled with dolosse to sea water is 3.4 m, both of which are higher than the high sea-level of 2.5 m.

2.3.2. Change Rate of Coastline

The rate of change in the past four decades is derived from a time series of shoreline vector data of the YRD with the Digital Shoreline Analysis System (DSAS) version 5.0. As is shown in Figure 7 and Figure 8, end point rate (EPR) and linear regression rate (LRR) are used to describe the change rate of the coastline (Equations (4)–(7)).
E P R = D i s t a n c e T i m e   = N e t   S h o r e l i n e   M o v e m e n t   ( m ) T i m e   S p a n   ( years )
where net shoreline movement (NSM) is equal to distance oldest and youngest shoreline; time span (SP) equals to time between oldest and most recent shoreline.
A linear regression rate-of-change statistic can be determined by fitting a least-squares regression line to all shoreline points for a transect. As the slope of the line (Equation (6)), the calculation of the LRR is based on accepted statistical concepts [45,46]. The method of linear regression uses all the data, regardless of changes in trend or accuracy.
y = a + b x
b = i = 1 n ( x i x ¯ ) ( y i y ¯ ) i = 1 n ( x i x ¯ ) 2
a = y ¯ b x ¯
where x i is the year; y i is the distance from the intersection to the baseline along one transect; x ¯ and y ¯ are the averages of x i and y i , respectively.
In the selection of the baseline position, the trend of all shorelines should be taken into account, especially in areas where the shoreline curvature changes greatly. In addition, the true change of shoreline of each section still needs to be manually identified. When selecting the location of the section, the selection of the tangent line depends on the setting of the baseline, especially the places with very drastic changes for some jumping points of the curve, which may also be difficult to reflect the real changes of the shoreline. In the section of uncertainty analysis of coastline extraction below, we set up a tangent with 50 m as the sampling interval to calculate the distance between the extracted coastline and the reference coastline along the tangent.
EPR and LRR can only roughly reflect the changes of shoreline. In cases where more data are available, EPR only uses the oldest and most recent shoreline, which would ignore additional information, e.g., the trends of accretion and erosion. The method of linear regression is susceptible to the effects of outliers and trends to underestimate the rate of change relative such as EPR [45,46,47]. In order to describe how shorelines change over time in detail, Figure 9 shows the staged ‘end point rate’ based on the distance of the intersection point along a transect between the adjacent shorelines, which presents the detailed information of shoreline accretion and erosion year by year in the YRD.
In shoreline analysis section, we use Pearson’s correlation coefficient and coefficient of determination to analysis that shoreline change. As shown in Formula (8), Pearson’s correlation coefficient is used to measure the strength of the relationship between two variables and their association with each other. The values can range from [−1.0, +1.0], where the +1.0 and −1.0 respectively indicate the perfect positive and negative relationship between the variables considered, and a 0.0 value indicates that no relationship exists.
r = C o r r e l a t i o n ( X , Y ) =   ( x x ¯ ) ( y y ¯ )   ( x x ¯ ) 2   ( y y ¯ ) 2
where x ¯ and y ¯ are the average of two variables x, y, respectively.
As shown in Equation (9), coefficient of determination R2 is used to measure the percentage of variance in the data that is explained by a regression. As a dimensionless index, the value ranges from 1 to 0, where 1 is perfect fit. R2 values close to 1.0 imply that the best-fit line explains most of the variation in the dependent variable.
R 2 = 1   ( y y ) 2   ( y y ¯ ) 2
where y , y , and y ¯ is measured data, predicted value, and mean of the measured data, respectively.
The observations of sediment load and water discharge are collected at the Yellow River Lijin Hydrometric Station (http://www.mwr.gov.cn accessed on 1 April 2021). The Lijin Station is the last hydrological station before the Yellow River enters the sea. The measurements of water discharge and sediment load from this station are used to investigate the correlation between the amount of water and sediment and the change of shoreline length and area of YRD.

3. Results

3.1. Historical Evolution of Coastlines over the YRD

As shown in Figure 7 for the analysis of shoreline change, the extracted shoreline ranges from the eastern part of Tiaohe Course to the southern part of Qingshuigou Course, where the distance between adjacent transects is set as 1000 m.
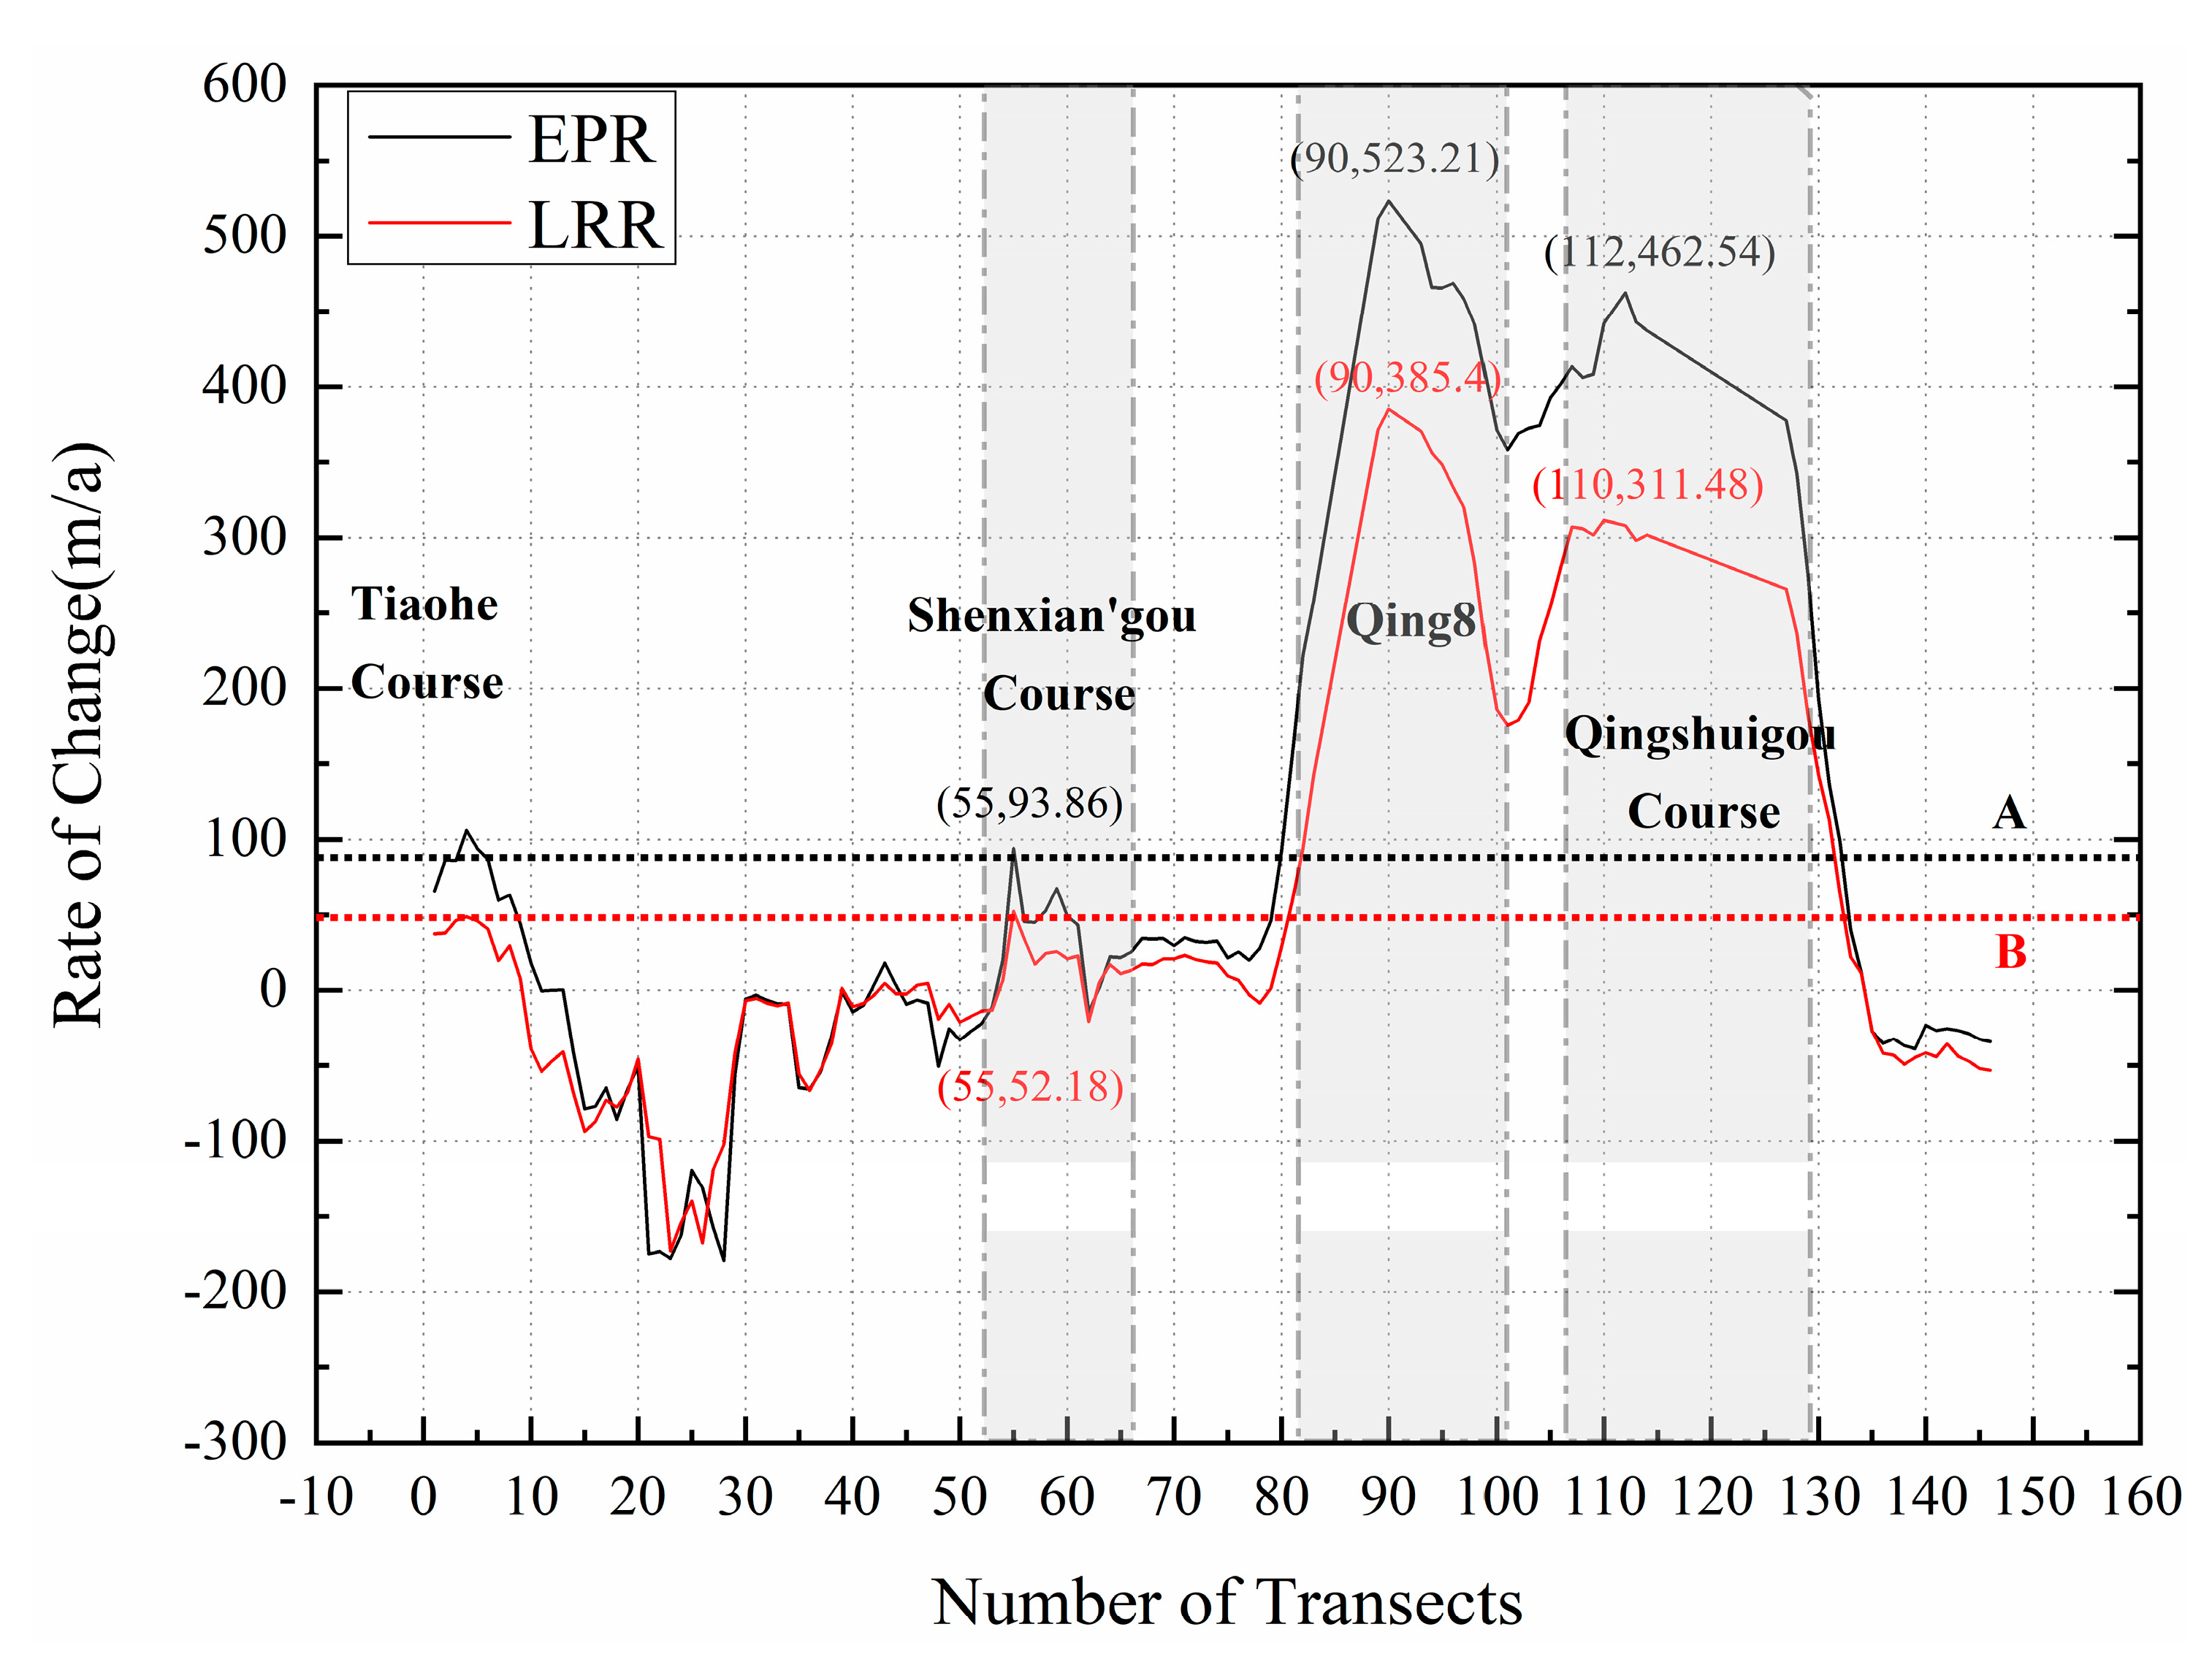
The rate of change from 1980 to 2020 in Figure 8 shows spatial heterogeneous variability as a whole with average EPR of 87.87 m/a and LRR of 47.82 m/a, respectively. There are significant positive bursts in four areas including Tiaohe, Shenxian’gou, Qing 8, and Qingshuigou course, which are mainly due to artificial land reclamation and deposition of sediment. However, a great negative change with the erosion rate more than −150 m/a in EPR and LRR exists in the northernmost area of YRD near Diaokou river course that probably attributes to winter storm surge erosion.
In Shenxian’gou Course, the maximum change rates of the shoreline are 93.86 m/a in EPR and 52.18 m/a in LRR, which are 2.9 times the average EPR and 3.6 times of the average LRR within transects from no. 55 to no. 66. In Qing 8 Course, the maximum change rate reach 523.21 m/a in EPR and 385.4 m/a in LRR, which are 4.9 times the average EPR and 6.2 times the average LRR within transects from no. 82 to no. 101, respectively. In Qinghsuigou Course, the maximum change rates of the coastline reach 462.54 m/a in EPR and 311.48 m/a in LRR, which are 4.5 times the average EPR and 5.8 times of the average LRR within transects from no. 107 to no. 129. In summary, Qing 8 and Qingshuigou Course are the areas with the most dramatic changes of shoreline in the past 40 years.
The staged average annual rate of change of adjacent shorelines in three key areas of the YRD is illustrated in Figure 10. From 1980 to 1985, all the three sections of shorelines were in a state of accretion. From 1985 to 1996, the annual change rate of shoreline in the Qingshuigou Course was as high as 400 m/a due to the high sediment transport, while there was a sharp decline in the period of 1996–1999 as a result of the artificial diversion of the Yellow River. From 1999 to the present, the overall annual change rate in the three areas is less than 100 m/a, which indicates that erosion and accretion alternate and gradually reach a balance, except that of Qing 8 in 2009–2013.

3.2. Area Change, Water Discharge, and Sediment Load

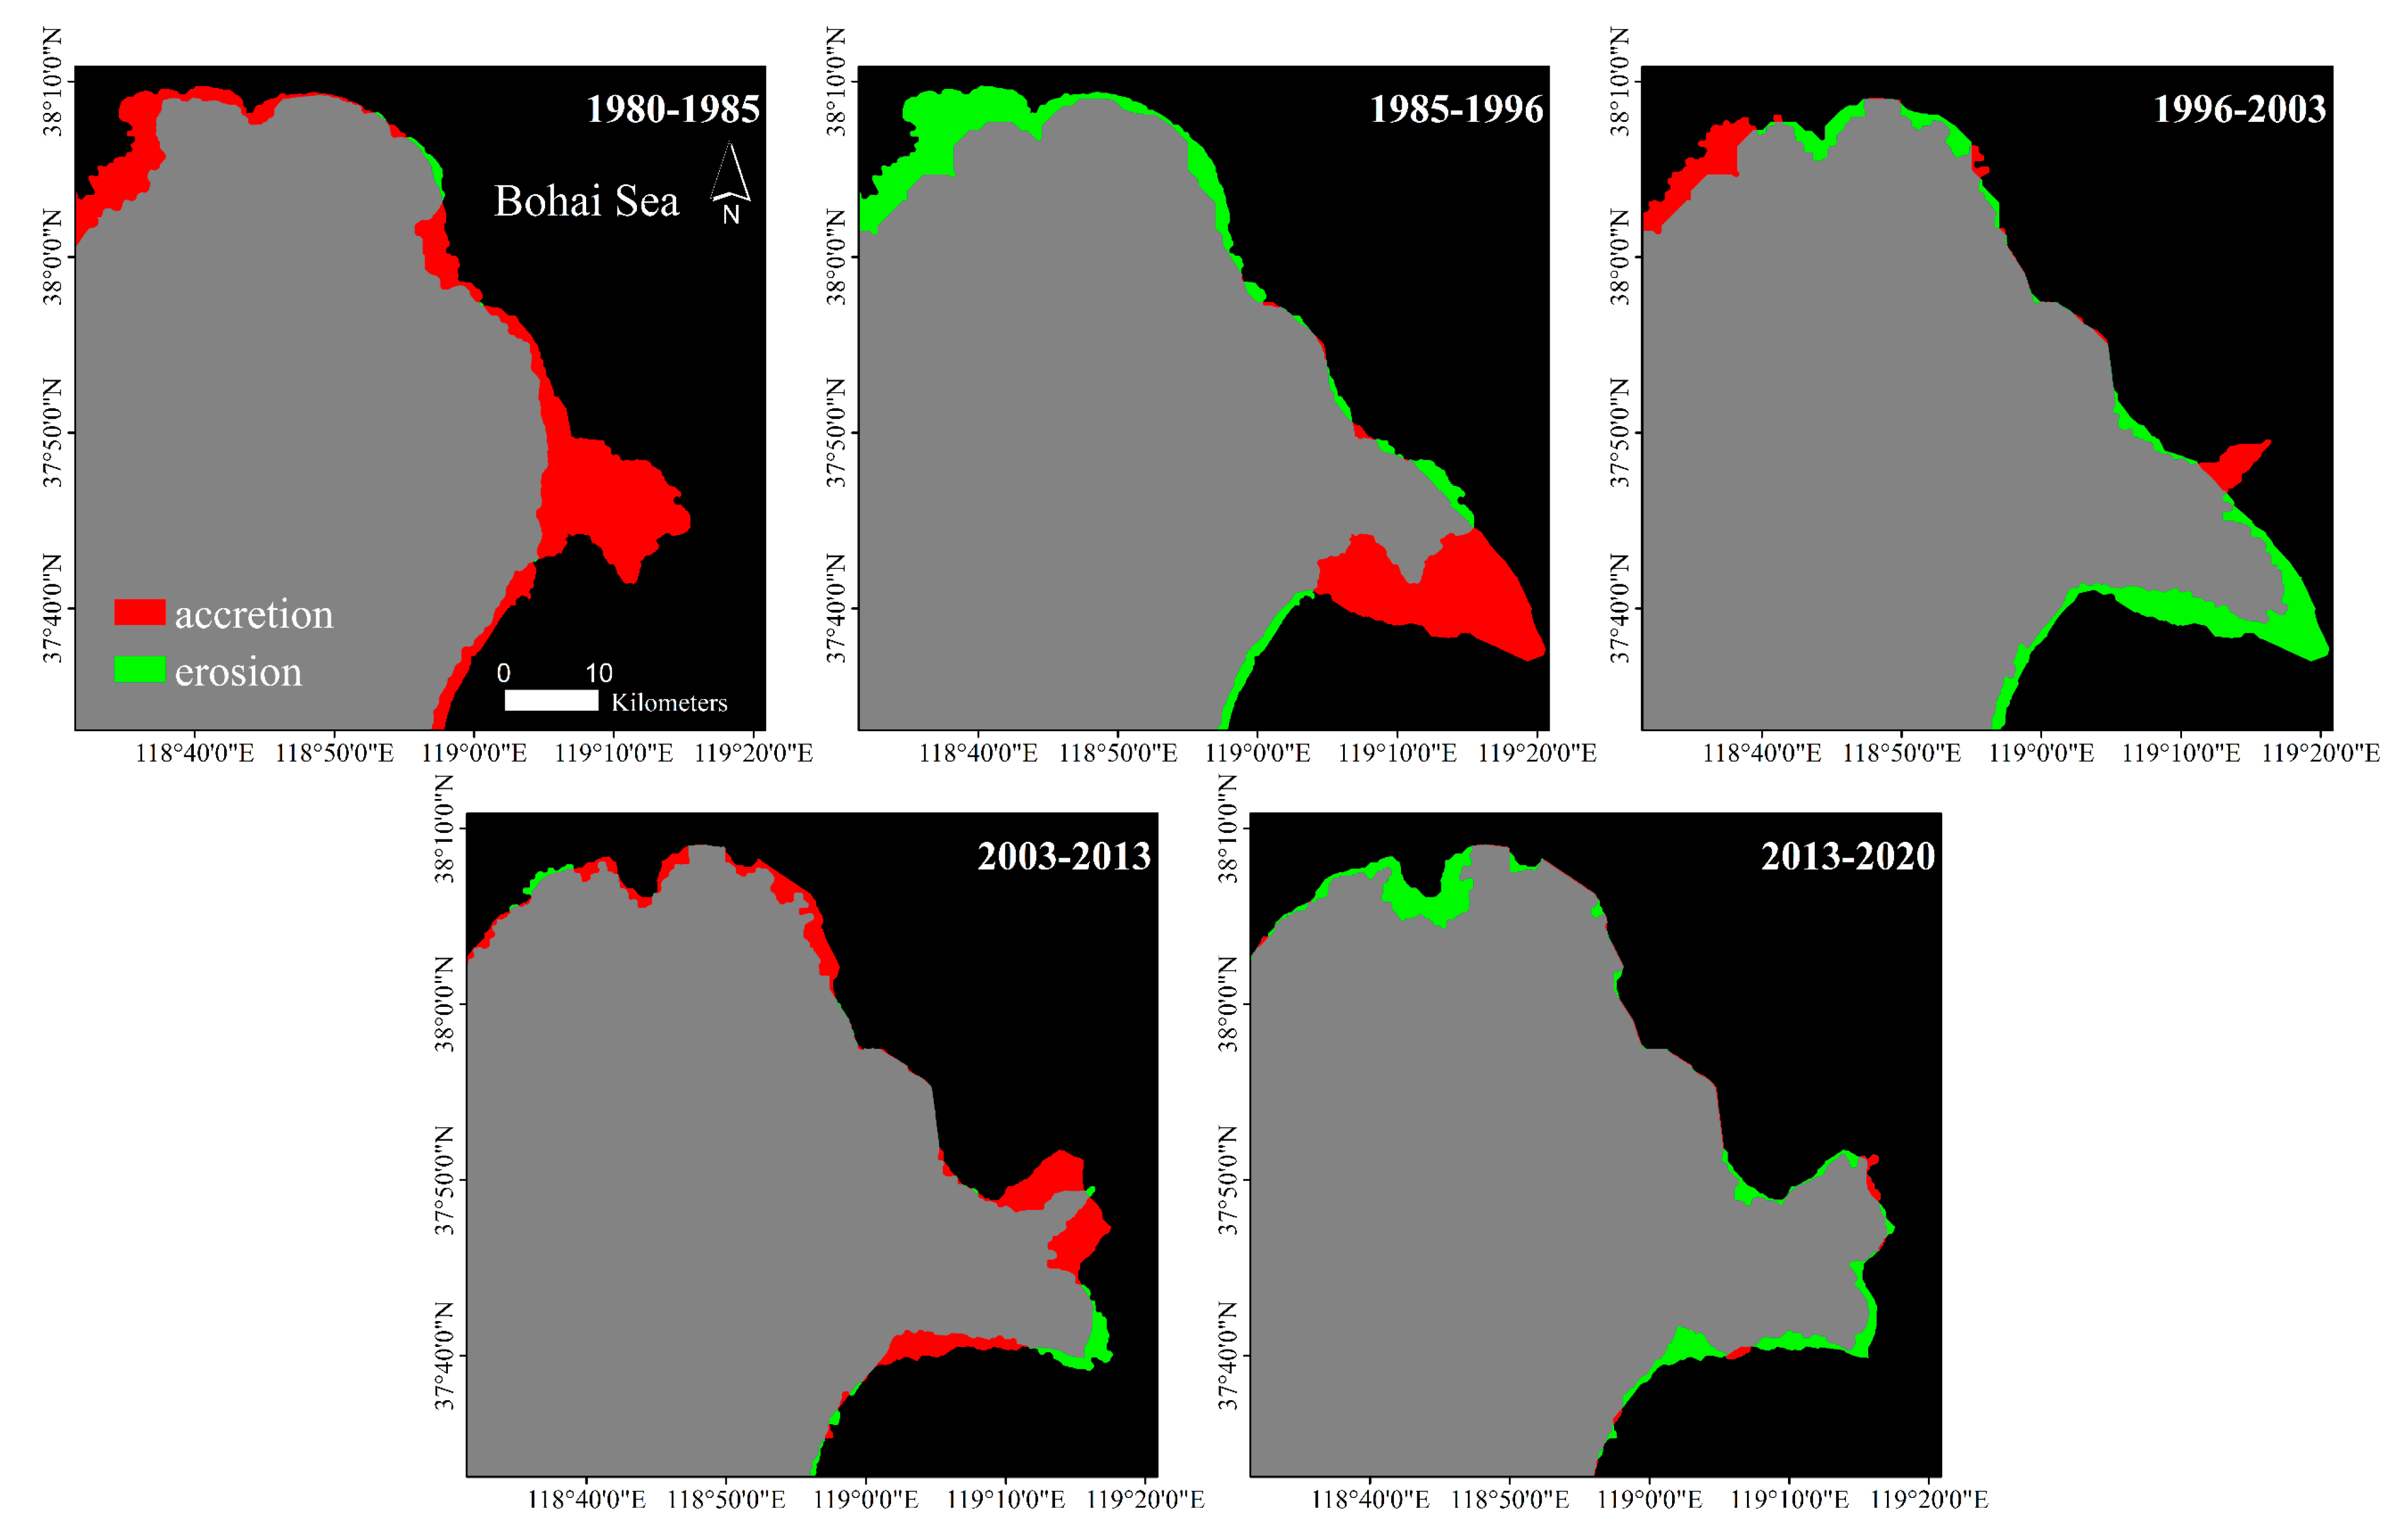
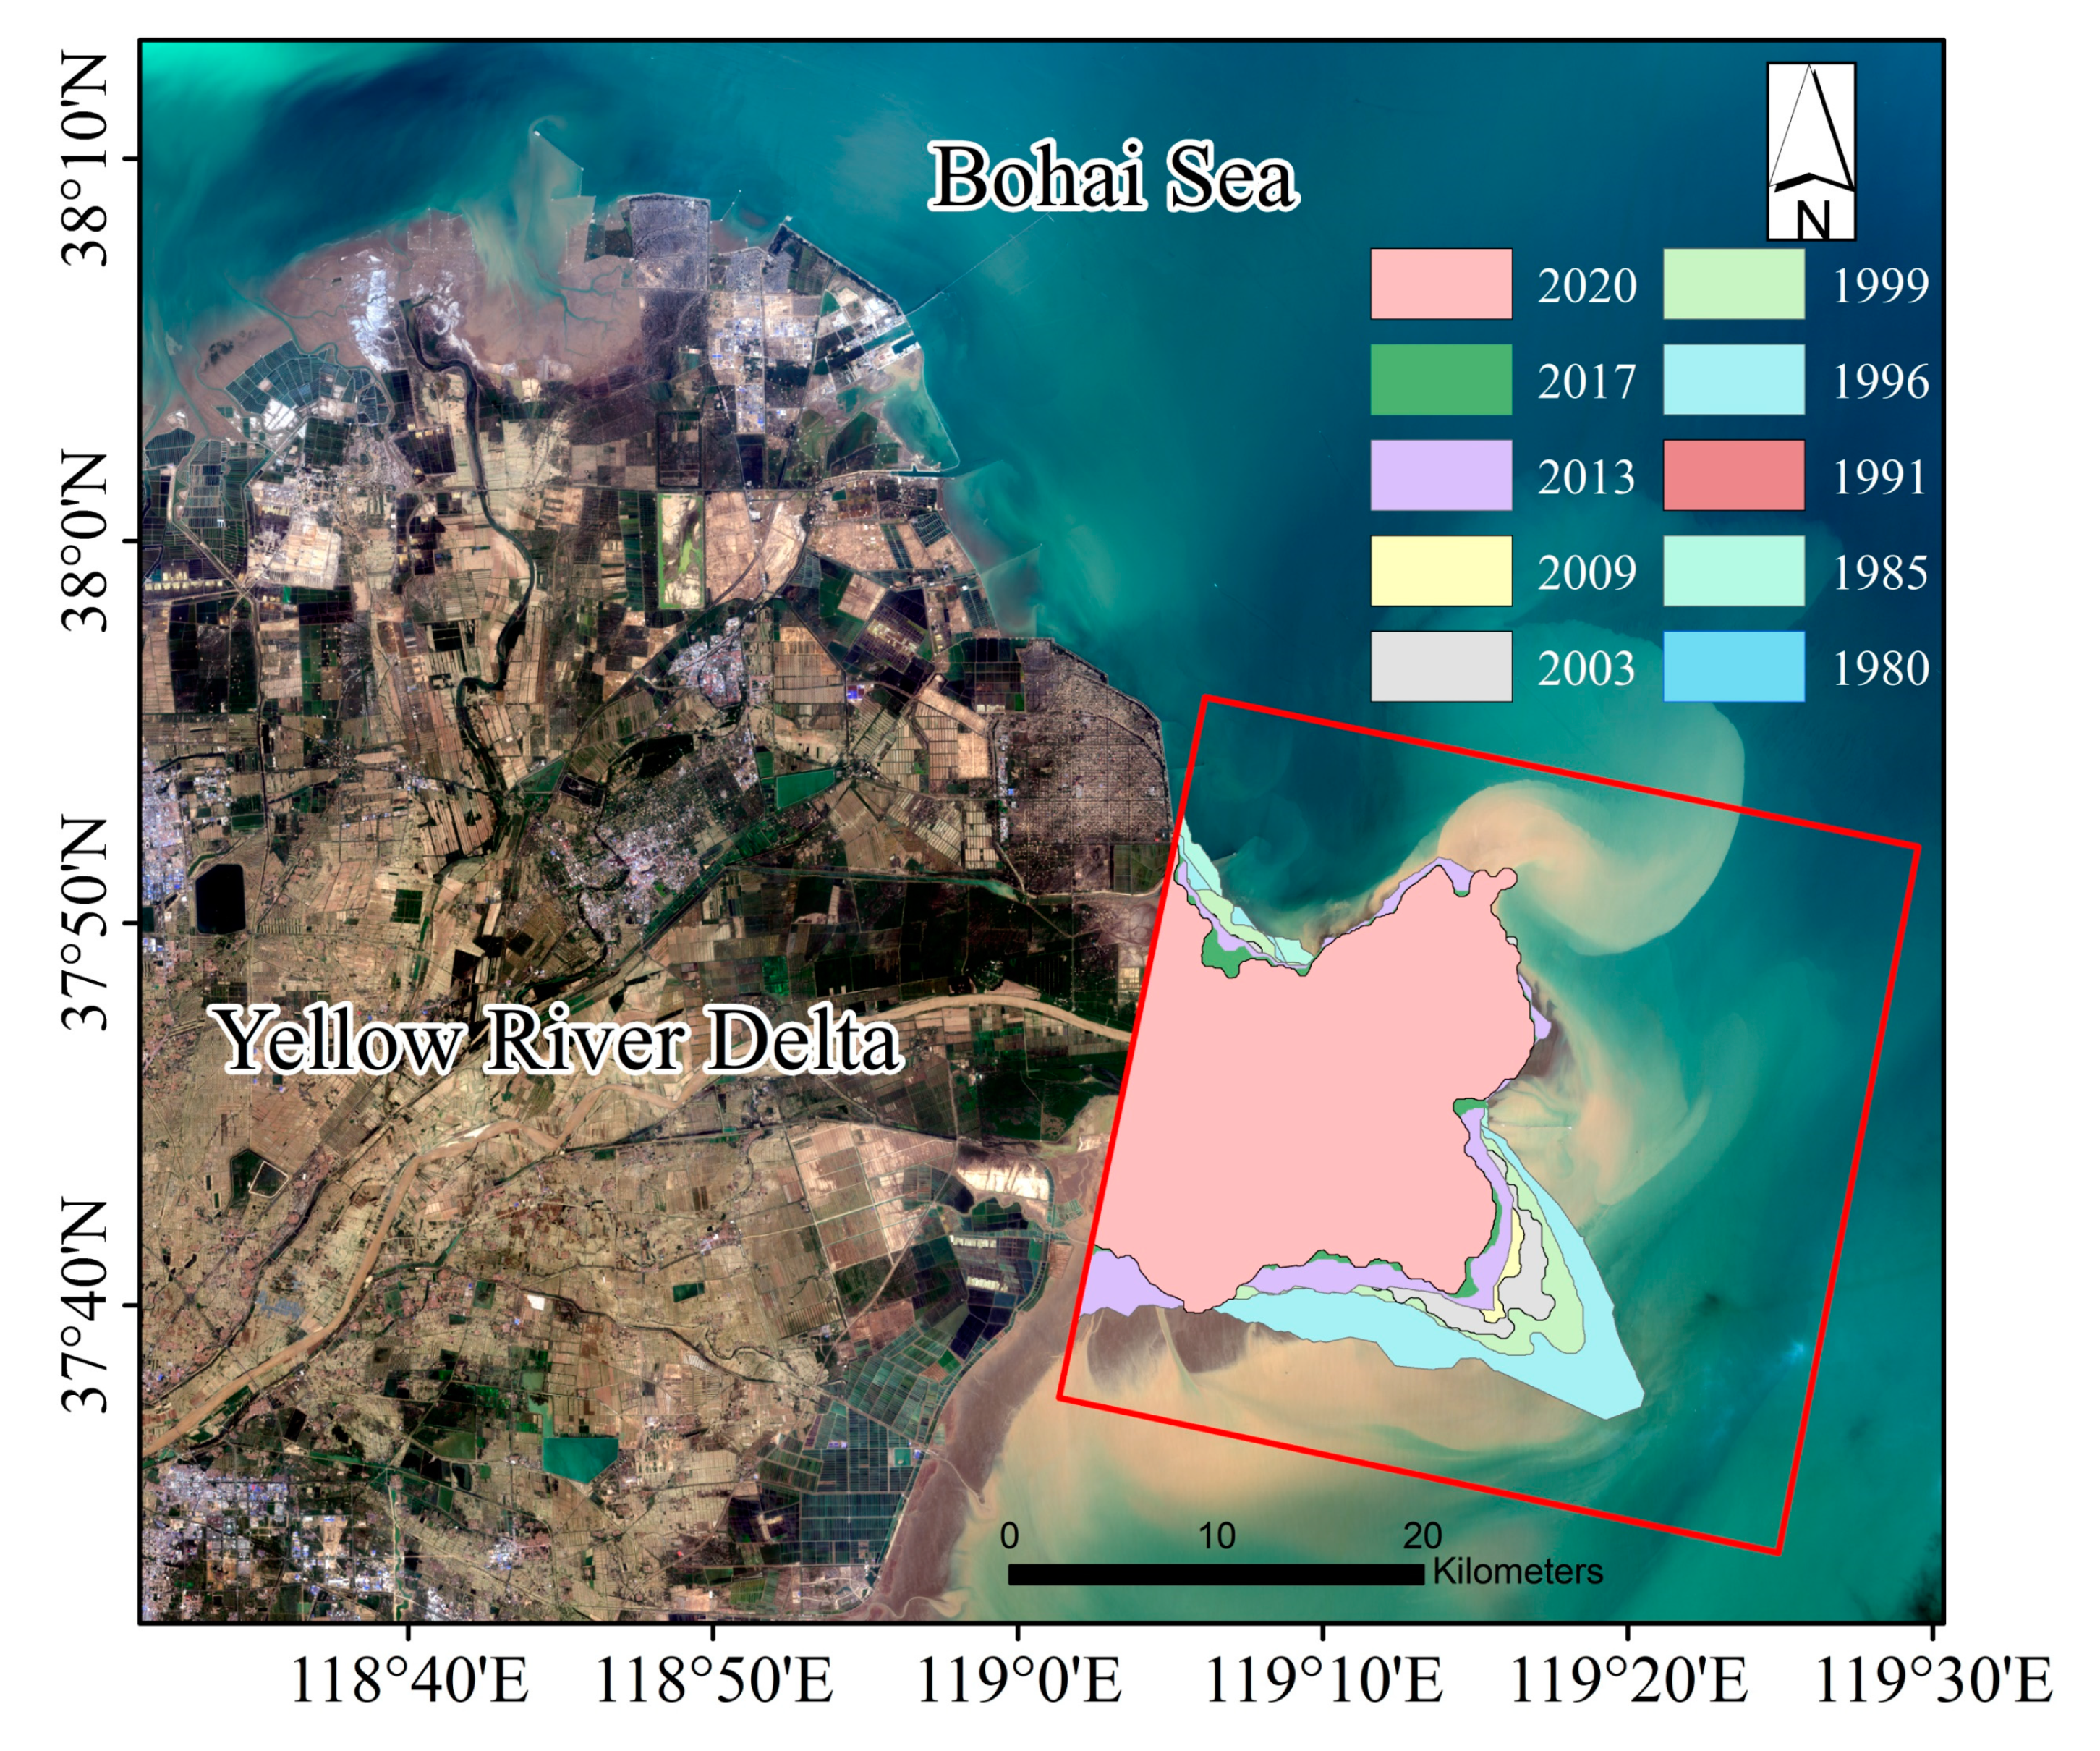
As shown in Figure 11, the staged area changes over the YRD for the last four decades are estimated from the extracted coastline vector data. From 1980 to 1985, the entire YRD was basically in the state of accretion. In the years 1985–1996, the accretion area was mainly located in the Qingshuigou Course due to sufficient sediment accumulation, while the erosion area was located in the north part of the YRD. In 1996, the coastal boundary outline of Gudong Oilfield was initially formed, and the coastline of this area has been stable since 1996. From 1996 to 2003, the change of the mouth of the Yellow River led to the reduction of the area of Qingshuigou channel, and Qing 8 Course gradually expanded to the sea. From 2003 to 2013, the Qing 8 Course further expanded to the sea, mainly in the mouth of the Yellow River to the direction of the lobes on both sides of the river, while the Qingshuigou Course was eroded to a lesser extent. Since 2013, the YRD has been in a state of erosion on the whole, with only a slight expansion at the mouth of the river.
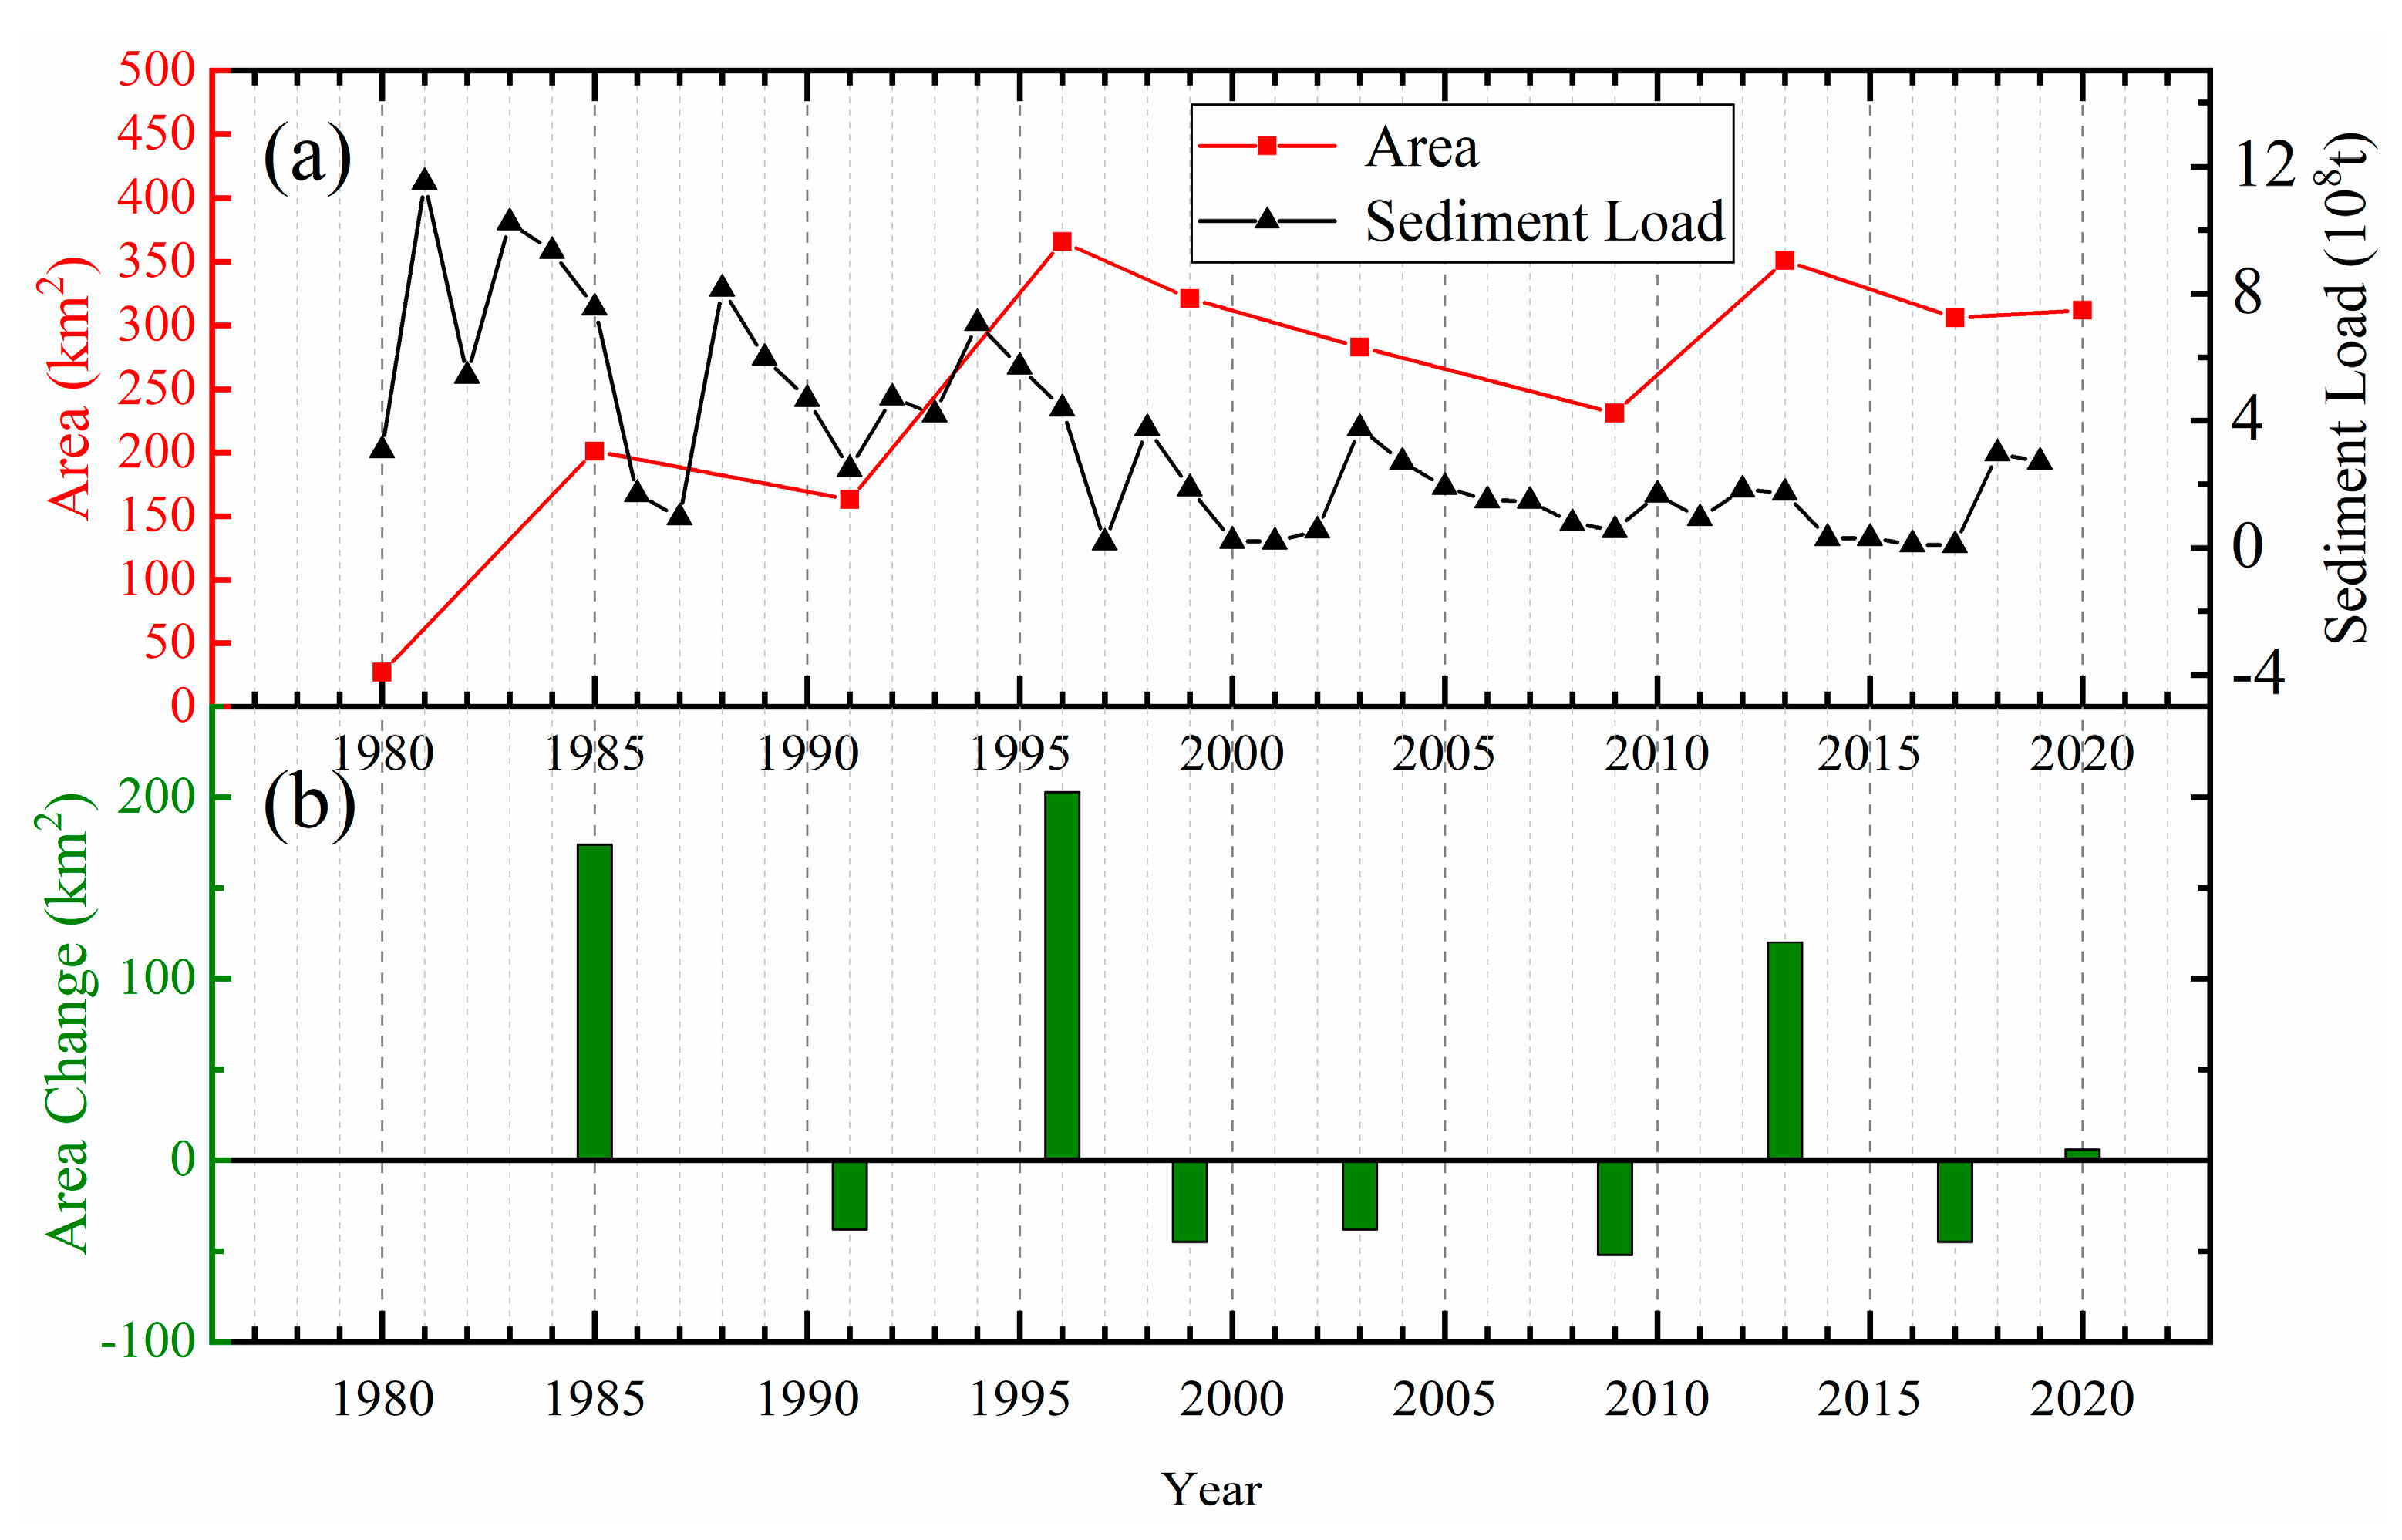
In Figure 12a, we can find that a similar variation trend between water discharge and sediment load, especially before the implementation of water and sediment regulation projects during the period of 1980–2002. According to the official Yellow River Sediment Bulletin (http://www.mwr.gov.cn/sj/, accessed on 13 May 2021), six major water and sediment regulation projects were carried out between 2002 and 2010. However, both water discharge and sediment transport began to decrease after 2002 [48], in which sediment transport was small in the years (2002, 2003, 2004, 2005, 2007, and 2010) with large water volume. Artificial hydraulic engineering increases the water discharge, but the total amount of sediment load does not increase significantly, which mainly resulted in the corresponding decrease of the shoreline length in the estuary area.
In Figure 12b, the total length of coastline continued to increase (from 150 km to 220 km) and reached a peak during the period 1980–2005. From 2005 to 2013, the growth rate of shoreline slowed down and the length of the coastline decreased to 180 km. Since 2013, the coastline length has started to grow rapidly again, reaching 220 km. However, the total area is accompanied by an increase and then a decrease with a period of about 5–10 years, and the highest peak of the total area is about 210–220 square kilometers.
Due to the twists and turns of the shoreline in the YRE, the change of shoreline length and area is not always positively correlated. As shown in Figure 12c, the coastline change is usually accompanied by a positive change in area, as in 1985, 1991, 1996, 1999, and 2009. However, the increase of length does not necessarily correspond to the increase of area, and vice versa, mainly due to the irregularity of the estuarine shoreline shape. Therefore, there are also shoreline changes accompanied by inverse changes in area, such as in 2003 and 2013.
In Figure 13, we can find that there is a strong positive correlation (up to 0.865) between water discharge and sediment load, which means sediment load is correspondingly high in the years with high water discharge. Furthermore, there is also a good positive correlation between the area change of the YRE and the entire area change of the YRD. Besides, both area changes are highly correlated with the water discharge and sediment load.

4. Discussion

4.1. Considerations of Sensors, Image Resolution, and Extration Methods

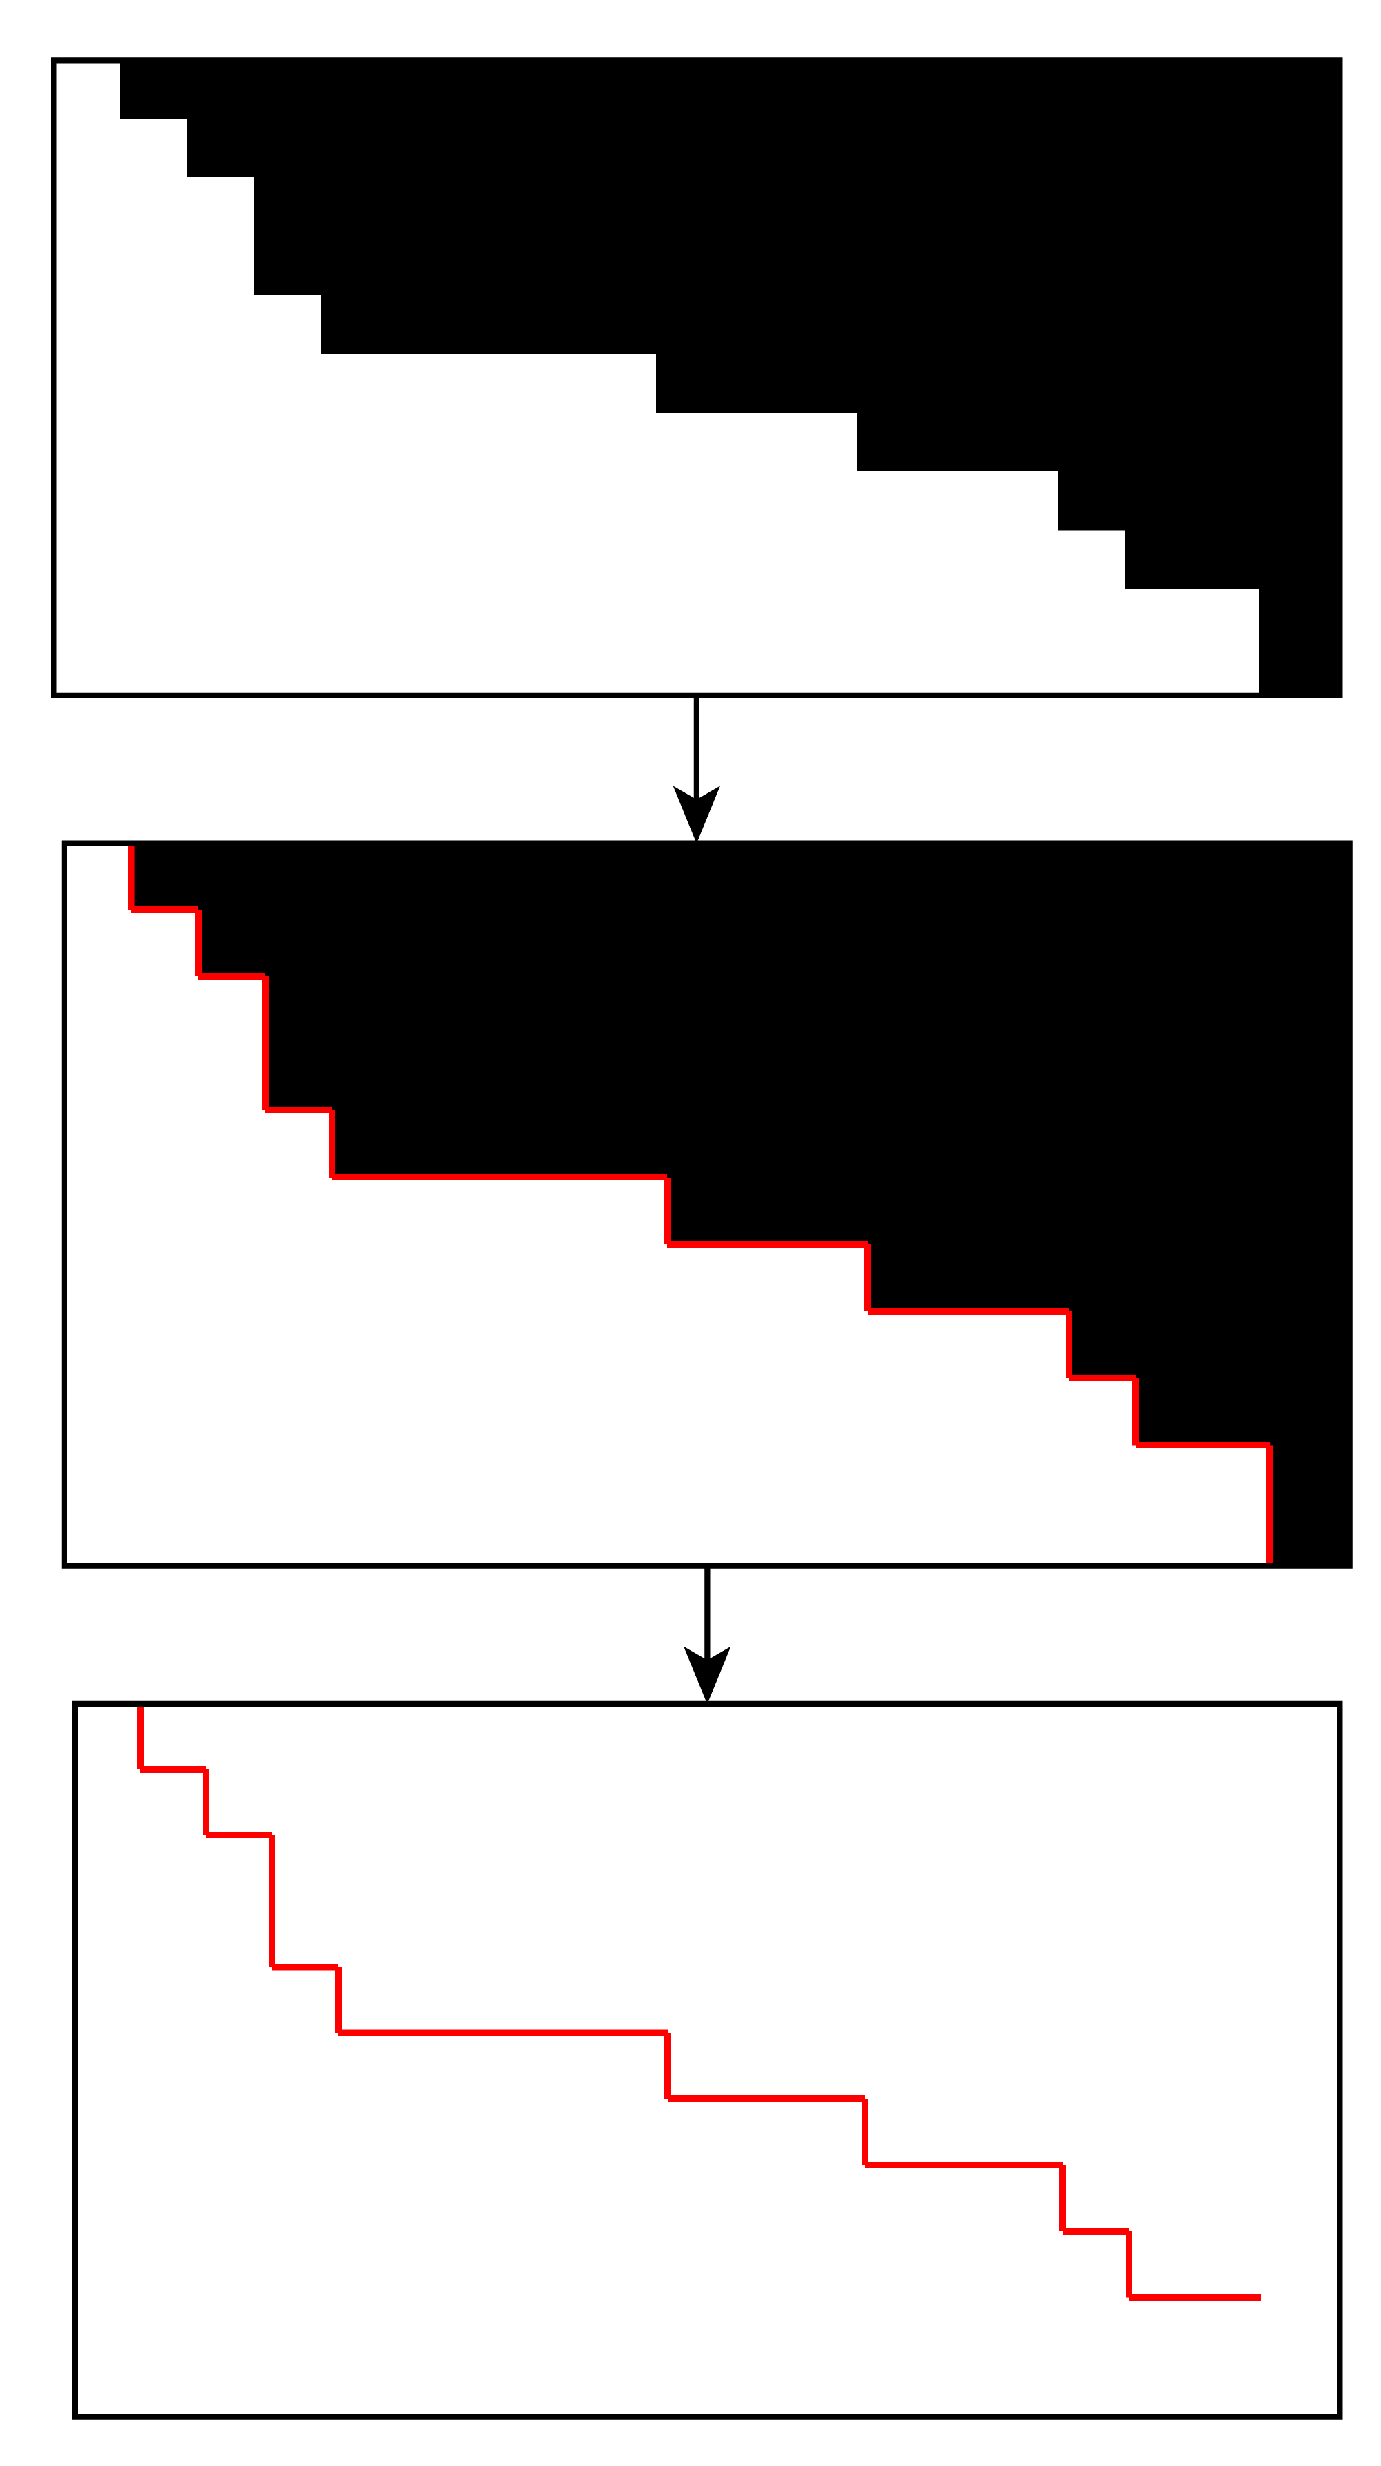
The sensors that collected images can be divided into two types: multi-spectral and SAR. The difference is mainly in the data preprocessing stage before the binarization step. NDWI that is calculated from two bands of the multispectral image can be considered as a nonlinear function related to reflectance, while filtered and radiometric calibrated amplitude that is generated from the SAR SLC image represents the backscattering intensity corresponding to the ground target closely related to the target medium, water content, and roughness. Then, both NDWI and amplitude images are used for binarization, morphologic operation, and edge detection, in which basically there is no loss of precision involved (Figure 14).
Image resolution can be considered the biggest source of uncertainty caused by the process of vector to raster conversion. The process of image acquisition by sensor is rasterization. Each pixel in raster data contains only one attribute data value, which is a generalization of various attributes within the pixel. The type of error that occurs when the feature is not captured properly is called a positional error, as opposed to attribute errors where information about the feature capture is inaccurate or false.
Geometric error refers to the positional error caused by the transformation of vector data into raster data, as well as the error of length, area, and topology matching caused by the positional error. The size of geometric error is proportional to the size of the pixel. When the polygon network represented by vector data is approximated by pixels, the problem of topology matching is serious.
Attribute error is related to the sensors that collect images and the image resolution. For example, the ground area corresponding to each pixel in the Landsat-3 MSS image is approximately 80 × 80 m. The attribute value of the pixel is the average reflected reflectivity of the objects. Some objects with high reflectivity will have a great influence on the pixel attribute value, even if their area is small. This will lead to misclassification and loss of some other useful information. Attribute error occurs when images are acquired. Due to the absence of measured data, especially as early as 1980, we cannot evaluate the attribute errors. However, when discussing uncertainty due to these various images used, attribute errors due to sensors and resolutions must be taken into account.
Positional error can be easily calculated with the measured data. According to overlying real vector and raster maps, the amount of correctly classified grids and misclassified grids can be counted. However, in many cases, the measured data cannot be provided. The rasterization error must then be estimated from the grid itself. The error is related to two factors. One is the distance between a random point in the vector map and pixel center in the raster map, and the other is the geometric characteristic of sampling grids. That means the higher the resolution, the smaller the pixel error.
It is not possible to use satellite images with the same resolution over a period of 40 years, especially from different sensors. However, the understanding of the relationship between image resolution and uncertainty of shoreline extraction is crucial for weighing the reliability of the results of shoreline changes in different periods.
The method we used to extract the shorelines is the most widely used threshold segmentation method from the fusion of NDWI and image binarization. Thresholding is a conceptually simple segmentation technique by using a histogram to segment images. At present, the optimal threshold is designed to determine and improve the threshold segmentation method. In this study, we used the threshold segmentation method proposed by Otsu [43], which is considered a gold standard in the field of thresholding.

4.2. Uncertainty Analysis of Coastline Extraction

With respect to river course or coastline extraction, several methods exist, such as image differencing, unsupervised land–water classification, supervised land–water classification, image segmentation, and manual coastline digitization. Most of them are based on multispectral bands or derived indices, such as the NDWI. A detailed review of the latest developments in coastline/shoreline derivation from remote sensing data has been presented by Gens [44]. However, it should be mentioned that while automatic digital image processing is fast and might seem more elegant, for coastline extraction, so far nothing can yield better results than a thorough human interpretation and manual digitization.
Since there are many types of coastline in the YRD region, it is difficult to use a single tidal station to correct the tide of the whole coastline. Furthermore, there is a lack of long time series of historical tidal observation data, especially in the YRE. Therefore, a dry–wet boundary is a more suitable choice for the coastline [27]. As far as the results of shoreline change are concerned, the annual average rate of change reached 87.87 m/a, and the range of change at the mouth of the Yellow River reached ~500 m/a. The remote sensing images used in this paper were acquired from June to August and the tidal coastline migration made little contribution to the coastline change. Considering that the spatial resolution of the optical and SAR images is about 10–30 m except for earlier 80 m Landsat-3 MSS imagery, the accuracy of image extraction will have an impact on the result of coastline change.
By comparing the performance of SAR and optical images in shoreline extraction, we find that SAR images are more suitable for intertidal shoreline detection. Therefore, we used them instead of multispectral images at the corresponding time, when SAR images are available. Visual interpretation and manual identification are necessary in the procedure of automatic shoreline extraction, especially for the low-resolution multispectral images from 1980 and 1985. Due to the extremely frequent and drastic changes in the Yellow River Delta, there is still a lack of long-term continuous GPS time-series measurements. We only used GPS observation to evaluate the accuracy of the results in 2020.
As shown in Figure 15, the coastline extracted from GF-3 SAR on 11 July 2020, is consistent with observations from the GPS RTK to a large extent. Morphological operation was used to make the artificial coastal edge smooth, especially for those long, man-made piers that go deep into the sea, which would probably produce larger errors in the corner area.
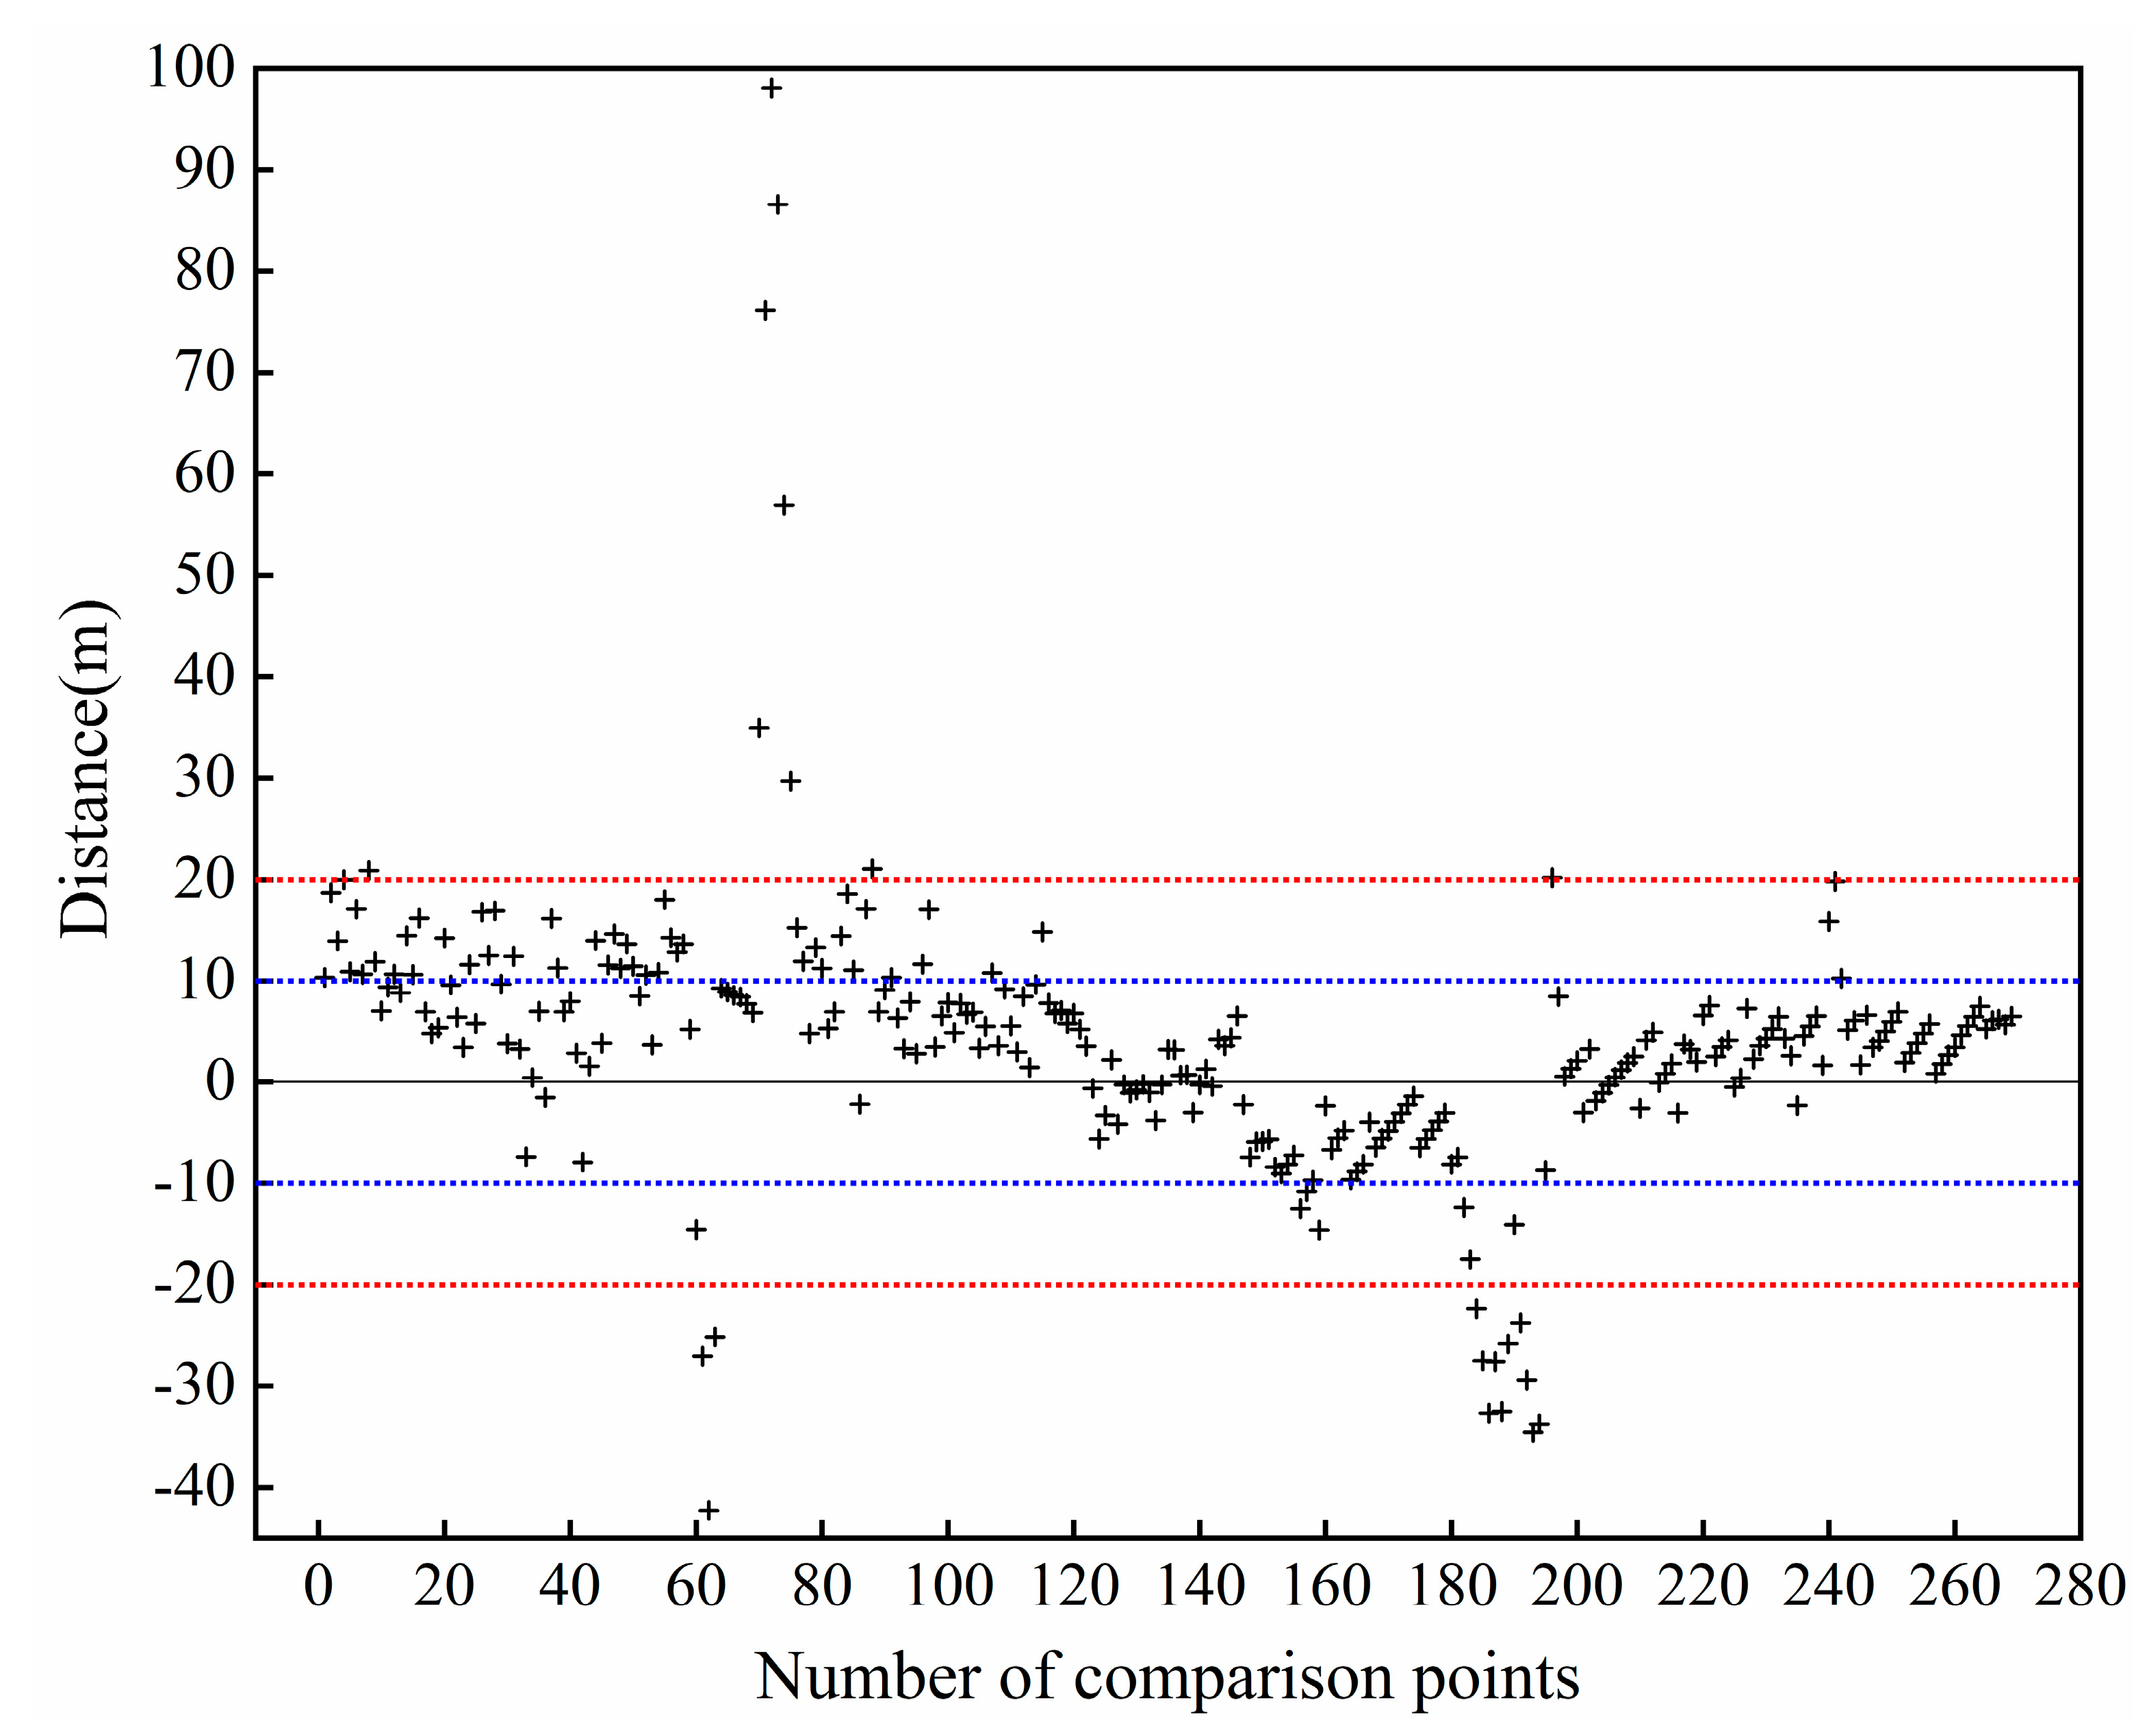
Figure 16 illustrates that the percentage of errors within one pixel of GF-3 SAR imagery (10 m) is 71.4%, while the percentage within two pixels (20 m) is 91.8%. The outliers more than 20 m come from the corner area as shown in Figure 15d. Therefore, through the evaluation from the GPS RTK measurements and manual visual interpretation, the authors think that the shoreline extraction accuracy is generally controlled at the level of 1–2 pixels.
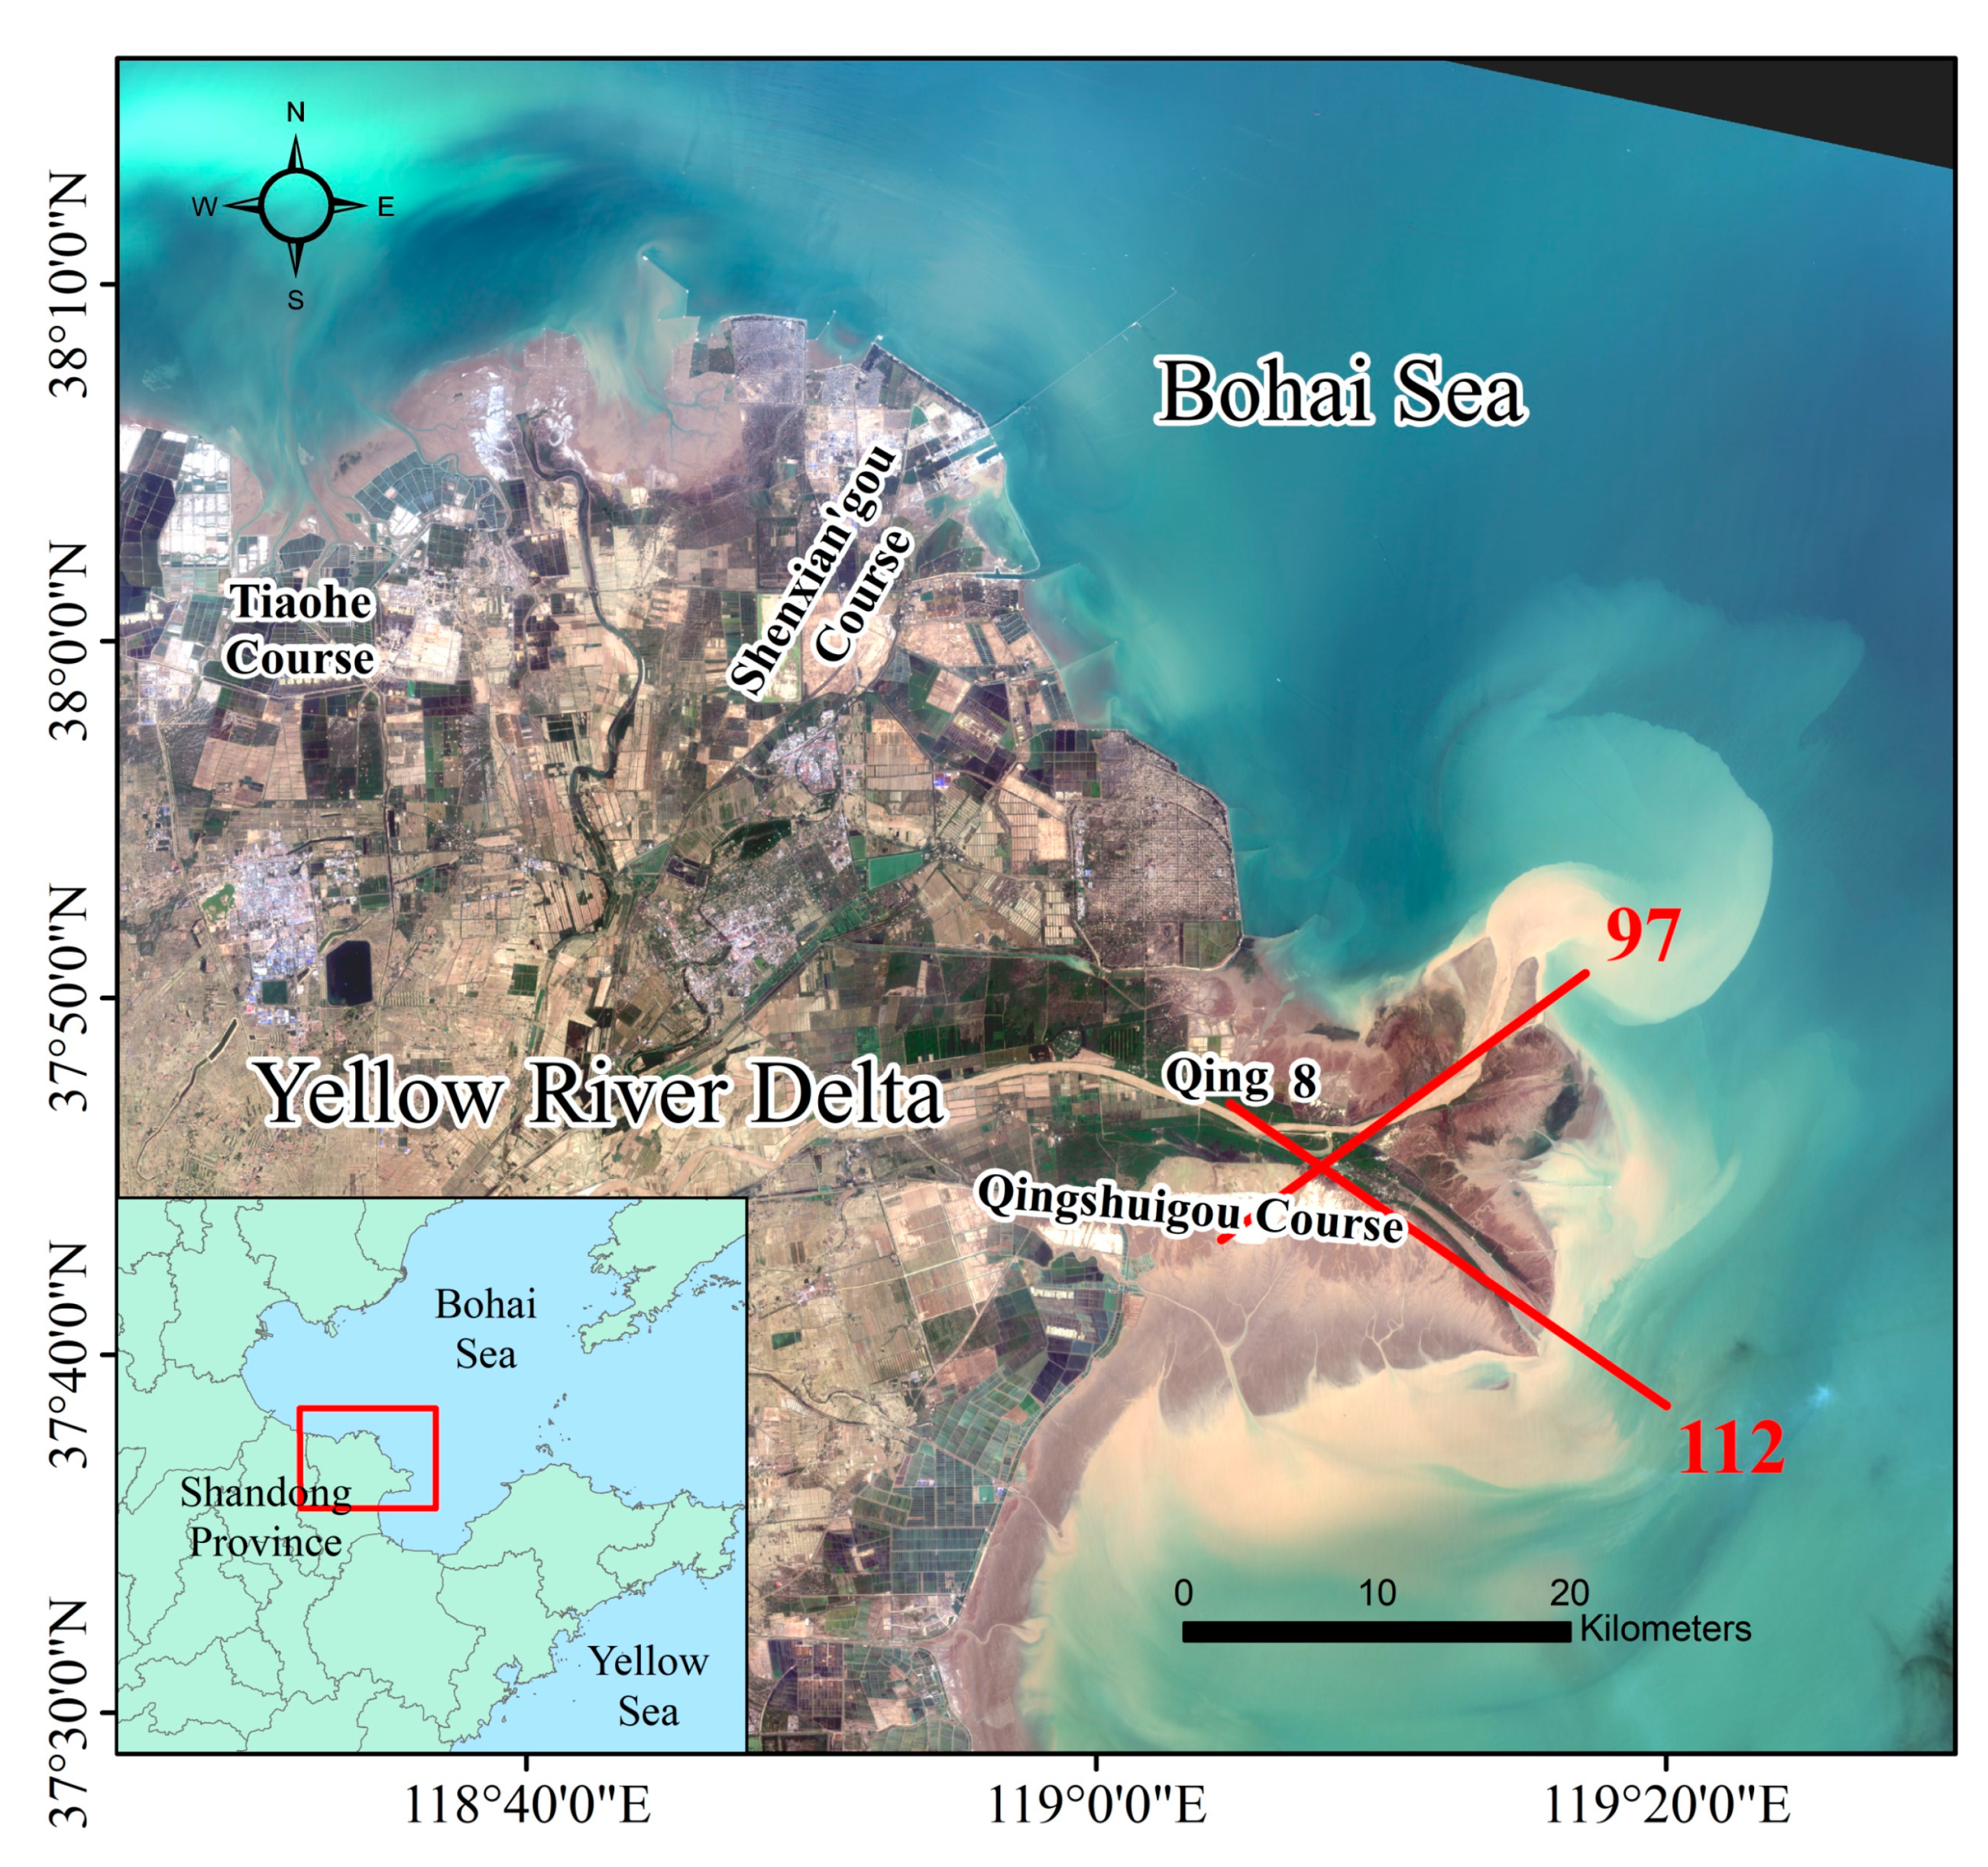
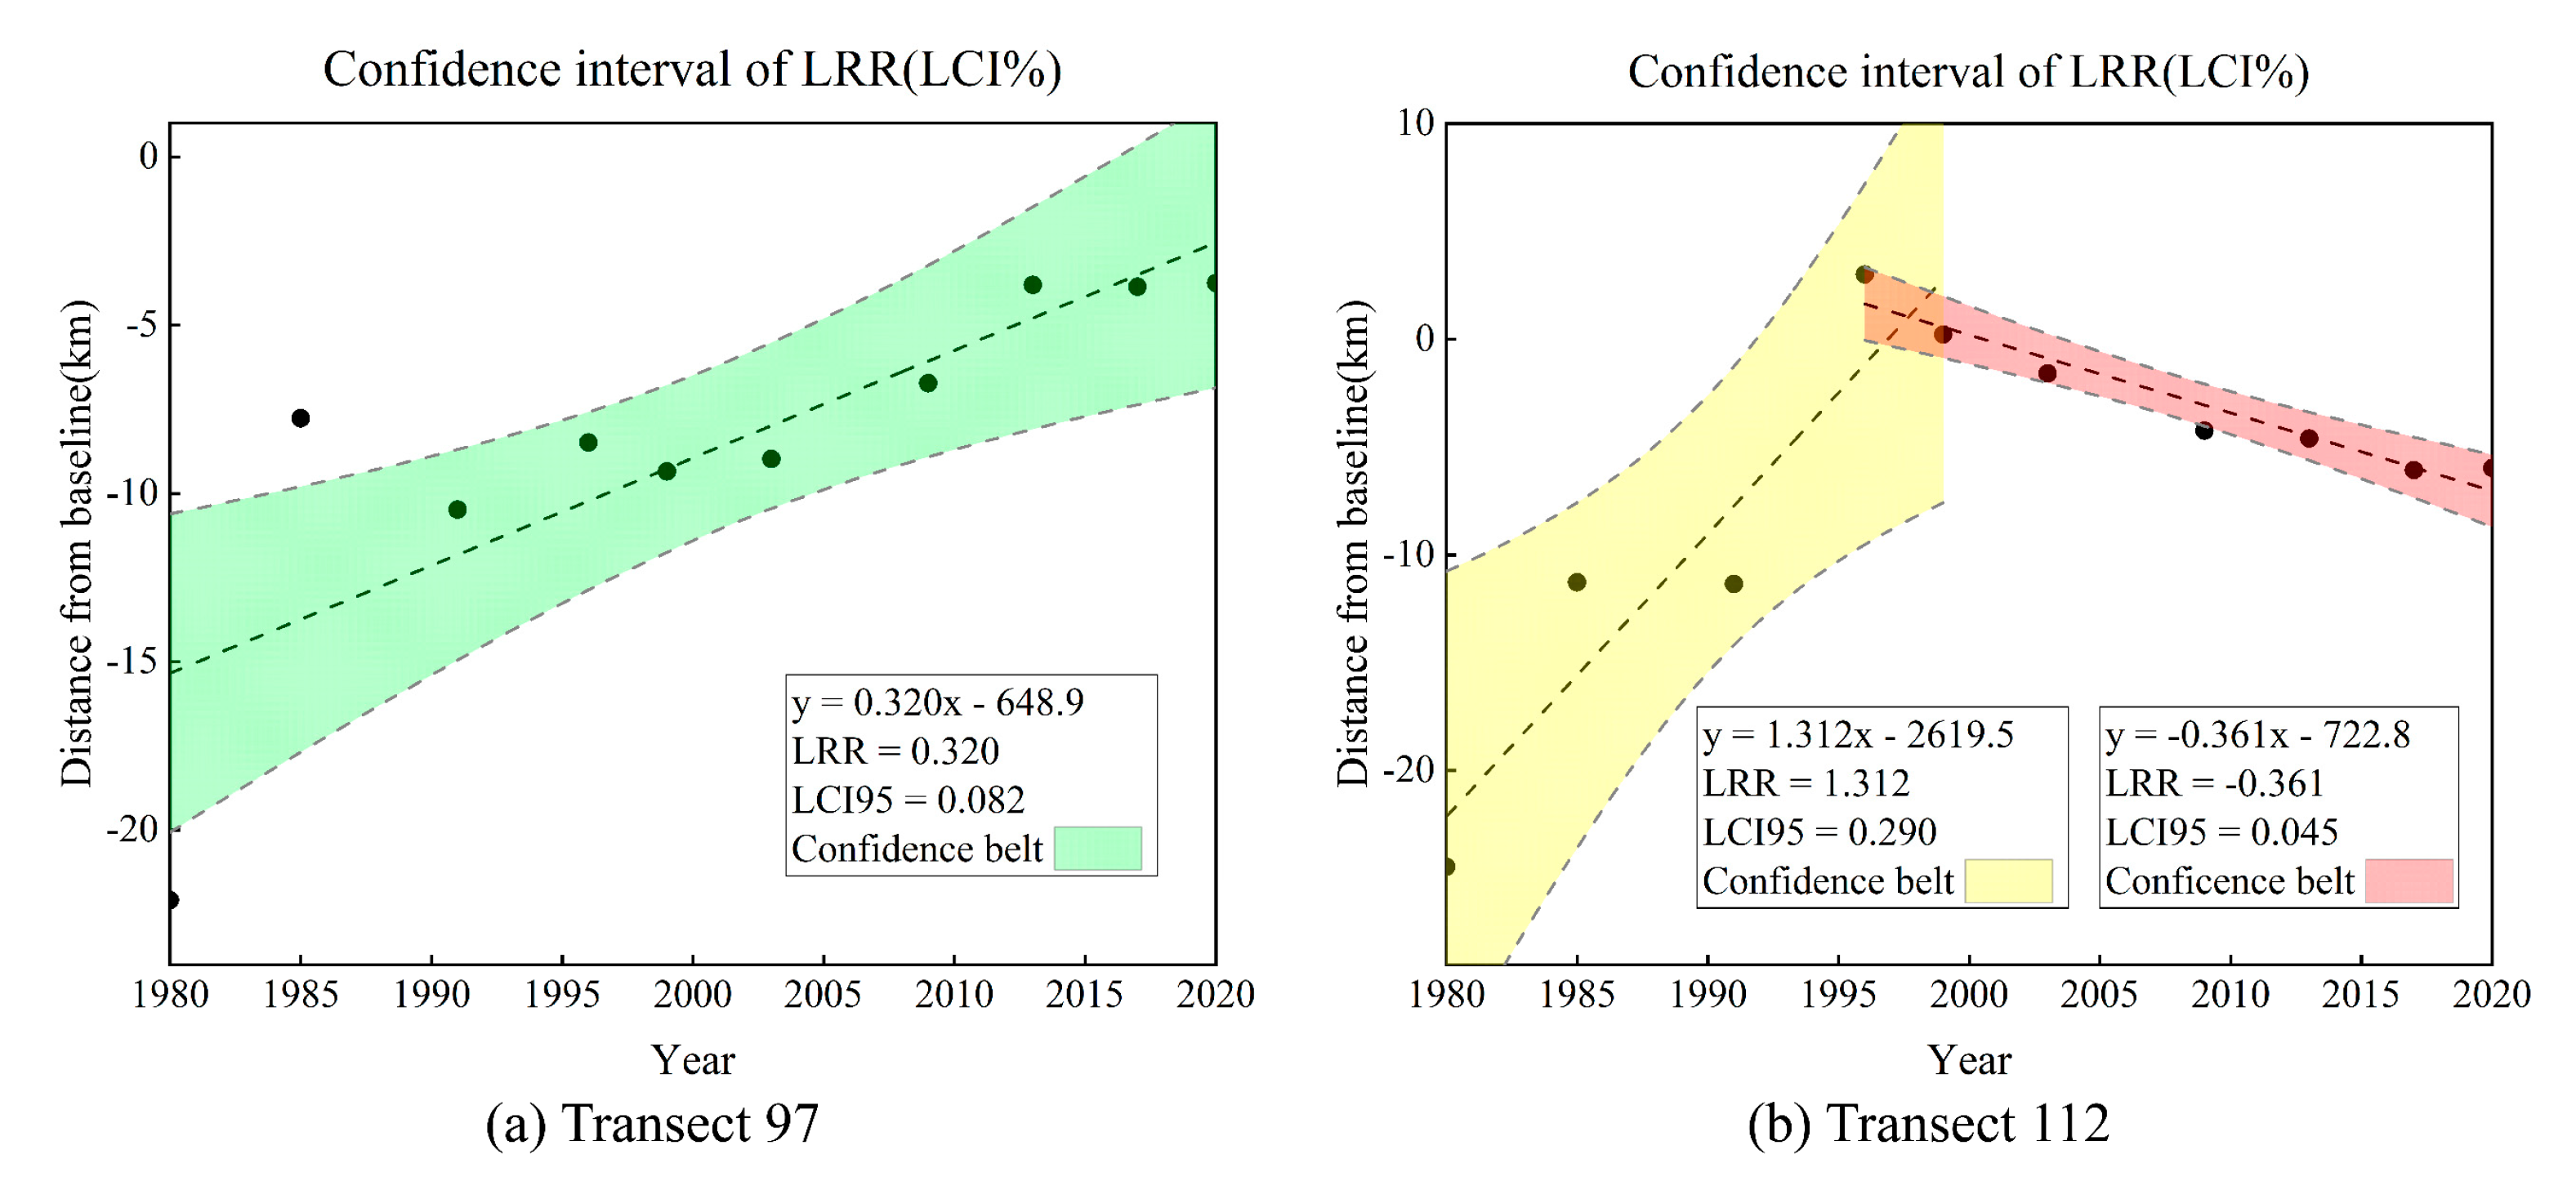
For Qingshuigou and Qing 8 shorelines, we analyzed the confidence interval of the calculated change rate to investigate the uncertainty of the change rate. As illustrated in Figure 17, there are two transects selected, no. 97 for Qingshuigou course and no. 112 for Qingshuigou course. In Figure 18, 95% confidence belts were plotted using the distance from the intersections of the shorelines and the transect to the baseline. The standard error of the slope with confidence interval (LCI for ordinary linear regression) describes the uncertainty of the LRR.
In Qingshuigou course (Figure 18a), the band of confidence around the reported rate of change is 320 m/a ± 82 m/a. In other words, we can be 95% confident that the true rate of change is between 238 m/a and 402 m/a, leaving a 5% chance that the true line is outside those boundaries. Due to the artificial diversion of the Yellow River mouth from Qingshuigou to Qing 8 in 1996, two sections of 95% confidence band can be obtained by linear fitting in Qing 8 (Figure 18b), that is, 1312 m/a ± 290 m/a (1022 m/a~1602 m/a) and −361 m/a ± 45 m/a (−406 m/a~−316 m/a).

4.3. Influence of Water Discharge and Sediment Load

Since the 1950s, human activities have had a more serious impact on the Yellow River basin due to the great economic and social development. Sediment losses due to urbanization, upstream irrigation, diversion, and hydraulic dams have altered the delta’s erosion and accretion balance [49]. Delta ecosystems are often developed well beyond sustainable limits, especially in developing and emerging countries [22]. Human activities that impact the river system include dams and reservoirs, flow diversions, and water extractions. By far >45,000 dams over 15 m in height have been registered in the world with the purpose of flood control and water extraction [38].
Sediment transport plays an important role in the shoreline change of the YRD. The water–sediment regulation scheme, beginning in 2002, presented unexpected disturbances on the delta and coastal system. Increasing grain size of suspended sediment and decreasing suspended sediment concentration at the river mouth resulted in a regime shift of sediment transport patterns that enhanced the disequilibrium of the delta [21]. Over the past four decades, sediment load decreased stepwise revealed by the datasets from key gauging stations in the main stream, on account of both natural and anthropogenic impacts [39]. The sediment load of the Yellow River has an effect on many aspects of the YRD, including delta morphology and land subsidence [50,51].
From the overall trend of change, the sediment load of the Yellow River decreases gradually with the anthropological activities. The correlations between the change of shoreline length and water discharge, sediment load are very low, indicating that water discharge or sediment transport has little influence on the change of shoreline. The correlations between the area of the YRD and water discharge, sediment load reached 0.562 and 0.572, respectively, indicating that water discharge and sediment load are vital to area change. The impact of water transport and sediment transport on the YRD is more reflected in the change of area than the change of shoreline length.
Since the 1990s, the Yellow River flow cutoff has become increasingly serious, which brings many problems to the evolution of river course and estuaries [52]. The objective situation of the Estuary of the Yellow River also requires a new understanding of the estuary and the adoption of new countermeasures. At that time, it was one of the strategies of oil and gas development in the coastal area of Shengli Oil Field to exploit oil and gas turning from submerged coastal area to land, by using the silt of the Yellow River to make land. In 1996, owing to the Yellow River shifted to Qing 8 Course from Qingshuigou Couse, and the status of the YRE began to change obviously, with Qing 8 Lobe forming. From 1996 to 1999, there was obvious accretion in Qing 8 Course, with the change rate reaching 116.5 m/a, and obvious erosion occurred in Qingshuigou Course, with the erosion rate reaching 253.2 m/a. Along with the reduction of sediment discharge, there is a downward trend of the change range of the YRE coastline. It is a special time period from 2003 to 2009, Qing 8 experienced a state of obvious accretion, on account of water-sediment modulation. Water-sediment Modulation has played a vital role in regulating the delivery of material from the Yellow River to the sea [53,54]. From 2013 to 2020, the range of coastline change in the YRD further decreased, and there hardly occurs a distinct change in the three regions (Shenxian’gou Course, Qingshuigou, Qing 8), with the range of change within 50 m/a basically.
To further understand the relationship between sediment load and the area of the YRE (Figure 19), we analyzed the relationship between the area change of the YRE and water discharge, sediment load. In Figure 20, we can roughly see that the area at the YRE increases sharply in years with high sediment load (1980–1985), and decreases slightly in years with low sediment load (1985–1991). After the Yellow River shifted to Qing 8 (1996–2009), the area of erosion (mainly located in Qingshuigou Course) was larger than the area of accretion (mainly located in Qing 8). The correlations between estuary area change and water discharge, sediment load are shown in Figure 13, reaching 0.539 and 0.615, respectively, higher than the previous results of correlation analysis for the whole study area (0.562 and 0.572). The outcome proves that the influence of water discharge and sediment load on the area change of the YRD is mainly concentrated in the YRE.
We can see that there is a strong correlation between sediment load and water discharge before 2003. From 2003 to 2009, water discharge increases slightly and remains in a relatively stable state, while sediment load decreases obviously due to the water and sediment regulation projects. However, there is still a weak correlation between them from the similar trends. The sediment load from upstream in the Yellow River mouth that does not keep a static state is an important factor affecting delta morphology. It can be found that the increase or decrease of sediment transport is accompanied by the increase or decrease of shoreline length, but there is a certain lag in the occurrence time of the latter. Due to the complicated ocean dynamics from waves and tides, accretion and erosion will gradually reach a balance.
Theoretically, the greater the water discharge, the greater the sediment transport. However, this is not always the case. Human activities have a great impact on the change of sediment in the upper reaches of the Yellow River, such as afforestation activities on the banks of the Yellow River, flood storage, and sediment control activities of hydropower stations, and gradual solidification and deposition of coarse sediment on the riverbed. Therefore, sediment transport does not necessarily increase at the same time as water flow increases.

4.4. Critical Sediment Deriven by Human Activities and Climate Change

The optical and SAR remote sensing images selected in this study could not fully reflect the detailed relationship between water, sediment transport, and estuary area with a time interval of 3–6 years. There are other underlying factors that are affecting the YRD. Previous studies usually assume that there is a linear correlation between sediment discharge and coastline change [26,51,52,55,56]. The analysis in Figure 13 shows that the sediment discharge has a great contribution to the change of estuary area with a correlation of 0.615. Therefore, the impulsive delivery of muds and sands indeed transforms the present YRD from a destructive phase to an accretion phase [57]. However, this study shows that the contribution of sediment transport to the change of the estuary is not the only dominant factor.
Due to the coarsening of the surface bed material sediments, the erosion efficiency of the downstream riverbed has reduced. Since 2013–2017 in Figure 9 and Figure 10, continuous scouring and reduced sediment transport have caused the current delta to re-enter a phase of erosion and destruction [57]. The previous study has shown that erosion of the abandoned delta lobes can sustain the supply of sediment to remote offshore depocenters, even after decades of declining river sediment discharge [58]. The artificial water and sediment regulation scheme increases the ratio of water flow and sediment transport, resulting in more sediment being carried away by the current entering the Bohai Sea, and further reducing the impact of sediment transport on the estuary area [59].
Furthermore, human activities intensified gradually from a negligible factor from 7000 to 3000 cal yr BP to a considerable force compared with natural forces over the last 3000 years, and finally dominated the Yellow River’s sediment discharge within the last few decades [60,61]. From the 1980s to the present, the anthropogenic influence on the YRE has been increasing, which further reduces the proportion of the impact of sediment transport on the estuary area. The transport of sediment into the sea significantly changes in the geomorphology of the estuary delta, and then the coupling of sediment transport and ocean dynamics has a superposition effect on the topography of the continental shelf [62,63]. As shown in Figure 21, the sediments from the Yellow River are mainly transported outward along two pathways, including the west side of the central Bohai Shoal to the central part of the Bohai Sea and the Bohai Strait to the Yellow Sea, which is closely related to sea surface temperature, flow field, wind speed, and wind direction [64].
Last but not the least, climate change and sea level rise affect waves and storm surges, which are also important drivers of coastal morphology [65,66]. Much of the world’s sandy coastline is already eroding, and climate change is likely to exacerbate this as sea level rise is accelerating, in addition to the combined result of a wide range of potentially erosive or accretive factors [9]. In particular, the southern section of the Qingshuigou course has a lower slope and the effect of sea level rise is more serious [37]. In recent years, the impact of sediment discharge on the area change of the YRD is decreasing, so understanding the redistribution of sediments by waves and tides as well as dynamics of extreme weather patterns is critical for human-driven and climate change to deltas.

5. Conclusions

In this study, we present a combination method to extract the coastline of the Yellow River Delta (YRD) in 1980–2020 with both optical and SAR satellite remote sensing images. Then, we investigate the influence of annual water discharge and sediment load as well as critical sediment on the changes of the coastline. The long-term time series fusion of multi-source optical and SAR remote sensing data provides an accurate quantitative estimate of the coastline geolocation of the YRD in the last 40 years and reveals its dynamic change drivers.
The results indicate that the rate of change shows spatial heterogeneous variability during 40 years. There are four significant accretion areas (Tiaohe, Shenxian’gou, Qing 8, and Qingshuigou course) due to artificial land reclamation and deposition of sediment. In the Qing 8 Course, the maximum change rate reaches 523.21 m/a in end point rate (ERR) and 385.4 m/a in linear regression rate (LRR), while 462.54 m/a in ERR and 311.48 m/a in LRR in the Qingshuigou Course. However, there was a sharp decline in the period of 1996–1999 as a result of the artificial water and sediment regulation scheme. Erosion and accretion gradually reach a balance from 1999 to the present, except for Qing 8 in 2009–2013.
The relative high correlation supports that the sediment discharge has a great contribution to the change of estuary area. However, the influence of water discharge and sediment load on the area change of the YRD is mainly concentrated in the Yellow River Estuary (YRE). Although the artificial hydraulic engineering increases the water discharge, the total amount of sediment load does not increase significantly, resulting in the corresponding decrease of the shoreline length in the estuary area. Therefore, apart from the contribution of sediment transport to the change of the estuary, human activities, climate change, and sea level rise that affect waves and storm surges, are also important drivers of coastal morphology to be investigated in the future.

Author Contributions

Conceptualization, P.L. and Z.L.; Methodology, Q.Z., P.L., S.P., and Z.L.; Formal analysis and validation, Q.Z., S.P., and P.L.; Investigation, Q.Z., P.L., X.W., N.B., and H.W.; Resources, P.L., Z.L., and H.W.; Writing—original draft preparation, Q.Z. and P.L.; Writing—review and editing, Q.Z., P.L., Z.L., X.W., N.B., and H.W.; Project administration, P.L., Z.L., and H.W.; Data curation, Q.Z. and P.L.; Visualization, Q.Z. and P.L.; Supervision, P.L., Z.L., and H.W.; Funding acquisition, P.L., Z.L., and H.W. All authors have read and agreed to the published version of the manuscript.

Funding

This work was jointly supported by the Natural Science Foundation of China (no. 41806108), National Key Research and Development Program of China (nos. 2017YFE0133500; 2016YFA0600903), Open Research Fund of State Key Laboratory of Estuarine and Coastal Research (no. SKLEC-KF202002) from East China Normal University, as well as State Key Laboratory of Geodesy and Earth’s Dynamics from Innovation Academy for Precision Measurement Science and Technology, Chinese Academy of Sciences (SKLGED2021-5-2). Z.H. Li was supported by the European Space Agency through the ESA-MOST DRAGON-5 Project (ref. no. 59339).

Institutional Review Board Statement

Not applicable.

Informed Consent Statement

Not applicable.

Data Availability Statement

Sentinel-1 data can be freely available here: https://scihub.copernicus.eu/dhus/#/home (accessed on 13 May 2021). Envisat ASAR data is publicly available here: https://earth.esa.int/eogateway/missions/envisat/data (accessed on 13 May 2021). All the Landsat data are available at no cost here: https://earthexplorer.usgs.gov/ (accessed on 13 May 2021). GaoFen data used in this study can be accessed through an official application approval here: https://osdds.nsoas.org.cn/#/ (accessed on 13 May 2021). The observations of sediment load and water discharge are available here: http://www.mwr.gov.cn (accessed on 13 May 2021). All the shorelines extracted in this study are openly available here: https://zenodo.org/record/4699272 (accessed on 18 April 2021).

Acknowledgments

The authors are grateful to those colleagues from the Ocean University of China for conducting GPS RTK and UAV measurements. Sentinel-1, Envisat ASAR, and Landsat data are freely available from the European Space Agency and the United States Geological Survey. We thank the National Satellite Ocean Application Service for providing GF-2, GF-3, and GF-6 data. Meanwhile, the authors sincerely thank all anonymous reviewers and the editors for their constructive and excellent reviews that greatly improve the article quality.

Conflicts of Interest

The authors declare no conflict of interest.

References

  1. Kuenzer, C.; Heimhuber, V.; Huth, J.; Dech, S. Remote Sensing for the Quantification of Land Surface Dynamics in Large River Delta Regions—A Review. Remote Sens. 2019, 11, 1985. [Google Scholar] [CrossRef] [Green Version]
  2. Kuleli, T.; Guneroglu, A.; Karsli, F.; Dihkan, M. Automatic detection of shoreline change on coastal Ramsar wetlands of Turkey. Ocean Eng. 2011, 38, 1141–1149. [Google Scholar] [CrossRef]
  3. Chu, Z.X.; Sun, X.G.; Zhai, S.K.; Xu, K.H. Changing pattern of accretion/erosion of the modern Yellow River (Huanghe) subaerial delta, China: Based on remote sensing images. Mar. Geol. 2006, 227, 13–30. [Google Scholar] [CrossRef]
  4. Zhang, X.; Lu, K.; Yin, P.; Zhu, L. Current and future mudflat losses in the southern Huanghe Delta due to coastal hard structures and shoreline retreat. Coast. Eng. 2019, 152, 103530. [Google Scholar] [CrossRef]
  5. Frihy, O.E.; Komar, P.D. Long-term shoreline changes and the concentration of heavy minerals in beach sands of the Nile Delta, Egypt. Mar. Geol. 1993, 115, 253–261. [Google Scholar] [CrossRef]
  6. Chamberlain, E.L.; Törnqvist, T.E.; Shen, Z.; Mauz, B.; Wallinga, J. Anatomy of Mississippi Delta growth and its implications for coastal restoration. Sci. Adv. 2018, 4, eaar4740. [Google Scholar] [CrossRef] [Green Version]
  7. Wang, X.; Xiao, X.; Zou, Z.; Chen, B.; Ma, J.; Dong, J.; Doughty, R.B.; Zhong, Q.; Qin, Y.; Dai, S.; et al. Tracking annual changes of coastal tidal flats in China during 1986–2016 through analyses of Landsat images with Google Earth Engine. Remote Sens. Environ. 2020, 238, 110987. [Google Scholar] [CrossRef]
  8. Murray, N.J.; Phinn, S.R.; DeWitt, M.; Ferrari, R.; Johnston, R.; Lyons, M.B.; Clinton, N.; Thau, D.; Fuller, R.A. The global distribution and trajectory of tidal flats. Nature 2019, 565, 222–225. [Google Scholar] [CrossRef]
  9. Vousdoukas, M.I.; Ranasinghe, R.; Mentaschi, L.; Plomaritis, T.A.; Athanasiou, P.; Luijendijk, A.; Feyen, L. Sandy coastlines under threat of erosion. Nat. Clim. Chang. 2020, 10, 260–263. [Google Scholar] [CrossRef]
  10. Abushandi, E.; Abualkishik, A. Shoreline Erosion Assessment Modelling for Sohar Region: Measurements, Analysis, and Scenario. Sci. Rep. 2020, 10, 4048. [Google Scholar] [CrossRef] [Green Version]
  11. Barbier, E.B.; Hacker, S.D.; Kennedy, C.; Koch, E.W.; Stier, A.C.; Silliman, B.R. The value of estuarine and coastal ecosystem services. Ecol. Monogr. 2011, 81, 169–193. [Google Scholar] [CrossRef]
  12. Nicholls, R.J.; Cazenave, A. Sea-Level Rise and Its Impact on Coastal Zones. Science 2010, 328, 1517–1520. [Google Scholar] [CrossRef] [PubMed]
  13. Qiao, G.; Mi, H.; Wang, W.; Tong, X.; Li, Z.; Li, T.; Liu, S.; Hong, Y. 55-year (1960–2015) spatiotemporal shoreline change analysis using historical DISP and Landsat time series data in Shanghai. Int. J. Appl. Earth Obs. Geoinf. 2018, 68, 238–251. [Google Scholar] [CrossRef]
  14. Boak, E.H.; Turner, I.L. Shoreline Definition and Detection: A Review. J. Coast. Res. 2005, 688–703. [Google Scholar] [CrossRef] [Green Version]
  15. Wang, G.; Li, P.; Li, Z.; Ding, D.; Qiao, L.; Xu, J.; Li, G.; Wang, H. Coastal Dam Inundation Assessment for the Yellow River Delta: Measurements, Analysis and Scenario. Remote Sens. 2020, 12, 3658. [Google Scholar] [CrossRef]
  16. Wu, X.; Bi, N.; Xu, J.; Nittrouer, J.A.; Yang, Z.; Saito, Y.; Wang, H. Stepwise morphological evolution of the active Yellow River (Huanghe) delta lobe (1976–2013): Dominant roles of riverine discharge and sediment grain size. Geomorphology 2017, 292, 115–127. [Google Scholar] [CrossRef]
  17. Jiang, Q.o.; Deng, X.; Zhan, J.; Yan, H. Impacts of economic development on ecosystem risk in the Yellow River Delta. Procedia Environ. Sci. 2011, 5, 208–218. [Google Scholar] [CrossRef] [Green Version]
  18. Wang, H.; Saito, Y.; Zhang, Y.; Bi, N.; Sun, X.; Yang, Z. Recent changes of sediment flux to the western Pacific Ocean from major rivers in East and Southeast Asia. Earth Sci. Rev. 2011, 108, 80–100. [Google Scholar] [CrossRef]
  19. Syvitski, J.P.M.; Saito, Y. Morphodynamics of deltas under the influence of humans. Glob. Planet. Chang. 2007, 57, 261–282. [Google Scholar] [CrossRef]
  20. Wang, Z.; Saito, Y.; Zhan, Q.; Nian, X.; Pan, D.; Wang, L.; Chen, T.; Xie, J.; Li, X.; Jiang, X. Three-dimensional evolution of the Yangtze River mouth, China during the Holocene: Impacts of sea level, climate and human activity. Earth Sci. Rev. 2018, 185, 938–955. [Google Scholar] [CrossRef]
  21. Wang, H.; Wu, X.; Bi, N.; Li, S.; Yuan, P.; Wang, A.; Syvitski, J.P.M.; Saito, Y.; Yang, Z.; Liu, S.; et al. Impacts of the dam-orientated water-sediment regulation scheme on the lower reaches and delta of the Yellow River (Huanghe): A review. Glob. Planet. Chang. 2017, 157, 93–113. [Google Scholar] [CrossRef]
  22. Renaud, F.G.; Syvitski, J.P.M.; Sebesvari, Z.; Werners, S.E.; Kremer, H.; Kuenzer, C.; Ramesh, R.; Jeuken, A.; Friedrich, J. Tipping from the Holocene to the Anthropocene: How threatened are major world deltas? Curr. Opin. Environ. Sustain. 2013, 5, 644–654. [Google Scholar] [CrossRef] [Green Version]
  23. Syvitski, J.P.M.; Kettner, A.J.; Overeem, I.; Hutton, E.W.H.; Hannon, M.T.; Brakenridge, G.R.; Day, J.; Vörösmarty, C.; Saito, Y.; Giosan, L.; et al. Sinking deltas due to human activities. Nat. Geosci. 2009, 2, 681. [Google Scholar] [CrossRef]
  24. Syvitski, J.P.M.; Vörösmarty, C.J.; Kettner, A.J.; Green, P. Impact of Humans on the Flux of Terrestrial Sediment to the Global Coastal Ocean. Science 2005, 308, 376–380. [Google Scholar] [CrossRef]
  25. Higgins, S.; Overeem, I.; Tanaka, A.; Syvitski, J.P.M. Land subsidence at aquaculture facilities in the Yellow River delta, China. Geophys. Res. Lett. 2013, 40, 3898–3902. [Google Scholar] [CrossRef]
  26. Zhang, X.; Lu, Z.; Jiang, S.; Chi, W.; Zhu, L.; Wang, H.; Lv, K.; Wang, B.; Yang, Z. The progradation and retrogradation of two newborn Huanghe (Yellow River) Delta lobes and its influencing factors. Mar. Geol. 2018, 400, 38–48. [Google Scholar] [CrossRef]
  27. Kuenzer, C.; Ottinger, M.; Liu, G.; Sun, B.; Baumhauer, R.; Dech, S. Earth observation-based coastal zone monitoring of the Yellow River Delta: Dynamics in China’s second largest oil producing region over four decades. Appl. Geogr. 2014, 55, 92–107. [Google Scholar] [CrossRef]
  28. Liu, Z.; Xu, N.; Wang, J. Satellite-Observed Evolution Dynamics of the Yellow River Delta in 1984–2018. IEEE J. Sel. Top. Appl. Earth Obs. Remote Sens. 2020, 13, 6044–6050. [Google Scholar] [CrossRef]
  29. Dai, C.; Howat, I.M.; Larour, E.; Husby, E. Coastline extraction from repeat high resolution satellite imagery. Remote Sens. Environ. 2019, 229, 260–270. [Google Scholar] [CrossRef]
  30. Toure, S.; Diop, O.; Kpalma, K.; Maiga, A.S. Shoreline Detection using Optical Remote Sensing: A Review. ISPRS Int. J. Geo-Inf. 2019, 8, 75. [Google Scholar] [CrossRef] [Green Version]
  31. Li, W.; Gong, P. Continuous monitoring of coastline dynamics in western Florida with a 30-year time series of Landsat imagery. Remote Sens. Environ. 2016, 179, 196–209. [Google Scholar] [CrossRef]
  32. Vos, K.; Harley, M.D.; Splinter, K.D.; Simmons, J.A.; Turner, I.L. Sub-annual to multi-decadal shoreline variability from publicly available satellite imagery. Coast. Eng. 2019, 150, 160–174. [Google Scholar] [CrossRef]
  33. García-Rubio, G.; Huntley, D.; Russell, P. Evaluating shoreline identification using optical satellite images. Mar. Geol. 2015, 359, 96–105. [Google Scholar] [CrossRef] [Green Version]
  34. An, M.; Sun, Q.; Hu, J.; Tang, Y.; Zhu, Z. Coastline Detection with Gaofen-3 SAR Images Using an Improved FCM Method. Sensors 2018, 18, 1898. [Google Scholar] [CrossRef] [Green Version]
  35. Pelich, R.; Chini, M.; Hostache, R.; Matgen, P.; López-Martínez, C. Coastline Detection Based on Sentinel-1 Time Series for Ship- and Flood-Monitoring Applications. IEEE Geosci. Remote Sens. Lett. 2020, 1–5. [Google Scholar] [CrossRef]
  36. Dai, K.; Li, Z.; Xu, Q.; Bürgmann, R.; Milledge, D.G.; Tomás, R.; Fan, X.; Zhao, C.; Liu, X.; Peng, J.; et al. Entering the Era of Earth Observation-Based Landslide Warning Systems: A Novel and Exciting Framework. IEEE Geosci. Remote Sens. Mag. 2020, 8, 136–153. [Google Scholar] [CrossRef] [Green Version]
  37. Zhang, X.; Yang, Z.; Zhang, Y.; Ji, Y.; Wang, H.; Lv, K.; Lu, Z. Spatial and temporal shoreline changes of the southern Yellow River (Huanghe) Delta in 1976–2016. Mar. Geol. 2018, 395, 188–197. [Google Scholar] [CrossRef]
  38. Jiang, C.; Pan, S.; Chen, S. Recent morphological changes of the Yellow River (Huanghe) submerged delta: Causes and environmental implications. Geomorphology 2017, 293, 93–107. [Google Scholar] [CrossRef]
  39. Wang, H.; Yang, Z.; Saito, Y.; Liu, J.P.; Sun, X.; Wang, Y. Stepwise decreases of the Huanghe (Yellow River) sediment load (1950–2005): Impacts of climate change and human activities. Glob. Planet. Chang. 2007, 57, 331–354. [Google Scholar] [CrossRef]
  40. McFeeters, S.K. The use of the Normalized Difference Water Index (NDWI) in the delineation of open water features. Int. J. Remote Sens. 1996, 17, 1425. [Google Scholar] [CrossRef]
  41. Gao, B.-c. NDWI—A normalized difference water index for remote sensing of vegetation liquid water from space. Remote Sens. Environ. 1996, 58, 257–266. [Google Scholar] [CrossRef]
  42. McFeeters, S.K. Using the Normalized Difference Water Index (NDWI) within a Geographic Information System to Detect Swimming Pools for Mosquito Abatement: A Practical Approach. Remote Sens. 2013, 5, 3544–3561. [Google Scholar] [CrossRef] [Green Version]
  43. Otsu, N. A Threshold Selection Method from Gray-Level Histograms. IEEE Trans. Syst. Man Cybern. 1979, 9, 62–66. [Google Scholar] [CrossRef] [Green Version]
  44. Gens, R. Remote sensing of coastlines: Detection, extraction and monitoring. Int. J. Remote Sens. 2010, 31, 1819–1836. [Google Scholar] [CrossRef]
  45. Dolan, R.; Michael, S.F.; Stuart, J.H. Temporal Analysis of Shoreline Recession and Accretion. J. Coast. Res. 1991, 7, 723–744. [Google Scholar]
  46. Mark, C.; Douglas, B.C.; Leatherman, S.P. On Forecasting Future U.S. Shoreline Positions: A Test of Algorithms. J. Coast. Res. 1997, 13, 1245–1255. [Google Scholar]
  47. Genz, A.S.; Fletcher, C.H.; Dunn, R.A.; Frazer, L.N.; Rooney, J.J. The Predictive Accuracy of Shoreline Change Rate Methods and Alongshore Beach Variation on Maui, Hawaii. J. Coast. Res. 2007, 2007, 87–105, 119. [Google Scholar] [CrossRef] [Green Version]
  48. Ji, H.; Pan, S.; Chen, S. Impact of river discharge on hydrodynamics and sedimentary processes at Yellow River Delta. Mar. Geol. 2020, 425, 106210. [Google Scholar] [CrossRef]
  49. Wang, H.; Yang, Z.; Saito, Y.; Liu, J.P.; Sun, X. Interannual and seasonal variation of the Huanghe (Yellow River) water discharge over the past 50 years: Connections to impacts from ENSO events and dams. Glob. Planet. Chang. 2006, 50, 212–225. [Google Scholar] [CrossRef]
  50. Liu, Y.; Liu, J.; Xia, X.; Bi, H.; Huang, H.; Ding, R.; Zhao, L. Land subsidence of the Yellow River Delta in China driven by river sediment compaction. Sci. Total. Environ. 2021, 750, 142165. [Google Scholar] [CrossRef]
  51. Bi, N.; Wang, H.; Yang, Z. Recent changes in the erosion–accretion patterns of the active Huanghe (Yellow River) delta lobe caused by human activities. Cont. Shelf Res. 2014, 90, 70–78. [Google Scholar] [CrossRef]
  52. Kong, D.; Miao, C.; Borthwick, A.G.L.; Duan, Q.; Liu, H.; Sun, Q.; Ye, A.; Di, Z.; Gong, W. Evolution of the Yellow River Delta and its relationship with runoff and sediment load from 1983 to 2011. J. Hydrol. 2015, 520, 157–167. [Google Scholar] [CrossRef] [Green Version]
  53. Yu, Y.; Shi, X.; Wang, H.; Yue, C.; Chen, S.; Liu, Y.; Hu, L.; Qiao, S. Effects of dams on water and sediment delivery to the sea by the Huanghe (Yellow River): The special role of Water-Sediment Modulation. Anthropocene 2013, 3, 72–82. [Google Scholar] [CrossRef]
  54. Wu, X.; Bi, N.; Yuan, P.; Li, S.; Wang, H. Sediment dispersal and accumulation off the present Huanghe (Yellow River) delta as impacted by the Water-Sediment Regulation Scheme. Cont. Shelf Res. 2015, 111, 126–138. [Google Scholar] [CrossRef]
  55. Wang, S.; Hassan, M.A.; Xie, X. Relationship between suspended sediment load, channel geometry and land area increment in the Yellow River Delta. CATENA 2006, 65, 302–314. [Google Scholar] [CrossRef]
  56. Cui, B.-L.; Li, X.-Y. Coastline change of the Yellow River estuary and its response to the sediment and runoff (1976–2005). Geomorphology 2011, 127, 32–40. [Google Scholar] [CrossRef]
  57. Wu, X.; Bi, N.; Syvitski, J.; Saito, Y.; Xu, J.; Nittrouer, J.A.; Bianchi, T.S.; Yang, Z.; Wang, H. Can Reservoir Regulation Along the Yellow River Be a Sustainable Way to Save a Sinking Delta? Earth’s Future 2020, 8, e2020EF001587. [Google Scholar] [CrossRef]
  58. Zhou, L.; Liu, J.; Saito, Y.; Diao, S.; Gao, M.; Qiu, J.; Xu, C.; He, L.; Ye, S. Sediment budget of the Yellow River delta during 1959–2012, estimated from morphological changes and accumulation rates. Mar. Geol. 2020, 430, 106363. [Google Scholar] [CrossRef]
  59. Fan, Y.; Chen, S.; Zhao, B.; Pan, S.; Jiang, C.; Ji, H. Shoreline dynamics of the active Yellow River delta since the implementation of Water-Sediment Regulation Scheme: A remote-sensing and statistics-based approach. Estuar. Coast. Shelf Sci. 2018, 200, 406–419. [Google Scholar] [CrossRef]
  60. Zhang, X.; Zhang, Y.; Zhu, L.; Chi, W.; Yang, Z.; Wang, B.; Lv, K.; Wang, H.; Lu, Z. Spatial-temporal evolution of the eastern Nanhui mudflat in the Changjiang (Yangtze River) Estuary under intensified human activities. Geomorphology 2018, 309, 38–50. [Google Scholar] [CrossRef]
  61. Wu, X.; Wang, H.; Bi, N.; Saito, Y.; Xu, J.; Zhang, Y.; Lu, T.; Cong, S.; Yang, Z. Climate and human battle for dominance over the Yellow River’s sediment discharge: From the Mid-Holocene to the Anthropocene. Mar. Geol. 2020, 425, 106188. [Google Scholar] [CrossRef]
  62. Maloney, J.M.; Bentley, S.J.; Xu, K.; Obelcz, J.; Georgiou, I.Y.; Miner, M.D. Mississippi River subaqueous delta is entering a stage of retrogradation. Mar. Geol. 2018, 400, 12–23. [Google Scholar] [CrossRef]
  63. Nienhuis, J.H.; Ashton, A.D.; Edmonds, D.A.; Hoitink, A.J.F.; Kettner, A.J.; Rowland, J.C.; Törnqvist, T.E. Global-scale human impact on delta morphology has led to net land area gain. Nature 2020, 577, 514–518. [Google Scholar] [CrossRef] [PubMed]
  64. Liu, X.; Qiao, L.; Zhong, Y.; Wan, X.; Xue, W.; Liu, P. Pathways of suspended sediments transported from the Yellow River mouth to the Bohai Sea and Yellow Sea. Estuar. Coast. Shelf Sci. 2020, 236, 106639. [Google Scholar] [CrossRef]
  65. Rahman, A.F.; Dragoni, D.; El-Masri, B. Response of the Sundarbans coastline to sea level rise and decreased sediment flow: A remote sensing assessment. Remote Sens. Environ. 2011, 115, 3121–3128. [Google Scholar] [CrossRef]
  66. Blum, M.D.; Roberts, H.H. Drowning of the Mississippi Delta due to insufficient sediment supply and global sea-level rise. Nat. Geosci. 2009, 2, 488–491. [Google Scholar] [CrossRef]
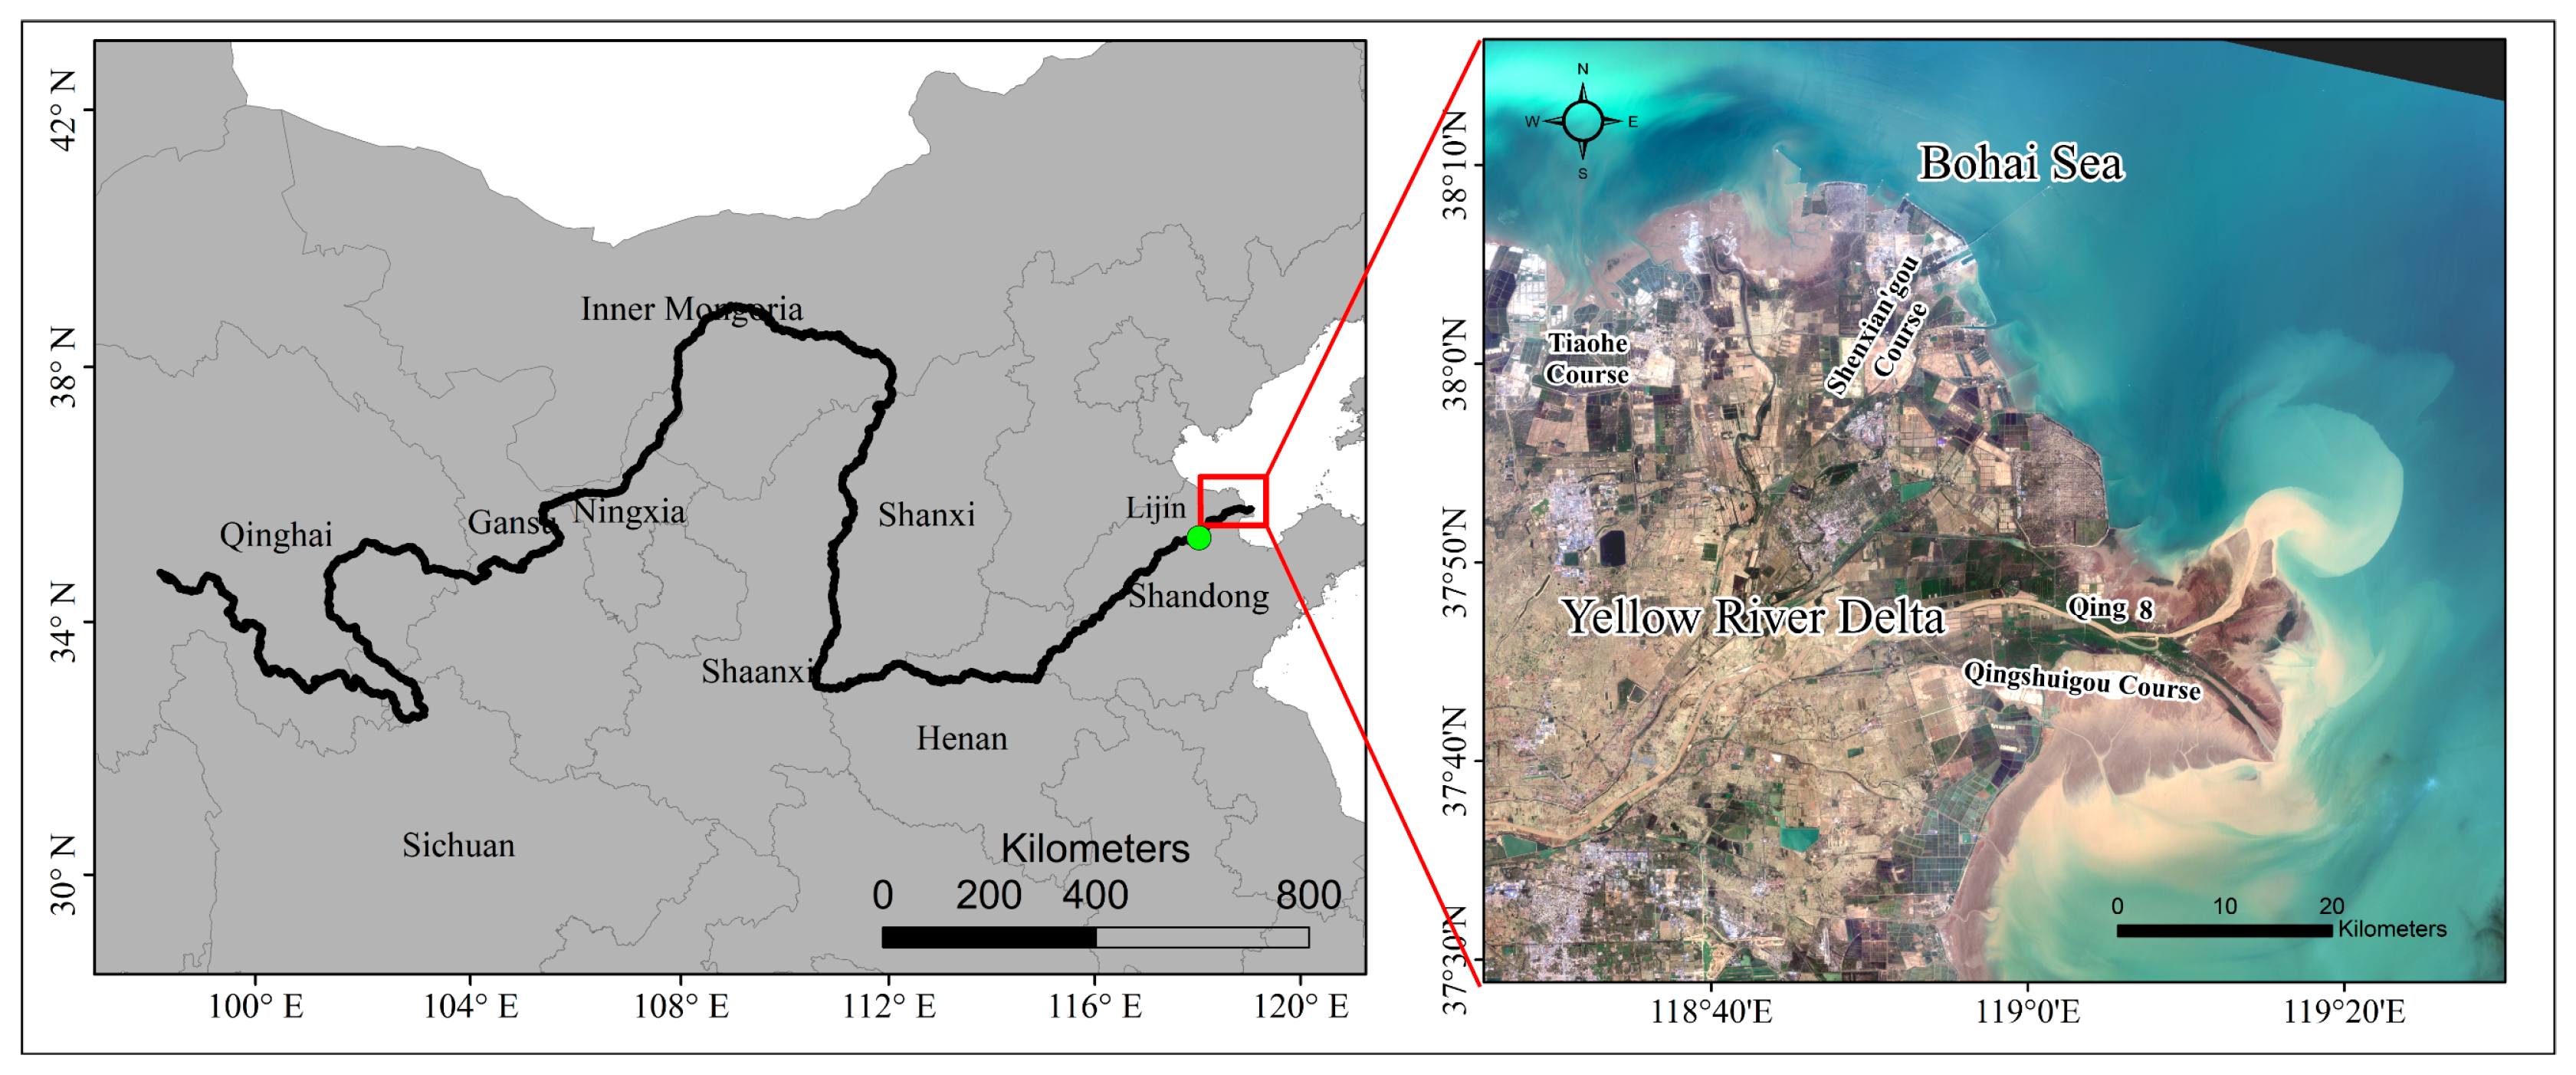
Figure 1. Location of the study area. On the left, the black solid line and green solid point represent the distribution of the Yellow River basin and Lijin Hydrometric Station, respectively. The figure on the right represents the 30 m natural true-color image of the YRD derived from the Landsat-8 Operational Land Imager (OLI) in March 2020.
Remotesensing 13 01940 g001
Figure 2. Optical false color composite images derived from Landsat-3 MSS band 6/5/4 (a), Landsat-5 TM band 4/3/2 (bf), and Landsat-8 OLI band 5/4/3 (h), and SAR intensity images derived from Envisat ASAR (g), Sentinel-1 (i), and GF-3 (j).
Remotesensing 13 01940 g002
Figure 3. Comparison of the coastlines extracted from Landsat-8 and Sentinel-1 images in 2017. The basemap of the whole YRD is downloaded from http://www.geodata.cn/, accessed on 20 October 2020. The basemap of subgraphs (ag) is derived from GaoFen-2 images with Rational Polynomial Coefficient (RPC) orthorectification in the Pixel Information Expert (PIE®) Basic 6.0.
Remotesensing 13 01940 g003
Figure 4. Flow chart of shoreline detection, extraction, and analysis methods in this study.
Remotesensing 13 01940 g004
Figure 5. Flow chart designed to extract shorelines after image preprocessing.
Remotesensing 13 01940 g005
Figure 6. Distribution of coastlines over the YRD from 1980 to 2020.
Remotesensing 13 01940 g006
Figure 7. Distribution of transects over the YRD.
Remotesensing 13 01940 g007
Figure 8. The change rate of coastlines over the YRD from 1980 to 2020. EPR and LRR are shown with black and red solid lines. Black dotted line A represents the average of EPR; red dotted line B indicates the average of LRR. The values in parentheses represent the abscissa and ordinate, respectively.
Remotesensing 13 01940 g008
Figure 9. Staged average annual rate of change of adjacent shorelines over the YRD.
Remotesensing 13 01940 g009
Figure 10. Staged average annual rate of change of adjacent shorelines in three major areas.
Remotesensing 13 01940 g010
Figure 11. Staged accretion and erosion areas over the YRD in the last 40 years.
Remotesensing 13 01940 g011
Figure 12. (a) Annual water discharge and annual sediment load at the Lijin Hydrometric Station from 1980 to 2020; (b) Coastline length and total area in the YRD; (c) Coastline and area change between two adjacent phases in the YRD. The green arrows in (a) present the years of the water and sediment regulation projects.
Remotesensing 13 01940 g012
Figure 13. Scatter matrix of water discharge, sediment load, entire shoreline length, entire area change, and estuary area change over the YRD in the last 40 years. Red lines are the fitting lines. R2 is the coefficient of determination, and r is Pearson’s correlation coefficient.
Remotesensing 13 01940 g013
Figure 14. Schematic diagram of binarization, edge detection, and shoreline extraction.
Remotesensing 13 01940 g014
Figure 15. (a) Geolocation of the Gudong Oilfield coastal dam. (b) Aerial photos of the central section of artificial dam obtained by the unmanned aerial vehicle (UAV) on 31 July 2019. (c) Spatial distribution of GPS RTK measurements along the coastal dam. (d) The corner area with the greatest coastline inconsistence between GPS RTK (11 January 2020) and GF-3 SAR (11 July 2020) by zooming in from (c). The Red line represents ‘true shoreline’ measured with GPS RTK, and the green line indicates the shoreline extracted from the SAR image.
Remotesensing 13 01940 g015
Figure 16. Distance between GF-3 coastline and true coastline from GPS RTK in 2020. The gray dotted line indicates the zero error, while red and blue dotted lines show the sections of interval values of ±10 m and ±20 m, respectively. The comparison points were sampled at 50 m intervals along the coastal dam from north to south.
Remotesensing 13 01940 g016
Figure 17. Location of transect 97 and 112 defined in DSAS analysis.
Remotesensing 13 01940 g017
Figure 18. Distance from baseline versus shoreline date to highlight the percent confidence interval statistic for (a) transect 97 and (b) transect 112. The colored region illustrates 95% confidence band (95% CI) around the linear regression rate (black dashed line). LCI95, 95% confidence interval; LRR, linear regression rate.
Remotesensing 13 01940 g018
Figure 19. Area change over the YRE from 1980 to 2020. The red frame is the YRE defined in this study. A total of 10 periods of coastlines extracted are located in the red frame.
Remotesensing 13 01940 g019
Figure 20. (a) Sediment load and estuary area in the YRE. (b) Area change in the YRE in the last 40 years.
Remotesensing 13 01940 g020
Figure 21. Distribution of sediment transports from Yellow river to the Bohai Sea and Yellow Sea. The base map is derived from 16 m GaoFen-6 (GF-6) wide field of view (WFV) data with geometry and radiation correction.
Remotesensing 13 01940 g021
Table 1. Optical and SAR remote sensing imagery used for coastline extraction in this study.
DateTimeSatelliteLevelSensorPixel Spacing (m)
1980-07-1401:53:31Landsat-3L1TPMSS80
1985-08-0502:11:42Landsat-5L1TPTM30
1991-07-0502:05:09Landsat-5L1TPTM30
1996-07-0201:55:39Landsat-5L1TPTM30
1999-06-2502:19:49Landsat-5L1TPTM30
2003-08-0702:18:46Landsat-5L1TPTM30
2009-08-3013:57:26EnvisatL1TPASAR-IMP12.5
2013-06-1502:43:55Landsat-8L1TPOLI30
2017-07-0213:04:39Sentinel-1Level 1SAR-IWS20
2020-07-1109:57:57GaoFen-3L1TPSAR-FSII10
Publisher’s Note: MDPI stays neutral with regard to jurisdictional claims in published maps and institutional affiliations.