Article

An Imaging Network Design for UGV-Based 3D Reconstruction of Buildings

by
Ali Hosseininaveh
1 and
Fabio Remondino
2,*
1
Department of Photogrammetry and Remote Sensing, Faculty of Geodesy and Geomatics Engineering, K. N. Toosi University of Technology, Tehran 15433-19967, Iran
2
3D Optical Metrology (3DOM) Unit, Bruno Kessler Foundation (FBK), 38123 Trento, Italy
*
Author to whom correspondence should be addressed.
Remote Sens. 2021, 13(10), 1923; https://doi.org/10.3390/rs13101923
Submission received: 17 March 2021 / Revised: 11 May 2021 / Accepted: 12 May 2021 / Published: 14 May 2021
(This article belongs to the Special Issue Advances in Mobile Mapping Technologies)

Abstract

:
Imaging network design is a crucial step in most image-based 3D reconstruction applications based on Structure from Motion (SfM) and multi-view stereo (MVS) methods. This paper proposes a novel photogrammetric algorithm for imaging network design for building 3D reconstruction purposes. The proposed methodology consists of two main steps: (i) the generation of candidate viewpoints and (ii) the clustering and selection of vantage viewpoints. The first step includes the identification of initial candidate viewpoints, selecting the candidate viewpoints in the optimum range, and defining viewpoint direction stages. In the second step, four challenging approaches—named façade pointing, centre pointing, hybrid, and both centre & façade pointing—are proposed. The entire methodology is implemented and evaluated in both simulation and real-world experiments. In the simulation experiment, a building and its environment are computer-generated in the ROS (Robot Operating System) Gazebo environment and a map is created by using a simulated robot and Gmapping algorithm based on a Simultaneously Localization and Mapping (SLAM) algorithm using a simulated Unmanned Ground Vehicle (UGV). In the real-world experiment, the proposed methodology is evaluated for all four approaches for a real building with two common approaches, called continuous image capturing and continuous image capturing & clustering and selection approaches. The results of both evaluations reveal that the fusion of centre & façade pointing approach is more efficient than all other approaches in terms of both accuracy and completeness criteria.

Graphical Abstract

1. Introduction

The 3D reconstruction of building is of interest for many companies and researchers who are working in the field of Building Information Modelling [1] or heritage documentation. Indeed, 3D modelling of buildings can be used for many applications, including accurate documentation [2], for reconstruction or repairing in the case of damage [3,4], for visualization purposes, for the generation of education resources for history and culture students and researchers [5], and for virtual tourism and for (Heritage) Building Information Modelling (H-BIM/BIM) [6,7]. Most of these applications require several necessities, which can be summarized as a fully automatic, low-cost, portable 3D modelling system which can deliver a high accurate, comprehensive, photorealistic 3D model with all details.
Image-based 3D reconstruction is one of the most feasible, accurate and fast techniques that can be used for building 3D reconstructions [8]. Images of buildings can be captured by an Unmanned Ground Vehicle (UGV), Unmanned Aerial Vehicle (UAV) or hand-held camera carried by an operator, as well as some novel approaches for capturing stereo images [9]. If a UGV equipped with a height-adjustable and pan-tilt camera is used for such task, the maximum height of the camera will be far lower than the height of the building. This restriction decreases the quality of the final model generated with the captured UGV-based images for the top parts of the building. On the other hand, using UAVs in urban areas is a challenging project due to numerous technical and operational issues, including regulatory restrictions, problems with data transfer, low payload, limited flight time to carry a high-quality camera, safety hazard for other aircrafts, impacts with people or structures, etc. [10]. These issues force users to exploit UAVs in a safe mode over buildings, decreasing the quality of the final model on façades. In an ideal situation, a combination of a UAV and a UGV can be used. In such way, a UAV flight planning technique can be used for the top parts of the building [11,12]. Similarly, path planning for UGVs should be carried out to capture images in suitable poses, in an optimal and obstacle-free way.
Imaging network design is one of the critical steps in image-based 3D reconstruction of buildings [13,14,15,16]. This step, also known in robotics as Next Best View Planning [17], aims to determine a minimum number of images that are sufficient to provide an accurate and complete digital twin of the surveyed scene. This can be done by considering the optimal range for each viewpoint and the suitable coverage and overlap between viewpoints. Although this issue has been taken into account by photogrammetry researchers [18,19] working with hand-held cameras or Unmanned Aerial Vehicles (UAV) [20], it has not yet been considered for UGVs equipped with digital cameras. Imaging network design for a UGV differs from that for UAVs as a result of the height and camera orientation constraints of the UGV.
A summary of investigations in image-based view planning for 3D reconstruction purposes was cited in [13], where research activities were classified into three main categories, including:
  • Next Best View Planning: starting from initial viewpoints, the research question is where the next viewpoints should be placed. Most of the approaches use Next Best View (NBV) methods to plan viewpoints without prior geometric information of the target object in the form of 3D model. Generally, NBV methods iteratively find the next best viewpoint based on a cost-planning function and information from previously planned viewpoints. These methods also use partial geometric information of the target object, reconstructed from planned viewpoints, to plan future sensor placements [21]. To find the next best viewpoints, one of three methods for representing the generated scanned area in the initial viewpoints is used, including triangular meshes [22] and volumetric [23] and Surfel representations [24].
  • Clustering and Selecting the Vantage Viewpoints: given a dense imaging network, clustering and selecting the vantage images is the primary goal [18]. Usually, in this category, the core functionality is performed by defining a visibility matrix between sparse surface points (rows) and the camera poses (columns), which can be estimated through a structure from motion procedure [15,16,25,26,27].
  • Complete Imaging Network Design (also known as model-based design): contrary to the previous methods, complete imaging network design is performed without any initial network, but an initial geometric model of the object should be available. The common approaches in this category are classified into set theory, graph theory and computational geometry [28].
Most of the previous works in this field have focused mainly on view planning for the 3D reconstruction of small industrial or cultural heritage objects using either an arm robot or a person holding a digital camera [15,19,20,29,30,31]. These methods follow a common workflow that includes generating a large set of initial candidate viewpoints, and then clustering and selecting a subset of vantage viewpoints through an optimization technique [32]. Candidate viewpoints are typically produced by offsetting from the surface of the object of interest [33], or on the surface of the sphere [34] or ellipsoid that encapsulates it [13].
A comparison of view planning algorithms in the complete design (the third group) and next best view planning (the first group) groups is presented in [35], where 13 state-of-the-art algorithms were compared with each other using a six-axis robotic arm manipulator equipped with a projector and two cameras mounted on a space bar and placed in front of a rotation table. All the methods were exploited to generate a complete and accurate 3D point cloud for five cultural heritage objects. The comparison was performed based on four criteria, including the number of directional measurements, digitization time, total positioning distance, and surface coverage.
Recently, view planning has been integrated into UAV applications, where large target objects, such as buildings or outdoor environments, need to be inspected or reconstructed via aerial or terrestrial photography [12,36,37,38,39]. A survey of view planning methods, also including UAV platforms, is presented in [36]. In the case of planning for 3D reconstruction purposes, methods are divided into two main groups: off-the-shelf flight planning and explore-then-exploit groups. While in the former group, commercial flight planners for UAVs use simple aerial photogrammetry imaging network constraints to plan the flight, in the latter group, having an initial flight based on off-the-shelf flight planning, a model is generated and flight view planning algorithms are used. Researchers have proposed different view planning algorithms, including complete design and next best view planning strategies, for the second view planning of the explore-then-exploit groups. For instance, [40,41,42] proposed on-line next best view planning for UAV with an initial 3D model. Other authors proposed different complete design view planning algorithms for 3D reconstruction of buildings using UAVs [12,21,39,43,44,45,46,47]. For instance, in [21], the footprint of a building is extracted from DSM generated by nadir UAV imagery. Next, a workflow including façade definition, dense camera network design, visibility analysis, and coverage-based filtering (three viewpoints for each point) were then applied to generate an optimum camera poses for acquiring façade images and generate a complete geometric 3D model of the structure. UAV imagery is in most cases not enough to obtain a highly accurate, complete and dense point cloud of a building, and terrestrial imaging should also be performed [37]. Moreover, UAV imagery needs a proper certificate of waiver or authorization in urban regions for flying.
Investigating optimum network design in the real world presents difficulties due to the diversity of parameters influencing the final result. In this article, before real-world experiments, the different proposed approaches of network design were tested in a simulation environment known as Gazebo with a simulated robot operated on ROS. ROS is an open-source middleware operating system that offers libraries and tools in the form of stacks, packages and nodes written in python or C++ to assist software developers in generating robot applications. It works based on a specific communication architecture in the form of a message passing through common topics, server and client communication in the form of request and response, and dynamic reconfiguration using services [48]. On the other hand, Gazebo provides tools to accurately and efficiently simulate different robots in complex indoor and outdoor environments [49]. To achieve ROS integration with Gazebo, a set of ROS packages provide wrappers for using Gazebo under ROS [50]. They offer the essential interfaces to simulate a robot in Gazebo using the ROS communication architecture. Researchers and companies have developed many simulated robots in ROS Gazebo and have made them freely available based on ROS licenses. For instance, Husky is a four-wheeled robot generated by the Clear Path company in both ROS Gazebo simulation and real-world scenarios [51]. Moreover, many robotics researchers have developed software packages for different robotics concepts such as navigation, localization and SLAM based on ROS rules. For example, GMapping is a Rao-Blackwellized particle filer for solving SLAM problems. Each particle carries an individual map of the environment for its poses. The weighting of each particle is performed based on the similarity between the 2D laser data and the map of the particle. An adaptive technique is used to reduce the number of particles in a Rao-Blackwellized particle filter using the movement of the robot and the most recent observations [52].
This paper aims to propose a novel photogrammetric imaging network design to automatically generate optimum poses for the 3D reconstruction of a building using terrestrial image acquisitions. The images can then be captured by either a human operator or a robot located in the designed poses and can be used in photogrammetric tools for accurate and complete 3D reconstruction purposes.
The main contribution of the article is a view planning method for the 3D reconstruction of a building from terrestrial images acquired with a UGV platform carrying a digital camera. Other contributions of the article are as follows:
(i)
It proposes a method to suggest camera poses reachable by either a robot in the form of numerical values of the poses or a human operator in the form of vectors on a metric map.
(ii)
In contrast to the imaging network design methods which have been developed to generate initial viewpoints located on an ellipse or a sphere at an optimal range from the object, the initial viewpoints are here placed within the maximum and minimum optimal ranges on a two-dimensional map.
(iii)
Contrary to other imaging network design methods developed for building 3D reconstruction (e.g., [21]), the presented method takes into account range-related constraints in defining the suitable range from the building. Moreover, clustering and selecting approach is accomplished using a visibility matrix defined based on a four-zone cone instead of filtering for coverage with only three rays for each point and filtering for accuracy without considering the impact of a viewpoint in dense 3D reconstruction. Additionally, in the presented method, four different definitions of viewpoints are examined to evaluate the best viewpoint directions.
(iv)
To evaluate the proposed methods, a simulated environment including textured buildings in ROS Gazebo, as well as a ROS-based simulated UGV equipped with a 2D LiDAR, a DSLR camera and an IMU, are provided and are freely available in https://github.com/hosseininaveh/Moor_For_BIM (accessed on 13 May 2021). Researchers can use them for evaluating their methods.
In the following sections of this article, the novel imaging network design method is presented. Method implementation and results are provided with simulation and real experiments for façade 3D modelling purposes in Section 3. Finally, the article ends with a discussion and concluding considerations and some suggestions for future works in Section 4 and Section 5.

2. Materials and Methods

The general structure of the developed methodology consists of four main stages (Figure 1):
  • A dataset is created for running the proposed algorithm for view planning, including a 2D map of the building; an initial 3D model of the building generated simply by defining a thickness for the map using the height of the building; camera calibration parameters; and, minimum distance for candidate viewpoints (in order to keep the correct Ground Sample Distance (GSD) for 3D reconstruction purposes).
  • A set of candidate viewpoints is provided by generating a grid of sample viewpoints on binary maps extracted from the 2D map and selecting some of the viewpoints located in suitable range with considering imaging network constraints. The direction of the camera for each viewpoint is calculated based on pointing towards the façade (called façade pointing) or pointing towards to the centre of the building (called centre pointing), or two directions in each viewpoint locations with centre & façade pointing. The candidate viewpoints in each pose are duplicated at two different heights (0.4 and 1.6 m).
  • The generated candidate viewpoints, the camera calibration parameters and the initial 3D model of the building are used in the process of clustering and selecting vantage viewpoints with four different approaches including: centre pointing, façade pointing, hybrid, and centre & façade pointing.
  • Given the viewpoint poses selected in the above-mentioned approaches, a set of images is captured at the designed viewpoints and processed with photogrammetric methods to generate dense 3D point clouds.

2.1. Dataset Preparation

To run the proposed algorithm for view planning, dataset preparation is needed. The dataset includes a 2D map (with building footprint and obstacles), camera calibration parameters and a rough 3D model of the building to be surveyed. These would be the same materials required to plan a traditional photogrammetric survey. The 2D map can be generated using different methods, including classic surveying, photogrammetry, remote sensing techniques or Simultaneous Localization And Mapping (SLAM) methods. In this work, SLAM was used for the synthetic dataset and the surveying method was used for the real experiment. The rough 3D model can be provided by different techniques, including quick sparse photogrammetry [53], quick 3D modelling software [54], or simply by defining a thickness for the building footprint as walls and generating sample points on each wall with a specific sample distance. In this work, the latter method, defining a thickness for the building footprint, was used.

2.2. Generating Candidate Viewpoints

Candidate viewpoints are provided in three steps: grid sample viewpoint generation, candidate viewpoint selection, and viewpoint direction definition.

2.2.1. Generating a Grid of Sample Viewpoints

The map is converted into three binary images: (i) a binary image with only the building, (ii) a binary image with the surrounding objects known as obstacles, and (iii) a full binary image including building and obstacles. The binary images were automatically generated by running a global threshold using Otsu thresholding method [55]. The ground coordinates (in the global coordinate system) and the image coordinates of the buildings corners are used to determine the transformation parameters between the coordinate systems. These parameters are used in the last stage of the procedure for a 2D affine transformation to transfer the estimated viewpoints coordinates from the image coordinate system to the map coordinate systems. Given the full binary image, a grid of viewpoints with a specific sample distances (e.g., one metre on the ground) is generated over the map.

2.2.2. Selecting the Candidate Viewpoints Located in a Suitable Range

The viewpoints located on the building and the obstacles are removed from the grid viewpoints. Since the footprint and obstacles are black in the full binary image, this process can be carried out by simply removing points with zero grey pixel values from the grid viewpoints. Moreover, the refinement of the initial viewpoints is performed by eliminating viewpoints outside the optimal range of the camera with considering the parameters of the camera in photogrammetric imaging network constraints such as imaging scale constraint ( D s c a l e m a x ), resolution ( D R e s o m a x ), depth of field ( D D O F n e a r ) and camera field of view ( D F O V m a x , D F O V m i n ). The optimum range is estimated using Equation (1) [56]. Further details of each equation are provided in Table 1 and Table 2.
  D m a x = m i n ( D s c a l e m a x   , D R e s o m a x ,   D F O V m a x )   D m i n = m a x ( D D O F n e a r ,   D F O V m i n ) R a n g e =   D m a x   D m i n
Having computed the suitable range, they should be converted into pixels. Then, a buffer is generated on the map by inverting the map of the building and subtracting two morphology operations from each other. The morphology operations are two dilations with a kernel size twice the maximum and minimum ranges. Having generated the buffer, the sample points located outside the buffer should be removed. In order to achieve redundancy in image observations in the z direction (height), two viewpoints are considered in each location with different heights (0.4 and 1.6 m) based on the height of an operator in sitting and standing states or different height level of the camera tripod on the robot.

2.2.3. Defining Viewpoint Directions

Having generated the viewpoint locations, in order to estimate the direction of the camera in each viewpoint location, three different approaches can be used:
(i)
the camera is looking at the centre of the building (centre pointing) [29]: the directions of viewpoints are generated by simply estimating the centre of the building in the binary image, estimated by computing the centroid derived from image moments on the building map [57] and defining the vector between each viewpoints locations and the estimated centre.
(ii)
the camera in each location is looking at the nearest point on the façade (façade pointing): some of the points on the façade may not be visible due to their being located behind obstacles or on the corners of complex buildings. These points are recognized by running the Harris corner detector on the map of the building for finding the corner of the buildings and recognizing the edge points located in front of big obstacles within the range buffer. Given these points, the directions of the six nearest viewpoints to these points are modified towards them.
(iii)
two directions (centre & façade pointing) are defined for any viewpoint locations: the directions of the viewpoints for both previous approaches are considered.
To estimate the directions in the form of quaternion, a vector between each viewpoint and the nearest point on the façade (in the façade pointing) or the centre of the building (in the centre pointing method) is drawn, and vector to quaternion equations are used to estimate the orientation parameters of the camera. These parameters were estimated by considering the normalized drawn vector in binary image with z value equal to zero ( a ) and the initial camera orientation in the ground coordinate systems ( b = [0, 0, −1]), as follows:
e = a × b
α = cos 1 ( a b | a | · | b | )
q = [ q 0 , q 1 , q 2 , q 3 ] = [ cos ( α / 2 ) ,   e x   sin ( α / 2 ) ,     e y   sin ( α / 2 ) ,   e z   sin ( α / 2 ) ]
r o l l = arctan 2 ( q 0   q 1 + q 2 q 3 ) 1 2 ( q 1 2 + q 2 2 ) p i t c h = arcsin ( 2 ( q 0 q 2 q 3 q 1 ) ) y a w = arctan 2 ( q 0   q 3 + q 1 q 2 ) 1 2 ( q 2 2 + q 3 2 )

2.3. Clustering and Selecting Vantage Viewpoints

The initial dense viewpoints generated from the previous step are suitable for accessibility and visibility, but the number and density of these viewpoints is generally very high. Therefore, a large amount of processing time is required to generate a dense 3D point cloud from the images captured in these viewpoints. Consequently, optimum viewpoints should be chosen by clustering and selecting vantage viewpoints using a visibility matrix [16]. As this method is presented in [16], for each point of the available rough 3D model of the building, a four-zone cone with an axis aligned with the surface normal is defined (Figure 2, right). The opening angle of the cone (80 degrees) is estimated based on the maximum incidence angle for a point to be visible in an image (60 degrees). The opening angle of the cone is divided into four sections to provide the four zones of the point. A visibility matrix is created by using the four zones of each of points as rows and all viewpoints as columns (Figure 2, left). The matrix is filled with binary values by checking visibility between viewpoints and points at each zone of the cone. For this checking, the angle between the ray coming from each viewpoint and the surface normal on the point is computed and it is compared with the threshold values for each zone [16].
Having generated the visibility matrix, an iterative procedure is carried out to select the optimum viewpoints. In this procedure, the sum of all the columns of the obtained visibility matrix is estimated, the column with the highest sum value is selected as the optimal viewpoint, and then all of the rows with a value of 1 in that column, as well as the column itself, are removed from the visibility matrix. Finally, in any iteration of the procedure, a photogrammetric space intersection is done. Photogrammetric space intersection can be run on the common points between at least two viewpoints without any redundancy in image observations. However, when aiming to estimate the standard deviation, an extra viewpoint is needed. The procedure is repeated until completeness and accuracy criteria are satisfied. The accuracy criterion, relative precision, is obtained through running photogrammetric space intersection on all visible points (the points visible at least in three viewpoints) and the selected viewpoints and dividing the estimated standard division by the maximum length of the building. The completeness criterion is estimated through dividing the number of points that has been seen in at least three viewpoints (has only one row in the final visibility matrix) by all points in the rough 3D model. If this ratio is greater than a given threshold (e.g., 95 percent) and an accuracy criterion (a threshold given by the operator) is satisfied, the iteration is terminated. This approach is similar to the method presented in [16], but a modification is performed with respect to ignoring range-related constraints in the visibility matrix when considering these constraints in generating the candidate viewpoints step (Section 3.2).
To choose the optimum viewpoints from the initial candidate viewpoints generated with the three approaches described in the previous step, the visibility matrix approach can be run using four approaches:
Centre Pointing: the initial candidate viewpoints that point towards the centre of the building; the camera calibration parameters and the rough 3D model of the building are used in the clustering and selecting approach.
Façade Pointing: the camera calibration parameters and the rough 3D model of the building are used in the clustering and selecting approach, with the initial candidate viewpoint pointing towards façade and corners of the building.
Hybrid: both camera calibration and the rough 3D model are identical to the previous approach, whereas the initial candidate viewpoints of both previous approaches are used as inputs for the clustering and selection step.
Centre & Façade Pointing: the output of the first two approaches is assumed to be the vantage viewpoint.

2.4. Image Acquisition and Dense Point Cloud Generation

Once viewpoints have been determined, images are captured in the determined positions for all four approaches presented in the previous section. This can be performed with either a robot equipped with a digital camera using the provided numerical poses for the viewpoints or a person with a hand-held camera using GPS app on his/her smart phone or a handy GPS and the provided guide map. The images are then processed with photogrammetric methods [56,57,58], including (1) key point detection and matching; (2) outlier removal; (3) estimation of the camera interior and exterior parameters and the generation of a sparse point cloud; and (4) generation of a dense point cloud using multi-view dense matching. In this work, Agisoft Metashape [59] was chosen for evaluating the performance of the presented network design and viewpoint selection.

3. Results

The proposed methodology was implemented in Matlab (https://github.com/hosseininaveh/IND_UGV (accessed on 13 May 2021)) and was evaluated in both simulated and real environments, using a simulated robot developed in this work, and as later presented, respectively.

3.1. Simulation Experiments on a Building with Rectangular Footprint

To test the performances and reliability of the proposed method, ROS and Gazebo simulations were exploited with the use of a ground vehicle robot, equipped with a digital camera, in order to survey a building.
To evaluate the method proposed in Section 3, the refectory building of the K.N. Toosi University campus (Figure 3, right) was modelled in the ROS Gazebo simulation environment. A UGV equipped with a DSLR camera and a 2D range finder (Figure 3, left) was used in the simulation environment to provide a map of the scene using the GMapping algorithm, and also to capture images (Figure 4). To evaluate the performance of the proposed imaging network design algorithm, the four steps of the algorithm were followed in order to generate the 3D point cloud of the refectory building.

3.1.1. Generating Initial Candidate Viewpoints

The steps for generating initial sample viewpoints are depicted in Figure 5. Three image maps (Figure 5A–C) were extracted from the map of the building generated with the GMapping algorithm [60,61]. The coordinates of four exterior corners of the building were measured in the Gazebo model and image maps to estimate the 2D affine transformation parameters. Given the pixel size of the map on the ground (53 mm), the initial sample viewpoints were then generated over the map with one-meter sample distances, where the pixel values of the image map were not zero (green points shown in Figure 5D).

3.1.2. Selecting the Candidate Viewpoints Located in a Suitable Range

Given the sample viewpoints, the viewpoints located very close or very far from the building optimum range of the camera were removed using the range imaging network constraints [13] (Figure 6). Given the building dimensions (the perimeter is around 140 m) and considering a mm accuracy for the produced 3D point cloud of the building, the relative precision would be 1/14,000. The minimum range (2.56 m) and the maximum range (4.49 m) were obtained considering camera parameters as follows: focal length (18 mm), f-Stop (8), expected accuracy (1/14,000), image measurement precision (half a pixel size of the camera (0.0039 mm) and sensor size (23.5 × 15.6 mm). Having obtained the minimum and maximum range, the buffer was generated on the map, including the sample viewpoints located within a suitable range.

3.1.3. Defining Viewpoints Directions

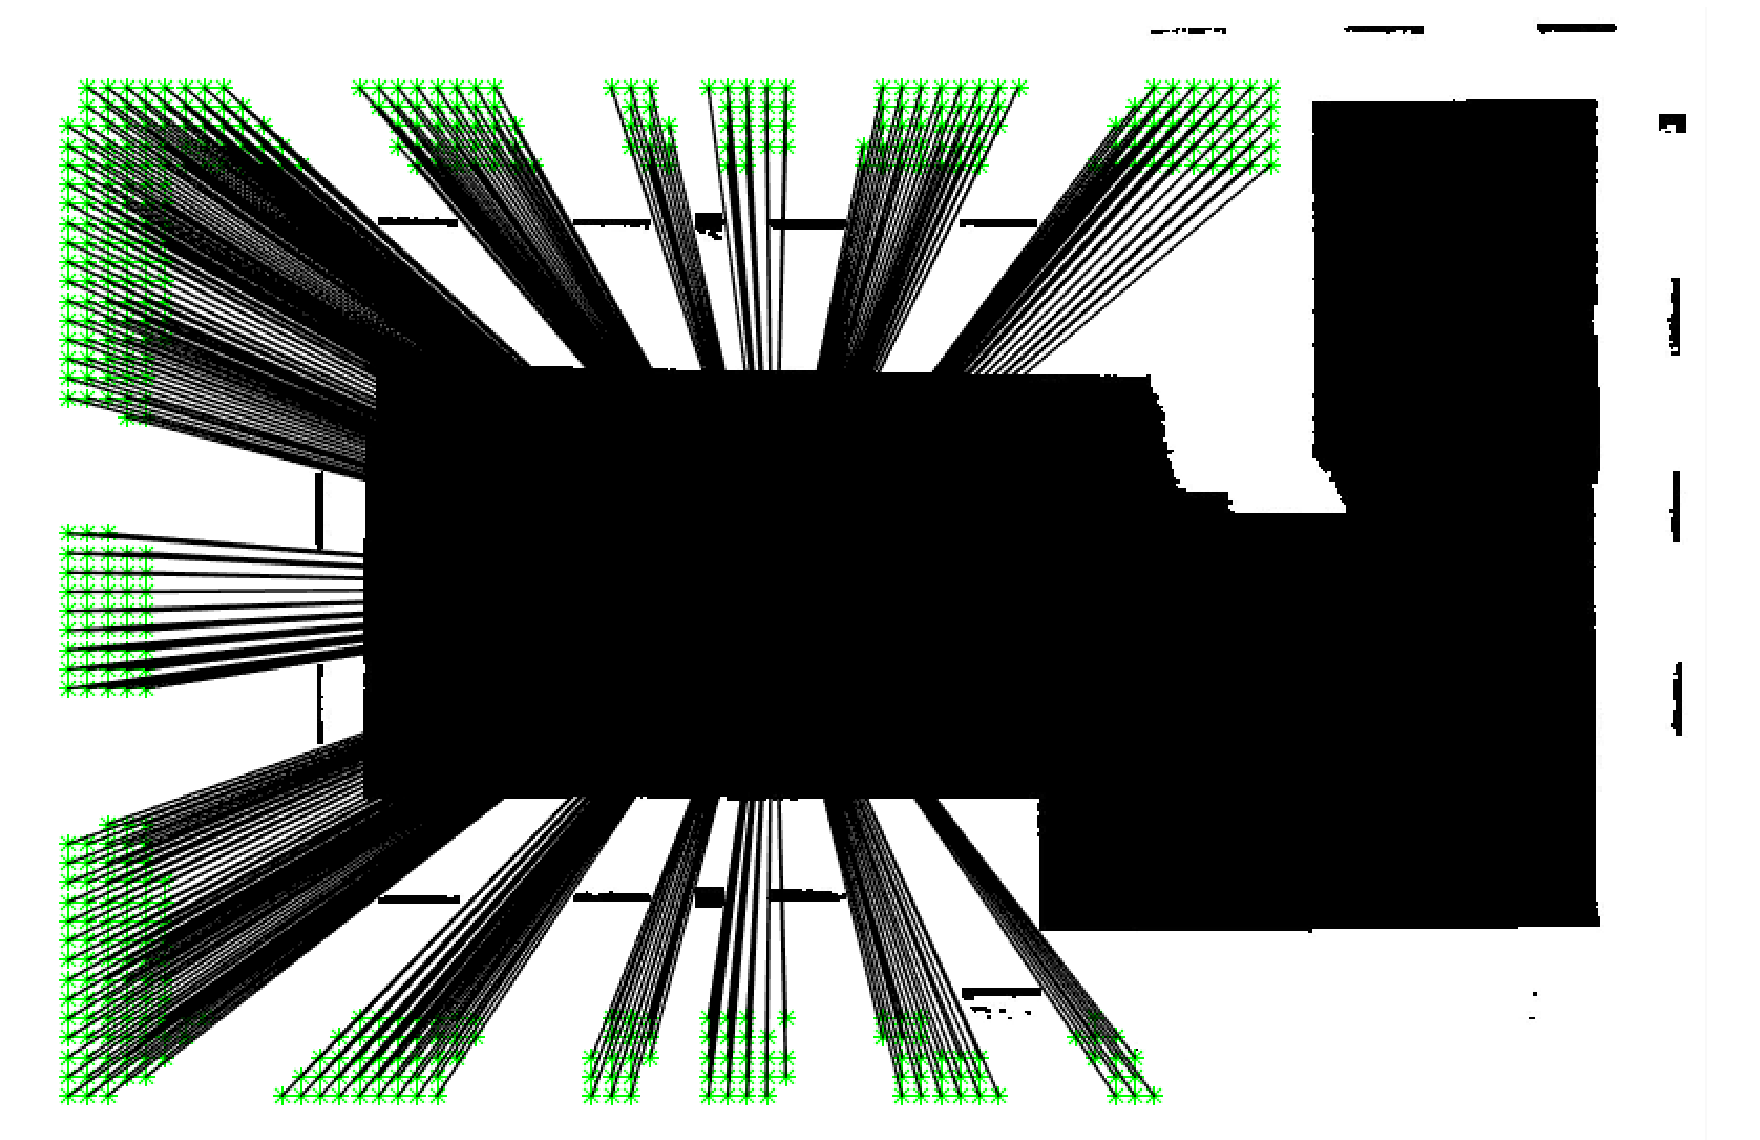
To find the direction of each viewpoint in the façade pointing strategy, a canny edge detector was run on the map of the building (Figure 7A) and a vector was generated from each viewpoint to the nearest pixel on the edge of the building (Figure 7B). The vectors located on obstacles were then eliminated by examining whether any of their pixels were located on the map pixels with grey value equal to zero (Figure 7C). The invisible points on the façade building were then identified by (1) running the Harris corner detector for points located on the corners of the building, and (2) finding the edge points that their corresponding viewpoints vectors were eliminated due to obstacles (Figure 7D). Finally, in the façade pointing strategy, the direction of the six nearest viewpoints to each of the invisible points was modified towards the invisible points (Figure 7E).
As shown in Figure 8, in the centre pointing strategy, the directions of viewpoints were shown by drawing vectors between the viewpoints and the centre of building. The vectors located on the parameters were then computed using Equations (2)–(5).

3.1.4. Clustering and Selecting Vantage Viewpoints

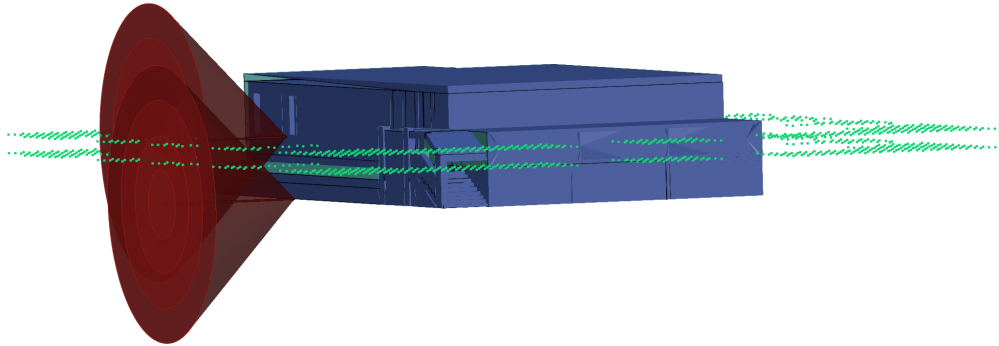
To have a more complete point cloud of the building in the vertical (z) direction, the number of viewpoints was doubled in order to have two viewpoints with the same location in the x and y coordinates, but with two different values in the z direction (0.4 and 1.6 m from the ground). Figure 9 illustrates the initial candidate viewpoints for the façade pointing approach and the four-zone cone (see Section 3.3) of two points in the CAD model. As can be concluded from this figure, by increasing the incidence angles, the aperture of the cone will decrease, and thus the points considered visible in the viewpoints will be closer to each other. This assumption results in more viewpoints by increasing the incidence angle.
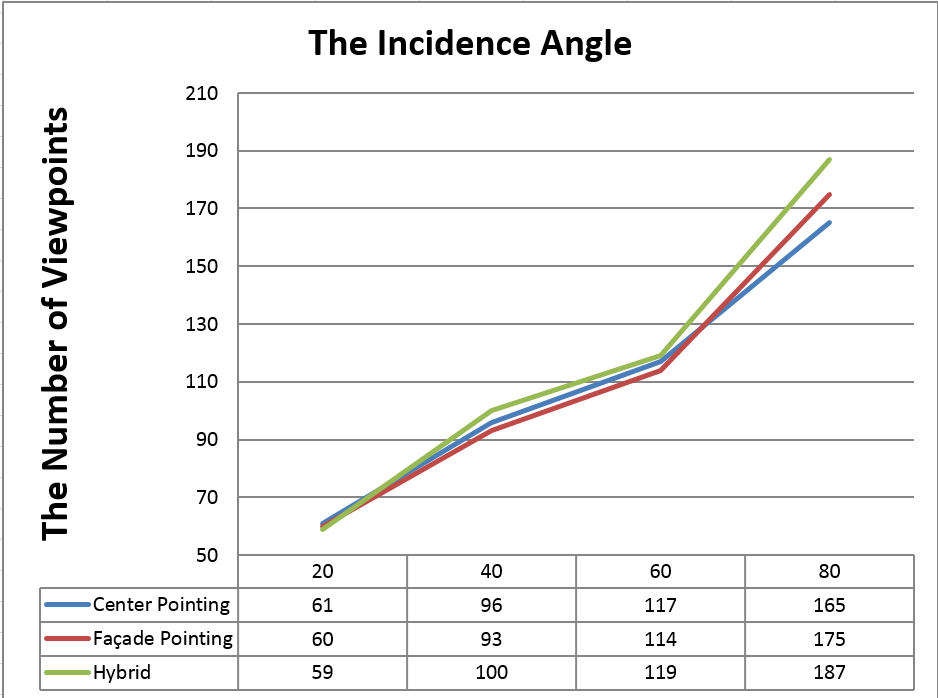
This fact is proved by setting different values for the incidence angle and running the algorithm for the clustering and selection of the vantage image. The results are presented in Figure 10. The number of viewpoints for the four different incidence angles is provided in Figure 6. Although the minimum number of viewpoints was obtained with an incidence angle of 20 degrees, a low number of images could increase the probability of failure of matching procedures in SfM due to the wide angle between the optical axes of adjacent cameras. This issue can be seen in Figure 11, which shows the gap in the positions of viewpoints in the corner of the building (the red box in the Figure) as well as the failure in image alignment in SfM for the dataset with incidence angles set below 60 degrees (the bottom of Figure 11A,B). In the experiments, with a trial-and-error approach, it was found that any value below 80 degrees for this parameter could result in a failure in image alignment. This happened when running hybrid approach in the simulation.
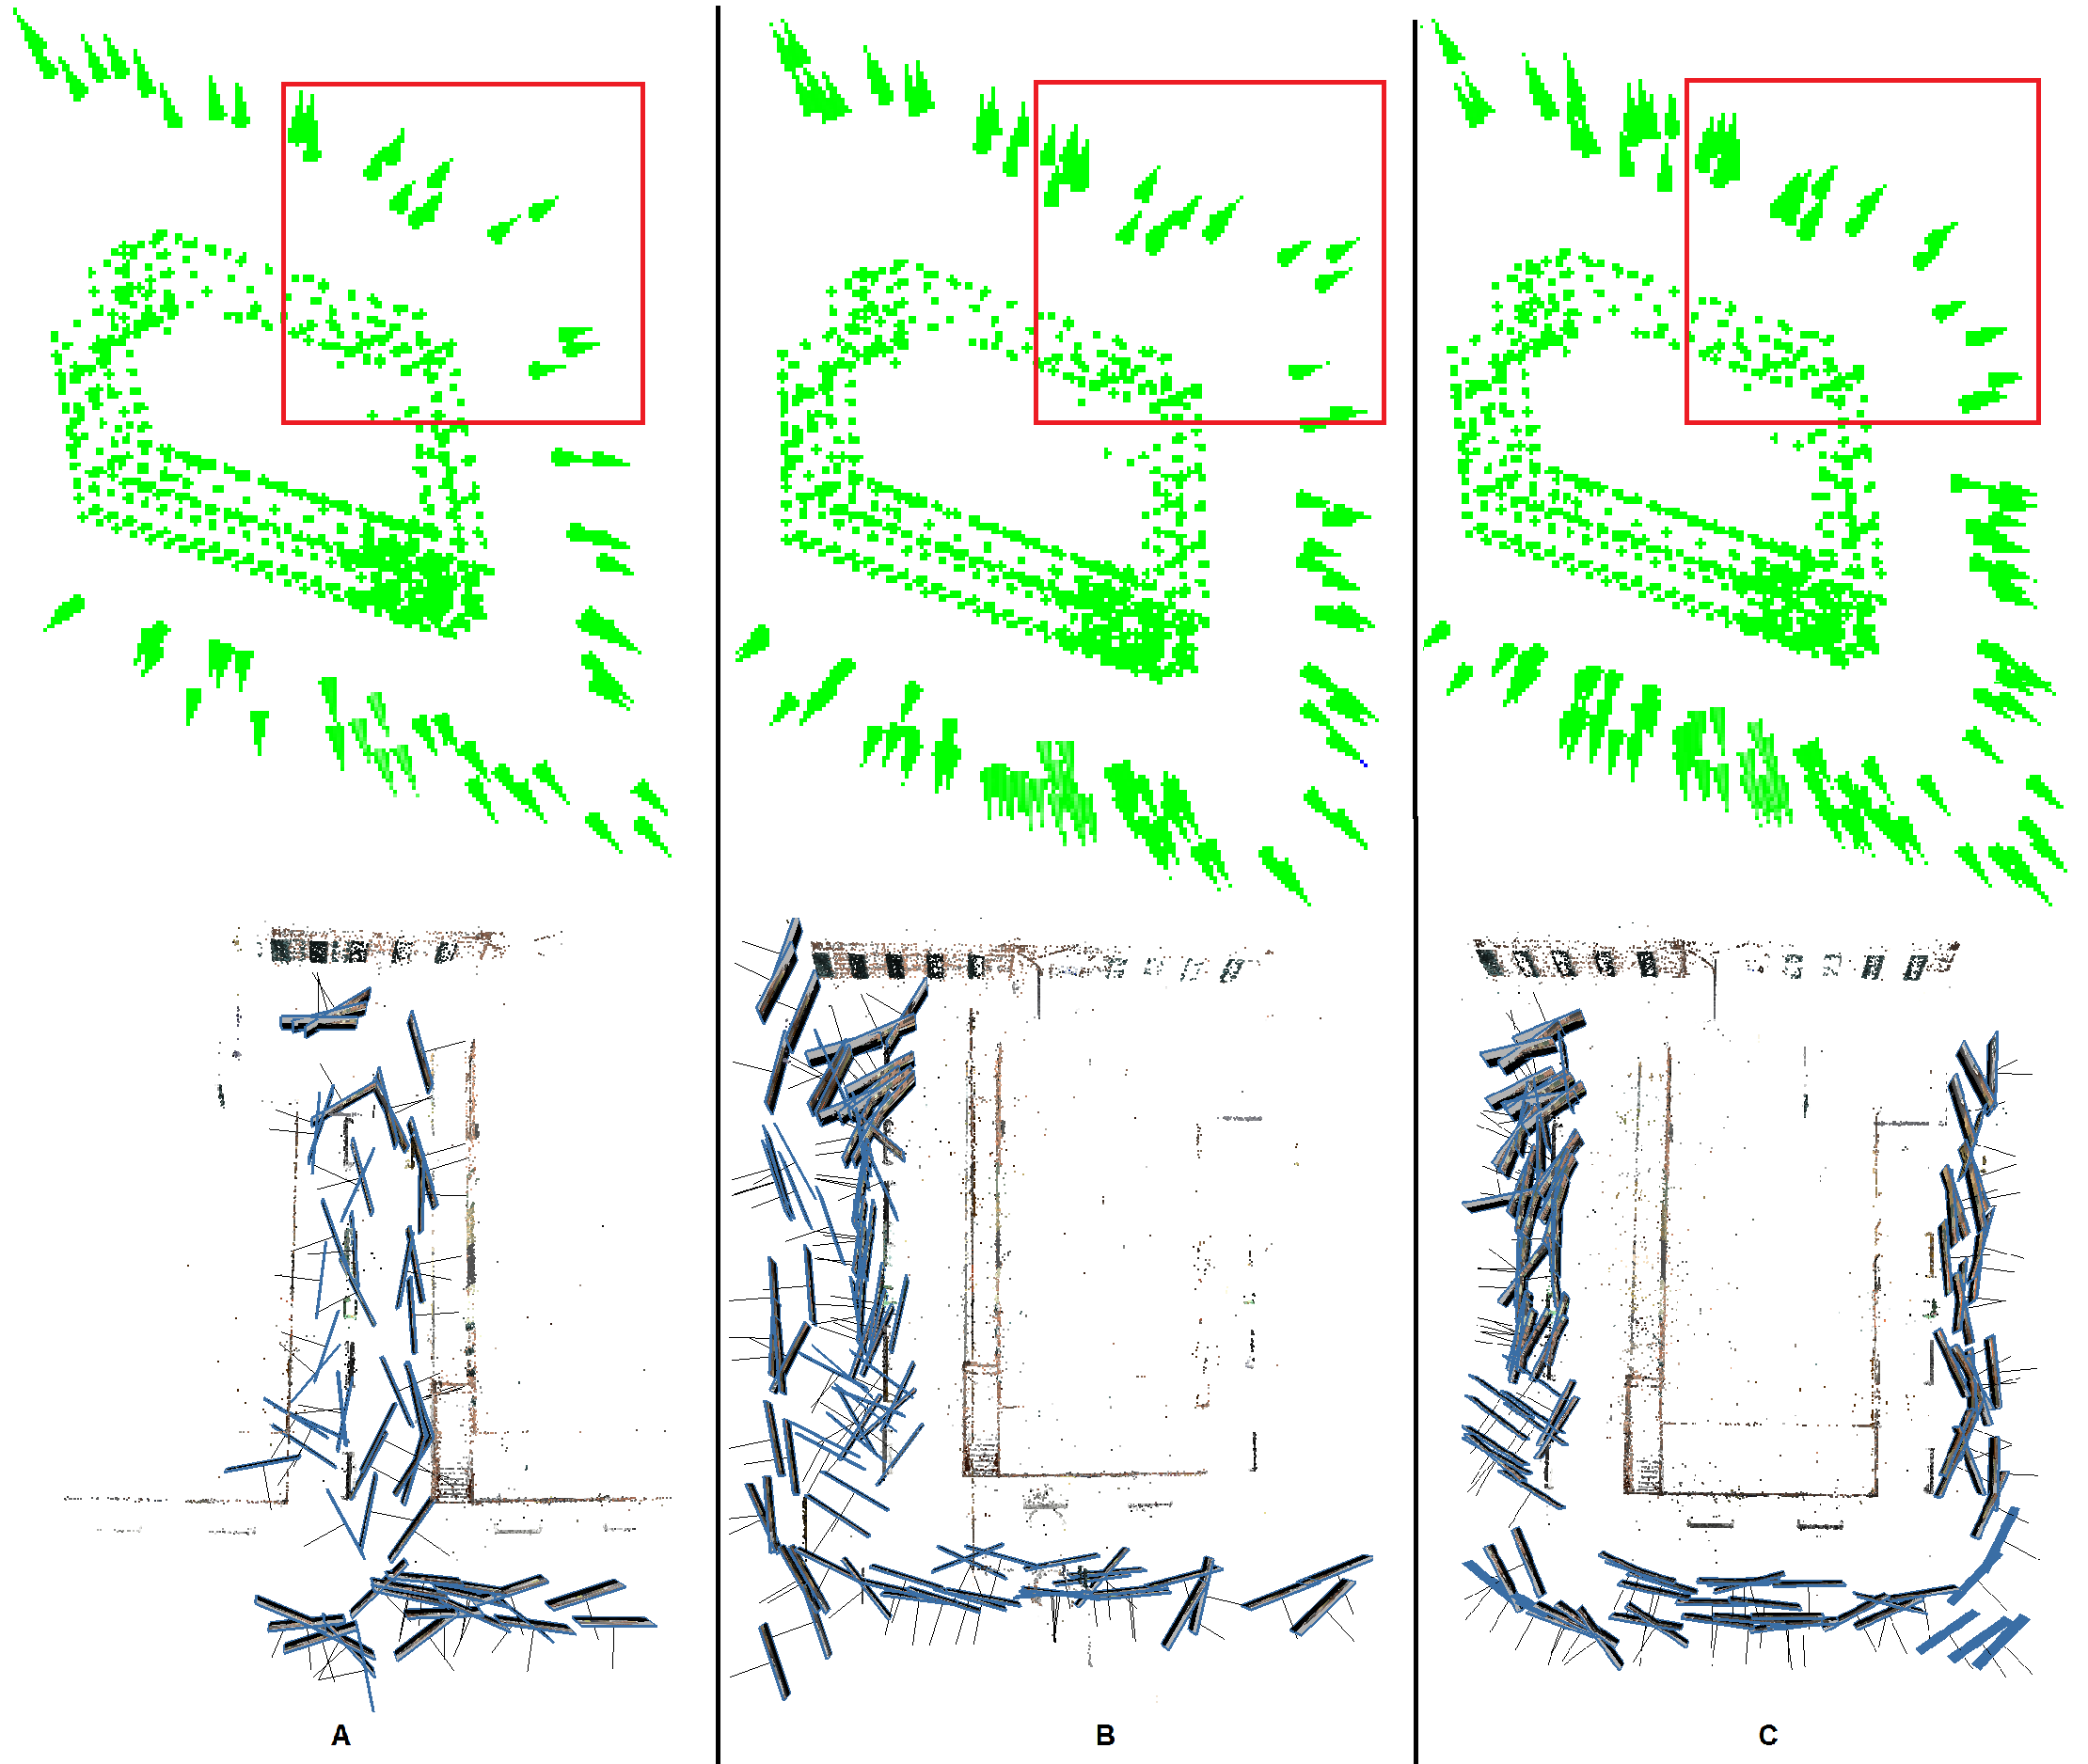
Given the candidate viewpoints in the centre, façade and hybrid approaches, clustering and selecting procedures were applied, while 60 degrees was set as incidence angle. The clustering and selecting algorithms (Section 3.3) were used to select (Figure 12) a set of viewpoints, which were selected at heights of 0.4 and 1.6 m, as follows:
-
Centre pointing approach: 96 viewpoints were selected out of 1020 initial candidate viewpoints;
-
Façade pointing: 107 viewpoints were selected out of 5218 initial viewpoints;
-
Hybrid approach: 119 viewpoints were selected out of 6238 initial candidates.
-
Centre & façade pointing: 213 viewpoints were chosen as a dataset including the output of both of the first two approaches.

3.1.5. Image Acquisition and Dense Point Cloud Generation

Given the candidate viewpoints, the robot was moved around the scene to capture the images in the designed viewpoints for all four approaches. The captured images were then processed to derive dense point clouds. Figure 13 shows a top view of the camera poses and point clouds for all four imaging network designs. Three regions (R1, R2 and R3) were considered to evaluate the quality of the derived point clouds.
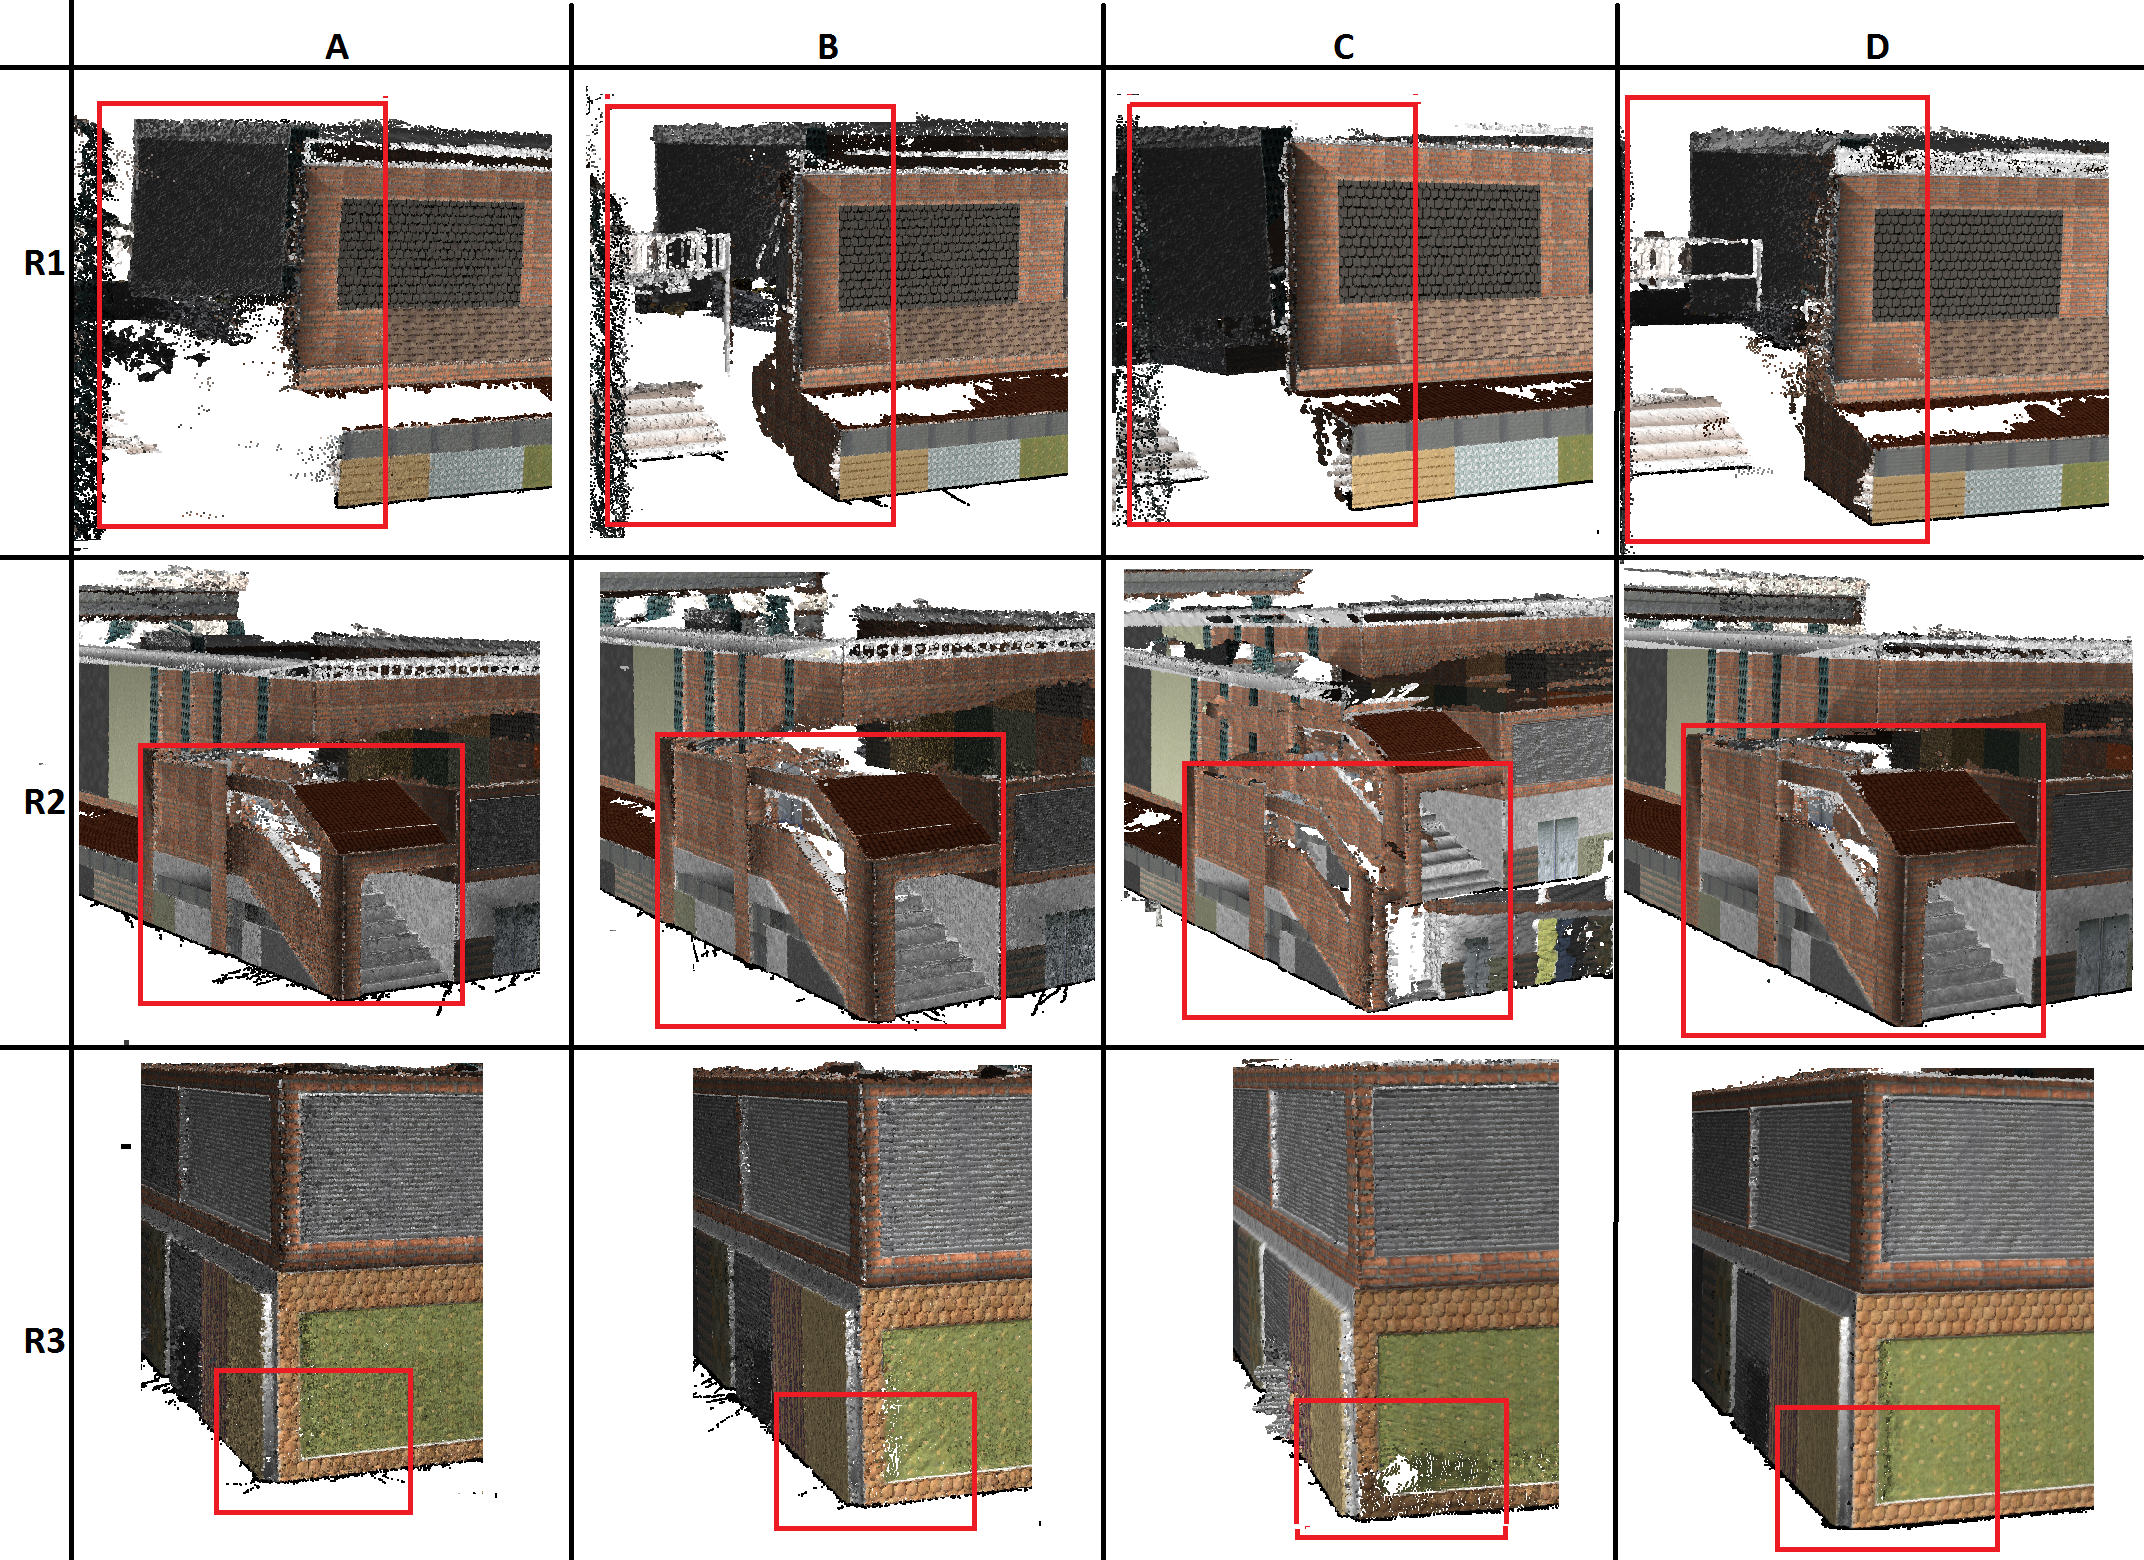
Figure 14 illustrates the point clouds of the building generated with the four proposed approaches. To compare the point clouds, three areas (shown as R1, R2 and R3 in Figure 13) were taken into account. Clearly, the best point cloud was generated with the images of centre & façade approach. The point cloud generated using images captured with the hybrid approach shows errors, noise and incompleteness in R2 (the red box for R2 in Figure 13C). This was due to the low number of viewpoints selected in the corners of the building with respect with other three image acquisition approaches. This issue resulted in the failure of image alignment in these regions. These results clarified the importance of having nearby viewpoints with smooth orientation changes in the corners of buildings.

3.2. Simulation Experiments on a Building with Complex Shape

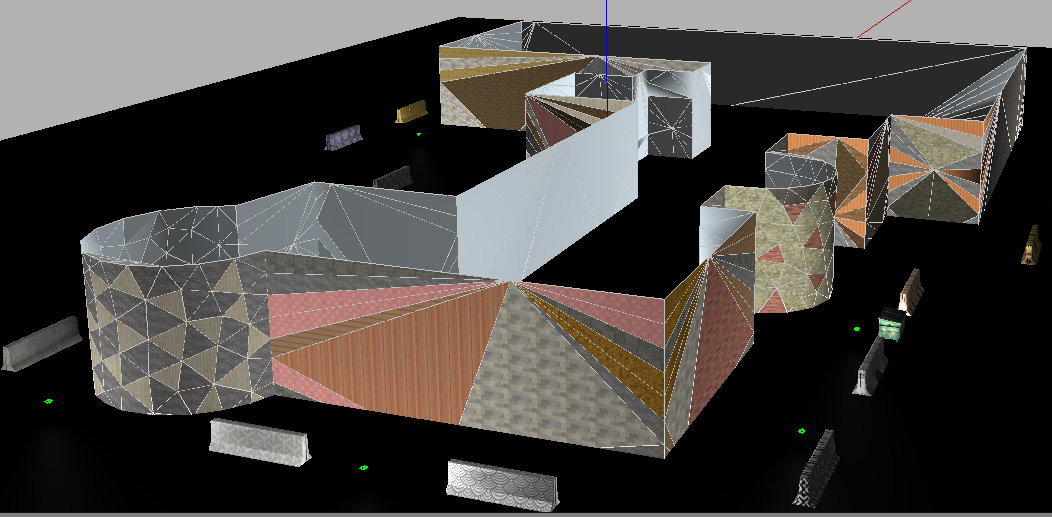
To evaluate the performance of the method for a building with a complex footprint shape, a building was designed using SketchUp software in such a way that it included different curved walls and corners with several obstacles in front of each walls. As illustrated in Figure 15, the model was also decorated with different colourful patterns to overcome the problem of textureless surfaces in the SfM and MVS algorithms. The model was then imported into the ROS Gazebo environment to be employed in the 3D reconstruction procedure presented in this work. To make the evaluation procedure more challenging, a part of the building was considered for 3D reconstruction (the area painted orange in Figure 16), and another part played a role as a self-occlusion area.
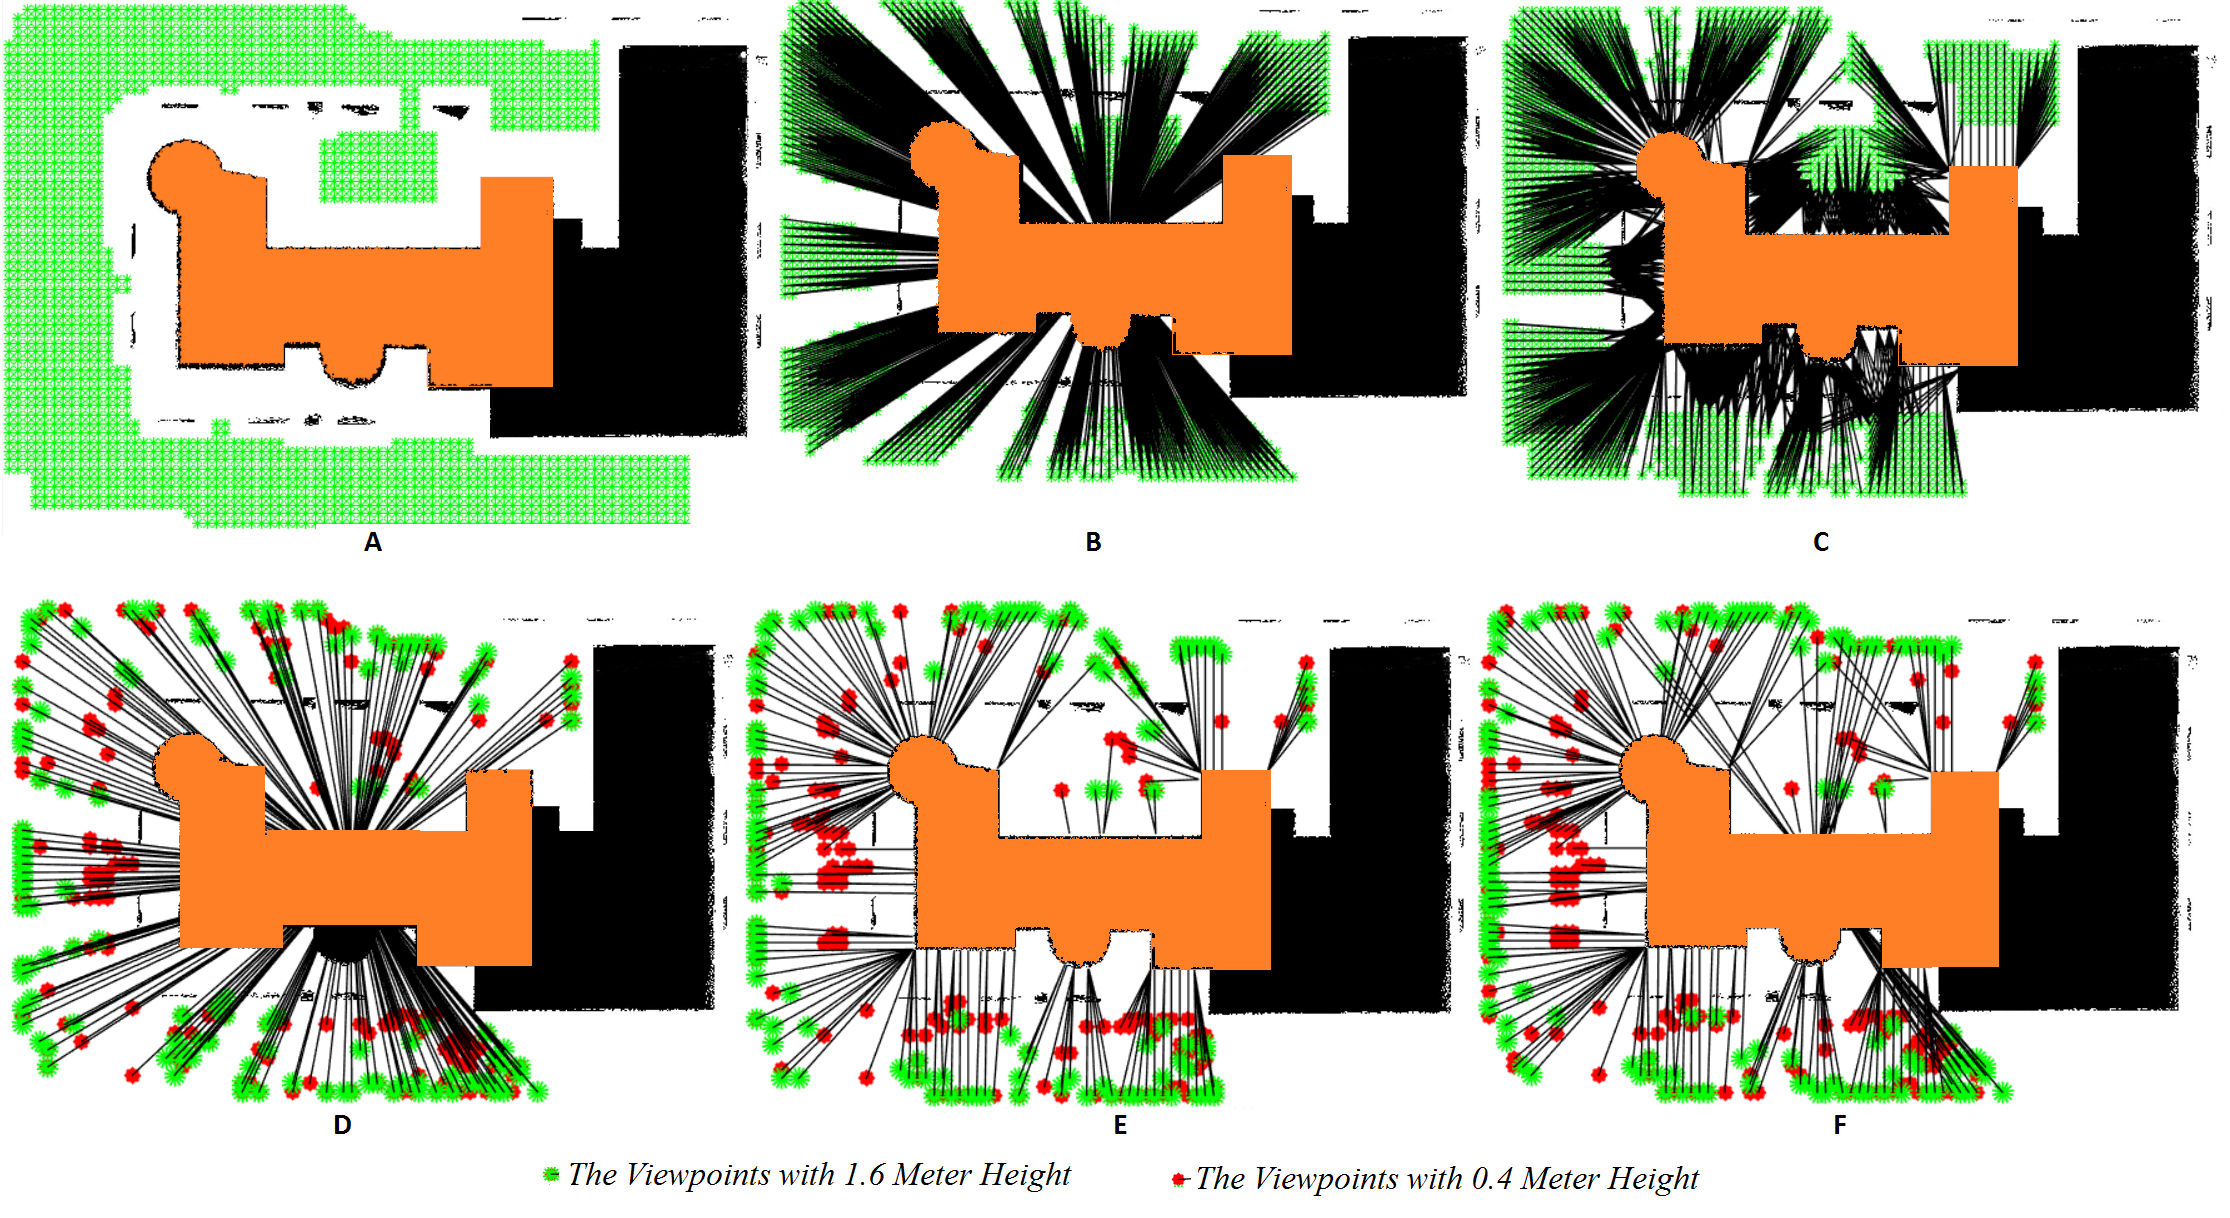
Given the building model in ROS Gazebo, the robot was used to generate a map of the building environment with GMapping algorithm. By setting camera parameters and expected accuracy at levels similar to those in the previous project, the minimum and maximum distances for the camera placement were computed (15,390 mm and 5130 mm, respectively) and converted into map units. As can be seen in Figure 16, the map was used in the present method to generate sample viewpoints (Figure 16A), as well as initial candidate viewpoints for both the centre and façade pointing approaches (Figure 16B,C). The generated candidate viewpoints were then imported into the clustering and selection approaches in order to produce four different outputs, including centre pointing, façade pointing, hybrid approach (Figure 16D–F), and centre & façade pointing. As the only difference between this project and the previous one with respect to setting the parameters of the clustering and selection approach, the incidence angle parameter was set at 80 degrees. This was done in order to prevent any failures in the photo alignment procedure in SfM.
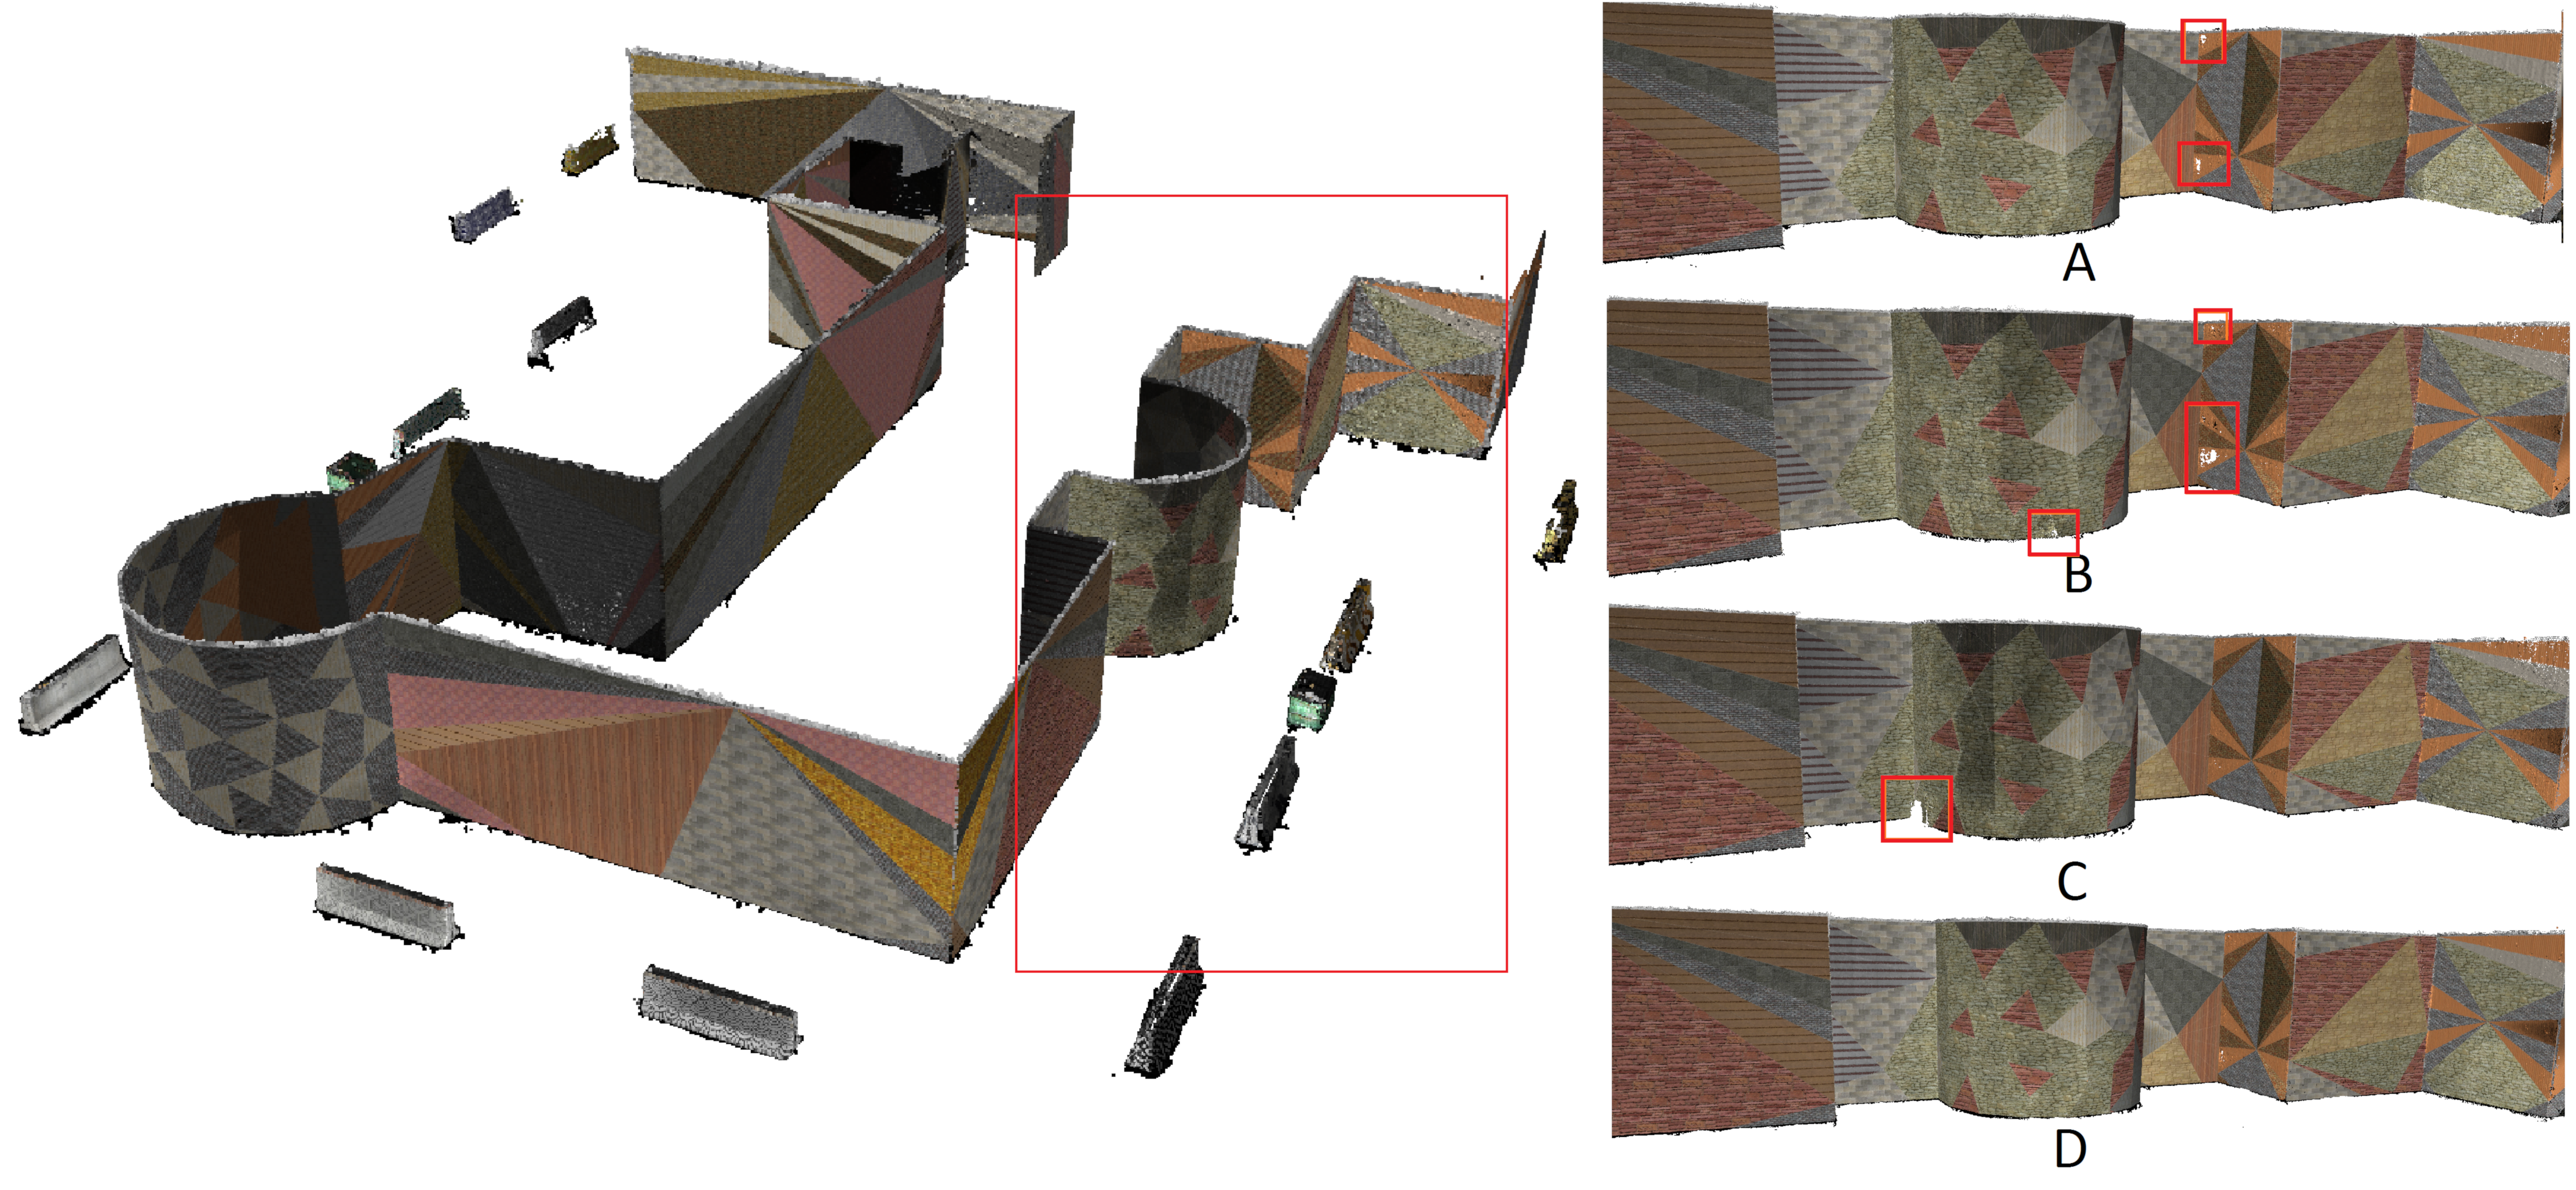
Having generated the viewpoints for all of the approaches, they were used in the next step to navigate the robot around the building, and to capture images in the designed poses. The captured images were then imported into the SfM and MVS approaches in order to generate a dense point cloud of the building. The point clouds of one side of the building, which have a greater complexity than the output of each of the approaches, are displayed in Figure 17. At first glance, the best results were achieved when using the centre & façade pointing approach.
Table 3 shows the number of initial viewpoints and the selected viewpoints, and the number of points in the final point cloud for each of the implemented approaches for a complex building. Similar to the previous project, the centre & façade pointing approach resulted in more complete point cloud when using 570 images. If the computation expenses are important for this comparison, the best approach is the hybrid. It performed better in this project with respect to the previous one due to the incidence angle being increased from 70 to 80 degrees, leading to a denser imaging network. Although the number of selected viewpoints for centre pointing (292) was close to this number for the hybrid approach (301), the worst results were achieved when running this approach due to the lack of flexibility of this approach with respect to overcoming the occluded area. Façade pointing also had limitations with respect to the 3D reconstruction of walls located in front of other walls (Figure 17A,B), but this approach resulted in more points than the centre pointing and hybrid approaches, with an even lower number of images (278).

3.3. Real-World Experiments

To evaluate the proposed algorithm in a real-world scenario, the refectory building of the civil department of K. N. Toosi University of Technology was considered as a case study (Figure 18, left). A map of the building and its surrounding environment was generated using classic surveying and geo-referencing procedures (Figure 18, right).
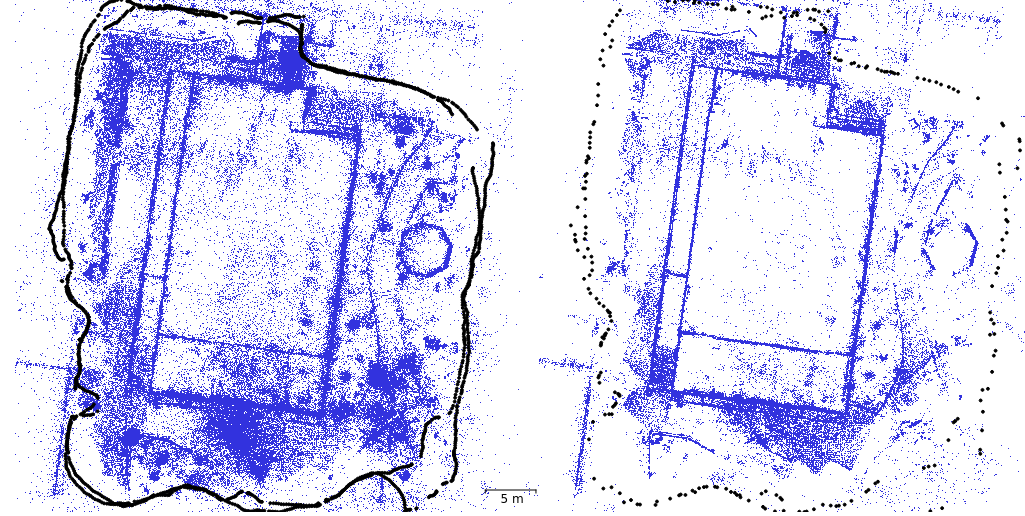
Moreover, in order to compare the results of the presented approaches with a standard method, known as continuous image capturing, for the image-based 3D reconstruction of a building a DSLR Nikon D5500 was used to capture images of the building from a suitable distance, where the whole height of each wall of the building can be seen in the images. In this camera, there is an option to capture high-resolution still images continuously every fifth of a second. The images were captured from the building in two complete rings at two different heights by rotating around the building twice continuously (Figure 19, left). Having captured the images, due to the huge number of images (1489 images) they were imported into a server computer with 24 CPU cores and 113 GiB RAM, as well as a GeForce RTX 2080 NVIDIA graphics card for running SfM and MVS procedures to generate a dense point cloud of the building. It took 200 min to complete the MVS procedure. As another common method for 3D reconstruction of the building in a process called continuous image capturing & clustering and selection, the captured images in the first method were used in the clustering and selection approach presented in Section 2.3 of this article to reduce the number of the images. In this procedure, the incidence angle was set to 80 degrees, and 236 images were selected as optimum images for 3D reconstruction (Figure 19, right). Running MVS on the selected images in the server computer took 14 min to generate the dense point cloud.
Starting from the available map, similar to the simulation section, the steps of the algorithm (Section 3) were followed (Figure 20) to generate viewpoints for all four approaches. The clustering and selecting procedure finally chose 176 viewpoints in centre pointing, 177 viewpoints in façade pointing and 178 viewpoints in hybrid, out of 232, 572 and 804 candidate viewpoints, respectively. All of the viewpoints selected in the first two approaches (355 viewpoints) were chosen as the output for the centre & façade pointing (Figure 21).
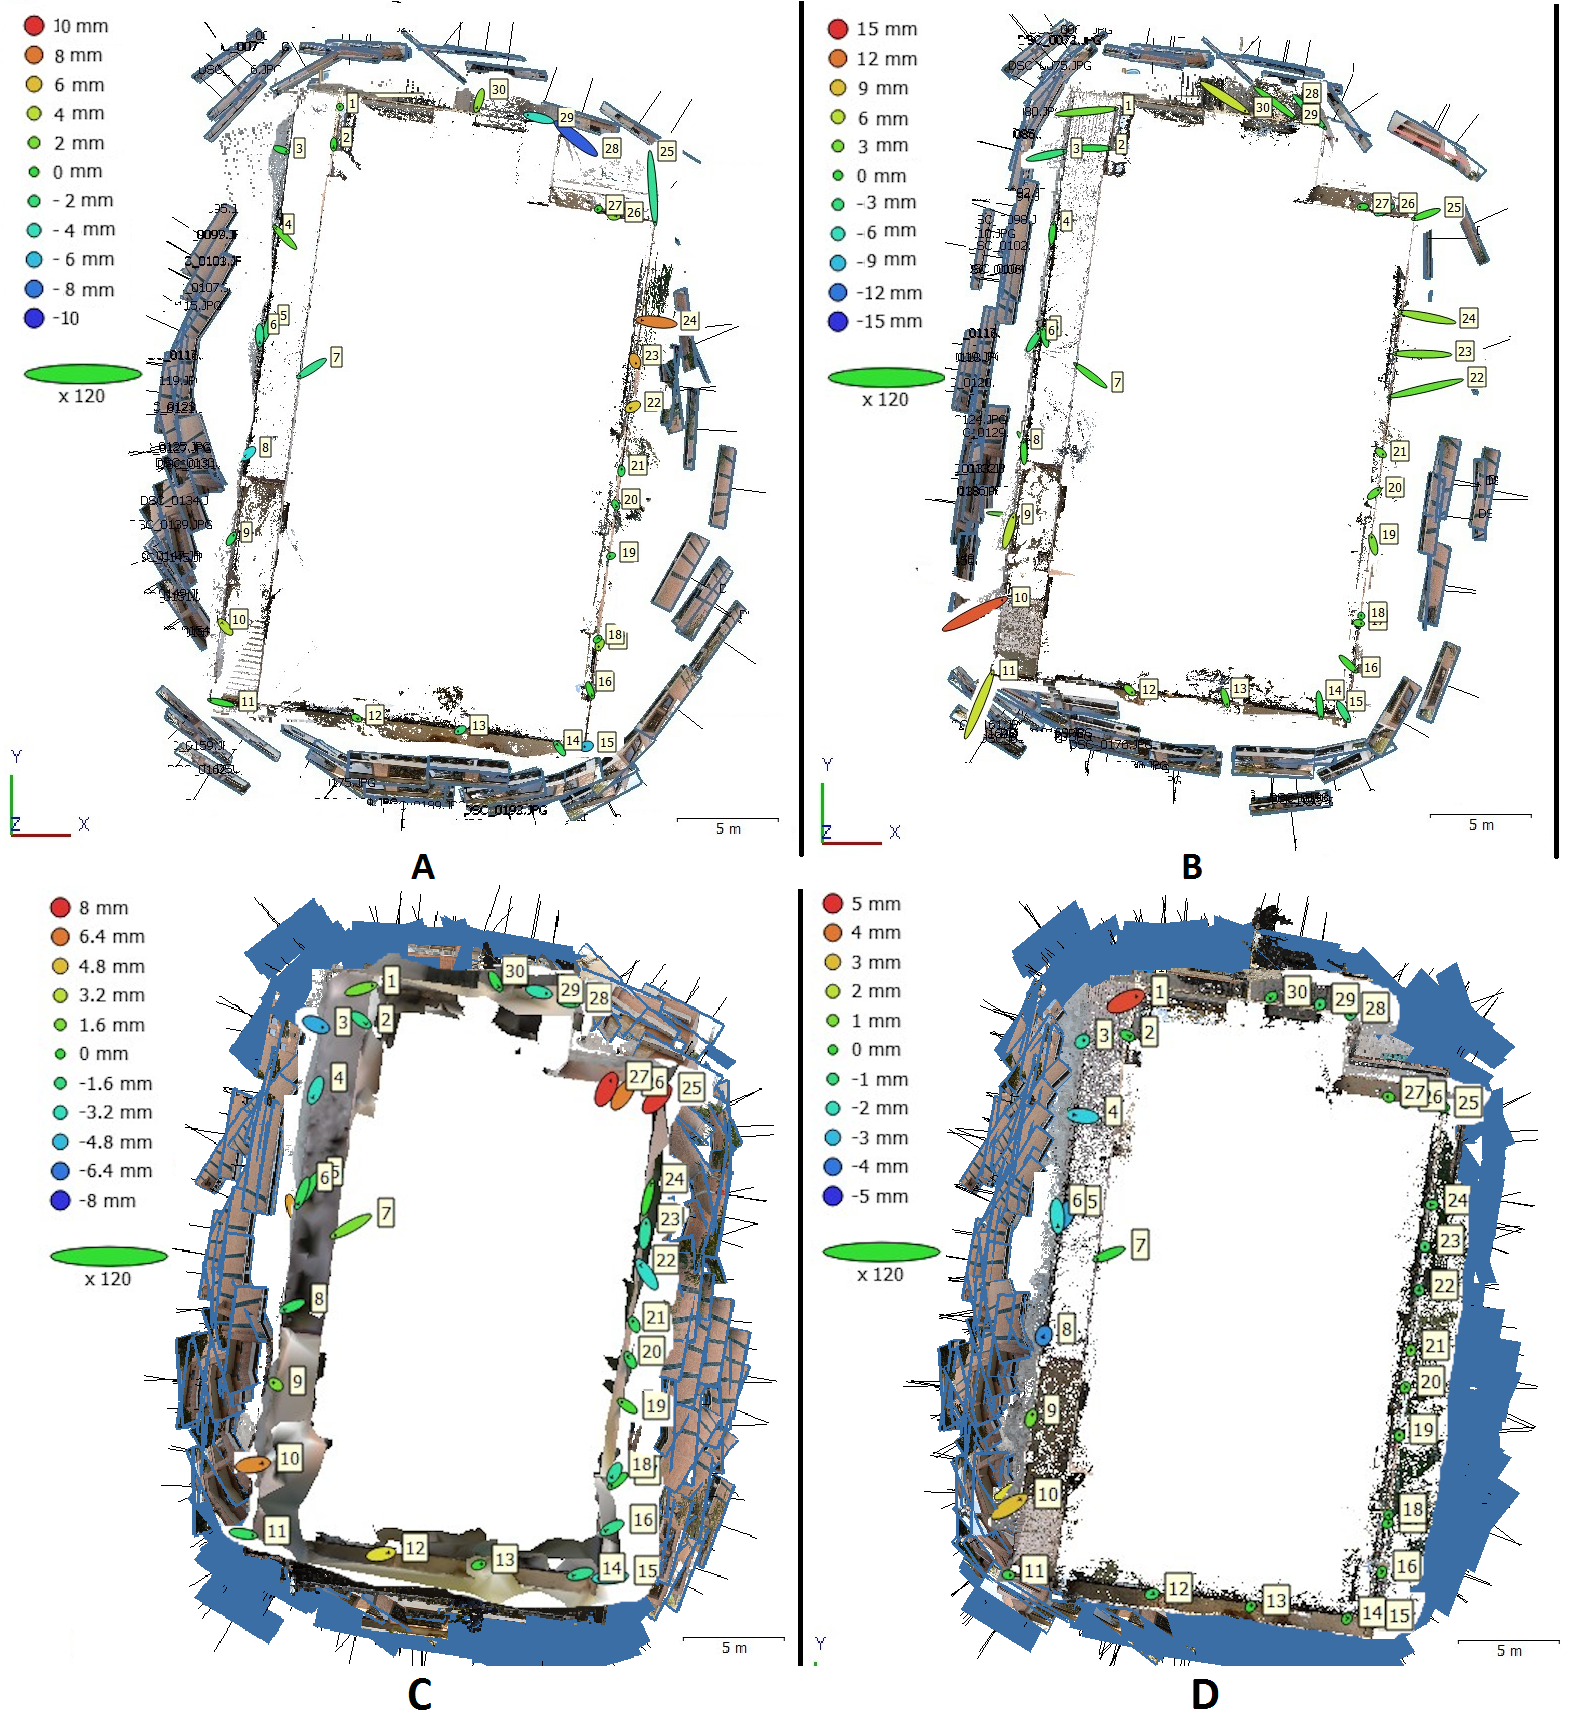
Having designed four imaging networks, a DSLR Nikon Camera (D5500) was implemented on a tripod to capture images of the building at the designated viewpoints. A focal length of 18 mm and a F-Stop of 6.3 were set for the camera. These values were estimated using a trial-and-error approach during the clustering and selection step (Section 2.3) by setting different values for these parameters and checking the final accuracy of the intersecting points. All of the captured images in all of the approaches (façade pointing, centre pointing, hybrid and centre & façade pointing) were then processed in order to derive camera poses and dense point clouds (Figure 22).
The 3D coordinates of the 30 Ground Control Points (GCPs) placed on the building façades were measured using a total station and were manually identified in the images. Fifteen points were then used to constrain the SfM bundle adjustment solution as a ground control (the odd numbers in Figure 22), and the other 15 (the even numbers Figure 22) were used as check points. Figure 22 displays the error ellipsoids of the GCPs for the presented approaches including the centre (Figure 22A), façade (Figure 22B), hybrid (Figure 22C) and centre & façade (Figure 22D) pointing datasets. The size of the error ellipsoids for the façade pointing dataset was almost twice as large as the size of the error ellipsoids for centre pointing. This could be due to the better configuration of rays coming from the cameras to each point in the centre pointing dataset which leads to better ray intersection angles. These angles in the façade pointing dataset are small, resulting in less accurate coordinates, but a more favourable geometry for dense matching and dense point cloud generation.
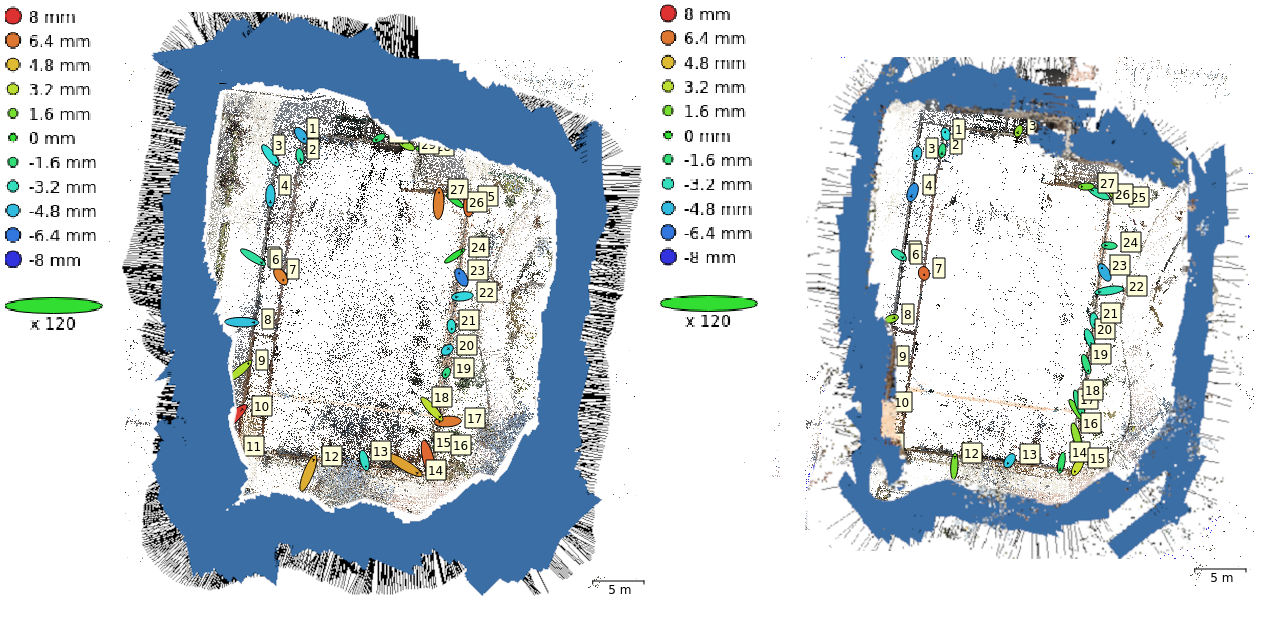
The GCPs were also used when evaluating the accuracy of the point clouds generated using the two common methods. As shown in Figure 23, in the bottom left corner of the building map, the distance from the camera to the building was reduced due to workspace limitations. This resulted in a reduction of the accuracy on the GCPs at this corner in comparison with other corners of the building. The results also indicate that having more images does not always lead to a better accuracy for GCPs, and more images produce more noise in the observations, with this noise at some point leading to a loss of accuracy.
Figure 24 illustrates the total error of the GCPs for all datasets. It can be observed from this figure that the points located around the middle of the building have less error than the points located at the corners of the building for all approaches. Moreover, the mean of GCP error for the façade pointing datasets is almost two times bigger than this value for the centre pointing datasets. The maximum error of GCP for all of the presented approaches, with the exception of centre pointing, is related to the error of estimating the X coordinates. As mentioned in the paragraphs above, this is due the stronger configuration of images in centre pointing datasets with triangle intersections that are closer to equilateral triangles.
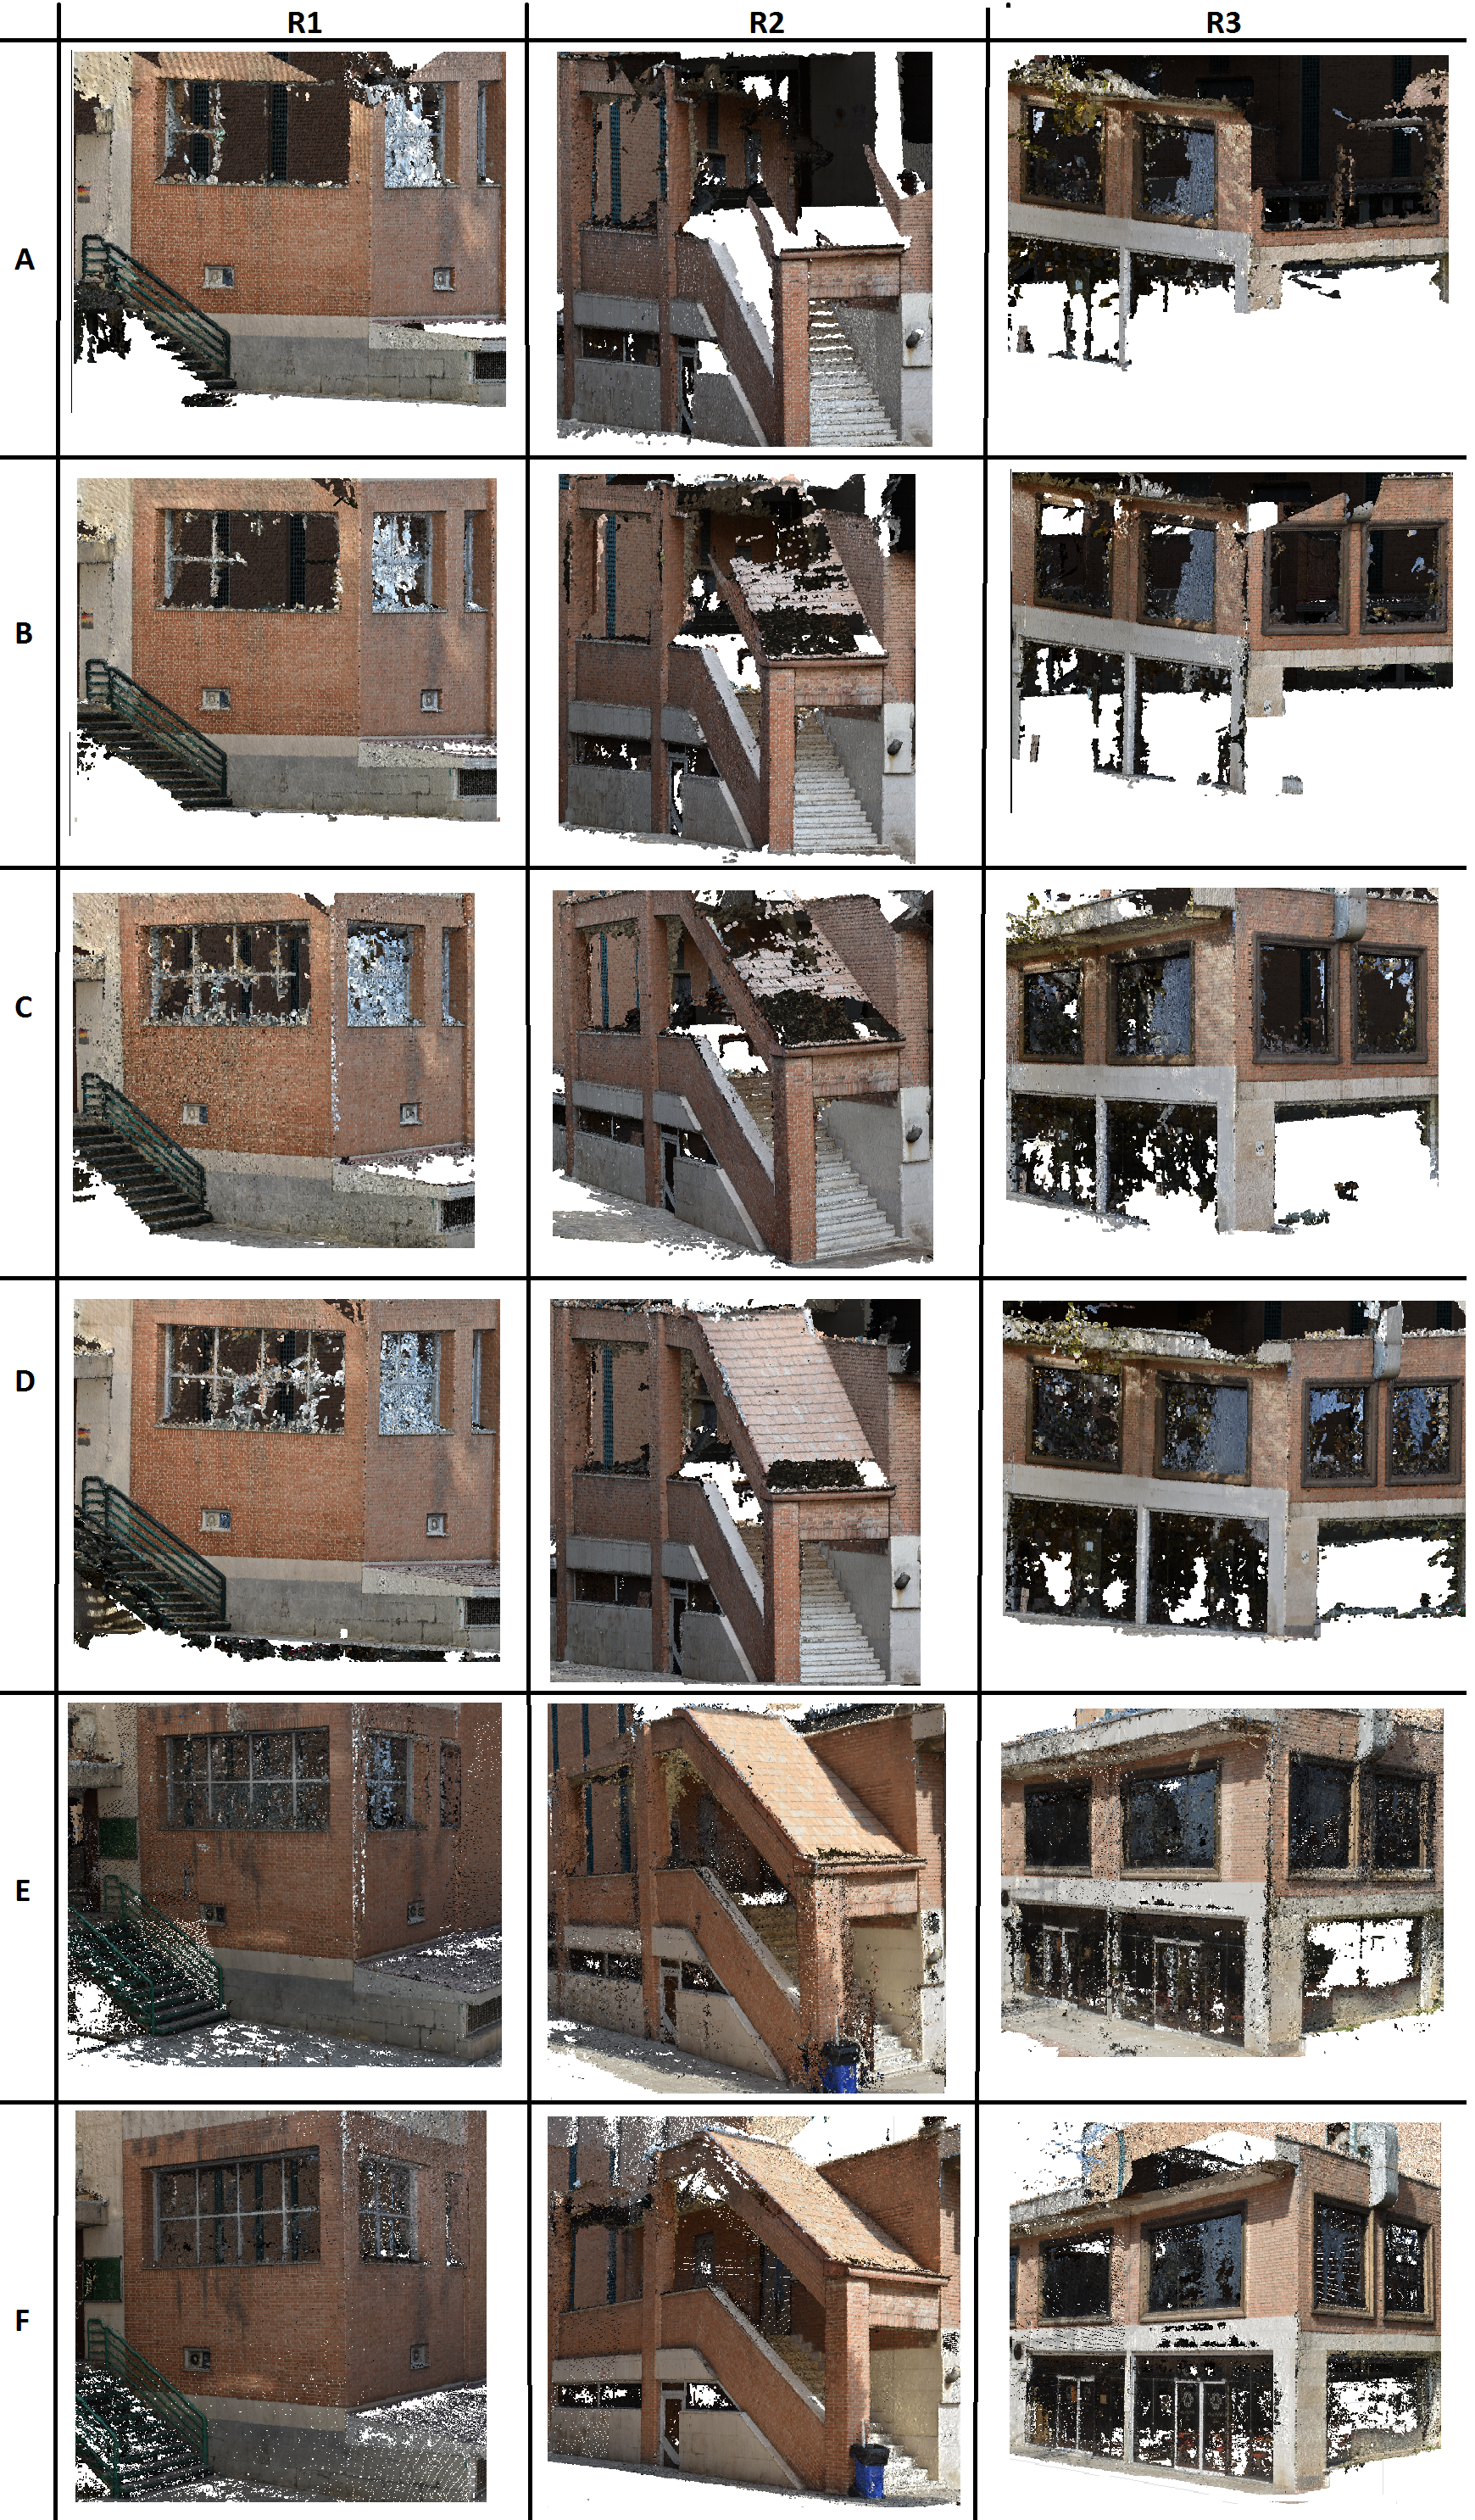
To evaluate the proposed approaches in comparison with the two standard approaches, two criteria based on completeness and accuracy of the final dense point cloud were taken into account. Firstly, the quality of the point clouds was visually evaluated in three corners of the building, similar to the simulation project (Section 3.1 and Section 3.2). Figure 25 shows the quality of the point clouds in the mentioned regions. The worst point clouds were generated when using the centre pointing dataset (Figure 25A), and the most complete point cloud with the fewest gaps was generated using the continuous capturing images dataset. Following this method, the continuous capture of images & clustering and selection approach, and the centre & façade approach obtained the second and third ranks for the generation of complete point clouds (Figure 25D,E). The hybrid dataset resulted in a more complete point cloud than the façade pointing dataset. Although the common methods were able to generate dense point clouds, the point clouds of these approaches included more noise and outliers due to the blurred images in the dataset.
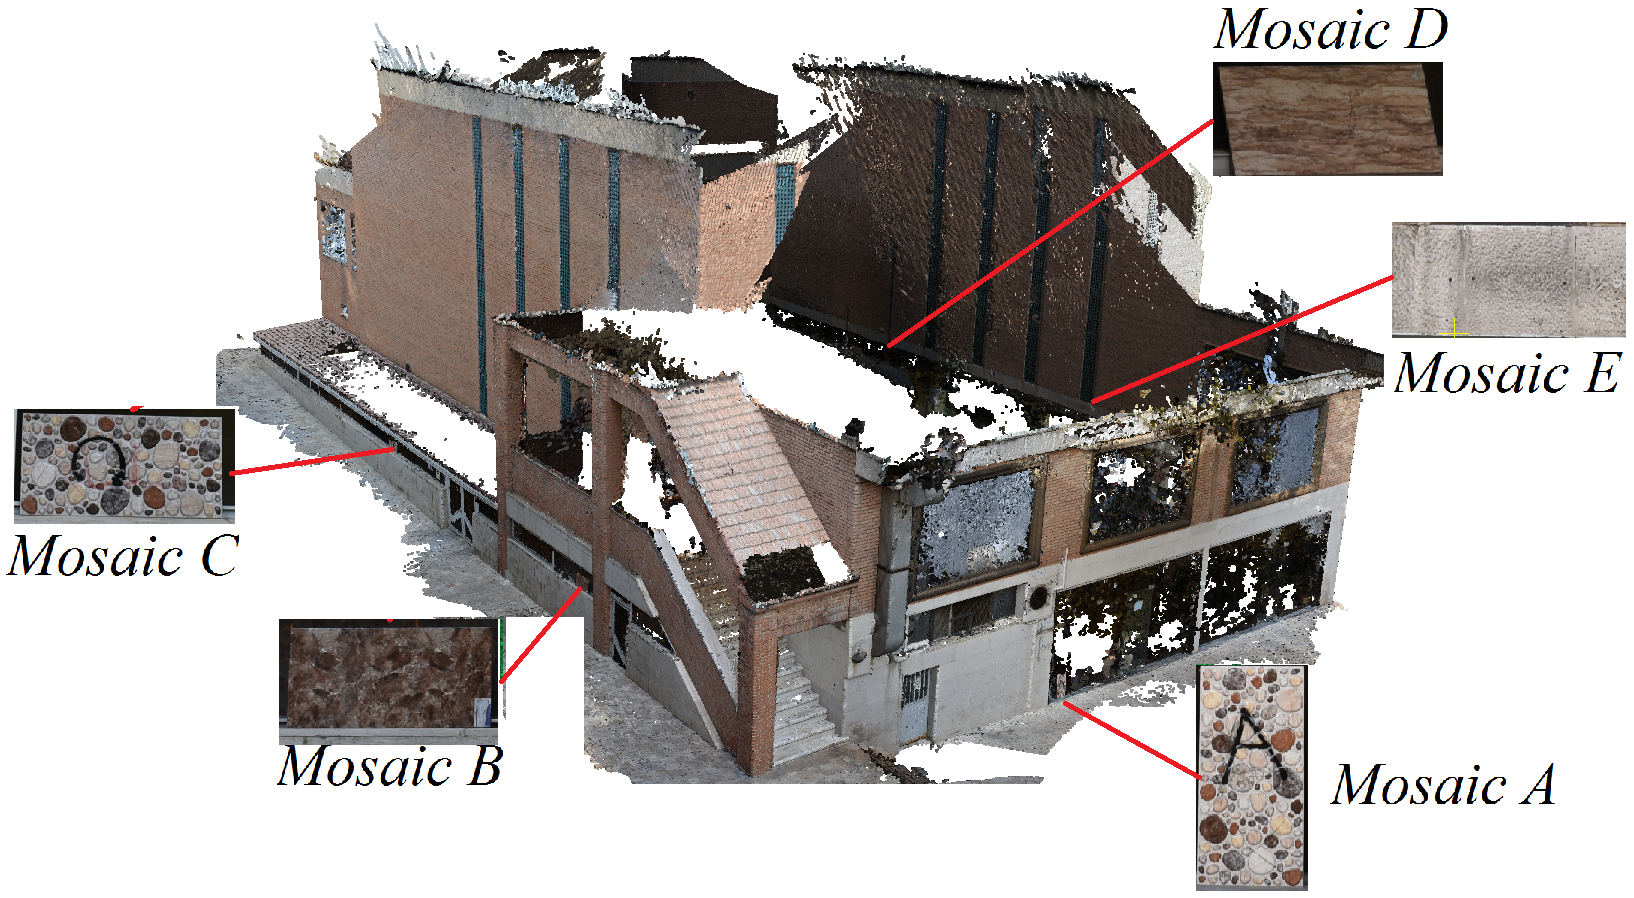
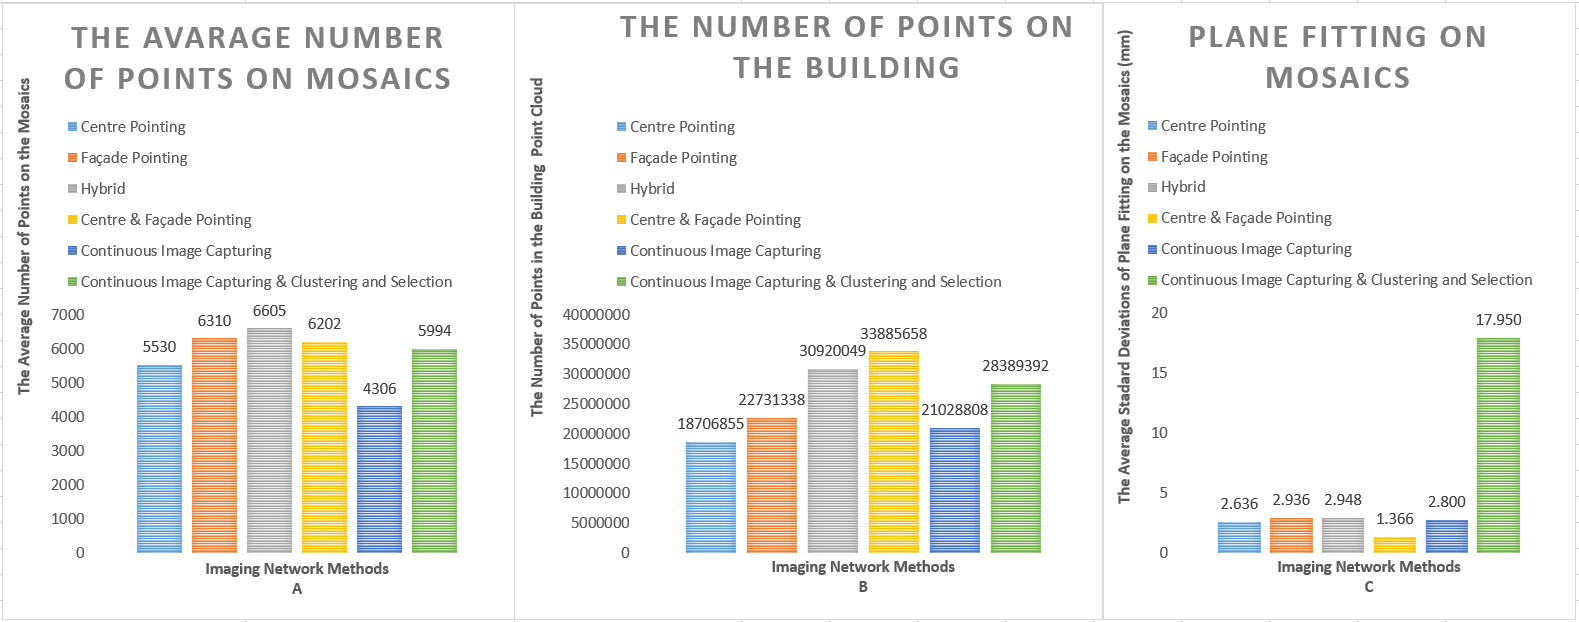
Then, as no ground truth data were available, the point cloud completeness was evaluated by counting the number of points on five-yard mosaics (Figure 26) as well as on the whole building. As shown in Figure 27A, all the presented approaches except the centre pointing dataset were able to provide more points on the mosaics than the standard approaches. Moreover, in the case of the number of points on the whole building (Figure 27B), the centre & façade pointing and hybrid datasets resulted in point clouds with more points (33 and 30 million points, respectively). Façade pointing led to more points for the whole building compared to the centre pointing dataset.
The noise level of the point clouds was evaluated by estimating the average standard deviations of a fitted plane on the mosaics. To evaluate the flatness of the mosaic surfaces, accurate 3D point clouds were separately generated for them in the lab by capturing many convergent images at close range (0.6 m), and a plan was fitted to each of the point clouds. The results showed that the surface of the mosaics fit on a plane with a standard deviation of around 0.2 mm. As illustrated in Figure 27C, the average standard deviations of fitting a plane on the mosaics point clouds generated with the hybrid and centre pointing approaches were almost identical (2.9 mm). While the best results were achieved by using the centre & façade dataset (1.4 mm), the noisiest point cloud was generated by the dataset of the continuous image capturing approach as the common method with the average standard deviation of 18 mm. Exploiting the clustering and selection approach on the continuous image capturing dataset led to a reduction of noise to one-sixth of its value (2.8 mm).
Considering both the number of points and the standard deviation of the fitted plane, it can be concluded that although the number of images in the centre & façade dataset is almost twice that of the other presented approaches, it is the best approach in terms of completeness and accuracy criteria. If the number of images is crucial in terms of the processing time and computer memory required, then hybrid and façade pointing can be considered as the best methods, respectively.

4. Discussion

This work presented an image-based 3D pipeline for the reconstruction of a building using an unmanned ground vehicle (UGV) or a human agent coupled with an imaging network design (view planning) algorithm. Four different approaches, including façade, centre, hybrid, and centre & façade pointing, were designed, developed and compared with each other in both simulated and real-world environments. Moreover, two other methods—continuous image capturing, and continuous image capturing & clustering and selection approaches—were considered as standard methods in real-world experiments for evaluating the performance of the presented methods. The results showed that the first standard method requires a fast computer, and even when using a server computer, a noisy point cloud is generated using this approach. Although clustering and selecting vantage images on this dataset reduced the noise considerably, the number of points on the building and the density of the points were dramatically reduced. Although the façade pointing approach could lead to more complete point clouds due to images with parallel optical axes more suitable for MVS algorithms, the accuracy of individual points in the centre pointing scenario was better, due to stronger intersection angles. Using all of the images of both of the previous approaches (centre & façade pointing) led to a more complete and more accurate point cloud than in the two first approaches (façade pointing and centre pointing). Clustering and selecting vantage viewpoints of the candidate viewpoints using both centre and façade pointing directions (hybrid approach) may result in a failure of alignment in SfM if the incidence angle is set below 80 degrees. This happened for the first simulation dataset. Obviously, more complete and accurate point clouds can be achieved by using the centre & façade pointing approach, with the disadvantages of greater processing time and greater requirement of computer power.

5. Conclusions

This paper proposes a novel imaging network design algorithm for façade 3D reconstruction using a UGV. In comparison with other state-of-the-art algorithms in this field, such as that presented in [21], the presented method takes into account range-related constraints when defining the suitable range from the building, and the clustering and selecting approach is performed using a visibility matrix defined based on a four-zone cone instead of filtering for coverage and filtering for accuracy. Moreover, instead of defining the viewpoint orientation towards the façade in [21], four different viewpoint directions were defined and compared with one another.
In this work, in order to generate the input dataset, 2D maps were obtained usingh SLAM and surveying techniques. In the case of using the presented method for any other building, the 2D maps can also be obtained by using Google Maps or a rapid imagery flight with a mini-UAV. For a rough 3D model of the building, the definition of a thickness of the building’s footprint was used in this work. In future work, rapid 3D modelling software such as SketchUp or video photogrammetry with the ability to capture image sequences could also be used.
In terms of capturing images, in the simulation experiments in this work, a navigation system was used to capture images in the designed poses. The navigation system was explained in another article [61]. Although the images of the real building were captured by an operator carrying a DSLR camera, this could also be performed with a real UGV or UAV.
Starting from the proposed imaging network methods, several research topics can be defined as a follow-up:
-
Develop another imaging network for a UGV equipped with a digital camera mounted on a pan-tilt unit; so far, it was assumed that the robot is equipped with a camera fixed to the body of the robot, and with no rotations allowed.
-
Deploy the proposed imaging network on mini-UAV; in this work, the top parts of the building were ignored (not seen) for 3D reconstruction purposes due to onboard camera limitations, whereas the fusion with UAV images would allow a complete survey of a building.
-
Use the clustering and selection approach for key frame selection of video sequences for 3D reconstruction purposes.

Author Contributions

Data curation, A.H.; Investigation, A.H. and F.R.; Software, A.H.; Supervision, F.R.; Writing—original draft, A.H.; Writing—review & editing, F.R. All authors have read and agreed to the published version of the manuscript.

Funding

This research received no external funding.

Data Availability Statement

Not applicable.

Acknowledgments

This work was part of a big project in close-range photogrammetry and robotics lab funded by K. N. Toosi University, Iran. The authors are thankful to Masoud Varshosaz and Hamid Ebadi for cooperating in defining the proposal of the project.

Conflicts of Interest

The authors declare no conflict of interest.

References

  1. Adán, A.; Quintana, B.; Prieto, S.; Bosché, F. An autonomous robotic platform for automatic extraction of detailed semantic models of buildings. Autom. Constr. 2020, 109, 102963. [Google Scholar] [CrossRef]
  2. Al-Kheder, S.; Al-Shawabkeh, Y.; Haala, N. Developing a documentation system for desert palaces in Jordan using 3D laser scanning and digital photogrammetry. J. Archaeol. Sci. 2009, 36, 537–546. [Google Scholar] [CrossRef]
  3. Valero, E.; Bosché, F.; Forster, A. Automatic Segmentation of 3D Point Clouds of Rubble Masonry Walls, and Its Ap-plication To Building Surveying, Repair and Maintenance. Autom. Constr. 2018, 96, 29–39. [Google Scholar] [CrossRef]
  4. Macdonald, L.; Ahmadabadian, A.H.; Robson, S.; Gibb, I. High Art Revisited: A Photogrammetric Approach. In Electronic Visualisation and the Arts; BCS Learning and Development Limited: Swindon, UK, 2014; pp. 192–199. [Google Scholar]
  5. Noh, Z.; Sunar, M.S.; Pan, Z. A Review on Augmented Reality for Virtual Heritage System. In Transactions on Petri Nets and Other Models of Concurrency XV; von Koutny, M., Pomello, L., Kordon, F., Eds.; Springer Science and Business Media LLC: Berlin/Heidelberg, Germany, 2009; pp. 50–61. [Google Scholar]
  6. Nocerino, E.; Menna, F.; Remondino, F. Accuracy of typical photogrammetric networks in cultural heritage 3D modeling projects. ISPRS Int. Arch. Photogramm. Remote. Sens. Spat. Inf. Sci. 2014, 45, 465–472. [Google Scholar] [CrossRef] [Green Version]
  7. Logothetis, S.; Delinasiou, A.; Stylianidis, E. Building Information Modelling for Cultural Heritage: A review. ISPRS Ann. Photogramm. Remote Sens. Spat. Inf. Sci. 2015, 2, 177–183. [Google Scholar] [CrossRef] [Green Version]
  8. Remondino, F.; Nocerino, E.; Toschi, I.; Menna, F. A Critical Review of Automated Photogrammetric Processing Of Large Datasets. ISPRS Int. Arch. Photogramm. Remote Sens. Spat. Inf. Sci. 2017, 42, 591–599. [Google Scholar] [CrossRef] [Green Version]
  9. Amini, A.S.; Varshosaz, M.; Saadatseresht, M. Development of a New Stereo-Panorama System Based on off-The-Shelf Stereo Cameras. Photogramm. Rec. 2014, 29, 206–223. [Google Scholar] [CrossRef]
  10. Watkins, S.; Burry, J.; Mohamed, A.; Marino, M.; Prudden, S.; Fisher, A.; Kloet, N.; Jakobi, T.; Clothier, R. Ten questions concerning the use of drones in urban environments. Build. Environ. 2020, 167, 106458. [Google Scholar] [CrossRef]
  11. Alsadik, B.; Remondino, F. Flight Planning for LiDAR-Based UAS Mapping Applications. ISPRS Int. J. Geo Inf. 2020, 9, 378. [Google Scholar] [CrossRef]
  12. Koch, T.; Körner, M.; Fraundorfer, F. Automatic and Semantically-Aware 3D UAV Flight Planning for Image-Based 3D Reconstruction. Remote Sens. 2019, 11, 1550. [Google Scholar] [CrossRef] [Green Version]
  13. Hosseininaveh, A.; Robson, S.; Boehm, J.; Shortis, M. Stereo-Imaging Network Design for Precise and Dense 3d Re-construction. Photogramm. Rec. 2014, 29, 317–336. [Google Scholar]
  14. Hosseininaveh, A.; Robson, S.; Boehm, J.; Shortis, M. Image selection in photogrammetric multi-view stereo methods for metric and complete 3D reconstruction. In Proceedings of the SPIE-The International Society for Optical Engineering, Munich, Germany, 23 May 2013; Volume 8791. [Google Scholar]
  15. Hosseininaveh, A.; Serpico, S.; Robson, M.; Hess, J.; Boehm, I.; Pridden, I.; Amati, G. Automatic Image Selection in Photogrammetric Multi-View Stereo Methods. In Proceedings of the International Symposium on Virtual Reality, Archaeology and Intelligent Cultural Heritage, Brighton, UK, 19–21 November 2012. [Google Scholar]
  16. Hosseininaveh, A.; Yazdan, R.; Karami, A.; Moradi, M.; Ghorbani, F. Clustering and selecting vantage images in a low-cost system for 3D reconstruction of texture-less objects. Measurement 2017, 99, 185–191. [Google Scholar] [CrossRef]
  17. Vasquez-Gomez, J.I.; Sucar, L.E.; Murrieta-Cid, R.; Lopez-Damian, E. Volumetric Next-best-view Planning for 3D Object Reconstruction with Positioning Error. Int. J. Adv. Robot. Syst. 2014, 11, 159. [Google Scholar] [CrossRef]
  18. Alsadik, B.; Gerke, M.; Vosselman, G. Automated Camera Network Design for 3D Modeling of Cultural Heritage Objects. J. Cult. Herit. 2013, 14, 515–526. [Google Scholar] [CrossRef]
  19. Mahami, H.; Nasirzadeh, F.; Ahmadabadian, A.H.; Nahavandi, S. Automated Progress Controlling and Monitoring Using Daily Site Images and Building Information Modelling. Buildings 2019, 9, 70. [Google Scholar] [CrossRef] [Green Version]
  20. Mahami, H.; Nasirzadeh, F.; Ahmadabadian, A.H.; Esmaeili, F.; Nahavandi, S. Imaging network design to improve the automated construction progress monitoring process. Constr. Innov. 2019, 19, 386–404. [Google Scholar] [CrossRef]
  21. Palanirajan, H.K.; Alsadik, B.; Nex, F.; Elberink, S.O. Efficient Flight Planning for Building Façade 3d Reconstruction. ISPRS Int. Arch. Photogramm. Remote. Sens. Spat. Inf. Sci. 2019, XLII-2/W13, 495–502. [Google Scholar] [CrossRef] [Green Version]
  22. Kriegel, S.; Bodenmüller, T.; Suppa, M.; Hirzinger, G. A surface-based Next-Best-View approach for automated 3D model completion of unknown objects. In Proceedings of the 2011 IEEE International Conference on Robotics and Automation, Shanghai, China, 9–13 May 2011; pp. 4869–4874. [Google Scholar]
  23. Isler, S.; Sabzevari, R.; Delmerico, J.; Scaramuzza, D. An Information Gain Formulation for Active Volumetric 3D Reconstruction. In Proceedings of the 2016 IEEE International Conference on Robotics and Automation (ICRA), Stockholm, Sweden, 16–21 May 2016; pp. 3477–3484. [Google Scholar]
  24. Monica, R.; Aleotti, J. Surfel-Based Next Best View Planning. IEEE Robot. Autom. Lett. 2018, 3, 3324–3331. [Google Scholar] [CrossRef]
  25. Furukawa, Y. Clustering Views for Multi-View Stereo (CMVS). 2010. Available online: https://www.di.ens.fr/cmvs/ (accessed on 13 May 2021).
  26. Furukawa, Y.; Curless, B.; Seitz, S.M.; Szeliski, R. Towards Internet-scale multi-view stereo. In Proceedings of the 2010 IEEE Computer Society Conference on Computer Vision and Pattern Recognition, San Francisco, CA, USA, 13–18 June 2010; pp. 1434–1441. [Google Scholar]
  27. Agarwal, S.; Furukawa, Y.; Snavely, N.; Simon, I.; Curless, B.; Seitz, S.M.; Szeliski, R. Building rome in a day. Commun. ACM 2011, 10, 105–112. [Google Scholar] [CrossRef]
  28. Scott, W.R.; Roth, G.; Rivest, J.-F. View Planning for Automated Three-Dimensional Object Reconstruction and Inspection. ACM Comput. Surv. 2003, 35, 64–96. [Google Scholar] [CrossRef]
  29. Hosseininaveh, A.A.; Sargeant, B.; Erfani, T.; Robson, S.; Shortis, M.; Hess, M.; Boehm, J. Towards Fully Automatic Reliable 3D Ac-quisition: From Designing Imaging Network to a Complete and Accurate Point Cloud. Robot. Auton. Syst. 2014, 62, 1197–1207. [Google Scholar] [CrossRef]
  30. Vasquez-Gomez, J.I.; Sucar, L.E.; Murrieta-Cid, R. View Planning for 3D Object Reconstruction with a Mobile Manipulator Robot. In Proceedings of the 2014 IEEE/RSJ International Conference on Intelligent Robots and Systems, Chicago, IL, USA, 14–18 September 2014; pp. 4227–4233. [Google Scholar]
  31. Fraser, S. Network Design Considerations for Non-Topographic Photogrammetry. Photogramm. Eng. Remote Sens. 1984, 50, 115–1126. [Google Scholar]
  32. Tarbox, G.H.; Gottschlich, S.N. Planning for Complete Sensor Coverage in Inspection. Comput. Vis. Image Underst. 1995, 61, 84–111. [Google Scholar] [CrossRef]
  33. Scott, W.R. Model-based view planning. Mach. Vis. Appl. 2007, 20, 47–69. [Google Scholar] [CrossRef] [Green Version]
  34. Chen, S.; Li, Y. Automatic Sensor Placement for Model-Based Robot Vision. IEEE Trans. Syst. Man, Cybern. Part B 2004, 34, 393–408. [Google Scholar] [CrossRef] [Green Version]
  35. Karaszewski, M.; Adamczyk, M.; Sitnik, R. Assessment of next-best-view algorithms performance with various 3D scanners and manipulator. ISPRS J. Photogramm. Remote Sens. 2016, 119, 320–333. [Google Scholar] [CrossRef]
  36. Zhou, X.; Yi, Z.; Liu, Y.; Huang, K.; Huang, H. Survey on path and view planning for UAVs. Virtual Real. Intell. Hardw. 2020, 2, 56–69. [Google Scholar] [CrossRef]
  37. Nocerino, E.; Menna, F.; Remondino, F.; Saleri, R. Accuracy and Block Deformation Analysis in Automatic UAV and Terrestrial Photogrammetry–Lesson Learnt. ISPRS Ann. Photogramm. Remote Sens. Spat. Inf. Sci. 2013, 2, 203–208. [Google Scholar] [CrossRef] [Green Version]
  38. Jing, W.; Polden, J.; Tao, P.Y.; Lin, W.; Shimada, K. View planning for 3D shape reconstruction of buildings with unmanned aerial vehicles. In Proceedings of the 2016 14th International Conference on Control, Automation, Robotics and Vision (ICARCV), Phuket, Thailand, 13–15 November 2016; pp. 1–6. [Google Scholar]
  39. Zheng, X.; Wang, F.; Li, Z. A multi-UAV cooperative route planning methodology for 3D fine-resolution building model reconstruction. ISPRS J. Photogramm. Remote Sens. 2018, 146, 483–494. [Google Scholar] [CrossRef]
  40. Almadhoun, R.; Abduldayem, A.; Taha, T.; Seneviratne, L.; Zweiri, Y. Guided Next Best View for 3D Reconstruction of Large Complex Structures. Remote Sens. 2019, 11, 2440. [Google Scholar] [CrossRef] [Green Version]
  41. Mendoza, M.; Vasquez-Gomez, J.I.; Taud, H.; Sucar, L.E.; Reta, C. Supervised learning of the next-best-view for 3d object reconstruction. Pattern Recognit. Lett. 2020, 133, 224–231. [Google Scholar] [CrossRef] [Green Version]
  42. Huang, R.; Zou, D.; Vaughan, R.; Tan, P. Active Image-Based Modeling with a Toy Drone. In Proceedings of the 2018 IEEE International Conference on Robotics and Automation (ICRA), Brisbane, Australia, 21–25 May 2018; pp. 1–8. [Google Scholar]
  43. Hepp, B.; Nießner, M.; Hilliges, O. Plan3d: Viewpoint and Trajectory Optimization for Aerial Multi-View Stereo Recon-struction. ACM Trans. Graph. 2018, 38, 1–17. [Google Scholar] [CrossRef]
  44. Krause, A.; Golovin, D. Submodular Function Maximization. Tractability 2014, 3, 71–104. [Google Scholar]
  45. Roberts, M.; Shah, S.; Dey, D.; Truong, A.; Sinha, S.; Kapoor, A.; Hanrahan, P.; Joshi, N. Submodular Trajectory Optimization for Aerial 3D Scanning. In Proceedings of the 2017 IEEE International Conference on Computer Vision (ICCV), Venice, Italy, 22–29 October 2017; pp. 5334–5343. [Google Scholar]
  46. Smith, N.; Moehrle, N.; Goesele, M.; Heidrich, W. Aerial Path Planning for Urban Scene Reconstruction: A Continuous Optimization Method and Benchmark. ACM Trans. Graph. 2019, 37, 183. [Google Scholar] [CrossRef] [Green Version]
  47. Arce, S.; Vernon, C.A.; Hammond, J.; Newell, V.; Janson, J.; Franke, K.W.; Hedengren, J.D. Automated 3D Reconstruction Using Op-timized View-Planning Algorithms for Iterative Development of Structure-from-Motion Models. Remote Sens. 2020, 12, 2169. [Google Scholar] [CrossRef]
  48. Yuhong. Robot Operating System (ROS) Tutorials (Indigo Ed.). 2018. Available online: http://wiki.ros.org/ROS/Tutorials (accessed on 26 June 2018).
  49. Gazebo. Gazebo Tutorials. 2014. Available online: http://gazebosim.org/tutorials (accessed on 9 March 2020).
  50. Gazebo. Tutorial: ROS Integration Overview. 2014. Available online: http://gazebosim.org/tutorials?tut=ros_overview (accessed on 9 March 2020).
  51. Husky. Available online: http://wiki.ros.org/husky_navigation/Tutorials (accessed on 27 June 2018).
  52. Grisetti, G.; Stachniss, C.; Burgard, W. Improved Techniques for Grid Mapping with Rao-Blackwellized Particle Filters. IEEE Trans. Robot. 2007, 23, 34–46. [Google Scholar] [CrossRef] [Green Version]
  53. Wu, C. Visualsfm: A Visual Structure from Motion System. 2011. Available online: http://ccwu.me/vsfm/doc.html (accessed on 13 May 2021).
  54. Trimble Inc. Sketchup Pro 2016. 2016. Available online: https://www.sketchup.com/ (accessed on 3 November 2016).
  55. Otsu, N. A threshold selection method from gray-level histograms. IEEE Trans. Syst. Man Cybern. 1979, 9, 62–66. [Google Scholar] [CrossRef] [Green Version]
  56. Hosseininaveh, A. Photogrammetric Multi-View Stereo and Imaging Network Design; University College London: London, UK, 2014. [Google Scholar]
  57. Ahmadabadian, H.; Robson, S.; Boehm, J.; Shortis, M.; Wenzel, K.; Fritsch, D. A Comparison of Dense Matching Algorithms for Scaled Surface Reconstruction Using Stereo Camera Rigs. ISPRS J. Photogramm. Remote Sens. 2013, 78, 157–167. [Google Scholar] [CrossRef]
  58. Mousavi, V.; Khosravi, M.; Ahmadi, M.; Noori, N.; Haghshenas, S.; Hosseininaveh, A.; Varshosaz, M. The performance evaluation of multi-image 3D reconstruction software with different sensors. Measurement 2018, 120, 1–10. [Google Scholar] [CrossRef]
  59. Agisoft PhotoScan Software. Agisoft Metashape. Available online: https://www.agisoft.com/ (accessed on 30 January 2020).
  60. Grisetti, G.; Stachniss, C.; Burgard, W. Improving Grid-based SLAM with Rao-Blackwellized Particle Filters by Adaptive Proposals and Selective Resampling. In Proceedings of the 2005 IEEE International Conference on Robotics and Automation, Barcelona, Spain, 18–22 April 2005. [Google Scholar]
  61. Hosseininaveh, A.; Remondino, F. An Autonomous Navigation System for Image-Based 3D Reconstruction of Façade Using a Ground Vehicle Robot. Autom. Constr. 2021. under revision. [Google Scholar]
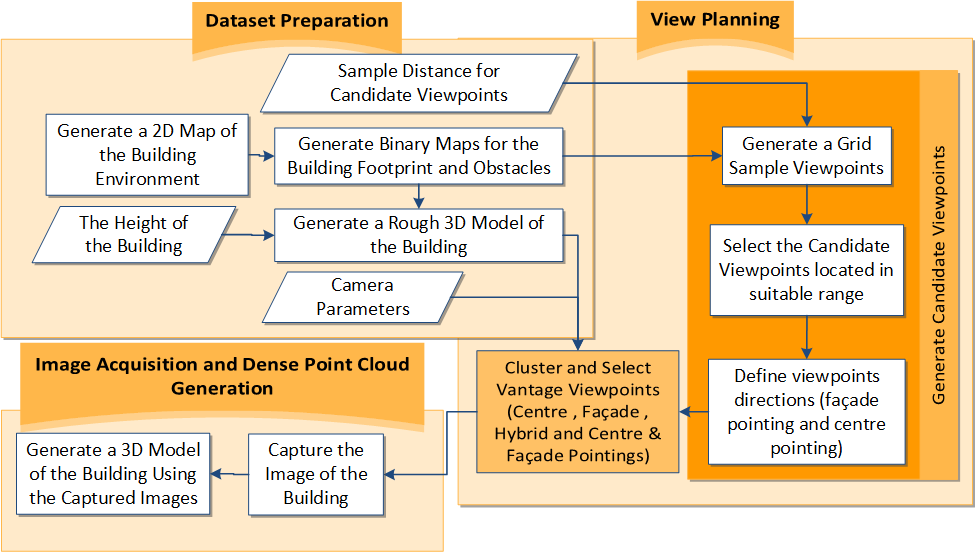
Figure 1. The proposed methodology for imaging network design for image-based 3D reconstruction of buildings.
Remotesensing 13 01923 g001
Figure 2. Visibility matrix and the procedure of clustering and selecting vantage viewpoints (left), the cone of points and viewpoints (right).
Remotesensing 13 01923 g002
Figure 3. The ROS Gazebo simulation of the refectory buildings (right) and the simulated UGV/robot (left) moving in the scene.
Remotesensing 13 01923 g003
Figure 4. An example of a captured (simulated) image using a camera mounted on the simulated UGV/robot (left) and the map of the simulated world generated with SLAM technique using a LiDAR sensor on the robot (right).
Remotesensing 13 01923 g004
Figure 5. The map of the refectory and other buildings with their surrounding objects in the simulation space (A); the refectory building map (B); the obstacle map (C); the initial sample viewpoints on the map (D).
Remotesensing 13 01923 g005
Figure 6. The buffer of the optimum camera range on the map (A); the sample points on the buffer of optimum camera range (B).
Remotesensing 13 01923 g006
Figure 7. The points on the façade of the refectory building extracted using the edge detection algorithm (A); the direction of viewpoints towards the façade points without considering the obstacles (B); the direction of viewpoints towards the façade with considering the obstacles (C); the invisible points on the façade obstacles were eliminated similarly to the technique used in Figure 7C. The viewpoint orientation located in front of obstacles (D); the direction of viewpoints towards the faced points modified in order to see invisible points (E).
Remotesensing 13 01923 g007
Figure 8. The direction of the viewpoints towards the centre of the building.
Remotesensing 13 01923 g008
Figure 9. The candidate viewpoints and the cone of two points of the initial mesh for façade pointing. For better visualization, only the cone with the two initial points is presented.
Remotesensing 13 01923 g009
Figure 10. The number of viewpoints for the centre, façade and hybrid pointing imaging network design in different setting of incidence angles (20, 40, 60 and 80 degrees).
Remotesensing 13 01923 g010
Figure 11. The selected viewpoints of the centre pointing imaging network for different incidence angles ((A): 20, (B): 40 and (C): 60 degrees) in viewpoint selection step (top) and SfM step (bottom).
Remotesensing 13 01923 g011
Figure 12. The final vantage viewpoints selected from the candidate viewpoints for the façade pointing (A), centre pointing (B), and hybrid (C) imaging networks.
Remotesensing 13 01923 g012
Figure 13. The captured images and the point clouds of the simulated building in centre pointing (A), façade pointing (B), hybrid (C), and combined centre & façade (D) imaging network design. Three areas (R1, R2, R3) are identified where a quality check was performed.
Remotesensing 13 01923 g013
Figure 14. The details of the results in the three selected areas (R1, R2, R3) for all of the image acquisition approaches: centre pointing (A), façade pointing (B), hybrid (C) and combined (D). The hybrid strategy (C) showed incomplete results.
Remotesensing 13 01923 g014
Figure 15. The complex building used to evaluate the performance of the algorithm.
Remotesensing 13 01923 g015
Figure 16. The steps of centre, façade, and hybrid pointing approaches for the imaging network design of complex buildings. The buffer of optimum camera positions (A); the viewpoint directions toward the centre of the building (B) and toward the façade (C); the outputs of the clustering and selection approach on centre pointing viewpoints (D); façade pointing viewpoints (E) and both of them (F).
Remotesensing 13 01923 g016
Figure 17. The final point cloud of the complex building (left) and the point clouds of the selected area in the red box for the centre pointing (A), façade pointing (B), hybrid (C) and centre & façade pointing (D) approaches. The gaps in the point cloud are shown using red boxes at the right of the figures.
Remotesensing 13 01923 g017
Figure 18. A cropped satellite view of the civil department and the refectory buildings augmented with a terrestrial image captured from the refectory building (left). The available surveying map of the building and their surrounding objects (right).
Remotesensing 13 01923 g018
Figure 19. The outputs of running the SfM procedure on the images of continuous image capturing (left) and continuous image capturing & clustering and selection (right) modes. The black dots in the figures show the position of the camera, and the blue dots represent the sparse point cloud of the building and its environment.
Remotesensing 13 01923 g019
Figure 20. The initial sample viewpoints (a), the sample viewpoints located at the optimal range from the building (b), and the direction of each viewpoint for centre pointing (c) and façade pointing (d).
Remotesensing 13 01923 g020
Figure 21. The final vantage viewpoints selected from the candidate viewpoints of the real-world project for the façade pointing (A), centre pointing (B), and hybrid (C) imaging networks.
Remotesensing 13 01923 g021
Figure 22. The four recovered image networks for centre pointing (A), façade pointing (B), hybrid (C) and centre & façade datasets (D). The error ellipsoids of GCPs, also demonstrated through the colourful ellipses to the left side of the building. For better visualization, the scale of the ellipses is multiplied by 120.
Remotesensing 13 01923 g022
Figure 23. The error ellipsoids on GCPs for the continuous image capturing and the continuous image capturing & clustering and selecting approaches.
Remotesensing 13 01923 g023
Figure 24. The errors of GCP coordinates for all four approaches (top). The mean of errors of the control and check points in X, Y and Z directions and the total errors for all approaches (bottom).
Remotesensing 13 01923 g024
Figure 25. The dense point clouds generated with centre pointing (A), façade pointing (B), hybrid (C), centre & façade pointing (D), continuous image capturing (E), and continuous image capturing & clustering and selection (F) approaches.
Remotesensing 13 01923 g025
Figure 26. The locations of the mosaics placed on the building façades.
Remotesensing 13 01923 g026
Figure 27. the average number of points on the five mosaics (A) and the whole building (B); the average standard deviations of plane fitting on the mosaics point clouds (C).
Remotesensing 13 01923 g027
Table 1. The equations for estimating the maximum distance from the building.
  D max The Maximum Distance From The Object: Min( D s c a l e m a x , D R e s o m a x , D F O V m a x )
D s c a l e m a x D × f × k q × S p × δ (mm) [56]
FThe focal length of the Camera (mm)
DThe maximum length of the object (mm)
KThe number of the images in each station
QThe design factor (between 0.4 and 0.7)
SpThe expected relative precision (1/Sp)
δ The image measurement error (half a pixel size) (mm)
D Reso max f × D T × sin ( φ ) I res × D t (mm)
DTThe expected minimum distance between two points in the final point cloud (mm)
DtThe minimum distance between two recognizable points in the image (pixel)
IresThe image resolution or pixel size (mm)
φ The angle between the ray coming from the camera and the surface plane (radians)
D FOV max D i × sin ( φ + α ) 2 × sin ( α ) (mm) [56]
A The field of view of the camera: atan ( 0.9 × H i 2 × f )
DiThe maximum object length to be seen in the image (mm)
HiThe minimum image frame size (mm)
Table 2. The equations for obtaining the minimum distance from the building.
  D min The minimum distance from the object: max ( D DOF near , D FOV min )
D DOF near The minimum distance from the object by considering the depth of fiel: D Z × D HF D HF + ( D HF f ) (mm) [56]
DHFThe hyper focal distance:
f 2 F stop × c (mm)
FstopThe F number of the camera
CThe circle of confusion ( f 1720 )
DZThe camera distance focus (   D max obtained from Table 1)
D FOV min H O × sin ( φ + α ) 2 × sin ( α ) (mm) [56]
HOThe height of the object (mm)
Table 3. The results of running the four approaches on the complex building.
Centre PointingFaçade PointingHybridCentre & Façade Pointing
The Number of Initial Viewpoints238610,24012,626------
The Number of Selected Viewpoints292278301570
The Number of Points
in the Point Cloud
9,175,44411,156,21110,648,20511,630,850
Publisher’s Note: MDPI stays neutral with regard to jurisdictional claims in published maps and institutional affiliations.