Abstract
Oriented object detection in optical remote sensing images (ORSIs) is a challenging task since the targets in ORSIs are displayed in an arbitrarily oriented manner and on small scales, and are densely packed. Current state-of-the-art oriented object detection models used in ORSIs primarily evolved from anchor-based and direct regression-based detection paradigms. Nevertheless, they still encounter a design difficulty from handcrafted anchor definitions and learning complexities in direct localization regression. To tackle these issues, in this paper, we proposed a novel multi-sector oriented object detection framework called MS-Det, which quantizes the scales and orientation prediction of targets in ORSIs via an anchor-free classification-to-regression approach. Specifically, we first represented the arbitrarily oriented bounding box as four scale offsets and angles in four quadrant sectors of the corresponding Cartesian coordinate system. Then, we divided the scales and angle space into multiple discrete sectors and obtained more accurate localization information by a coarse-granularity classification to fine-grained regression strategy. In addition, to decrease the angular-sector classification loss and accelerate the network’s convergence, we designed a smooth angular-sector label (SASL) that smoothly distributes label values with a definite tolerance radius. Finally, we proposed a localization-aided detection score (LADS) to better represent the confidence of a detected box by combining the category-classification score and the sector-selection score. The proposed MS-Det achieves state-of-the-art results on three widely used benchmarks, including the DOTA, HRSC2016, and UCAS-AOD data sets.
1. Introduction
With the development of aerospace technology and sensor technology, remote sensing technology is entering a new stage that can quickly and accurately provide a variety of massive Earth observation data and facilitate widely applied research. Moreover, the demands of people for high-resolution optical remote sensing images (ORSIs) continue to increase. As a key task of remote sensing data information extraction, object detection in ORSIs plays an important role in many remote sensing applications, such as traffic supervision, resource exploration, military investigation, land management, and smart city construction. In recent years, although the related research on object detection has already made significant progress, ORSI implementations remain a challenging task due to the unique morphological characteristics of ORSI targets, such as varying scales, dense arrangement, arbitrary direction, and complex backgrounds.
In recent years, deep learning methods, especially the deep convolutional neural network (DCNN), have made great progress in the field of object detection (e.g., Faster-RCNN [1], YOLO [2], SSD [3], and RetinaNet [4]). Although the DCNN-based object detection approaches have achieved promising results in natural scene images, there are two fatal defects that arise in migrating this to ORSI object detection. On the one hand, the target representations of natural scene object detection generally adopt axis-aligned bounding boxes (AABBs) that detect the targets without regard to the orientation property, thereby omitting important angle information and limiting the scope of application and fields. Meanwhile, as shown in Figure 1, due to the bird’s-eye view of the ORSI shooting method, it is more accurate to describe the rotating and densely packed ORSI targets with arbitrarily oriented bounding boxes (AOBBs) with abundant angle information instead of the AABB representation with more noisy information of complex backgrounds. One the other hand, DCNN-based natural object detectors are generally based on an anchor mechanism. However, there are several drawbacks when directly applying anchor mechanisms to ORSI object detection models. First, in order to represent the bulk of a target with varying scales, aspect ratios, and orientation, more complex anchors need to be designed for dense prediction. However, the network needs to predict the locations and categories of all the anchors, which introduces an extra computation cost for redundant anchors. Furthermore, anchor-based detectors are parameter-sensitive models. When parameter-sensitive detectors encounter unsuitable anchor definitions, the performance will deteriorate dramatically. In addition, limited anchor designs, such as a (3 scales × 3 aspect ratios × 12 orientations) collocation strategy for the anchor, are not enough to meet the need of the large shape variation in ORSI targets. To tackle the above-mentioned problems of handcrafted anchor definitions, many scholars proposed a simple, but effective anchor-free pipeline via directly or indirectly regressing the scales and angle parameters of ORSI targets. For example, the VCSOP detector [5] transforms the vehicle detection task into a multi-task learning problem via an anchor-free one-stage fully convolution network. Yi et al. [6] represented the objects in remote sensing via the center keypoints and regressed the box boundary-aware vectors (BBAVectors) to locate the AOBB targets. -DNet [7] detected the oriented targets in remote sensing images by predicting a pair of middle lines inside each bounding box. To the best of our knowledge, the above anchor-free oriented object detectors can be simplified into two typical models: (1) directly or indirectly regress the coordinates of the four vertices of AOBB; (2) directly or indirectly regress the center coordinate , the scale of the AOBB, such as the lengths of the long and short sides , and the orientation of the target. However, they all fail to address the inherent order ambiguity and loss discontinuity in regressing the corresponding parameters due to the angular periodicity and boundary discontinuity problems [8], which make it difficult for training to converge. To eliminate the ambiguity of the direct regression-based methods, WPSGA-Net [9] represented AOBB as a CenterMap OBB and proposed to treat the AOBB problem as a pixel-level classification issue. Yang et al. [10] proposed a circular smooth label (CSL) to transform the angle regression into a sparse classification problem within the range of error tolerance. Nevertheless, these two methods rely on a single regression network for predicting the accurate location of the ORSI targets in the unbounded space, which is considered to be challenging for the network to learn.
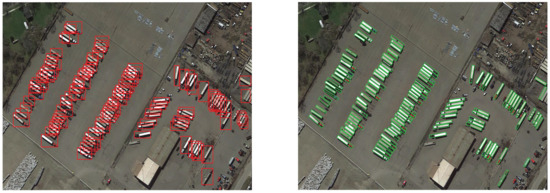
Figure 1.
Detection results of AABB (left) and AOBB (right) generated with our method on the DOTA data set.
In this article, we designed an anchor-free multi-sector oriented object detector (MS-Det) that adopts the partitioning idea and multi-sector mechanisms to quantize the regression space of scales and the orientation of ORSI objects. Our multi-sector mechanisms are threefold. First, as depicted in Figure 2b, we divided the coordinate space into four quadrant sectors and represented the AOBB as four scale and angle parameters in the Cartesian coordinate system. Based on this quadrant-sector mechanism, we represented the targets by . Specifically, targets are described by an in-box point, four scale diameters that are offset from the in-box point to the four boundaries, and four angles between the four scale diameters and the reference x-axis. By dividing the coordinate system into four sectors, each quadrant sector will be responsible for regressing the respective scale offset and angle to build an entire bounding box, which enhances the convergence performance of the network and addresses the order ambiguity problem of the angle and boundary. Second, instead of directly regressing the scales of the four diameters, we divided the scale space into multiple scale sectors and then employed a classification-to-regression strategy to obtain a more accurate location of the targets. Specifically, we first adopted a coarse-granularity classification approach to determine to which sector the scale range belongs. Then, the corresponding regression network refines the coarse localization with the selected sector scale by a fine-grained regression strategy. Compared with the direct regression method, the network of the combined regression and classification is easier to train and converge while obtaining a more accurate boundary box scale. Third, we designed a smooth angular-sector label (SASL) to smoothly distribute the label value and improve the missed rate and detection accuracy. In addition, we adopted a localization-aided detection score (LADS) that better represents the confidence of a detected box by combining the category-classification and sector-selection score, in contrast to the previous category-based confidence decision method. This localization-aided method dramatically improves the performance of detection.
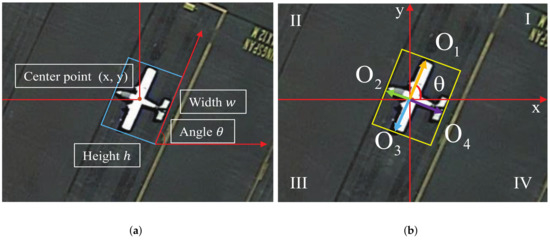
Figure 2.
(a) Representation of a target by the center point , scale , and angle . (b) Representation of the target used in our method.
The contributions of this article are summarized as follows:
- We proposed an innovative representation, i.e., quadrant sectors, for AOBBs in ORSIs. The proposed representation of AOBBs addresses the ambiguity problem of the boundary and the angle well, while enhancing the convergence performance of the network;
- We proposed a classification-to-regression strategy to obtain the accurate localization of the ORSI targets with discrete scale and angular sectors. This strategy makes it easier for the network to learn the scale and orientation information of the AOBB;
- We designed a smooth angular-sector label (SASL) that smoothly distributes label values with a definite tolerance radius. With this label, the missed rate and detection accuracy are dramatically improved;
- To obtain a more accurate confidence of the detected boxes, we proposed the fusion of classification and localization information and thus achieved promising results on the DOTA, HRSC2016, and UCAS-AOD data sets.
The remainder of this article is organized as follows. The related work is concisely reviewed in Section 2. The details of the proposed method are introduced in Section 3. In Section 4, the experiments result are analyzed in detail. Finally, the conclusions of this article are presented in Section 5.
2. Related Works
According to the geometric characteristics of the bounding box, most of the existing object detectors in ORSIs can be roughly classified into two types: axis-aligned object detection and arbitrarily oriented object detection methods. In this section, the related works of axis-aligned object detection and arbitrarily oriented object detection models are briefly reviewed.
2.1. Axis-Aligned Object Detection in ORSIs
Studies on real-time, precise target detection algorithms of a target have been a research hotspot in the field of machine vision and are also a difficult research area. In recent years, as a significant and tough research branch of computer vision, object detection in ORSIs has developed rapidly. Traditional object detection algorithms are based on the excellent texture description ability of handcrafted features (e.g., the histogram of oriented gradients [11], the scale-invariant feature transform [12], and deformable part-based models [13]) and follow the paradigm of sliding windows. Gradually, the performance of manual feature selection techniques became saturated. Due to the robust learning ability and the high-level feature representation capability of deep convolutional neural networks (DCNNs) for images, a large number of DCNN-based object detectors have been proposed in natural image object detection and ORSI object detection. These detectors are used to detect axis-aligned bounding box targets and can be categorized into two main branches: multi-stage and one-stage object detection.
2.1.1. Multi-Stage Object Detection Method
The DCNN-based multi-stage object detectors divide the detection process of AABB into several core computational steps, and higher accuracy is achieved. As the originator of the multi-stage detection method, the R-CNN [14] first extracts the target proposals by selective search and then utilizes the CNN to determine the category and refine the location of the object proposal. Fast R-CNN [15] inputs the whole image to extract the features by the CNN and then generates the features of each region proposal by RoI pooling for the subsequent classifiers and fine regressors. Faster R-CNN [1] implements a CNN-based region proposal network (RPN) to generate the feature information of the region proposal, and the end-to-end detection is realized. Based on the Faster R-CNN framework, the Cascade R-CNN [16] cascades multiple R-CNN networks based on different IoU thresholds to continuously optimize the resulting proposals and obtain more accurate detection results. Aimed at the characteristics of ORSI targets, some recent works have applied the multi-stage detection methods to the ORSI object detection field. For example, Deconv R-CNN [17] utilizes a network with a deconvolution layer after the last convolution layer of the Faster R-CNN backbone network for ORSI small target detection. Yang et al. [18] purposed a cluster proposal network (CPN) that addresses the target clustering and scale adjustment issues of aerial image targets. To boost multi-class and multi-scale detection capabilities, FRPNet [19] is designed with a feature-reflowing pyramid structure to generate high-quality features representations for each scale by fusing fine-grained features from the lower adjacent layer. Chen et al. [20] introduced a multi-scale spatial and channelwise attention (MSCA) mechanism to eliminate the interference of complex background. Lu et al. [21] designed a gated axis-concentrated localization network (GACL-Net) to improve the performance of small-scale detection in ORSIs.
2.1.2. One-Stage Object Detection Methods
One-stage object detection methods (e.g., YOLO [2], SSD [3], and RetinaNet [4]), which abandon the region proposal stage, directly generate the category probability and position coordinate value of the object. With a single feedforward CNN baseline, the final detection result can be obtained directly. Therefore, these types of methods are considered to be faster, slicker, and simpler in the design stage. In the field of ORSIs, one-stage detectors are becoming increasingly popular. For example, MRFF-YOLO [22] introduced a multi-receptive field model to enhance the performance of small-scale target extraction. Based on the SSD paradigm, AF-SSD [23] improves the performance of ORSI object detection by designing exquisite enhancement modules such as the encoding–decoding module and spatial and channel attention modules. Sun et al. [24] proposed an adaptive saliency-biased loss (ASBL) to train the RetinaNet and dramatically improved the performance of detection in the ORSIs. In addition, the work in [25,26] proposed the advanced object detection architecture that involves both spatial and temporal domain information in the decision. However, these axis-aligned bounding box object detectors are still confronted with the challenge of arbitrary orientations in ORSIs. More auxiliary network structures are required for arbitrarily oriented objects in the ORSIs.
2.2. Arbitrarily Oriented Object Detection in ORSIs
Given the orientation characteristic of remote sensing objects, a good alternative is the use of an arbitrarily oriented bounding box to describe the ORSI targets. These arbitrarily oriented object detectors for ORSIs can be roughly divided into two categories: anchor-based and direct regression-based object detection methods.
2.2.1. Anchor-Based Object Detection Method
For an optical remote sensing image, anchor-based detectors first make use of many fixed anchors as a referee and then either regress the localization offset of the bounding box or generate the region proposals on the basis of anchors and decide whether the corresponding proposal belongs to a certain category. Liu et al. [27] transformed the original region-of-internet (RoI) pooling layer and AABB regression representation into a rotated RoI and AOBB regression model for the ship detection task in ORSIs. The work in [28] introduced the feature pyramid network (FPN) and the cascade image to obtain abundant semantic information for regressing the offsets between the AOBB and the AABB. RoI Transformer [29] upgrades the horizontal RoI to an oriented RoI by a supervised RoI learner design. To effectively detect ships, the PN [30] proposed a rotated region proposal network (PN) and a rotated RoI layer to generate oriented proposals and extract features from inclined regions, respectively. Based on the FPN structure and a novel spatial and scale-aware attention mechanism, CAD-Net [31] introduced a global and local context network to collect the scene and object-level contextual information for accurate and efficient AOBB object detection in ORSIs.
2.2.2. Anchor-Free Object Detection Method
While anchor-based detection strategies have demonstrated promising results in ORSIs, they are unable to escape the inefficient and inflexible manual designs of multi-scale, multi-orientation anchors. Recently, the ORSI target detection field has seen an upsurge of numerous anchor-free approaches. Typically, these methods are classified into two categories: keypoint-based and intensive predictive-based detectors. In regard to keypoint-based methods, CornerNet [32] utilizes the upper left and lower right corners of the AABB to locate the objects. CenterNet [33] proposes a center-based paradigm to represent the target and then regresses the offsets of the center and the corresponding distances among four boundaries and the center. Combining with CornerNet [8] and CenterNet [20], Chen et al. [34] utilized an end-to-end FCN to identify the ship AOBBs according to the predicted corners, center, and corresponding angle of the ship. The OPLD [35] transforms an accurate localization task from a regression problem to a keypoint estimation problem and then combines the endpoint scores with the classification score to improve the final detection quality. Shi et al. [5] decomposed the vehicle detection problem in the ORSIs into one central point classification and three parameter regression subtasks to predict the central point, scales, orientation, and offsets of the vehicle central point. HRPNet [36] introduced polar coordinates and transformed the detection task of the arbitrarily oriented bounding box into the regression of one polar angle and four polar radii. GRS-Det [37] employs an anchor-free ship detection algorithm based on the unique U-shape network and rotation Gaussian-mask. For intensive predictive-based methods, DenseBox [38] utilizes a fully convolutional network (FCN) to obtain the pixel-level prediction of confidence and the location of AABBs. FCOS [39] follows the FCN structure and implements center-ness to suppress the low-quality detected boxes. For ORSIs targets, IENet [40] modifies the FCOS structure with an oriented regression branch enhanced by a self-attention mechanism. Similarly, TOSO [41] designed a robust Student’s T distribution-aided one-stage orientation detector to address orientation target detection in ORSIs. Xiao et al. [42] proposed to detect the arbitrarily oriented objects in ORSIs by predicting the axis of the object at the pixel level of feature maps. Different from the aforementioned method that directly regresses the scales or the angle of the AOBB, our proposed MS-Det quantizes the boundless regression spaces by a classification-to-regression multi-sector strategy, which accelerates the convergence of the network and obtains more accurate localization of AOBBs in ORSIs.
2.3. Localization-Guided Detection Confidence
There are many works that have verified that the combination of the localization quality score and classification score can be instrumental in identifying high-quality detection results. Many works are committed to correcting the final detection confidence by the localization score. The work in [43] proposed to transform the task of the intersection of union (IoU) prediction between the predicted box and ground truth as a classification task and then used the predicted IoU to optimize the final detection confidence. IoU-Net [44] corrects the detected bounding box score by an IoU regression branch. The work in [45] combined the IoU score that was predicted by a fused scoring network with the classification score for the final detection confidence. Wu et al. [46] predicted the IoU for each detected box and utilized the product of the predicted IoU and the classification score to compute the final detection confidence, which effectively boosted the localization accuracy. OPLD [35] uses the class-agnostic keypoint-estimation score to guide the detection score of the AOBB in ORSIs. Therefore, inspired by these methods, our MS-Det combines the category-classification score with the localization sector-selection score, which provides a more reasonable final detection confidence.
3. Methodology
The pipeline of the proposed multi-sector oriented object detector (MS-Det) is illustrated in Figure 3. It mainly includes two modules: the multi-level feature extraction backbone network and the multi-level prediction head for object classification and localization. Given an input image, the backbone network generates a multi-level feature map by a feature pyramid network (FPN), which is used for the subsequent multi-level prediction head. Note that each level of the FPN will extend a prediction head to detect targets with different scales. For each position on the feature map of different levels, the classification branch of the prediction head is responsible for the prediction of the category confidence score. Meanwhile, in order to predict the accurate localization of objects, we designed a sector-based localization branch to pinpoint the ORSI targets. Specifically, the localization branch of the prediction head is composed of the scale-sector classification, scale-sector regression, angular-sector regression, and angular-sector classification prediction sub-branches. Combining the scale-sector classification and regression, we can obtain an accurate scale of the targets. The angular-sector classification and regression subbranch is in charge of precise angle prediction. In addition, to obtain more accurate localization confidence, we adopted a localization-guided detection confidence strategy that combines the category-classification score with the sector-selection score and dramatically improves the localization quality.
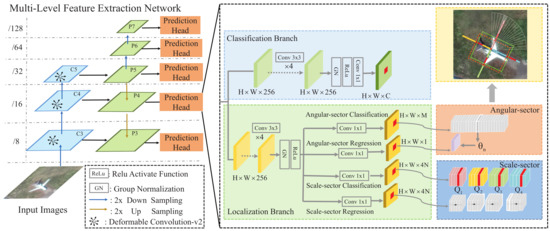
Figure 3.
Architecture of the proposed MS-Det, where , and represent the feature maps of the backbone network that are generated by deformable convnets v2 (DCN-v2). P3 to P7 denote the feature levels of the feature pyramid network (FPN) used for the subsequent prediction head. and C indicate the height, weight, and channel, respectively. The 2× downsampling and 2× upsampling adopt 2-stride convolution and deconvolution, respectively.
3.1. Multi-Level Feature Extraction Network
As shown in Figure 3, a 101-layer residual network (ResNet-101) [47] backbone was deployed to extract features from the input training or testing images, followed by a feature pyramid network (FPN) [48], which was implemented to detect objects with different sizes on multi-level feature maps. The output feature maps of ResNet-101 were down-sampled 32 times by five stages, and we only utilized three levels of the multi-scale feature pyramid, following the design of FCOS. We defined , and as the feature maps in Stages 3, 4, and 5 of the ResNet-101 backbone. In addition, to enhance the ability of modeling geometric transformation, we replaced the 3 × 3 convolution in , and with DCN-v2 (modulated deformable convolution). Meanwhile, represents the feature maps of different levels used for final classification and localization prediction that are obtained by the FPN. In our method, five levels of feature maps were utilized, where , , and were generated by the backbone network’s feature maps , , and , followed by a 1 × 1 convolutional unit layer with top-down connections. and were obtained by employing a two-stride size convolutional layer on and , respectively. Finally, the prediction heads were obtained from feature maps at different levels. Let be the feature maps with size at layer of the network, be the total stride until the l-th layer, and C represent the number of ORSI target categories. For each localization on the feature map, which can be mapped back onto the corresponding position of the input image, it is considered a positive sample if it has to be within a distance to the center point of a ground truth AOBB belonging to category label c, and the range of the scale sector lies in the regression range of the l-th layer. We defined the regression range for the FPN level from 3 to 7 as (0, 64], (64, 128], (128, 256], (256, 512], and (512, ∞), respectively. Otherwise, it can be considered a negative sample with c = 0, which denotes the background.
3.2. Classification Branch of the Prediction Head
Figure 3 illustrates the network details of the prediction heads. For the classification branch, a four-layer convolution stack with 3 × 3 kernels and 256 channels was employed to extract the features from the i-th level of the FPN. The final feature map for predicting object multi-category probability scores can be calculated as:
where denotes the final category-classification prediction map, indicates the convolutional operation with 1 × 1 kernels and C channels (i.e., the total category number), GN represents the group normalization, and denotes the ReLU activation function. At the inference stage, the final layer of the classification branch network predicts a C-dimensional vector of classification labels at the localization .
3.3. Localization Branch of the Prediction Head
3.3.1. Multi-Sector Design
As shown in Figure 4, in order to obtain the accurate localization of the AOBB target, we represented the target by a multi-sector model. For each in-box point in the ORSI target, we represented it by , where indicates the coordinate of the in-box point, denotes the vertical distance scale from in-box point to the four boundaries and represents the angles between the four scale diameters and the reference x-axis. For convenience, we only took the angle in the first quadrant to represent the AOBB target, and the angles of the 2nd, 3rd, and 4th quadrant can be calculated as , , and , respectively. Note that the detailed descriptions of the scale offsets and SASL can be found in Appendix A Algorithms A1 and A2. Meanwhile, for the localization branch of the prediction head in Figure 3, we also first deployed a four-layer convolution stack with 3 × 3 kernels and 256 channels to extract the features from the i-th level of the FPN. Then, similar to (1), we employed a operation to obtain the feature maps for scale-sector regression, for scale-sector classification, for angular-sector regression, and for angular-sector classification. The motivation of this multi-sector design can be summed up in two points. One is divide-and-conquer. The Cartesian coordinate system will be divided into four independent quadrant sectors, and then, the regression tasks of each sector can be more definite, which effectively eliminates the ambiguity of the regression parameter definition. The other is coarse-to-fine. By discretizing the regression range into multiple coarse-scale sectors and angular sectors in four quadrant sectors, we can shrink the regression range and then perform fine-tuning in the smaller regression interval adapting to the object size, which will be instrumental in detecting the remote sensing objects with various resolutions. The core mechanisms of the multi-sector model for our method are detailed as follows.
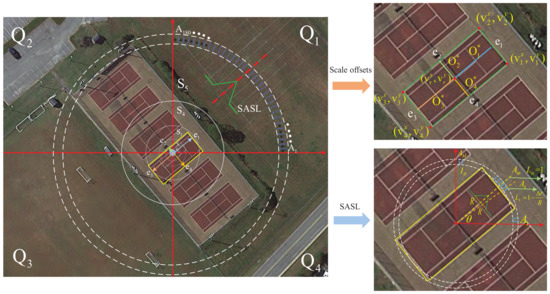
Figure 4.
Detail of the multi-sector design of our method. represent the four-quadrant sector. indicate the scale sector that divides the scale space into 5 parts. represent the angular sector of the 1st quadrant. represent the 4 endpoints of the corresponding four middle supporting lines (i.e., ).
3.3.2. Quadrant Sector
As described in [10], if we adopted the representation in Figure 2a, the regression parameters, such as w and h, of the target AOBB will be measured in one fixed rotating coordinate, which will result in the inherent ambiguity problem in the regression parameter definition and make it hard for the network to converge. Therefore, we took the in-box point as the origin and split the AOBB of the ORSI target with the corresponding x-axis and y-axis. As shown in Figure 4, the Cartesian coordinate system will be divided into four quadrant sectors, namely, , and then, the network will regress the respective diameter belonging to the corresponding quadrant sector. This representation of the AOBB will be more distinct and enhance the convergence performance of the network.
3.3.3. Scale Sector
As shown in Figure 2b, we reconstructed the AOBB of the object by calculating the scale offset between the regression point and four AOBB boundaries in four quadrants . Formally, if location is associated with a bounding box , the training regression targets (i.e., scale offset) for the location can be calculated by Algorithm A1. Instead of directly regressing the scale offsets, we adopted a classification-to-regression strategy to obtain the values of the scale offsets. Specifically, as illustrated in Figure 4, we divided the scale regression space into N scale sectors, where in our method. We defined the range for the N sector as (0, 32], (32, 64], (64, 128], (128, 256], and (256, ∞). If the scale offset falls into a certain scale sector , it will be assigned a scale regression parameter . We used a one-hot label for scale-sector selection prediction. We defined as the predicted scale-sector classification score for the quadrant within the n-th scale sector, and the final predicted confidence score was formulated as:
We regressed the scale offsets by a classification-to-regression strategy. In particular, we identified which scale-sector the scale offsets belong to as follows:
where denotes that the scale offset falls into the j-th sector. Then, the regression of the scale sector was formulated as:
where and are the scale offsets of the predicted bounding box and ground truth bounding box in the j-th quadrant (likewise for and ), respectively. As illustrated in Figure 4, the scale-sector classification performs N classifications for sector selection in four quadrants. The scale-sector regression performs scale predictions for the selected sector from the scale-sector classification branch.
3.3.4. Angular Sector
For the arbitrarily oriented objects in ORSIs, the direction of the AOBB has a great impact on the detection performance. The IoU between the predicted box and ground truth may decrease considerably even with a small angle bias. To obtain more accurate angle information, we also employed a classification-to-regression method to predict the angle in the first quadrant. To be more concrete, we split the angle into M angular sectors, where M was set to 90 and each sector had an interval . Therefore, we divided the angular space as . If the angle falls into a certain angular sector , the network will regress the angle bias as follows:
where and denote the predicted result and ground truth of the first quadrant angle, respectively. Meanwhile, m denotes that the ground truth angle belongs to the m-th angular sector. We defined as the predicted angular-sector classification score within the m-th angular sector and as the parameter for angle bias regression. Moreover, we designed a smooth angular-sector label (SASL) to smoothly assign the label value with a certain tolerance R and obtain robust angular-sector prediction. The procedure of SASL generation is summarized in Algorithm A2. Instead of taking the one-to-one mapping paradigm of the one-hot label for angular selection prediction, this smooth label smoothly maps the ground truth angular sector into multiple sectors and alleviates the effect of classification error. By assigning this SASL to each angular sector, the prediction results close to the ground truth will obtain more angle tolerance and be allowed within a weak angle deviation, resulting in missed rate and detection accuracy improvements.
3.4. Localization-Aided Detection Score
To obtain more accurate detection confidence, we designed a localization-aided detection score. Most of detectors only use classification scores as the standard of the detected box quality. Nevertheless, a high-quality detection result represents not only precise category classification, but also accurate localization. Therefore, it is inaccurate to evaluate the quality of detection results only by classification scores. To tackle this issue, we proposed to combine the classification score with a localization confidence score (i.e., scale-sector and angular-sector selection confidence score), which is formulated as:
where represents the maximum confidence of angular-sector classification in four quadrants and denotes the maximum probability of the angular-sector selection score. and are the prediction results in the classification and localization branches, respectively. In our experiment, the parameter was introduced to fuse the contribution of the classification and localization score into the final detection score. Taking localization quality into account, the detection result can better represent the confidence of detected bounding boxes. For each location, we chose the final confidence score that was higher than 0.05 as a definite prediction.
3.5. Loss Function
Our MS-Det is an end-to-end framework, and the multi-task training loss function was formulated as follows:
where represents an indicator function that returns one if (i.e., positive sample) and otherwise returns zero. represents the feature point category-classification loss. and indicate the sector classification and regression loss, respectively. In our method, we set the loss weights to 0.5.
3.5.1. Classification Loss
The category classification loss is calculated by the focal loss [4] function as follows:
where indicates the number of positive targets in the ground truth. and represent the predicted probability score and ground truth of the category, respectively. In our experiment, we set and to 2 and 0.25, respectively.
3.5.2. Sector Classification Loss
The sector-classification loss of the scale sector and angular sector is calculated as follows:
where and are the predicted scale-sector classification score and ground truth label of each feature point, respectively. and are the predicted angular-sector probability distribution and smooth angular-sector label of the ground truth in each feature point , respectively. and represents the sigmoid cross-entropy loss and cross-entropy loss, respectively. Note that we omitted the mark for simplicity
3.5.3. Sector Regression Loss
The scale-sector and angular-sector regression loss were formulated via the smooth L1 regression loss function. The formula is defined as follows:
where represents the regression targets of scale-sector and angular-sector offsets of the positive samples, which are defined in (4) and (5), respectively.
4. Experiments and Results Analysis
In this section, we first introduce three public optical remote sensing image data sets and evaluation metrics and then analyze the implementation details of the training and detection inference of the network. Next, the superiority of the proposed method is analyzed in comparison with the state-of-the-art detectors. Finally, some promising detection results are displayed.
4.1. Data Sets and Evaluation Metrics
In our experiments, we chose three oriented optical remote sensing image data sets: the DOTA [49] data set, the HRSC2016 data set [50], and the UCAS-AOD [51] data set.
4.1.1. DOTA Data Set
DOTA consists of 2806 aerial images that contain a total of 188,282 instances annotated with horizontally oriented bounding boxes. The categories of the data set include plane, ship, storage tank, baseball diamond, tennis court, swimming pool, ground track field, harbor, bridge, large vehicle, small vehicle, helicopter, roundabout, soccer field, and basketball court. The 15 categories contain 14 main categories, where small vehicles and large vehicles are sub-classes of the vehicle category. In this data set, the proportions of training, validation, and test images are 1/2, 1/6, and 1/3, respectively. The size of each image falls within the range of 800 × 800 to 4000 × 4000 pixels. In the experiments, we only used the annotations of the arbitrarily oriented bounding boxes. Multiple sizes were used for the crop images; the sizes used were 512 × 512, 800 × 800, and 1024 × 1024 with 0.2 overlaps.
4.1.2. HRS2016 Data Set
HRSC2016 is a public data set for arbitrarily oriented ship object detection in ORSIs. The HRSC2016 data set contains a total of 1061 images with scales from 300 × 300 to 1500 × 900 pixels that were captured from six famous ports. The training, validation, and test data sets contain 436, 181, and 444 images.
4.1.3. UCAS-AOD Data Set
The UCAS-AOD data set consists of two types of targets: airplane and car, which are labeled with oriented bounding boxes. It includes 1000 plane images and 510 car images, which contain 7482 objects and 7144 objects, respectively. The scale of the UCAS-AOD image is 1280 × 659 pixels. In the experiment, we randomly divided the training and testing set according to the ratio of 7:3.
4.1.4. Evaluation Metrics
A predicted box is regarded as a true positive if the IoU between the predicted box and ground truth exceeds the preset threshold; otherwise, it is a false positive . If a ground truth box has not been detected correctly, it is labeled a false negative . denotes the proportion of true positives to all predicted positive samples, while indicates the ratio of correctly detected positive samples to all positive samples. Combined with precision and recall, can evaluate the one-class object detection performance comprehensively. For multi-category object detection, we used the mean average precision (mAP), which is defined as the mean value of the AP in each category, to evaluate the detection accuracy. Meanwhile, we recorded the number of images that can be processed per second (i.e., frame per second (FPS)) and the model parameters to evaluate the detection speed and complexities of the methods.
4.2. Experimental Details and Network Inference
4.2.1. Experimental Details
In the experiments, the computer hardware platform used in this article was an Inter®Xeon(R) CPUE52603v4@1.70GHz×6 CPU and two NVIDIA GeForce GTX 1080Ti GPUs with 12 GB memory. We used the deep learning development framework PyTorch 1.0 that was run on the Ubuntu 16.04 operating system. In our method, ResNet-100, which was initialized with the weights pre-trained on ImageNet, was used as the backbone network. In addition, we used stochastic gradient descent (SGD) to optimize the network and set the initial learning rate to 0.001. The learning rate was reduced by a factor of 1.8 every 20 k iterations with a batch size setting of 32. In addition, the weight decay and momentum were set as 0.0001 and 0.9, respectively. We resized the input image to 1024 × 1024 and randomly applied the data augmentation methods to enlarge the data set, including horizontal and vertical flipping, rotation, cropping, and color dithering. We trained the network for approximately 50 epochs on the DOTA data set and 150 epochs on the UCAS-AOD and HRSC2016 data sets. We utilized ResNet-101+FPN as the backbone network to optimize the parameters of our method on the UCAS-AOD data set. First, in our method, the parameters and in (8) are two factors that can have a vital impact on the detection results. We analyzed the sensitivity of MS-Det on these two values. We set the parameter and . Figure 5 shows that the best performance of our method was achieved with and . Therefore, the values of these two parameters and were set to zero-point-two-five and two empirically. Meanwhile, as shown in Table 1, we set the value of in (7) and achieved the highest mAP of 96.33% when . Therefore, we chose 0.5 as the value for the best performance.
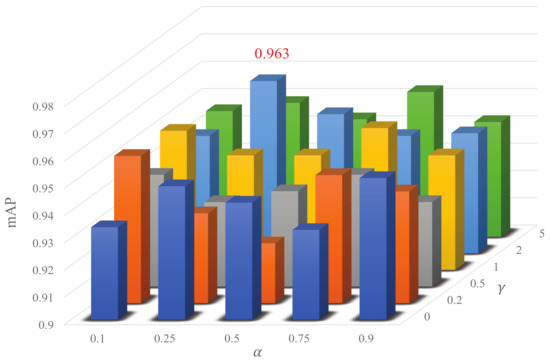
Figure 5.
Effects of different values of and on the object detection results of the UCAS-AOD data set.

Table 1.
Comparisons with different values on UCAS-AOD (%).
4.2.2. Network Inference
The inference of our network is straightforward; we input the image into the network and forwarded the input image through the network. The classification branch of the prediction head will output an M-dimensional vector for C category predictions. In addition, corresponding to the training targets, the final layer of localization branch networks predicts an M-dimensional vector for angular-sector selection prediction, a one-dimensional vector for angular-sector bias prediction, a -dimensional vector for scale-sector selection prediction, and a -dimensional vector for scale-sector bias prediction in the inference stage. For each point of the FPN feature map, we can map it back onto the input image coordinate . Then, we can obtain the scale offset and according to (4) and (5), respectively. Finally, we can calculate the four endpoints’ coordinates of the corresponding four middle supporting lines (i.e., ), which are illustrated in Figure 4 by the following formula:
In our method, we only decoded bounding box predictions from at most 1k top-scoring predictions score per FPN level, after thresholding the detector confidence at 0.05. The top predictions from all levels were merged, and oriented non-maximum suppression with a threshold of 0.5 was applied to yield the final detection results.
4.3. Ablation Study
We conducted some ablation experiments on the UCAS-AOD data set to verify the effectiveness of the proposed smooth angular-sector label (SASL) and localization-aided detection score (LADS). All models for impartial comparison were based on ResNet101-FPN with data augmentation.
4.3.1. SASL
In our method, we transformed the regression of the object orientation angle into the discrete fine-grained multiple angular-sector classification problem. In the experiment, we found that the one-hot label used in the baseline model that adopts a point-to-point mapping between the ground truth and true predicted angular-sector was agnostic to the angle bias between the false angular-sector classification prediction and ground truth. All false classification results of the angle were allocated an equal prediction loss, but the prediction results close to the ground truth should be assigned a smaller classification loss. To tackle this problem, we designed an angular-sector label that smoothly distributes the label value with a definite tolerance radius. Our baseline model without SASL and LADS only achieved 90.56% mAP. Integrated with SASL, the performance of our model was improved by 2.22% compared with the baseline model, due to its ability to accommodate the angle prediction results, which were allowed within a defined error tolerance limit from a detection perspective.
4.3.2. LADS
A single classification score cannot comprehensively assess the final detection quality of the detected box. Therefore, we used the average value of four scale-sectors and the angular-sector classification scores as the localization quality of the AOBB to aid the evaluation of the detected box quality. Then, as shown in (6), we took the weighted product of localization score and classification score as the final detection confidence , which took into account both classification and localization confidence. By using LADS to reflect the confidence of detected AOBB, the detection performance was improved by 3.42% compared with the baseline model. The additional improvement indicated that the localization score made the accuracy increase significantly, and the LADS enabled better assessment of the quality of the detected box.
As shown in Table 2, the proposed MS-Det that combines the SASL and LADS achieved a total of a 5.77% mAP improvement compared to the baseline model, pushing the mAP to 96.33%, which illustrates that these two methods are actually complementary to each other and can effectively improve the detection performance. Meanwhile, Figure 6 shows some detection results from the baseline model (first row) and the full implementation of the proposed MS-Det (second row). The green, red, and yellow boxes indicate true positives (TPs), false positives (FPs), and false negatives (FNs), respectively. We can see that the additions of SASL and LADS can effectively decrease the number of FPs and FNs and improve the recall and precision rate. Moreover, we recorded the PRCs for car and plane objects on the UCAS-AOD data set with the four implementation models (baseline, MS-Det w/o SASL, MS-Det w/o SASL, and MS-Det) in Figure 7 and concluded that the full implemented MS-Det outperformed the other three models in terms of AP by a large margin, which further proved the effectiveness of our SASL and LADS. Figure 8 shows the curves of the validation mAP and losses obtained by the MS-Det and MS-Det without SASL models in 150 training epochs. It can be seen that MS-Det with the SASL component yielded a higher validation mAP and a smaller loss and then converged faster, which demonstrated that SASL played a precise active role in speeding up the convergence of the network and improving the detection accuracy.

Table 2.
Comparisons on UCAS-AOD with different detectors (%). Note that the MS-Det (baseline) model represents the MS-Det model without SASL and LADS.
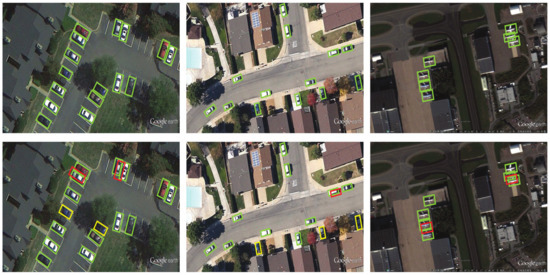
Figure 6.
Various detection results from our method on the UCAS-AOD data set. The green, red, and yellow bounding boxes represent TPs, FPs, and TNs, respectively.
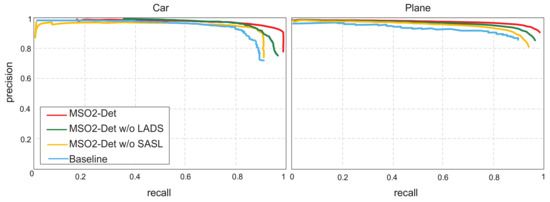
Figure 7.
PRCs of the four ablation study models for car and plane objects on the UCAS-AOD data set.
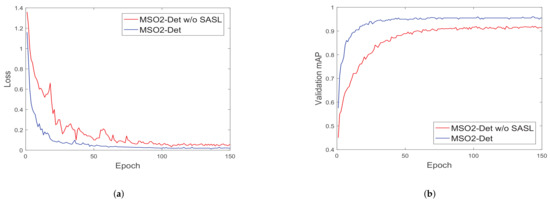
Figure 8.
(a) mAP and (b) losses obtained by the MS-Det and MS-Det without SASL models in 150 training epochs.
4.4. Analysis of High Parameters
In this section, we performed a sequence of comparison experiments with the proposed MS-Det on HRSC2016 data set to analyze the effect of the key parameters.
4.4.1. Smooth Radius of SASL
The smooth radius R of the SASL is a crucial parameter as discussed in Algorithm A2. It can be seen as the reflection of the maximum error tolerance of angular-sector classification. Therefore, it is vital for MS-Det to determine the optimal range of the smooth radius. As shown in Table 3a, the value of of LADS was fixed at 0.4. First, when R was zero, SASL degenerated to the original one-hot label, and we can see that the F1-score and AP of MS-Det only achieved 0.8875 and 0.8956, respectively. Then, with the increase of R, the indexes of the F1-score and mAP on the HRSC2016 data set with MS-Det gradually increased until reaching , which further verified the effectiveness of our smooth radius. However, if the value of R was further increased, the tolerance of the angular-sector error would be overburdened, and the performance would degrade. Taking the above into consideration, the smooth radius R was set to the crucial value of five in our method.

Table 3.
Analysis of influence of the hyper-parameters R and .
4.4.2. Trade-off Factor of LADS
When using the combination of localization and classification scores as the detection confidence, the trade-off between these two scores determines the importance of classification and localization tasks. To test the influence of the trade-off factor on our method, we first set the smooth radius R to five based on the analysis of the smooth radius R and then explored different values in Table 3b. First, if we only considered the localization confidence, i.e., , the detector would encounter a considerable performance degradation (an mAP of only 0.7853) because the localization score does not contain the category information at all. Similarly, the detection score that only takes classification confidence into account will also face the problem of deficient localization information. Then, by gradually increasing the value of from zero to one, we can conclude that when equaled 0.6, the F1 score and mAP achieved the highest values of 0.8854 and 0.8744, respectively. Experimental results demonstrated that this pattern of information fusion effectively improved the detection performance.
4.4.3. Numbers of Scale and Angular Sectors
To find suitable hyper-parameter settings of the scale sector N and angular sector M in our method, we conducted parameter optimization experiments, and the results are shown in Table 4. First, the scale sectors were set to 45, 90, and 180, which demonstrated that the angular space was divided into 45, 90, and 180 sectors, and each sector was equally allocated to , , and , respectively. Then, the number of scale sectors increased from two to six. We listed all the combined results and found that when N and M were extremely small or large, the performance dropped sharply (as in () or ()) because these settings of M and N destroyed the balance between the classification and regression tasks. For example, when M equaled 90, the demand for classification accuracy would increase, leading to the CNN confronting more difficulty in learning and converging. Under this consideration, the number of scale sectors N and M was set to five and ninety for optimal detection performance, respectively.

Table 4.
Analysis of the influence of the hyper-parameters M and N.
4.5. Comparison with State-of-the-Art Detectors
We compared the performance of the proposed MS-Det with the state-of-the-art oriented detectors on three data sets: DOTA [49], UCAS-AOD [51], and HRSC2016 [50].
4.5.1. DOTA
To comprehensively verify the superiority of our method, we performed a series of experiments including some precision comparison and speed comparison experiments on the DOTA data set. First, we compared the AP in 15 categories of objects and the mAP value of fifty deep learning-based methods. All models listed in Table 5 adopted ResNet-101-FPN as the backbone network, except that RRPN [55], CNN, and -DNet adopted VGG-16 and ResNet101, respectively. Note that data augmentation was applied for a fair comparison with all the compared methods. In terms of the mAP values over fifteen categories of remote sensing targets, six of the fifteen detectors had mAP values over 70%, and the proposed MS-Det achieved an mAP of 76.63%, which outperformed the top six detectors, i.e., Det, -DNet, SCRDet, Gliding Vertex, WPSGA-Net, and OPLD by 4.94%, 5.51%, 4.02%, 1.51%, 0.60%, and 0.20%, respectively. In addition, the AP values of small-scale and densely arranged objects (e.g., plane and storage tank), large aspect ratio objects (e.g., ship and harbor), and easily confused objects (e.g., baseball diamond and ground track field) with MS-Det were all higher than all compared methods, which demonstrated the superiority of our method for remote sensing object detection. Figure 9 displays the mAP-IoU curves of our model and the other four anchor-free models. Note that a higher IoU threshold represents more accurate detection results. It can be seen that the mAPs generated from our model were always higher than the other four anchor-free models, which indicated that our model was more efficient and accurate in the ORSI object detection task. Moreover, as indicated in Table 6, we compared the speed, accuracy, and model parameters with the other four anchor-free methods and four anchor-based models. Note that the computational burden of post-processing is also included. Our method can achieve the highest accuracy of 76.63% while maintaining a speed of 7.67FPS with 218.5MB parameters, which was faster and more lightweight than all compared anchor-based models and most anchor-free models except for -DNet and TOSO. The experimental results indicated that our model was relatively efficient and lightweight, but the complexity of our detector was exactly heavier compared to some state-of-the-art anchor-free methods due to the further stages of sector processing. The visualization results on the DOTA data set are shown in Figure 10.

Table 5.
Comparisons on DOTA with the state-of-the-art detectors. We chose an IoU threshold of 0.5 when calculating the AP.
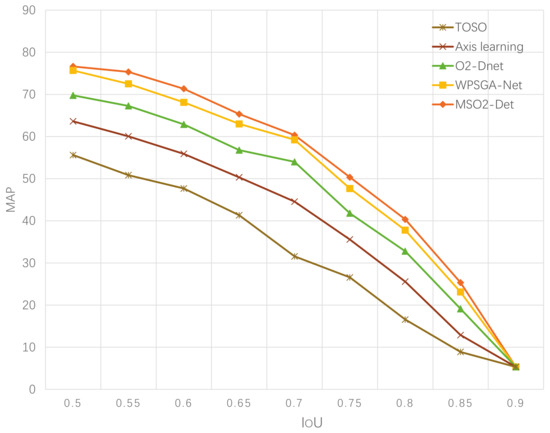
Figure 9.
The mAP-IoU curves of four anchor-free detectors.

Table 6.
Speed and accuracy comparisons with the state-of-the-art methods on DOTA.
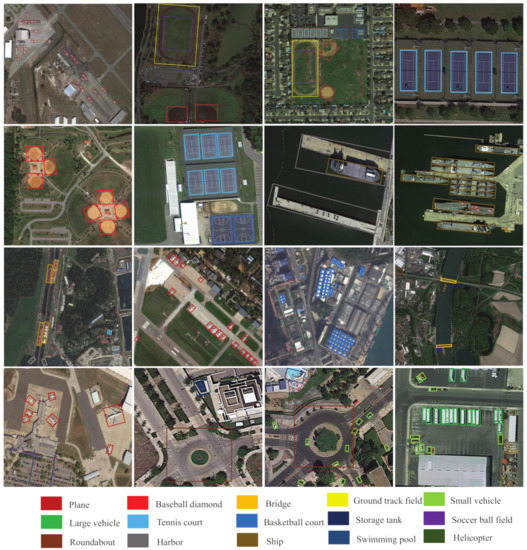
Figure 10.
Visualization of the detection results from MS-Det on the DOTA data set.
4.5.2. UCAS-AOD
In addition, we evaluated the proposed method on the UCAS-AOD data set and compared it with several advanced oriented object detectors, namely R-DFPN [52], ARN [53], RetinaNet-H [54], ICN [28], Det, and WPSGA-Net [9], as shown in Table 2. We can see that our method achieved state-of-the-art performance, and the detection accuracy AP of the small car exceeded that of other compared detectors, which indicated that our method was robust to densely arranged ORSI objects.
4.5.3. HRSC2016
To test the performance of our MS-Det, we compared it with eleven ship detectors, which included several state-of-the-art methods such as RoI Transformer [29], Det [54], Gliding Vertex [58], and GRS-Det [37]. The comparison results are reported in Table 7. We can see that MS-Det outperformed all compared methods in terms of mAP. Compared with the methods that adopted data augmentation and resized the input image to 800 × 800 (PN [30], RetinaNet-H [54], Det [54], and GRS-Det [37]), MS-Det outperformed them by 10.61%, 7.32%, 1.07%, and 0.64%, respectively, which indicated the superiority of our method in the ship detection task. The detection results on HRSC2016 are visualized in Figure 11. It can be noticed that the ship with a large aspect ratio, which increased the difficulty of network convergence, can be detected well, and the detected box gave a compact peripheral outline of the ship.

Table 7.
Comparisons results on the HRSC2016 data set. Data Aug. represents data augmentation.
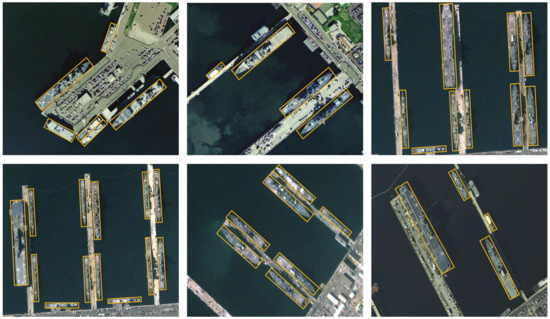
Figure 11.
Visualization of the detection results from MS-Det on HRSC2016.
5. Conclusions
In this paper, we abandoned the anchor mechanism and direct regression paradigm and proposed MS-Det, which tackled the prediction of bounding box scale and orientation via a successive coarse-granularity classification to fine-grained regression strategy in the discrete scale and angular sector space. Furthermore, we also designed a smooth angular-sector label to speed up the network’s convergence and dramatically improve the detection performance. In addition, to obtain a more accurate detection confidence, we adopted a localization-aided detection score that combined the category-classification score with localization sector-selection score. Extensive experimental results and ablation studies based on the DOTA, UCAS-AOD, and HRSC2016 data sets proved the effectiveness of our method in optical remote sensing arbitrarily oriented object detection. In future work, we will design a more lightweight and efficient backbone network to speed up the real-time performance of the detector for detecting oriented targets in optical remote sensing images.
Author Contributions
Methodology, L.H.; software, C.W.; validation, L.R.; formal analysis, L.H.; investigation, S.M.; resources, L.R.; data curation, S.M.; writing—original draft preparation, X.H.; writing—review and editing, X.H.; visualization, L.R.; supervision, S.M.; project administration, C.W.; and funding acquisition, L.H. All authors have read and agreed to the published version of the manuscript.
Funding
This work was supported in part by the National Natural Science Foundation of China, under Grant 61701524, and in part by the China Postdoctoral Science Foundation, under Grant 2019M653742.
Acknowledgments
The authors wish to thank the Editor and reviewers for their suggestions.
Conflicts of Interest
The authors declare no conflict of interest.
Appendix A
| Algorithm A1 Scale offset calculation procedure. |
| Input: : coordinates of the four vertexes of the input bounding box. : coordinates of the regression point associated with . |
| Output: regression scale offset target for four quadrants ; |
|
| Algorithm A2 Smooth angular-sector label generation. |
| Input: : each angular sector of the ground truth; the ground truth angle; |
| Parameter: smooth radius R = 5; angular-sector interval ; sector number M = 90 |
| Output: the smooth angular-sector label of |
|
References
- Ren, S.; He, K.; Girshick, R.; Sun, J. Faster r-cnn: Towards real-time object detection with region proposal networks. IEEE Trans. Pattern Anal. Mach. Intell. 2016, 39, 1137–1149. [Google Scholar] [CrossRef] [PubMed]
- Redmon, J.; Divvala, S.; Girshick, R.; Farhadi, A. You only look once: Unified, real-time object detection. In Proceedings of the IEEE Conference on Computer Vision and Pattern Recognition, Las Vegas, NV, USA, 27–30 June 2016; pp. 779–788. [Google Scholar]
- Liu, W.; Anguelov, D.; Erhan, D.; Szegedy, C.; Reed, S.; Fu, C.; Berg, A.C. Ssd: Single shot multibox detector. In Proceedings of the European Conference on Computer Vision (ECCV), Amsterdam, The Netherlands, 11–14 October 2016; pp. 21–37. [Google Scholar]
- Lin, T.Y.; Goyal, P.; Girshick, R.; He, K.; Dollár, P. Focal loss for dense object detection. In Proceedings of the IEEE International Conference on Computer Vision, Venice, Italy, 22–29 October 2017; pp. 2980–2988. [Google Scholar]
- Shi, F.; Zhang, T.; Zhang, T. Orientation-Aware Vehicle Detection in Aerial Images via an Anchor-Free Object Detection Approach. IEEE Trans. Geosci. Remote Sens. 2020, 1–13. [Google Scholar] [CrossRef]
- Yi, J.; Wu, P.; Liu, B.; Huang, Q.; Qu, H.; Metaxas, D. Oriented Object Detection in Aerial Images with Box Boundary-Aware Vectors. In Proceedings of the IEEE/CVF Winter Conference on Applications of Computer Vision, Snowmass Village, CO, USA, 1–5 March 2020; pp. 2150–2159. [Google Scholar]
- Wei, H.; Zhang, Y.; Chang, Z.; Li, H.; Wang, H.; Sun, X. Oriented objects as pairs of middle lines. ISPRS J. Photogramm. Remote Sens. 2020, 169, 268–279. [Google Scholar] [CrossRef]
- Qian, W.; Yang, X.; Peng, S.; Guo, Y.; Yan, J. Learning modulated loss for rotated object detection. arXiv 2019, arXiv:1911.08299. [Google Scholar]
- Wang, J.; Yang, W.; Li, H.C.; Zhang, H.; Xia, G.S. Learning Center Probability Map for Detecting Objects in Aerial Images. IEEE Trans. Geosci. Remote Sens. 2020, 59, 4307–4323. [Google Scholar] [CrossRef]
- Yang, X.; Yan, J. Arbitrary-Oriented Object Detection with Circular Smooth Label. arXiv 2020, arXiv:2003.05597. [Google Scholar]
- Dalal, N.; Triggs, B. Histograms of oriented gradients for human detection. In Proceedings of the 2005 IEEE Computer Society Conference on Computer Vision and Pattern Recognition (CVPR’05), San Diego, CA, USA, 20–25 June 2005; Volume 1, pp. 886–893. [Google Scholar]
- Lowe, D.G. Object recognition from local scale-invariant features. In Proceedings of the Seventh IEEE International Conference on Computer Vision, Kerkyra, Corfu, Greece, 20–25 September 1999; Volume 2, pp. 1150–1157. [Google Scholar]
- Felzenszwalb, P.F.; Girshick, R.B.; McAllester, D.; Ramanan, D. Object detection with discriminatively trained part-based models. IEEE Trans. Pattern Anal. Mach. Intell. 2009, 32, 1627–1645. [Google Scholar] [CrossRef]
- Girshick, R.; Donahue, J.; Darrell, T.; Malik, J. Rich feature hierarchies for accurate object detection and semantic segmentation. In Proceedings of the IEEE Conference on Computer Vision and Pattern Recognition, Columbus, OH, USA, 23–28 June 2014; pp. 580–587. [Google Scholar]
- Girshick, R. Fast r-cnn. In Proceedings of the IEEE International Conference on Computer Vision, Santiago, Chile, 7–13 December 2015; pp. 1440–1448. [Google Scholar]
- Cai, Z.; Vasconcelos, N. Cascade r-cnn: Delving into high quality object detection. In Proceedings of the IEEE Conference on Computer Vision and Pattern Recognition, Salt Lake City, UT, USA, 18–22 June 2018; pp. 6154–6162. [Google Scholar]
- Zhang, W.; Wang, S.; Thachan, S.; Chen, J.; Qian, Y. Deconv R-CNN for small object detection on remote sensing images. In Proceedings of the IGARSS 2018—2018 IEEE International Geoscience and Remote Sensing Symposium, Valencia, Spain, 22–27 July 2018; pp. 2483–2486. [Google Scholar]
- Yang, F.; Fan, H.; Chu, P.; Blasch, E.; Ling, H. Clustered object detection in aerial images. In Proceedings of the IEEE International Conference on Computer Vision, Seoul, Korea, 27–28 October 2019; pp. 8311–8320. [Google Scholar]
- Wang, J.; Wang, Y.; Wu, Y.; Zhang, K.; Wang, Q. FRPNet: A Feature-Reflowing Pyramid Network for Object Detection of Remote Sensing Images. IEEE Geosci. Remote Sens. Lett. 2020. [Google Scholar] [CrossRef]
- Chen, J.; Wan, L.; Zhu, J.; Xu, G.; Deng, M. Multi-scale spatial and channel-wise attention for improving object detection in remote sensing imagery. IEEE Geosci. Remote Sens. Lett. 2019, 17, 681–685. [Google Scholar] [CrossRef]
- Lu, X.; Zhang, Y.; Yuan, Y.; Feng, Y. Gated and Axis-Concentrated Localization Network for Remote Sensing Object Detection. IEEE Trans. Geosci. Remote Sens. 2019, 58, 179–192. [Google Scholar] [CrossRef]
- Xu, D.; Wu, Y. MRFF-YOLO: A Multi-Receptive Fields Fusion Network for Remote Sensing Target Detection. Remote Sens. 2020, 12, 3118. [Google Scholar] [CrossRef]
- Yin, R.; Zhao, W.; Fan, X.; Yin, Y. AF-SSD: An Accurate and Fast Single Shot Detector for High Spatial Remote Sensing Imagery. Sensors 2020, 20, 6530. [Google Scholar] [CrossRef] [PubMed]
- Sun, P.; Chen, G.; Shang, Y. Adaptive Saliency Biased Loss for Object Detection in Aerial Images. IEEE Trans. Geosci. Remote Sens. 2020, 58, 7154–7165. [Google Scholar] [CrossRef]
- Ruan, L.; Gao, B.; Wu, S.; Woo, W.L. DeftectNet: Joint loss structured deep adversarial network for thermography defect detecting system. Neurocomputing 2020, 417, 441–457. [Google Scholar] [CrossRef]
- Hu, B.; Gao, B.; Woo, W.L.; Ruan, L.; Jin, J.; Yang, Y.; Yu, Y. A Lightweight Spatial and Temporal Multi-Feature Fusion Network for Defect Detection. IEEE Trans. Image Process. 2020, 30, 472–486. [Google Scholar] [CrossRef]
- Liu, Z.; Hu, J.; Weng, L.; Yang, Y. Rotated region based CNN for ship detection. In Proceedings of the 2017 IEEE International Conference on Image Processing (ICIP), Beijing, China, 17–20 September 2017; pp. 900–904. [Google Scholar]
- Azimi, S.M.; Vig, E.; Bahmanyar, R.; Körner, M.; Reinartz, P. Towards multi-class object detection in unconstrained remote sensing imagery. In Proceedings of the Asian Conference on Computer Vision, Perth, Australia, 2–6 December 2018; pp. 150–165. [Google Scholar]
- Ding, J.; Xue, N.; Long, Y.; Xia, G.S.; Lu, Q. Learning RoI transformer for oriented object detection in aerial images. In Proceedings of the IEEE Conference on Computer Vision and Pattern Recognition, Long Beach, CA, USA, 16–20 June 2019; pp. 2849–2858. [Google Scholar]
- Zhang, Z.; Guo, W.; Zhu, S.; Yu, W. Toward arbitrarily oriented ship detection with rotated region proposal and discrimination networks. IEEE Geosci. Remote Sens. Lett. 2018, 15, 1745–1749. [Google Scholar] [CrossRef]
- Zhang, G.; Lu, S.; Zhang, W. Cad-net: A context-aware detection network for objects in remote sensing imagery. IEEE Trans. Geosci. Remote Sens. 2019, 57, 10015–10024. [Google Scholar] [CrossRef]
- Law, H.; Deng, J. Cornernet: Detecting objects as paired keypoints. In Proceedings of the European Conference on Computer Vision (ECCV), Munich, Germany, 8–14 September 2018; pp. 734–750. [Google Scholar]
- Duan, K.; Bai, S.; Xie, L.; Qi, H.; Huang, Q.; Tian, Q. Centernet: Keypoint triplets for object detection. In Proceedings of the IEEE International Conference on Computer Vision, Seoul, Korea, 27–28 October 2019; pp. 6569–6578. [Google Scholar]
- Chen, J.; Xie, F.; Lu, Y.; Jiang, Z. Finding Arbitrary-Oriented Ships From Remote Sensing Images Using Corner Detection. IEEE Geosci. Remote Sens. Lett. 2019, 17, 1712–1716. [Google Scholar] [CrossRef]
- Song, Q.; Yang, F.; Yang, L.; Liu, C.; Hu, M.; Xia, L. Learning Point-guided Localization for Detection in Remote Sensing Images. IEEE J. Sel. Top. Appl. Earth Obs. Remote Sens. 2020, 14, 1084–1094. [Google Scholar] [CrossRef]
- He, X.; Ma, S.; He, L.; Ru, L. High-Resolution Polar Network for Object Detection in Remote Sensing Images. IEEE Geosci. Remote Sens. Lett. 2020. [Google Scholar] [CrossRef]
- Zhang, X.; Wang, G.; Zhu, P.; Zhang, T.; Li, C.; Jiao, L. GRS-Det: An Anchor-Free Rotation Ship Detector Based on Gaussian-Mask in Remote Sensing Images. IEEE Trans. Geosci. Remote Sens. 2020, 59, 3518–3531. [Google Scholar] [CrossRef]
- Huang, L.; Yang, Y.; Deng, Y.; Yu, Y. Densebox: Unifying landmark localization with end to end object detection. arXiv 2015, arXiv:1509.04874. [Google Scholar]
- Tian, Z.; Shen, C.; Chen, H.; He, T. Fcos: Fully convolutional one-stage object detection. In Proceedings of the IEEE International Conference on Computer Vision, Thessaloniki, Greece, 23–25 September 2019; pp. 9627–9636. [Google Scholar]
- Lin, Y.; Feng, P.; Guan, J. Ienet: Interacting embranchment one stage anchor free detector for orientation aerial object detection. arXiv 2019, arXiv:1912.00969. [Google Scholar]
- Feng, P.; Lin, Y.; Guan, J.; He, G.; Shi, H.; Chambers, J. TOSO: Student’sT Distribution Aided One-Stage Orientation Target Detection in Remote Sensing Images. In Proceedings of the ICASSP 2020—2020 IEEE International Conference on Acoustics, Speech and Signal Processing (ICASSP), Barcelona, Spain, 4–8 May 2020; pp. 4057–4061. [Google Scholar]
- Xiao, Z.; Qian, L.; Shao, W.; Tan, X.; Wang, K. Axis Learning for Orientated Objects Detection in Aerial Images. Remote Sens. 2020, 12, 908. [Google Scholar] [CrossRef]
- Tychsen-Smith, L.; Petersson, L. Improving object localization with fitness nms and bounded iou loss. In Proceedings of the IEEE Conference on Computer Vision and Pattern Recognition, Salt Lake City, UT, USA, 18–22 June 2018; pp. 6877–6885. [Google Scholar]
- Jiang, B.; Luo, R.; Mao, J.; Xiao, T.; Jiang, Y. Acquisition of localization confidence for accurate object detection. In Proceedings of the European Conference on Computer Vision (ECCV), Munich, Germany, 8–14 September 2018; pp. 784–799. [Google Scholar]
- Zhu, B.; Song, Q.; Yang, L.; Wang, Z.; Liu, C.; Hu, M. CPM R-CNN: Calibrating Point-guided Misalignment in Object Detection. arXiv 2020, arXiv:2003.03570. [Google Scholar]
- Wu, S.; Li, X.; Wang, X. IoU-aware single-stage object detector for accurate localization. Image Vision Comput. 2020, 97, 103911. [Google Scholar] [CrossRef]
- He, K.; Zhang, X.; Ren, S.; Sun, J. Deep residual learning for image recognition. In Proceedings of the IEEE Conference on Computer Vision and Pattern Recognition, Las Vegas, NV, USA, 27–30 June 2016; pp. 770–778. [Google Scholar]
- Lin, T.Y.; Dollár, P.; Girshick, R.; He, K.; Hariharan, B.; Belongie, S. Feature pyramid networks for object detection. In Proceedings of the IEEE Conference on Computer Vision and Pattern Recognition, Honolulu, HI, USA, 21–26 July 2017; pp. 2117–2125. [Google Scholar]
- Xia, G.; Bai, X.; Ding, J.; Zhu, Z.; Belongie, S.; Luo, J.; Datcu, M.; Pelillo, M.; Zhang, L. DOTA: A large-scale dataset for object detection in aerial images. In Proceedings of the IEEE Conference on Computer Vision and Pattern Recognition, Salt Lake City, UT, USA, 18–22 June 2018; pp. 3974–3983. [Google Scholar]
- Liu, Z.; Wang, H.; Weng, L.; Yang, Y. Ship rotated bounding box space for ship extraction from high-resolution optical satellite images with complex backgrounds. IEEE Geosci. Remote Sens. Lett. 2016, 13, 1074–1078. [Google Scholar] [CrossRef]
- Zhu, H.; Chen, X.; Dai, W.; Fu, K.; Ye, Q.; Jiao, J. Orientation robust object detection in aerial images using deep convolutional neural network. In Proceedings of the 2015 IEEE International Conference on Image Processing (ICIP), Quebec City, QC, Canada, 27–30 September 2015; pp. 3735–3739. [Google Scholar]
- Yang, X.; Sun, H.; Fu, K.; Yang, J.; Sun, X.; Yan, M.; Guo, Z. Automatic Ship Detection of Remote Sensing Images from Google Earth in Complex Scenes Based on Multi-Scale Rotation Dense Feature Pyramid Networks. Remote Sens. 2018, 10, 132. [Google Scholar] [CrossRef]
- Bao, S.; Zhong, X.; Zhu, R.; Zhang, X.; Li, Z.; Li, M. Single Shot Anchor Refinement Network for Oriented Object Detection in Optical Remote Sensing Imagery. IEEE Access 2019, 7, 87150–87161. [Google Scholar] [CrossRef]
- Yang, X.; Liu, Q.; Yan, J.; Li, A.; Zhang, Z.; Yu, G. R3det: Refined single-stage detector with feature refinement for rotating object. arXiv 2019, arXiv:1908.05612. [Google Scholar]
- Ma, J.; Shao, W.; Ye, H.; Wang, L.; Wang, H.; Zheng, Y.; Xue, X. Arbitrary-oriented scene text detection via rotation proposals. IEEE Trans. Multimed. 2018, 20, 3111–3122. [Google Scholar] [CrossRef]
- Jiang, Y.; Zhu, X.; Wang, X.; Yang, S.; Li, W.; Wang, H.; Fu, P.; Luo, Z. R2cnn: Rotational region cnn for orientation robust scene text detection. arXiv 2017, arXiv:1706.09579. [Google Scholar]
- Yang, X.; Yang, J.; Yan, J.; Zhang, Y.; Zhang, T.; Guo, Z.; Sun, X.; Fu, K. Scrdet: Towards more robust detection for small, cluttered and rotated objects. In Proceedings of the IEEE International Conference on Computer Vision, Thessaloniki, Greece, 23–25 September 2019; pp. 8232–8241. [Google Scholar]
- Xu, Y.; Fu, M.; Wang, Q.; Wang, Y.; Chen, K.; Xia, G.S.; Bai, X. Gliding vertex on the horizontal bounding box for multi-oriented object detection. IEEE Trans. Pattern Anal. Mach. Intell. 2020, 43, 1452–1459. [Google Scholar] [CrossRef] [PubMed]
- Liu, Z.; Yuan, L.; Weng, L.; Yang, Y. A high resolution optical satellite image dataset for ship recognition and some new baselines. In Proceedings of the International Conference on Pattern Recognition Applications and Methods, Porto, Portugal, 24–26 February 2017; Volume 2, pp. 324–331. [Google Scholar]
- Simonyan, K.; Zisserman, A. Very deep convolutional networks for large-scale image recognition. In Proceedings of the International Conference on Learning Representations, San Diego, CA, USA, 7–9 May 2015; pp. 1–14. [Google Scholar]
- Liao, M.; Zhu, Z.; Shi, B.; Xia, G.S.; Bai, X. Rotation-Sensitive Regression for Oriented Scene Text Detection. In Proceedings of the IEEE Conference on Computer Vision and Pattern Recognition (CVPR), Salt Lake City, UT, USA, 18–22 June 2018. [Google Scholar]
Publisher’s Note: MDPI stays neutral with regard to jurisdictional claims in published maps and institutional affiliations. |
© 2021 by the authors. Licensee MDPI, Basel, Switzerland. This article is an open access article distributed under the terms and conditions of the Creative Commons Attribution (CC BY) license (https://creativecommons.org/licenses/by/4.0/).