Abstract
This paper analyses the radiance reflectance modelling of a sea area and the case of a water column polluted with an oil emulsion in relation to various depths of the occurrence of an oil-in-water emulsion in all azimuth and zenith angles. For the radiance reflectance modelling, the simulation of large numbers of solar photons in water was performed using a Monte Carlo simulation. For the simulations, the optical properties of seawater for the open sea typical of the southern Baltic Sea were used and Petrobaltic-type crude oil (extracted in the Baltic Sea) was added. Oil pollution in the sea was considered for oil droplet concentrations of 10 ppm, which were optically represented by spectral waveforms of absorption and scattering coefficients, as well as by angular light scattering distribution determined using the Mie theory. The results of the radiance reflectance modelling in the whole spectrum of both angles, azimuth and zenith, allowed us to select 555 nm as the optimal wavelength for oil emulsion detection. Moreover, the parameter contrast was defined and determined using radiance reflectance results for eight light wavelengths in the range of 412-676 nm. The contrast is discussed in relation to the various thicknesses of polluted water layers. Changes in contrast for a thickness layer 5 m under the sea surface were noted, whereas for thicker layers the contrast remained unchanged.
1. Introduction
Over the last few decades, a wide range of scientific literature has indicated that oil substance occurrence in the marine environment creates an unfavourable situation due to the threat posed to the natural seawater ecosystem. The problem of large oil spills is well known—for example, there was a very large oil spill in the Gulf of Mexico in 2010. After that oil spill, various space-borne remote sensors were investigated as possibly suitable for oil detection or oil slick tracking [1,2,3,4,5,6]. Fortunately, there have been fewer oil spills lately. Moreover, international conventions such as MARPOL [7], restrictive maritime law controlled by the European Maritime Safety Agency (EMSA) [8] and the Helsinki Commission (HELCOM) [9], and the technological development of the sea fleet have reduced the frequency of oil spills at sea. However, the development of maritime transport, the construction of offshore pipelines, and the exploration and production of crude oil and natural gas increase the likelihood of oil discharges occurring in the sea space. This may involve crude oil and its products, or fuels and consumables used in marine engine rooms. Leaks from pipelines and mining equipment also cannot be ruled out. There are also natural seabed seepages. Therefore, the prevention, detection, and combatting of oil spills play an important role in the protection of the marine ecosystem.
The efficacy of the detection of oil in seawater depends on several factors, such as the form or amount of oil in the water, the weathering state, and the scale of the oil spill. Remote sensing methods for oil detection use a wide range of devices, such as photography from airborne platforms, ultraviolet and infrared imaging, and laser fluorosensors. If an oil spill is visible on the sea surface, the most effective methods for quick oil detection and to assess the scale of the spillage would be space-borne or airborne remote detection [10]. Even if weather conditions are unfavourable or problems occur during the night, remote sensing using Synthetic Aperture Radar (SAR) is possible, albeit with limited reliability, depending on the state of the sea surface [11,12]. It is particularly challenging if oil pollution is present in the water column and the effectiveness of receiving information about the processes in the water column is reduced by glints of sunlight. Oil in a dispersed form appears in the water column as a consequence of natural environmental conditions such as wind and waves. Oil leaking from underwater transfer installations is also possible. The use of chemical substances that increase dispersion in the water column cannot be ruled out. Dispersed oil in the water column can also be detected by immersion oil sensors [13,14,15] and above-water sensors analysing the light coming out of the sea [16]. Moreover, the process of light transfer in the water column caused by oil dispersion in the water column causes oil to manifest itself by colour changes in the ocean and it is possible to determine whether these colour changes are caused by the presence of dispersed oil [17,18].
In the marine environment, continuous monitoring using remote methods for testing the biological constituents of seawater is often carried out [19]. However, oil pollution present in seawater can disturb the data readings of natural constituents such as chlorophyll. Therefore, it is necessary to extend the data for algorithms, taking into account the oil present in seawater. An oil film occurring on the water surface is not a problem, although it would be a serious problem if dispersed oil was present deep in the water column. In that case, oil is not visible to the naked eye, but the light transfer from the water column above the sea surface is modified to some extent. Exploring the contrast between unpolluted and polluted seawater using dispersed oil present in the water column is the goal of this paper. Previously, the issue of optical contrast was discussed in several papers [20,21]. However, the novelty of the current paper is the study of the influence of the thickness of a dispersed oil cloud in the water column on the light field above the sea surface. In this paper, Monte Carlo simulations were used to model the radiance field above the sea surface disturbed from the dispersed oil present in a water column. This paper is a continuation of the authors’ previous papers [22,23], in which the influence of dispersed oil on the spectral composition of reflected light was discussed in relation to the wide range of possible viewing angles. This paper presents the results of the contrast for dispersed oil in a water column, determined over a wide range of nadir and azimuth angles. The contrast was determined for various light wavelengths and various thicknesses of a water layer polluted with dispersed oil.
2. Materials and Methods
2.1. Scheme of Modelling of Light Conditions in the Marine Environment
The light conditions used in this paper include above-sea downward irradiance consisting of light coming from the sky hemisphere and light falling on the sea surface from the direction of the sun (details in Table 1) shaping the spatial and directional distribution of radiance in the water column and shaping the upward distribution of radiance above the water surface, all for different wavelengths of light. The distribution of radiance in the water column and the upward radiance above the water surface are determined by the simulation of the migration and destination of a large number of solar photons entering the sea surface.

Table 1.
Direct and diffuse solar irradiance contributions for various light wavelengths (RADTRAN model developed by Gregg and Calder [24]).
To obtain the contrast as a tool for assessing the limit of visibility of oil in seawater, the three previous stages of action presented in Figure 1 should be performed. First, an optical model of the sea surface covering the refractive index of the seawater and the statistical distribution of the slopes of wind-generated surface waves is created. The optical water column model includes the Inherent Optical Properties (IOPs) of water at various depths in the southern Baltic Sea region.
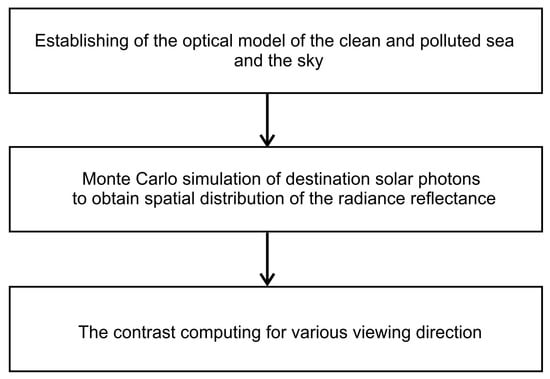
Figure 1.
Stages of activities aimed at determining the visibility of a cloud of oil droplets dispersed in seawater.
If there are oil droplets in the sea, the IOPs of the oil-in-water emulsion are attached to the optical model (details in Figure 2).
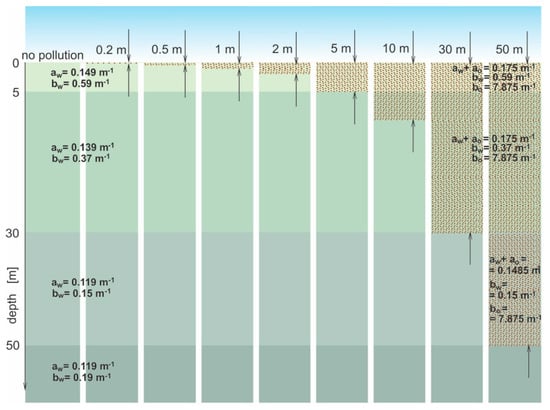
Figure 2.
Scheme of the optical model of sea basin for various thicknesses of oil droplet clouds for a chosen wavelength (555 nm) applied for Monte Carlo simulations.
Taking into account the sea model described above, the second stage can be performed—i.e., the simulation of the course of a large number of photons—thus obtaining the directional distribution of radiance reflectance for different wavelengths of light. In turn, in the third stage, with these distributions, it is possible to establish the optical contrast between the clean and polluted sea area.
2.2. Solar Irradiance Distribution
Models of direct and diffused solar irradiance for considered wavelengths are presented in Table 1. To obtain the value of both of these quantities, the RADTRAN model developed by Gregg and Calder was applied [24].
2.3. Sea Basin Model with Oil-in-Water Emulsion Used for Modelling
A model of the sea basin and the same basin but polluted with oil is presented in Figure 2. The model of the sea basin was divided into four layers with appropriate thicknesses. The thicknesses of the layers of the sea basin model have been covered by literature data on the inherent optical properties of seawater, such as the absorption coefficient and the scattering coefficient typical for open waters (Figure 2) of the Baltic Sea. The details are taken from Sagan’s publication [25]. These data refer to water in the area delineated by the border of the Polish Exclusive Economic Zone, excluding the Gulf of Gdańsk and the Bay of Pomerania (see Figure 3). The particular layers of seawater for four appropriate thicknesses are described by optical properties: the absorption coefficients—aw(λ)—specific to four particular layers of the sea; scattering coefficients—bw(λ)—specific for four particular layers; and βw(λ)—the scattering phase function—for the simulations, one of Petzold’s functions—i.e., the “costal ocean” type—was used [26]. A comparison of the shape of the angular scattering function according to Petzold with an example of the function for an oil emulsion can be found in this paper [27]. The shapes of the phase functions of the oil emulsion (for various wavelengths and different types of oils) are presented in this paper [28]. However, the oil-in-water emulsion in the model was located at the start of the seawater surface and the depth of the oil layer was partially changed to 0.2 m, 0.5 m, 1 m, 2 m, 5 m, 10 m, 30 m, and 50 m. The oil-in-water emulsion in seawater is described by its optical properties, such as the absorption coefficient of oil ao(λ), the scattering coefficient bo(λ), and the scattering phase function of oil βo(λ) typical for this particular kind of oil. Figure 2 presents an optical model of the sea basin with example optical properties for a 555 nm wavelength used to simulate photon destinations.
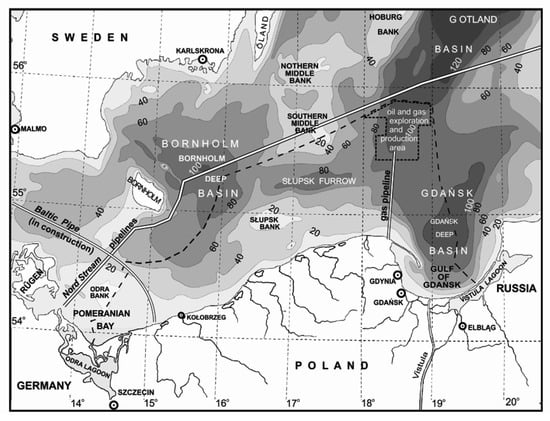
Figure 3.
The area of the Baltic Sea where the actual optical properties used in this paper were determined.
2.4. Optical Properties of Seawater
To perform Monte Carlo simulations, the optical parameters of seawater were used, which took into account the sea model described above. The absorption coefficients of seawater—aw(λ)—specific for four particular layers of the sea and the considered wavelength are presented in Table 2. The scattering coefficients of seawater—bw(λ)—specific for four particular layers and for the considered wavelength are presented in Table 3.

Table 2.
Absorption coefficient aw of seawater free of oil droplets for various light wavelengths at various sea depths for the open sea [25].

Table 3.
Scattering coefficient (bw) of seawater free of oil droplets for various light wavelengths at various sea depths for open sea [25].
2.5. Optical Properties of oil Dispersed in the Water Column
To determine the optical parameters of seawater polluted by dispersed oil, the sea model described above was used. The absorption coefficients of seawater polluted by oil—ao(λ)—specific for four particular layers of the sea and for the considered wavelength are presented in Table 4. The scattering coefficients of seawater polluted by oil—bo(λ)—specific for four particular layers and for the considered wavelength are presented in Table 5.

Table 4.
Absorption coefficient ao of oil droplets for Petrobaltic-type crude oil dispersed in seawater at a concentration of 10 ppm for various light wavelengths.

Table 5.
Scattering coefficient bo of oil droplets for Petrobaltic-type crude oil dispersed in seawater at a concentration of 10 ppm for various light wavelengths.
3. Results and Discussion
Figure 4b–f present the results of radiance reflectance modelling for various thicknesses of oil-polluted water (10 ppm), for an example wavelength of 555 nm and a sea surface condition corresponding to a wind speed of 5 m/s (according to the Cox and Munk algorithm [29]). Figure 4a presents the results for seawater free of oil. The results of the values of radiance reflectance from light diffused in a water column and a sky light reflected from the sea surface are visible for the case of no oil pollution shown in Figure 4a. The influence of dispersed oil in a water column on the values of radiance reflectance are presented in Figure 4b–f for various thicknesses (0.2 m, 0.5 m, 1 m, 2 m, and 50 m) of the oil-polluted layer. Changes in values of radiance reflectance in the case where there is no oil pollution in relation to the dispersed oil are visible for a polluted layer with a thickness of 0.2 m. Moreover, in Figure 4b–f the changes in radiance reflectance are visible for a thickness of 2 m. For greater thicknesses, the differences in values of radiance reflectance are not as visible, while the radiance reflectance values are negligible for thicknesses greater than 10 m.
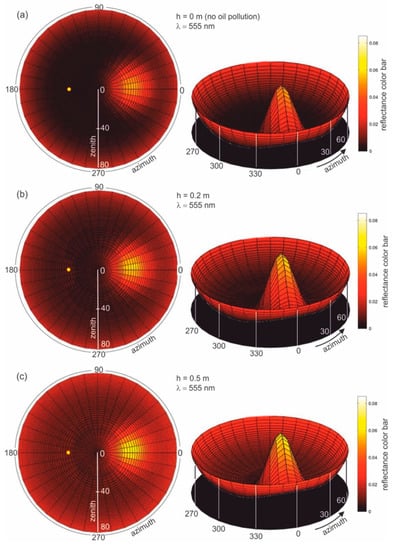
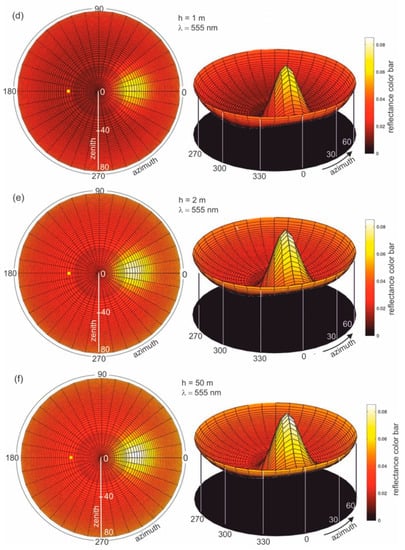
Figure 4.
Radiance reflectance values in cylindrical coordinates (left side—2D maps; right side—3D contour maps) for the example wavelength λ = 555 nm determined from the Monte Carlo simulations for cases where there is (a) no oil pollution in seawater and seawater polluted by oil for a 10 ppm oil concentration for a different thickness (b–f) of a layer of oil dispersed in seawater: the yellow spot marked on the left side of the 2D maps refers to the sun position, as described by the zenith angle θ = 30° and azimuth angle φ = 180°.
The radiance reflectance for the selected azimuth angles is shown in Figure 5. The reflectance maximum is located near the direction of the spectacular reflection of light coming directly from the sun. However, it depends on the actual viewing azimuth angle.
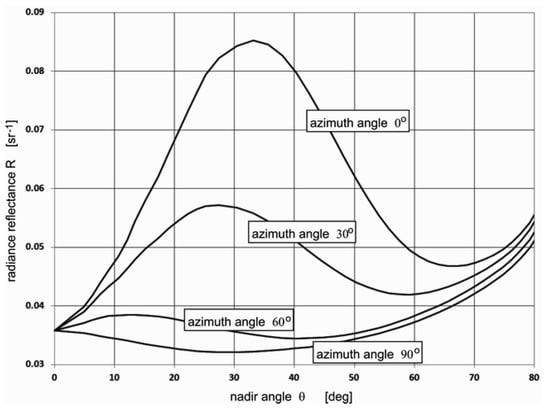
Figure 5.
Radiance reflectance vs. nadir angle for chosen azimuth angle. Sun position: zenith. θ = 30°, azimuth φ = 180°.
The current study aimed to determine the possibility of detecting oil dispersed in seawater corresponding to the optimal wavelength when viewing the sea surface under the zenith angle θ and the azimuth angle φ. Therefore, based on the results obtained for the radiance reflectance L(θ,φ), the parameter radiance reflectance contrast C(θ,φ) was defined. The definition of the radiance reflectance contrast C(θ,φ) is described by Formula 1 as the quotient of the difference in radiance reflectance above the unpolluted seawater Lseawater(θ,φ) and the radiance reflectance of the oil-polluted seawater Loil(θ,φ) to the sum of the radiance reflectance above the unpolluted seawater Lseawater(θ,φ) and the radiance reflectance of the oil-polluted seawater Loil(θ,φ).
where C(θ,φ) is contrast, is the radiance above the unpolluted seawater, and is the radiance above the seawater polluted by oil.
To determine the optimal wavelength suitable for dispersed oil detection in seawater, the calculation of the contrast parameter for the thickness of the layer with dispersed oil in seawater of 50 m was first performed. Figure 6a–h presents the results of the calculations of contrast C(θ,φ) for eight wavelengths (412 nm, 440 nm, 488 nm, 510 nm, 532 nm, 555 nm, 650 nm, and 676 nm, respectively).
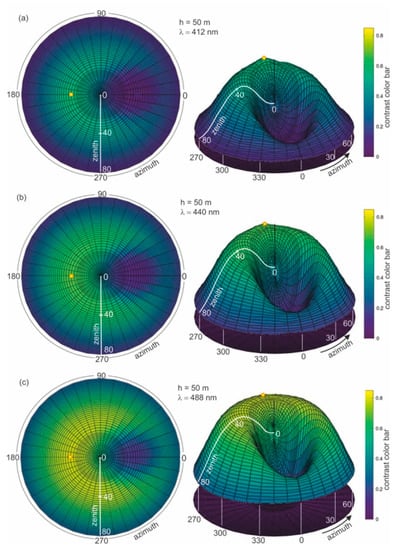
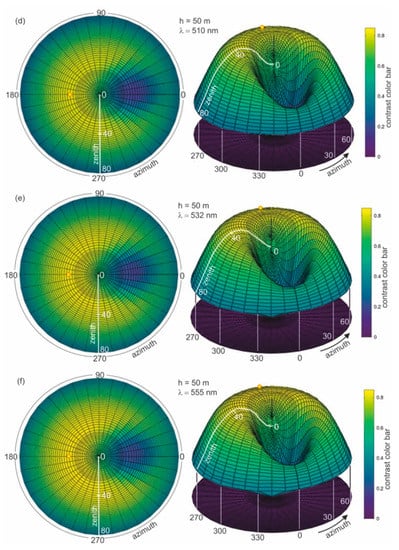
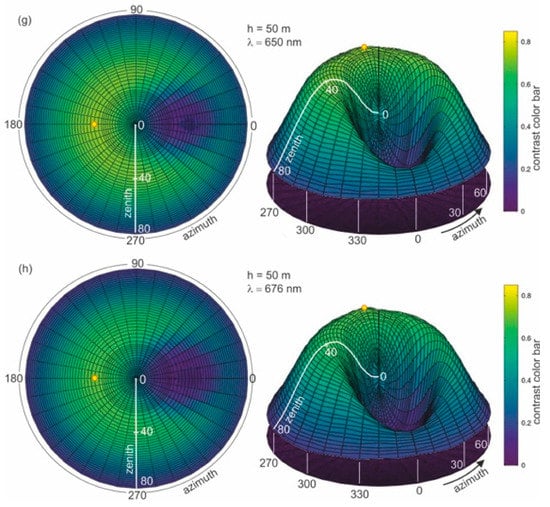
Figure 6.
Contrast of radiance reflectance values C(θ,φ) in cylindrical coordinates (left side—2D maps; right side—3D contour maps) for various wavelengths (λ) determined for seawater polluted by oil in a 10 ppm oil concentration and a depth of oil dispersed in seawater h = 50 m and a wind speed of 5 m/s, respectively.
In Figure 6a–h, the results of the radiance reflectance contrast C(θ,φ) are presented in cylindrical coordinates (θ,φ) for 45 zenith angles and 36 azimuth angles. The obtained results for the contrast of radiance reflectance C(θ,φ) indicate the influence of wavelengths. The values of contrast increase with the values of wavelengths. However, in Figure 6f it can be seen that the contrast becomes weaker when observed at wavelengths above 555 nm. To select the optimal wavelength value for the depth of oil detection in seawater, the determined results for contrast were presented for selected observation angles θ = 0° and θ = 30° for φ = 180°. The contrast results for the selected angles θ = 0° and θ = 30° are presented in Figure 7 as a function for selected wavelengths 412 nm, 440 nm, 488 nm, 510 nm, 532 nm, 555 nm, 650 nm, and 680 nm, respectively. The results presented in Figure 7 confirm that 555 nm is the optimal wavelength for dispersed oil detection.
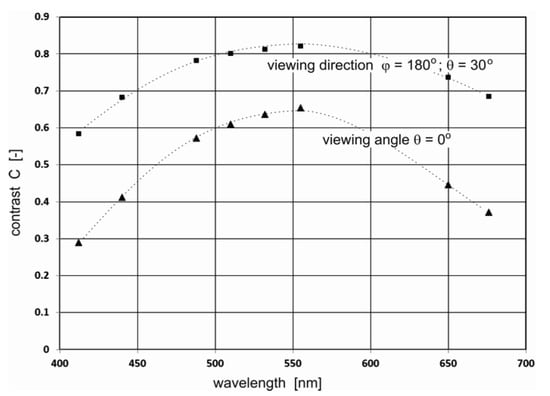
Figure 7.
Contrast of radiance reflectance values C(θ,φ) as a function for selected wavelengths 412 nm, 440 nm, 488 nm, 510 nm, 532 nm, 555 nm, 650 nm, and 676 nm for the selected viewing direction for seawater polluted by oil at a depth of 50 m for a 10 ppm oil concentration and a wind speed of 5 m/s.
In the next step, an analysis of the role of the thickness of the water layer polluted with dispersed oil is performed. The contrast of radiance reflectance C(θ,φ) for different depths of dispersed oil in seawater (0.2 m, 0.5 m, 1 m, 5 m, 10 m, 20 m, and 50 m), for the previously established optimal wavelength of 555 nm was calculated. Figure 8a–h present the results of calculations of the radiance reflectance contrast C(θ,φ) for various thicknesses of the layer polluted with dispersed oil. The obtained results for the contrast of radiance reflectance C(θ,φ) indicate the changes in values in relation to the depths of polluted water. The contrast values increase along with the depths of dispersed oil up to 5 m (see Figure 8e) and remain unchanged for further thicknesses of the contaminated layer (Figure 8f–h). The contrast results for the selected angles θ = 0°, θ = 30° for φ = 180° (in the plane of incidence of sunlight) as a function of the thickness of the polluted layer are presented in Figure 9. It appears that it would be more useful to observe the sea surface from the direction of the sun rays than from a perpendicular direction.
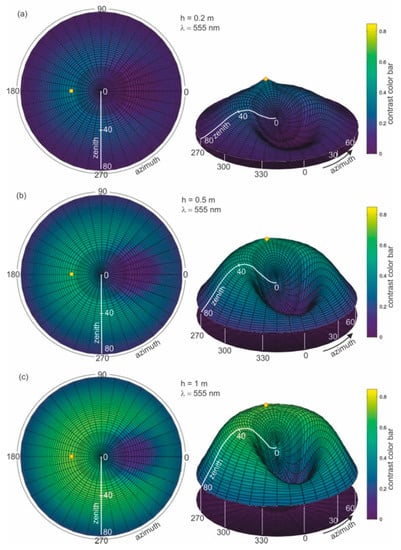
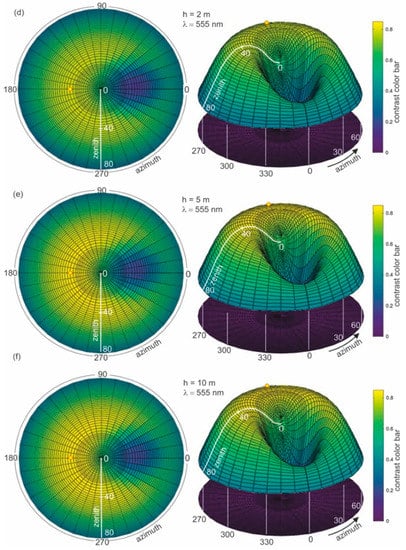
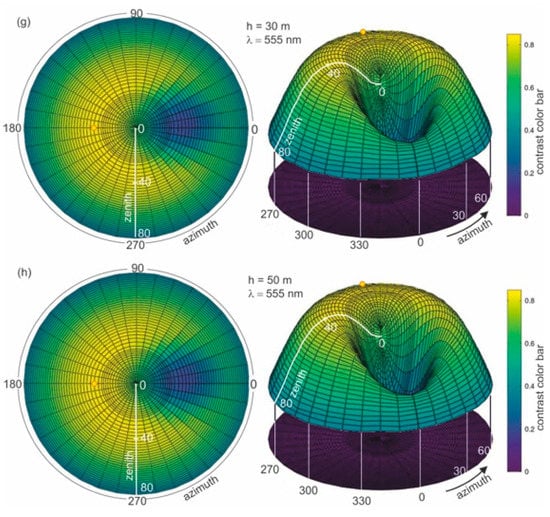
Figure 8.
Contrast of radiance reflectance values C(θ,φ) in cylindrical coordinates (left side—2D maps; right side—3D contour maps) for different depths (a–h) of dispersed oil in seawater, determined for a selected wavelength of 555 nm, a 10 ppm oil concentration, and a wind speed of 5 m/s.
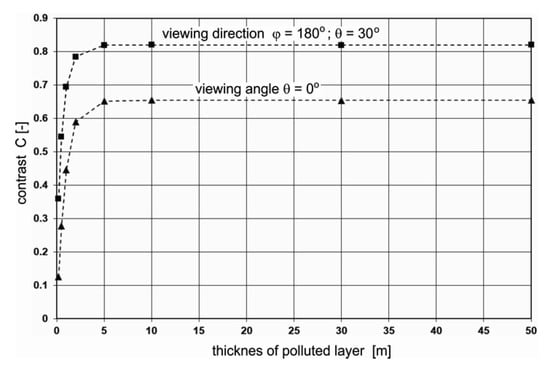
Figure 9.
Contrast of radiance reflectance values C(θ,φ) as a function of dispersed oil in seawater depths of 0.2 m, 0,5 m, 1 m, 5 m, 10 m, 30 m, and 50 m for the selected viewing direction at a wavelength of 555 nm, a 10 ppm oil concentration, and a wind speed of 5 m/s.
4. Conclusions
Monte Carlo simulations of photon migration in a marine environment and the final fate of photons passing to the atmosphere were used to determine radiance reflectance as the data to calculate the optical contrast between a clean sea area and a polluted area with an oil-in-water emulsion for a relatively low concentration (10 ppm). Radiance reflectance modelling for the whole spectrum of azimuth angles and zenith angles was performed to obtain information about the optimal angles for the optical detection of oil sunk under the sea surface. Moreover, the modelling of radiance reflectance was performed to select the optimal wavelength for the sea surface to be viewed. For the given sea area (southern Baltic Sea) and kind of oil (Petrobaltic type extracted from the bottom of the Baltic Sea), our results indicate that 555 nm is a suitable wavelength.
Moreover, the influence of the thickness of the contaminated water layer on the possibility of the optical detection of the presence of oil in seawater was analysed. An analysis of the results indicated that for a concentration of 10 ppm, detection is already possible for a contaminated layer thickness of 0.2 m. An increase to above 5 m in layer thickness does not influence the contrast value change and shows that the possibility of detecting the dispersed oil cloud does not change.
The most favourable situation for the detection of oil dispersed in the sea happened when the observation of the sea was made from the direction of the sun. An observation perpendicular to the sea surface also produced good results, although the contrast value was several dozen percent lower.
The obtained results confirm that it is possible to detect clouds of oil dispersed in water by using the optical contrast observed at a specific wavelength of oil-polluted water masses against a surrounding clean contrast. There is currently no information as to whether analogous conclusions could be drawn for sea areas with different optical properties, other oils, or other optical models of the upper sky hemisphere. Undertaking similar actions to those described in this paper but in other regions of the ocean is associated with the need to establish water IOPs in these regions. The optical parameters of the water used in this paper are representative of a semi-open sea with a relatively low transparency. Moreover, the data characterizing the optical model of the sea come from the summer season. In the remaining seasons of the year, since the water transparency is better, it can be assumed that the detection of dispersed oil clouds could be easier.
Author Contributions
Conceptualization, Z.O., E.B. and J.P.; methodology, Z.O.; formal analysis, Z.O.; investigation, E.B. and Z.O.; data curation, E.B. and Z.O.; software, J.P., writing—original draft preparation, E.B.; writing—review and editing, Z.O.; visualization, E.B. and Z.O. All authors have read and agreed to the published version of the manuscript.
Funding
This research received no external funding.
Acknowledgments
This paper was supported by Gdynia Maritime University grant No. WM/2021/PZ/05 and IOPAN statutory Task I.3.
Conflicts of Interest
The authors declare no conflict of interest.
References
- Zhou, Z.; Guo, L.; Shiller, A.M.; Lohrenz, S.; Asper, V.L.; Osburn, C. Characterization of oil components from the Deepwater Horizon oil spill in the Gulf of Mexico using fluorescence EEM and PARAFAC techniques. Mar. Chem. 2013, 148, 10–21. [Google Scholar] [CrossRef]
- Hou, Y.; Li, Y.; Liu, B.; Liu, Y.; Wang, T. Design and Implementation of a Coastal-Mounted Sensor for Oil Film 5 Detection on Seawater. Sensors 2017, 18, 70. [Google Scholar] [CrossRef] [PubMed]
- Hu, C.; Weisberg, R.H.; Liu, Y.; Zheng, L.; Daly, K.L.; English, D.; Zhao, J.; Vargo, G.A. Did the northeastern Gulf of Mexico become greener after the Deepwater Horizon oil spill? Geophys. Res. Lett. 2011, 38, L09601. [Google Scholar] [CrossRef]
- Leifer, I.; Lehr, W.J.; Simecek-Beatty, D.; Bradley, E.; Clark, R.; Dennison, P.E.; Hu, Y.; Matheson, S.; Jones, C.E.; Holt, B.; et al. State of the art satellite and airborne marine oil spill remote sensing: Application to the BP Deepwater Horizon oil spill. Remote Sens. Environ. 2012, 124, 185–209. [Google Scholar] [CrossRef]
- Sun, S.; Lu, Y.; Liu, Y.; Wang, M.; Hu, C. Tracking an Oil Tanker Collision and Spilled Oils in the East China Sea Using Multisensor Day and Night Satellite Imagery. Geophys. Res. Lett. 2018, 45, 3212–3220. [Google Scholar] [CrossRef]
- Schifter, I.; Sánchez-Reyna, G.; González-Macías, C.; Salazar-Coria, L.; González-Lozano, C. Fluorescence characteristics in the deep waters of South Gulf of México. Mar. Pollut. Bull. 2017, 123, 165–174. [Google Scholar] [CrossRef]
- IMO. The International Convention for the Prevention of Pollution from Ships (MARPOL), 1973 as Modified by the Protocol of 1978. Available online: http://www.imo.org/en/About/conventions/listofconventions/pages/international-convention-for-the-prevention-of-pollution-from-ships-(marpol).aspx (accessed on 22 March 2021).
- European Maritime Safety Agency (EMSA). Available online: http://emsa.europa.eu/csn-menu/csn-service.html (accessed on 1 July 2020).
- Migliaccio, M.; Gambardella, A.; Tranfaglia, M. SAR Polarimetry. To Observe Oil Spills. IEEE Trans. Geosci. Remote Sens. 2007, 45, 506–511. [Google Scholar] [CrossRef]
- Hu, C.; Feng, L.; Holmes, J.; Swayze, G.A.; Leifer, I.; Melton, C.; García, O.; Macdonald, I.; Hess, M.; Muller-Karger, F.; et al. Remote sensing estimation of surface oil volume during the 2010 Deepwater Horizon oil blowout in the Gulf of Mexico: Scaling up AVIRIS observations with MODIS measurements. J. Appl. Remote Sens. 2018, 12, 026008. [Google Scholar] [CrossRef]
- Fingas, M.; Brown, C.E. Oil Spill Remote Sensing. In Handbook of Oil Spill Science and Technology; Wiley: Hoboken, NJ, USA, 2015; pp. 311–356. [Google Scholar]
- Fingas, M.; Brown, C.E. A review of Oil Spill Remote Sensing. Sensors 2018, 18, 91. [Google Scholar] [CrossRef] [PubMed]
- Baszanowska, E.; Otremba, Z. Fluorometric index for sensing oil in the sea environment. Sensors 2017, 17, 1276. [Google Scholar] [CrossRef] [PubMed]
- Baszanowska, E.; Otremba, Z. Detecting the Presence of Different Types of Oil in Seawater Using a Fluorometric Index. Sensors 2019, 19, 3774. [Google Scholar] [CrossRef] [PubMed]
- Baszanowska, E.; Otremba, Z. Fluorometry in application to the fingerprint of petroleum products present in the natural waters. J. Eur. Opt. Soc. Rapid Publ. 2016, 12, 16. [Google Scholar] [CrossRef]
- Wang, Y.; Thanyamanta, W.; Bulger, C.; Bose, N.; Hwang, J. Microbubbles as proxies for oil spill delineation in field tests. J. Mar. Sci. Eng. 2021, 9, 126. [Google Scholar] [CrossRef]
- Otremba, Z.; Król, T. Modelling of the crude oil suspension impact on inherent optical parameters of the coastal seawater. Pol. J. Environ. Stud. 2002, 11, 407–411. [Google Scholar]
- Haule, K.; Freda, W.; Darecki, M.; Toczek, H. Possibilities of optical remote sensing of dispersed oil in coastal waters. Estuar. Coast. Shelf Sci. 2017, 195, 76–89. [Google Scholar] [CrossRef]
- Miranda, M.L.; Mustaffa, N.I.H.; Robinson, T.-B.; Stolle, C.; Ribas-Ribas, M.; Wurl, O.; Zielinski, O. Influence of solar radiation on biogeochemical parameters and fluorescent dissolved organic matter (FDOM) in the sea surface microlayer of the southern coastal North Sea. Elem. Sci. Anthr. 2018, 6, 15. [Google Scholar] [CrossRef]
- Otremba, Z. Influence of oil dispersed in seawater on the bi-directional reflectance distribution function (BRDF). Opt. Appl. 2005, 35, 99–109. [Google Scholar]
- Otremba, Z.; Zielinski, O.; Hu, C. Optical contrast of oil dispersed in seawater under windy conditions. J. Eur. Opt. Soc. Rapid Publ. 2013, 8, 13051. [Google Scholar] [CrossRef]
- Baszanowska, E.; Otremba, Z.; Piskozub, J. Modelling Remote Sensing Reflectance to Detect Dispersed Oil at Sea. Sensors 2020, 20, 863. [Google Scholar] [CrossRef] [PubMed]
- Baszanowska, E.; Otremba, Z.; Piskozub, J. Modelling a Spectral Index to Detect Dispersed Oil in a Seawater Column Depending on the Viewing Angle: Gulf of Gdańsk Case Study. Sensors 2020, 20, 5352. [Google Scholar] [CrossRef] [PubMed]
- Gregg, W.W.; Carder, K.L. A simple spectral solar irradiance model for cloudless maritime atmospheres. Limnol. Oceanogr. 1990, 35, 1657–1675. [Google Scholar] [CrossRef]
- Sagan, S. The inherent water optical properties of Baltic waters. In Rozprawy i Monografie; IOPAN Sopot: Sopot, Poland, 2008; p. 244. (In Polish) [Google Scholar]
- Petzold, T.J. Volume Scattering Functions for Selected Ocean Waters; SIO Ref. 72–78; Scripps Institution of Oceanography, University of California: San Diego, CA, USA, 1972. [Google Scholar]
- Otremba, Z. Modeling of the light transfer in a water column polluted with oil suspension. J. Eur. Opt. Soc. Rapid Publ. 2013, 8, 13067. [Google Scholar] [CrossRef]
- Otremba, Z.; Piskozub, J. Phase functions of oil-in-water emulsions. Opt. Appl. 2004, 34, 93–99. [Google Scholar]
- Cox, C.; Munk, W.H. Statistics of the sea surface derived from sun glitter. J. Mar. Res. 1954, 13, 198–227. [Google Scholar]
Publisher’s Note: MDPI stays neutral with regard to jurisdictional claims in published maps and institutional affiliations. |
© 2021 by the authors. Licensee MDPI, Basel, Switzerland. This article is an open access article distributed under the terms and conditions of the Creative Commons Attribution (CC BY) license (https://creativecommons.org/licenses/by/4.0/).