
Remote Sensing Image Augmentation Based on Text Description for Waterside Change Detection


Abstract
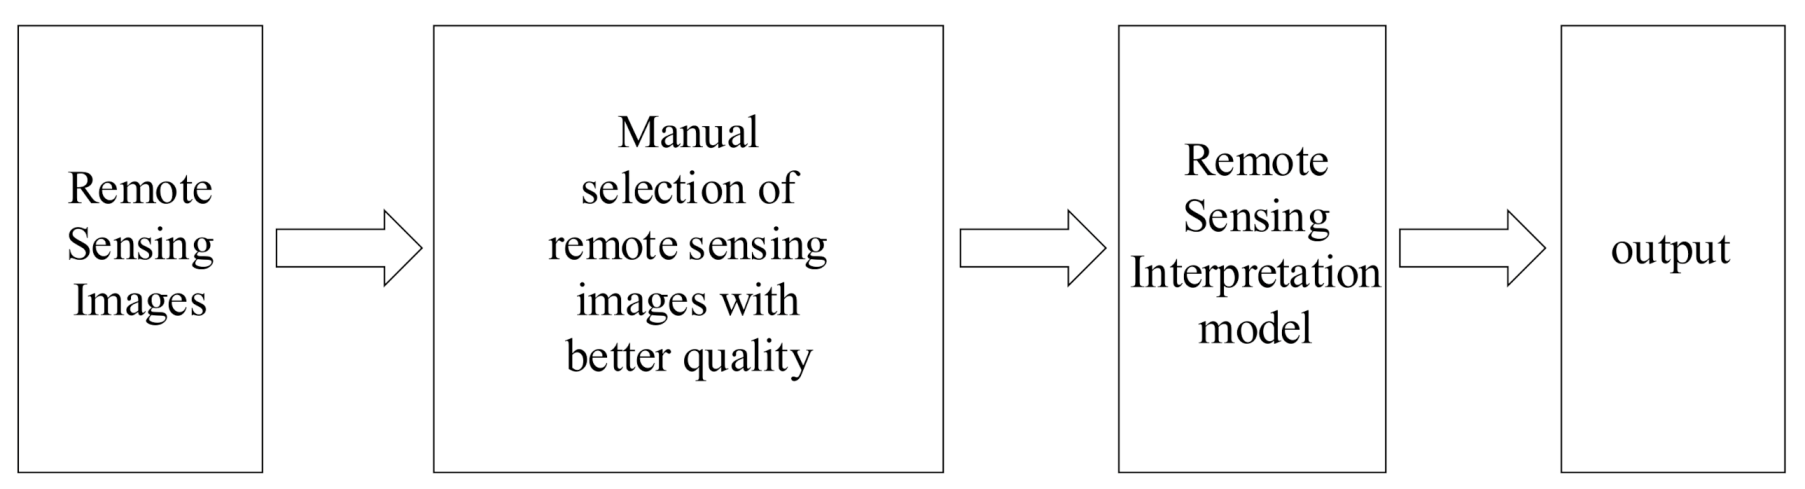
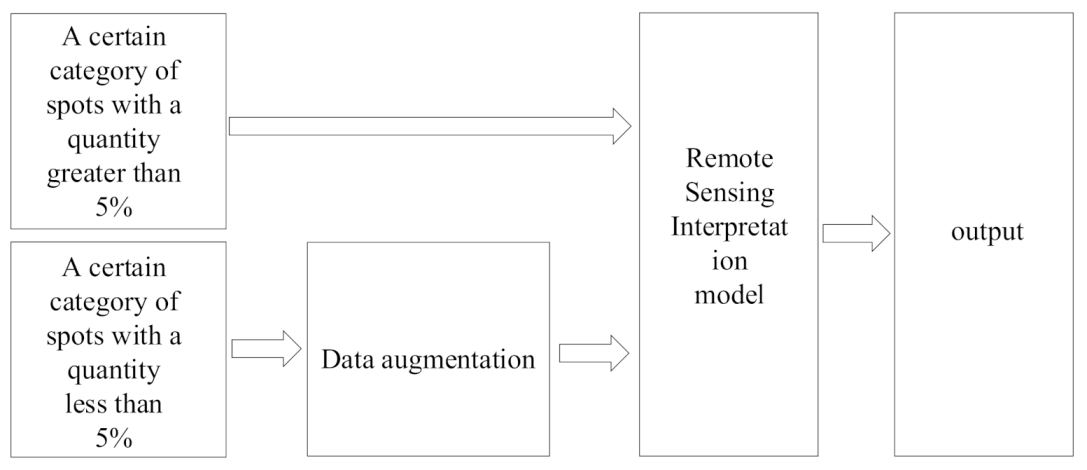
1. Introduction
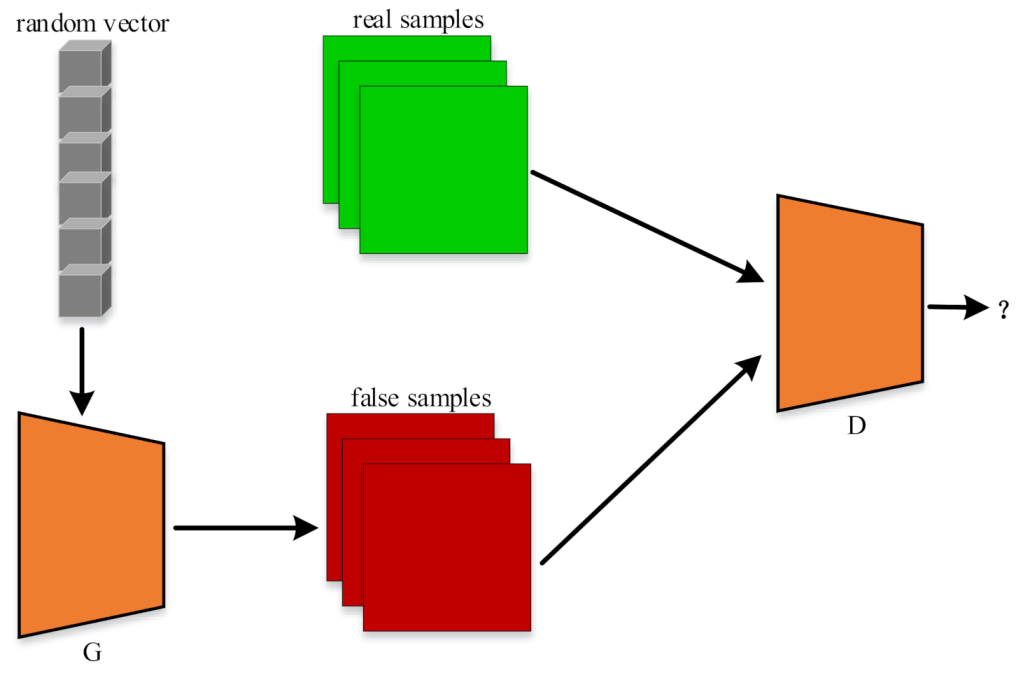
1.1. Conditional Generative Adversarial Network
1.2. Image Generation
1.3. Image Semantics and Text Semantic Loss
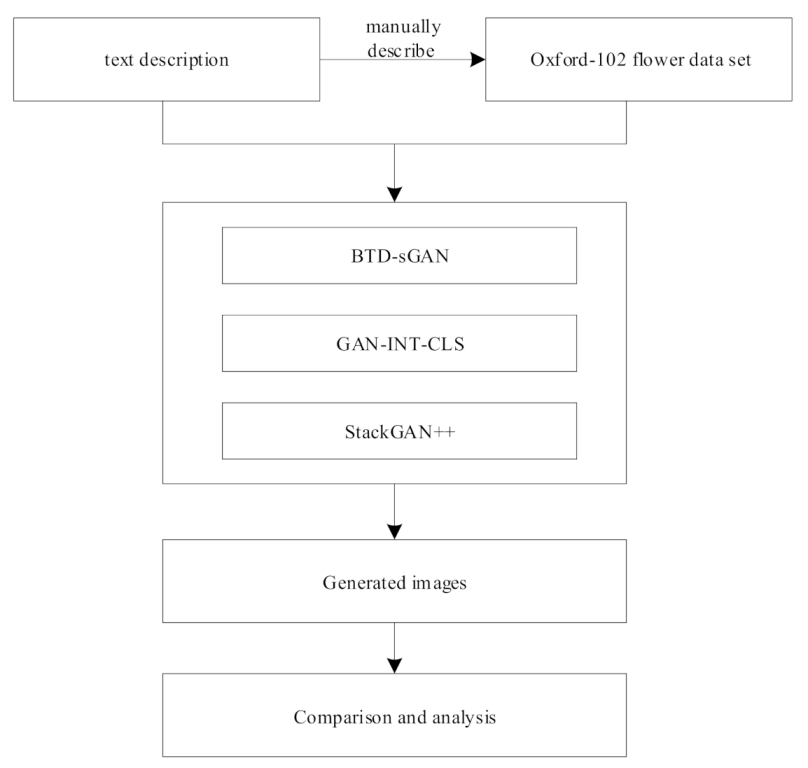
2. Materials and Methods
2.1. Methods
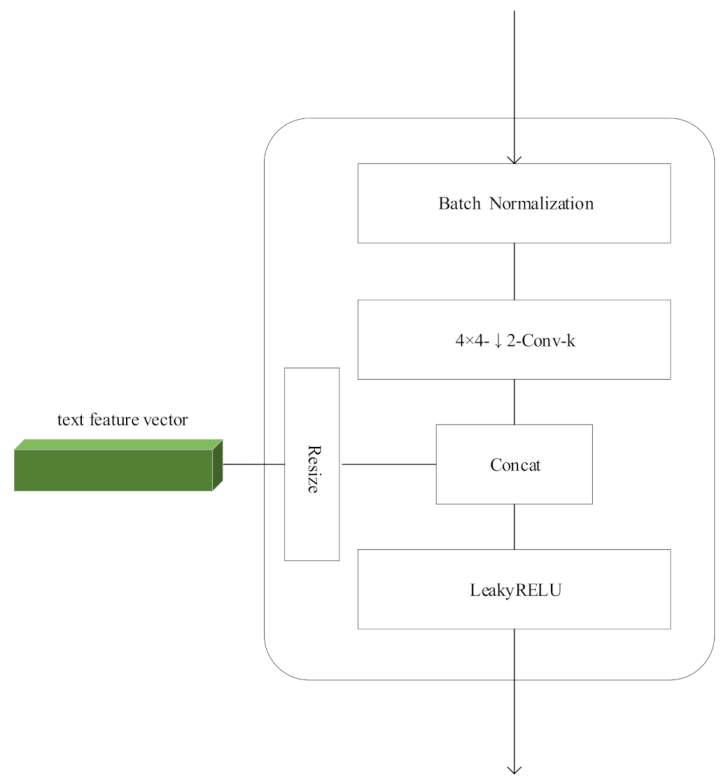
2.1.1. Lower Sampling Procedure
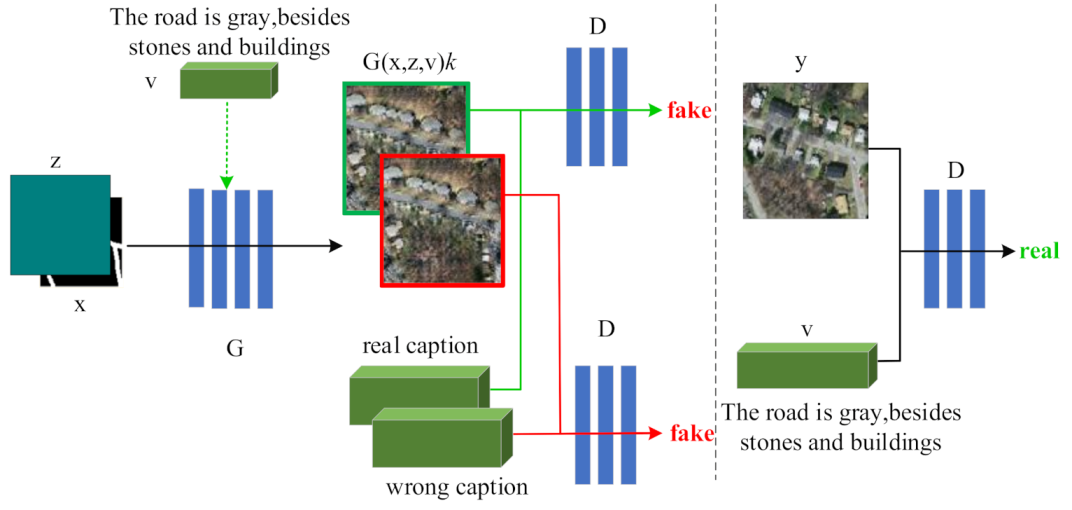
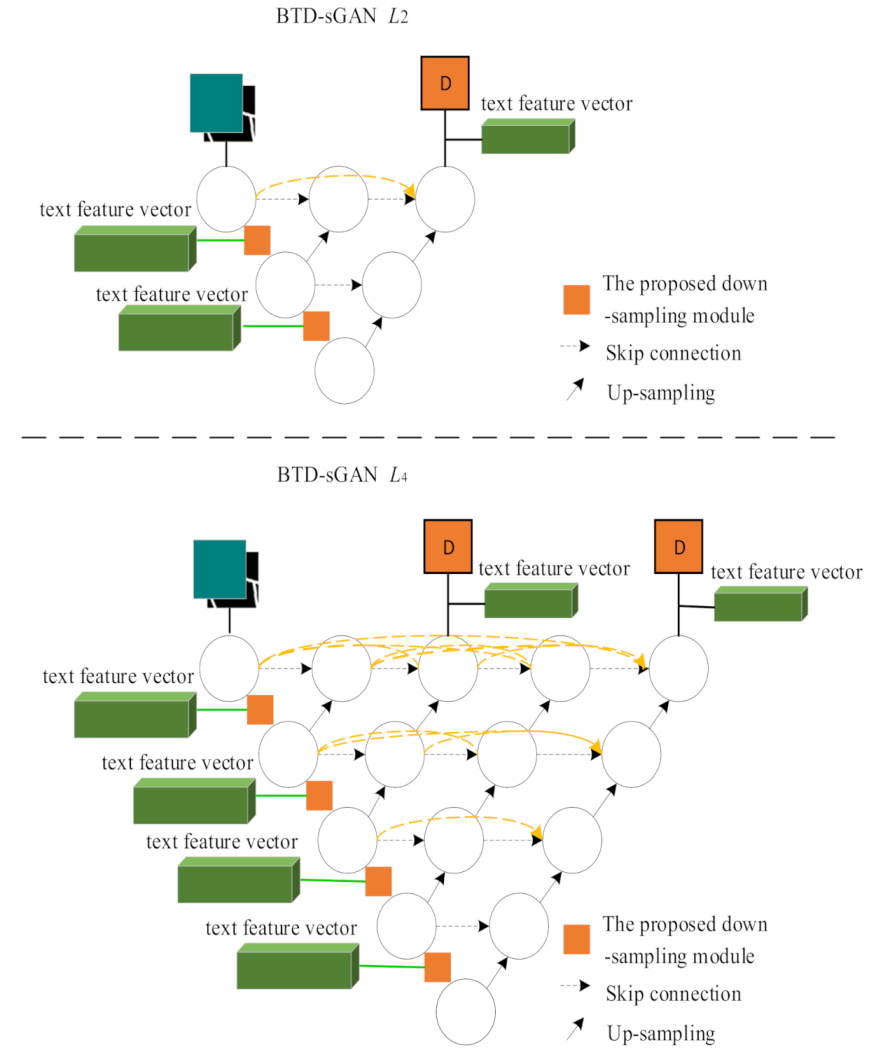
2.1.2. BTD-sGAN Structure
2.1.3. Loss Function
2.2. Datasets
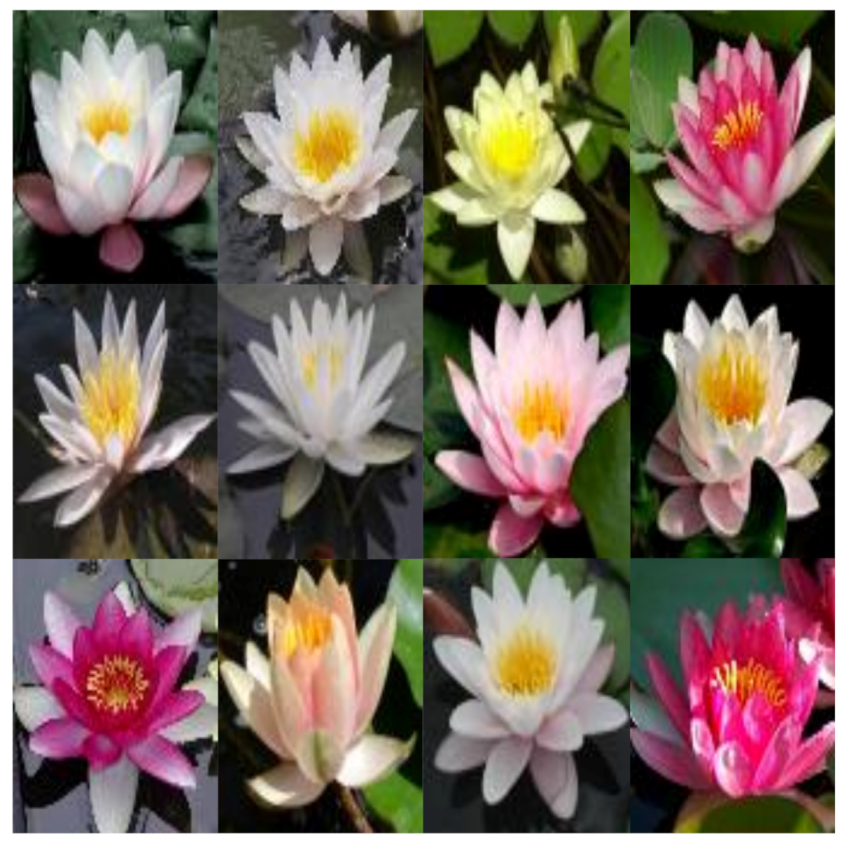
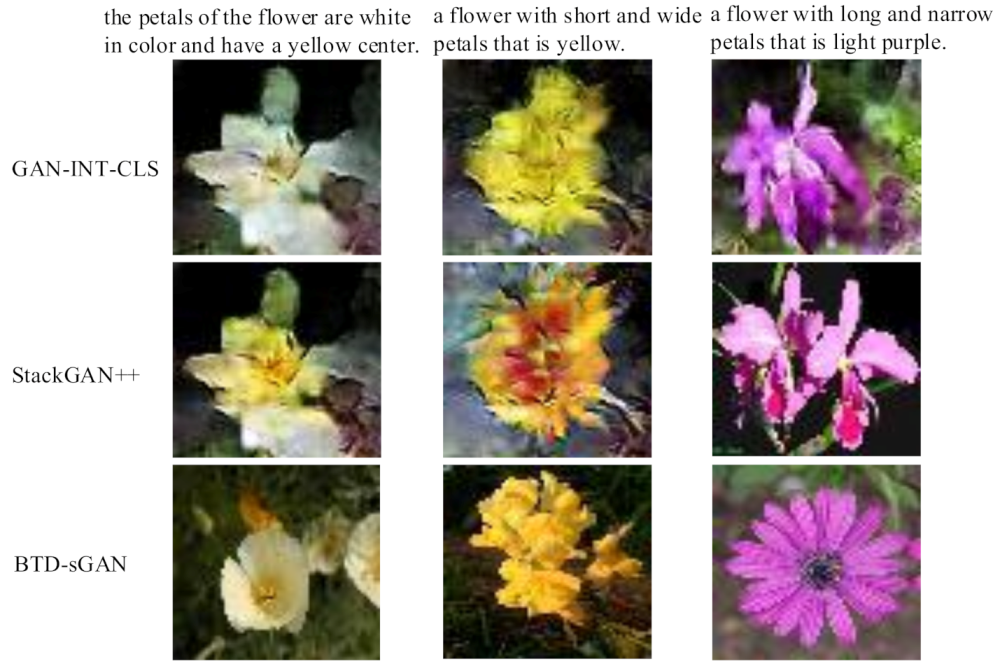
2.2.1. Oxford-102 Dataset
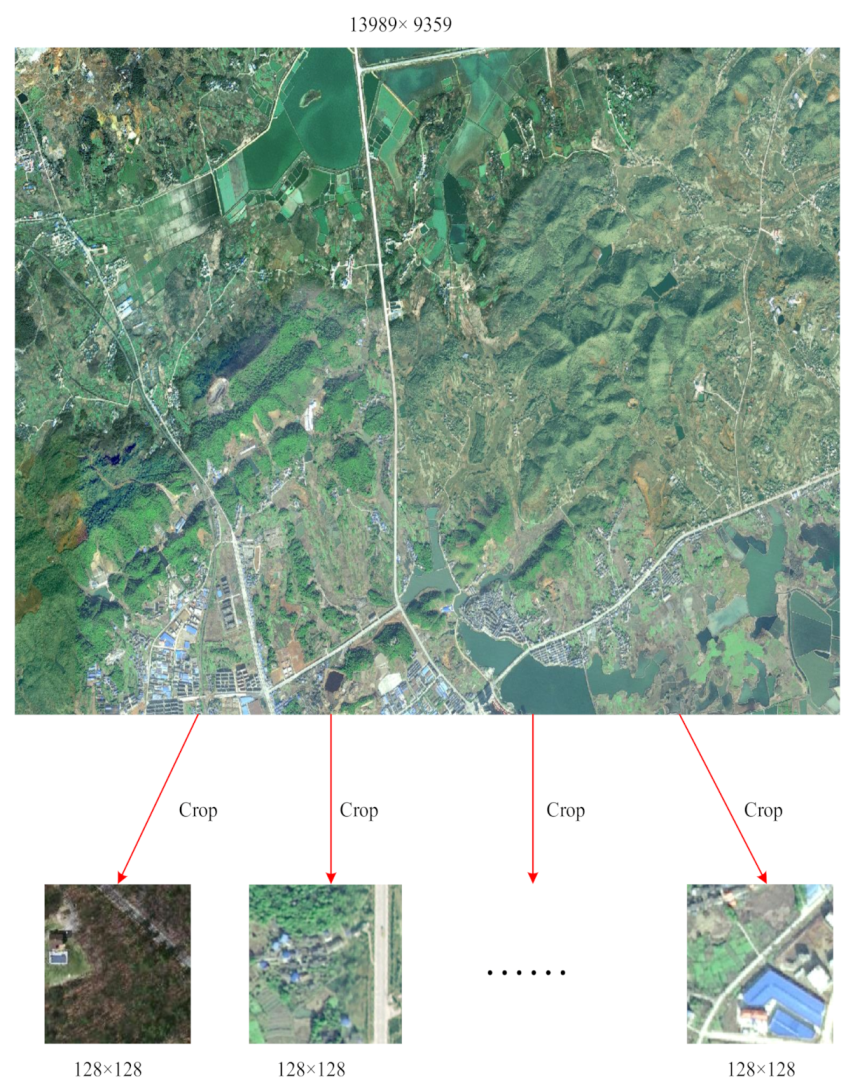
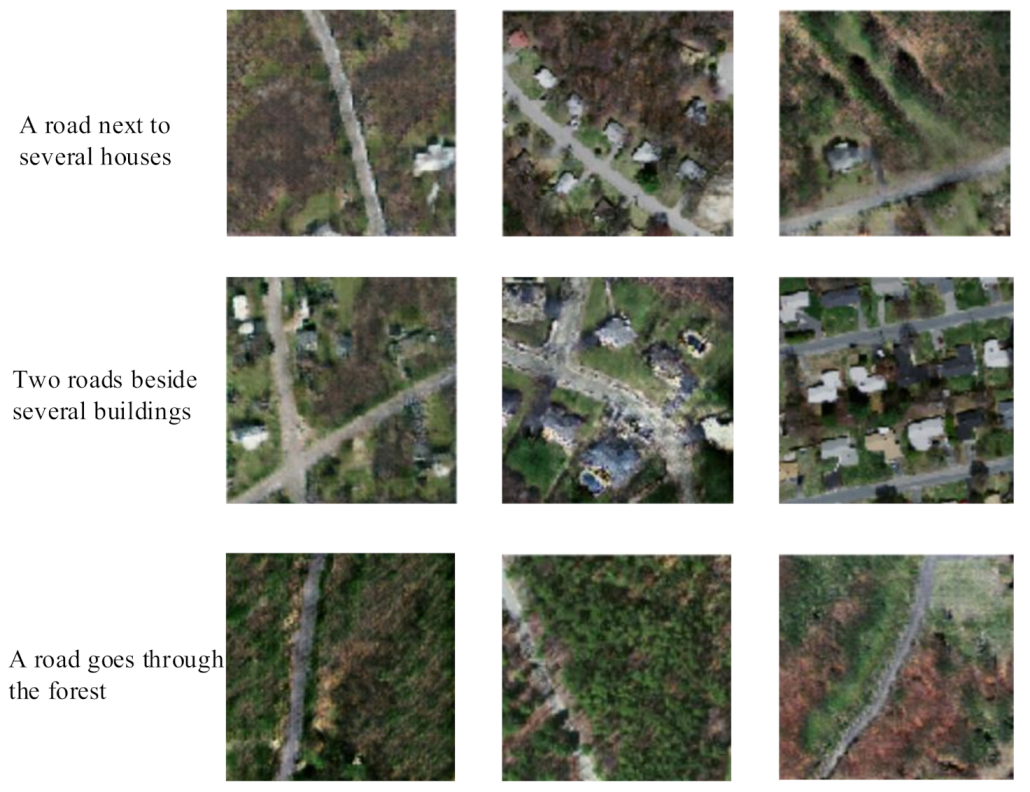
2.2.2. Remote Sensing Datasets of Jiangxi and Anhui Provinces, China
2.3. Evaluation Metrics
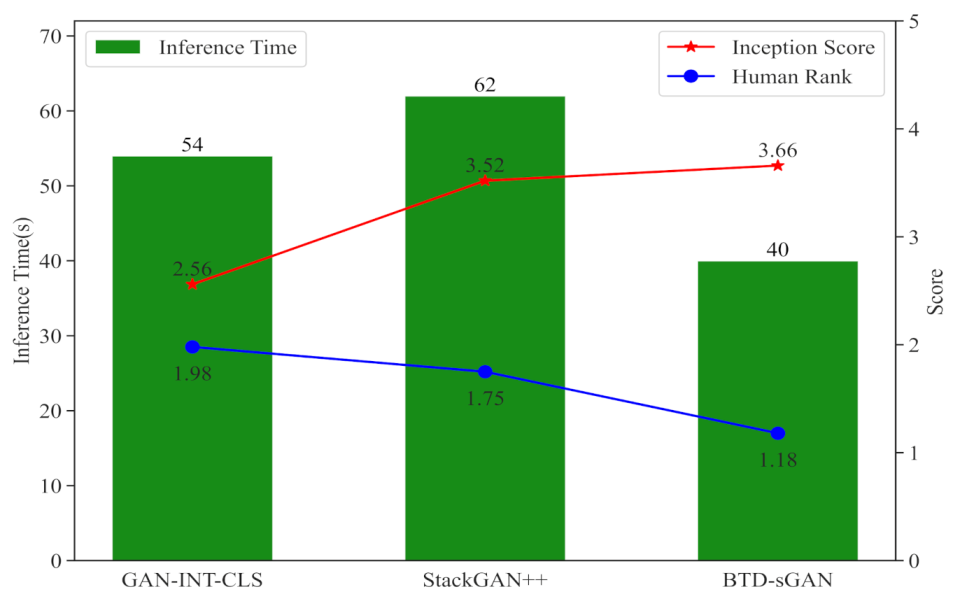
2.3.1. Inception Score
2.3.2. Interpretation Score
2.3.3. Human Rank
2.3.4. Inference Time
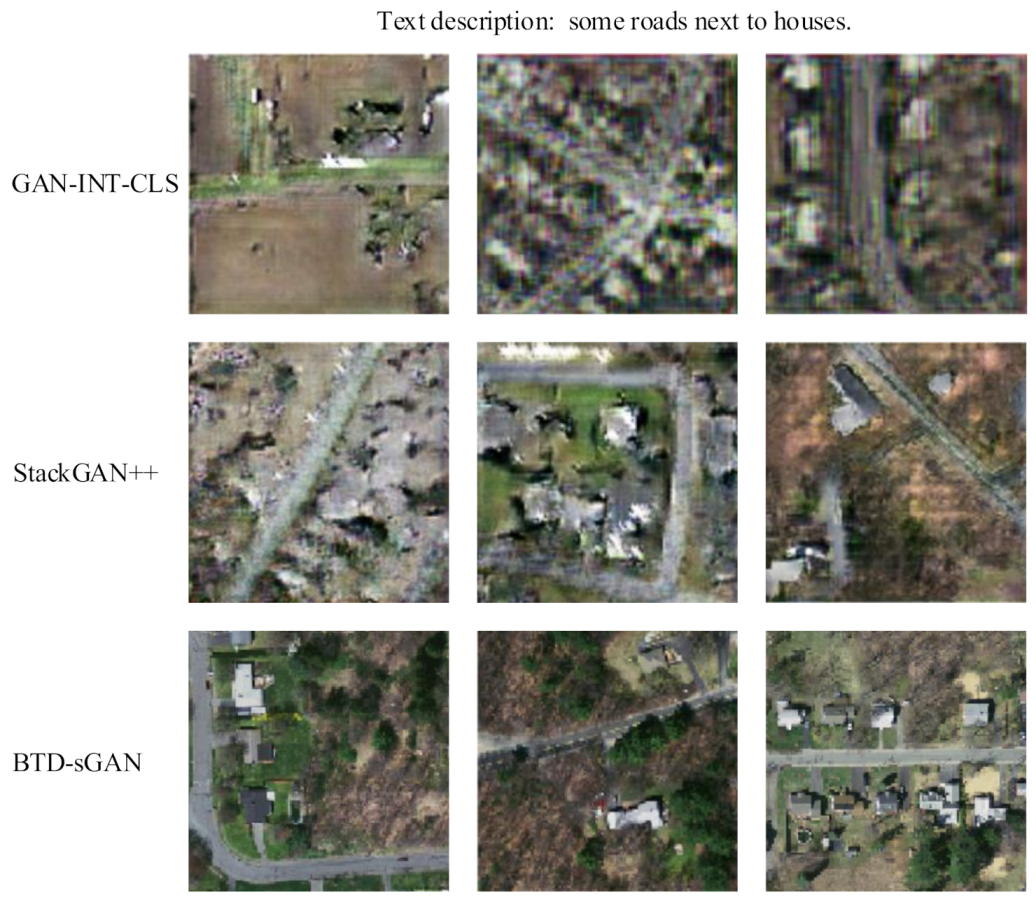
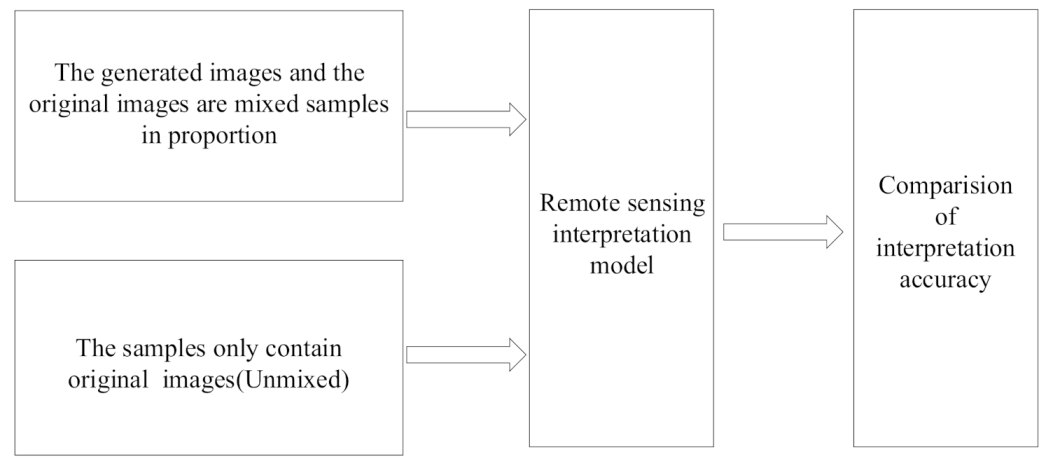
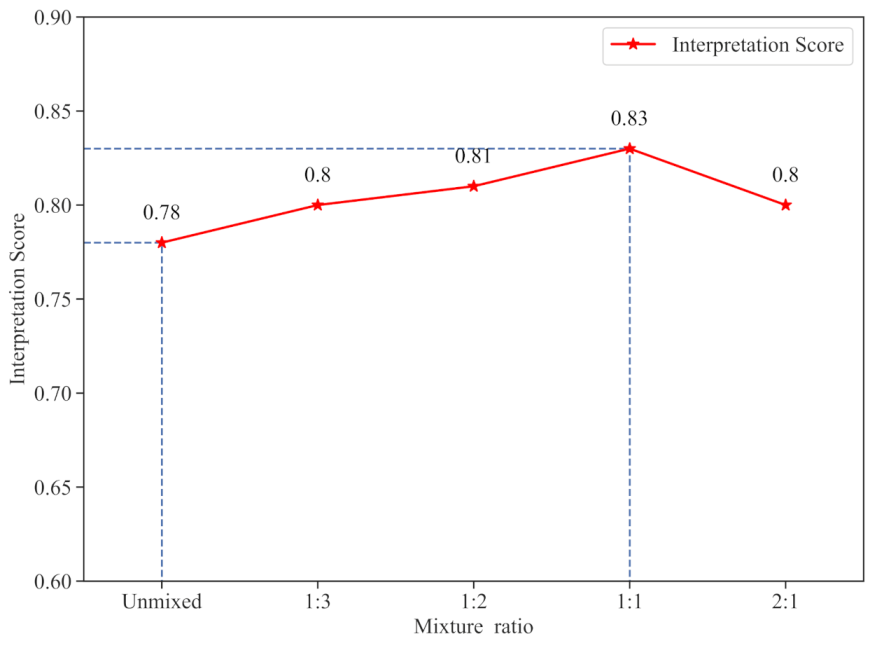
3. Results
3.1. Experiment 1
3.2. Experiment 2
4. Discussion
5. Conclusions
Author Contributions
Funding
Institutional Review Board Statement
Informed Consent Statement
Data Availability Statement
Acknowledgments
Conflicts of Interest
Abbreviations
| VAE | Variational Auto Encoder |
| GAN | Generative Adversarial Network |
| cGAN | conditional Generative Adversarial Network |
| DGN | Deep Generator Network |
| AM | Activation Maximization |
| PPGN | Plug & Play Generative Network |
| ArtGAN | Artwork Synthesis with Conditional Categorical GAN |
| StackGAN | Stacked Generative Adversarial Network |
| ATTNGAN | Attentional Generative Adversarial Network |
| IS | Inception Score |
References
- Lv, N.; Chen, C.; Qiu, T.; Sangaiah, A.K. Deep Learning and Superpixel Feature Extraction Based on Contractive Autoencoder for Change Detection in SAR Images. IEEE Trans. Ind. Inform. 2018, 14, 5530–5538. [Google Scholar] [CrossRef]
- Ghaderpour, E.; Vujadinovic, T. Change Detection within Remotely Sensed Satellite Image Time Series via Spectral Analysis. Remote Sens. 2020, 12, 4001. [Google Scholar] [CrossRef]
- Srivastava, G.; Kumar, C.N.S.V.; Kavitha, V.; Parthiban, N.; Venkataraman, R. Two-stage data encryption using chaotic neural networks. J. Intell. Fuzzy Syst. 2020, 38, 2561–2568. [Google Scholar] [CrossRef]
- Shivani, S.; Patel, S.C.; Arora, V.; Sharma, B.; Jolfaei, A.; Srivastava, G. Real-time cheating immune secret sharing for remote sensing images. J. Real-Time Image Process. 2020. [Google Scholar] [CrossRef]
- Zhu, Z.; Woodcock, C.E.; Holden, C.; Yang, Z. Generating synthetic Landsat images based on all available Landsat data: Predicting Landsat surface reflectance at any given time. Remote Sens. Environ. 2015, 162, 67–83. [Google Scholar] [CrossRef]
- Yan, Y.; Tan, Z.; Su, N. A data augmentation strategy based on simulated samples for ship detection in rgb remote sensing images. ISPRS Int. J. Geo-Inf. 2019, 8, 276. [Google Scholar] [CrossRef]
- Chen, C.; Liu, B.; Wan, S.; Qiao, P.; Pei, Q. An Edge Traffic Flow Detection Scheme Based on Deep Learning in an Intelligent Transportation System. IEEE Trans. Intell. Transp. Syst. 2021, 22, 1840–1852. [Google Scholar] [CrossRef]
- Jiang, J.; Ma, J.; Chen, C.; Wang, Z.; Cai, Z.; Wang, L. SuperPCA: A Superpixelwise PCA Approach for Unsupervised Feature Extraction of Hyperspectral Imagery. IEEE Trans. Geosci. Remote Sens. 2018, 56, 4581–4593. [Google Scholar] [CrossRef]
- Kingma, D.P.; Welling, M. Auto-Encoding Variational Bayes. In Proceedings of the ICLR 2014: International Conference on Learning Representations (ICLR) 2014, Banff, AB, Canada, 14–16 April 2014. [Google Scholar]
- Goodfellow, I.; Pouget-Abadie, J.; Mirza, M.; Xu, B.; Warde-Farley, D.; Ozair, S.; Courville, A.; Bengio, Y. Generative Adversarial Nets. In Proceedings of the 27th International Conference on Advances in Neural Information Processing Systems, Montreal, QC, Canada, 8–13 December 2014; Volume 27, pp. 2672–2680. [Google Scholar]
- Isola, P.; Zhu, J.Y.; Zhou, T.; Efros, A.A. Image-to-Image Translation with Conditional Adversarial Networks. In Proceedings of the 2017 IEEE Conference on Computer Vision and Pattern Recognition (CVPR), Honolulu, HI, USA, 21–26 July 2017; pp. 5967–5976. [Google Scholar]
- Sangkloy, P.; Lu, J.; Fang, C.; Yu, F.; Hays, J. Scribbler: Controlling Deep Image Synthesis with Sketch and Color. In Proceedings of the 2017 IEEE Conference on Computer Vision and Pattern Recognition (CVPR), Honolulu, HI, USA, 21–26 July 2017; pp. 6836–6845. [Google Scholar]
- Gauthier, J. Conditional generative adversarial nets for convolutional face generation. In Proceedings of the Class Project for Stanford CS231N: Convolutional Neural Networks for Visual Recognition, Winter Semester, Toulon, France, 24–26 April 2017; Volume 2014, p. 2. [Google Scholar]
- Denton, E.; Chintala, S.; Szlam, A.; Fergus, R. Deep generative image models using a Laplacian pyramid of adversarial networks. In Proceedings of the 28th International Conference on Neural Information Processing Systems, Montreal, QC, Canada, 7–12 December 2015; Volume 28, pp. 1486–1494. [Google Scholar]
- Sønderby, C.K.; Caballero, J.; Theis, L.; Shi, W.; Huszár, F. Amortised MAP Inference for Image Super-resolution. In Proceedings of the International Conference on Learning Representations (ICLR) 2016, San Juan, Puerto Rico, 2–4 May 2016. [Google Scholar]
- Nguyen, A.M.; Dosovitskiy, A.; Yosinski, J.; Brox, T.; Clune, J. Synthesizing the preferred inputs for neurons in neural networks via deep generator networks. In Proceedings of the Advances in Neural Information Processing Systems (NIPS), Barcelona, Spain, 9 December 2016; Volume 29, pp. 3387–3395. [Google Scholar]
- Nguyen, A.; Clune, J.; Bengio, Y.; Dosovitskiy, A.; Yosinski, J. Plug & Play Generative Networks: Conditional Iterative Generation of Images in Latent Space. In Proceedings of the 2017 IEEE Conference on Computer Vision and Pattern Recognition (CVPR), Honolulu, HI, USA, 21–26 July 2017; pp. 3510–3520. [Google Scholar]
- Tan, W.R.; Chan, C.S.; Aguirre, H.E.; Tanaka, K. ArtGAN: Artwork synthesis with conditional categorical GANs. In Proceedings of the 2017 IEEE International Conference on Image Processing (ICIP), Beijing, China, 17–20 September 2017; pp. 3760–3764. [Google Scholar]
- Reed, S.; Akata, Z.; Yan, X.; Logeswaran, L.; Schiele, B.; Lee, H. Generative adversarial text to image synthesis. In Proceedings of the ICML’16 Proceedings of the 33rd International Conference on International Conference on Machine Learning—Volume 48, New York, NY, USA, 20–22 June 2016; pp. 1060–1069. [Google Scholar]
- Lin, T.Y.; Maire, M.; Belongie, S.; Hays, J.; Perona, P.; Ramanan, D.; Dollár, P.; Zitnick, C.L. Microsoft coco: Common objects in context. In Proceedings of the European Conference on Computer Vision, Zurich, Switzerland, 6–12 September 2014; pp. 740–755. [Google Scholar]
- Ding, S.; Qu, S.; Xi, Y.; Wan, S. Stimulus-driven and concept-driven analysis for image caption generation. Neurocomputing 2020, 398, 520–530. [Google Scholar] [CrossRef]
- Reed, S.; Akata, Z.; Mohan, S.; Tenka, S.; Schiele, B.; Lee, H. Learning what and where to draw. In Proceedings of the NIPS’16 30th International Conference on Neural Information Processing Systems, Barcelona, Spain, 5–10 December 2016; Voume 29; pp. 217–225. [Google Scholar]
- Zhang, H.; Xu, T.; Li, H. StackGAN: Text to Photo-Realistic Image Synthesis with Stacked Generative Adversarial Networks. In Proceedings of the 2017 IEEE International Conference on Computer Vision (ICCV), Venice, Italy, 22–29 October 2017; pp. 5908–5916. [Google Scholar]
- Zhao, Y.; Li, H.; Wan, S.; Sekuboyina, A.; Hu, X.; Tetteh, G.; Piraud, M.; Menze, B. Knowledge-aided convolutional neural network for small organ segmentation. IEEE J. Biomed. Health Inform. 2019, 23, 1363–1373. [Google Scholar] [CrossRef] [PubMed]
- Zhang, H.; Xu, T.; Li, H.; Zhang, S.; Wang, X.; Huang, X.; Metaxas, D.N. Stackgan++: Realistic image synthesis with stacked generative adversarial networks. IEEE Trans. Pattern Anal. Mach. Intell. 2018, 41, 1947–1962. [Google Scholar] [CrossRef] [PubMed]
- Xu, T.; Zhang, P.; Huang, Q.; Zhang, H.; Gan, Z.; Huang, X.; He, X. AttnGAN: Fine-Grained Text to Image Generation with Attentional Generative Adversarial Networks. In Proceedings of the 2018 IEEE/CVF Conference on Computer Vision and Pattern Recognition, Salt Lake City, UT, USA, 18–22 June 2018; pp. 1316–1324. [Google Scholar]
- Wan, S.; Xia, Y.; Qi, L.; Yang, Y.H.; Atiquzzaman, M. Automated colorization of a grayscale image with seed points propagation. IEEE Trans. Multimed. 2020, 22, 1756–1768. [Google Scholar] [CrossRef]
- Hong, S.; Yang, D.; Choi, J.; Lee, H. Inferring Semantic Layout for Hierarchical Text-to-Image Synthesis. In Proceedings of the 2018 IEEE/CVF Conference on Computer Vision and Pattern Recognition, Salt Lake City, UT, USA, 18–22 June 2018; pp. 7986–7994. [Google Scholar]
- Gao, Z.; Li, Y.; Wan, S. Exploring deep learning for view-based 3D model retrieval. ACM Trans. Multimed. Comput. Commun. Appl. (TOMM) 2020, 16, 1–21. [Google Scholar] [CrossRef]
- Huang, F.; Jolfaei, A.; Bashir, A.K. Robust Multimodal Representation Learning with Evolutionary Adversarial Attention Networks. IEEE Trans. Evol. Comput. 2021. [Google Scholar] [CrossRef]
- Park, T.; Liu, M.Y.; Wang, T.C.; Zhu, J.Y. Semantic Image Synthesis With Spatially-Adaptive Normalization. In Proceedings of the 2019 IEEE/CVF Conference on Computer Vision and Pattern Recognition (CVPR), Long Beach, CA, USA, 15–20 June 2019; pp. 2337–2346. [Google Scholar]
- Tang, B.; Tu, Y.; Zhang, Z.; Lin, Y. Digital Signal Modulation Classification With Data Augmentation Using Generative Adversarial Nets in Cognitive Radio Networks. IEEE Access 2018, 6, 15713–15722. [Google Scholar] [CrossRef]
- Yang, J.; Zhao, Z.; Zhang, H.; Shi, Y. Data Augmentation for X-Ray Prohibited Item Images Using Generative Adversarial Networks. IEEE Access 2019, 7, 28894–28902. [Google Scholar] [CrossRef]
- Lv, N.; Ma, H.; Chen, C.; Pei, Q.; Zhou, Y.; Xiao, F.; Li, J. Remote Sensing Data Augmentation Through Adversarial Training. In Proceedings of the IGARSS 2020-2020 IEEE International Geoscience and Remote Sensing Symposium, Waikoloa, HI, USA, 26 September–2 October 2020; pp. 2511–2514. [Google Scholar]
- Zhou, Z.; Siddiquee, M.M.R.; Tajbakhsh, N.; Liang, J. UNet++: Redesigning Skip Connections to Exploit Multiscale Features in Image Segmentation. IEEE Trans. Med. Imaging 2020, 39, 1856–1867. [Google Scholar] [CrossRef] [PubMed]
- Nilsback, M.E.; Zisserman, A. Automated Flower Classification over a Large Number of Classes. In Proceedings of the 2008 Sixth Indian Conference on Computer Vision, Graphics & Image Processing, Bhubaneswar, India, 16–19 December 2008; pp. 722–729. [Google Scholar]
- Sharif Razavian, A.; Azizpour, H.; Sullivan, J.; Carlsson, S. CNN features off-the-shelf: An astounding baseline for recognition. In Proceedings of the IEEE Conference on Computer Vision and Pattern Recognition Workshops, Columbus, OH, USA, 23–28 June 2014; pp. 806–813. [Google Scholar]
- Salimans, T.; Goodfellow, I.; Zaremba, W.; Cheung, V.; Radford, A.; Chen, X. Improved techniques for training GANs. In Proceedings of the NIPS’16 30th International Conference on Neural Information Processing Systems, Barcelona, Spain, 5–10 December 2016; Volume 29, pp. 2234–2242. [Google Scholar]
- Szegedy, C.; Vanhoucke, V.; Ioffe, S.; Shlens, J.; Wojna, Z. Rethinking the Inception Architecture for Computer Vision. In Proceedings of the 2016 IEEE Conference on Computer Vision and Pattern Recognition (CVPR), Las Vegas, Nevada, 27–30 June 2016; pp. 2818–2826. [Google Scholar]
- Huang, G.; Liu, Z.; Van Der Maaten, L.; Weinberger, K.Q. Densely connected convolutional networks. In Proceedings of the IEEE conference on computer vision and pattern recognition, Honolulu, HI, USA, 21–26 July 2017; pp. 4700–4708. [Google Scholar]
- Chen, C.; Wang, C.; Qiu, T.; Atiquzzaman, M.; Wu, D.O. Caching in Vehicular Named Data Networking: Architecture, Schemes and Future Directions. IEEE Commun. Surv. Tutor. 2020, 22, 2378–2407. [Google Scholar] [CrossRef]


| Model | Inception Score | Human Rank | Inference Time (s) |
|---|---|---|---|
| GAN-INT-CLS | 2.56 ± 0.03 | 1.98 ± 0.04 | 54 |
| StackGAN++ | 3.52 ± 0.02 | 1.75 ± 0.03 | 62 |
| BTD-sGAN | 3.66 ± 0.03 | 1.18 ± 0.02 | 40 |
Publisher’s Note: MDPI stays neutral with regard to jurisdictional claims in published maps and institutional affiliations. |
© 2021 by the authors. Licensee MDPI, Basel, Switzerland. This article is an open access article distributed under the terms and conditions of the Creative Commons Attribution (CC BY) license (https://creativecommons.org/licenses/by/4.0/).
Share and Cite
Chen, C.; Ma, H.; Yao, G.; Lv, N.; Yang, H.; Li, C.; Wan, S. Remote Sensing Image Augmentation Based on Text Description for Waterside Change Detection. Remote Sens. 2021, 13, 1894. https://doi.org/10.3390/rs13101894
Chen C, Ma H, Yao G, Lv N, Yang H, Li C, Wan S. Remote Sensing Image Augmentation Based on Text Description for Waterside Change Detection. Remote Sensing. 2021; 13(10):1894. https://doi.org/10.3390/rs13101894
Chicago/Turabian StyleChen, Chen, Hongxiang Ma, Guorun Yao, Ning Lv, Hua Yang, Cong Li, and Shaohua Wan. 2021. "Remote Sensing Image Augmentation Based on Text Description for Waterside Change Detection" Remote Sensing 13, no. 10: 1894. https://doi.org/10.3390/rs13101894
APA StyleChen, C., Ma, H., Yao, G., Lv, N., Yang, H., Li, C., & Wan, S. (2021). Remote Sensing Image Augmentation Based on Text Description for Waterside Change Detection. Remote Sensing, 13(10), 1894. https://doi.org/10.3390/rs13101894