Abstract
Quality tree species information gathering is the basis for making proper decisions in forest management. By applying new technologies and remote sensing methods, very high resolution (VHR) satellite imagery can give sufficient spatial detail to achieve accurate species-level classification. In this study, the influence of pansharpening of the WorldView-3 (WV-3) satellite imagery on classification results of three main tree species (Quercus robur L., Carpinus betulus L., and Alnus glutinosa (L.) Geartn.) has been evaluated. In order to increase tree species classification accuracy, three different pansharpening algorithms (Bayes, RCS, and LMVM) have been conducted. The LMVM algorithm proved the most effective pansharpening technique. The pixel- and object-based classification were applied to three pansharpened imageries using a random forest (RF) algorithm. The results showed a very high overall accuracy (OA) for LMVM pansharpened imagery: 92% and 96% for tree species classification based on pixel- and object-based approach, respectively. As expected, the object-based exceeded the pixel-based approach (OA increased by 4%). The influence of fusion on classification results was analyzed as well. Overall classification accuracy was improved by the spatial resolution of pansharpened images (OA increased by 7% for pixel-based approach). Also, regardless of pixel- or object-based classification approaches, the influence of the use of pansharpening is highly beneficial to classifying complex, natural, and mixed deciduous forest areas.
1. Introduction
Over the last few decades, significant technological development of optical sensors has increased the possibility of remote sensing applications in many disciplines, including forestry. The application of remote sensing in forestry on both local and regional scales decreases the need for difficult, expensive, and slow field surveys and at the same time increases the quantitative and qualitative value of the information obtained [1]. Optical sensors (multispectral or hyperspectral) are the most commonly used in remote sensing, mainly due to an increase in availability [2,3]. Various sensors have provided various data sets of different spatial, spectral, radiometric, and temporal resolutions.
Moderate (e.g., Landsat) [4,5,6] and high spatial (e.g., RapidEye) [7,8,9,10] resolution satellite imagery have been shown to be very useful for land-use and land-cover classification [3]. On the other hand, very high resolution (VHR) satellite imagery (e.g., PlanetScope, SkySat, WorldView) provides a large number of more detailed information and presents an effective tool for individual tree species classification [11,12]. Most of these VHR sensors produce lower spatial resolution for multispectral (MS) bands and higher spatial resolution for panchromatic (PAN) that can be useful for further studies.
According to Fassnacht et al. [2], spatially explicit information of tree species plays an important role in a wide variety of applications in forestry, regardless of the forest or vegetation type. In order to get improved, spatially explicit information, the spatial resolution of MS data can be upgraded by data fusion or pansharpening.
Fusion methods, also known as pansharpening, essentially are based on the combination of higher spatial resolution of PAN band and the spectral information of the lower resolution MS bands [13]. The higher spatial resolution of PAN band is not very often used in forest applications since (most applications remain in urban environments) it is required for accurate description of texture and shapes, while lower resolution MS bands are required for accurate discrimination of classes. Fusion methods can be divided into two categories: the component substitution methods and the multi-resolution analysis methods [14]. Applying a color decorrelation transform, component substitution methods (e.g., Brovey’s band-dependent spatial detail, principal component analysis transform, intensity-hue-saturation transform, Gram–Schmidt orthonormalization, and partial replacement adaptive component substitution) convert unsampled lower-resolution multispectral bands into a new color system that differentiates the spatial and spectral details [15]. Multiresolution analysis-based methods (e.g., Laplacian pyramid, high-pass modulation, contourlet, and discrete wavelet transform), through a multi-resolution decomposition, combine the high frequencies inherent in the PAN band and unsampled multispectral components [15]. Most of the new pansharpening techniques are generally grouped as Bayesian, sparse reconstruction, variational optimization-based methods, model-based optimization, multi-resolution analysis, and component substitution [16]. Some pansharpening algorithms have been proven to be suitable not only for visual enhancements of imagery [17] but also for quantitative analyses in forested areas [18,19]. Although many different pansharpening algorithms exist, not all are suitable for quantitative analyses [20]. Due to the loss of some of the spectral properties of original bands during the pansharpening process, some algorithms are designed to maximize spectral preservation (e.g., principal component analysis, wavelet transform) [20,21]. Also, a pansharpened product which proved to be the best in terms of visual inspection and quality indexes may be suitable for applications such as image interpretation while at the same time not suitable for applications related to classification and object identification [14]. According to Ghosh et al. [22], the selection of an appropriate fusion method depends on various factors, such as algorithms, scene, choice of tuning parameters, and user experience. The spectral, spatial, and radiometric integrity of pansharpened imagery is important for tree species classification because the process of pansharpening increases the spatial resolution of the imagery and consequently improves tree species classification. Several studies analyzed the influence of fusion on classification accuracy and indicated an increased classification accuracy when using the fused imagery [23,24].
Tree species classification can be done using individual pixels (pixel-based approach) or tree crown objects (object-based approach). The object-based approach, in the last decade, has made significant advances and has been proven as superior to pixel-based approaches [25,26], producing higher classification accuracy, especially in the classification of VHR satellite imagery when the pixel size is significantly smaller than the average size of the objects of interest. Also, the object-based approach eliminates the salt and pepper or noise effect by considering mean pixel values within objects instead of individual pixel values [27].
The accuracy of object-based classification mainly depends on the quality of image segmentation [28]. Segmentation algorithms, based on discontinuity and similarity of object areas, can be grouped as boundary- and region-based [29]. Various researchers attempted to improve segmentation and the region-based Mask RCNN (region-based convolutional neural networks) deep learning technique [30,31,32,33] with increasing application in tree detection [34,35] has recently been established. Also, an open tool for the large-scale segmentation LargeScaleMeanShift application has been specially developed to be applied in large VHR imagery processing [36].
Many authors have directly compared the pixel-based approach to the object-based approach [37,38]. Myint et al. [37] concluded that the object-based approach is significantly better than the classical pixel-based approach, while Immitzer et al. [38] could not find distinct advantages using an object-based compared to a pixel-based approach. Object-based approaches achieve superior results in complex forest structures [39,40].
Immitzer et al. [26] used WorldView-2 satellite imagery for tree species classification in temperate Austrian forests dominated by Scots pine, Norway spruce, pedunculate oak, and European beech. The random forest (RF) classifier is used to compare pixel- and object-based tree species classification. Over 1450 reference polygons were manually determined for ten tree species. The authors found that object-based classification accuracy outperformed pixel-based classification. Object-based classification, with the highest classification accuracy at 82%, gave about 10% better results compared to the pixel-based classification. Cho et al. [41] used WorldView-2 satellite imagery for tree species classification in protected South African subtropical coastal forests. Support vector machine (SVM) algorithm was used, and its achieved results show higher overall accuracy of the object-based (89%) approach compared accordingly to the pixel-based (85%). Also, the spectral confusion between individual classes was considerably worse in the pixel-based approach. Ghosh et al. [42] and Shojanoori et al. [43] also confirmed the higher accuracy achieved by the object-based approach.
In opposite to most previous studies which were conducted in simpler forest conditions and predominantly based on WV-2 or WV-3 satellite imagery [11,44,45], this research was conducted in an area of complex lowland and mixed deciduous forest. To the best of our knowledge, no similar studies have been conducted in this or similar forest conditions. Built on our previous research [46], which confirmed the great potential of VHR satellite imagery (WV-3) for pixel-based tree species mapping in the area of mixed deciduous forest stands, current research has moved forward by utilizing pansharpened WV-3 imagery in two different classification approaches (pixel- and object-based). The main goal of this research was the evaluation of the applicability of the pixel- and object-based tree species classification of fused WV-3 satellite imagery in areas of mixed deciduous forest. The influence of fusion on classification accuracy was also analyzed.
2. Materials
Study Area and Data
The study was performed in an area of 2128.77 ha of lowland deciduous forests in the Jastrebarski lugovi management unit (105–118 m above sea level), 35 km southwest of Zagreb, near the city of Jastrebarsko, in central Croatia, (Figure 1). Even-aged pedunculate oak (Quercus robur L.) of different age classes is the main forest type (management class) and covers 77% of the study area. The oak stands are commonly mixed with other tree species, such as narrow-leaved ash (Fraxinus angustifolia Vahl.), black alder (Alnus glutinosa (L.) Geartn.), and common hornbeam (Carpinus betulus L.), whereas silver birch (Betula pendula Roth.), European white elm (Ulmus laevis Pall.), poplars (Populus sp.), and lime (Tilia sp.) occur sporadically. Except for the oak management class, there are two other forest types in the study area: even-aged common hornbeam and even-aged narrow-leaved ash management classes, covering 6% and 17% of the study area, respectively. The ash and hornbeam stands are mostly homogeneous and less mixed with other tree species.
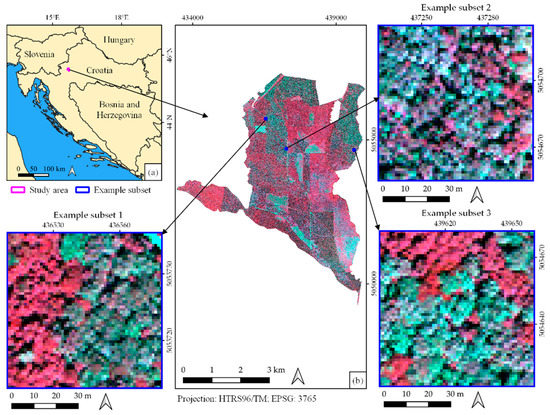
Figure 1.
The study area (a) the location of the study area in Croatia. (b) The location of three example subsets (blue squares). (Basemap: False-color composite B7-B5-B3 of WV-3).
Field data, i.e., locations and species of the trees, were collected between March and June 2017. A total of 4953 trees were measured within the 164 systematically distributed sample plots with a radius of 8, 15, or 20 m. A more detailed description of the study area, field survey, and summary statistics on field data can be found in Deur et al. [46].
Very high spatial resolution WV-3 satellite imagery, used in this research, was acquired on 12 June 2017, at:
- cross-track view angles of −0.5°
- mean sun azimuth of 158.6°
- sun elevation angle of 66.6°
- mean in-track of −29.2°
- mean off-nadir view angle of 29.2°.
WV-3 imagery provides panchromatic band (0.45–0.80 µm) with 0.31 m spatial resolution and eight 1.24 m multispectral bands: B1 (0.40–0.45 µm), B2 (0.45–0.51 µm), B3 (0.51–0.58 µm), B4 (0.585–0.625 µm), B5 (0.63–0.69 µm), B6 (0.705–0.745 µm), B7 (0.77–0.895 µm), and B8 (0.86–1.04 µm).
3. Methods
The research workflow in this study can be divided into four main steps: preprocessing, pansharpening, segmentation, classification and accuracy assessment (Figure 2). The research was done by using open-source software, e.g., Quantum GIS (3.10.1), Grass GIS (7.8.1), Orfeo ToolBox (6.6.1), and SAGA GIS (7.0.0).
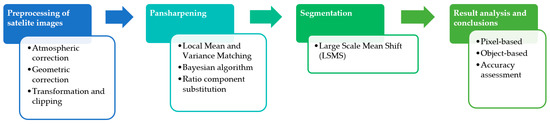
Figure 2.
Research workflow of tree species classification using pansharpened very high spatial resolution satellite imagery.
3.1. WorldView-3 Satellite Imagery Preprocessing
Before processing and classification, the WV-3 imagery was subjected to atmospheric and geometric corrections. Atmospheric corrections were provided via i.atcorr module in GRASS GIS. The geometric correction was performed by a two-step procedure: (1) sensor orientation and (2) orthorectification [47]. For sensor orientation, the rational polynomial coefficients with a shift or zero-order bias correction using seven ground control points (GCPs) were used. Orthorectification was done in Orfeo ToolBox based on a global digital elevation model (DEM) obtained by Shuttle Radar Topography Mission (SRTM). More detailed descriptions of conducted atmospheric and geometric corrections can be found in Deur et al. [46].
3.2. Pansharpening
To increase the spatial resolution of WV-3 imagery, the PAN band was merged with the MS bands through a process of pansharpening (in literature, also known as fusion). In the pansharpening process, the spatial information of a high-resolution PAN band is fused with the spectral information of low-resolution MS bands to produce a high-resolution MS image [48]. Numerous authors have dealt with the process of pansharpening [49,50,51,52].
In this study, we evaluated three pansharpening algorithms implemented in OTB software: the Local Mean and Variance Matching (LMVM), Ratio Component Substitution (RCS), and Bayesian algorithm.
The LMVM pansharpening algorithm uses a normalization function with the goal of matching the local mean and variance values of the high-resolution PAN band with those of the original low-resolution MS channels [53]. According to Karathanassi et al. [53], this type of algorithm drastically increases the correlation between the pansharpened band and the original MS imagery. The LMVM matching algorithm was performed according to the following equation [53]:
where
- i,j—pixel coordinates
- w,h—window size
- —pansharpened imagery
- —high-resolution imagery
- —low-resolution imagery
- —local mean of LR imagery
- —local mean of HR imagery
- —local standard deviation (SD) of LR imagery
- —local SD of HR imagery
The Bayesian pansharpening algorithm (Bayes) is based on statistical relationships between the various MS bands and the PAN band without modeling hypotheses. The user is allowed to weight the spectral and panchromatic information enabling adaptable results obtained according to the users’ needs. The Bayesian pansharpening algorithm is dependent on the notion that vector Z (the variables of interest) cannot be directly determined. Observable variable Y was performed according to an error-like equation [54]:
where
- g(Z)—set of functionals
- E—a random errors vector (considered to be independent of Z).
A comprehensive overview of Bayesian data fusion can be found in Fasbender study [54].
The ratio component substitution (RCS) pansharpening algorithm fuses orthorectified PAN and MS imageries based on a low-pass sharpening filter. The original PAN image was used for multiplication and filtered PAN image for normalization of the MS image. RCS algorithm was performed according to the following equation [16]:
where E is a vector of random errors. Low-pass filter radius is the only parameter of RCS algorithm.
In this study, the pansharpened WV-3 imagery were used as a basis for all investigations.
3.3. Segmentation
Object-based classification starts with segmentation, which represents the process of partitioning an image into meaningful parts. Real objects should be represented by objects (or segments) in the image. Segmentation considers the radiometric information of the pixels, the semantic properties of each segment, and other background information that describes the connection of adjacent pixels (intensity, color, texture, shape, weft, context, position, and dimensional relations) [55]. Image segmentation was performed on the pansharpened imagery. The LargeScaleMeanShift (LSMS) algorithm was used for the segmentation process in this research.
The LSMS segmentation algorithm was first developed in 1975 [56]. It is an iterative and non-parametric clustering method that enables the performance of tile-wise segmentation of satellite imagery [57]. This method is suitable for large-sized VHR imageries [36]. The segmentation procedure was performed by LargeScaleMeanShift application implemented in OTB software, which is composed of four steps [57]: mean-shift smoothing, segmentation, merging small regions, and vectorization.
Mean-shift smoothing as a first step of the segmentation procedure smooths large images by streaming them [57]. The segmentation will group neighboring pixels whose range distance is below the range radius parameter and (optionally) spatial distance is below the spatial radius parameter. The small regions of the segmented image are merged according to the minimum segment size parameter. In the last step, the segmented image is converted into a vector file. A comprehensive overview of each individual step can be found in the Orfeo ToolBox Documentation [57].
Several tests were carried out to estimate range radius values (i.e., all values between 5 and 30 with steps of 5 unit) and spatial radius (i.e., all values between 1 and 30 with steps of 3 unit). Finally, the best results for the LSMS segmentation were achieved when the range radius and spatial radius were set to 30 and 10, respectively. The minimum segment size was set to 40.
3.4. Image Classification and Accuracy Assessment
In this study, two approaches of image classification were applied and tested:
- Pixel-based classification using pansharpened WV-3 imagery (Bayes, RCS, LMVM) and RF algorithm and
- Object-based classification using pansharpened WV-3 imagery (Bayes, RCS, LMVM) and RF algorithm.
RF as an automatic learning algorithm is described in detail by Breiman [58] and by Adele Cutler [59]. A detailed review of the RF algorithm can be found in studies [58,59,60,61,62]. Open-source software’s SAGA GIS and OTB for pixel- and object-based classification, respectively, were used to run an RF classifier. As in a previous study [46] and according to [38,63], default OTB parameters were set to run an RF algorithm. The maximum depth of the tree was set to 10, while the minimum sample count was set to 2. Regression accuracy was set to 0.01.
Image classification and detailed statistical accuracy assessment were conducted using training and validation polygons that were randomly split from reference polygons. Reference polygons of pixel-based classification were identical to those in the previous study [46]. In order to define reference segments for object-based tree species classification, these manually selected training and validation datasets were overlapped with three segmented imageries. Overlapped image objects were selected by referencing pansharpened imagery and field data. Selection was conducted using true and false color compositions. Only image segments that had coincident boundaries with real ground objects as seen in pansharpened imagery were selected as training and validation segments. Due to the use of three different pansharpening algorithms (Bayes, RCS, and LMVM), this procedure was repeated three times, and therefore a total of three different reference polygons for object-based classification were produced (Table 1).

Table 1.
Number of reference polygons for object-based classification.
For classification accuracy assessment, user’s accuracies (UAs) and producer’s accuracies (PAs) were computed from the confusion matrix as well as the overall accuracy (OA) and Kappa coefficient (k) [64]. Extended accuracy assessment was made with the figure of merit (FoM) [65], weighted Kappa (Weighted k) [64] with linear weights, and weighted overall accuracy (Weighted OA) [66]. Weight matrix for overall accuracy was defined with the similarity for A. glutinosa and C. betulus as 0.6, Q. robur and A. glutinosa/C. betulus as 0.3, low vegetation and A. glutinosa/C. betulus/Q. robur as 0.1, and 0 for all classes versus bare land and shadow.
Also, to compare the performance of the pixel- and object-based classification, the statistical significance between the two classification approaches was evaluated using the McNemar’s test [67]. The test assumes that the reference polygons are independent for each approach. Based on a binary 2 × 2 contingency matrix, McNemar’s test closely related to the chi-squared statistic and was performed according to the following equation [68]:
where and indicate the number of correctly classified reference polygons in classification approach 1 but incorrectly in classification approach 2 and vice versa.
If a value exceeds 3.84 (confidence level of 95%), the null hypothesis can be rejected. McNemar’s test was conducted using the R programming language, version 3.5.3, through RStudio version 1.1.463 (R Foundation for Statistical Computing, Auckland, New Zealand).
4. Results
WV-3 imageries were fused using three different pansharpening algorithms: Bayes, RCS, and LMVM. A visual and a quantitative assessment of the pansharpened imageries were conducted. The visual interpretation of pansharpened imageries indicates that each algorithm preserved the spectral information while the differences are noticeable on a spatial level.
The classification of the pansharpened WV-3 imagery (Bayes, RCS, LMVM) was performed using two different approaches: pixel-based and object-based. Based on previous research [46], the same parameters for the RF algorithm were kept and applied to the classification of three pansharpened WV-3 imageries.
4.1. Pixel-Based Classification of Pansharpened Imagery
The results of the pixel-based classification of the pansharpened WV-3 imageries (Bayes, RCS, LMVM) are shown in Figure 3 with detailed classification results for three example subsets.
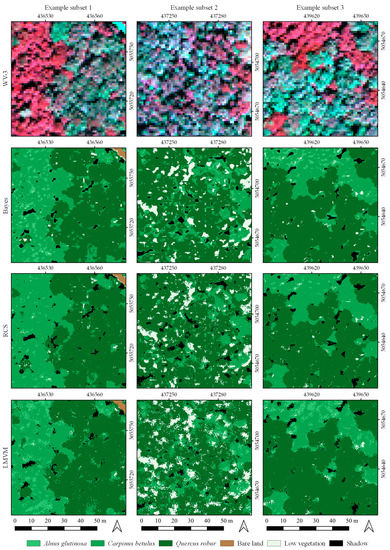
Figure 3.
Three example subsets: (1st row) false-color composite of WV-3; (2nd row) pixel-based classification using Bayes pansharpened imagery; (3rd row) pixel-based classification using RCS pansharpened imagery; (4th row) pixel-based classification using LMVM pansharpened imagery.
A visual assessment of the performed pixel-based classification showed similar results using RCS and LMVM pansharpened imagery. Slightly worse results were obtained using Bayes pansharpened imagery. Besides the visual analysis, detailed statistical accuracy assessment was conducted as well. Using three different pansharpened imageries (Bayes, RCS, and LMVM), the highest pixel-based classification accuracy was obtained for LMVM with OA = 92%, and k = 0.89 (Table 2). Observed by tree species, Alnus glutinosa had the lowest classification accuracy (UA ranging from 57% to 70%). High accuracy was obtained for Carpinus betulus (UA = 86–90%) and Quercus robur (UA = 75–91%). The obtained results showed that pixel-based classification for the same study area was improved when the LMVM pansharpened imagery was considered. Compared to pixel-based classification of only multispectral bands from a preview study [46], the OA and k value for pixel-based classification of the LMVM pansharpened imagery increased by 7% and 0.1, respectively.
Table 2.
Accuracy assessment of pixel-based classification of the pansharpened imageries (Bayes, RCS, LMVM) performed on 136 validation polygons.
The extended accuracy assessment was made with the figure of merit, weighted kappa, and weighted overall accuracy (Table 3). FoM, weighed k, and weighted OA, as well as OA and k value, indicate that pixel-based classification using pansharpened WV-3 imagery derived by the LMVM approach shows the highest classification accuracy. Statistics measure omission (O), commission (C), and overall agreement (A) have been measured too.
Table 3.
Extended accuracy assessment of pixel-based classification of the pansharpened imageries (Bayes, RCS, LMVM).
4.2. Object-Based Classification of Pansharpened Imagery
As in the case of pixel-based classification, visual assessment of object-based classification showed that worst results were obtained using Bayes pansharpened imagery. Classification of RCS and LMVM pansharpened imagery showed a better distribution of tree species classes.
The results of object-based classification of the pansharpened WV-3 imagery (Bayes, RCS, LMVM) with detailed classification results for three example subsets are shown in Figure 4.
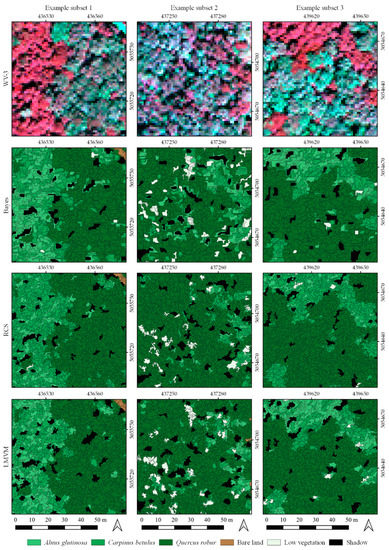
Figure 4.
Three example subsets: (1st row) false-color composite of WV-3; (2nd row) object-based classification using Bayes pansharpened imagery; (3rd row) object-based classification using RCS pansharpened imagery; (4th row) object-based classification using LMVM pansharpened imagery.
Detailed statistical analysis for object-based classification approaches was performed on validation segments (Table 1). Object-based classification of three different pansharpened imageries (Bayes, RCS, and LMVM) produced the highest classification accuracy for LMVM with OA= 96% and k = 0.94 (Table 4). Observed by tree species, Alnus glutinosa had the lowest classification accuracy (UA ranging from 64% to 87%). Quercus robur had a slightly higher accuracy (UA = 79–94%), while the highest classification accuracy was for Carpinus betulus (UA = 89–98%). Comparing results (Table 4) with the corresponding results of pixel-based classification (Table 2), it is visible that the accuracy of the object-based approach was significantly better than the accuracy of pixel-based approach.
Table 4.
Accuracy assessment of object-based classification of the pansharpened imageries (Bayes, RCS, LMVM) performed on validation segments.
The classification accuracy for A. glutinosa was noticeably improved using object-based classification in comparison to the pixel-based approach; the UA values for the Bayes and LMVM approaches increased by 9% and 17%, respectively. The RCS approach gave the same classification accuracy for both classification approaches. Slight improvements in classification accuracy were also observed for C. betulus, where UA increased by 5% for Bayes pansharpened imagery, by 3% for the RCS pansharpened imagery, and by 8% for the LMVM pansharpened imagery compared to pixel-based classification. Similar improvements in classification accuracy were also achieved for Q. robur compared to pixel-based classification where UA increased by and 3%, 4%, and 9% for the LMVM, Bayes, and RCS approaches, respectively.
As in the case of pixel-based classification, an extended accuracy assessment (Table 5) was made. As well as OA and k value, weighted OA, weighted k, and figure of merit (FoM) accuracy metrics indicate that object-based classification, in comparison to pixel-based approach, improved classification accuracy.
Table 5.
Extended accuracy assessment of object-based classification of the pansharpened imageries (Bayes, RCS, LMVM).
An initial visual analysis of both pixel- and object-based classification approaches showed outperformed pixel-based approach with the noisy distribution of tree species classes. The proportion of tree species classes for the study area can be seen in Figure 5.
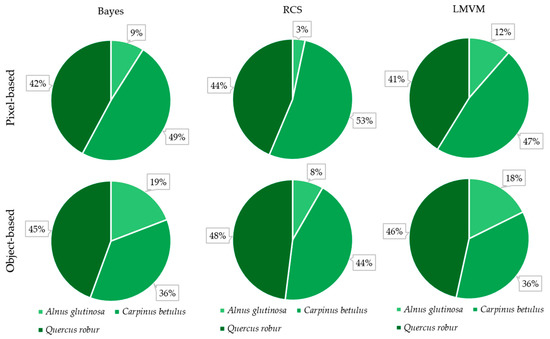
Figure 5.
The share of the tree species classes for pixel- and object-based classification of three pansharpened imagery (Bayes, RCS, LMVM).
Additionally, to take a closer look at the scattering of surfaces (ha) of pixel- and object-based classification of LMVM pansharpened imagery, a sankey diagram was made (Figure 6). It is clearly visible that Carpinus betulus was overemphasized in relation to Alnus glutinosa in the pixel-based approach. Because of mixing contributions from other tree species, the pixel-based approach produced a noisy distribution of Alnus glutinosa (Figure 3), which was considerably improved using the object-based approach (Figure 4). Also, the object-based approach solved the problem with shadows, since the pixel-based compared to the object-based approach produced a significantly higher quantity of shadow pixels. Statistical comparison of the pixel- and object-based classification of LMVM pansharpened imagery was performed with McNemar’s test. value is 40.106, which also indicates that the two classification results were significantly different.
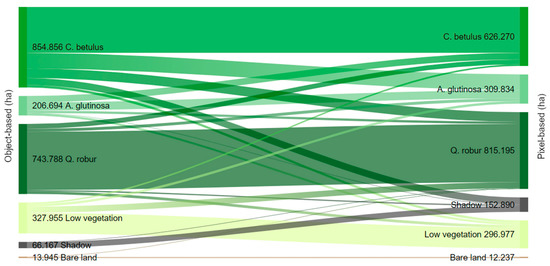
Figure 6.
The scattering of six land-cover classes (Alnus glutinosa, Carpinus betulus, Quercus robur, bare land, low vegetation, and shadow) for the entire study area obtained with pixel- and object-based classification of LMVM pansharpened imagery.
5. Discussion
This research assessed the influence of pansharpened WV-3 imagery on pixel- and object-based classification of tree species using RF machine-learning algorithms. The pixel- and object-based classification approaches were evaluated on pansharpened imagery.
Compared to previous studies that were conducted in urban forests [44,69,70], parklands [12], or temperate mixed forests [26,71,72,73], this research was conducted in a mixed deciduous forest with large shares of deciduous species.
Because of the complex forest structure in the study area, the generation of reference polygons represented a time-intensive and complex task. According to Belgiu and Drăguţ [62], training polygons, among others, needs to fulfill size requirement to accommodate the increased number of data dimensions. Because of spectral similarity and mixing contributions from other tree species in some pixels, it is important to highlight the difficulty in generating Alnus glutinosa reference polygons. The problem was solved by using different color compositions of which true and false color compositions were the most commonly used. In this research, Alnus glutinosa had the lowest number of reference polygons (Table 1) and the lowest classification accuracy (Table 2 and Table 4). The importance of generating reference polygons was also pointed out by Sabat-Tpomala et al. [74], who indicated a direct correlation between the quality of the reference polygons and machine-learning algorithms. A similar conclusion was reached by Kupidura et al. [75], who considered that adequate data preprocessing is often more important than the choice of the classification algorithm. According to Lu and Weng [76], classification accuracy can depend on many different factors in conjunction with the selection of an appropriate algorithm. Different studies used different algorithms in accordance with certain forest areas. Therefore, partial least squares discriminant analysis (PLS-DA) was used to discriminate forest species in South Africa [77]. Support vector machine (SVM) and artificial neural network (ANN) algorithms are used for pixel-based classification in mixed indigenous coastal forests of South Africa [78]. Varin et al. [79] compared five different algorithms: RF, SVM, k-nearest neighbors, linear discriminant analysis, and classification and regression tree to classify tree species in a broadleaf forest in Canada, where the RF algorithm produced higher precision. Compared to traditional classifiers (e.g., decision tree classifiers, maximum likelihood classifier), RF as a non-parametric classifier has wide application in tree species classifications [39,79,80,81]. Also, in this research, the RF algorithm is used for both pixel- and object-based approaches.
In order to improve tree species classification, pansharpening was used. Three fusion methods for improving spatial resolution were evaluated: Bayes, RCS, and LMVM. According to the visual and quantitative quality assessment, LMVM and RCS showed better results as compared with Bayes. The results of this research correspond to previous studies that showed increased classification accuracy when pansharpened satellite imagery was used [20,82]. Ibarola et al. [82] applied pixel- and object-based classification to different pansharpened imagery. Using the SVM algorithm that obtained the highest classification accuracies for individual classes, OA increased by 3% and 8% for the pixel-based and the object-based approach, respectively. In this research, OA increased by 7% and 11% for the pixel-based and object-based approaches, respectively.
According to Ghosh et al. [22], the selection of fusion method mostly depends on user experience, satellite scene, and type of used fusion algorithms and parameters of the tuning process. In this case, the LMVM method proved the most effective fusion technique.
In both classification approaches, LMVM pansharpened imagery achieved the highest overall classification accuracy. The object-based classification outperformed the pixel-based in terms of overall accuracy by 4%; OA was 92% and 96% for pixel- and object-based approaches, respectively. McNemar’s test was statistically used to compare the classification results achieved by pixel- and object-based classification approaches. value is 40.106 (greater than 3.84), which indicates that the two classification results were significantly different. All accuracy parameters, including FoM, weighted k, and weighted OA, showed improvements in object-based classification for all tree species. Also, the shadow problem in the pixel-based approach was solved in the object-based approach as well as the salt and pepper or noise effect, which was eliminated.
Previous research suggests that object-based classification is more suitable to handle high spatial resolution remote sensing data [25,83], and it has produced higher tree species classification accuracies [26,39]. There are also some limitations for both studied approaches [82]. The main limitations of the pixel-based approach are mixed pixels located in boundaries between classes and higher quantity of data that should be processed. On the other hand, object-based classification considerably depends on the segmentation process.
According to previous studies [84,85,86], the visual analysis of segments remains the recommended method for quality assessment of the segmentation process. Even today, there is no global protocol for setting the segmentation parameters and, depending on the image, the user estimates the appropriate segmentation parameters based on visual interpretation. Except for segmentation quality, the accuracy of tree species classification using VHR imagery is highly dependent on the reference polygons size, sampling method, classification approach, and vegetation mixture and distribution [87]. This is especially evident in the Alnus glutinosa class. Because of mixed distribution, the low number of reference polygons of Alnus glutinosa (Table 1) did not fulfill the size requirement, which resulted in the lowest classification accuracy (Table 2 and Table 4). The SVM algorithm reported in previous research [46], proved more resistant to smaller numbers of training polygons (evident for Alnus glutinosa class) compared to the RF algorithm. Mixed distribution with other tree species resulted in lower PA for low vegetation class (Table 2 and Table 4) as well as noise effect for the pixel-based approach.
In continuation of the previous research [46], the principal finding of this study is that pansharpening led to improvements (~10%) in accuracies in both the pixel- and object-based approaches. The RF classifier applied to LMVM pansharpened imagery produced improvements in overall accuracy for 7% and 11% for pixel- and object-based approaches, respectively.
In the purpose of simple use of the presented method, in this paper, the entire research was conducted using open-source software that ensures the basis of effective and sustainable forest management for other areas, either on local or global scales.
6. Conclusions
By using open-source software, we confirmed the significant potential of pansharpened VHR WV-3 imagery for tree species classification in areas of mixed deciduous forest stands. Three different pansharpening algorithms (Bayes, RCS, and LMVM) were conducted for improving tree species classification.
Reference polygons were generated for three tree species classes: Alnus glutinosa, Carpinus betulus, and Quercus robur as well as bare land, low vegetation, and shadow. The pixel- and object-based classification of pansharpened imagery were based on training polygons using random forest (RF) machine-learning algorithms. The LMVM pansharpening algorithm proved the most effective fusion technique. Accuracy assessment results showed its high overall accuracy: 92% and 96 % for tree species classification using LMVM pansharpened imagery based on pixel- and object-based approach, respectively. As expected, the object-based classification achieved higher accuracy compared to the pixel-based classification results.
Our research showed that the overall classification accuracy of tree species classification was significantly influenced by the spatial resolution of images. Also, regardless of using a pixel- or object-based classification approach, the influence of the use of pansharpening is highly beneficial for classifying complex, natural, and mixed deciduous forest areas.
The findings and results of this research can be used in future studies, like researching the influence of the usage of additional data (e.g., point clouds, canopy height models, or digital surface models) in combination with the WV-3 imagery to increase the accuracy of the classification.
Author Contributions
Conceptualization, M.D. and M.G.; methodology, M.D.; software, M.D.; validation, M.D., M.G. and I.B.; formal analysis, M.D. and M.G.; investigation, M.D.; resources, M.D. and M.G.; data curation, M.D., M.G. and I.B.; writing—original draft preparation, M.D.; writing—review and editing, M.D., M.G. and I.B.; visualization, M.D. and M.G.; supervision, M.G. and I.B.; project administration, M.G. and I.B.; funding acquisition, M.G. and I.B. All authors have read and agreed to the published version of the manuscript.
Funding
This research has been supported by projects: Retrieval of Information from Different Optical 3D Remote Sensing Sources for Use in Forest Inventory (3D-FORINVENT), funded by the Croatian Science Foundation (HRZZ IP-2016-06-7686); Operational Sustainable Forestry with Satellite-Based Remote Sensing (MySustainableForest), funded by the European Union’s Horizon 2020 research and innovation program under grant agreement No 776045; and Advanced photogrammetry and remote sensing methods for environmental change monitoring (grant No. RS4ENVIRO), funded by the University of Zagreb.
Conflicts of Interest
The authors declare no conflict of interest.
References
- Balenović, I.; Simic Milas, A.; Marjanović, H. A Comparison of Stand-Level Volume Estimates from Image-Based Canopy Height Models of Different Spatial Resolutions. Remote Sens. 2017, 9, 205. [Google Scholar] [CrossRef]
- Fassnacht, F.E.; Latifi, H.; Sterenczak, K.; Modzelewska, A.; Lefsky, M.; Waser, L.T.; Straub, C.; Ghosh, A. Review of studies on tree species classification from remotely sensed data. Remote Sens. Environ. 2016, 186, 64–87. [Google Scholar] [CrossRef]
- Lechner, A.M.; Foody, G.M.; Doreen, S.; Boyd, D.S. Applications in Remote Sensing to Forest Ecology and Management. One Earth 2020, 2, 405–412. [Google Scholar] [CrossRef]
- Knorn, J.; Rabe, A.; Radeloff, V.C.; Kuemmerle, T.; Kozak, J.; Hostert, P. Land cover mapping of large areas using chain classification of neighboring Landsat satellite images. Remote Sens. Environ. 2009, 113, 957–964. [Google Scholar] [CrossRef]
- Griffiths, P.; Linden, S.; Kuemmerle, T.; Hostert, P. A pixel-based Landsat compositing algorithm for large area land cover mapping. IEEE J. Sel. Top. Appl. Earth Obs. Remote Sens. 2013, 6, 2088–2101. [Google Scholar] [CrossRef]
- Chaves, M.E.D.; Picoli, C.A.M.; Sanches, I.D. Recent Applications of Landsat 8/OLI and Sentinel-2/MSI for Land Use and Land Cover Mapping: A Systematic Review. Remote Sens. 2020, 12, 3062. [Google Scholar] [CrossRef]
- Li, X.; Chen, W.; Cheng, X.; Liao, Y.; Chen, G. Comparison and integration of feature reduction methods for land cover classification with RapidEye imagery. Multimed. Tools Appl. 2017, 76, 23041–23057. [Google Scholar] [CrossRef]
- Mas, J.F.; Lemoine-Rodríguez, R.; González-López, R.; López-Sánchez, J.; Piña-Garduño, A.; Herrera-Flores, E. Land use/land cover change detection combining automatic processing and visual interpretation. Eur. J. Remote Sens. 2017, 50, 626–635. [Google Scholar] [CrossRef]
- Nampak, H.; Pradhan, B.; Rizeei, H.M.; Park, H.J. Assessment of land cover and land use change impact on soil loss in a tropical catchment by using multitemporal SPOT-5 satellite images and Revised Universal Soil Loss Equation model. Land Degrad. Dev. 2018, 29, 3440–3455. [Google Scholar] [CrossRef]
- Saini, R.; Ghosh, S.K. Analyzing the impact of red-edge band on land use land cover classification using multispectral RapidEye imagery and machine learning techniques. J. Appl. Remote Sens. 2019, 13, 044511. [Google Scholar] [CrossRef]
- Ferreira, M.P.; Wagner, F.H.; Aragão, L.E.; Shimabukuro, Y.E.; de Souza Filho, C.R. Tree species classification in tropical forests using visible to shortwave infrared WorldView-3 images and texture analysis. ISPRS J. Photogramm. Remote Sens. 2019, 149, 119–131. [Google Scholar] [CrossRef]
- Lelong, C.C.D.; Tshingomba, U.K.; Soti, V. Assessing Worldview-3 multispectral imaging abilities to map the tree diversity in semi-arid parklands. Int. J. Appl. Earth Obs. Geoinf. 2020, 93, 102211. [Google Scholar] [CrossRef]
- Ghassemian, H. A review of remote sensing image fusion methods. Inf. Fusion 2016, 1, 1–15. [Google Scholar] [CrossRef]
- Li, H.; Jing, L.; Tang, Y. Assessment of Pansharpening Methods Applied to WorldView-2 Imagery Fusion. Sensors 2017, 17, 89. [Google Scholar] [CrossRef] [PubMed]
- Duran, J.; Buades, A.; Coll, B.; Sbert, C.; Blanchet, G. A survey of pansharpening methods with a new band-decoupled variational model. ISPRS J. Photogramm. Remote Sens. 2017, 125, 78–105. [Google Scholar] [CrossRef]
- Mhangara, P.; Mapurisa, W.; Mudau, N. Comparison of Image Fusion Techniques Using Satellite Pour l’Observation de la Terre (SPOT) 6 Satellite Imagery. Appl. Sci. 2020, 10, 1881. [Google Scholar] [CrossRef]
- Ghodekar, H.R.; Deshpande, A.S.; Scholar, P.G. Pan-sharpening based on non-subsampled contourlet transform. Int. J. Eng. Sci. 2016, 1, 2831. [Google Scholar]
- Stavrakoudis, D.G.; Dragozi, E.; Gitas, I.Z.; Karydas, C.G. Decision Fusion Based on Hyperspectral and Multispectral Satellite Imagery for Accurate Forest Species Mapping. Remote Sens. 2014, 6, 6897–6928. [Google Scholar] [CrossRef]
- Lin, C.; Popescu, S.C.; Thomson, G.; Tsogt, K.; Chang, C.I. Classification of Tree Species in Overstorey Canopy of Subtropical Forest Using QuickBird Images. PLoS ONE 2015, 10, e0125554. [Google Scholar] [CrossRef] [PubMed]
- Gilbertson, J.; Kemp, J.; Van Niekerk, A. Effect of pan-sharpening multi-temporal Landsat 8 imagery for crop type differentiation using different classification techniques. Comput. Electron. Agric. 2017, 134, 151–159. [Google Scholar] [CrossRef]
- Witharana, C.; Bhuiyan, M.A.E.; Liljedahl, A.; Kanevskiy, M.; Epstein, H.; Jones, B.; Daanen, R.; Griffin, C.; Kent, K.; Jones, M. Understanding the synergies of deep learning and data fusion of multispectral and panchromatic high resolution commercial satellite imagery for automated ice-wedge polygon detection. ISPRS J. Photogramm. Remote Sens. 2020, 170, 174–191. [Google Scholar] [CrossRef]
- Ghosh, A.; Joshi, P.K. Assessment of pan-sharpened very high-resolution WorldView-2 images. Int. J. Remote Sens. 2013, 34, 8336–8359. [Google Scholar] [CrossRef]
- Gašparović, M.; Klobučar, D. Mapping Floods in Lowland Forest Using Sentinel-1 and Sentinel-2 Data and an Object-Based Approach. Forests 2021, 12, 553. [Google Scholar] [CrossRef]
- Yang, J.; Zhao, Y.-Q.; Chan, J.C.-W. Hyperspectral and Multispectral Image Fusion via Deep Two-Branches Convolutional Neural Network. Remote Sens. 2018, 10, 800. [Google Scholar] [CrossRef]
- Blaschke, T. Object based image analysis for remote sensing. ISPRS J. Photogramm. Remote Sens. 2010, 65, 2–16. [Google Scholar] [CrossRef]
- Immitzer, M.; Atzberger, C.; Koukal, T. Tree species classification with Random forest using very high spatial resolution 8-band worldView-2 satellite data. Remote Sens. 2012, 4, 2661–2693. [Google Scholar] [CrossRef]
- Whiteside, T.G.; Boggs, G.S.; Maier, S.W. Comparing object-based and pixel-based classifications for mapping savannas. Int. J. Appl. Earth Obs. Geoinf. 2011, 13, 884–893. [Google Scholar] [CrossRef]
- Su, T.; Zhang, S. Local and global evaluation for remote sensing image segmentation. ISPRS J. Photogramm. Remote Sens. 2017, 130, 256–276. [Google Scholar] [CrossRef]
- Hossain, M.D.; Chen, D. Segmentation for Object-Based Image Analysis (OBIA): A review of algorithms and challenges from remote sensing perspective. ISPRS J. Photogramm. Remote Sens. 2019, 150, 115–134. [Google Scholar] [CrossRef]
- Li, Y.; Xu, W.; Chen, H.; Jiang, J.; Li, X. A Novel Framework Based on Mask R-CNN and Histogram Thresholding for Scalable Segmentation of New and Old Rural Buildings. Remote Sens. 2021, 13, 1070. [Google Scholar] [CrossRef]
- Bhuiyan, M.A.E.; Witharana, C.; Liljedahl, A.K. Use of Very High Spatial Resolution Commercial Satellite Imagery and Deep Learning to Automatically Map Ice-Wedge Polygons across Tundra Vegetation Types. J. Imaging 2020, 6, 137. [Google Scholar] [CrossRef]
- Mahmoud, A.; Mohamed, S.; El-Khoribi, R.; AbdelSalam, H. Object Detection Using Adaptive Mask RCNN in Optical Remote Sensing Images. Int. J. Intell. Eng. Syst. 2020, 13, 65–76. [Google Scholar] [CrossRef]
- Zhao, K.; Kang, J.; Jung, J.; Sohn, G. Building extraction from satellite images using mask R-CNN with building boundary regularization. In Proceedings of the IEEE Conference on Computer Vision and Pattern Recognition Workshops, Salt Lake City, UT, USA, 18–22 June 2018; pp. 242–251. [Google Scholar]
- Ocer, N.; Jovanovska Kaplan, G.; Erdem, F.; Matci, D.; Avdan, U. Tree extraction from multi-scale UAV images using Mask R-CNN with FPN. Remote Sens. Lett. 2020, 11, 847–856. [Google Scholar] [CrossRef]
- Chiang, C.-Y.; Barnes, C.; Angelov, P.; Jiang, R. Deep Learning-Based Automated Forest Health Diagnosis from Aerial Images. IEEE Access 2020, 8, 144064–144076. [Google Scholar] [CrossRef]
- Michel, J.; Youssefi, D.; Grizonnet, M. Stable Mean-Shift Algorithm and Its Application to the Segmentation of Arbitrarily Large Remote Sensing Images. IEEE Trans. Geosci. Remote Sens. 2015, 53, 952–964. [Google Scholar] [CrossRef]
- Myint, S.W.; Gober, P.; Brazel, A.; Grossman-Clarke, S.; Weng, Q. Per-pixel vs. object-based classification of urban land cover extraction using high spatial resolution imagery. Remote Sens. Environ. 2011, 115, 1145–1161. [Google Scholar] [CrossRef]
- Immitzer, M.; Vuolo, F.; Atzberger, C. First Experience with Sentinel-2 Data for Crop and Tree Species Classifications in Central Europe. Remote Sens. 2016, 8, 166. [Google Scholar] [CrossRef]
- Clark, M.L.; Roberts, D.A. Species-level differences in hyperspectral metrics among tropical rainforest trees as determined by a tree-based classifier. Remote Sens. 2012, 4, 1820–1855. [Google Scholar] [CrossRef]
- Feret, J.-B.; Asner, G.P. Tree Species Discrimination in Tropical Forests Using Airborne Imaging Spectroscopy. IEEE Trans. Geosci. Remote Sens. 2013, 51, 73–84. [Google Scholar] [CrossRef]
- Cho, M.A.; Malahlela, O.; Ramoelo, A. Assessing the utility worldview-2 imagery for tree species mapping in south african subtropical humid forest and the conservation implications: Dukuduku forest patch as case study. Int. J. Appl. Earth Obs. Geoinf. 2015, 38, 349–357. [Google Scholar] [CrossRef]
- Ghosh, A.; Joshi, P.K. A comparison of selected classification algorithms for mapping bamboo patches in lower Gangetic plains using very high resolution WorldView 2 imagery. Int. J. Appl. Earth Obs. Geoinf. 2014, 26, 298–311. [Google Scholar] [CrossRef]
- Shojanoori, R.; Shafri, H.; Mansor, S.; Ismail, M.H. The use of worldview-2 satellite data in urban tree species mapping by object-based image analysis technique. Sains Malaysiana 2016, 45, 1025–1034. [Google Scholar]
- Li, D.; Ke, Y.; Gong, H.; Li, X. Object-Based Urban Tree Species Classification Using Bi-Temporal WorldView-2 and WorldView-3 Images. Remote Sens. 2015, 7, 16917–16937. [Google Scholar] [CrossRef]
- Majid, I.A.; Latif, Z.A.; Adnan, N.A. Tree Species Classification Using WorldView-3 Data. In Proceedings of the IEEE 7th Control and System Graduate Research Colloquium, UiTM Shah Alam, Shah Alam, Malaysia, 8 August 2016; pp. 73–76. [Google Scholar]
- Deur, M.; Gašparović, M.; Balenović, I. Tree Species Classification in Mixed Deciduous Forests Using Very High Spatial Resolution Satellite Imagery and Machine Learning Methods. Remote Sens. 2020, 12, 3926. [Google Scholar] [CrossRef]
- Gašparović, M.; Dobrinić, D.; Medak, D. Geometric accuracy improvement of WorldView-2 imagery using freely available DEM data. Photogramm. Rec. 2019, 34, 266–281. [Google Scholar] [CrossRef]
- Xu, Q.; Zhang, Y.; Li, B. Recent advances in pansharpening and key problems in applications. Int. J. Image Data Fusion 2014, 5, 175–195. [Google Scholar] [CrossRef]
- Gašparović, M.; Jogun, T. The effect of fusing Sentinel-2 bands on land-cover classification. Int. J. Remote Sens. 2018, 39, 822–841. [Google Scholar] [CrossRef]
- Zhang, Y. Understanding image fusion. Photogramm. Eng. Remote Sens. 2004, 70, 657–661. [Google Scholar]
- Wang, Z.; Ziou, D.; Armenakis, C.; Li, D.; Li, Q. A comparative analysis of image fusion methods. IEEE Trans. Geosci. Remote Sens. 2005, 43, 1391–1402. [Google Scholar] [CrossRef]
- Wang, Q.; Shi, W.; Li, Z.; Atkinson, P.M. Fusion of Sentinel-2 images. Remote Sens. Environ. 2016, 187, 241–252. [Google Scholar] [CrossRef]
- Karathanassi, V.; Kolokousis, P.; Ioannidou, S. A comparison study on fusion methods using evaluation indicators. Int. J. Remote Sens. 2007, 28, 2309–2341. [Google Scholar] [CrossRef]
- Fasbender, D.; Radoux, J.; Bogaert, P. Bayesian data fusion for adaptable image pansharpening. IEEE Trans. Geosci. Remote Sens. 2008, 46, 1847–1857. [Google Scholar] [CrossRef]
- De Luca, G.; Silva, J.M.N.; Cerasoli, S.; Araújo, J.; Campos, J.; Di Fazio, S.; Modica, G. Object-Based Land Cover Classification of Cork Oak Woodlands using UAV Imagery and Orfeo ToolBox. Remote Sens. 2019, 11, 1238. [Google Scholar] [CrossRef]
- Fukunaga, K.; Hostetler, L. The estimation of the gradient of a density function, with applications in pattern recognition. IEEE Trans. Inf. Theory 1975, 21, 32–40. [Google Scholar] [CrossRef]
- Orfeo ToolBox Documentation. Available online: https://www.orfeo-toolbox.org/CookBook/ (accessed on 17 December 2020).
- Breiman, L. Random Forests. Mach. Learn. 2001, 45, 5–32. [Google Scholar] [CrossRef]
- Cutler, D.R.; Edwards, T.C.; Beard, K.H.; Cutler, A.; Hess, K.T.; Gibson, J.; Lawler, J.J. Random Forests for Classification in Ecology. Ecology 2007, 88, 2783–2792. [Google Scholar] [CrossRef]
- Gašparović, M.; Dobrinić, D. Comparative Assessment of Machine Learning Methods for Urban Vegetation Mapping Using Multitemporal Sentinel-1 Imagery. Remote Sens. 2020, 12, 1952. [Google Scholar] [CrossRef]
- Pal, M. Random forest classifier for remote sensing classification. Int. J. Remote Sens. 2005, 26, 217–222. [Google Scholar] [CrossRef]
- Belgiu, M.; Drăguţ, L. Random forest in remote sensing: A review of applications and future directions. ISPRS J. Photogramm. Remote Sens. 2016, 114, 24–31. [Google Scholar] [CrossRef]
- Trisasongko, B.H.; Panuju, D.R.; Paull, D.J.; Jia, X.; Griffin, A.L. Comparing six pixel-wise classifiers for tropical rural land cover mapping using four forms of fully polarimetric SAR data. Int. J. Remote Sens. 2017, 38, 3274–3293. [Google Scholar] [CrossRef]
- Cohen, J. A Coefficient of Agreement for Nominal Scales. Educ. Psychol. Meas. 1960, 20, 37–46. [Google Scholar] [CrossRef]
- Pontius, R.G.; Millones, M. Death to Kappa: Birth of quantity disagreement and allocation disagreement for accuracy assessment. Int. J. Remote Sens. 2011, 32, 4407–4429. [Google Scholar] [CrossRef]
- Bechtel, B.; Demuzere, M.; Stewart, I.D. A Weighted Accuracy Measure for Land Cover Mapping: Comment on Johnson et al. Local Climate Zone (LCZ) Map Accuracy Assessments Should Account for Land Cover Physical Characteristics that Affect the Local Thermal Environment. Remote Sens. 2019, 11, 2420. Remote Sens. 2020, 12, 1769. [Google Scholar] [CrossRef]
- McNemar, Q. Note on the sampling error of the difference between correlated proportions or percentages. Psychometrika 1947, 12, 153–157. [Google Scholar] [CrossRef]
- Whyte, A.; Ferentinos, K.P.; Petropoulos, G.P. A new synergistic approach for monitoring wetlands using Sentinels -1 and 2 data with object-based machine learning algorithms. Environ. Model. Softw. 2018, 104, 40–54. [Google Scholar] [CrossRef]
- Pu, R.; Landry, S. A comparative analysis of high spatial resolution IKONOS and WorldView-2 imagery for mapping urban tree species. Remote Sens. Environ. 2012, 124, 516–533. [Google Scholar] [CrossRef]
- Dorigo, W.; Lucieer, A.; Podobnikar, T.; Carni, A. Mapping invasive Fallopia japonica by combined spectral, spatial, and temporal analysis of digital orthophotos. Int. J. Appl. Earth Obs. Geoinf. 2012, 19, 185–195. [Google Scholar] [CrossRef]
- Karlson, M.; Ostwald, M.; Reese, H.; Roméo, B.; Boalidioa, T. Assessing the potential of multi-seasonal WorldView-2 imagery for mapping West African agroforestry tree species. Int. J. Appl. Earth Obs. Geoinf. 2016, 50, 80–88. [Google Scholar] [CrossRef]
- Verlic, A.; Duric, N.; Kokalj, Z.; Marsetic, A.; Simoncic, P.; Ostir, K. Tree species classification using WorldView-2 satellite images and laser scanning data in a natural urban forest. Šumarski List 2014, 138, 477–488. [Google Scholar]
- Waser, L.T.; Küchler, M.; Jütte, K.; Stampfer, T. Evaluating the Potential of WorldView-2 Data to Classify Tree Species and Different Levels of Ash Mortality. Remote Sens. 2014, 6, 4515–4545. [Google Scholar] [CrossRef]
- Sabat-Tomala, A.; Raczko, E.; Zagajewski, B. Comparison of Support Vector Machine and Random Forest Algorithms for Invasive and Expansive Species Classification Using Airborne Hyperspectral Data. Remote Sens. 2020, 12, 516. [Google Scholar] [CrossRef]
- Kupidura, P. The Comparison of Different Methods of Texture Analysis for Their Efficacy for Land Use Classification in Satellite Imagery. Remote Sens. 2019, 11, 1233. [Google Scholar] [CrossRef]
- Lu, D.; Weng, Q. A survey of image classification methods and techniques for improving classification performance. Int. J. Remote Sens. 2007, 28, 823–870. [Google Scholar] [CrossRef]
- Peerbhay, K.Y.; Mutanga, O.; Ismail, R. Investigating the capability of few strategically placed WorldView-2 multispectral bands to discriminate forest species in KwaZulu-Natal, South Africa. IEEE J. Sel. Top. Appl. Earth Obs. Remote Sens. 2013, 7, 307–316. [Google Scholar] [CrossRef]
- Galal, O.; Onisimo, M.; Elfatih, M.A.-R.; Elhadi, A. Performance of Support Vector Machines and Artificial Neural Network for Mapping Endangered Tree Species Using WorldView-2 Data in Dukuduku Forest, South Africa. IEEE J. Sel. Top. Appl. Earth Obs. Remote Sens. 2015, 8, 4825–4840. [Google Scholar]
- Varin, M.; Chalghaf, B.; Joanisse, G. Object-Based Approach Using Very High Spatial Resolution 16-Band WorldView-3 and LiDAR Data for Tree Species Classification in a Broadleaf Forest in Quebec, Canada. Remote Sens. 2020, 12, 3092. [Google Scholar] [CrossRef]
- Wang, H.; Zhao, Y.; Pu, R.; Zhang, Z. Mapping Robinia Pseudoacacia Forest Health Conditions by Using Combined Spectral, Spatial, and Textural Information Extracted from IKONOS Imagery and Random Forest Classifier. Remote Sens. 2015, 7, 9020–9044. [Google Scholar] [CrossRef]
- Hartling, S.; Sagan, V.; Sidike, P.; Maimaitijiang, M.; Carron, J. Urban Tree Species Classification Using a WorldView-2/3 and LiDAR Data Fusion Approach and Deep Learning. Sensors 2019, 19, 1284. [Google Scholar] [CrossRef]
- Ibarrola-Ulzurrun, E.; Gonzalo-Martín, C.; Marcello, J. Influence of Pansharpening in Obtaining Accurate Vegetation Maps. Can. J. Remote Sens. 2017, 43, 528–544. [Google Scholar] [CrossRef]
- Benz, U.C.; Hofmann, P.; Willhauck, G.; Lingenfelder, I.; Heynen, M. Multiresolution, object-oriented fuzzy analysis of remote sensing data for GIS-ready information. ISPRS J. Photogramm. Remote Sens. 2004, 58, 239–258. [Google Scholar] [CrossRef]
- Clinton, N.; Holt, A.; Scarborough, J.; Yan, L.I.; Gong, P. Accuracy assessment measures for object-based image segmentation goodness. Photogramm. Eng. Remote Sens. 2010, 76, 289–299. [Google Scholar] [CrossRef]
- Drăguţ, L.; Csillik, O.; Eisank, C.; Tiede, D. Automated parameterisation for multi-scale image segmentation on multiple layers. ISPRS J. Photogramm. Remote Sens. 2014, 88, 119–127. [Google Scholar] [CrossRef]
- Prošek, J.; Šímová, P. UAV for mapping shrubland vegetation: Does fusion of spectral and vertical information derived from a single sensor increase the classification accuracy? Int. J. Appl. Earth Obs. Geoinf. 2019, 75, 151–162. [Google Scholar] [CrossRef]
- Yu, Q.; Gong, P.; Clinton, N.; Biging, G.; Kelly, M.; Schirokauer, D. Object-based detailed vegetation classification with airborne high spatial resolution remote sensing imagery. Photogramm. Eng. Remote Sens. 2006, 72, 799–811. [Google Scholar] [CrossRef]


Publisher’s Note: MDPI stays neutral with regard to jurisdictional claims in published maps and institutional affiliations. |
© 2021 by the authors. Licensee MDPI, Basel, Switzerland. This article is an open access article distributed under the terms and conditions of the Creative Commons Attribution (CC BY) license (https://creativecommons.org/licenses/by/4.0/).