Article

A2S-Det: Efficiency Anchor Matching in Aerial Image Oriented Object Detection

1
State Key Laboratory of Information Engineering in Surveying Mapping and Remote Sensing, Wuhan University, Wuhan 430079, China
2
School of Computer Science, Hubei University of Technology, Wuhan 430064, China
*
Author to whom correspondence should be addressed.
Remote Sens. 2021, 13(1), 73; https://doi.org/10.3390/rs13010073
Submission received: 17 November 2020 / Revised: 21 December 2020 / Accepted: 22 December 2020 / Published: 27 December 2020
(This article belongs to the Section Remote Sensing Image Processing)

Abstract

:
Object detection is a challenging task in aerial images, where many objects have large aspect ratios and are densely arranged. Most anchor-based rotating detectors assign anchors for ground-truth objects by a fixed restriction of the rotation Intersection-over-Unit ( I o U ) between anchors and objects, which directly follow horizontal detectors. Due to many directional objects with a large aspect ratio, the object-anchor I o U is heavily influenced by the angle, which may cause few anchors assigned for some ground-truth objects. In this study, we propose an anchor selection method based on sample balance assigning anchors adaptively, which we name the Self-Adaptive Anchor Selection ( A 2 S-Det) method. For each ground-truth object, A 2 S-Det selects a set of candidate anchors by horizontal I o U . Then, an adaptive threshold module is adopted on the set of candidate anchors, which calculates a boundary of these candidate anchors aiming to keep a balance between positive and negative anchors. In addition, we propose a coordinate regression of relative reference ( C R 3 ) module to precisely regress the rotating bounding box. We test our method on a public aerial image dataset, and prove better performance than many other one-stage detectors and two-stage detectors, achieving the m A P of 70.64. An efficiency anchor matching method helps the detector achieve better performance for objects with large aspect ratios.

1. Introduction

Object detection is a crucial task in aerial image information extraction. Unlike natural images, objects in aerial images may be densely arranged, in any direction and with large aspect ratios, which make it very challenging to precisely detect objects in aerial images. The scene where objects are densely arranged requires detectors to locate and identify a category precisely for each object. In addition, objects may be in any direction, which may cause missing objects in the dense scene by the postprocessing of non-maximum suppression ( N M S ) . Objects with large aspect ratios make it hard to extract features and predict the bounding box.
For objects in any direction, many rotating detectors based on common object detectors are proposed to detect objects as rotating rectangles, which originate from text detection, such as R R P N  [1] and R 2 C N N  [2]. Furthermore, the rotating object detection partly solves the problem of missing some objects caused by N M S where objects are densely arranged in aerial images. In the common detection, detectors are divided into two-stage detectors and one-stage detectors, where it has been generally thought that two-stage detectors perform better while one-stage detectors are faster. R R P N  [1] and R 2 C N N  [2] are both two-stage detectors. Considering the large amount of aerial images, the speed of detectors are also important. Recent evidences suggest that the one-stage detector also shows great potential in aerial image rotating object detection [3]. The Anchor-based method and the anchor-free method are two main approaches to define positive samples and negative samples. Anchor-based detectors adopt preset rectangles of different shapes in each feature point and assign these positive anchors to the corresponding ground-truth boxes by some certain rules. Anchor-free detectors define samples by points, grids, or other rules. Without preset anchors, anchor-free detectors save time in the label assignment process, but for objects densely arranged in aerial images, anchor-based detectors with dense anchors may be a good choice compared with anchor-free detectors. The characteristics of objects in aerial image may cause these challenges:
Samples are hard to be defined. Most anchor-based rotating detectors assign anchors by a restriction of the rotating I o U . As shown in Figure 1c, a small-angle deviation may lead to low I o U for objects with large aspect ratio, which may cause few anchor assigned for ground-truth objects.
Bounding boxes are hard to be regressed precisely. The sensitive rotating I o U of a large aspect ratio object means the predicted rotating bounding box must be very precise when using the rotating I o U as the evaluation method, compared with horizontal detectors.
As shown in Figure 1a, the ship object only selects one anchor as the positive anchor by the fixed restriction of I o U , where the fixed restriction is set to 0.5 . Figure 1b shows the I o U distribution of top-k anchors, which are divided into positive anchors and negative anchors by the I o U threshold. The I o U between anchors and objects with large aspect ratios is sensitive to the angle deviation. As shown in Figure 1c, the I o U between the box and rotating box with larger aspect ratios is smaller while the angle deviation is the same. In the anchor selection process, anchors are generated following certain rules, where there may be some deviation of location, box size, and angle from ground-truth objects. The difficulty of anchor selection in rotating object detection may cause inadequate training for objects with large aspect ratios.
In this paper, we discuss that the missing matching and low matching ratio between anchors and objects are two of the influencing factors for detector training, especially for objects with large aspect ratios. To solve these, we propose an anchor selection method based on sample balance to improve the anchor selection process, which consists of three modules. Firstly, candidate anchors are selected by a self-adaptive anchor selection module based on horizontal I o U , which will be divided into positive and negative anchors by the statistical threshold of rotating I o U . For the statistical threshold, a self-adaptive threshold module is devised to determine a threshold that keeps a balance between positive and negative anchors according to the rotating I o U in the set of candidate anchors. Finally, we design a coordinate regression of the relative reference module to predict the rotating bounding box precisely. In this module, there is some improvement in the coordinate regression and angle regression for rotating objects.
The contributions of this work are concluded as follows:
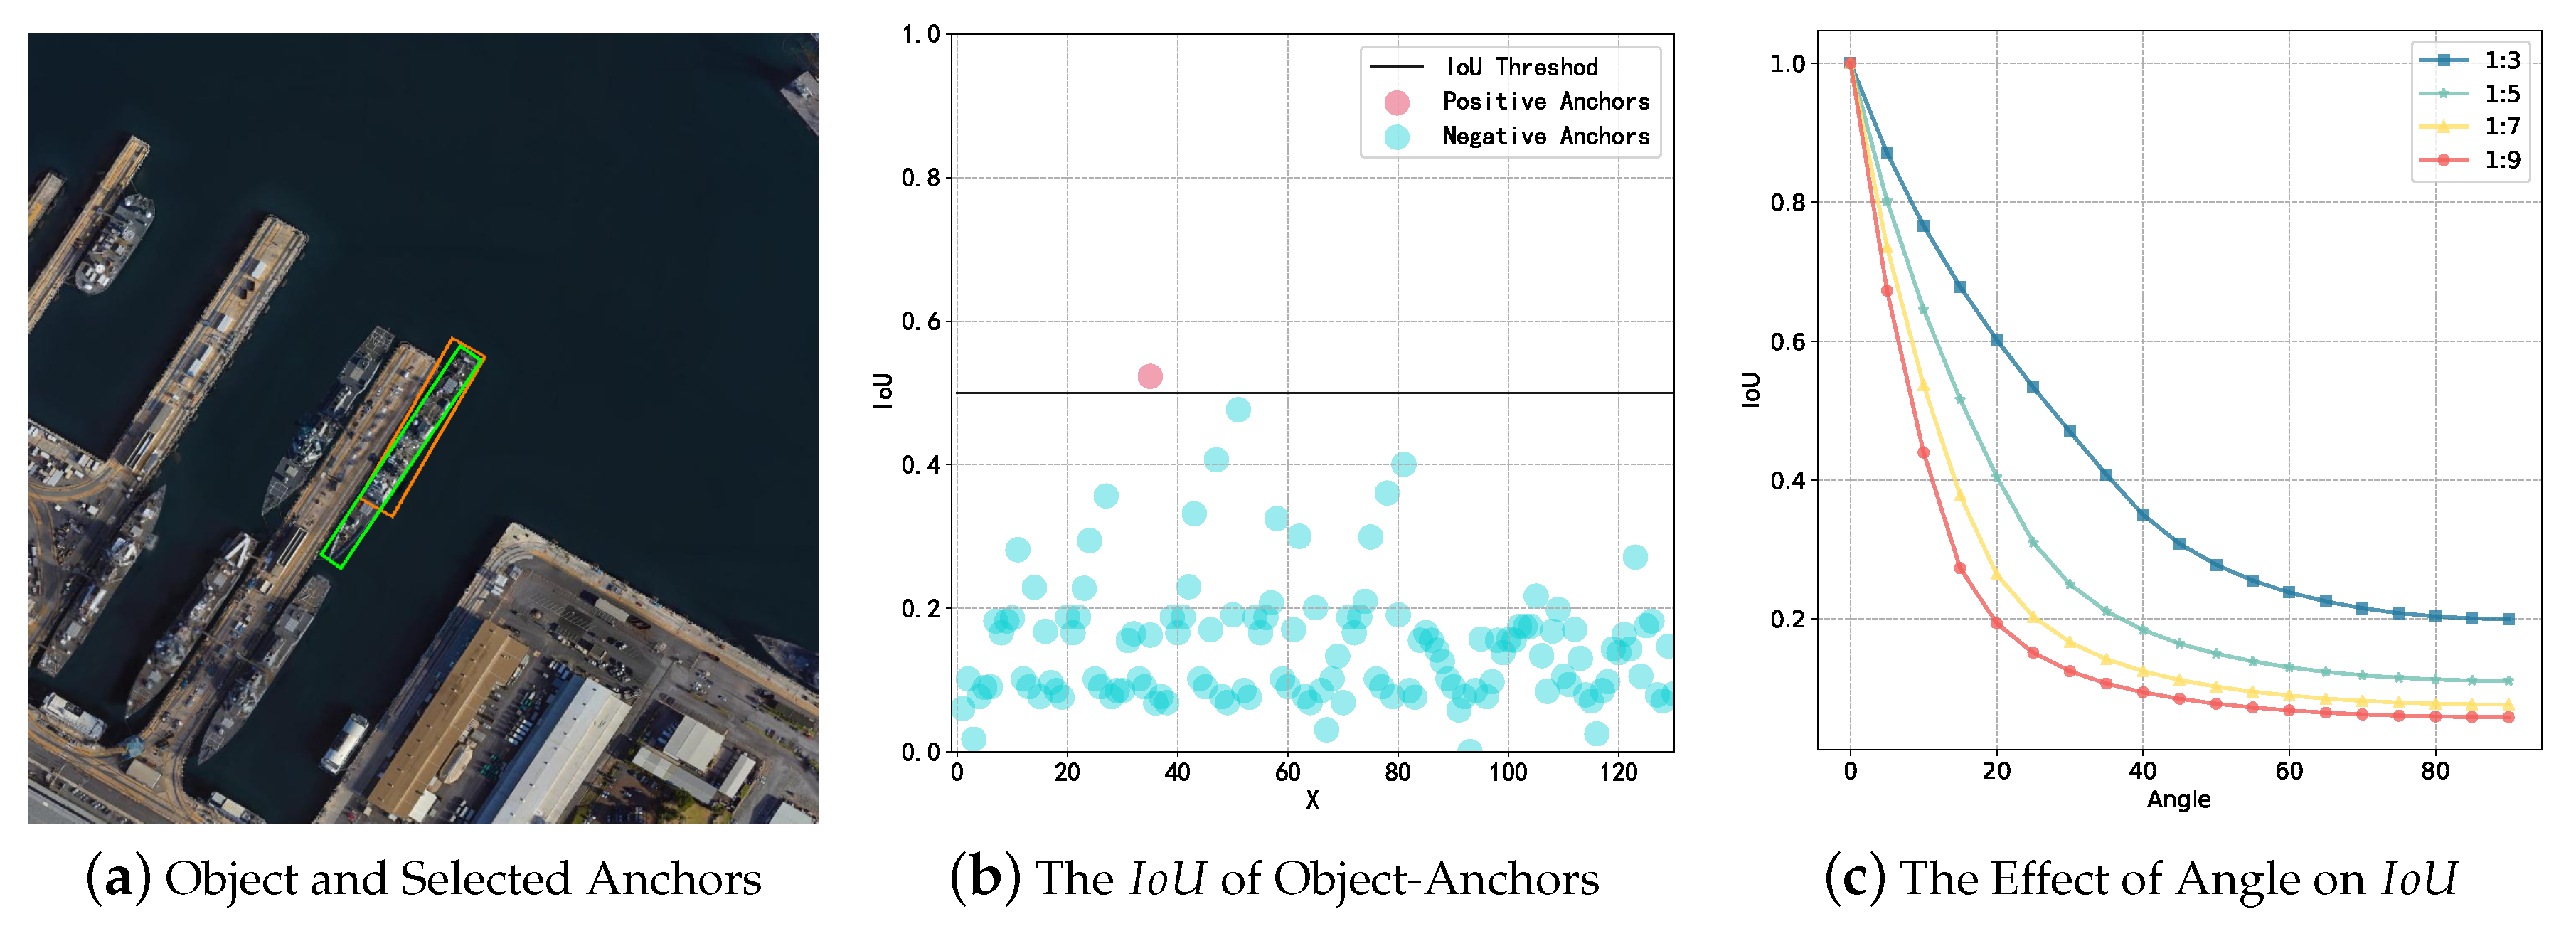
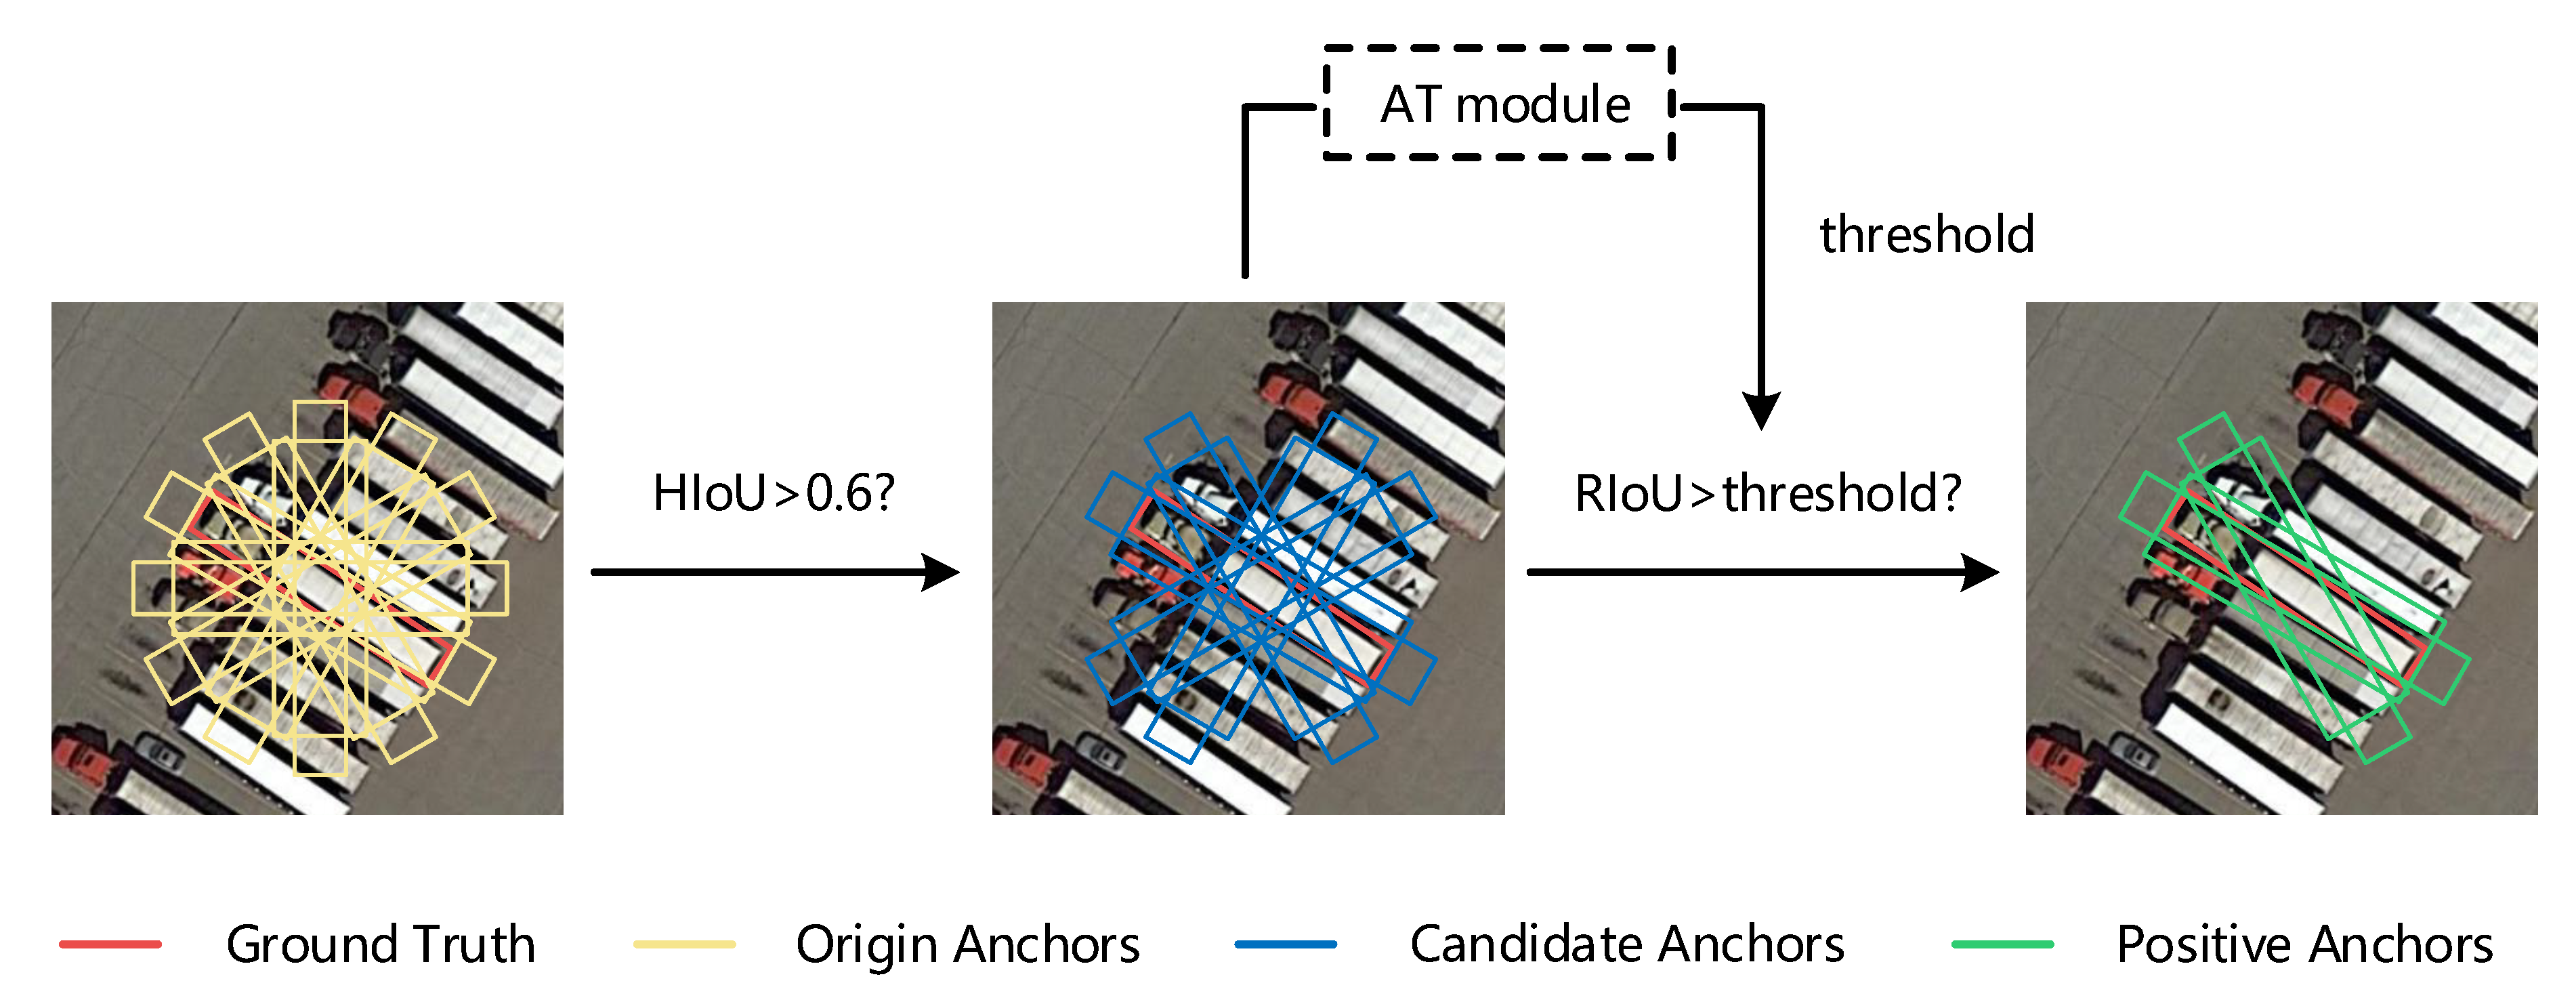
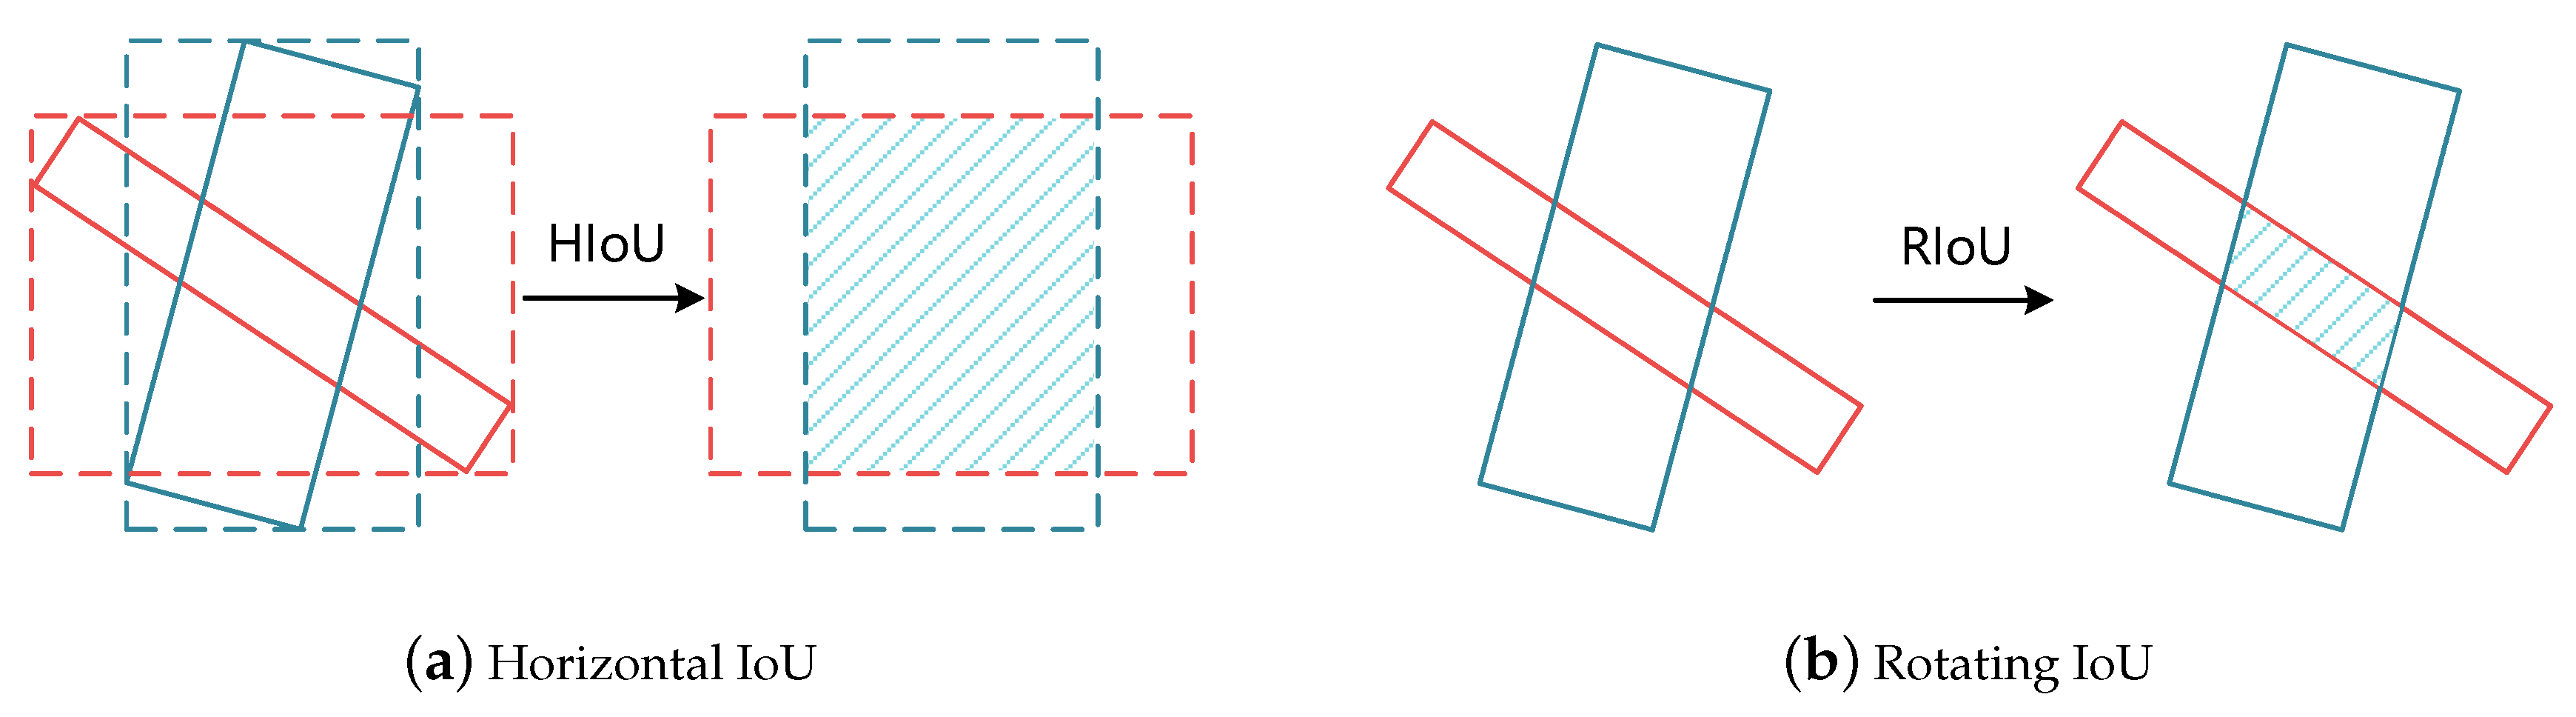
  • We propose an anchor selection method combining horizontal features and rotating features. For the set of candidate anchors, a self-adaptive threshold module based on sample balance is adopted to determine a threshold, which divides these candidate anchors into positive and negative anchors. There are larger improvements in DOTA [4] compared with the baseline for objects with large aspect ratios.
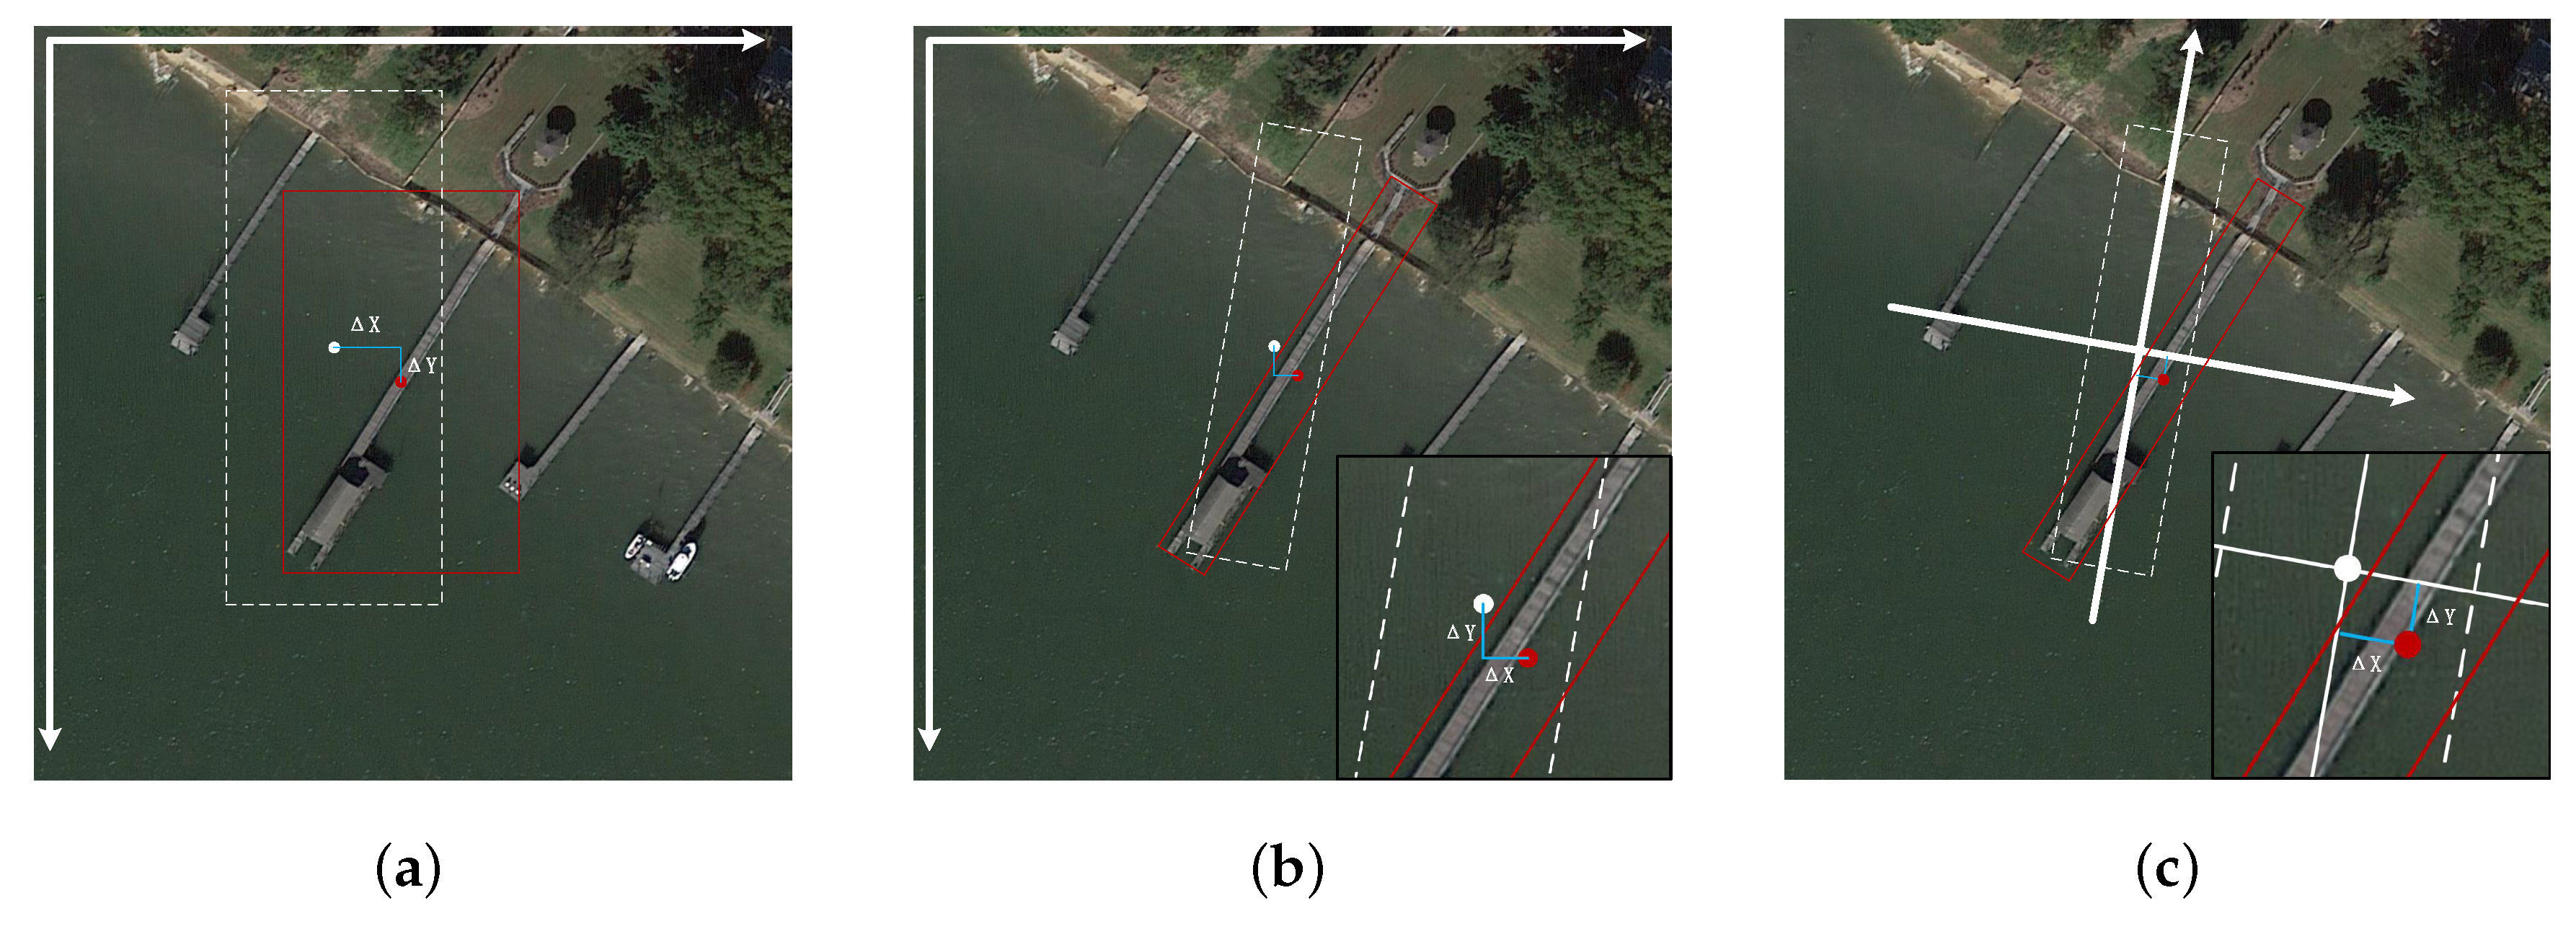
  • For bounding box prediction, the coordinate regression of the relative reference module can predict box more precisely and be to the benefit of more rigorous evaluations, like A P I o U = 0.75 .

2. Materials and Methods

2.1. Data

DOTA [4] is a large dataset for object detection in aerial images, which contains 2806 aerial images from different sensors and with different resolutions. The image size ranges from around 800 × 800 to 4000 × 4000 pixels. This dataset consists of 15 categories, including Plane, Ship, Bridge, Harbor, Baseball Diamond (BD), Ground Track Field (GTF), Small Vehicle(SV), Large Vehicle(LV), Tennis Court(TC), Basketball Court(BC), Storage Tank(ST), Soccer Ball Field(SBF), Roundabout (RA), Swimming Pool(SP), and Helicopter (HC). There are 188,282 instances in this dataset, which are labeled respectively by horizontal bounding boxes and rotating bounding boxes. The dataset is officially spilled into three parts of training, validation, test. We merge these two sets of training and validation for training and test on the test dataset by the official evaluation server. In the training process, we divide these images into 600 × 600 sub-images, whose overlaps are 200 pixels. Those sub-images without any objects are discarded directly. Finally, there are 30,250 sub-images for training.
Furthermore, we adopt online data augmentation if data augmentation is needed. The data augmentation method includes random rotation and random flip, whose probabilities of occurrence are both 50%. For the random rotation, the rotation angle randomly generates from 0 to 360 by the step of 15.

2.2. Related Work

Two-Stage Detectors. R-CNN [5] divides the detection process into the region proposal stage and regression stage, which develops a two-stage detector. Fast R-CNN is proposed to solve the problem of a heavy calculation burden by generating region proposals in the feature map. Two-Stage detectors consist mainly of region proposal network(RPN) and convolutional neural networks(CNN) from Faster C-NN [6]. The RPN module generates many proposals to distinguish foreground and background by the score, such as 0.7. Then, the CNN module randomly selects positive and negative proposals in a ratio of ( 3 / 1 ) for training. In the inference process, the RPN module generates quantitative proposals and the CNN module predicts the categories and the bounding boxes from these proposals, which avoids lots of windows and reduces computation. Many worthy two-stage detection method are proposed from then, such as Mask R-CNN [7], FPN [8], OHEM [9], Context-Aware [10], etc.
One-Stage Detectors. Although the two-stage detectors are faster than before. The speed is still so slow to satisfy the needs of real-time detection. Different from two-stage detectors, one-stage detectors define positive and negative samples based on points in the feature map, whose inference speed is faster. Unlike two-stage detectors like YOLO [11], which compute image features for anchors of each feature point, anchors make use of the feature maps and compute class probability and bounding box based on the corresponding anchor. There is a weakness that negative samples are far more than positive samples, which makes the training process difficult. To solve this problem, RetinaNet [12] proposed the focal loss to keep a balance of loss between positive loss and negative loss, which makes it possible to train a one-stage high-detector with high performance. Many one-stage detectors are proposed today, such as FCOS [13], CenterNet [14], etc.
Rotation Detectors. Rotation target detection is derived from text detection. RRPN [1] proposed a rotation region proposal network based on Faster R-CNN [6] to detect text with direction. RRPN defines a rotation box as ( x , y , w , h , θ ) while Faster R-CNN [6] defines a horizontal box as ( x , y , w , h ) . ( x , y ) indicates the centroid coordinates of rotation box. ( w , h ) indicates the width and height of rotation box. θ indicates the direction of rotation box relative to the horizontal coordinate system. R 2 C N N  [2] defines rotation box as ( x 1 , y 1 , x 2 , y 2 , w , h ) . ( x 1 , y 1 ) and ( x 2 , y 2 ) mean the coordinates of the first two points. ( w , h ) is the same as definition in RRPN [1]. In addition, R 2 C N N  [2] proposed a special RoI Pooling method, whose pooled size are 7 × 7 , 3 × 11 and 11 × 3 . There are many other outstanding rotation detectors applicating in text detection, such as EAST [15], DRBOX [16], TextBoxes++ [17], etc. In aerial image target detection, many high-performance detectors are proposed. RoI transfromer [18] proposed an RRoI learner to learn direction information from horizontal anchors, which reduces the amount of computation compared with the RRPN module. R3Det [3] proposed a feature refinement module to reconstruct the feature map, which achieves the purpose of feature alignment. In R3Det [3], it is proved that one-stage detectors also have huge potential in aerial image target detection. Many rotation detectors aim at how to define rotation boxes and how to define samples. For instance, Axis-learning [19] predicts the axis of rotation objects based on the idea of anchor free, which has good performance and inference fast. O2-DNet [20] define boxes as two middle lines and the intersection point of middle lines. There are many other high-performance rotation detectors, such as SCRDet [21], Gliding Vertex [22], CenterMap OBB [23], etc.
Label Assignment. ATSS [24] discusses that anchor-based method(RetinaNet [12]) perform as well as anchor free method(FCOS [13]) if the method of sample definition is similar. What affects the performance is the method to define positive and negative samples instead of how to regress the box. It matters little whether regressions by anchors or by points. Therefore, ATSS [24] proposed an adaptive training sample selection method defining samples by a dynamic threshold. FreeAnchor [25] proposed that the largest k IoU of anchors are potential positive samples. When calculating loss, each anchor has a weight which determines the regression effect. At the beginning of training, all anchors have similar weights due to a bad regression effect, but as the training goes on, some anchors regress well and weights improve. At the ending of training, there are only several anchors whose weights are far beyond other anchors. In brief, FreeAnchor [25] defines positive and negative samples by prediction, which is a special method of label assignment. MAL [26] proposed a multiple anchor learning method to assess positive anchors in the anchor bag selected by I o U . The assessment method combines the score of classification and location. PISA [27] indicates that what affects performance most is not the hard sample, but the prime sample.

2.3. Method

We adopt backbone, feature pyramid network, and detector head as basic structures. Similar to RetinaNet [12], there are several rotation anchors for each point in the feature map, which are in charge of predicting objects. For the detector head, we propose a coordinate regression module based on the relative reference module. In the training process, we propose a self-adaptive anchor selection module to define positive anchors and negative anchors, which can keep a balance between these anchors. In general, our work focuses on the training process and rotation detector head.

2.3.1. Network Architecture

Our main network architecture uses ResNet architecture with a Feature Pyramid Network backbone to extract rich, multi-scale, directional feature information from images. As shown in Figure 2, ResNet generates C 3 , C 4 and C 5 , which denote P 3 to P 7 of feature pyramid network. Furthermore, P 3 to P 7 are the feature levels for prediction, whose feature map size are the down-sampling ratio of ( 8 , 16 , 32 , 64 , 128 ) times of input image. In this paper, all input images are resized into 800 × 800. There are two subnetworks in charge of predicting category and bounding box for each P i , where i = 3 , 4 , 5 , 6 , 7 . The final feature map of category prediction branch predicts K values representing K categories for each anchor in each feature point where there are A anchors in each feature point. The predicting values are transformed into the probability of each category by S i g m o i d function. In the bounding box predicting branch, the final feature map predicts a tuple of ( δ x , δ y , δ w , δ h , δ θ ) representing the deviation relative to the anchor, which needs to be decode into ( x , y , w , h , θ ) . In addition, two subnetworks share the same parameter weights of all feature levels, which greatly reduces computation. The network architecture is almost the same as RetinaNet [12], except using rotating anchors and predicting a tuple of 5 values in the output feature map of the bounding box predicting branch. The details of implementation for those differences are represented in Section 2.3.4 and Section 2.3.6.

2.3.2. Self-Adaptive Anchor Selection

The baseline rotating detector derives from RetinaNet and has an imbalance performance on objects with different aspect ratios. Due to the inflexible anchor selection process, objects with large aspect ratios match fewer anchors for training. We propose a self-adaptive anchor selection method which can define anchors adaptively. As shown in Figure 3, there are many anchors for the object and these anchors are disorderly. Candidate anchors are selected by horizontal I o U , which ensures that the horizontal features correspond. Then, positive anchors are selected by rotating I o U , using an adaptive threshold computed by the A T module.
In this section, the self-adaptive anchor selection method combines horizontal features and rotating features. As shown in Algorithm 1, there are the set of ground-truth boxes( G ) on the image and the set of anchors( A ) for all feature map. In the training process, each anchor in A is either assigned to one of the ground-truth boxes( G ) or defined as a negative anchor. Firstly, we compute the horizontal I o U and the rotating I o U between A and G , represented as H D and R D . For each anchor, the ground-truth box which has the max rotating I o U is assigned to this anchor, ensuring only one ground-truth box for an anchor. Secondly, a set of candidate anchors is selected by a conditional inequality( H D g 0.6 ) for each ground-truth box(g). Thirdly, we compute a threshold T g based on a statistical method to distinguish the candidate anchors. The function of self-adaptive computing T g is described in Section 2.3.3 and discussed in Section 4.1. For each candidate anchor(d), the anchor is assigned to the ground-truth box(g) and defined as a positive anchor if R I o U ( d , g ) T g . Finally, a set of positive anchors(P) is selected by this algorithm and the rest of the anchors are defined as negative anchors(N).
Algorithm 1 Self-Adaptive Anchor Selection
  • Require: 
       G is a set of ground-truth boxes on the image
       L is the number of feature pyramid levels
       A is a set of all anchor boxes  
  • Ensure: 
       P is a set of positive samples
       N is a set of negative samples  
1:
compute RIOU between A and G: RD = R I o U ( A , G ) ;  
2:
build an empty set for candidate positive samples of the ground-truth G: C M a x ( R D )  ;
3:
for each ground-truth g G do
4:
    compute HIOU between C g and g: HD g = H I o U ( C g , g ) ;  
5:
    remove those anchors whose HIOU are less than 0.6: C g where HD g 0.6
6:
     D g = C g RD g ;  
7:
    compute threshold T g on the basis of statistical method: T g = F u n ( D g )
8:
    for each candidate d D g do
9:
      if R I o U ( d , g ) T g then
10:
         P = P d ;
11:
      end if 
12:
    end for 
13:
 end for 
14:
  N = A P ;  
15:
 return P , N ;
Moreover, we define horizontal I o U and rotating I o U as Figure 4. For the horizontal I o U , the rotating box is transformed into the horizontal box based on the vertexes of the rotating box and the horizontal I o U is computed based on the horizontal boxes. For the rotating I o U , the computing method is the same as the common I o U , using the rotating intersection area and the rotating box area.

2.3.3. Self-Adaptive Threshold Based on Sample Balance

In Section 2.3.2, we discuss the algorithm flow of the self-adaptive anchor selection method. There is a key problem, which is how to compute the threshold( T g ) adaptively. Functions based on statistical methods are reasonable. Statistical data varies from different samples. Mean value and standard deviation are common statistical parameters, whose combination is a common method to describe the normal distribution. In this section, we discuss how to describe the distribution of positive and negative samples correctly. In general, anchors are divided into positive anchors and negative anchors by I o U , and they can be formulated as:
A i i s p o s i t i v e + T g R I o U ( A g , g ) , a n d A i C g n e g a t i v e o t h e r s .
Here, R I o U ( A g , g ) means the rotating I o U between the anchor( A i ) and the object(g). T g is a key parameter to divide positive anchors and negative anchors. ( M e a n + S t d ) may be an effective method to divide anchors while I o U between anchors and objects is a normal distribution. For those objects with large aspect ratios, the distribution of I o U may be random. The adaptive anchor selection method aims at finding a rotating I o U boundary to divide these anchors into two sets and keeping a balance between positive anchors and negative anchors. The algorithm can be described as:
a r g m i n F ( T g )
s . t . F ( T g ) = | S t d ( C 1 ) S t d ( C 2 ) | , c T g , a n d c C 1 , c > T g , a n d c C 2 , C 1 C 2 = C g .
The Formula (2) and (3) describes this problem as an optimization problem. The key problem is how to define sample balance and solve T g . The standard deviation reflects the dispersion degree of data. In this formula, the standard deviation is adopted to describe the stability of the rotating I o U . The optimization goal is to minimize | S t d ( C 1 ) S t d ( C 2 ) | , which represents the balance degree between these two sets( C 1 , C 2 ). The solving process of T g will be complicated if a precise solution is needed. Considering both speed and effectiveness, this part adopts an estimation method to compute a rough T g :
T g ( 0 , s t e p , 1 ) , a n d s t e p = 0.01 .
Then, the algorithm can be simplified as:
a r g m i n F ( T g )
s . t . F ( T g ) = | S t d ( C 1 ) S t d ( C 2 ) | , c T g , a n d c C 1 , c > T g , a n d c C 2 , C 1 C 2 = C g , T g ( 0 , s t e p , 1 ) , a n d s t e p = 0.01 .

2.3.4. Coordinate Regression of Relative Reference

In common detector, the box regression method is shown as (a) in Figure 5. This box regression method of the horizontal detector is used in most rotating detectors, which is shown as (b) in Figure 5. The box encoding method can be described as:
t x = x x a w a t y = y y a y a t w = ln ( w w a w a ) t h = ln ( h h a h a ) t θ = θ θ a 180 π
( x , y , w , h , θ ) represents bounding box of the object while ( x a , y a , w a , h a , θ a ) represents bounding box of the anchor. For objects, ( x , y ) is the centroid coordinates of bounding box. ( w , h ) represents width and height. θ represents the rotation angle of bounding box. ( t x , t y , t w , t h , t θ ) is values which we want to regress precisely, representing the offsets relative to the corresponding anchor.
The edges of the box are parallel to the axies of the image in horizontal detection while there is an angle between the rotating box and axies of the image in rotating detection. Therefore, the coordinate regression method of horizontal detection can not well describe the relation between ( δ x , δ y ) and rotating I o U in rotating detection. To solve this problem, we propose a coordinate regression method based on relative reference. The new coordinate encoding method is shown as:
δ x = ( x x a ) c o s ( θ a ) ( y y a ) s i n ( θ a ) , t x = δ x w a δ y = ( y y a ) c o s ( θ a ) + ( x x a ) s i n ( θ a ) , t y = δ y h a
We establish the coordinate system which takes ( x a , y a ) as the origin. The X-axis and the Y-axis are separately parallel to the width and height of the anchor. The new coordinate system and ( δ x , δ y ) are shown in Figure 5c. In the inference process, the corresponding coordinate decoding method can be described as:
δ x = r e g x w a c o s ( θ a ) + r e g y h a s i n ( θ a ) , p r e d x = δ x + x a δ y = r e g y h a c o s ( θ a ) r e g x h a s i n ( θ a ) , p r e d y = δ y + y a
( r e g x , r e g y ) represents the coordinate for network output, which needs to be decoded to ( p r e d x , p r e d y ) . The angle ( θ ) of the rotating box also needs to be predicted. The angle is usually defined in [ 90 , 90 ] , which may cause ambiguity in the border. For instance, the δ θ between −89° and 89° should be 2° instead of 178°. The new theta encoding method is shown as:
t θ = ( θ θ a ) + 180 , ( θ θ a ) ( 180 ° , 90 ° ) ( θ θ a ) + 180 , ( θ θ a ) ( 90 ° , 180 ° ) θ θ a , ( θ θ a ) ( 90 ° , 90 ° )
Combined with the formula of ( 3 ) , ( 4 ) and ( 6 ) , the box regression method based on relative reference can be described as:
t x = t x t y = t y t w = ln ( w w a w a ) t h = ln ( h h a h a ) t θ = t θ 180 π

2.3.5. Loss

The loss function consists of classification loss and regression loss. Classification loss calculates loss of all anchors, including positive anchors and negative anchors. Regression loss calculates loss only for those positive anchors. It can be formulated as:
L = λ 1 N p o s · L r e g { p o s i t i v e } + λ 2 N p o s · L c l s
L c l s and L r e g are classification loss and regression loss. The classification loss is f o c a l l o s s while the regression loss is Smooth L1 loss. ( λ 1 , λ 2 ) represents the weight of L c l s and L r e g , which are hyperparameters. N p o s is the number of positive anchors. ( t x , t y , t w , t h , t θ ) is the input parameter of Smooth L1, which can be formulated as:
S m o o t h L 1 { p o s i t i v e } = 0.5 ( Δ i Δ i p r e d ) 2 | Δ i Δ i p r e d | β , i = t x , t y , t w , t h , t θ ( | Δ i Δ i p r e d | 0.5 β ) o t h e r s , i = t x , t y , t w , t h , t θ .

2.3.6. Implementation Details

The code of the proposed method is implemented with PyTorch [28] and based on RetinaNet [12]. For some rotating modules, we refer to RRPN [1]. In this paper, we adopt ResNet-50 and ResNet-101 as the backbone network with the initialization of the pre-trained model. There are two Nvidia GeForce RTX 2080 Ti GPUs with 11G memory for experiments. We train the model for 24 epoch, about 90 k iterations on DOTA. Stochastic gradient descent(SGD) is adopted to train the model. The learning rate is initialized at 0.01 and decays to 10% of the current learning rate at the 60 k and 82.5 k learning rate decay steps. The weight decay and momentum are 0.001 and 0.9. In the anchor generation process, the aspect ratios are set to ( 1 / 1 , 3 / 1 , 5 / 1 ) . The anchor angles are set to ( 60 ° , 30 ° , 0 ° , 30 ° , 60 ° , 90 ° ) . The anchor scales are set to (0.2, 4), which means the anchor scales are ( 0.2 1 / 4 , 0.2 2 / 4 , 0.2 3 / 4 , 0.2 4 / 4 ). There are 72 anchors for each feature point and 960k anchors totally. Loss parameters are the same as RetinaNet [12], including focal loss and smooth L1 loss. In the inference and evaluation stage, the prediction is judged to be correct if the confidence score is greater than 0.1. Furthermore, the threshold of Non-Maximum Suppression ( N M S ) is set to 0.15 for each category.

3. Results

A 2 S-Det is compared with other rotating detectors in Table 1 under the evaluation method of A P I o U = 0.5 . In the inference process, we divide test images into 600 with the overlap of 200, referring to R3Det [3]. A 2 S-Det has better performance than most detectors in Table 1, including one-stage detectors [3,12,19,20,29,30,31] and two-stage detectors [1,2,6,18,32]. On Ship, Small Vehicle(SV), Large Vehicle(LV), Basketball Court(BC), Storage Tank(ST), Swimming Pool(SP), our method achieves the best performance. For categories with large aspect ratios, A 2 S-Det has a distinct advantage compared with other detectors where the self-adaptive anchor selection method improves the anchor selection process. The visualizations of predictions are shown in Figure 6.
Our method aims to improve the performance for objects with large aspect ratios but does not achieve the best performance on B r i d g e and H a r b o r . IENet [31] achieves the best performance on B r i d g e and R3Det [3] achieves the best performance on H a r b o r . The mAP of A 2 S-Det is very close to the mAP of R3Det [3] on H a r b o r , which respectively are 65.29% and 65.44%. For B r i d g e , the mAP of A 2 S-Det is lower than several state-of-art detectors(IENet [31], O 2 -DNet [20], and R3Det [3]). From another perspective, there are 3.01% increase compared with the baseline(RetinaNet-R [12]) under no data augmentation on B r i d g e , as shown in Figure 2.
As shown in Figure 2, A 2 S-Det has worse performance than the baseline on several categories, such as Baseball Diamond(BD), Basketball Court(BC), and Helicopter (HC). As opposed to objects with large aspect ratios, the aspect ratios of these objects are close to 1. Under these circumstances, A 2 S-Det may define many anchors with high I o U into negative anchors, which are not conducive to the training process, but there are few impacts for P l a n e and S t o r a g e T a n k , whose aspect ratios are also close to 1. Taken as a whole, there is a large number of objects for P l a n e and S t o r a g e T a n k , which can make up the deficiency of the anchor selection process.

4. Discussion

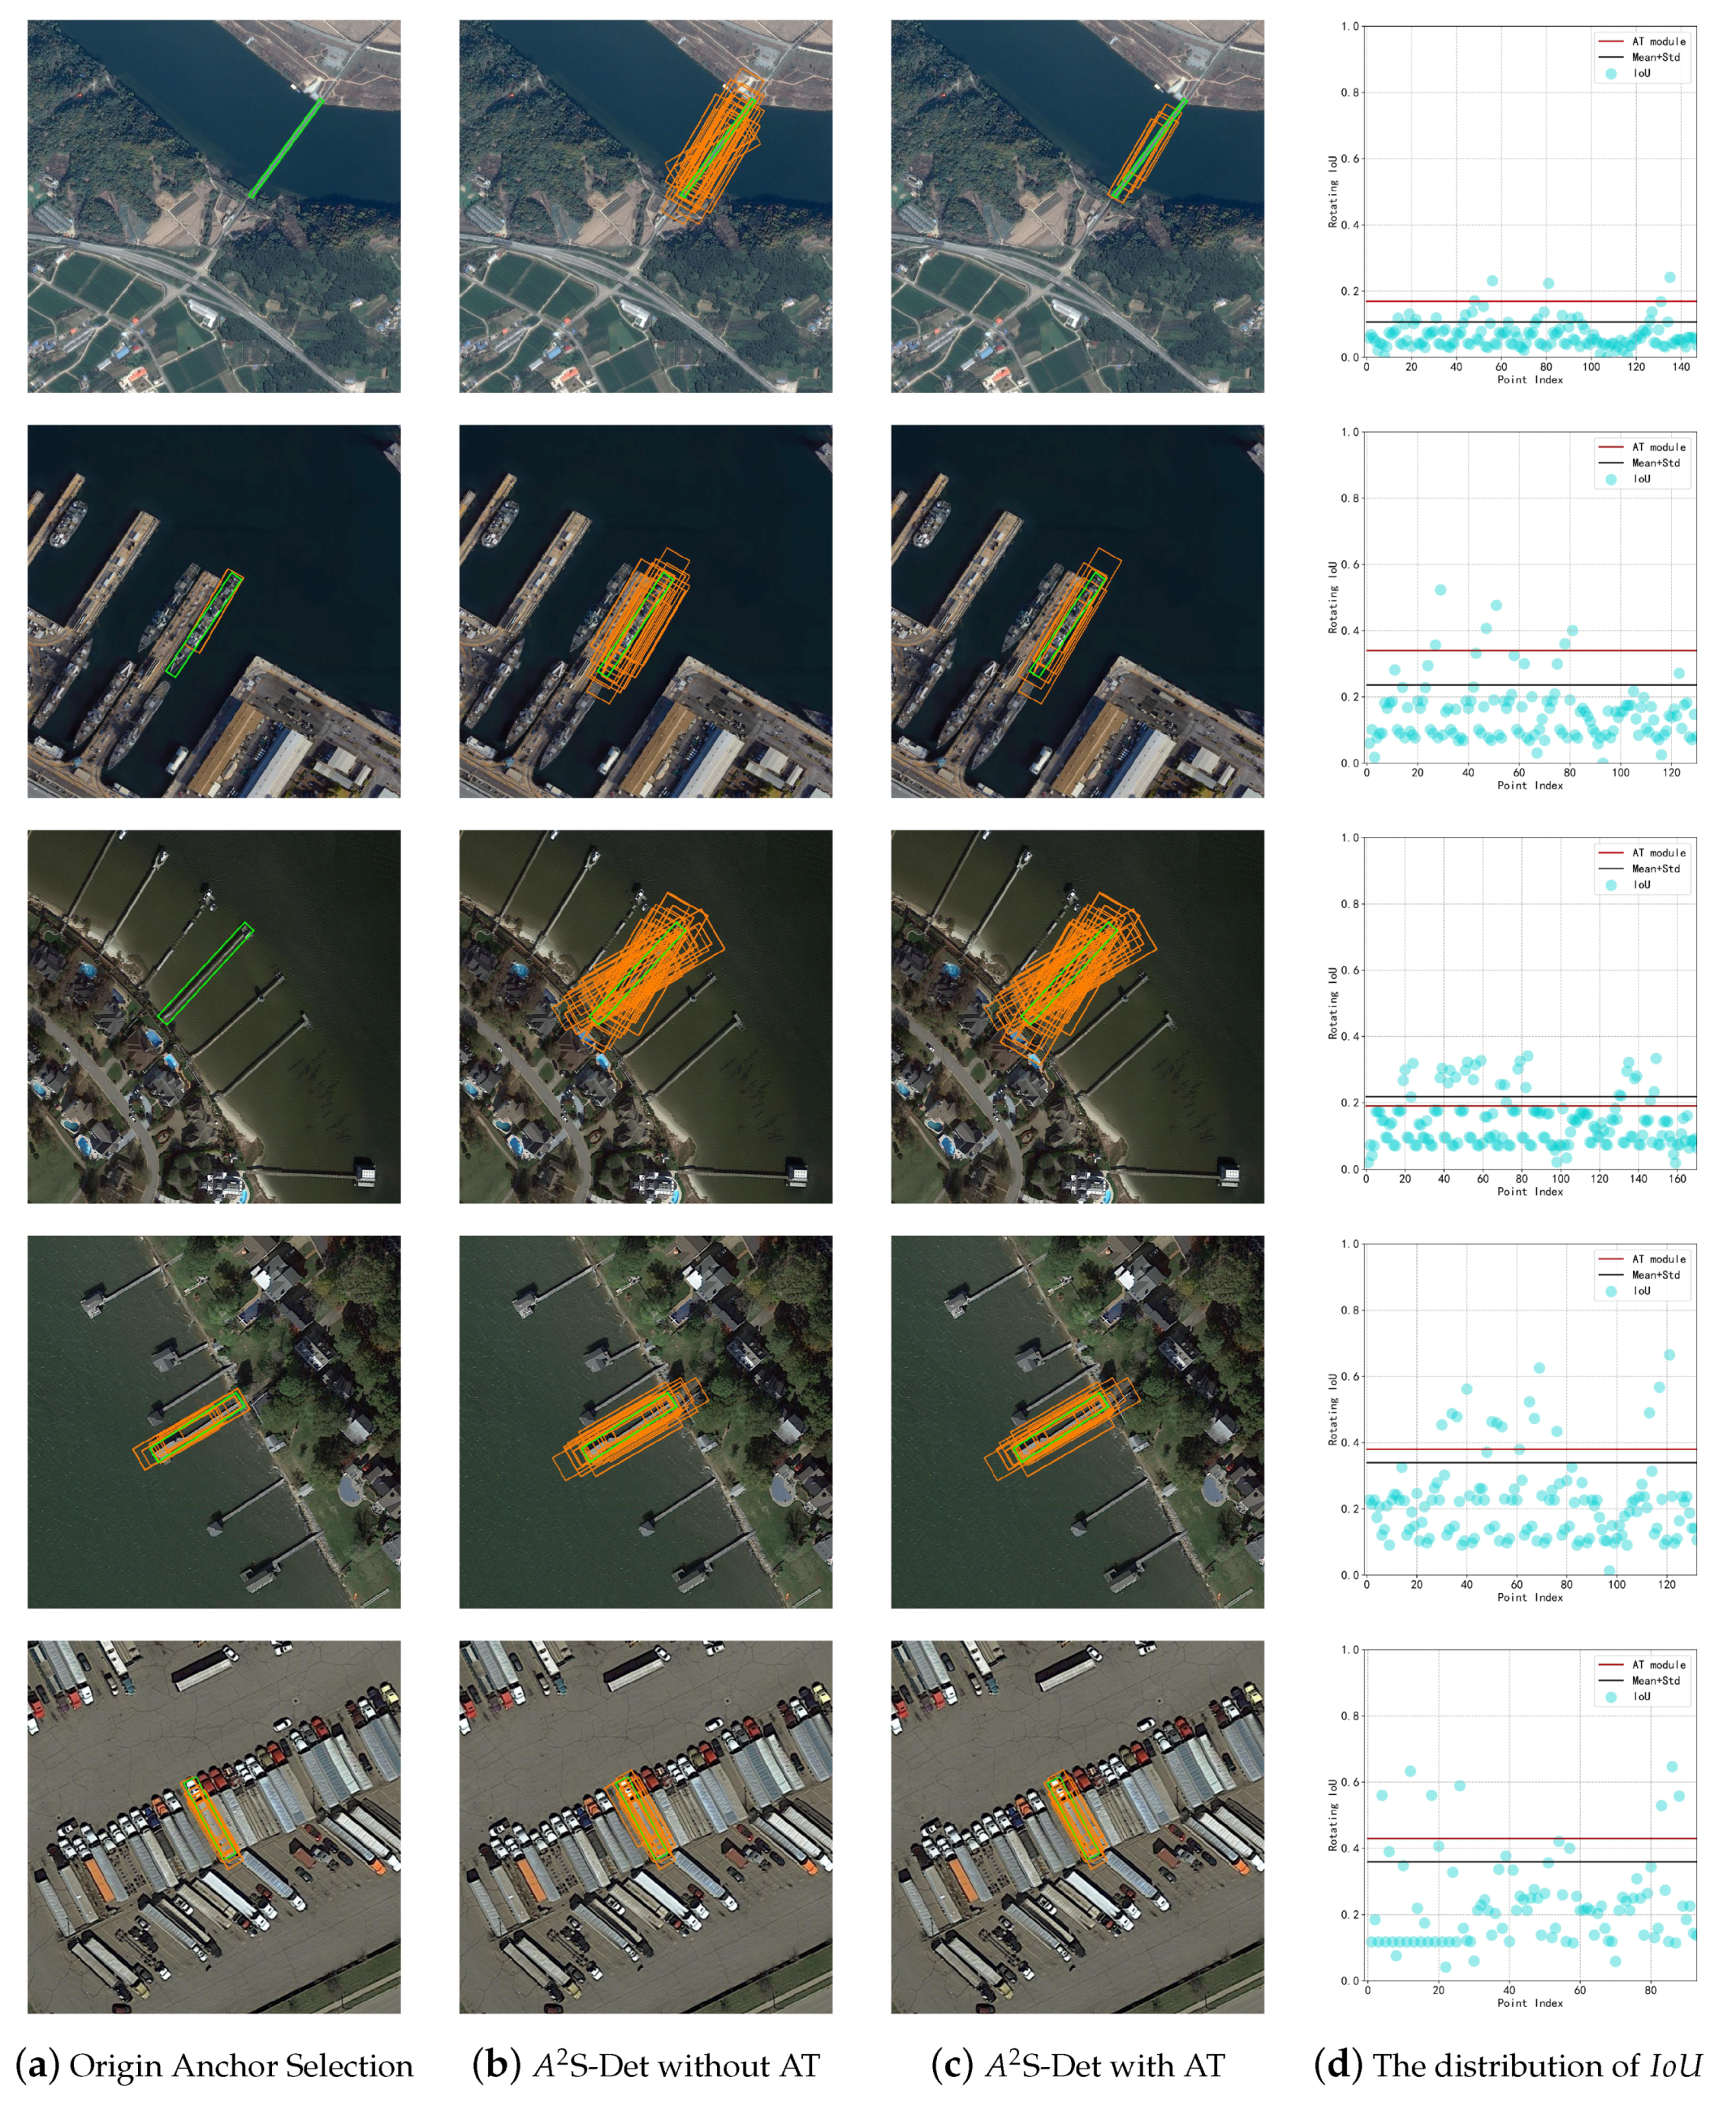
4.1. Effectiveness of Self-Adaptive Anchor Selection
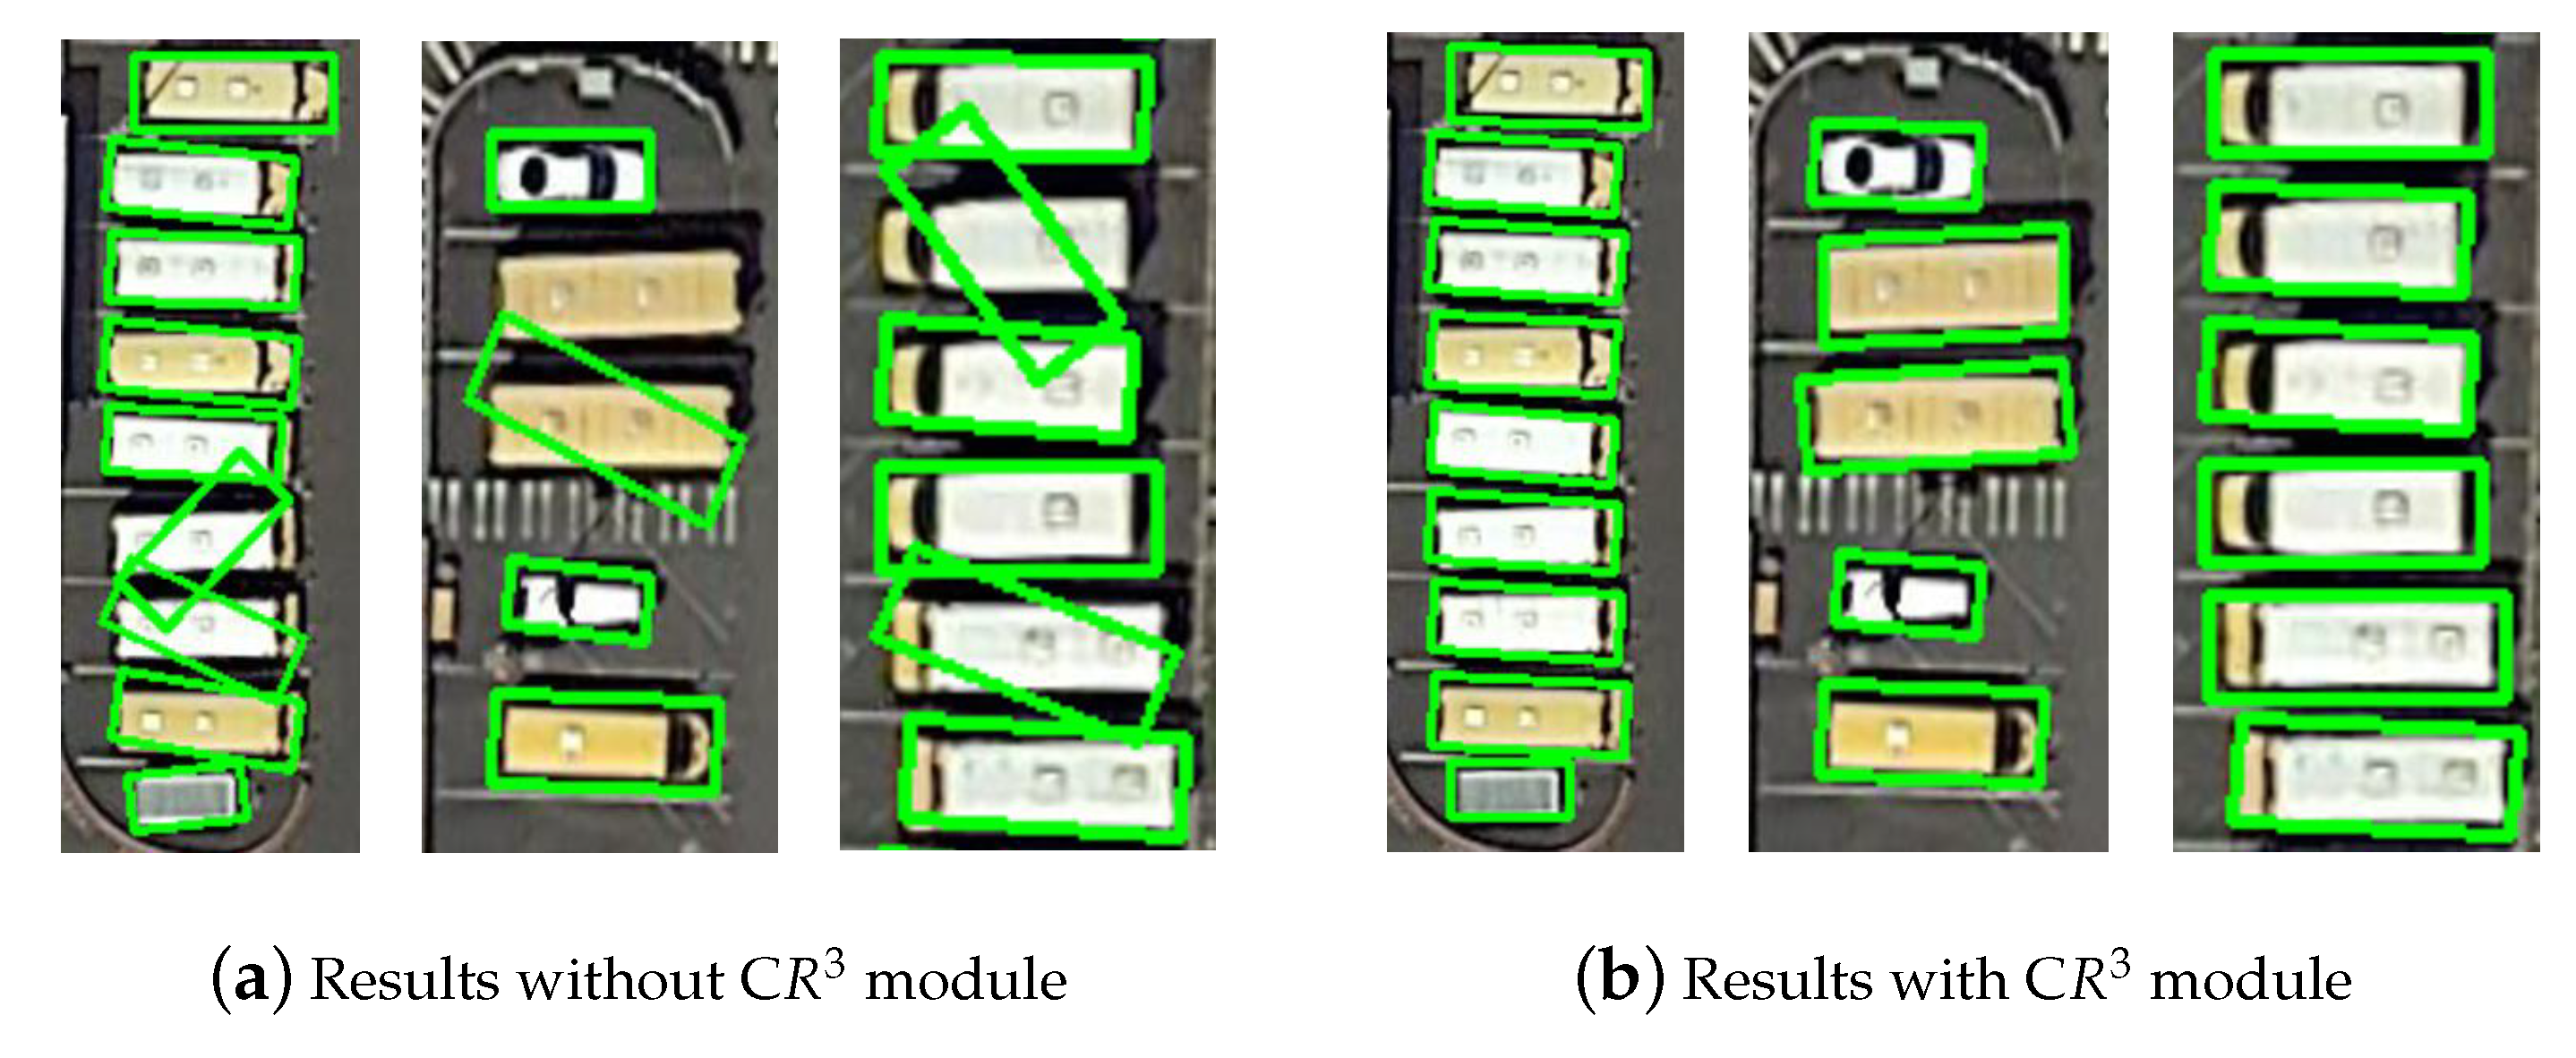
In Section 1, we discuss that there are some weaknesses in rotating detection when using the traditional anchor selection method. The self-adaptive anchor selection method proposed in the Section 2.3.2 is effective, especially for objects with large aspect ratios. As shown in Table 2, A 2 S-Det with A T module has 1.12% improvements on the evaluation method of m A P I o U = 0.5 , compared with the baseline R e t i a n N e t -R [12]. For objects with large aspect ratios, there are 2.46% increase for the b r i d g e , 3.06% increase for the S V , 0.25% increase for the L V and 4.73% increase for the h a r b o r . Moreover, the A T module plays an important role in A 2 S-Det. In this paper, A 2 S-Det without A T module adopts (Mean+Std) to define positive anchors and negative anchors. From the Table 2, A 2 S-Det with A T module has 0.31% improvements, compared with A 2 S-Det without A T module. For those objects with large aspect ratios, there are 1.89% increase for the b r i d g e , 0.3% increase for the L V and 3.95% increase for the h a r b o r . The A 2 S-Det and A T module are very effective in terms of both objects with large aspect ratios and the whole result.
Due to the randomness in anchor generation, defining anchors by a fixed restriction of rotating I o U may lead to few positive anchor in the training process. In Figure 7, we compare the differences of anchor visualization of these three anchor selection methods. The origin anchor selection method in (a) defines positive samples by a fixed I o U threshold. For objects with large aspect ratios, this anchor selection method may cause matching no anchor, such as bridge and harbor. Compared with the origin anchor selection, A 2 S-Det which is a flexible anchor selection method performs better in the anchor selection process, especially for objects with large aspect ratios. In A 2 S-Det, a set of candidate anchors selected by horizontal I o U can avoid matching no anchor in some special situation. A 2 S-Det without AT module use the function of ( m e a n + s t d ) as the threshold to distinguish samples, which is an empirical value. The A T module can adaptively find a boundary between the set of positive samples and the set of negative samples. As shown in Figure 7, selected positive anchors in (c) seem more regular than positive anchors in (b), which is more obvious in images with bridge and harbor. From the distribution of I o U in (d), the A T module can divide the candidate anchors into positive anchors and negatives anchors by the characteristics of I o U distribution, instead of an empirical value.

4.2. Effectiveness of C R 3 Module

C R 3 module proposed in Section 2.3.4 solves the problem of inaccurate regression. As shown in Table 2, C R 3 module has a positive influence. In the benchmark of A 2 S-Det without C R 3 module, there is a total 0.39% increase if C R 3 module is applied to A 2 S-Det. For those objects with large aspect ratios, there is an obvious increase, especially for B r i d g e , L V , S h i p , and H a r b o r . What is more, there are 0.55% increase for b r i d g e , 0.3% increase for L V , and 0.5% increase for h a r b o r . Just from the view of A v e r a g e P r e c i s i o n ( A P ) , C R 3 module may not have a big advantage while the increase of AP is not obvious. For evaluating if a target is detected correctly, the rotating I o U threshold is set to 0.5 in Evaluation-Server [4]. The object is considered to be detected correctly if the rotating I o U between the predicted bounding box and the ground-truth box is greater than the threshold. As shown in Figure 8, the bounding box of A 2 S-Det with C R 3 module regress better than the bounding box of A 2 S-Det without C R 3 module. Due to the rotating I o U threshold of 0.5, most predicted boxes are judged as correct while there is a little deviation in the regression of bounding box, such as results in Figure 8. Whether regressing precisely has a greater influence on objects with larger aspect ratios( b r i d g e , h a r b o r , L V ).
The official evaluation server only support A P I o U = 0.5 . To verify the reasoning, we train the model on training dataset and test on validation dataset, whose performance evaluation method uses A P I o U = 0.75 and A P . A P means we test the model from A P I o U = 0.5 to A P I o U = 0.95 , where the I o U step is 0.05, and calculate the average value as A P . As shown in Table 3, A 2 S-Det without C R 3 performs better than A 2 S-Det with C R 3 for the b r i d g e and the h a r b o r on A P I o U = 0.5 , but on A P I o U = 0.75 , there are 1.52% increase for the b r i d g e and 1.01% increase for the h a r b o r on A 2 S-Det with C R 3 . On the stricter evaluation method(like A P I o U = 0.75 ), the impact of C R 3 module is more obvious, such as the L V , the B C and the S B F .

4.3. Advantages and Limitations

The anchor-based rotating detectors are very dependent on anchor parameters and the positive-negative threshold, which are hard to be adjusted. The anchor parameters affect the anchor generation process, indirectly affecting the anchor selection process, such as aspect ratios, angels, and scales. Moreover, the anchor selection process is directly affected by the positive-negative threshold. As is discussed in Section 1, there are some situations where some objects with large aspect ratios match few anchors for training, leading to inadequate training and bad performance. A 2 S-Det combines horizontal features and rotating features and selects anchors entirely based on the distribution of the rotating I o U . Our method solves the problem of the missing matching and low matching ratio between anchors and objects, especially for objects with large aspect ratios. As the visualizations of the anchor selection process in Figure 7 shows, A 2 S-Det is suitable for both general situations and extreme situations. For predicting rotating bounding boxes, the C R 3 module helps regress the rotating bounding box precisely. As shown in Table 1, our method has better performance than most rotating detectors, showing great potential on those objects with large aspect ratios. The Table 2 shows there are big improvements when the modules proposed in Section 2.3.2, Section 2.3.3 and Section 2.3.4 are applied in the baseline(RetinaNet-R [12]).
Combining horizontal features with rotating features and searching for an appropriate threshold based on the balance of samples provide a possible direction to improve the anchor matching process. For objects with large ratio aspects, horizontal features benefit the category classification while rotating features benefit the box regression, but it takes up a lot of computation to calculate both the rotating I o U and the horizontal I o U , which may be simplified in future work. In this paper, we explore how to define positive anchors and negative anchors by the distribution of anchors. The anchor matching process is considered as an optimization problem, whose goal is to keep a balance between positive anchors and negative anchors. To reduce the amount of calculation and achieve end-to-end training, we simplify the goal function and the solving process. As shown in Table 1 and Table 2, considering the anchor matching process as an optimization problem shows great potential.
There are also some limitations of this method. Firstly, the angle deviation has a little impact for objects whose aspect ratios are close to 1, such as P l a n e , B D , S T , B C , R A , and H C . Therefore, the self-adaptive anchor selection method based on the distribution of the rotating I o U is not suitable for all categories. In Table 2, there are 0.51% decreases for B D , 2.7% decreases for B C and 1.93% decreases for H C on A P I o U = 0.5 when A 2 S-Det is compared with the baseline. Benefiting from a large number of objects, the AP of A 2 S-Det does not decline on P l a n e and S T . This limitation may lead to low AP for the object whose height is close to width if there is a small number of objects. Further, this method increases the training time. Both the rotating I o U and the horizontal I o U are needed in A 2 S-Det, and the threshold solving process in the A T module costs a lot of time. The training time of A 2 S-Det nearly doubles the baseline. The inference process of A 2 S-Det is almost unaffected, whose inference time is very close to the baseline. There are some inadequacies of the proposed method on m A P compared with some state-of-art rotating detectors. The I o U can not describe the relationship between positive anchors and objects well. We will aim to adopt a better way to describe it and improve this method in the future.

5. Conclusions

We have presented a self-adaptive anchor selection method based on the one-stage detector. Aiming at objects with large aspect ratios, three modules are proposed in this paper, which are the self-adaptive anchor selection module, the A T module, and the C R 3 module. A 2 S-Det improves the prediction performance of objects with large aspect ratios by improving the anchor selection process. The C R 3 helps regress the rotating bounding box more precisely. Further, we design several experiments on DOTA [4] dataset and prove that these modules are effective in aerial image object detection. Our approach has better performance than many other state-of-art rotating detectors according to m A P I o U = 0.5 , achieving the m A P of 70.64. Compared with the baseline detector, there is an averagely 1.51% increase when these three modules are applied. For objects with large ratio aspects, the increases of m A P range from 0.09% to 5.23%. The results prove that an efficient anchor matching method helps the detector learn better feature information and achieve better performance for objects with large ratio aspects. In future work, we will aim to improve this method and explore more potential methods of label assignment to improve the detection performance in aerial images.

Author Contributions

Conceptualization, Z.X., K.W., and C.X.; methodology, K.W.; software, Q.W. and X.T.; validation, F.X. and K.W.; formal analysis, K.W.; investigation, Q.W. and K.W.; resources, Z.X.; data curation, F.X., X.T.; writing—original draft preparation, K.W.; writing—review and editing, Z.X. and X.T.; visualization, K.W.; supervision, Z.X. and C.X.; project administration, Z.X.; and funding acquisition, Z.X. and C.X. All authors have read and agreed to the published version of the manuscript.

Funding

This research received no external funding.

Data Availability Statement

The source code used in this study is available in [https://github.com/RSIA-LIESMARS-WHU/A2S-DET].

Acknowledgments

The numerical calculations in this paper have been done on the supercomputing system in the Supercomputing Center of Wuhan University.

Conflicts of Interest

The authors declare no conflict of interest.

Abbreviations

The following abbreviations are used in this manuscript:
A 2 S-Detself-adaptive anchor selection
C R 3 coordinate regression of relative reference
A T self-adaptive threshold
I o U intersection over unit
N M S non-maximum suppression
B D baseball diamond
G T F ground track field
SVsmall vehicle
L V large vehicle
T C tennis court
B C basketball court
S T storage tank
S B F soccer ball field
R A roundabout
S P swimming pool
H C helicopter
S t d standard deviation
A P average precision

References

  1. Ma, J.; Shao, W.; Ye, H.; Wang, L.; Wang, H. Arbitrary-Oriented Scene Text Detection via Rotation Proposals. IEEE Trans. Multimed. 2017, 20, 3111–3122. [Google Scholar] [CrossRef] [Green Version]
  2. Jiang, Y.; Zhu, X.; Wang, X.; Yang, S.; Li, W.; Wang, H.; Fu, P.; Luo, Z. R2cnn: Rotational region cnn for orientation robust scene text detection. arXiv 2017, arXiv:1706.09579. [Google Scholar]
  3. Yang, X.; Liu, Q.; Yan, J.; Li, A.; Zhang, Z.; Yu, G. R3det: Refined single-stage detector with feature refinement for rotating object. arXiv 2019, arXiv:1908.05612. [Google Scholar]
  4. Xia, G.S.; Bai, X.; Ding, J.; Zhu, Z.; Belongie, S.; Luo, J.; Datcu, M.; Pelillo, M.; Zhang, L. DOTA: A large-scale dataset for object detection in aerial images. In Proceedings of the IEEE Conference on Computer Vision and Pattern Recognition, Salt Lake City, UT, USA, 18–22 June 2018; pp. 3974–3983. [Google Scholar]
  5. Girshick, R.; Donahue, J.; Darrell, T.; Malik, J. Rich Feature Hierarchies for Accurate Object Detection and Semantic Segmentation. In Proceedings of the IEEE Conference on Computer Vision and Pattern Recognition, Columbus, OH, USA, 23–28 June 2014; pp. 580–587. [Google Scholar]
  6. Ren, S.; He, K.; Girshick, R.; Sun, J. Faster R-CNN: Towards Real-Time Object Detection with Region Proposal Networks. arXiv 2015, arXiv:cs.CV/1506.01497. [Google Scholar] [CrossRef] [Green Version]
  7. Kaiming, H.; Georgia, G.; Piotr, D.; Ross, G. Mask R-CNN. In Proceedings of the IEEE International Conference on Computer Vision (ICCV), Venice, Italy, 22–29 October 2017; pp. 2980–2988. [Google Scholar]
  8. Lin, T.Y.; Dollár, P.; Girshick, R.; He, K.; Hariharan, B.; Belongie, S. Feature pyramid networks for object detection. In Proceedings of the IEEE Conference on Computer Vision and Pattern Recognition, Honolulu, HI, USA, 21–26 July 2017; pp. 936–944. [Google Scholar]
  9. Shrivastava, A.; Gupta, A.; Girshick, R. Training region-based object detectors with online hard example mining. In Proceedings of the IEEE Conference on Computer Vision and Pattern Recognition, Las Vegas, NV, USA, 27–30 June 2016; pp. 761–769. [Google Scholar]
  10. Gong, Y.; Xiao, Z.; Tan, X.; Sui, H.; Xu, C.; Duan, H.; Li, D. Context-Aware Convolutional Neural Network for Object Detection in VHR Remote Sensing Imagery. IEEE Trans. Geosci. Remote Sens. 2020, 58, 34–44. [Google Scholar] [CrossRef]
  11. Redmon, J.; Divvala, S.; Girshick, R.; Farhadi, A. You only look once: Unified, real-time object detection. In Proceedings of the IEEE Conference on Computer Vision and Pattern Recognition, Las Vegas, NV, USA, 27–30 June 2016; pp. 779–788. [Google Scholar]
  12. Lin, T.Y.; Goyal, P.; Girshick, R.; He, K.; Dollár, P. Focal Loss for Dense Object Detection. In Proceedings of the IEEE International Conference on Computer Vision, Venice, Italy, 22–29 October 2017; pp. 2999–3007. [Google Scholar]
  13. Tian, Z.; Shen, C.; Chen, H.; He, T. FCOS: Fully Convolutional One-Stage Object Detection. In Proceedings of the 2019 IEEE/CVF International Conference on Computer Vision (ICCV), Seoul, Korea, 27 October–2 November 2019; pp. 9626–9635. [Google Scholar]
  14. Zhou, X.; Wang, D.; Krähenbühl, P. Objects as Points. arXiv 2019, arXiv:1904.07850. [Google Scholar]
  15. Zhou, X.; Yao, C.; Wen, H.; Wang, Y.; Zhou, S.; He, W.; Liang, J. East: An efficient and accurate scene text detector. In Proceedings of the IEEE Conference on Computer Vision and Pattern Recognition, Honolulu, HI, USA, 21–26 July 2017; pp. 2642–2651. [Google Scholar]
  16. Liu, L.; Pan, Z.; Lei, B. Learning a rotation invariant detector with rotatable bounding box. arXiv 2017, arXiv:1711.09405. [Google Scholar]
  17. Liao, M.; Shi, B.; Bai, X.; Wang, X.; Liu, W. Textboxes: A fast text detector with a single deep neural network. arXiv 2016, arXiv:1611.06779. [Google Scholar]
  18. Ding, J.; Xue, N.; Long, Y.; Xia, G.S.; Lu, Q. Learning roi transformer for detecting oriented objects in aerial images. arXiv 2018, arXiv:1812.00155. [Google Scholar]
  19. Xiao, Z.; Qian, L.; Shao, W.; Tan, X.; Wang, K. Axis Learning for Orientated Objects Detection in Aerial Images. Remote Sens. 2020, 12, 908. [Google Scholar] [CrossRef] [Green Version]
  20. Wei, H.; Zhang, Y.; Chang, Z.; Li, H.; Wang, H.; Sun, X. Oriented Objects as pairs of Middle Lines. arXiv 2020, arXiv:cs.CV/1912.10694. [Google Scholar]
  21. Yang, X.; Yang, J.; Yan, J.; Zhang, Y.; Zhang, T.; Guo, Z.; Xian, S.; Fu, K. SCRDet: Towards More Robust Detection for Small, Cluttered and Rotated Objects. arXiv 2018, arXiv:cs.CV/1811.07126. [Google Scholar]
  22. Xu, Y.; Fu, M.; Wang, Q.; Wang, Y.; Bai, X. Gliding vertex on the horizontal bounding box for multi-oriented object detection. IEEE Trans. Pattern Anal. Mach. Intell. 2020. [Google Scholar] [CrossRef] [PubMed] [Green Version]
  23. Wang, J.; Yang, W.; Li, H.; Zhang, H.; Xia, G. Learning Center Probability Map for Detecting Objects in Aerial Images. IEEE Trans. Geosci. Remote Sens. 2020, 1–17. [Google Scholar] [CrossRef]
  24. Zhang, S.; Chi, C.; Yao, Y.; Lei, Z.; Li, S.Z. Bridging the Gap Between Anchor-based and Anchor-free Detection via Adaptive Training Sample Selection. arXiv 2019, arXiv:cs.CV/1912.02424. [Google Scholar]
  25. Zhang, X.; Wan, F.; Liu, C.; Ji, R.; Ye, Q. FreeAnchor: Learning to Match Anchors for Visual Object Detection. arXiv 2019, arXiv:cs.CV/1909.02466. [Google Scholar]
  26. Ke, W.; Zhang, T.; Huang, Z.; Ye, Q.; Liu, J.; Huang, D. Multiple Anchor Learning for Visual Object Detection. arXiv 2019, arXiv:cs.CV/1912.02252. [Google Scholar]
  27. Cao, Y.; Chen, K.; Loy, C.C.; Lin, D. Prime Sample Attention in Object Detection. arXiv 2019, arXiv:cs.CV/1904.04821. [Google Scholar]
  28. Paszke, A.; Gross, S.; Massa, F.; Lerer, A.; Bradbury, J.; Chanan, G.; Killeen, T.; Lin, Z.; Gimelshein, N.; Antiga, L.; et al. PyTorch: An Imperative Style, High-Performance Deep Learning Library. In Advances in Neural Information Processing Systems; Wallach, H., Larochelle, H., Beygelzimer, A., d’Alché-Buc, F., Fox, E., Garnett, R., Eds.; Curran Associates, Inc.: Red Hook, NY, USA, 2019; pp. 8026–8037. [Google Scholar]
  29. Liu, W.; Anguelov, D.; Erhan, D.; Szegedy, C.; Reed, S.; Fu, C.Y.; Berg, A.C. SSD: Single Shot MultiBox Detector. In Computer Vision—ECCV 2016; Leibe, B., Matas, J., Sebe, N., Welling, M., Eds.; Springer International Publishing: Cham, Switzerland, 2016; pp. 21–37. [Google Scholar]
  30. Redmon, J.; Farhadi, A. YOLO9000: Better, Faster, Stronger. arXiv 2016, arXiv:1612.08242. [Google Scholar]
  31. Lin, Y.; Feng, P.; Guan, J. IENet: Interacting Embranchment One Stage Anchor Free Detector for Orientation Aerial Object Detection. arXiv 2019, arXiv:cs.CV/1912.00969. [Google Scholar]
  32. Yang, X.; Sun, H.; Fu, K.; Yang, J.; Sun, X.; Yan, M.; Guo, Z. Automatic ship detection in remote sensing images from google earth of complex scenes based on multiscale rotation dense feature pyramid networks. Remote Sens. 2018, 10, 132. [Google Scholar] [CrossRef] [Green Version]
Figure 1. Aspect ratio heavily affects the anchor selection process while R e t i n a N e t is applied to rotating object detection. (a) visualizations of the ground-truth object and selected anchors; (b) the I o U distribution of object-anchors and anchors selection process; (c) the effect of angle on I o U for objects with different aspect ratios.
Remotesensing 13 00073 g001
Figure 2. The main structure of our detector and training process. (1) A in this figure means there are A rotation anchors in each feature point and K means there are K categories needing to be predicted; (2) The values of points in label map mean which target this anchor matches; (3) The positive anchor set is selected by a fixed threshold of horizontal I o U (referred to as H I o U ), which is a rough selection; (4) AT module calculates the threshold based on the distribution of the rotating I o U (referred to as R I o U ) and the final positive anchors are selected by this threshold in the subtle selection process; (5) ( δ x , δ y , δ w , δ h , δ θ ) are the deviations between anchors and objects, which need to be decoded.
Remotesensing 13 00073 g002
Figure 3. The visualization of the anchor selection process. H I o U and R I o U are described in Figure 4. A T module is described in Section 2.3.3.
Remotesensing 13 00073 g003
Figure 4. For the degree of overlapping between rotating anchors and objects, there are two evaluation methods. (a) the visualization of horizontal I o U ; (b) the visualization of rotating I o U .
Remotesensing 13 00073 g004
Figure 5. (a) the encode method of common detection; (b) the encode method of rotation detection which is similar to horizontal detection; (c) the encode method we propose based on relative reference.
Remotesensing 13 00073 g005
Figure 6. The visualizations of predictions using A 2 S-Det on the DOTA dataset.
Remotesensing 13 00073 g006
Figure 7. Images of the bridge, harbor, large vehicle and ship from train dataset with their ground truth and positive anchors. (a) visualizations of positive anchors when using origin anchor selection; (b) visualizations of positive anchors in A 2 S-Det without AT; (c) visualizations of positive anchors in A 2 S-Det with AT; and (d) the anchor selection process using two threshold defining methods of ( M e a n + S t d ) and A T .
Remotesensing 13 00073 g007
Figure 8. The visualizations of whether the C R 3 module is adopted. (a) visualizations of predictions without the C R 3 module; (b) visualizations of predictions with the C R 3 module.
Remotesensing 13 00073 g008
Table 1. Comparison of our method with other detectors performance ( A P I o U = 0.5 ) on DOTA.
MethodsBackbonePlaneBDBridgeGTFSVLVShipTCBCSTSBFRAHarborSPHCmAP
two-stage
detectors
FR-O [6]ResNet-10179.0969.1217.1763.4934.2037.1636.2089.1969.6058.9649.452.5246.6944.8046.3052.93
R-DFPN [32]ResNet-10180.9265.8233.7758.9455.7750.9454.7890.3366.3468.6648.7351.7655.1051.3235.8857.94
R 2 CNN [2]VGG1680.9465.6735.3467.4459.9250.9155.8190.6766.9272.3955.0652.2355.1453.3548.2260.67
RRPN [1]VGG1688.5271.2031.6659.3051.8556.1957.2590.8172.8467.3856.6952.8453.0851.9453.5861.01
RoI-Transformer [18]ResNet-10188.6478.5243.4475.9268.8173.6883.5990.7477.2781.4658.3953.5462.8358.9347.6769.56
one-stage
detectors
SSD [29]SSD39.839.090.6413.180.260.391.1116.2427.579.2327.169.093.031.051.0110.59
YOLOv2 [30]DarkNet-1939.5720.2936.5823.428.852.094.8244.3438.3534.6516.0237.6247.2325.57.4521.39
IENet [31]ResNet-10157.1480.2064.5439.8232.0749.7165.0152.5881.4544.6678.5146.5456.7364.4064.2457.14
Axis-Learning [19]ResNet-10179.5377.1538.5961.1567.5370.4976.3089.6679.0783.5347.2761.0156.2866.0636.0565.98
RetinaNet-R [12]ResNet-5088.0371.0440.2750.7071.3372.9984.8390.7677.1282.9538.3858.9155.0867.4154.2966.94
O 2 -DNet [20]104-Hourglass89.3182.1447.3361.2171.3274.0378.6290.7682.2381.3660.9360.1758.2166.9861.0371.04
R3Det [3]ResNet-10189.5481.9948.4662.5270.4874.2977.5490.8081.3983.5461.9759.8265.4467.4660.0571.69
proposed A 2 S-DetResNet-5089.4578.5242.7853.9376.3774.6286.0390.6883.3583.5548.5860.5163.4671.3353.1070.42
A 2 S-DetResNet-10189.5977.8946.3756.4775.8674.8386.0790.5881.0983.7150.2160.9465.2969.7750.9370.64
Table 2. Ablation study ( A P I o U = 0.5 ) of each module in our proposed method on DOTA.
MethodsDataAugATC R 3 PlaneBDBridgeGTFSVLVShipTCBCSTSBFRAHarborSPHCmAP
RetinaNet-R [12]---88.0371.0440.2750.7071.3372.9984.8390.7677.1282.9538.3858.9155.0867.4154.2966.94
A 2 S-Det---89.0569.6740.8456.8875.9572.9484.1390.6673.3982.1541.9062.1255.8670.1750.6067.75
--89.0968.6842.7356.9474.3973.2484.6890.7473.8082.9544.0359.6359.8169.6450.5068.06
-89.0870.5343.2855.8974.2073.5484.9290.4874.4284.0542.7062.6360.3168.3852.3668.45
89.4578.5242.7853.9376.3774.6286.0390.6883.3583.5548.5860.5163.4671.3353.1070.42
✓ means this method or module is adpoted.
Table 3. Comparison of C R 3 module effect with different evaluation methods ( A P I o U = 0.5 , A P I o U = 0.75 , and A P ) on DOTA.
MethodsEvaluationC R 3 PlaneBDBridgeGTFSVLVShipTCBCSTSBFRAHarborSPHCmAP
A 2 S-Det A P I o U = 0.5 -89.0158.3631.8244.3553.5071.3486.4090.3754.9185.2732.9758.1351.1752.1439.5959.95
89.1259.6429.5945.1058.0872.5286.1390.2356.6784.9834.7656.0850.8251.3736.5260.11
A 2 S-Det A P I o U = 0.75 -51.239.763.0320.9319.4131.3034.1280.5330.7343.245.5722.736.946.369.7025.04
54.188.654.5523.4919.2134.8534.8280.3637.2040.319.0422.557.954.328.7726.02
A 2 S-Det A P -50.7224.4710.6921.9827.2037.3142.5170.4229.8246.9511.2829.2617.8317.7318.0630.42
53.8925.1310.3222.6726.7638.5542.6570.1934.5446.6313.2129.7317.3316.9615.2230.92
✓ means this method or module is adpoted.
Publisher’s Note: MDPI stays neutral with regard to jurisdictional claims in published maps and institutional affiliations.

