Imputing Satellite-Derived Aerosol Optical Depth Using a Multi-Resolution Spatial Model and Random Forest for PM2.5 Prediction
Abstract
1. Introduction
2. Materials and Methods
2.1. Study Area
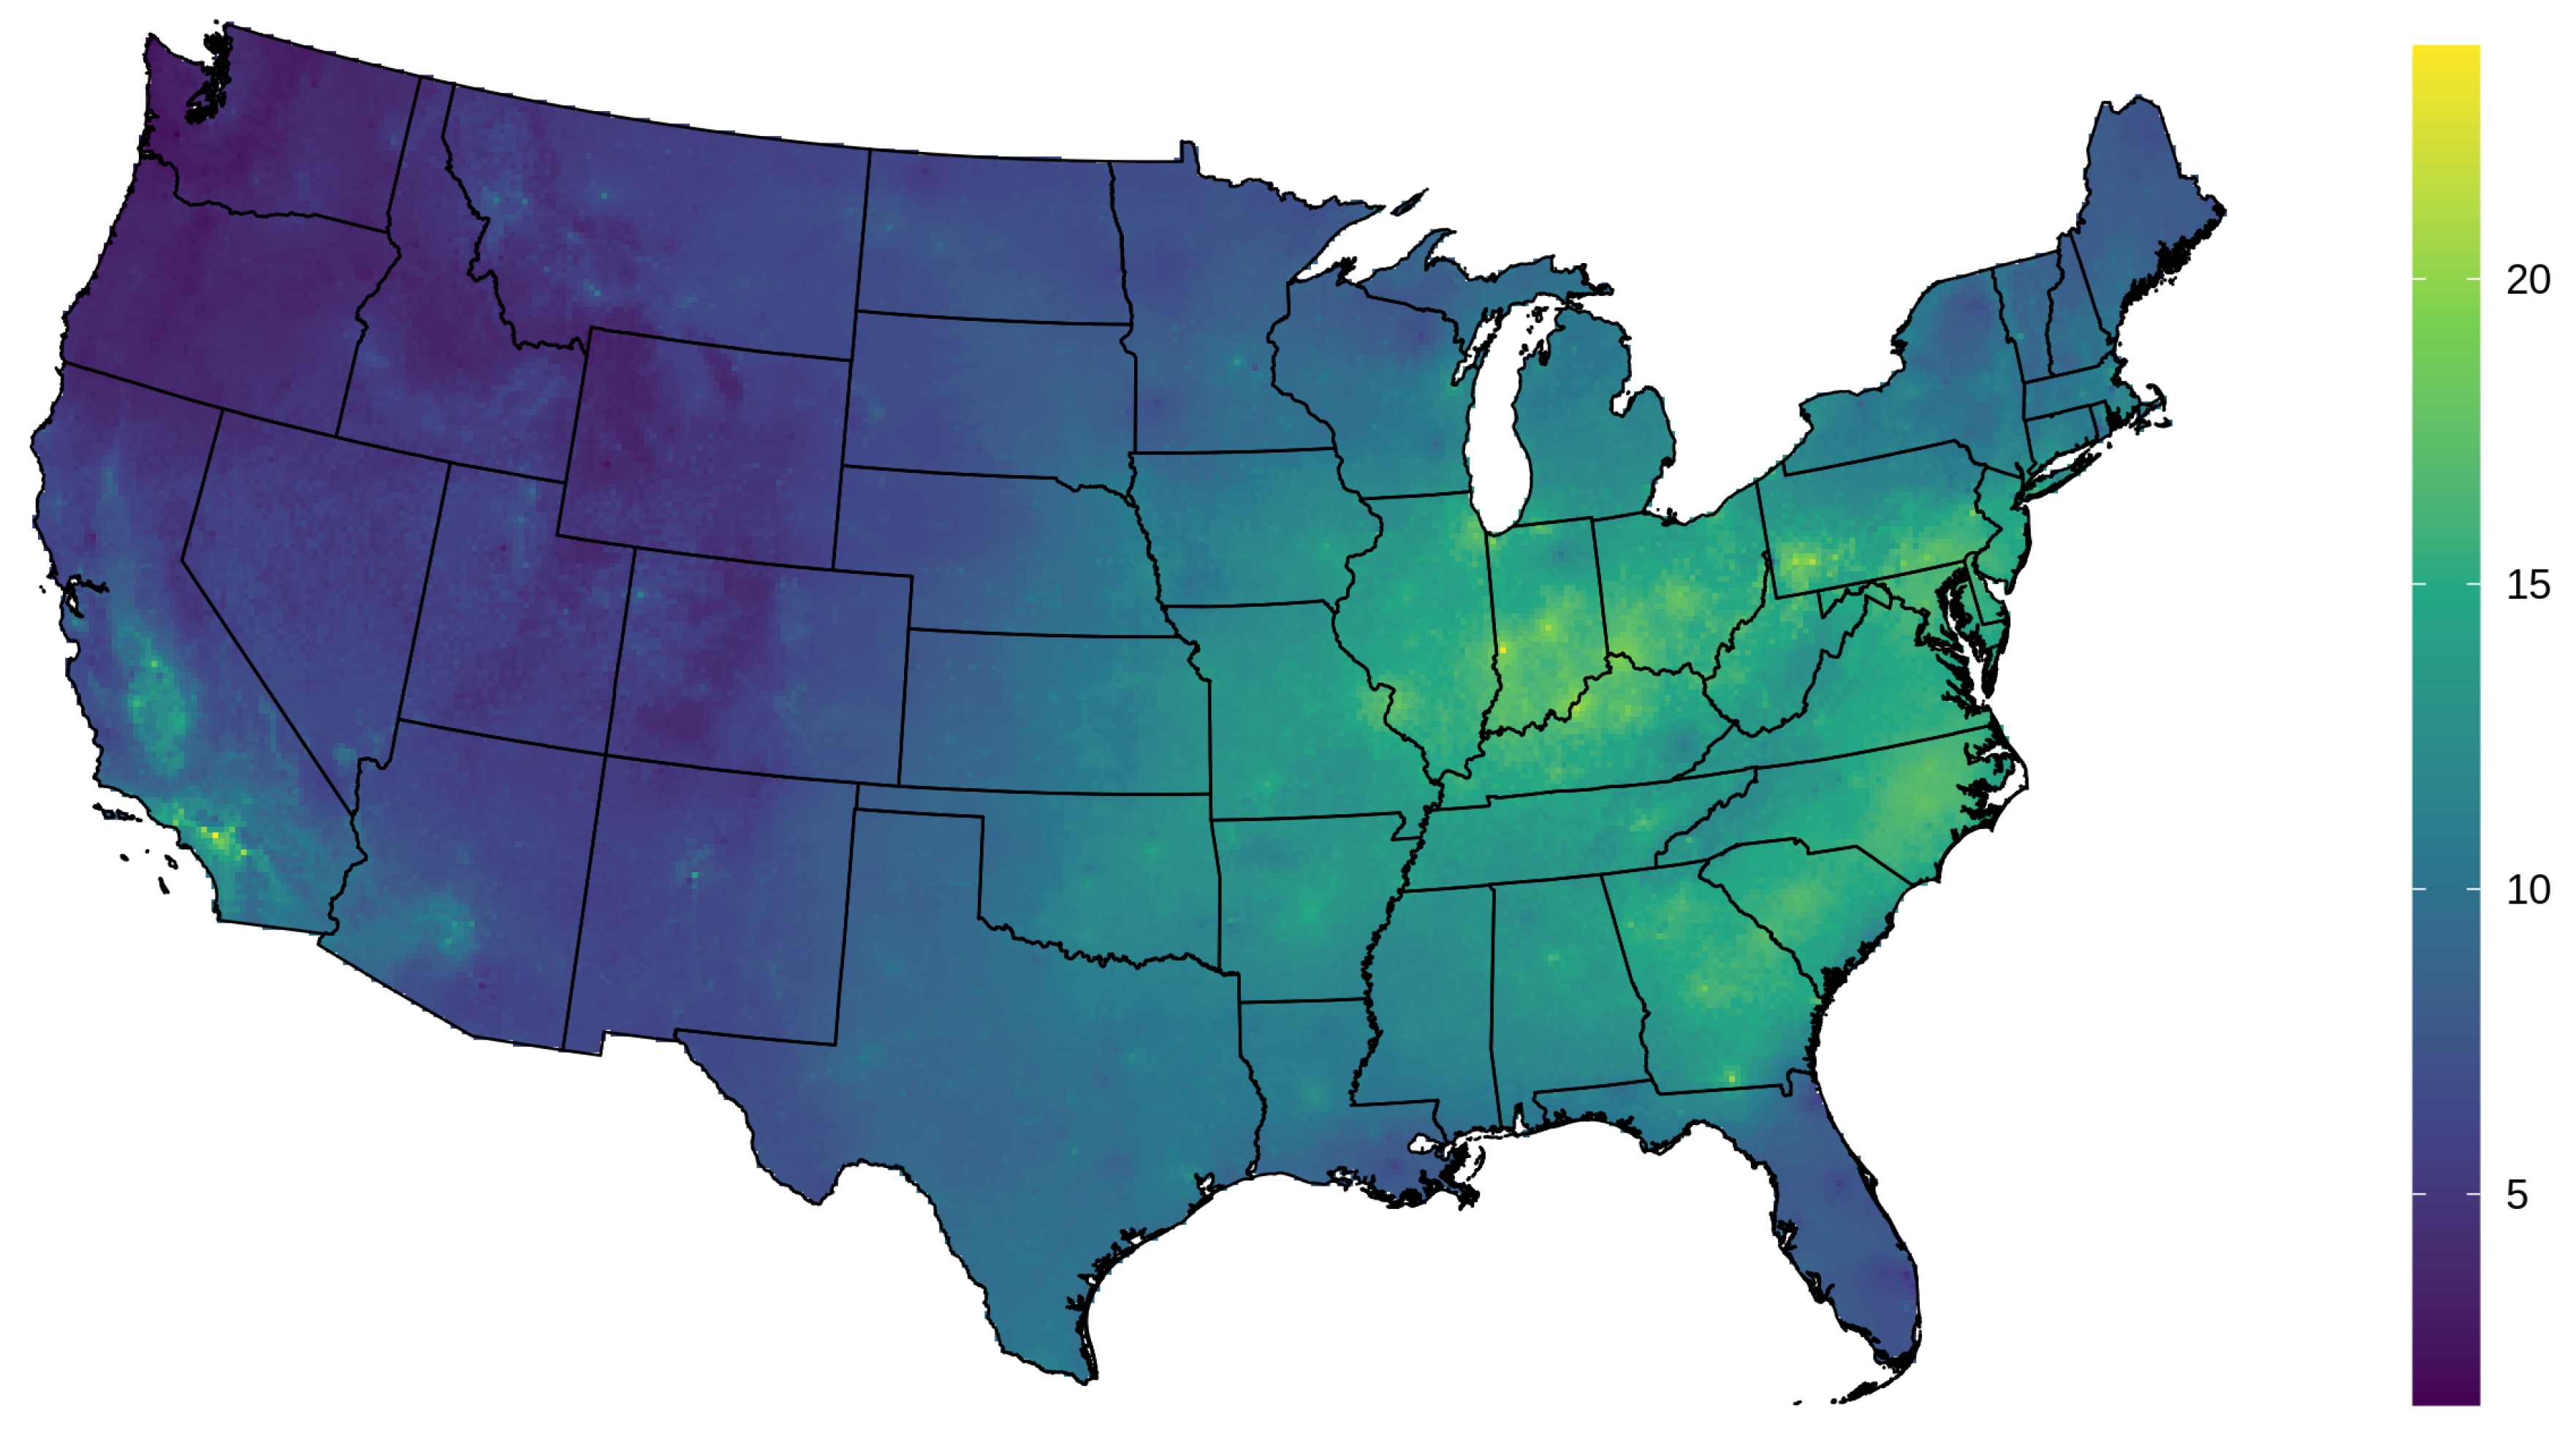
2.2. PM2.5 Measurements
2.3. MODIS AOD
2.4. GEOS-Chem AOD
2.5. Meteorological Variables
2.6. Land Use
2.7. Data Integration
2.8. Statistical Methods
2.8.1. Lattice Kriging
2.8.2. Random Forest
2.8.3. Super Learner Methods
- Divide observed data into k folds.
- For each fold k, let the kth fold be the validation data, and the remainder be the training data. Fit each algorithm or model m to the training data and make predictions on the kth fold.
- Stack all predictions for each algorithm.
- Estimate the weights for algorithm using the model formulationwhere and . can be estimated by non-negative least-squares methods and then normalizing the weights to sum to 1.
2.9. AOD Gap-Filling Analysis
- Average. We construct a simple average of RF and LK predictions. Cross-validation data are not used in this approach.
- SL: overall. After stacking all of the cross-validation predictions for all days together, we produce a single set of optimal weights with (4) for making predictions.
- SL: daily. We stack cross-validation predictions for each day separately, and we obtaining a daily set of optimal weights with (4).
- SL: distance-based. For each cross-validation fold on each day, we determine the closest distance between each point in the cross-validation fold and the training data. We then stack all of the cross-validation predictions across days together with these nearest-neighbor distances. We bin these stacked predictions according to nearest-neighbor distances with bin widths of 25 km from 0 to 300 km and higher. Using (4), we estimate the optimal weights for LK and RF for each binned distance grouping. We then fit a simple loess model relating interval mid-point distance and optimal weight, and we use these fitted optimal weights for combining LK and RF for predictions. The motivation for this last technique is that the further the unobserved point is from the observed data, the more different algorithms may be in predictions. If there is strong spatial correlation, then LK may perform better; in contrast, if there is limited range in the spatial correlation and the covariates are more important, then RF may produce better fits based on the relationship between the covariates and response.
2.10. PM2.5 Analysis
- M1: Includes neither AOD nor GEOS-Chem.
- M2: Includes GEOS-Chem.
- M3: Includes gap-filled AOD. This variable is defined to be observed AOD where available, and otherwise the predicted AOD value based on the super-learner distance-based method. GEOS-Chem is also included as a separate feature.
- M4: Includes AOD by replacing missing values of AOD with GEOS-Chem (as in Hu et al. [17]).
- M5: Includes observed AOD, and training solely on observations where AOD is observed. For predictions, missing values of AOD are replaced with the gap-filled AOD. GEOS-Chem is also included as a separate feature.
- Random: Cross-validation folds are constructed by selecting observed PM2.5 monitors at random on a daily basis.
- Constant spatial clusters: Cross-validation folds are constructed by creating spatially clustered areas that are constant across all days. A particular area of the map will be assigned to the same cross-validation fold for each day.
- Varying spatial clusters: Cross-validation folds are constructed by creating spatial clusters at random for each day.
3. Results
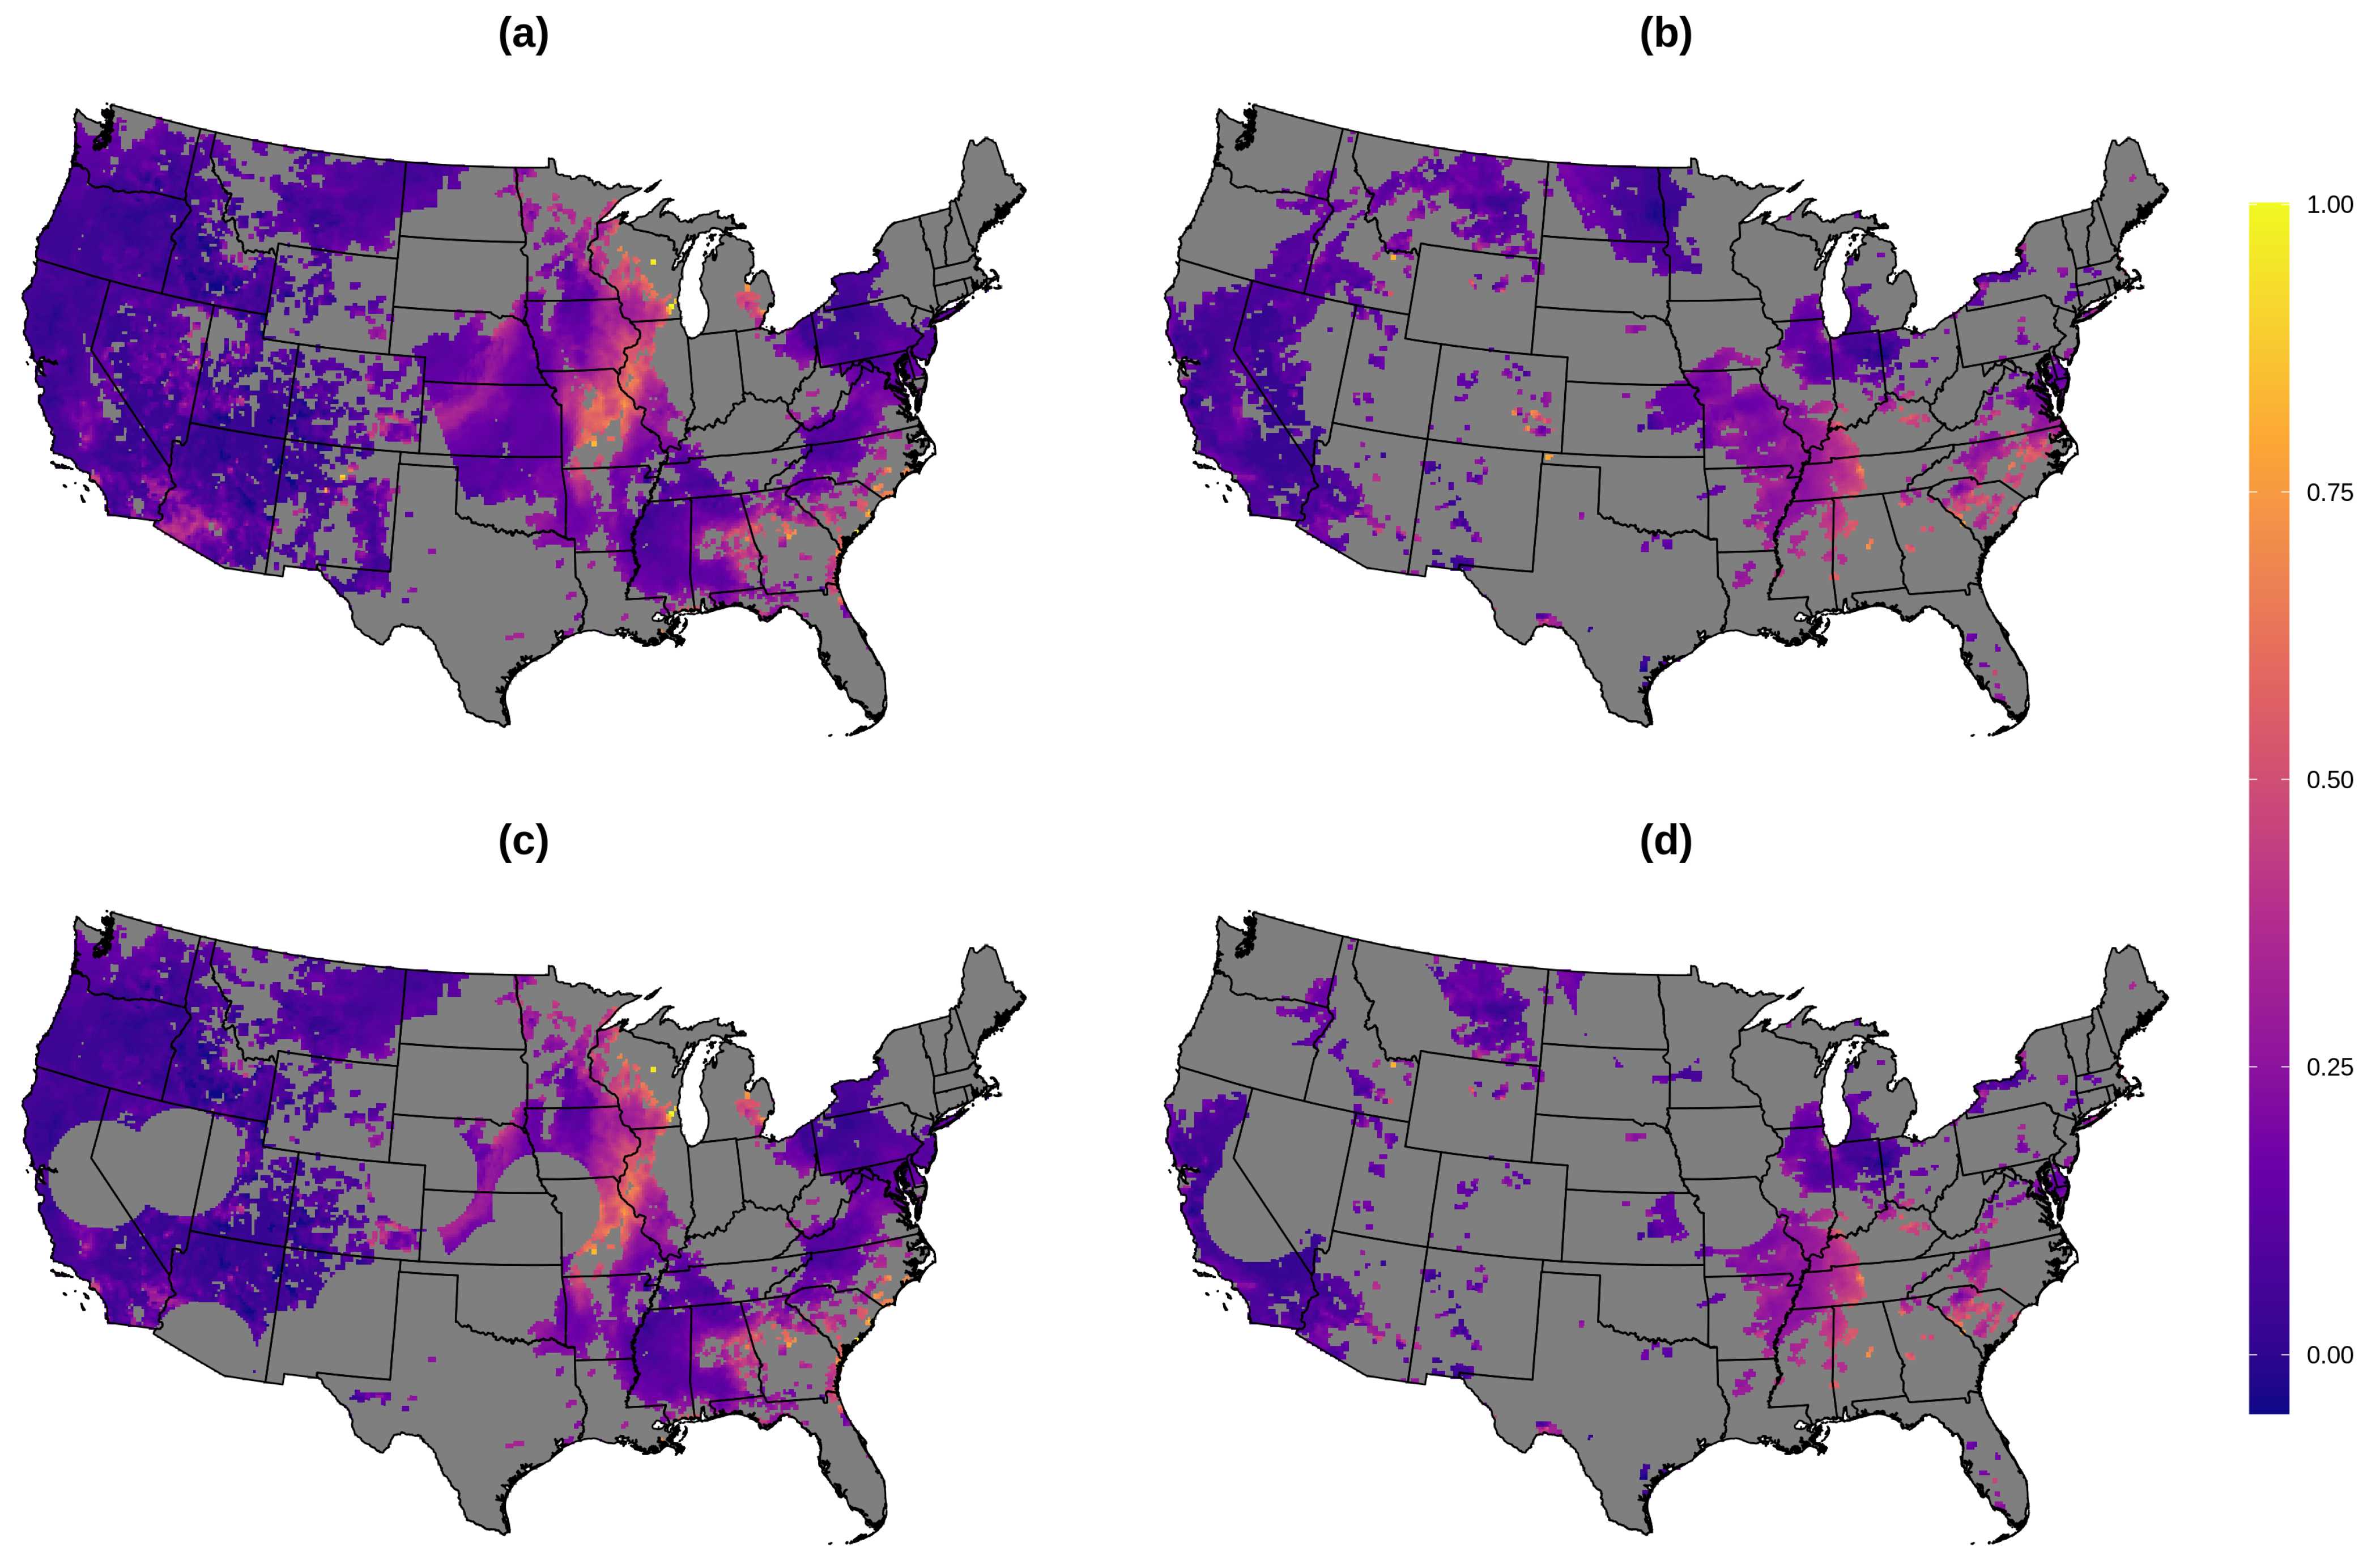
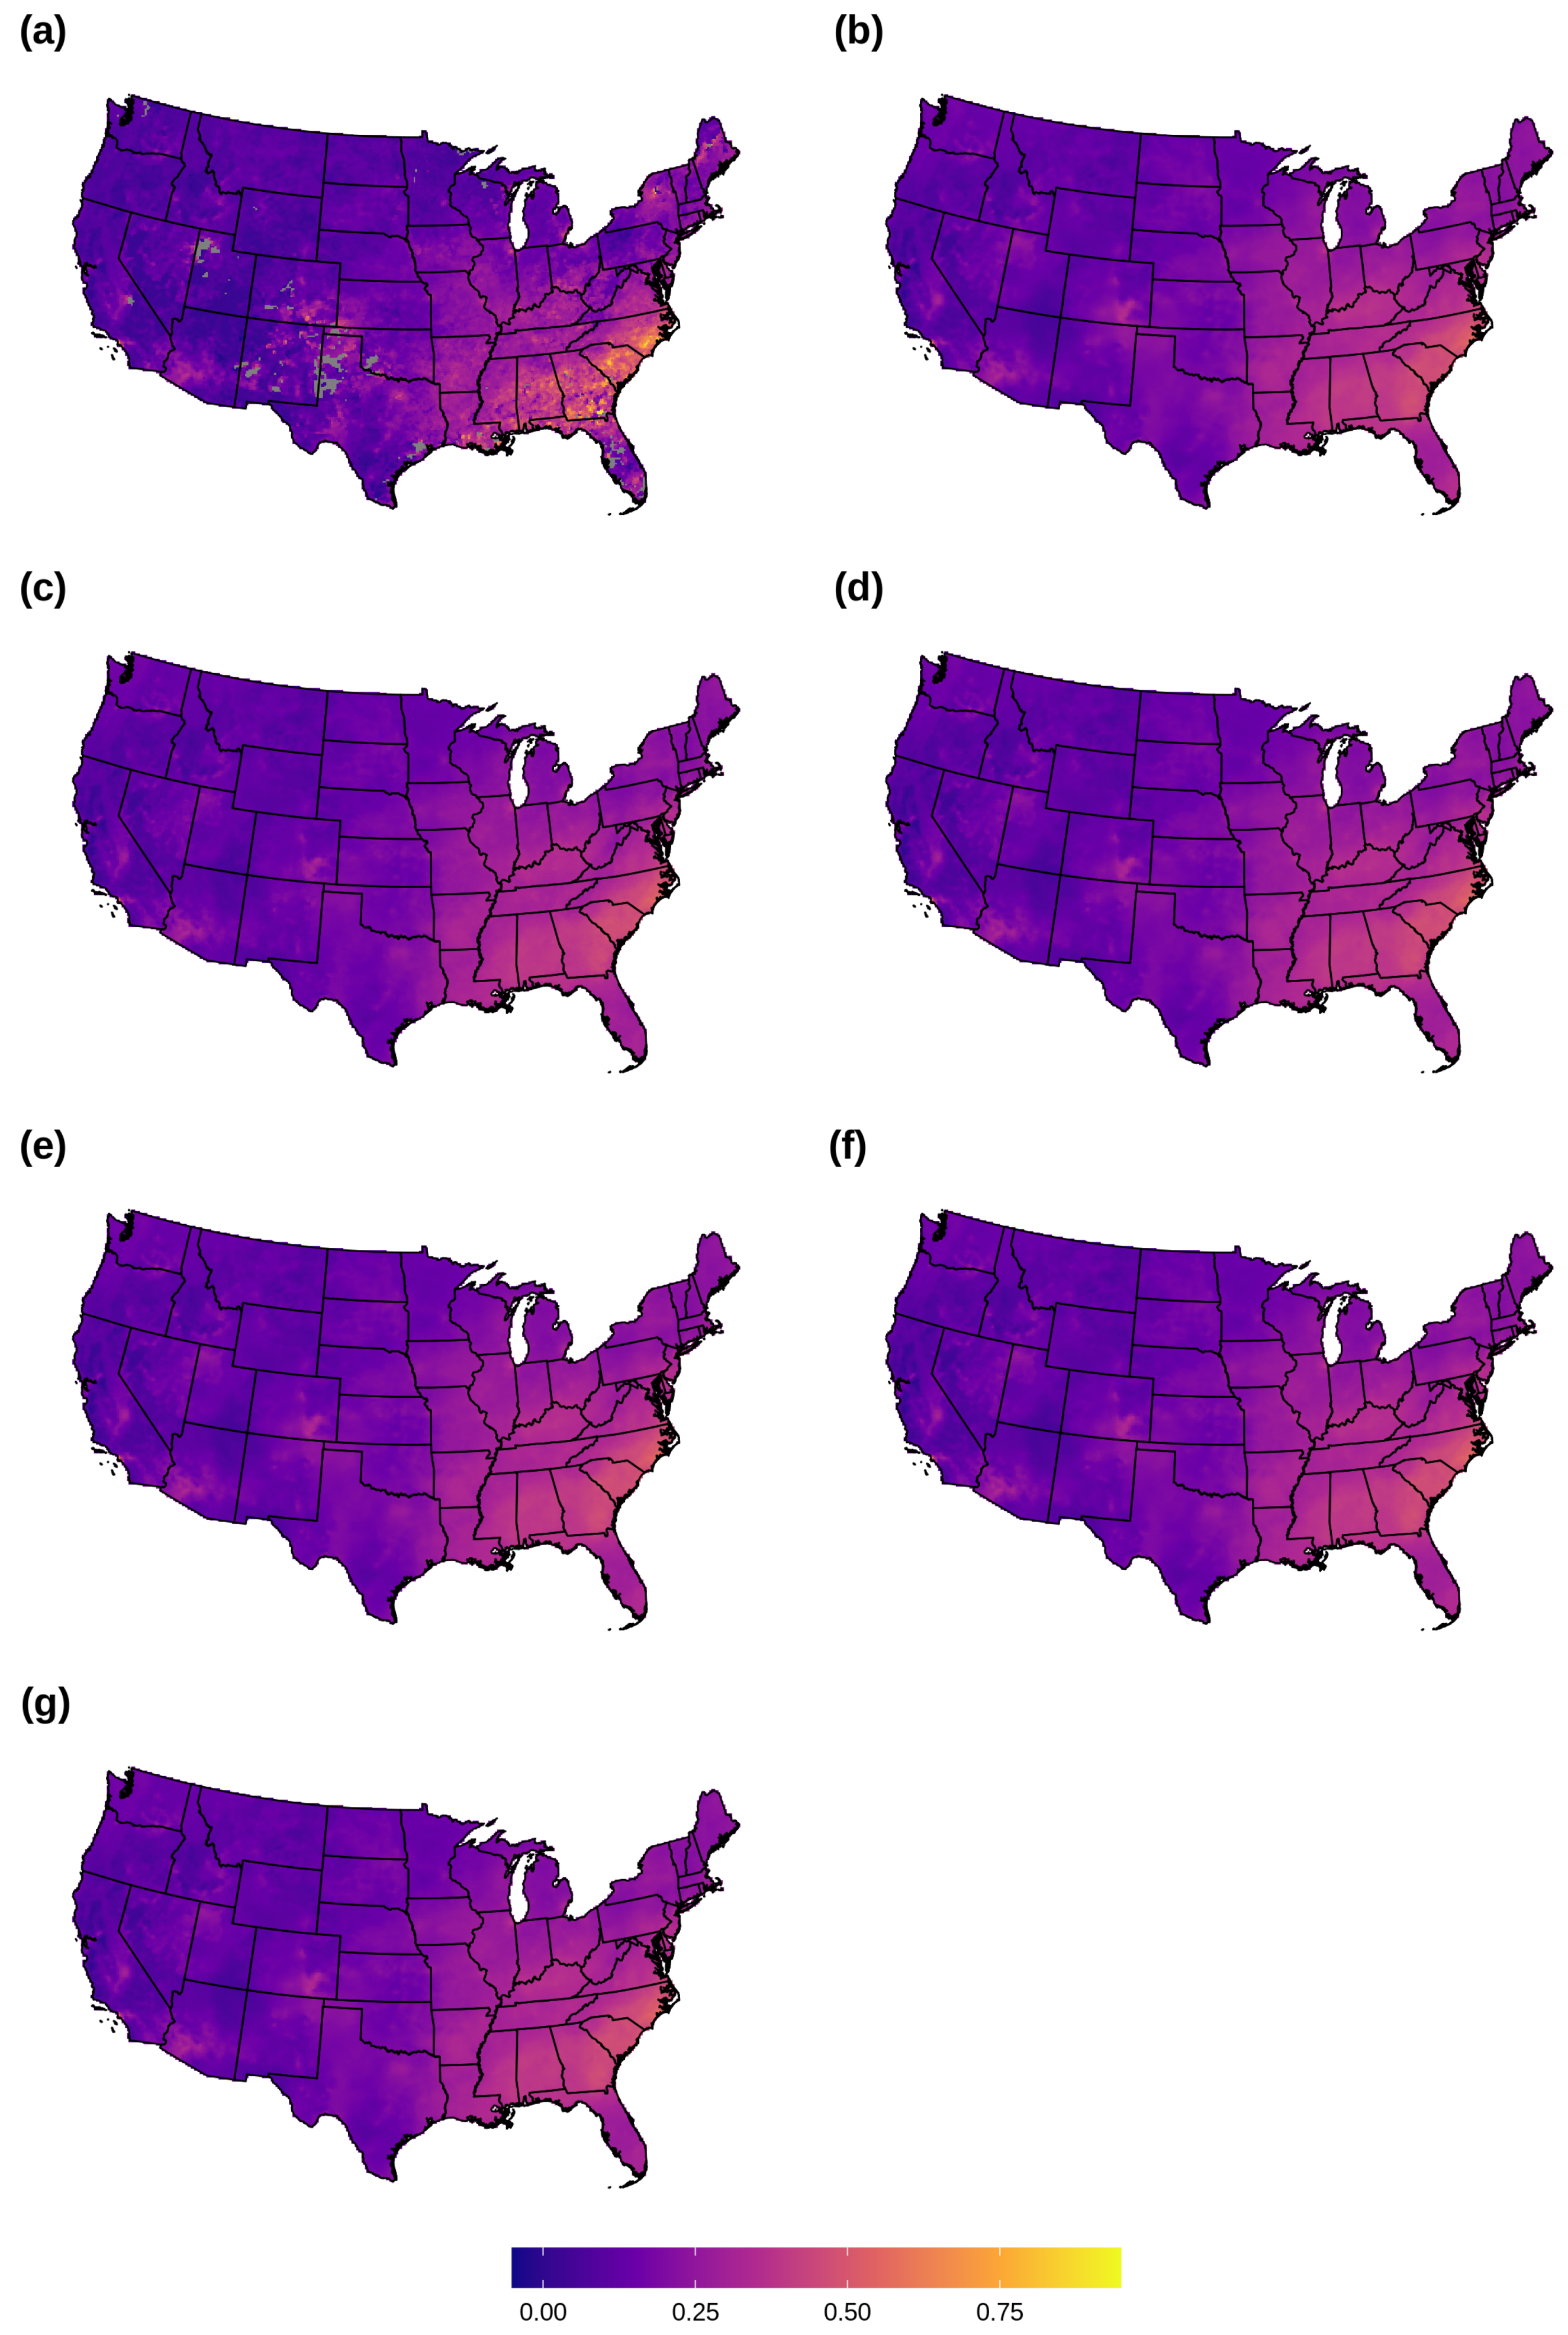
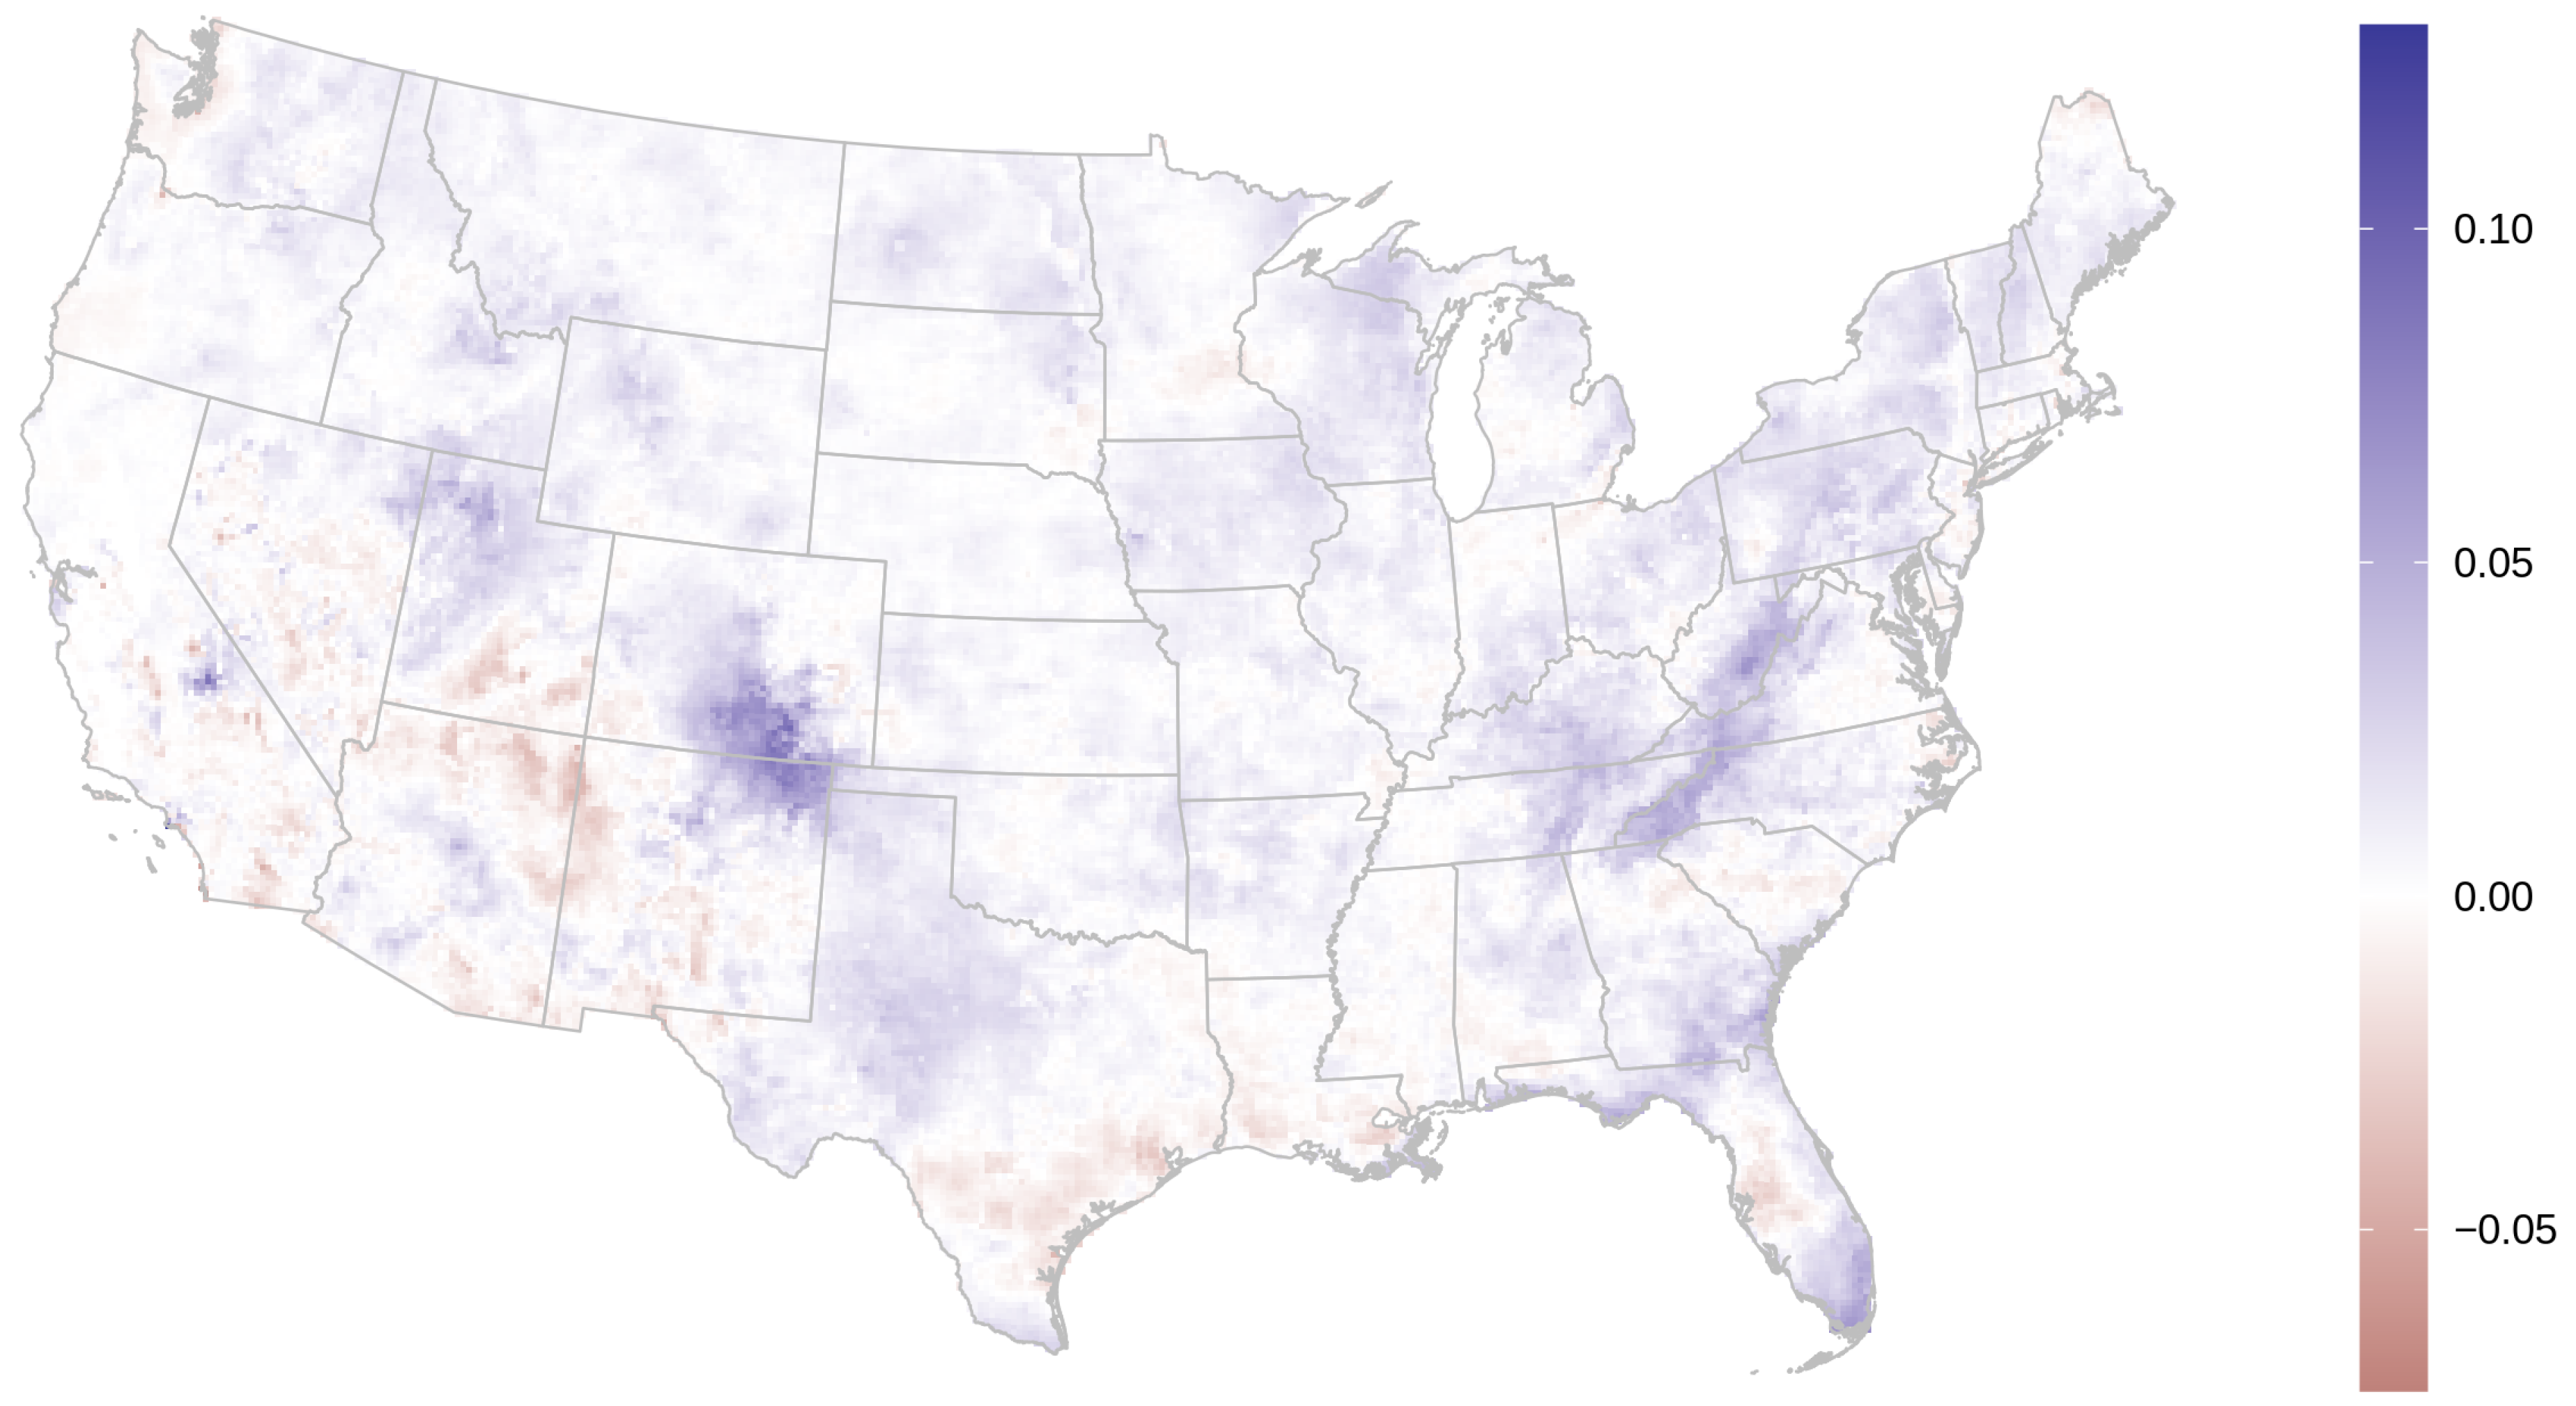
3.1. AOD Gap-Filling
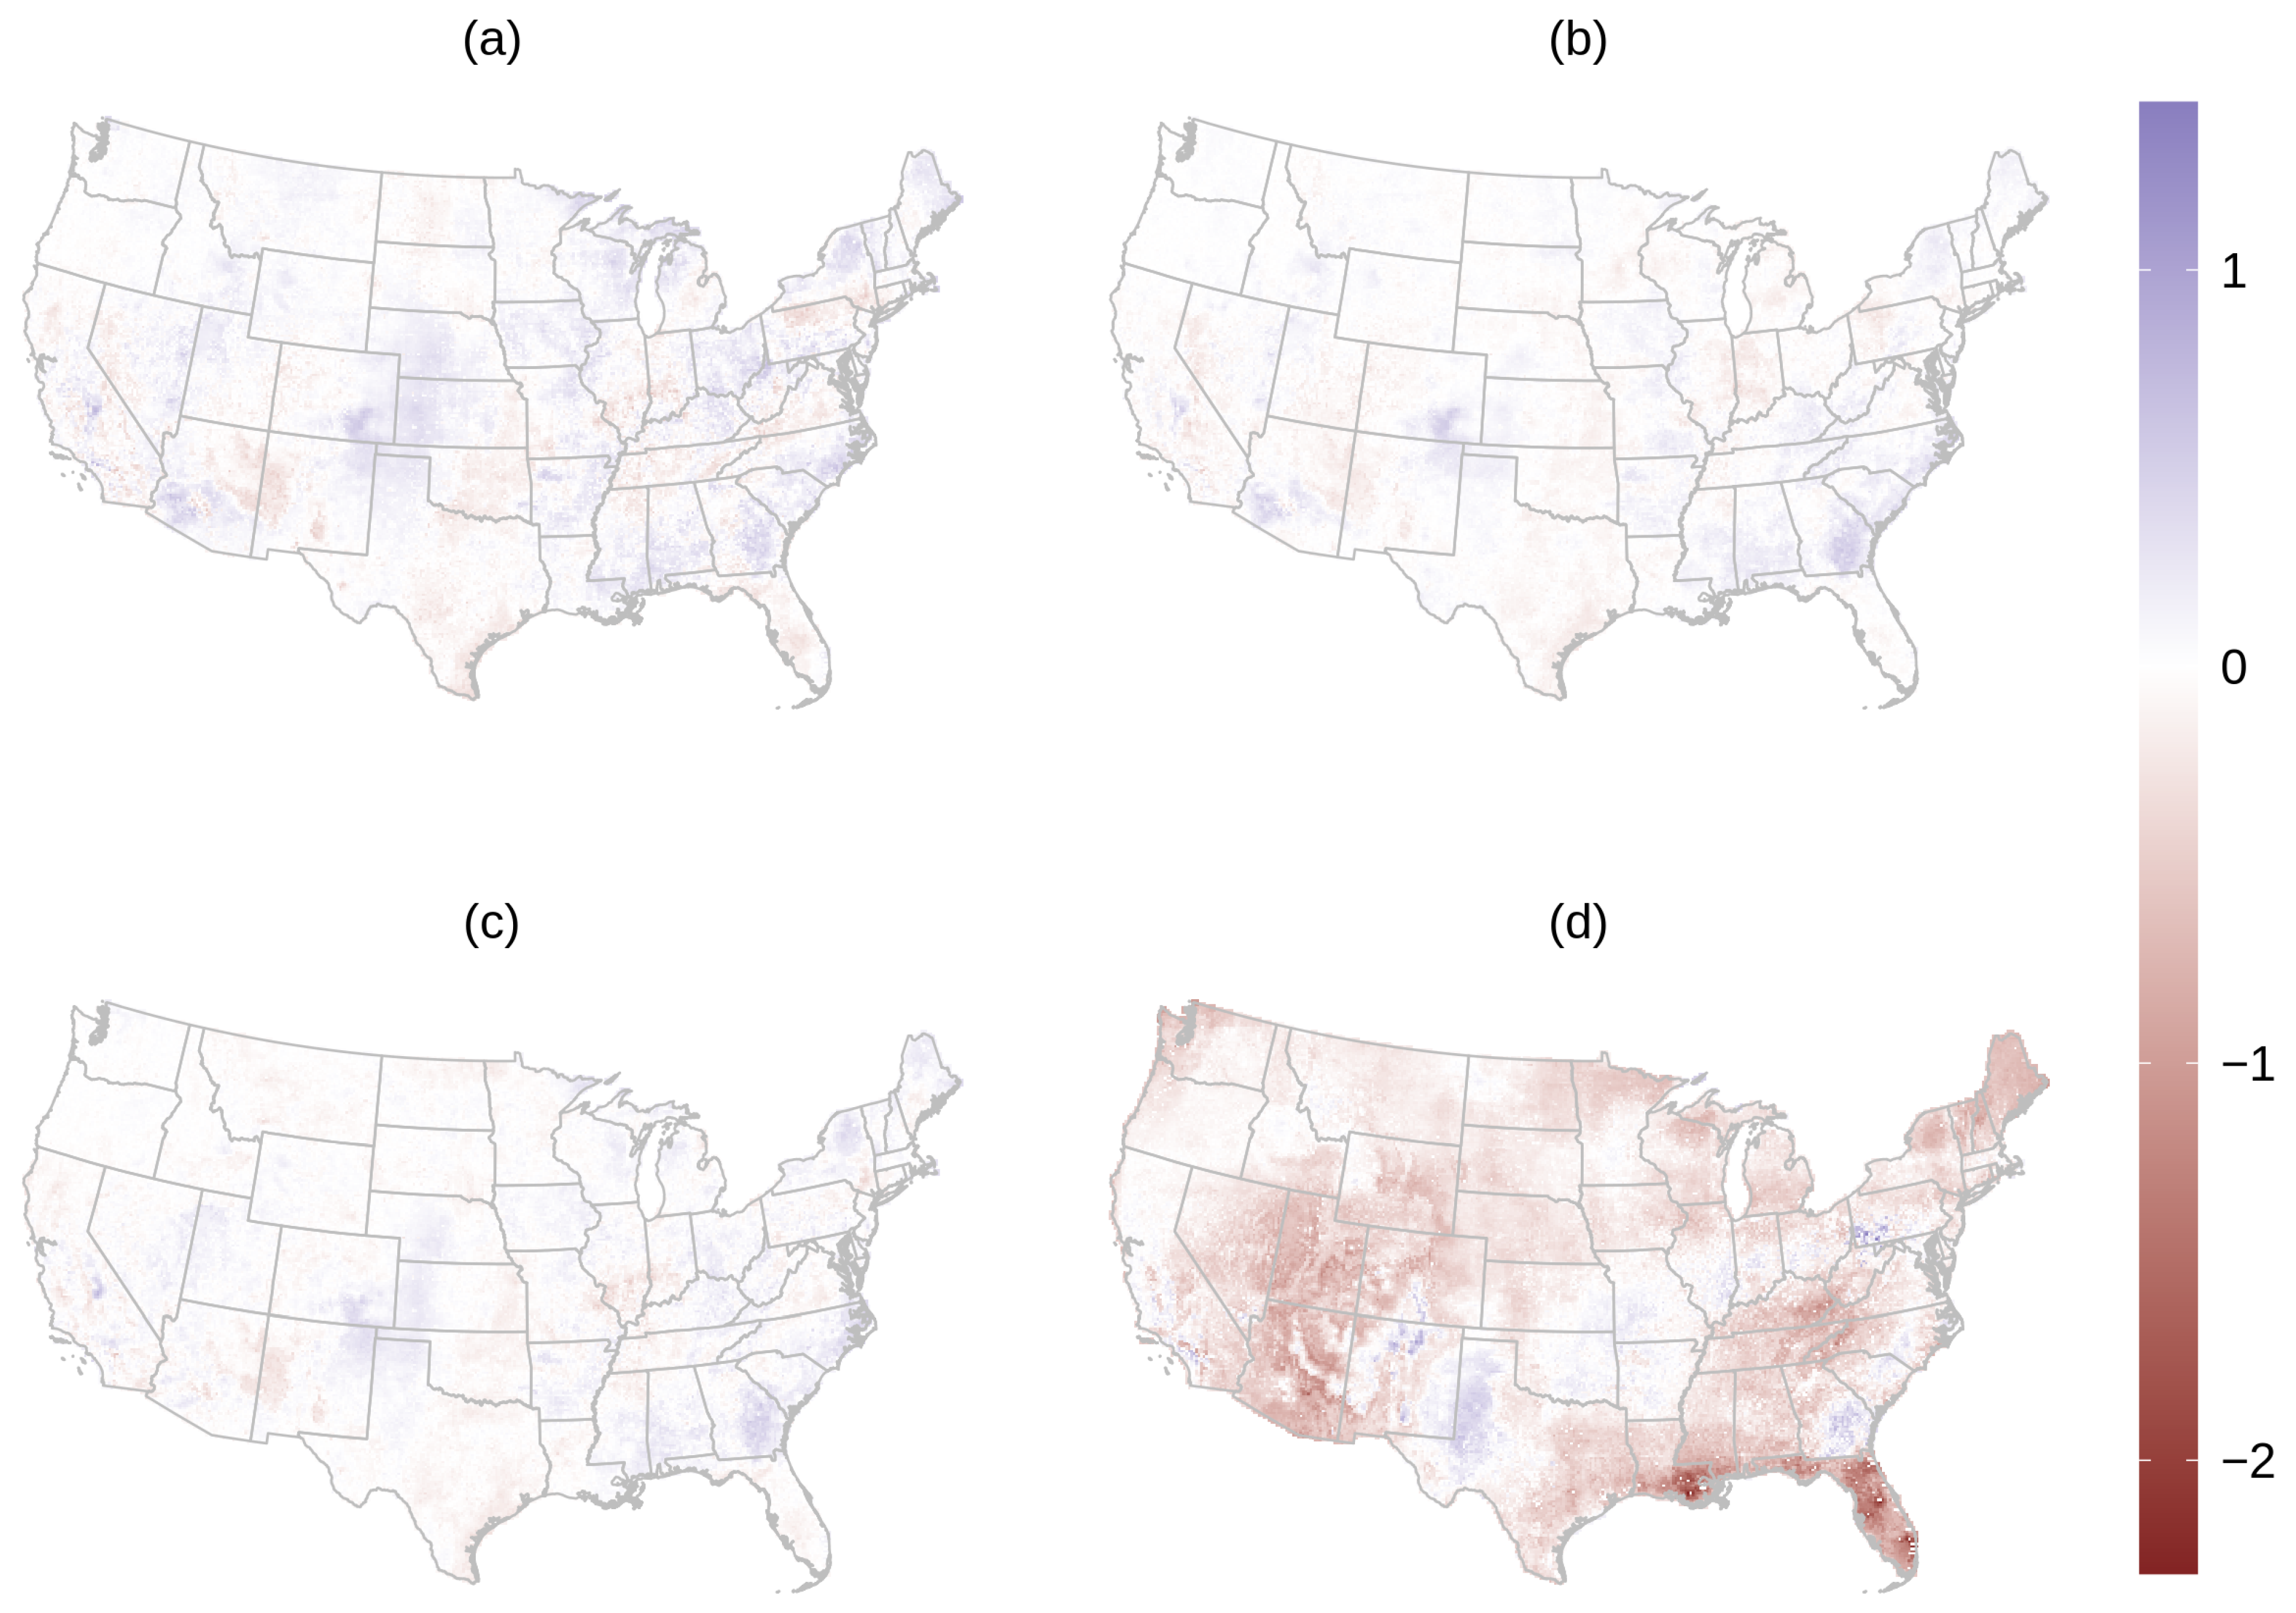
3.2. PM2.5 Prediction
4. Discussion
5. Conclusions
Supplementary Materials
Author Contributions
Funding
Institutional Review Board Statement
Informed Consent Statement
Data Availability Statement
Acknowledgments
Conflicts of Interest
Abbreviations
| AOD | Aerosol optical depth |
| PM2.5 | Particulate matter less than 2.5 micrometers in aerodynamic diameter |
| RF | Random forest |
| LK | Lattice kriging |
| SL | Super learner |
| RMSE | Root mean square error |
| IDW | Inverse distance weighting |
| CTM | Chemical transport model |
| MODIS | Moderate Resolution Imaging Spectroradiometer |
| MAIAC | Multi-angle implementation of atmospheric correction |
| OOB | Out-of-bag |
References
- WHO. Ambient (Outdoor) Air Pollution. 2018. Available online: https://web.archive.org/web/20200824220508/https%3A%2F%2Fwww.who.int%2Fnews-room%2Ffact-sheets%2Fdetail%2Fambient-%2528outdoor%2529-air-quality-and-health (accessed on 24 August 2020).
- Lim, S.S.; Vos, T.; Flaxman, A.D.; Danaei, G.; Shibuya, K.; Adair-Rohani, H.; AlMazroa, M.A.; Amann, M.; Anderson, H.R.; Andrews, K.G.; et al. A comparative risk assessment of burden of disease and injury attributable to 67 risk factors and risk factor clusters in 21 regions, 1990–2010: A systematic analysis for the Global Burden of Disease Study 2010. Lancet 2012, 380, 2224–2260. [Google Scholar] [CrossRef]
- Lelieveld, J.; Evans, J.S.; Fnais, M.; Giannadaki, D.; Pozzer, A. The contribution of outdoor air pollution sources to premature mortality on a global scale. Nature 2015, 525, 367–371. [Google Scholar] [CrossRef] [PubMed]
- Levy, R.; Mattoo, S.; Munchak, L.; Remer, L.; Sayer, A.; Patadia, F.; Hsu, N. The Collection 6 MODIS aerosol products over land and ocean. Atmos. Meas. Tech. 2013, 6, 2989. [Google Scholar] [CrossRef]
- Sorek-Hamer, M.; Just, A.; Kloog, I. Satellite remote sensing in epidemiological studies. Curr. Opin. Pediatr. 2016, 28, 228. [Google Scholar] [CrossRef] [PubMed]
- Chu, Y.; Liu, Y.; Li, X.; Liu, Z.; Lu, H.; Lu, Y.; Mao, Z.; Chen, X.; Li, N.; Ren, M.; et al. A review on predicting ground PM2.5 concentration using satellite aerosol optical depth. Atmosphere 2016, 7, 129. [Google Scholar] [CrossRef]
- Shin, M.; Kang, Y.; Park, S.; Im, J.; Yoo, C.; Quackenbush, L.J. Estimating ground-level particulate matter concentrations using satellite-based data: A review. GIScience Remote Sens. 2020, 57, 174–189. [Google Scholar] [CrossRef]
- Belle, J.H.; Liu, Y. Evaluation of Aqua MODIS Collection 6 AOD Parameters for Air Quality Research over the Continental United States. Remote Sens. 2016, 8, 815. [Google Scholar] [CrossRef]
- Belle, J.H.; Chang, H.H.; Wang, Y.; Hu, X.; Lyapustin, A.; Liu, Y. The potential impact of satellite-retrieved cloud parameters on ground-level PM2.5 mass and composition. Int. J. Environ. Res. Public Health 2017, 14, 1244. [Google Scholar] [CrossRef]
- Bi, J.; Belle, J.H.; Wang, Y.; Lyapustin, A.I.; Wildani, A.; Liu, Y. Impacts of snow and cloud covers on satellite-derived PM2.5 levels. Remote Sens. Environ. 2019, 221, 665–674. [Google Scholar] [CrossRef]
- Christopher, S.A.; Gupta, P. Satellite remote sensing of particulate matter air quality: The cloud-cover problem. J. Air Waste Manag. Assoc. 2010, 60, 596–602. [Google Scholar] [CrossRef]
- Liang, F.; Xiao, Q.; Huang, K.; Yang, X.; Liu, F.; Li, J.; Lu, X.; Liu, Y.; Gu, D. The 17-y spatiotemporal trend of PM2.5 and its mortality burden in China. Proc. Natl. Acad. Sci. USA 2020, 117, 25601–25608. [Google Scholar] [CrossRef] [PubMed]
- Geng, G.; Murray, N.L.; Tong, D.; Fu, J.S.; Hu, X.; Lee, P.; Meng, X.; Chang, H.H.; Liu, Y. Satellite-Based Daily PM2.5 Estimates During Fire Seasons in Colorado. J. Geophys. Res. Atmos. 2018, 123, 8159–8171. [Google Scholar] [CrossRef] [PubMed]
- Kloog, I.; Koutrakis, P.; Coull, B.A.; Lee, H.J.; Schwartz, J. Assessing temporally and spatially resolved PM2.5 exposures for epidemiological studies using satellite aerosol optical depth measurements. Atmos. Environ. 2011, 45, 6267–6275. [Google Scholar] [CrossRef]
- Kloog, I.; Nordio, F.; Coull, B.A.; Schwartz, J. Incorporating local land use regression and satellite aerosol optical depth in a hybrid model of spatiotemporal PM2.5 exposures in the Mid-Atlantic states. Environ. Sci. Technol. 2012, 46, 11913–11921. [Google Scholar] [CrossRef] [PubMed]
- Lee, M.; Kloog, I.; Chudnovsky, A.; Lyapustin, A.; Wang, Y.; Melly, S.; Coull, B.; Koutrakis, P.; Schwartz, J. Spatiotemporal prediction of fine particulate matter using high-resolution satellite images in the Southeastern US 2003–2011. J. Expo. Sci. Environ. Epidemiol. 2016, 26, 377–384. [Google Scholar] [CrossRef] [PubMed]
- Hu, X.; Belle, J.H.; Meng, X.; Wildani, A.; Waller, L.A.; Strickland, M.J.; Liu, Y. Estimating PM2.5 concentrations in the conterminous United States using the random forest approach. Environ. Sci. Technol. 2017, 51, 6936–6944. [Google Scholar] [CrossRef]
- Xiao, Q.; Wang, Y.; Chang, H.H.; Meng, X.; Geng, G.; Lyapustin, A.; Liu, Y. Full-coverage high-resolution daily PM2.5 estimation using MAIAC AOD in the Yangtze River Delta of China. Remote Sens. Environ. 2017, 199, 437–446. [Google Scholar] [CrossRef]
- Huang, K.; Xiao, Q.; Meng, X.; Geng, G.; Wang, Y.; Lyapustin, A.; Gu, D.; Liu, Y. Predicting monthly high-resolution PM2.5 concentrations with random forest model in the North China Plain. Environ. Pollut. 2018, 242, 675–683. [Google Scholar] [CrossRef]
- Lv, B.; Hu, Y.; Chang, H.H.; Russell, A.G.; Bai, Y. Improving the accuracy of daily PM2.5 distributions derived from the fusion of ground-level measurements with aerosol optical depth observations, a case study in North China. Environ. Sci. Technol. 2016, 50, 4752–4759. [Google Scholar] [CrossRef]
- Laslett, G.M. Kriging and splines: An empirical comparison of their predictive performance in some applications. J. Am. Stat. Assoc. 1994, 89, 391–400. [Google Scholar] [CrossRef]
- Chen, Z.Y.; Zhang, T.H.; Zhang, R.; Zhu, Z.M.; Yang, J.; Chen, P.Y.; Ou, C.Q.; Guo, Y. Extreme gradient boosting model to estimate PM2.5 concentrations with missing-filled satellite data in China. Atmos. Environ. 2019, 202, 180–189. [Google Scholar] [CrossRef]
- Breiman, L. Random forests. Mach. Learn. 2001, 45, 5–32. [Google Scholar] [CrossRef]
- Stafoggia, M.; Bellander, T.; Bucci, S.; Davoli, M.; De Hoogh, K.; De’Donato, F.; Gariazzo, C.; Lyapustin, A.; Michelozzi, P.; Renzi, M.; et al. Estimation of daily PM10 and PM2.5 concentrations in Italy, 2013–2015, using a spatiotemporal land-use random-forest model. Environ. Int. 2019, 124, 170–179. [Google Scholar] [CrossRef]
- Huang, K.; Bi, J.; Meng, X.; Geng, G.; Lyapustin, A.; Lane, K.J.; Gu, D.; Kinney, P.L.; Liu, Y. Estimating daily PM2.5 concentrations in New York City at the neighborhood-scale: Implications for integrating non-regulatory measurements. Sci. Total Environ. 2019, 697, 134094. [Google Scholar] [CrossRef] [PubMed]
- Zhang, R.; Di, B.; Luo, Y.; Deng, X.; Grieneisen, M.L.; Wang, Z.; Yao, G.; Zhan, Y. A nonparametric approach to filling gaps in satellite-retrieved aerosol optical depth for estimating ambient PM2.5 levels. Environ. Pollut. 2018, 243, 998–1007. [Google Scholar] [CrossRef]
- Jiang, T.; Chen, B.; Nie, Z.; Ren, Z.; Xu, B.; Tang, S. Estimation of hourly full-coverage PM2.5 concentrations at 1-km resolution in China using a two-stage random forest model. Atmos. Res. 2021, 248, 105146. [Google Scholar] [CrossRef]
- Holben, B.N.; Eck, T.F.; Slutsker, I.A.; Tanre, D.; Buis, J.; Setzer, A.; Vermote, E.; Reagan, J.A.; Kaufman, Y.; Nakajima, T.; et al. AERONET—A federated instrument network and data archive for aerosol characterization. Remote Sens. Environ. 1998, 66, 1–16. [Google Scholar] [CrossRef]
- Sayer, A.; Munchak, L.; Hsu, N.; Levy, R.; Bettenhausen, C.; Jeong, M.J. MODIS Collection 6 aerosol products: Comparison between Aqua’s e-Deep Blue, Dark Target, and “merged” data sets, and usage recommendations. J. Geophys. Res. Atmos. 2014, 119, 13–965. [Google Scholar] [CrossRef]
- Heaton, M.J.; Datta, A.; Finley, A.O.; Furrer, R.; Guinness, J.; Guhaniyogi, R.; Gerber, F.; Gramacy, R.B.; Hammerling, D.; Katzfuss, M.; et al. A case study competition among methods for analyzing large spatial data. J. Agric. Biol. Environ. Stat. 2019, 24, 398–425. [Google Scholar] [CrossRef]
- Bradley, J.R.; Cressie, N.; Shi, T. A comparison of spatial predictors when datasets could be very large. Stat. Surv. 2016, 10, 100–131. [Google Scholar] [CrossRef]
- Shao, Y.; Ma, Z.; Wang, J.; Bi, J. Estimating daily ground-level PM2.5 in China with random-forest-based spatiotemporal kriging. Sci. Total Environ. 2020, 740, 139761. [Google Scholar] [CrossRef] [PubMed]
- Xiao, Q.; Chang, H.H.; Geng, G.; Liu, Y. An ensemble machine-learning model to predict historical PM2.5 concentrations in China from satellite data. Environ. Sci. Technol. 2018, 52, 13260–13269. [Google Scholar] [CrossRef] [PubMed]
- Di, Q.; Amini, H.; Shi, L.; Kloog, I.; Silvern, R.; Kelly, J.; Sabath, M.B.; Choirat, C.; Koutrakis, P.; Lyapustin, A.; et al. An ensemble-based model of PM2.5 concentration across the contiguous United States with high spatiotemporal resolution. Environ. Int. 2019, 130, 104909. [Google Scholar] [CrossRef] [PubMed]
- Murray, N.L.; Holmes, H.A.; Liu, Y.; Chang, H.H. A Bayesian ensemble approach to combine PM2.5 estimates from statistical models using satellite imagery and numerical model simulation. Environ. Res. 2019, 178, 108601. [Google Scholar] [CrossRef] [PubMed]
- Nychka, D.; Bandyopadhyay, S.; Hammerling, D.; Lindgren, F.; Sain, S. A multiresolution Gaussian process model for the analysis of large spatial datasets. J. Comput. Graph. Stat. 2015, 24, 579–599. [Google Scholar] [CrossRef]
- van der Laan, M.J.; Polley, E.C.; Hubbard, A.E. Super learner. Stat. Appl. Genet. Mol. Biol. 2007, 6. [Google Scholar] [CrossRef]
- Naimi, A.I.; Balzer, L.B. Stacked generalization: An introduction to super learning. Eur. J. Epidemiol. 2018, 33, 459–464. [Google Scholar] [CrossRef]
- Levy, R.; Hsu, C. MODIS Atmosphere L2 Aerosol Product. NASA MODIS Adaptive Processing System; Goddard Space Flight Center: Greenbelt, MD, USA, 2015; Vulume 10. [CrossRef]
- Bey, I.; Jacob, D.J.; Yantosca, R.M.; Logan, J.A.; Field, B.D.; Fiore, A.M.; Li, Q.; Liu, H.Y.; Mickley, L.J.; Schultz, M.G. Global modeling of tropospheric chemistry with assimilated meteorology: Model description and evaluation. J. Geophys. Res. Atmos. 2001, 106, 23073–23095. [Google Scholar] [CrossRef]
- Li, S.; Garay, M.J.; Chen, L.; Rees, E.; Liu, Y. Comparison of GEOS-Chem aerosol optical depth with AERONET and MISR data over the contiguous United States. J. Geophys. Res. Atmos. 2013, 118, 11–228. [Google Scholar] [CrossRef]
- Cosgrove, B.A.; Lohmann, D.; Mitchell, K.E.; Houser, P.R.; Wood, E.F.; Schaake, J.C.; Robock, A.; Marshall, C.; Sheffield, J.; Duan, Q.; et al. Real-time and retrospective forcing in the North American Land Data Assimilation System (NLDAS) project. J. Geophys. Res. Atmos. 2003, 108. [Google Scholar] [CrossRef]
- Mitchell, K.E.; Lohmann, D.; Houser, P.R.; Wood, E.F.; Schaake, J.C.; Robock, A.; Cosgrove, B.A.; Sheffield, J.; Duan, Q.; Luo, L.; et al. The multi-institution North American Land Data Assimilation System (NLDAS): Utilizing multiple GCIP products and partners in a continental distributed hydrological modeling system. J. Geophys. Res. Atmos. 2004, 109. [Google Scholar] [CrossRef]
- Nychka, D.; Hammerling, D.; Sain, S.; Lenssen, N. LatticeKrig: Multiresolution Kriging Based on Markov Random Fields. R Package Version 8.4, 2016. Available online: https://cran.r-project.org/web/packages/LatticeKrig/index.html (accessed on 30 December 2020). [CrossRef]
- Wright, M.N.; Ziegler, A. ranger: A Fast Implementation of Random Forests for High Dimensional Data in C++ and R. J. Stat. Softw. 2017, 77. [Google Scholar] [CrossRef]
- Breiman, L. Stacked regressions. Mach. Learn. 1996, 24, 49–64. [Google Scholar] [CrossRef]
- Polley, E.C.; van der Laan, M.J. Super learner in prediction. In U.C. Berkeley Division of Biostatistics Working Paper Series. Working Paper 266; U.C. Berkeley: Berkeley, CA, USA, 2010. [Google Scholar]
- Davies, M.M.; van der Laan, M.J. Optimal spatial prediction using ensemble machine learning. Int. J. Biostat. 2016, 12, 179–201. [Google Scholar] [CrossRef]
- Valavi, R.; Elith, J.; Lahoz-Monfort, J.J.; Guillera-Arroita, G. blockCV: An R package for generating spatially or environmentally separated folds for k-fold cross-validation of species distribution models. Methods Ecol. Evol. 2019, 10, 225–232. [Google Scholar] [CrossRef]
- Sarafian, R.; Kloog, I.; Just, A.C.; Rosenblatt, J.D. Gaussian Markov Random Fields versus Linear Mixed Models for satellite-based PM2.5 assessment: Evidence from the Northeastern USA. Atmos. Environ. 2019, 205, 30–35. [Google Scholar] [CrossRef]
- Young, M.T.; Bechle, M.J.; Sampson, P.D.; Szpiro, A.A.; Marshall, J.D.; Sheppard, L.; Kaufman, J.D. Satellite-based NO2 and model validation in a national prediction model based on universal kriging and land-use regression. Environ. Sci. Technol. 2016, 50, 3686–3694. [Google Scholar] [CrossRef]
- Cressie, N.; Shi, T.; Kang, E.L. Fixed rank filtering for spatio-temporal data. J. Comput. Graph. Stat. 2010, 19, 724–745. [Google Scholar] [CrossRef]
- Lindgren, F.; Rue, H.; Lindström, J. An explicit link between Gaussian fields and Gaussian Markov random fields: The stochastic partial differential equation approach. J. R. Stat. Soc. Ser. B Stat. Methodol. 2011, 73, 423–498. [Google Scholar] [CrossRef]
- Datta, A.; Banerjee, S.; Finley, A.O.; Gelfand, A.E. Hierarchical nearest-neighbor Gaussian process models for large geostatistical datasets. J. Am. Stat. Assoc. 2016, 111, 800–812. [Google Scholar] [CrossRef]
- Datta, A.; Banerjee, S.; Finley, A.O.; Hamm, N.A.S.; Schaap, M. Nonseparable dynamic nearest neighbor Gaussian process models for large spatio-temporal data with an application to particulate matter analysis. Ann. Appl. Stat. 2016, 10, 1286–1316. [Google Scholar] [CrossRef] [PubMed]
- Bradley, J.R. What is the best predictor that you can compute in five minutes using a given Bayesian hierarchical model? arXiv 2019, arXiv:1912.04542. [Google Scholar]
- Katzfuss, M. A multi-resolution approximation for massive spatial datasets. J. Am. Stat. Assoc. 2017, 112, 201–214. [Google Scholar] [CrossRef]
- Appel, M.; Pebesma, E. Spatiotemporal multi-resolution approximations for analyzing global environmental data. Spat. Stat. 2020, 38, 100465. [Google Scholar] [CrossRef]
- Goldberg, D.L.; Gupta, P.; Wang, K.; Jena, C.; Zhang, Y.; Lu, Z.; Streets, D.G. Using gap-filled MAIAC AOD and WRF-Chem to estimate daily PM2.5 concentrations at 1 km resolution in the Eastern United States. Atmos. Environ. 2019, 199, 443–452. [Google Scholar] [CrossRef]
| Method | # of Days Ranked | |||||
|---|---|---|---|---|---|---|
| R2 | RMSE (×100) | Intercept | Slope | Best | Worst | |
| LatticeKrig | 0.644 | 6.66 | −0.01 | 0.94 | 7 | 12 |
| Random Forest | 0.619 | 6.90 | −0.01 | 0.92 | 3 | 19 |
| LK-RF Average | 0.658 | 6.52 | −0.01 | 0.97 | 4 | 0 |
| SL: Overall | 0.659 | 6.51 | −0.01 | 0.97 | 4 | 0 |
| SL: Daily | 0.657 | 6.52 | −0.01 | 0.96 | 3 | 0 |
| SL: Distance-based | 0.659 | 6.50 | −0.01 | 0.96 | 10 | 0 |
| Daily | Spatio-Temporal | ||||||||||
|---|---|---|---|---|---|---|---|---|---|---|---|
| Setting | AOD Status | M1a | M2a | M3a | M4a | M5a | M1b | M2b | M3b | M4b | M5b |
| RMSE (μg m−3) | |||||||||||
| Random | All | 3.30 | 3.29 | 3.28 | 3.30 | 3.68 | 2.96 | 2.98 | 2.99 | 2.98 | 3.20 |
| Random | Missing | 3.30 | 3.28 | 3.27 | 3.29 | 3.84 | 2.99 | 3.00 | 3.02 | 3.01 | 3.29 |
| Random | Observed | 3.31 | 3.30 | 3.29 | 3.31 | 3.41 | 2.92 | 2.94 | 2.95 | 2.94 | 3.04 |
| Constant cluster | All | 3.66 | 3.64 | 3.62 | 3.64 | 3.99 | 3.68 | 3.66 | 3.63 | 3.66 | 3.75 |
| Constant cluster | Missing | 3.61 | 3.58 | 3.56 | 3.59 | 4.09 | 3.63 | 3.60 | 3.57 | 3.61 | 3.74 |
| Constant cluster | Observed | 3.74 | 3.73 | 3.72 | 3.73 | 3.82 | 3.76 | 3.75 | 3.72 | 3.73 | 3.76 |
| Varying cluster | All | 3.66 | 3.65 | 3.63 | 3.65 | 4.00 | 3.33 | 3.34 | 3.35 | 3.35 | 3.56 |
| Varying cluster | Missing | 3.61 | 3.58 | 3.57 | 3.60 | 4.11 | 3.34 | 3.33 | 3.34 | 3.34 | 3.61 |
| Varying cluster | Observed | 3.75 | 3.74 | 3.72 | 3.74 | 3.83 | 3.33 | 3.35 | 3.35 | 3.35 | 3.47 |
| R2 (×100) | |||||||||||
| Random | All | 75.3 | 75.5 | 75.7 | 75.4 | 69.7 | 80.4 | 80.2 | 79.8 | 80.0 | 77.1 |
| Random | Missing | 75.9 | 76.2 | 76.3 | 76.1 | 68.1 | 80.5 | 80.4 | 79.9 | 80.1 | 76.5 |
| Random | Observed | 73.8 | 73.9 | 74.1 | 73.8 | 72.3 | 79.9 | 79.7 | 79.3 | 79.5 | 78.0 |
| Constant cluster | All | 69.9 | 70.1 | 70.4 | 70.1 | 64.1 | 69.6 | 69.9 | 70.3 | 69.9 | 68.6 |
| Constant cluster | Missing | 71.5 | 71.8 | 72.2 | 71.7 | 63.6 | 71.2 | 71.6 | 72.1 | 71.5 | 69.8 |
| Constant cluster | Observed | 66.8 | 66.9 | 67.2 | 66.9 | 65.2 | 66.4 | 66.7 | 67.1 | 66.8 | 66.6 |
| Varying cluster | All | 69.7 | 70.0 | 70.3 | 70.0 | 63.9 | 75.6 | 75.6 | 75.4 | 75.5 | 72.1 |
| Varying cluster | Missing | 71.4 | 71.8 | 72.1 | 71.7 | 63.2 | 76.3 | 76.4 | 76.2 | 76.3 | 72.2 |
| Varying cluster | Observed | 66.5 | 66.6 | 67.1 | 66.7 | 65.1 | 74.1 | 73.9 | 73.9 | 73.7 | 71.8 |
| Daily | Spatio-Temporal | ||||||||||
|---|---|---|---|---|---|---|---|---|---|---|---|
| Setting | AOD Status | M1a | M2a | M3a | M4a | M5a | M1b | M2b | M3b | M4b | M5b |
| Random | Central | 3.70 | 3.67 | 3.65 | 3.68 | 4.15 | 3.56 | 3.56 | 3.58 | 3.56 | 3.78 |
| East North Central | 3.17 | 3.17 | 3.16 | 3.18 | 3.52 | 3.04 | 3.03 | 3.01 | 3.02 | 3.15 | |
| Northeast | 3.31 | 3.27 | 3.26 | 3.29 | 3.74 | 2.97 | 2.96 | 3.00 | 2.97 | 3.23 | |
| Northwest | 1.48 | 1.49 | 1.49 | 1.49 | 1.82 | 1.23 | 1.24 | 1.24 | 1.24 | 1.35 | |
| South | 2.35 | 2.35 | 2.33 | 2.35 | 2.77 | 2.11 | 2.13 | 2.15 | 2.15 | 2.39 | |
| Southeast | 3.55 | 3.54 | 3.53 | 3.56 | 4.22 | 3.39 | 3.41 | 3.40 | 3.43 | 3.72 | |
| Southwest | 4.13 | 4.11 | 4.09 | 4.10 | 4.43 | 3.58 | 3.61 | 3.62 | 3.54 | 3.94 | |
| West | 4.41 | 4.42 | 4.41 | 4.40 | 4.47 | 3.58 | 3.64 | 3.70 | 3.67 | 3.76 | |
| West North Central | 2.91 | 2.92 | 2.92 | 2.92 | 3.08 | 2.34 | 2.37 | 2.35 | 2.35 | 2.50 | |
| Constant cluster | Central | 4.38 | 4.34 | 4.32 | 4.34 | 4.67 | 4.54 | 4.49 | 4.46 | 4.50 | 4.60 |
| East North Central | 3.36 | 3.36 | 3.34 | 3.36 | 3.67 | 3.46 | 3.41 | 3.38 | 3.43 | 3.48 | |
| Northeast | 3.55 | 3.51 | 3.49 | 3.53 | 3.90 | 3.54 | 3.49 | 3.46 | 3.50 | 3.60 | |
| Northwest | 1.48 | 1.48 | 1.50 | 1.49 | 1.84 | 1.46 | 1.46 | 1.46 | 1.46 | 1.53 | |
| South | 2.47 | 2.47 | 2.46 | 2.47 | 2.90 | 2.49 | 2.47 | 2.47 | 2.48 | 2.64 | |
| Southeast | 3.91 | 3.88 | 3.83 | 3.90 | 4.54 | 3.94 | 3.92 | 3.85 | 3.93 | 4.08 | |
| Southwest | 4.29 | 4.27 | 4.26 | 4.27 | 4.60 | 4.34 | 4.34 | 4.35 | 4.32 | 4.47 | |
| West | 5.20 | 5.21 | 5.21 | 5.19 | 5.28 | 5.10 | 5.11 | 5.08 | 5.08 | 5.08 | |
| West North Central | 3.04 | 3.04 | 3.04 | 3.04 | 3.18 | 3.09 | 3.08 | 3.08 | 3.08 | 3.09 | |
| Varying cluster | Central | 4.39 | 4.34 | 4.32 | 4.34 | 4.70 | 4.29 | 4.26 | 4.26 | 4.27 | 4.50 |
| East North Central | 3.34 | 3.35 | 3.34 | 3.34 | 3.74 | 3.30 | 3.29 | 3.28 | 3.29 | 3.37 | |
| Northeast | 3.53 | 3.49 | 3.49 | 3.51 | 3.94 | 3.26 | 3.23 | 3.27 | 3.25 | 3.49 | |
| Northwest | 1.51 | 1.51 | 1.52 | 1.53 | 1.85 | 1.29 | 1.30 | 1.31 | 1.31 | 1.39 | |
| South | 2.48 | 2.49 | 2.48 | 2.49 | 2.93 | 2.31 | 2.33 | 2.34 | 2.33 | 2.59 | |
| Southeast | 3.92 | 3.89 | 3.84 | 3.92 | 4.54 | 3.76 | 3.74 | 3.70 | 3.75 | 4.03 | |
| Southwest | 4.45 | 4.44 | 4.42 | 4.42 | 4.76 | 3.97 | 4.02 | 4.07 | 4.02 | 4.30 | |
| West | 5.16 | 5.17 | 5.14 | 5.16 | 5.18 | 4.18 | 4.23 | 4.26 | 4.25 | 4.42 | |
| West North Central | 2.97 | 2.97 | 2.97 | 2.97 | 3.11 | 2.40 | 2.43 | 2.45 | 2.45 | 2.57 | |
| Daily | Spatio-Temporal | ||||||||||
|---|---|---|---|---|---|---|---|---|---|---|---|
| Setting | AOD Status | M1a | M2a | M3a | M4a | M5a | M1b | M2b | M3b | M4b | M5b |
| Random | Central | 61.1 | 61.7 | 62.1 | 61.5 | 51.1 | 64.7 | 64.7 | 63.8 | 64.1 | 59.3 |
| East North Central | 69.4 | 69.6 | 69.7 | 69.3 | 63.3 | 72.8 | 73.2 | 72.6 | 72.5 | 70.7 | |
| Northeast | 77.0 | 77.6 | 77.8 | 77.4 | 70.8 | 81.9 | 82.0 | 81.3 | 81.6 | 78.4 | |
| Northwest | 44.6 | 44.2 | 44.0 | 44.5 | 28.2 | 61.2 | 60.9 | 60.0 | 60.1 | 53.6 | |
| South | 68.0 | 68.1 | 68.4 | 68.0 | 57.9 | 74.5 | 74.0 | 73.2 | 73.1 | 67.5 | |
| Southeast | 70.4 | 70.6 | 70.8 | 70.2 | 59.5 | 73.2 | 73.1 | 72.8 | 72.3 | 68.3 | |
| Southwest | 46.6 | 47.3 | 47.7 | 47.4 | 42.4 | 61.1 | 60.6 | 59.3 | 61.0 | 51.9 | |
| West | 50.7 | 50.5 | 50.8 | 50.9 | 49.2 | 68.7 | 67.7 | 65.7 | 66.4 | 64.8 | |
| West North Central | 39.2 | 39.1 | 38.9 | 38.8 | 33.3 | 61.5 | 60.4 | 60.6 | 60.7 | 55.3 | |
| Constant cluster | Central | 48.0 | 49.0 | 49.4 | 49.2 | 40.1 | 45.0 | 46.0 | 46.7 | 45.9 | 43.5 |
| East North Central | 66.0 | 66.1 | 66.6 | 66.2 | 60.8 | 64.4 | 65.6 | 66.3 | 65.1 | 65.1 | |
| Northeast | 73.8 | 74.4 | 74.7 | 74.1 | 68.1 | 74.0 | 74.7 | 75.1 | 74.5 | 73.3 | |
| Northwest | 45.4 | 45.0 | 44.3 | 45.0 | 29.1 | 45.6 | 45.6 | 45.3 | 45.5 | 43.7 | |
| South | 64.5 | 64.6 | 64.9 | 64.5 | 53.5 | 64.3 | 64.9 | 65.0 | 64.6 | 61.5 | |
| Southeast | 64.4 | 64.9 | 65.9 | 64.5 | 53.5 | 64.1 | 64.4 | 65.6 | 64.2 | 62.5 | |
| Southwest | 41.9 | 42.5 | 42.8 | 42.6 | 35.1 | 40.5 | 40.4 | 40.3 | 40.9 | 37.5 | |
| West | 34.6 | 34.6 | 34.5 | 35.1 | 32.0 | 36.6 | 36.6 | 37.3 | 37.2 | 37.5 | |
| West North Central | 34.0 | 34.1 | 34.1 | 34.0 | 28.8 | 32.1 | 32.4 | 32.6 | 32.4 | 31.6 | |
| Varying cluster | Central | 47.3 | 48.5 | 48.9 | 48.6 | 39.0 | 50.8 | 51.4 | 51.5 | 51.5 | 45.4 |
| East North Central | 66.5 | 66.5 | 66.7 | 66.5 | 59.1 | 68.5 | 69.1 | 69.3 | 69.0 | 67.4 | |
| Northeast | 74.3 | 74.8 | 74.9 | 74.6 | 67.6 | 79.0 | 79.3 | 78.7 | 79.1 | 75.3 | |
| Northwest | 42.5 | 42.4 | 42.0 | 41.9 | 26.7 | 58.1 | 57.7 | 57.0 | 56.8 | 52.1 | |
| South | 64.3 | 64.2 | 64.4 | 64.1 | 52.7 | 70.2 | 69.9 | 69.6 | 69.8 | 63.1 | |
| Southeast | 64.3 | 64.8 | 65.8 | 64.2 | 53.2 | 68.0 | 68.3 | 69.0 | 68.1 | 63.5 | |
| Southwest | 37.5 | 37.8 | 38.5 | 38.5 | 30.6 | 53.0 | 52.0 | 50.9 | 52.8 | 43.7 | |
| West | 33.8 | 33.6 | 34.4 | 34.1 | 32.8 | 58.8 | 57.7 | 57.3 | 57.5 | 52.4 | |
| West North Central | 36.6 | 36.7 | 36.8 | 36.6 | 31.4 | 59.8 | 58.8 | 58.1 | 58.4 | 53.4 | |
Publisher’s Note: MDPI stays neutral with regard to jurisdictional claims in published maps and institutional affiliations. |
© 2021 by the authors. Licensee MDPI, Basel, Switzerland. This article is an open access article distributed under the terms and conditions of the Creative Commons Attribution (CC BY) license (http://creativecommons.org/licenses/by/4.0/).
Share and Cite
Kianian, B.; Liu, Y.; Chang, H.H. Imputing Satellite-Derived Aerosol Optical Depth Using a Multi-Resolution Spatial Model and Random Forest for PM2.5 Prediction. Remote Sens. 2021, 13, 126. https://doi.org/10.3390/rs13010126
Kianian B, Liu Y, Chang HH. Imputing Satellite-Derived Aerosol Optical Depth Using a Multi-Resolution Spatial Model and Random Forest for PM2.5 Prediction. Remote Sensing. 2021; 13(1):126. https://doi.org/10.3390/rs13010126
Chicago/Turabian StyleKianian, Behzad, Yang Liu, and Howard H. Chang. 2021. "Imputing Satellite-Derived Aerosol Optical Depth Using a Multi-Resolution Spatial Model and Random Forest for PM2.5 Prediction" Remote Sensing 13, no. 1: 126. https://doi.org/10.3390/rs13010126
APA StyleKianian, B., Liu, Y., & Chang, H. H. (2021). Imputing Satellite-Derived Aerosol Optical Depth Using a Multi-Resolution Spatial Model and Random Forest for PM2.5 Prediction. Remote Sensing, 13(1), 126. https://doi.org/10.3390/rs13010126


