Article

Evaluation of Radar-Rainfall Products over Coastal Louisiana

University of Louisiana at Lafayette, Department of Civil Engineering & Watershed Flood Center, Lafayette, LA 70503, USA
*
Author to whom correspondence should be addressed.
Remote Sens. 2020, 12(9), 1477; https://doi.org/10.3390/rs12091477
Submission received: 18 March 2020 / Revised: 30 April 2020 / Accepted: 2 May 2020 / Published: 6 May 2020
(This article belongs to the Section Environmental Remote Sensing)

Abstract

:
Radar-rainfall products provide valuable information for hydro-ecological modeling and ecosystem applications, especially over coastal regions that lack adequate in-situ rainfall observations. This study evaluates two radar-based rainfall products, the Multi-Sensor Stage IV and the Multi-Radar Multi-Sensor (MRMS), over the Louisiana coastal region in the United States. Surface reference rainfall observations from two independent rain gage networks were used in the analysis. The evaluation included distribution-based comparisons between radar and gage observations at different time scales (hourly to monthly), bias decomposition to quantify the contribution of different error sources, and conditional evaluation of systematic and random components of the estimation errors. Both products report large levels of random errors at the hourly scale; however, the performance of the radar-rainfall products improves significantly with the increase in time scales. After decomposing the total bias, the results show that the largest contributor to the overall bias in radar-rainfall products is false rainfall detection, followed by missed rainfall. The results also reveal that the Stage IV product experienced a significant improvement over the area in the past few years (post 2015) compared to earlier periods. The results have implications for ongoing and future coastal ecosystem modeling and planning studies.

Graphical Abstract

1. Introduction

Precipitation is one of the major driving factors in natural ecosystems and is highly critical to ongoing and future hydrological, environmental, and ecological planning studies. Although rain gages provide direct and accurate surface rainfall measurement, their point-based observations hinder their ability to provide high-resolution, spatially continuous areal coverage [1]. In addition, the typical spatial sparsity of rain gages can be quite limiting for studies that span large-scale watersheds and ecosystems [2]. The need for reliable information with high spatial and temporal resolutions is more evident over areas that suffer from sparse rain gage availability. Prime examples of such areas are coastal ecosystems that are typically under-monitored in terms of key hydrological variables. Over the last two decades, weather radars have become a highly desirable source of rainfall information because of their extensive continuous spatial coverage with relatively high spatial and temporal resolutions [3,4,5]. Nevertheless, radar-rainfall products are affected by numerous sources of uncertainties due to the indirect relationships between their raw reflectivity observations and the desired surface rainfall estimates. The sources of these uncertainties include radar calibration error, beam attenuation and blockage, ground clutter, anomalous propagation, bright band and range effects [6,7]. Thus, it is important to characterize the uncertainties associated with radar-rainfall products in order to understand their potential impacts on the quality of various modeling and environmental analysis applications.
The current article focuses on evaluating two radar-rainfall products over the Louisiana coastal region, namely; the National Center for Environmental Prediction (NCEP) Multi-Sensor Stage IV [8] and the National Severe Storms Laboratory (NSSL) Multi-Radar Multi-Sensor (MRMS) [9]. These two products are arguably the most commonly used radar-rainfall products by the hydrological community and are a result of a continuous development and improvement over the past couple of decades. The two products will be evaluated over the Louisiana coastal region along the Gulf of Mexico in the south-central US, as a typical example of other coastal regions that are not adequately monitored by rain gage networks. The lack of rain gauge coverage affects the calibration and bias correction of radar-rainfall products [3,4,10,11]. The Hydrometeorological Automated Data System (HADS) hourly precipitation network [12] used in Stage IV and MRMS bias correction is sparsely available (about 25 gages over the entire coastal Louisiana). This is not peculiar over the study region since it is mostly covered by coastal marshes and wetlands, and less by urban areas where rain gauges can be more readily available. Such lack of availability of rain gage observations can significantly affect the overall quality of radar-rainfall estimates in the area [13].
Recent studies [14,15] documented the progression in radar-rainfall products’ performance over the years. This performance enhancement can be directly attributed to the continuous improvements in the National Weather Service (NWS) Weather Surveillance Radar-1988 Doppler (WSR-88D) algorithms as well as the inclusion of additional calibration datasets (e.g., rain gage networks). A common assessment of previous studies [16,17,18,19] is that Stage IV and MRMS provide reliable spatial rainfall estimates over various parts of the conterminous United States (CONUS). Adams III and Dymond (2019) [15] showed the significant improvement in Stage IV, especially starting in the year 2016 (median biases close to unity) in the Ohio River Valley, USA. They attributed this to the use of the initial MRMS estimates (reflectivity fields) in Stage IV production. The performance of Stage IV and MRMS in hydrological applications has been evaluated in several studies [20,21,22,23,24]. These studies demonstrated that using Stage IV and MRMS to force various hydrological models resulted in high quality hydrological simulations. Studies such as Quintero et al. (2016), ElSaadani (2017), and ElSaadani et al. (2018) [23,24,25] demonstrated the effect of the propagation of radar-rainfall errors in hydrological modeling simulations. Such studies also highlighted the importance of characterizing the errors associated with radar-rainfall products prior to using them in conducting hydrological and ecological simulations. The importance of addressing the quality of rainfall information was specifically highlighted over coastal basins [20,26] where rainfall plays a critical role in determining the overall balance of the freshwater budgets and salinity regimes. Accurate representation of temporal rainfall variability was found critical in explaining salinity changes, especially in flow-restricted estuarine systems [27].
Evaluation of the performance of radar-rainfall products needs further attention over coastal regions that suffer from sparse rain gauge coverage. In this study we provide such evaluation using reference observations from two independent (i.e., not used for radar-rainfall bias correction) rain gage networks located in the Louisiana coastal region. This article will provide valuable information to the developers of the radar-rainfall products on where improvements are needed in the estimation algorithms, as well as to hydro-ecologic modelers and planners who are interested in using such products in their respective applications. Our study can also be useful for large-scale ecosystem restoration and protection initiatives underway in many coastal regions such as the Louisiana Coastal Master Plan (CMP) [28,29]. The rest of this article is organized as follows. Section 2 provides an overview of the study area, the two radar-rainfall products to be evaluated, and the rain gage networks used as ground reference. Section 3 describes the methods used in the evaluation. Section 4 provides the study results obtained from the different analyses. Discussion of results and final conclusions are presented in Section 5 and Section 6.

2. Study Area and Datasets

The study area covers the Louisiana coastal zone located in south Louisiana (Figure 1). Coastal Louisiana has a low-relief topography, and its climate is heavily influenced by the Gulf of Mexico. It is frequently subject to tropical storms and hurricanes that result in heavy flooding. Coastal Louisiana is an important natural and economic resource that hosts a rich ecological system. This complex and fragile system has been negatively impacted by both natural and anthropogenic factors (e.g., climate change, hurricanes, relative sea level rise, land subsidence, manipulation of the landscape) which resulted in loss of land at alarming rates [28,29]. Coastal Louisiana covers around one third of the state total area and is populated by roughly two million citizens [29]. The area is very flat with some areas below mean sea level which makes it vulnerable to storm surge, land subsidence and major loss of wetlands [28,29]. The area’s strategic socio-economics can be attributed to oil and natural gas industry, agriculture, commercial fishing, petrochemical industry, and tourism [28,29]. Thus, assessing the quality of rainfall information at relevant spatial scales is crucial in order to inform modeling and planning activities in such vital ecosystems. Constrained by the record of the independent ground reference data that will be used for evaluating the radar products, the study period of the evaluation is January 2017 through August 2018. The MRMS was operational at NCEP in September 2014, nevertheless, the system was subject to significant updates and was implemented operationally by the NWS in 2016 [9]. However, Stage IV data is available since 2002 and provides the main source of long-term radar-rainfall data. Studies such as Habib et al. (2013), Prat and Nelson (2015) and Adams III and Dymond (2019) [13,14,15] demonstrated how Stage IV performance have changed over the years at different locations in the US. Thus, in this study we also inspect the changes in Stage IV’s performance over our study area over the 2012–2017 period.

2.1. Radar-Rainfall Products

This study evaluates two radar-rainfall products, NCEP’s Stage IV and NSSL’s MRMS over the Louisiana coastal region. These products are derived from three NWS Doppler radars (WSR-88D) located in Lake Charles (KLCH), Fort Polk (KPOE) and Slidell (KLIX), (Figure 1). The coastal zone is not adequately monitored by rain gages, thus limiting the amount of ground observations used in radar-rainfall bias correction. Stage IV has a long historical record starting from 2002 and has spatial and temporal resolutions of ~ 4 km × 4 km and 1 hour, respectively [8]. The product is based on the Multi-Sensor Precipitation Estimator (MPE) algorithm and national mosaic from regional multi-sensor analyses by NWS River Forecast Centers (RFC’s) [4,30,31,32,33]. The MPE algorithm is a fusion of Digital Precipitation Arrays (DPA) and combines data from several WSR-88D radars with operational rain gage data to produce hourly gage-adjusted precipitation estimates projected on the Hydrological Rainfall Analysis Projection (HRAP) grid [34]. The relatively fine spatial and temporal resolution of Stage IV make it suitable for implementation in different ecological and hydrological applications, but an understanding of the nature of errors associated with the product is necessary to ensure and anticipate the quality of model outputs [22,23,24,25,35]. The Stage IV data used in this study was obtained from the University Corporation for Atmospheric Research (UCAR) archive at https://data.eol.ucar.edu/dataset/21.093.
The MRMS system was developed at NSSL and was deployed operationally to the NWS in 2016. It was produced from a seamless national 3D radar mosaicked over the CONUS at high spatial and temporal resolutions. It is a real-time operational system with an automated algorithm that rapidly integrates multiple over-lapping radars, atmospheric environmental data, satellite data, numerical weather prediction (NWP) models and rain gages [9]. It takes 3D volume scans data from WSR-88D radars, and approximately 7000 HADS hourly rain gage data covering the entire US to correct the product. The final MRMS gage-corrected product has a spatial resolution 0.01˚ (~ 1 km × 1 km) and a temporal resolution of 1 hour. We obtained the MRMS data used in this study from the Iowa State University archive at http://mtarchive.geol.iastate.edu.

2.2. Rain Gage Network

The two radar-rainfall products will be evaluated using independent ground observations obtained from two rain gage networks. The first network is operated by the Calcasieu Parish (‘parish’ is equivalent to county in other states) in southwest Louisiana and (Figure 1). The second network is based on the national-scale Citizen Weather Observer Program (CWOP) and we used the data from the stations located within our study area. Both rain gage networks provide hourly rainfall accumulations, matching the radar-rainfall products’ temporal resolution. The available Calcasieu parish rain gage record covers the period from January 2017 to August 2018, thus limiting our radar-gage comparisons to this period. In order to perform the evaluation, we determined the corresponding radar pixel to each rain gage based on nearest neighbor method. The number of gages available from the Calcasieu parish and CWOP networks are 77 and 30, respectively. It is important to note that the Calcasieu parish gage observations have a minimum threshold of 1 mm/h. Thus, hours with radar-rainfall observations less than 1 mm/h were omitted from the analysis. We also applied the same threshold to the CWOP network to ensure the uniformity of our analysis.
Rain gage observations are also prone to errors due to factors such as wind, gage under-catch, wetting losses, and recording and transfer errors, among others [36]. Thus, we performed additional quality assessment on the rain gage data in order to exclude erroneous data and only retain high quality observations [37]. This included visual inspection of the data [38] where neighboring gages were cross-compared to detect gages that may have missed significant amounts of rainfall [39]. We also compared gage observations against Stage IV and MRMS radar-rainfall accumulations over different temporal scales (i.e., hourly, daily, and monthly). If the estimates were unreasonably and drastically different over a certain time period, this period was eliminated from the analysis.
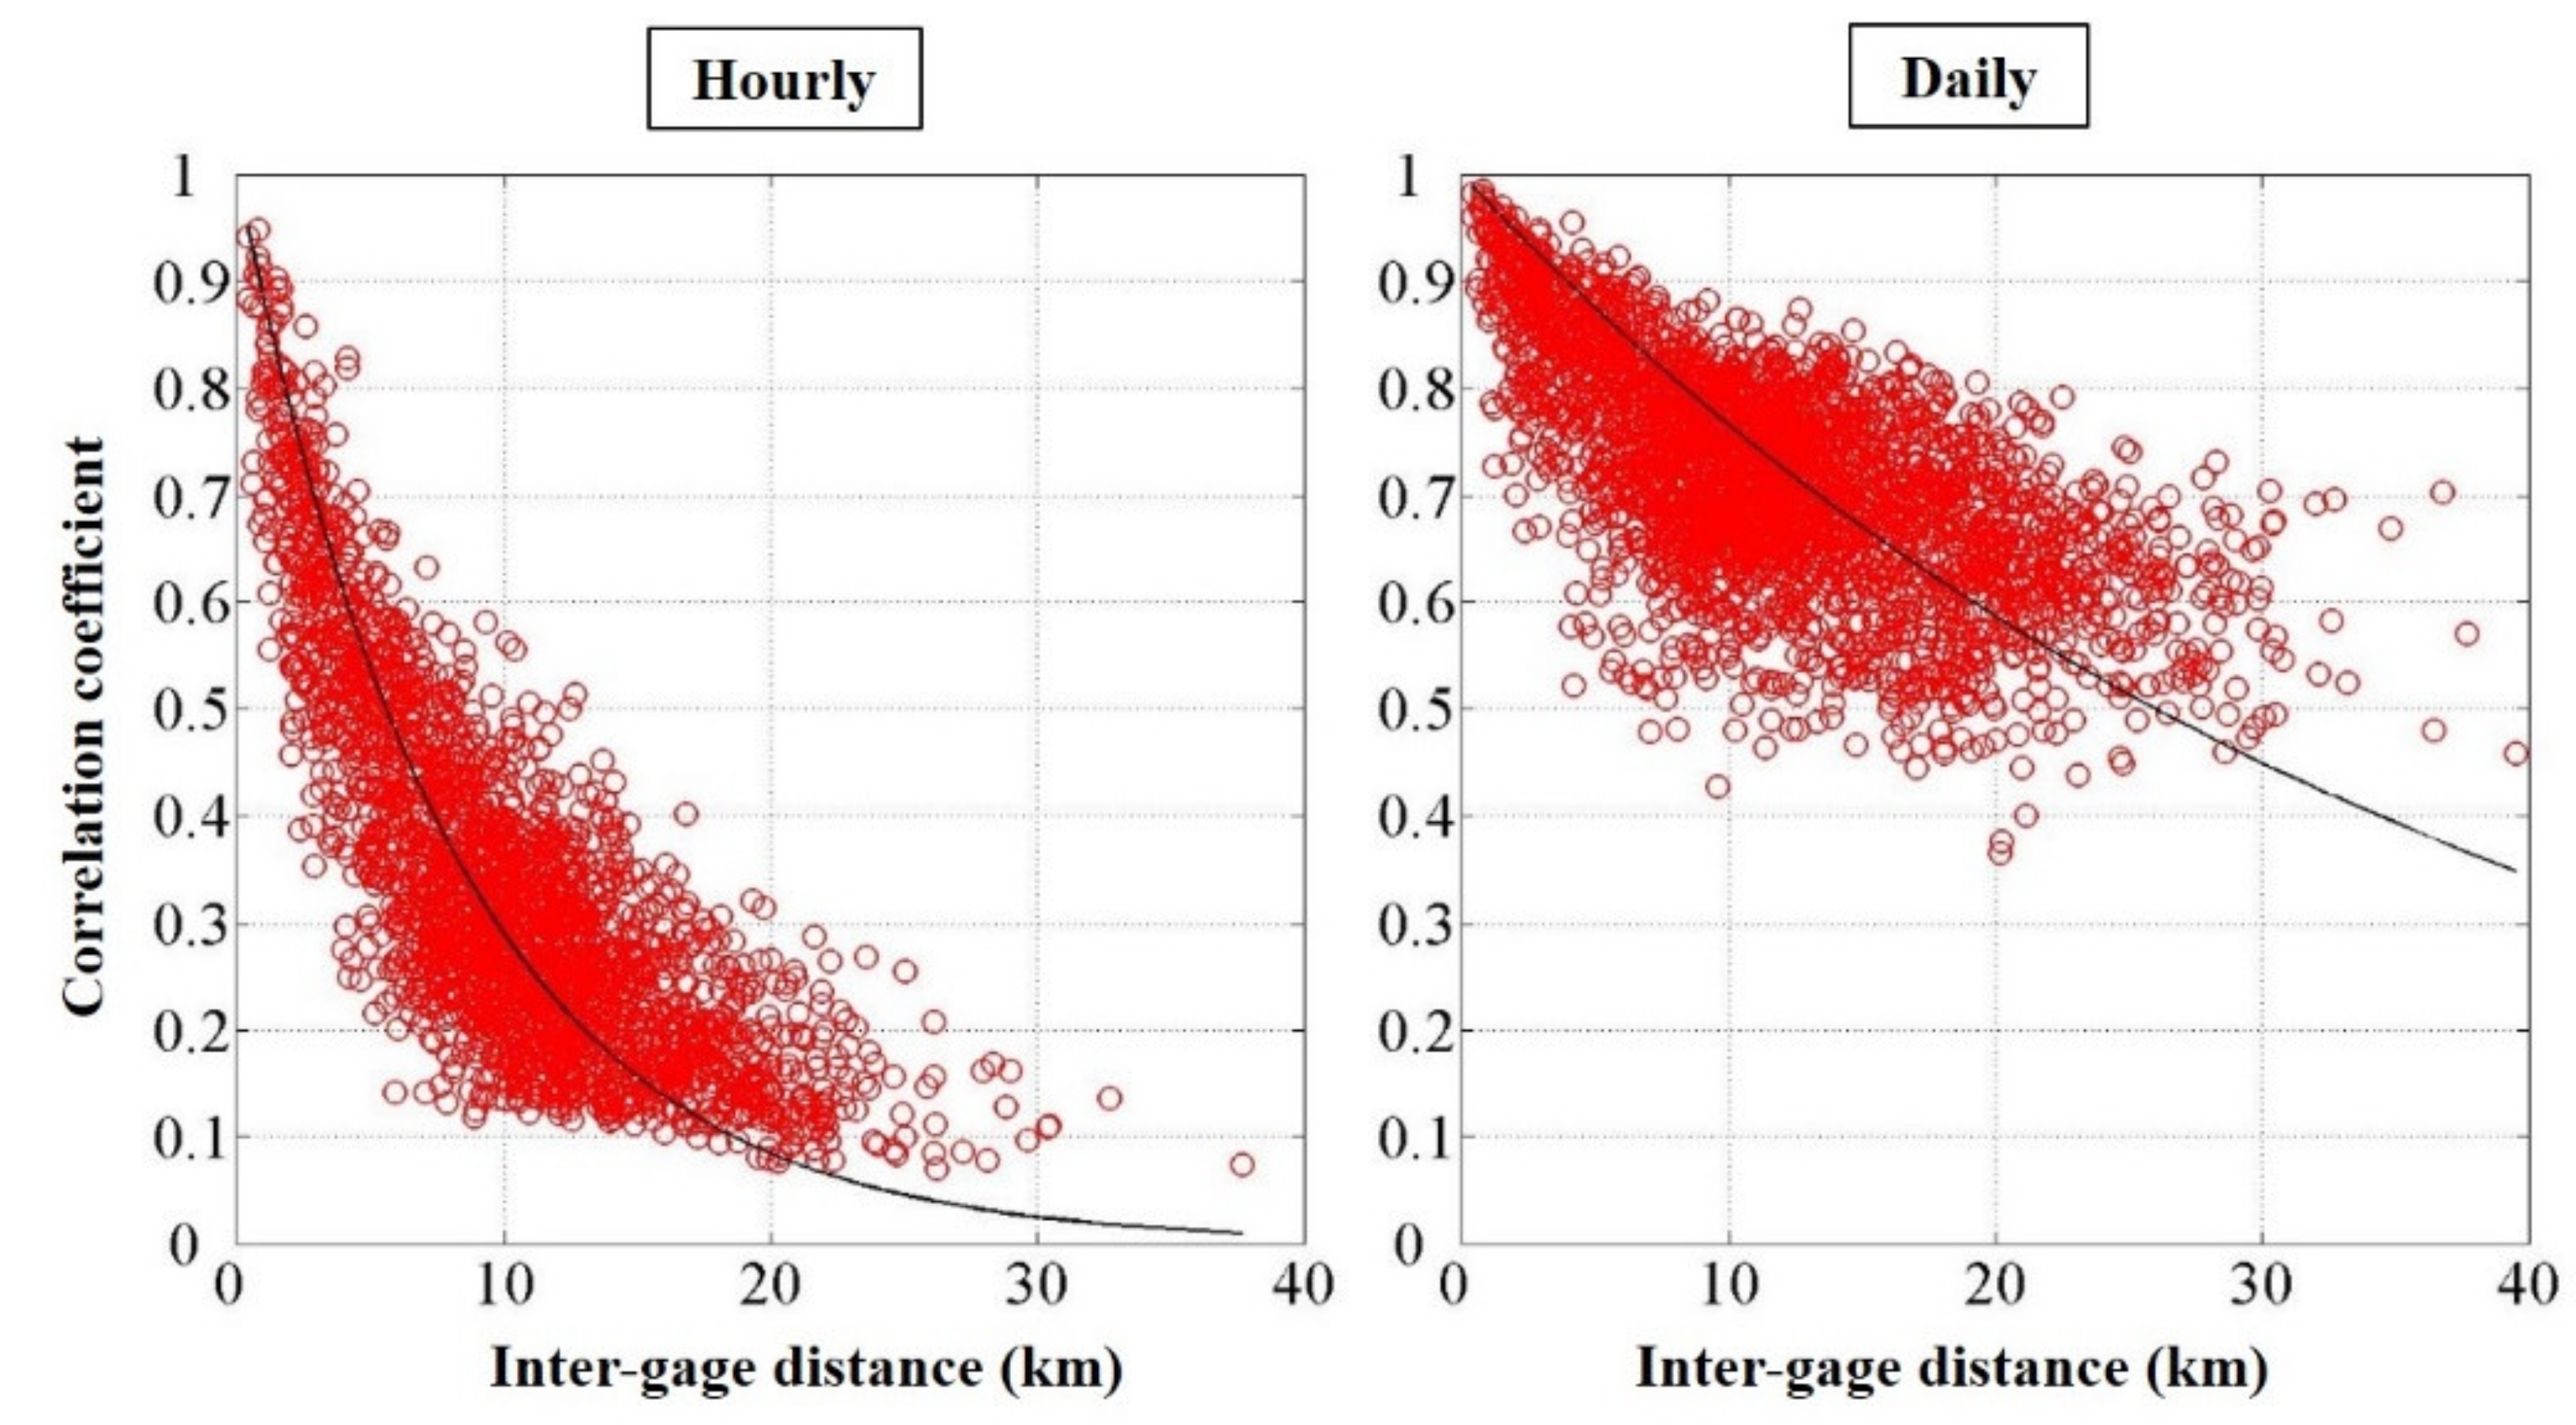
Point-based rain gage observations may not always provide accurate representation of the areal rainfall over the radar grid pixel scale [16,40]. Therefore, prior to performing a direct comparison between radar products and our point-based ground observations, it is necessary to examine the effects of the difference in the spatial scales between the two (i.e., point vs radar pixel) [41]. In order to verify the representativeness of rain gage observations to those of the corresponding radar pixel, we calculated the empirical spatial correlation function of rainfall at the hourly and daily scales (Figure 2). Since the spatial scales of the two radar-rainfall products are 4 km and 1 km, the spatially dense observations of the Calcasieu parish network are more suitable for deriving the spatial correlation information compared to the sparser CWOP network. Each point in Figure 2 represents the correlation between the observations from a pair of rain gages from the Calcasieu parish network and their corresponding inter-gauge distance. The black lines in the figure represent an exponential fit for the correlation estimates. As expected, the spatial correlation of rainfall increases (spatial variability decreases) as the time step of rainfall accumulation increases from hourly to daily. At the hourly scale, the results indicate relatively moderate and high levels of correlation at 1 km (MRMS resolution) and 4 km (Stage IV resolution), respectively. The correlations are much higher for the daily temporal scale at the resolutions of both products. This shows that a direct gage–radar comparison is possible due to the relatively small spatial variability over the radar pixel area, especially for the daily time scale. For our gauge–pixel comparisons, and in the case that more than one gauge was located within a single pixel, each gauge was paired separately with its corresponding pixel to be used later in the product evaluation analysis.

3. Methods

3.1. Spatial Radar-Rainfall Accumulation

Spatial radar-rainfall accumulations help detect systematic errors such as beam blockage, product mosaicking artifacts, and ground clutter, among others [15]. Based on the findings of studies such as Habib et al. (2013), Prat and Nelson (2015) and Adams III and Dymond (2019) [13,14,15], radar-rainfall products underwent significant development to minimize these systematic errors. Out of the two products, only Stage IV has a long historical record dating back to the year 2002, which means that it will continue to serve as a primary input for any modeling studies that require long-term rainfall datasets over coastal regions, such as the case in Louisiana. Thus, it is important to investigate historical Stage IV rainfall accumulations over our study area. To do this, we examined annual rainfall accumulation maps of Stage IV starting from 2012 through the end of the evaluation period (August 2018) to monitor any changes in the product’s performance. Additionally, during the evaluation period we performed a visual comparison between Stage IV and MRMS to investigate if there are any noticeable differences in the rainfall spatial patterns between the two products.

3.2. Unconditional and Conditional Statistical Analysis

A series of graphical comparisons and statistical metrics were used to evaluate Stage IV and MRMS. Scatter plots of radar-rainfall products against gage observations at different time scales and probability of exceedance comparisons at hourly and daily scale were developed. In addition, we evaluated a number of unconditional and conditional statistical metrics to quantify the systematic and random errors associated with the radar-rainfall products. In this study, the term “error” is defined as the difference between radar-rainfall estimates and their corresponding gage observations.
We used a suite of summary statistics including, overall bias (B) or mean error, standard deviation (σ) of differences, Pearson’s linear correlation coefficient (r) and Normalized Root Mean Square Error (NRMSE). Bias (B; Equation 1) is defined as the mean difference between the radar-gage rainfall estimates and is a measure of systematic error. Standard deviation of the differences helps in measuring random errors. Pearson’s correlation coefficient is a measure of linear association between the two products. Root mean square error is normalized by the mean of rain gage data and is defined as Normalized Root Mean Square Error (NRMSE). In the following equations, radar-rainfall is denoted by R radar and the corresponding gage rainfall is denoted by R gage , while overbar represents the average operation:
Bias :   B = R radar ¯ R gage ¯ ,
Standard   deviation :   S = R r a d a r R g a g e R r a d a r R g a g e ¯ 2 ¯ ,
Pearson s   correlation   coefficient :   r = ( R radar R radar ¯ ) ( R gage R gage ¯ ) ¯ σ radar   σ gage ,
Normalized   root   mean   square   error :   NRMSE = ( R radar R gage ) 2 ¯ R gage ¯
We calculated the probability of exceedance of rainfall intensities of both radar-rainfall products and the rain gage networks in order to monitor the performance of the radar-rainfall products conditional to the spectrum of given hourly and daily accumulations. This is done by comparing the number of occurrences of intensities exceeding a certain value (over the hourly and daily scales) to the total number of the corresponding rainy occurrences in that temporal scale. In addition, we calculated the conditional versions of the summary statistics listed above to provide a more detailed performance assessment. Following Habib et al. (2009) [16], the total bias, defined at the overall difference between the radar and corresponding gage accumulations over the entire sample, can be decomposed into three components: Hit Bias (HB), Missed Bias (MB) and False Bias (FB). Hit bias is the total difference between the radar and the corresponding gage observations when rainfall is detected by both sensors. Missed bias is the total depth of rainfall reported by the reference gage data that have not been detected in the radar product. False bias is the total depth of falsely detected rainfall by the radar that have not been detected by the corresponding rain gages. These conditional error components help in detecting any systematic problems in the radar-rainfall products.
HB = Σ ( R radar R gage ) | ( R radar > 0   &   R gage > 0 ) ,
MB = Σ R gage | ( R radar = 0   &   R gage > 0 ) ,
FB = Σ R radar | ( R radar > 0   &   R gage = 0 ) ,
TB = Σ R radar R gage ,
Following Habib et al. (2013) and Ciach et al. (2007) [13,42], we also evaluated the statistical metrics as conditional expectation functions based on rainfall intensities. The conditional bias and standard deviation of the estimation error ( e = R radar R gage ) were derived by conditioning on a specific value (rg) of the reference rainfall ( R gage ). The conditional error is described as: e | R gage = r g , where r g represents a specific value of the random variable R gage :
Conditional   bias :   CB = e | R gage = r g ¯ ,
Conditional   standard   deviation   of   error :   CS = e e ¯ 2 | R gage = r g ¯ ,
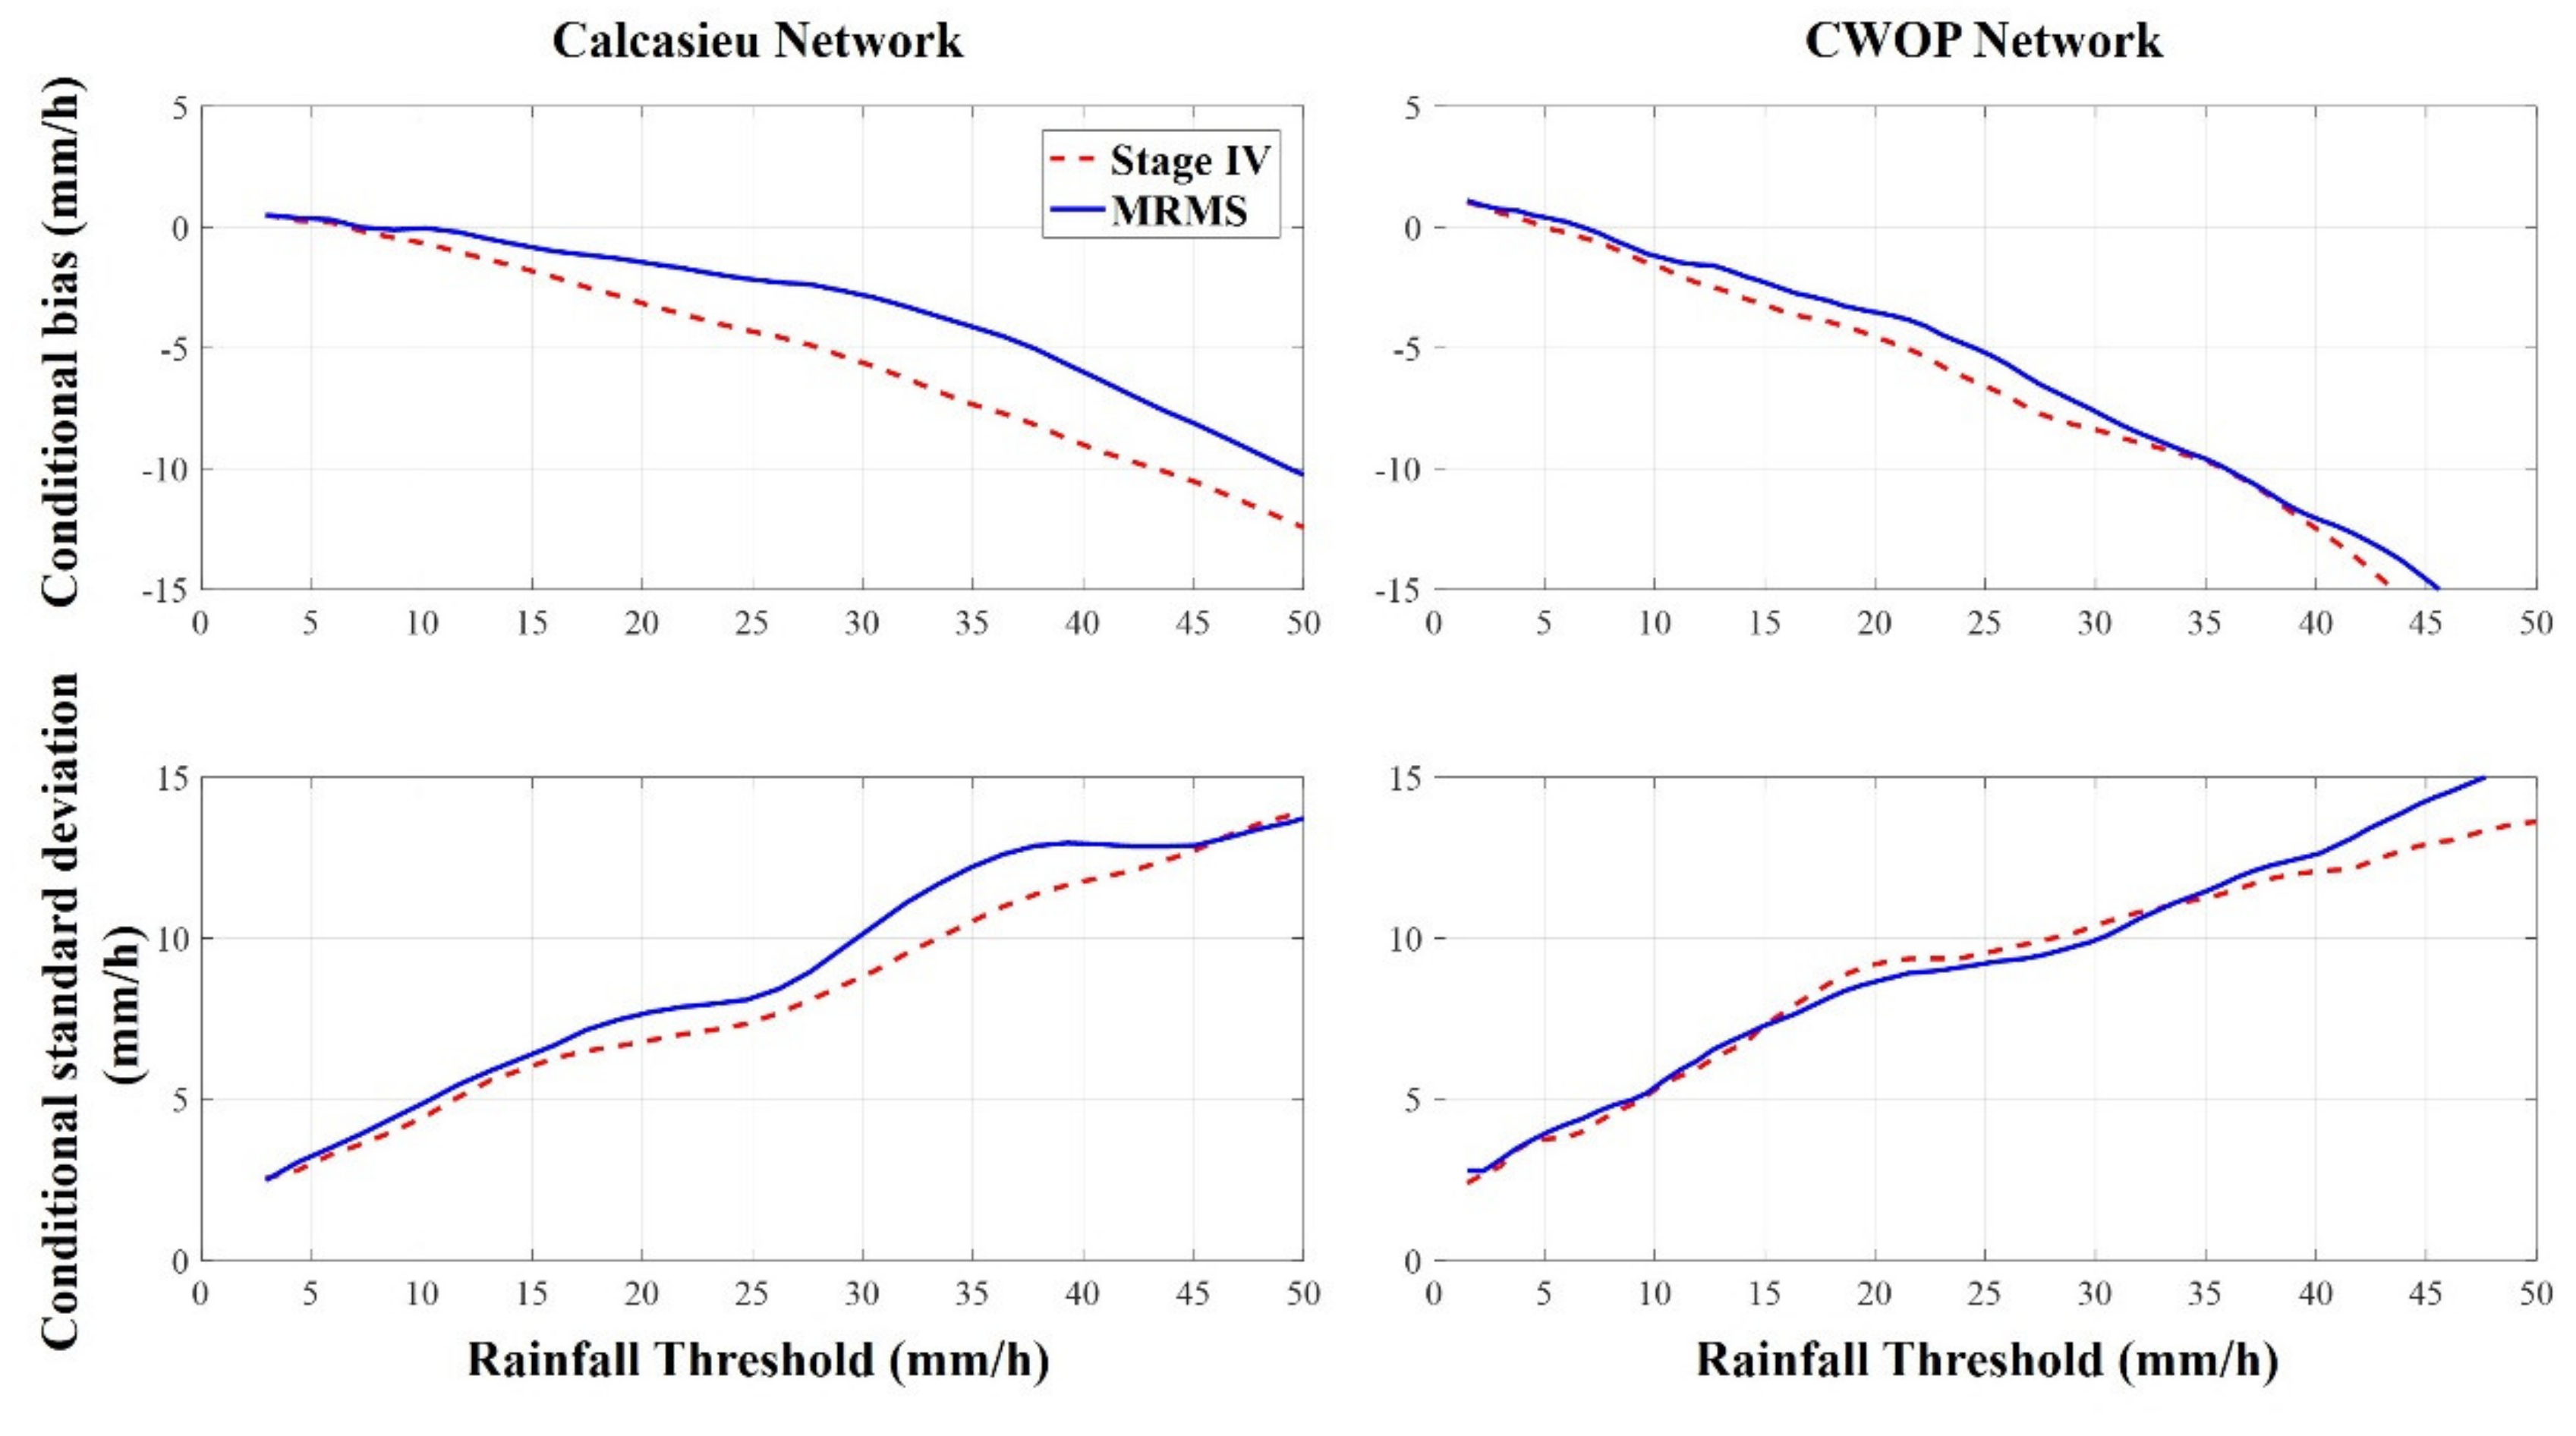
Following Ciach et al. (2007) [42], we expressed the conditional statistics, conditional bias (CB) and conditional standard deviation of errors (CS) using kernel regression approach with a moving window averaging formula. The window size is proportional to the R gage value. When the center of the window moves to larger R gage values, the conditional sample size significantly decreases. For this reason, the conditional statistics are not reported beyond R gage = 50 mm/h.

4. Results

4.1. Spatial Accumulation Maps

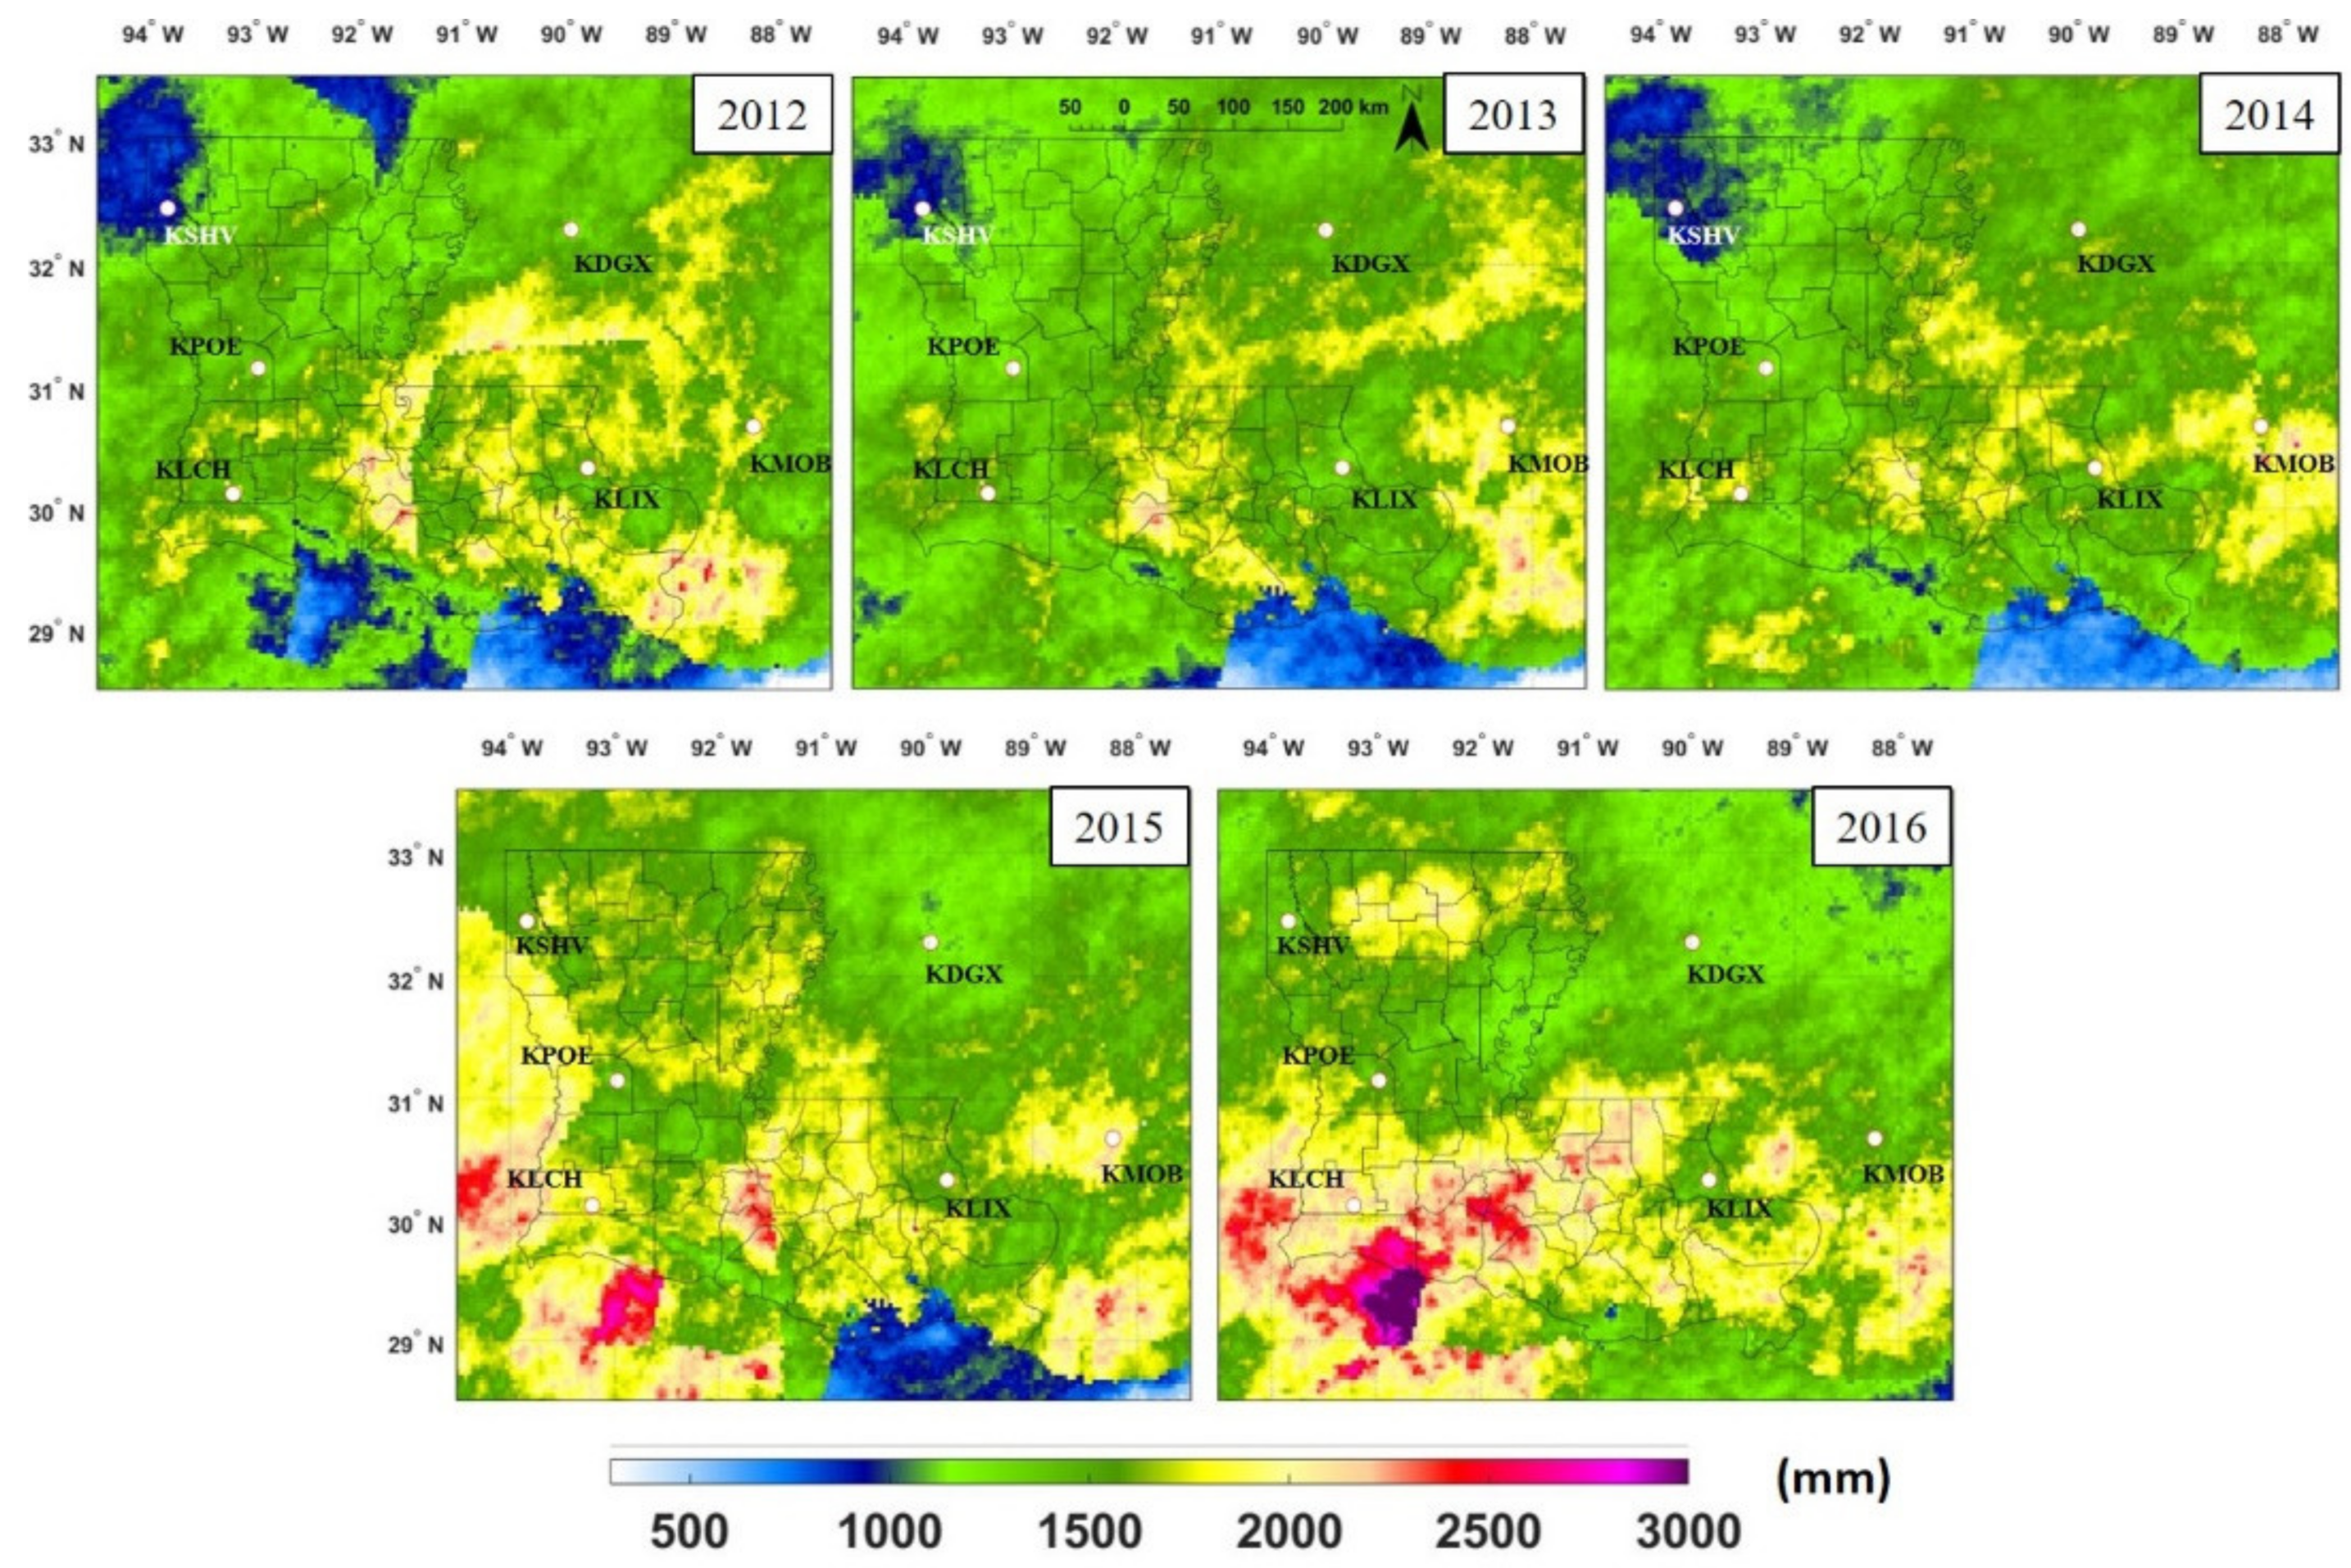
Figure 3 shows the spatial annual accumulation maps of Stage IV for the years 2012 through 2016. Similar plots for years 2017 and 2018 are shown in Figure 4 and Figure 5, respectively. A noticeable feature which stands out in the accumulations of the years 2012 through 2014 is the gap in rainfall accumulations and the apparent visibility of the mosaicking polygon around the KLIX radar located near Slidell and into the Gulf of Mexico. This issue seems to improve starting in 2015, primarily due to the fact that the Stage IV product started utilizing base radar fields from the MRMS over the region starting that year (personal communications, Jeffery Graschel and Scott Lincoln, Lower Mississippi River Forecast Center). Prior to 2015, the Stage IV product relied on a mosaicking algorithm that takes the lowest altitude datum among the multiple radars that cover the same point on the surface. While this approach ensures the most accurate surface rainfall rate estimates, it may result in spatial discontinuities in the merged field, such as those observed in years 2012, 2013 and 2014 in Figure 3. Starting year 2015, the Stage IV started to use base fields from the MRMS system with a weight-based mosaicking approach [9] that results in smoother rainfall fields and avoids the spatial discontinuities noticed earlier. Another noticeable feature is the visible beam blockage over the south-east side of the radar KLCH located near the city of Lake Charles in southwest Louisiana. There is also a significant decrease in the rainfall accumulations over the Gulf area in southeastern Louisiana, which was consistently present till the end of 2015 and has been resolved during the year 2016. These issues should be considered while conducting modeling studies that use Stage IV observations prior to 2015, especially if such models are sensitive to long-term precipitation accumulations. Years prior to 2012 show the same spatial mosaicking artifacts but they are not presented in this article for space considerations.
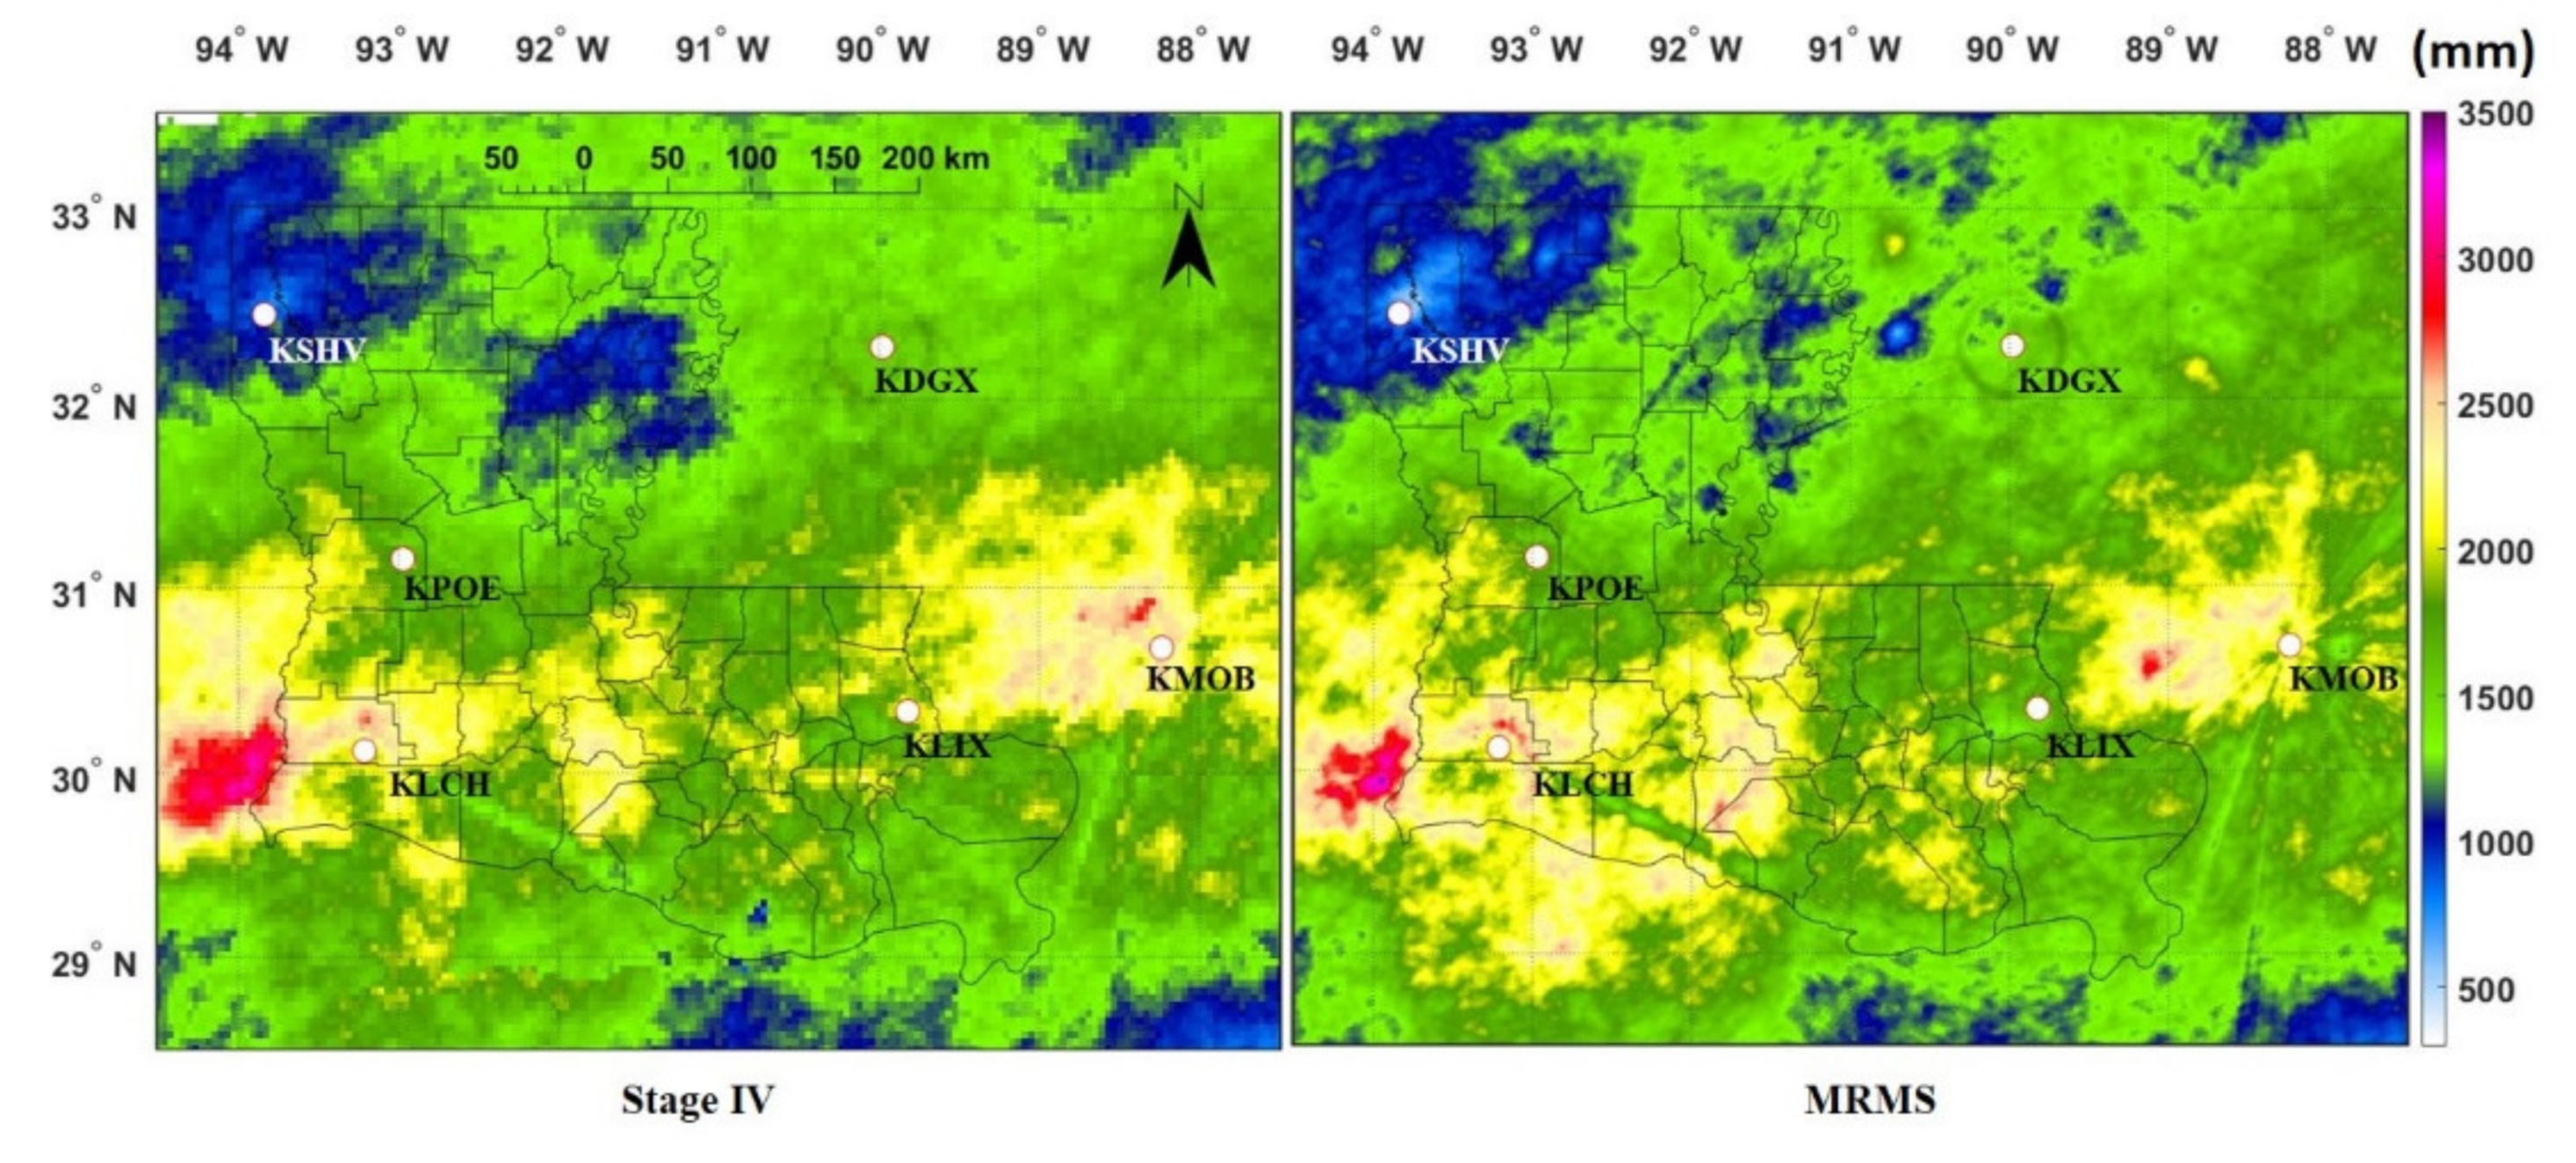
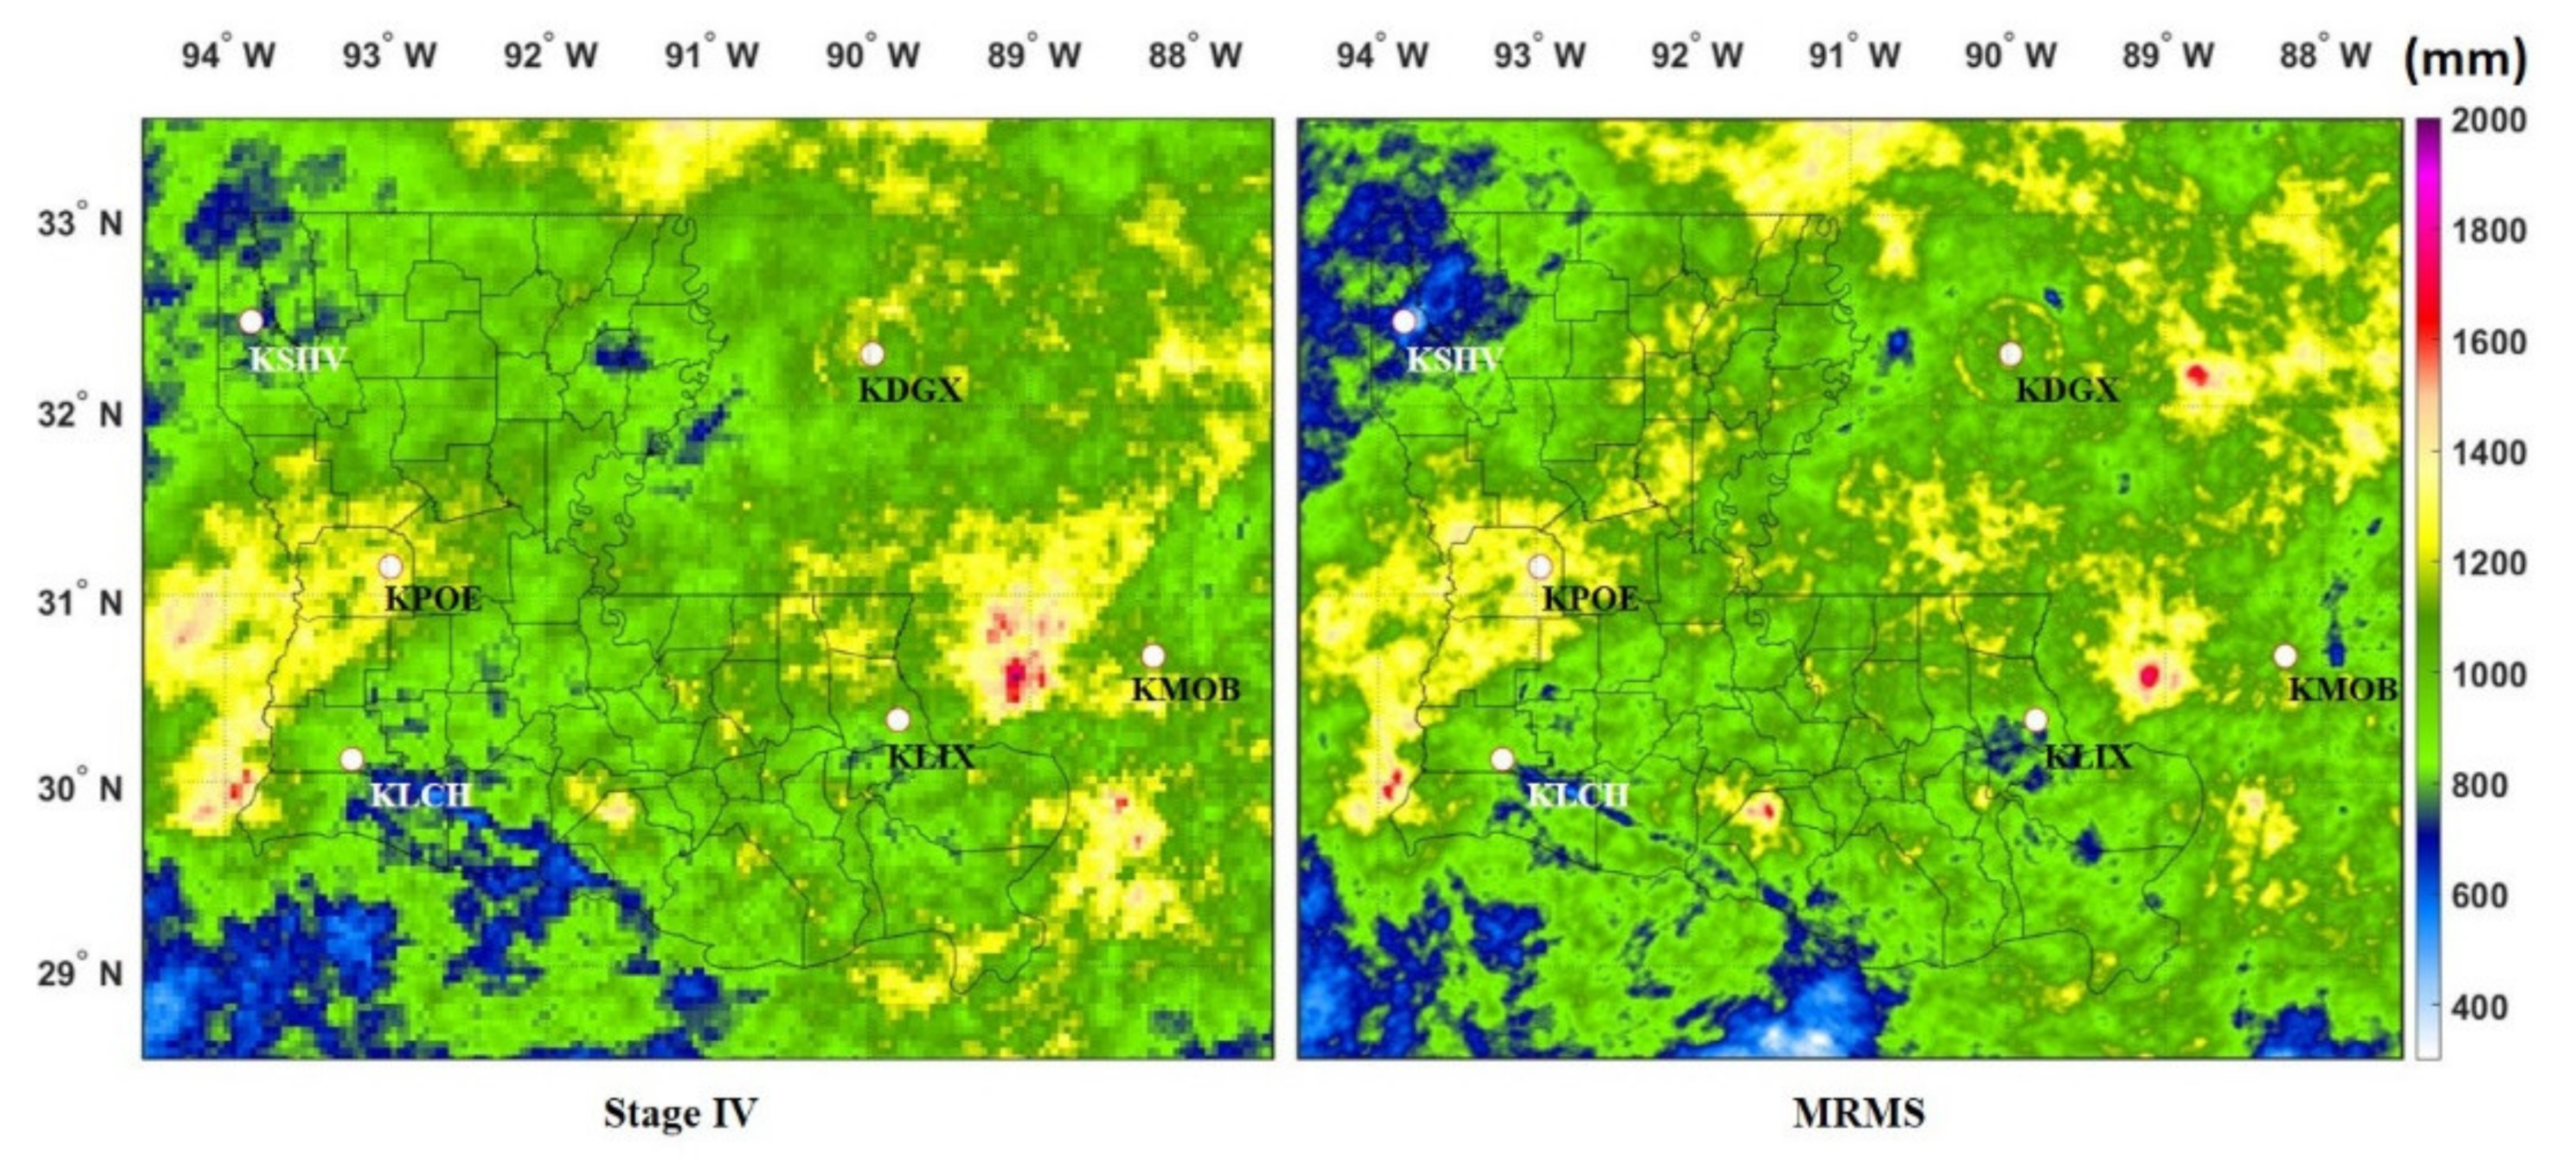
Figure 4 shows the spatial accumulation in the year 2017, for Stage IV (left) and MRMS (right). Over coastal Louisiana, Stage IV estimates are overall lower than those of MRMS especially in southwest Louisiana covered by KLCH. The figures also show that while the overall spatial patterns of both radar-rainfall products are similar, there are a few common noticeable artifacts. Despite the disappearance of the mosaicking artifacts mentioned earlier, beam blockage is still present in both products and is visible for the KLCH and KMOB radars located in Lake Charles, Louisiana and Mobile, Alabama, respectively. The blockage of the KLCH radar is a result of a tower located close to the radar (personal communication, NWS Lake Charles Office). In addition, a ring shape of higher intensity rainfall accumulations is visible for both products around the KDGX radar in Jackson. Such artifacts could be attributed to the radar scanning strategy and the use of different tilts at different distances. Determining the specific cause of this effect may require examining the individual radar scans, which is beyond the scope of this study. Figure 5 shows the accumulations of January through August of 2018 (end of our study period) for both radar-rainfall products. In addition to the observations from Figure 4, the spatial distribution of MRMS preserves details of the high-intensity rainfall clusters, mainly due to its higher spatial resolution than that of Stage IV (e.g., north and west of Mobile, Alabama (KMOB) radar, west of Lake Charles, Louisiana (KLCH), and between KLCH and Slidell, Louisiana (KLIX)). Large areas of heavy rain are completely missed by Stage IV, e.g., east of Jackson, Mississippi (KDGX). MRMS also tends to show more pronounced patterns of beam blockages around the KMOB radar compared to Stage IV.

4.2. Assessment of Unconditional Error Statistics

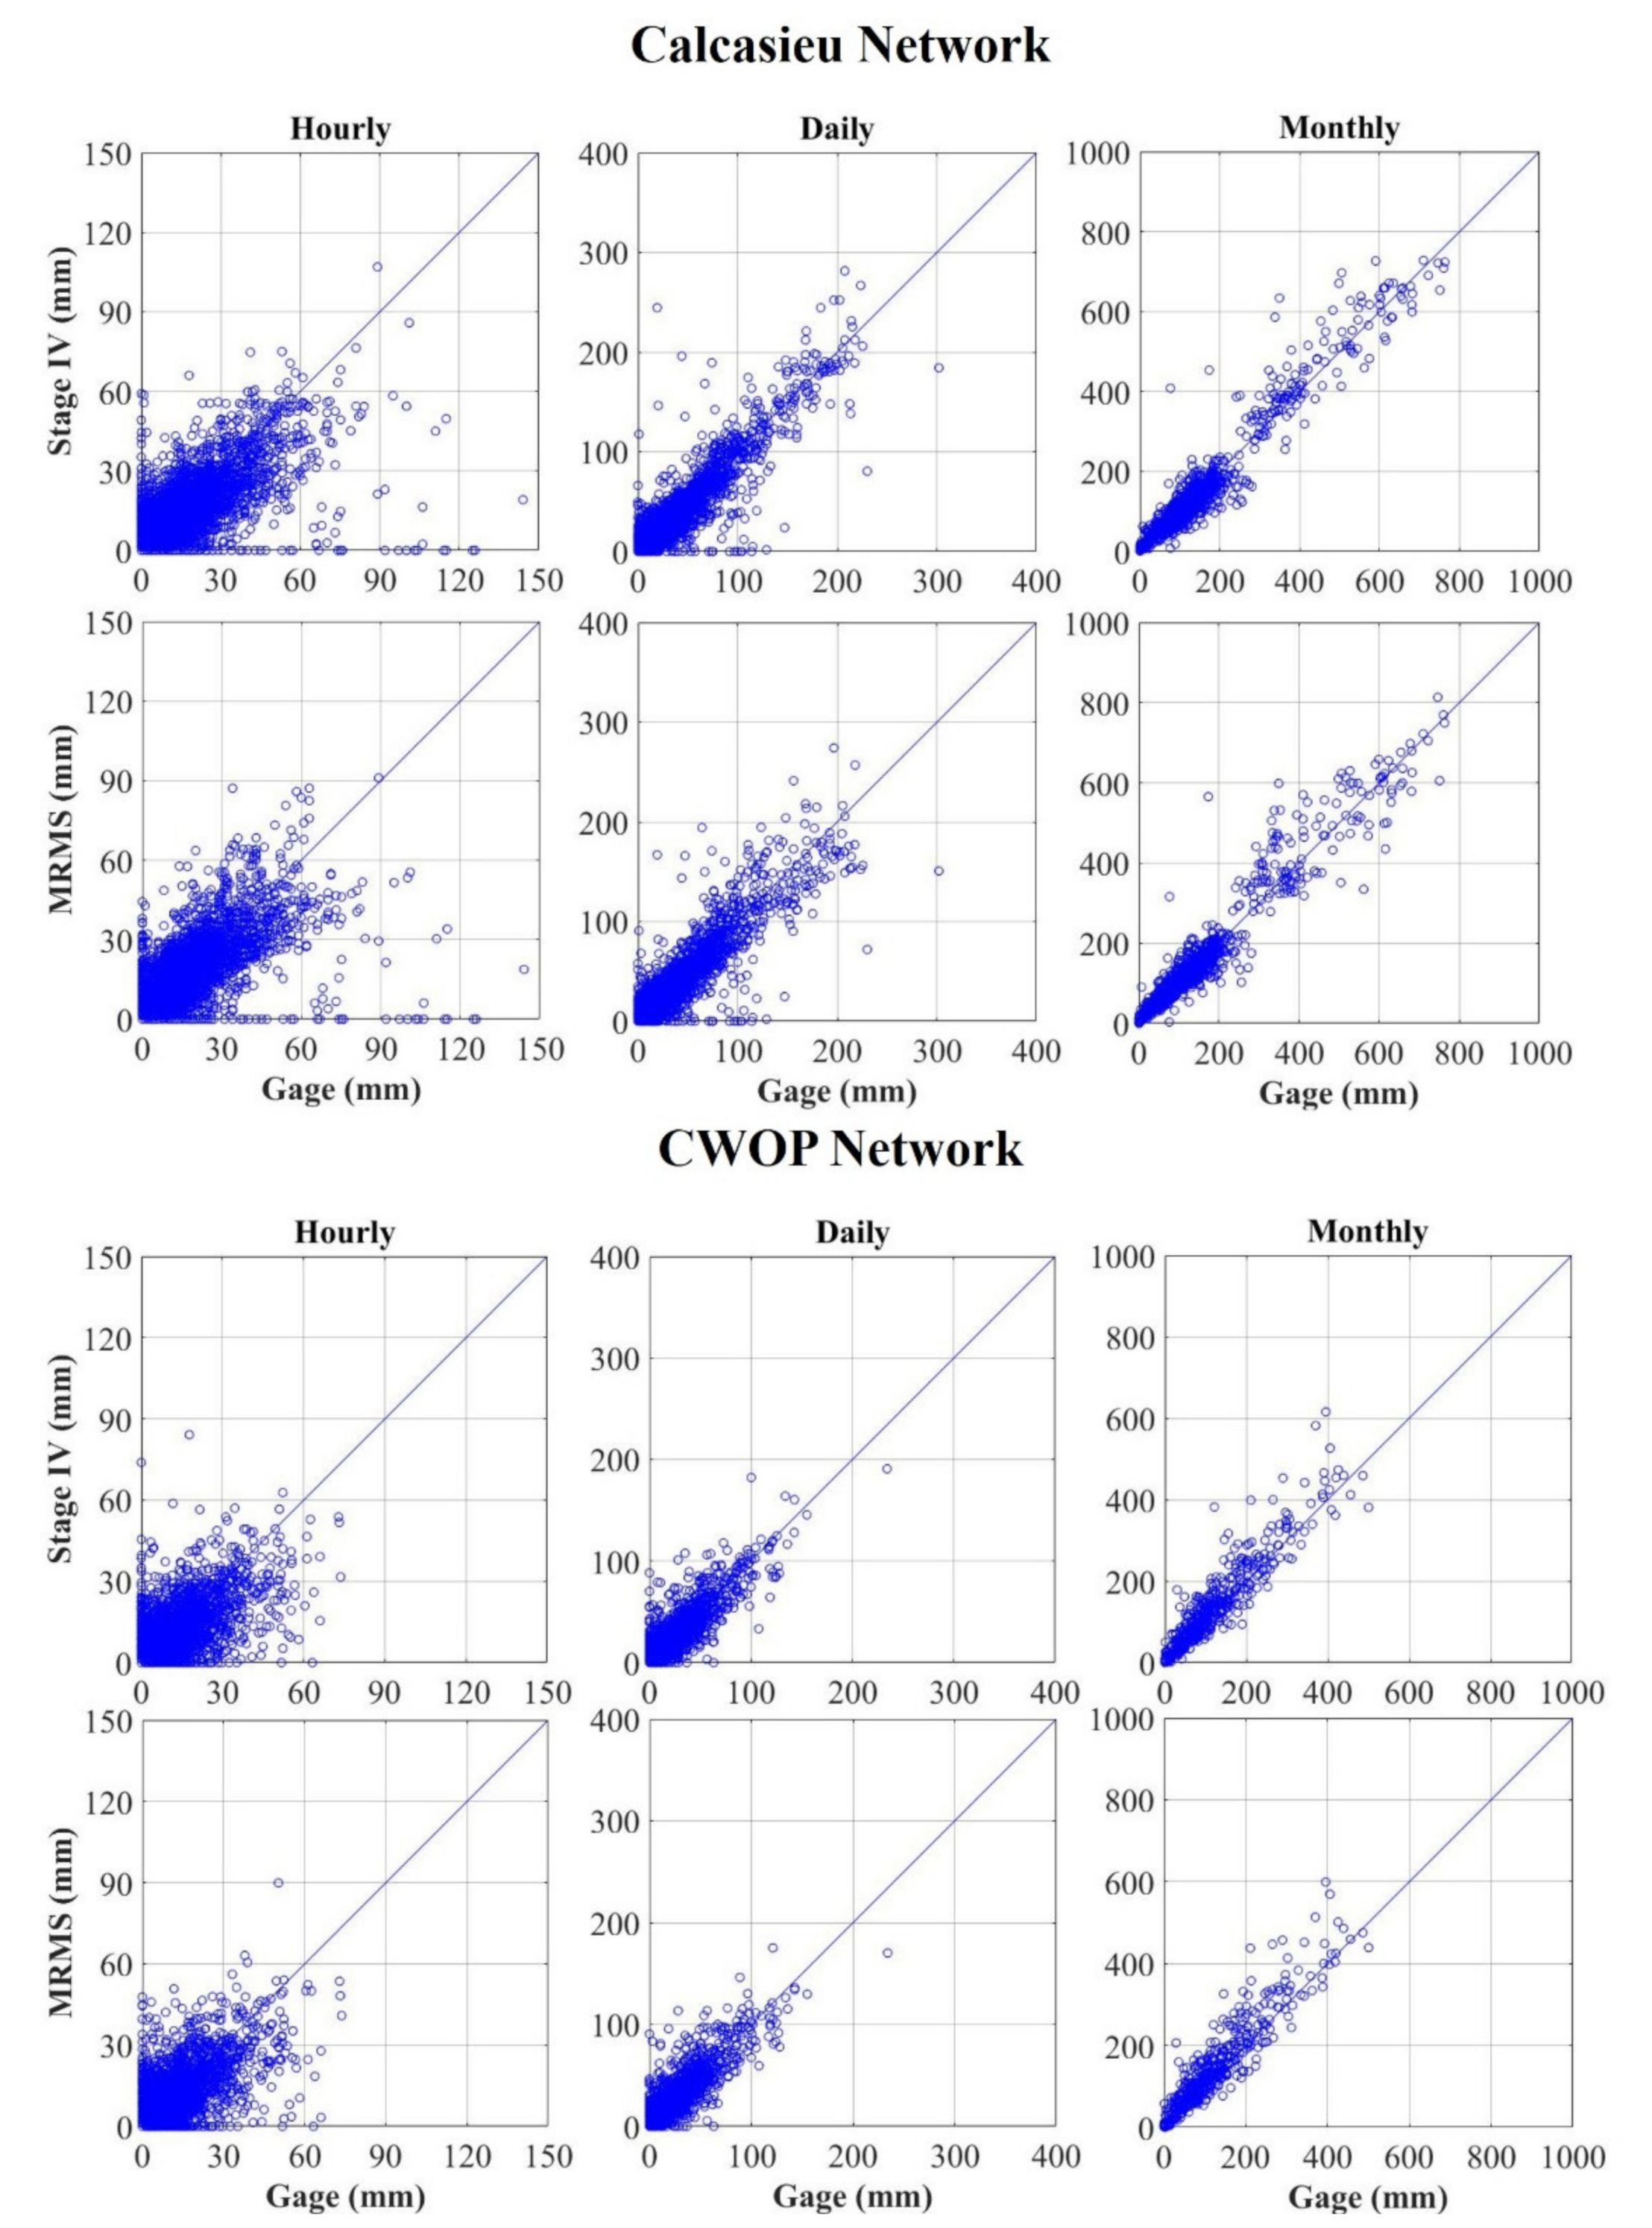
Graphical comparisons using scatterplots of the radar versus rain gages are presented in Figure 6 at hourly, daily, and monthly scales. The figure shows large differences between the observations of both gage networks and the two radar products at the hourly scale; however, such differences are significantly reduced as the rainfall estimates are accumulated to larger time scales such as daily and monthly. At hourly scales, differences as large as 15–30 mm/h are common. The scatterplots show several failed and false detections by the radar products compared to the gage observations. Missed and false detections up to 25 mm/h at the hourly scale and up to 50 mm/day at the daily scale are present. Note that despite careful quality control of the gages, some of these failed or false detections can still be attributed to gage quality issues. Significant difference as large as 30–45 mm/day at the daily scale and 50–70 mm/month at the monthly scale are also observed. In few instances, the radar product missed extremely high rainfall values (over 100 mm/h) over the Calcasieu network, these gages are not located near any beam blockages. Overall, the degree of scatter is similar for both radar products and both networks. Nevertheless, deviations from observed values are more evident at hourly scale for CWOP network compared to Calcasieu network, possibly indicating a lesser gage quality for this citizen network. Issues related to gage maintenance and inconsistencies in collection times [10] are supported by the larger deviations at the hourly time scale and how they were significantly reduced at the daily and monthly scales (Figure 6).
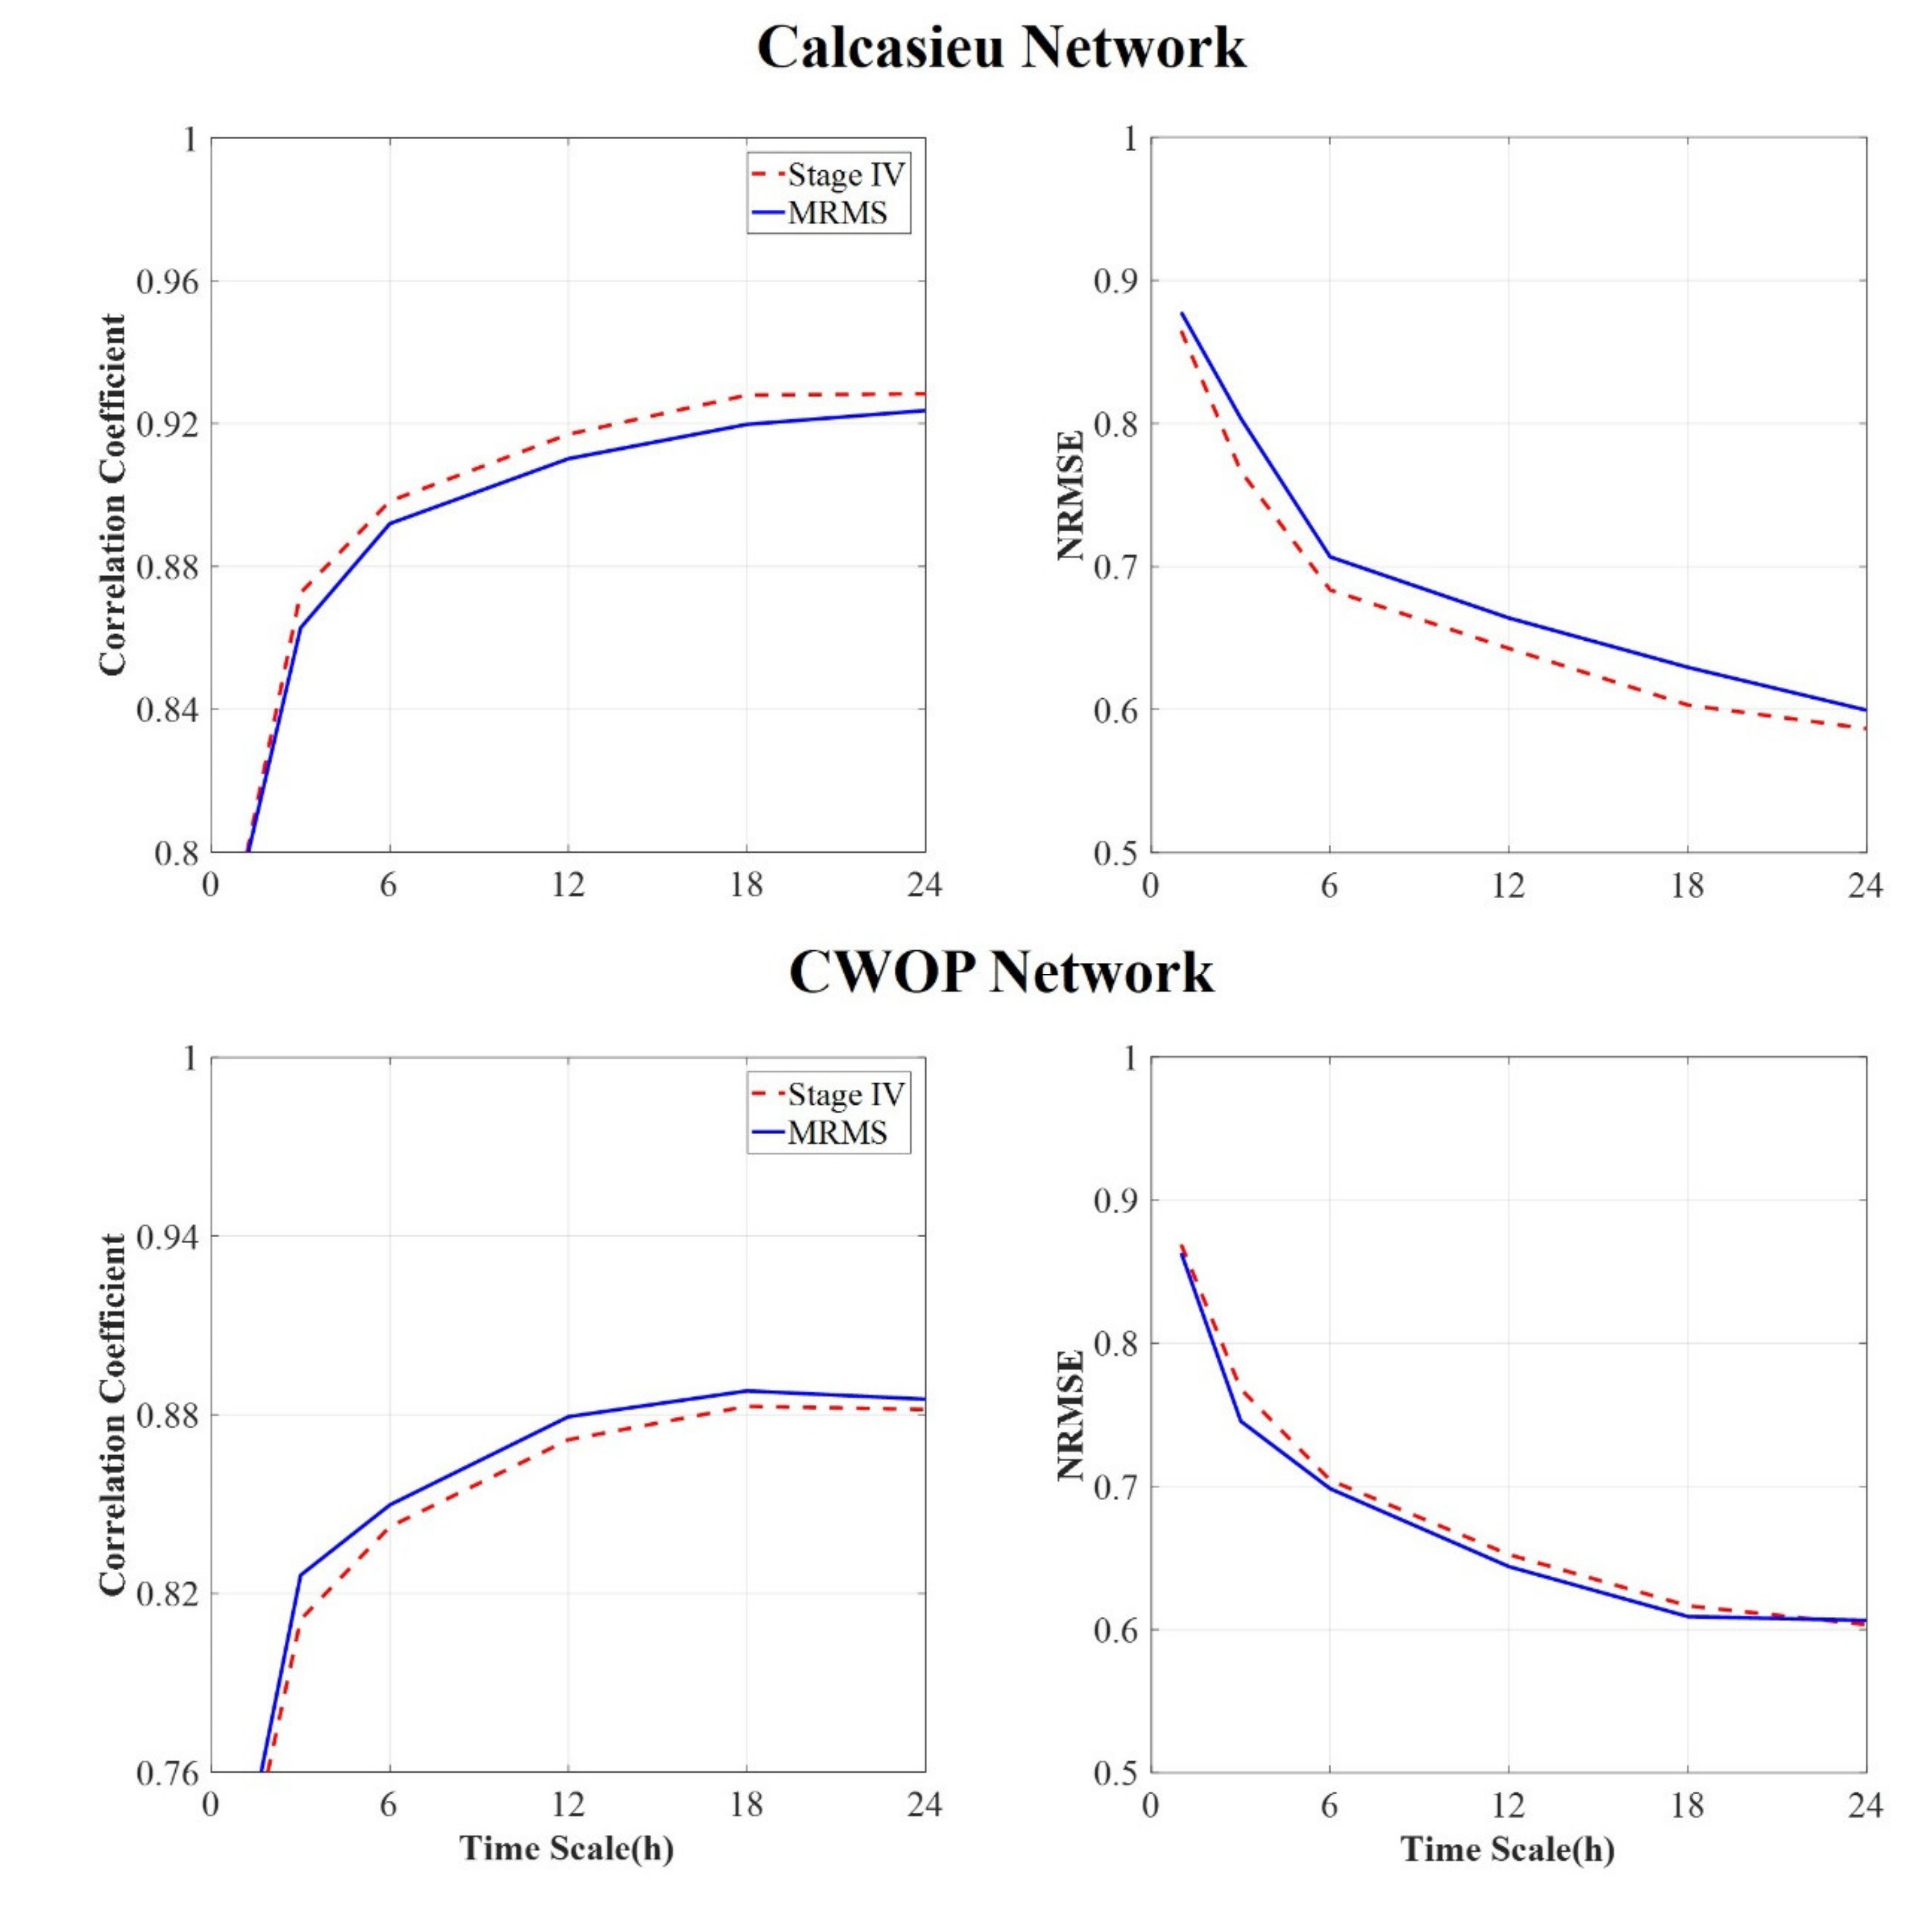
To quantify the differences between the radar products and the gauge observations, the basic statistical skill scores described in equations 1 through 4 are reported in Table 1. These statistics were calculated using time intervals where either gage or radar reported non-zero amounts. The results indicate relatively low overall bias values, which are consistent with previous studies [9,10], especially for the case of Calcasieu network. The overall bias values for the daily and monthly scales are larger in the case of CWOP compared to the Calcasieu network indicating possible data quality issues with the CWOP network. The results also show that MRMS has a slightly higher positive bias (overestimation) compared to Stage IV. Both radar products correlate highly with the reference networks (correlation coefficient of 0.7 and higher). The random error, characterized by the standard deviation of the differences and by the NRMSE statistics, has similar levels for both products. Both statistics are noticeably high at the hourly scale, indicating considerable random errors at this time scale. The NRMSE values are always less than unity at all timescales, but can be as high 0.88 at the hourly scale. As expected, both products experience a significant decrease in the magnitude of random errors with the increase of time scale from hourly to daily to monthly. A further examination of the performance at sub-daily scales is presented in Figure 7 by plotting the correlation (left column) and NRMSE (right column) versus time scale. The greatest improvement in the performance of both products is attained over the range of 1–6 hours, after which a gradual improvement with less gradient is observed.

4.3. Probability of Exceedance Analysis

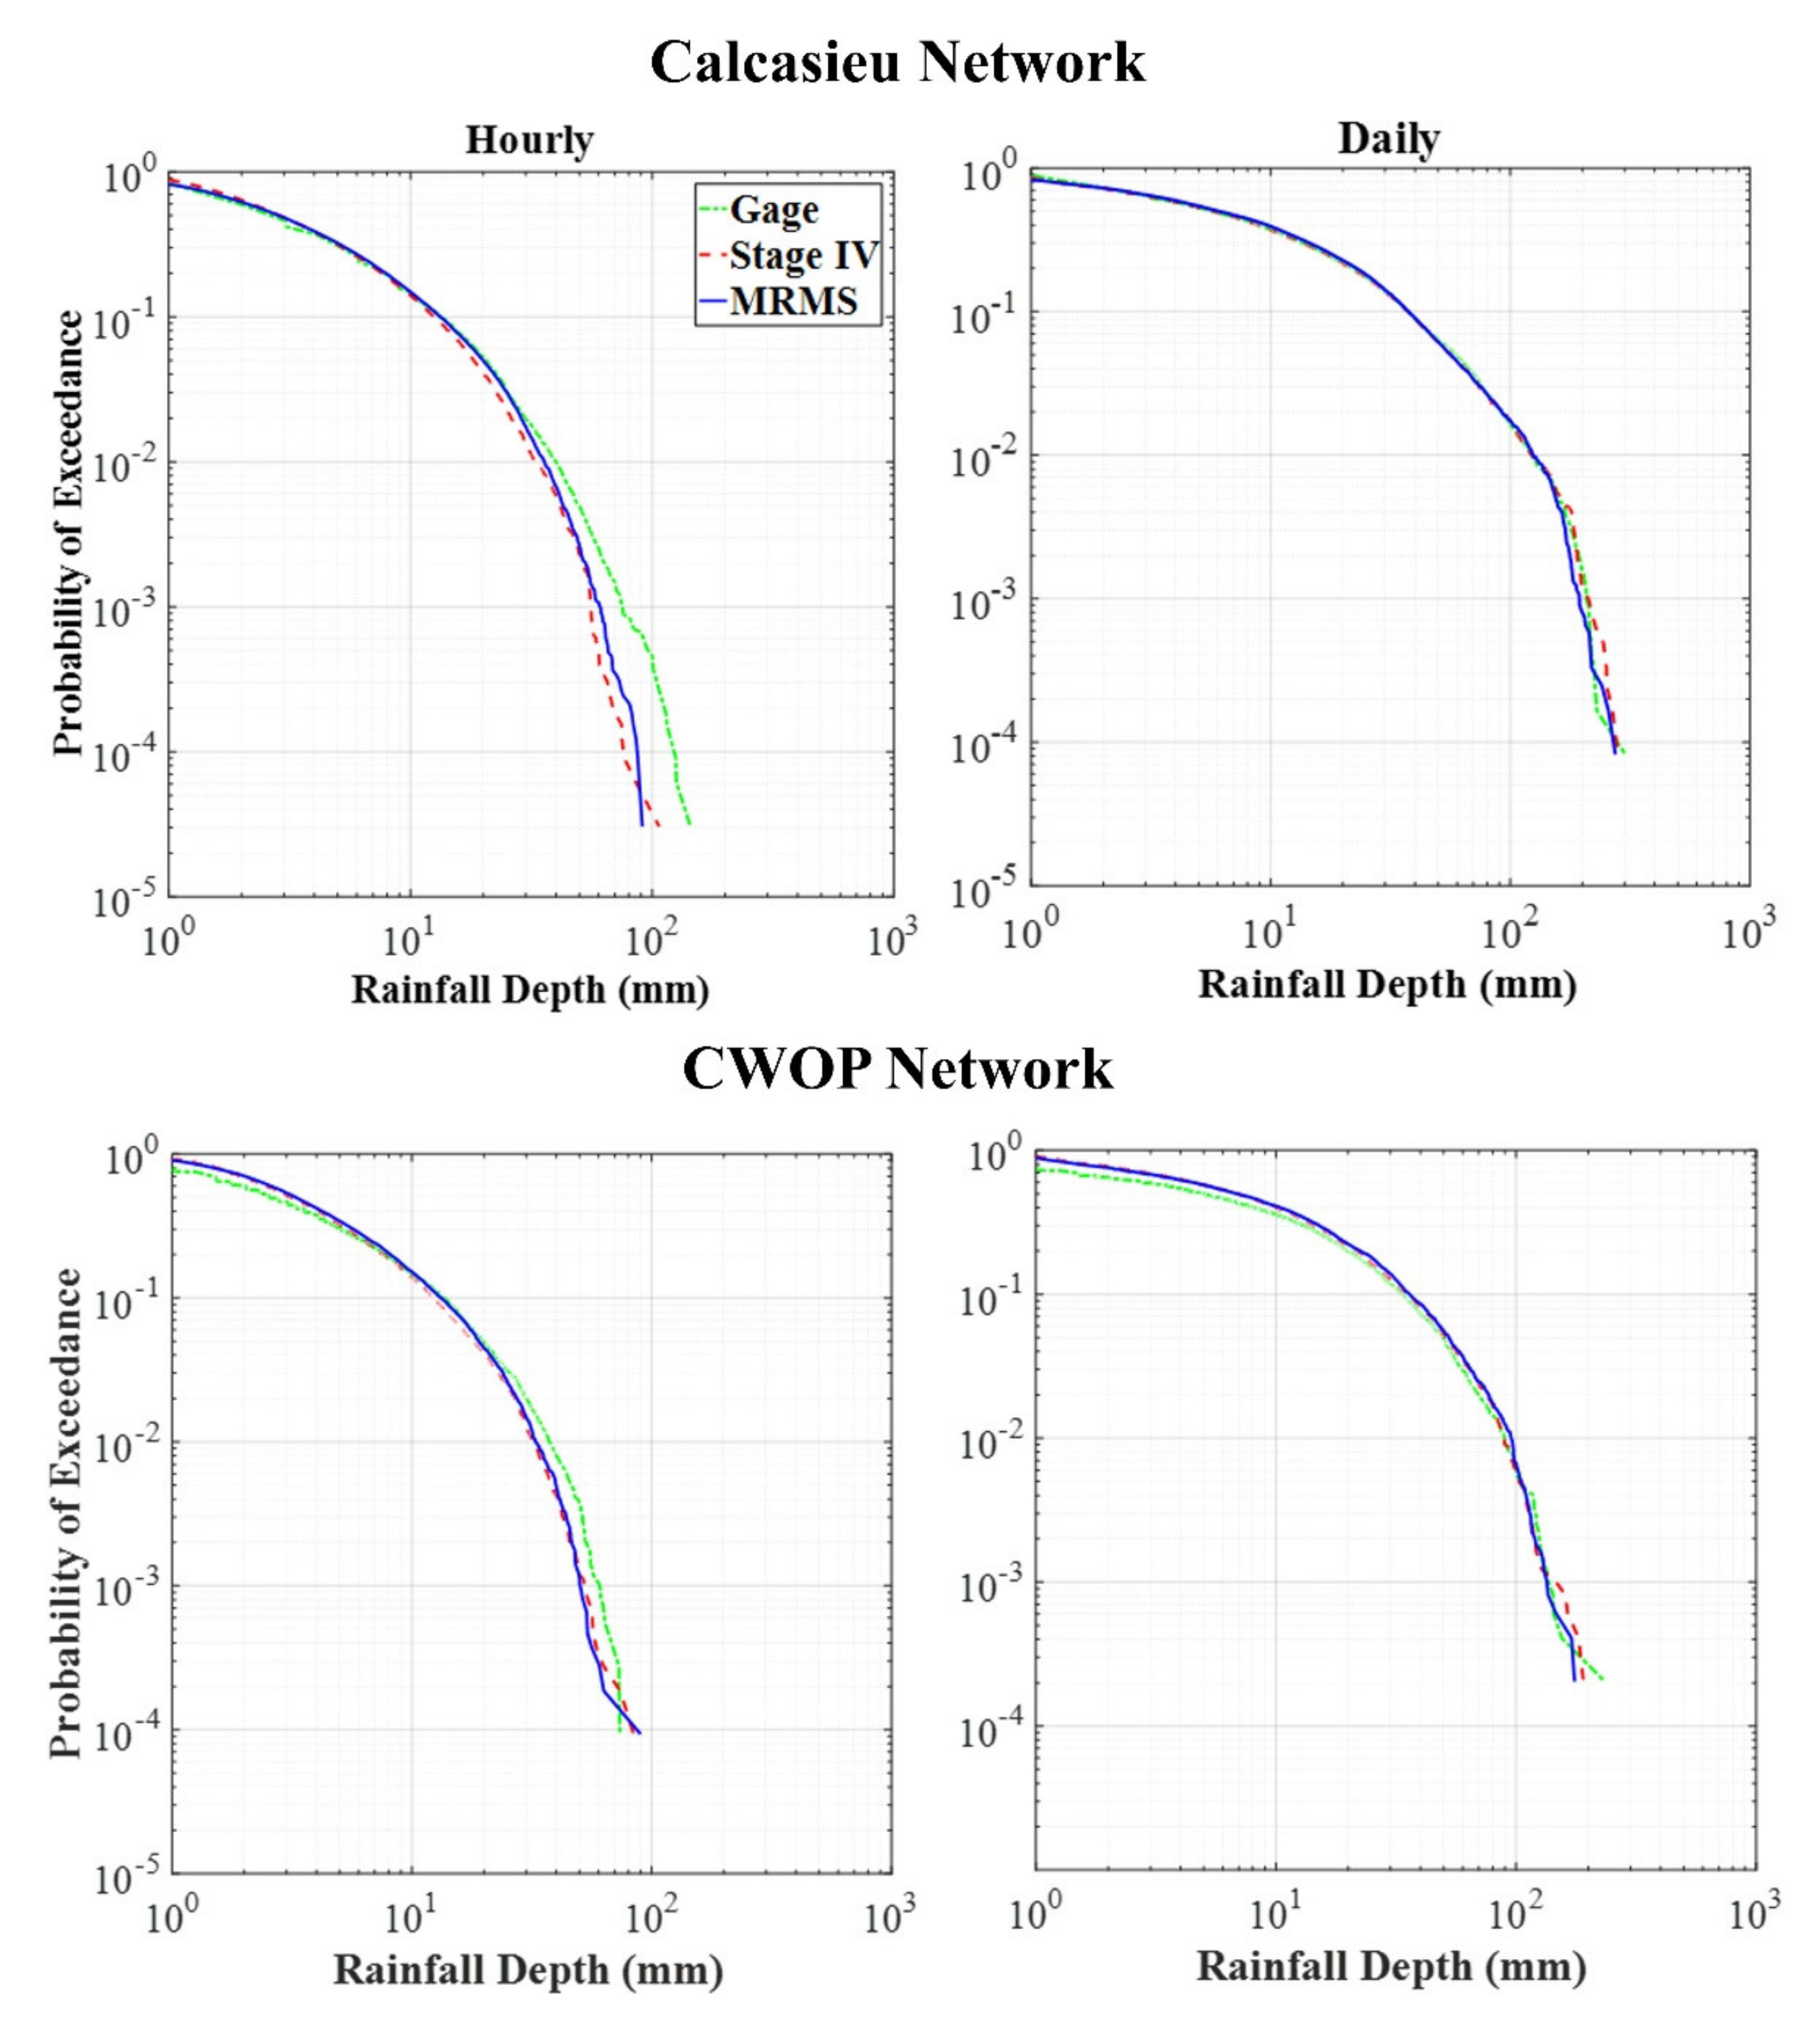
The comparison of the rainfall distributions of radar products against the gage rainfall is further analyzed using probability of exceedance (Figure 8), which is defined as the probability of rainfall exceeding a certain threshold. This will reveal the ability of radar-rainfall in reproducing the distribution of surface rainfall, which can be especially important for extreme event analysis. The probability of exceedance of both radar products agrees with the surface gage observations (the three lines mostly overlap) for small rainfall intensities (between 2–10 mm/h). The agreement is better for the Calcasieu parish network more than the CWOP network. The distributions deviate at the extreme tail (1% exceedance or lower) where both radar products show lower number of occurrences of extreme rain compared to gage observations. This is consistent with the results observed in Figure 6. The results also show that Stage IV tends to generally underestimate the probability of exceedance compared to MRMS, except at very large rainfall intensities. Given that about 90% of the hourly intensities observed by radar and gage networks are less than or equal 10 mm/h, it is expected that intensities at this range will have the most significant impact on the bias statistics of radar products. In addition, it is important to note that the small sample size at the extreme rates may affect the accuracy of the performance statistics at the tail of the distribution. It is also important to note that the scales of observations of gage (point-based) and radar (area-averaged) have significant impacts on the probability of occurrence of such high hourly rainfall rates. Extreme rainfall rates (larger than 50 mm/h) are likely to occur during convective storms that happen over small scales and may present challenges to both radar and gages. Most of these issues are resolved over larger time scales as demonstrated in the daily probability of exceedance plots.

4.4. Bias Decomposition

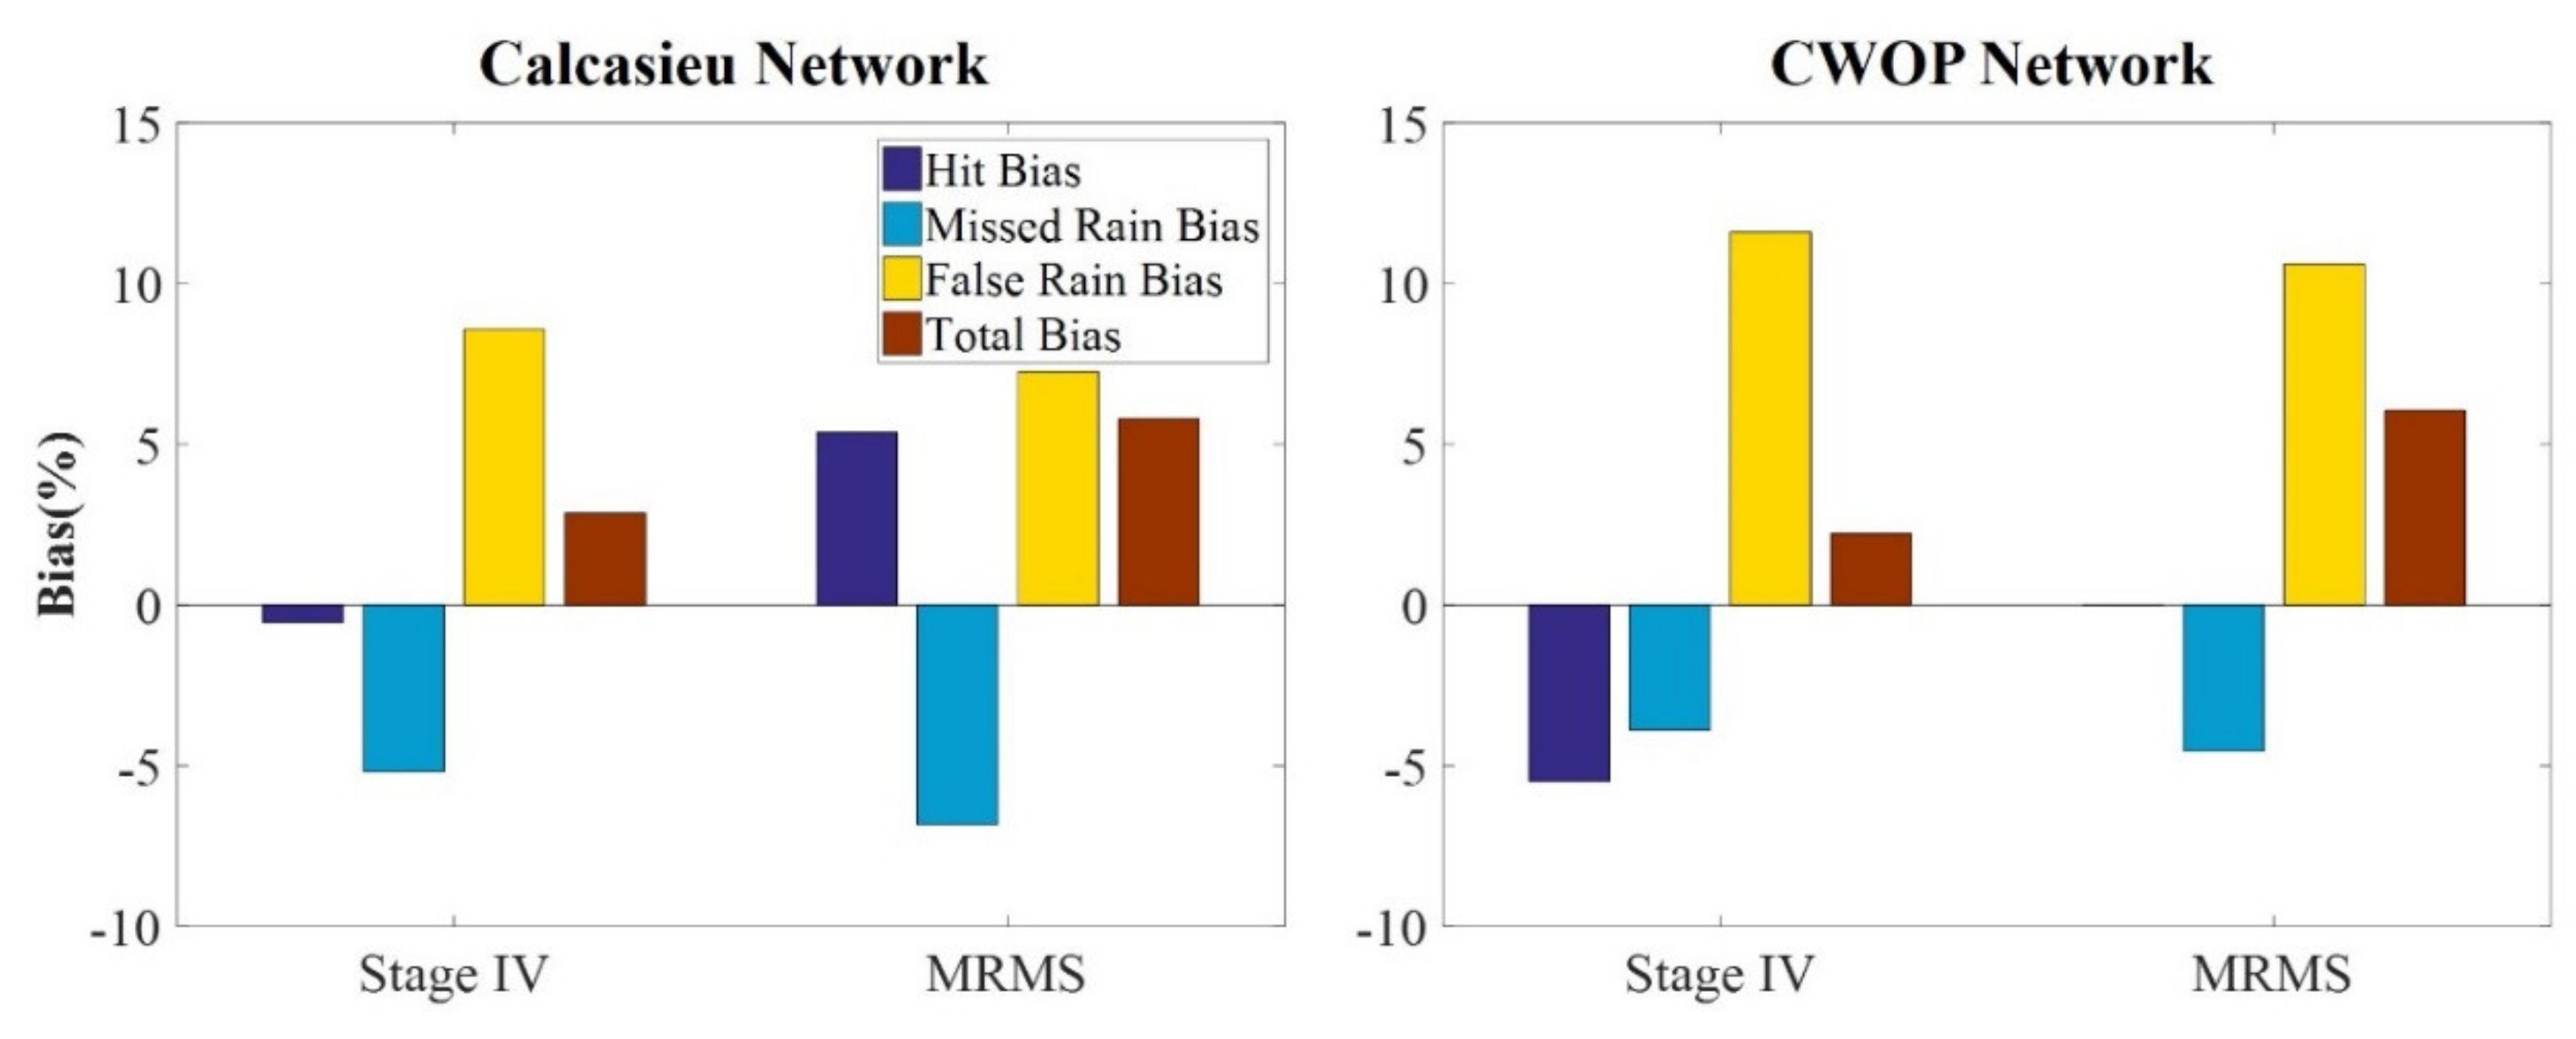
Figure 9 shows the total bias and its three conditional components; hit, missed, and false rain biases. The three bias components were calculated at the hourly scale and expressed as percentages of the total reference rainfall accumulations. Analyzing these biases individually provides information about the sources of systematic errors in the radar-rainfall products. Based on the two gage networks it seems that both products have an overall total positive bias; however, the MRMS shows a higher overestimation than the Stage IV. False rain biases are the highest relative to other types of biases for both products, especially when the CWOP is used as a ground reference. The missed rainfall biases are the second contributor to the total bias and can possibly be related to relatively high rainfall rates shown in the scatter plots of hourly rainfall intensities (Figure 6). Despite the relatively small number of missed rainfall instances (see Figure 6), they apparently resulted in considerable missed bias components. The hit biases of MRMS and Stage IV are not consistent across the two networks. MRMS showed positive and negligible hit biases in the case of Calcasieu and CWOP, respectively; while Stage IV showed negligible and negative biases. While this can be again attributed to the difference in the observational quality of the two networks, it can also be due to the fact that the region covered by the Calcasieu parish network (southwest) has seen more rainfall volumes (see annual spatial maps in Figure 4 and Figure 5) compared to the entire coastal region where the CWOP network is distributed. Attributing hit biases to a certain range of intensities is further examined in the analysis of intensity-conditional analysis presented in the next section.

4.5. Conditional Analysis

In order to gain more insight on the performance of the radar-rainfall products under different surface rainfall conditions, the conditional bias (CB) and standard deviation of the error were evaluated at different rainfall intensities (Figure 10). This is done by conditioning both statistics over a range of reference rainfall intensity values (Equations (9) and (10)). For the Calcasieu parish network, both radar products show negative CB consistently over different rainfall values except for low rainfall amounts (less than 5 mm/h) where small positive bias exists. The Stage IV conditional bias deteriorates almost linearly with increasing rainfall intensities, with a bias value exceeding –12 mm/h at the 50 mm/h intensity. MRMS shows better performance compared to Stage IV across all intensities and both networks. The conditional bias shows higher negative levels when using the CWOP as an evaluation reference compared to the Calcasieu parish network. One should note that despite the small positive biases at the beginning of the intensity distribution, these intensities are quite large in number (about 90% of the total observed rainfall) and the accumulation of errors over these small intensities can be larger than those observed at larger intensities. This happened in the case of MRMS where, despite the large underestimation at higher intensities, the hit bias was still positive in the case of the Calcasieu network. In the case of CWOP, the MRMS negative biases at larger intensities were able to cancel out those occurring at smaller intensities. As for Stage IV, the overwhelmingly negative biases at larger intensities caused the hit bias to be negative over both networks. This is especially evident for CWOP where the negative conditional biases are much higher, resulting in a large negative overall hit bias compared to the Calcasieu network.
The results of the conditional standard deviation of error (CS) are overall similar for both products. However, the MRMS product shows higher standard deviation over intensities between 20–45 mm/h for the Calcasieu network and in the tail of the distribution (40 mm/h and higher) for the CWOP network. This large variability in random errors at higher intensities in the case of MRMS can be attributed to its finer spatial scale compared to Stage IV where averaging of random errors is expected (4 km vs 1 km). The values in Figure 10 are in-line with the results presented in Habib and Qin (2011) [3], nevertheless, there is a slight improvement in the radar products’ performance in terms of the random errors compared to earlier years of the products’ record.

5. Discussion

Evaluation of radar-rainfall products have been the focus of numerous studies [13,14,17,30,43,44,45,46,47,48,49]; this section discusses the results of the current analysis in relation to such studies. The progressive improvement in radar-rainfall product performance over the years, as clearly revealed in our study, is consistent with earlier inter-product-comparison and evaluation studies that showed how the product performance varied over the years. This can be attributed to the continuous development and improvements in the National Weather Service (NWS) Weather Surveillance Radar−1988 Doppler (WSR-88D) algorithms as well as the inclusion of additional calibration datasets (e.g., rain gage networks). Our analysis specifically highlights the value of the recent use of the MRMS base reflectivity fields to alleviate the spatial discontinuities in the Stage IV products. The improvement in product performance at larger time scales (e.g., daily and higher) that we observed over coastal Louisiana is consistent with results from other coastal areas such as the Carolinas [50]. This was also consistent with earlier findings from southern Louisiana [16] where the overall estimation bias was significantly smaller when calculated on an annual scale compared to event-based biases. The conditional dependence of both the systematic and random errors of the Stage IV product on the surface rainfall rate was a key finding in our studies, similar to Habib et al. (2009) [16] where Stage IV overestimated rainfall amounts of relatively low rainfall rates and underestimated relatively large rainfall rates. Similarly, a comparison of Stage IV to rain gage observations over the United States Mid-West [51] showed that Stage IV overestimated in case of lower rainfall amounts and underestimated or relatively matched higher rainfall amounts. While results from a US continental-scale study [17] showed that the MRMS product consistently had higher correlations and lower biases than the Stage IV, our study did not necessarily reveal any superior performance of one of the two products. The apparent regional-dependent behavior across the two products was also evident in a recent study over central and northeastern Iowa [19] that assessed the performance of six radar products, including Stage IV and MRMS, and found that Stage IV performed better than MRMS and other radar-rainfall estimates. Our conditional bias analysis indicated that both the MRMS and Stage IV rainfall products underestimated the heavy rainfall, some of this heavy rain could be attributed to tropical rain events that occurred over our study. Such systematic underestimation could be caused by issues such as attenuation, vertical variations of reflectivity, and unrepresentative rainfall-reflectivity relationships. Future developments on the use of dual-polarization estimation techniques (e.g., differential reflectivity, [9]) can bring much needed improvements to the rainfall products. Both products also show some signs of beam blockages over the study area that need to be addressed. Overall, our study showed that the two products had different levels of performance depending on the evaluation criteria and the time scale of interest. This may highlight the contribution of inadequate rain gauge coverage necessary for bias-correction algorithms of multi-sensor rainfall products such as Stage IV and MRMS products, especially in remote coastal regions such as our study area.

6. Summary and Conclusions

In this study we evaluated the performance of radar-rainfall estimates from two products, Stage IV and MRMS, over Louisiana’s coastal region, an area that has scarce ground observations. Such evaluation can inform ongoing and future hydro-ecological modeling and coastal planning studies on the strengths and limitations of radar-based rainfall products. The evaluation analysis also provides an insight on the possible improvements needed in the estimation algorithms of the radar products over gauge-sparse coastal areas. We used two independent rain gage networks, the Calcasieu parish and CWOP, as ground reference to perform the evaluation. The evaluation criteria included a series of visual and statistical measures, both unconditional and conditional, evaluated at different temporal scales. Prior to performing the direct comparisons between radar and gage rainfall, we first confirmed the adequacy of the point-based rain gage observations in representing rainfall rates at the spatial resolution of the radar products. The analysis started by identifying spatial artifacts that are visible in the radar-rainfall accumulation maps and their possible causes. Next, we conducted a statistical characterization of the differences between the radar-based rainfall products and the reference rainfall at multiple time scales (hourly to monthly). Using the probability of exceedance plots, we were able to investigate the distribution of the rainfall intensities obtained from both radar and rain gage rainfall and how they compare to each other. In addition, we categorized different sources of biases that contribute to the overall bias between the radar-rainfall products and our reference rainfall. This was done by decomposing the overall bias into hit, missed, and false rain biases. Lastly, we investigated the products’ performance dependency on the magnitude of rainfall intensity by conditioning the mean and standard deviation of the estimation errors on incremental values of the reference rainfall rate.
The following conclusions can be derived based on the analysis performed in the current study:
  • Overall, based on visual inspection of the annual accumulation maps, both products show similar spatial accumulations at the annual scale, with MRMS showing more high-intensity clusters, attributable to its higher spatial resolution. Improvements in spatial mosaicking in Stage IV rainfall product were apparent starting in 2015, mainly due to the incorporation of base reflectivity fields from the MRMS system. Nevertheless, other spatial artifacts such as beam blockage and halo-shaped rainfall overestimation around some radar locations are still present in both products.
  • Direct comparisons against the reference rainfall showed considerable differences as large as 15–30 mm/h at the hourly scale, 30−45 mm/day at the daily scale and 50−70 mm/month at the monthly scale. Despite the significant scatter at the hourly scale, both radar products showed better agreement with the surface rainfall as the time scale increases beyond hourly. The most improvement is achieved by going from the hourly to 6-hour scale.
  • The distributions of radar-rainfall intensities slightly overestimated the occurrence of small rainfall intensities compared to the reference rainfall, but deviate significantly at the extreme tail (large intensities) where the radar products underestimate the probability of occurrences compared to the rain gages. Closer agreement is evident between the tails of the radar-gage distributions at daily scale indicating an improved performance as time scale increases.
  • Both products have an overall total positive bias, with false-rain and missed-rainfall bias components being the largest contributors.
  • Stage IV and MRMS consistently underestimated rainfall when conditioned on specific reference rainfall rates. The conditional bias deteriorates almost linearly with increasing rainfall rates, with biases reaching −10 to −15 mm/h at the 50 mm/h rate of surface rainfall. Similarly, both products show dependence of the random error on the magnitude of surface rainfall. The standard deviation of the random increases proportionally to rainfall intensities, reaching as high as 15 mm/h at the 50 mm/h rate of surface rainfall.

Author Contributions

R.B.S. performed the analysis, helped with data curation and validation, and writing of the original draft. E.H.H. conceived and designed the experiments, methodology, writing original draft, and performed draft revisions. M.E. participated in data curation, analysis, writing original draft, and performed draft revisions. All authors have read and agreed to the published version of the manuscript.

Funding

This project was funded by The Water Institute of the Gulf under project award (Evaluation of Radar-Based Precipitation Datasets for Applications in the Louisiana Coastal Master Plan). This project was paid for in part with federal funding from the Department of the Treasury through the Louisiana Coastal Protection and Restoration Authority’s Center of Excellence Research Grants Program under the Resources and Ecosystems Sustainability, Tourist Opportunities, and Revived Economies of the Gulf Coast States Act of 2012 (RESTORE Act). The statements, findings, conclusions, and recommendations are those of the author and do not necessarily reflect the views of the Department of the Treasury, CPRA or The Water Institute of the Gulf.

Acknowledgments

The authors would like to thank Jeff Graschel, Scott Lincoln and David Welch from the Lower Mississippi River Forecasting Center for providing insightful discussions about the radar products. The authors also thank Allen Wainwright and the staff of the Public Works Department at the Calcasieu Parish Police Jury for providing rain gauge data from their regional network.

Conflicts of Interest

The authors declare no conflict of interest.

References

  1. Habib, E.; Haile, A.T.; Tian, Y.; Joyce, R.J. Evaluation of the high-resolution CMORPH satellite rainfall product using dense rain gage observations and radar-based estimates. J. Hydrometeorol. 2012, 13, 1784–1798. [Google Scholar] [CrossRef]
  2. Lee, T.; Sacks, L.; Swancar, A. Exploring the long-term balance between net precipitation and net groundwater exchange in Florida seepage lakes. J. Hydrol. 2014, 519, 3054–3068. [Google Scholar] [CrossRef] [Green Version]
  3. Habib, E.; Qin, L. Application of a radar-rainfall uncertainty model to the NWS multi-sensor precipitation estimator products. Meteorol. App. 2011, 20, 276–286. [Google Scholar] [CrossRef]
  4. Kitzmiller, D.; Miller, D.; Fulton, R.; Ding, F. Radar and multisensor precipitation estimation techniques in National Weather Service hydrological operations. J. Hydrol. Eng. 2013, 18, 133–142. [Google Scholar] [CrossRef]
  5. Eldardiry, H.; Habib, E.; Zhang, Y.; Graschel, J. Artifacts in Stage IV NWS real-time multisensor precipitation estimates and impacts on identification of maximum series. J. Hydrol. Eng. 2015, 22, E4015003. [Google Scholar] [CrossRef]
  6. Gourley, J.J.; Calvert, C.M. Automated detection of the bright band using WSR-88D data. Weather. Forecast. 2003, 18, 585–599. [Google Scholar] [CrossRef]
  7. Krajewski, W.F.; Villarini, G.; Smith, J.A. RADAR-rainfall uncertainties. Q. J. R. Meteorol. Soc. 2009, 91, 87–94. [Google Scholar] [CrossRef]
  8. Lin, Y.; Mitchell, K.E. The NCEP Stage II/IV hourly precipitation analyses: Development and applications. In Proceedings of the 19th Conference on Hydrology, American Meteorological Society, San Diego, CA, USA, 9–13 January 2005. [Google Scholar]
  9. Zhang, J.; Howard, K.; Langston, C.; Kaney, B.; Qi, Y.; Tang, L.; Grams, H.; Wang, Y.; Cocks, S.; Martinaitis, S.; et al. Multi-Radar Multi-Sensor (MRMS) quantitative precipitation estimation: Initial operating capabilities. Bull. Am. Meteorol. Soc. 2016, 97, 621–638. [Google Scholar] [CrossRef]
  10. Nelson, B.R.; Prat, O.P.; Seo, D.; Habib, E. Assessment and implications of NCEP Stage IV quantitative precipitation estimates for product intercomparisons. Weather. Forecast. 2016, 31, 371–394. [Google Scholar] [CrossRef]
  11. Seo, B.C.; Cunha, L.K.; Krajewski, W.F. Uncertainty in radar-rainfall composite and its impact on hydrological prediction for the eastern Iowa flood of 2008. Water Resour. Res. 2013, 49, 2747–2764. [Google Scholar] [CrossRef]
  12. Kim, D.; Nelson, B.; Seo, D.J. Characteristics of reprocessed Hydrometeorological Automated Data System (HADS) hourly precipitation data. Weather. Forecast. 2009, 24, 1287–1296. [Google Scholar] [CrossRef]
  13. Habib, E.; Qin, L.; Seo, D.; Ciach, G.J.; Nelson, B.R. Independent assessment of incremental complexity in NWS multisensor precipitation estimator algorithms. J. Hydrol. Eng. 2013, 18, 143–155. [Google Scholar] [CrossRef]
  14. Prat, O.P.; Nelson, B.R. Evaluation of precipitation estimates over CONUS derived from satellite, radar, and rain gage data sets at daily to annual scales (2002–2012). Hydrol. Earth Syst. Sci. 2015, 19, 2037–2056. [Google Scholar] [CrossRef] [Green Version]
  15. Adams, T.E., III; Dymond, R.L. Possible hydrological forecasting improvements resulting from advancements in precipitation estimation and forecasting for a real-time flood forecast system in the Ohio River Valley USA. J. Hydrol. 2019, 579, 124138. [Google Scholar] [CrossRef]
  16. Habib, E.; Larson, B.F.; Graschel, J. Validation of NEXRAD multisensor precipitation estimates using an experimental dense rain gage network in south Louisiana. J. Hydrol. 2009, 373, 463–478. [Google Scholar] [CrossRef]
  17. Wu, W.; Kitzmiller, D.; Wu, S. Evaluation of radar precipitation estimates from the national mosaic and multisensor quantitative precipitation estimation system and the WSR-88D precipitation processing system over the conterminous United States. J. Hydrometeorol. 2011, 13, 1080–1093. [Google Scholar] [CrossRef]
  18. Chen, S.; Gourley, J.J.; Hong, Y.; Kirstetter, P.E.; Zhang, J.; Howard, K.; Flamig, Z.L.; Hu, J.; Qi, Y. Evaluation and uncertainty estimation of NOAA/NSSL next-generation National Mosaic Quantitative Precipitation Estimation product (Q2) over the continental United States. J. Hydrometeorol. 2013, 14, 1308–1322. [Google Scholar] [CrossRef] [Green Version]
  19. Seo, B.C.; Krajewski, W.F.; Quintero, F.; ElSaadani, M.; Goska, R.; Cunha, L.K.; Dolan, B.; Wolff, D.B.; Smith, J.A.; Rutledge, S.A.; et al. Comprehensive evaluation of the IFloodS radar rainfall products for hydrological applications. J. Hydrometeorol. 2018, 19, 1793–1813. [Google Scholar] [CrossRef]
  20. Habib, E.; Larson, B.F.; Nuttle, W.K.; Rivera-Monroy, V.H.; Nelson, B.R.; Meselhe, E.A.; Twilley, R.R. Effect of rainfall spatial variability and sampling on salinity prediction in an estuarine system. J. Hydrol. 2008, 350, 56–67. [Google Scholar] [CrossRef]
  21. Gourley, J.J.; Hong, Y.; Flamig, Z.L.; Wang, J.H.; Vergara, H.; Anagnostou, E.N. Hydrological evaluation of rainfall estimates from radar, satellite, gage, and combinations on Ft. Cobb basin, Oklahoma. J. Hydrometeorol. 2011, 12, 973–988. [Google Scholar] [CrossRef] [Green Version]
  22. Cunha, L.K.; Mandapaka, P.V.; Krajewski, W.F.; Mantilla, R.; Bradley, A.A. Impact of radar-rainfall error structure on estimated flood magnitude across scales: An investigation based on a parsimonious distributed hydrological model. Water Resour. Res. 2012, 48, W10515. [Google Scholar] [CrossRef]
  23. Quintero, F.; Krajewski, W.F.; Mantilla, R.; Small, S.; Seo, B. A spatial–dynamical framework for evaluation of satellite rainfall products for flood prediction. J. Hydrometeorol. 2016, 17, 2137–2154. [Google Scholar] [CrossRef]
  24. ElSaadani, M. A Spatio-temporal Dynamical Evaluation of Satellite Rainfall Products in Hydrological Applications. Ph.D. Thesis, University of Iowa, Iowa City, IA, USA, August 2017. [Google Scholar]
  25. ElSaadani, M.; Krajewski, W.F.; Zimmerman, D.L. River network based characterization of errors in remotely sensed rainfall products in hydrological applications. Rem. Sens. Let. 2018, 9, 743–752. [Google Scholar] [CrossRef]
  26. Xie, T.; Cui, B.; Li, S.; Wang, Q.; Shi, W. Rainfall variation shifts habitat suitability for seedling establishment associated with tidal inundation in salt marshes. Ecol. Indic. 2018, 98, 694–703. [Google Scholar] [CrossRef]
  27. Summer, D.M.; Belaineh, G. Evaporation, Precipitation, and Associated Salinity Changes at a Humid, Subtropical Estuary. Estuaries 2005, 28, 844–855. [Google Scholar] [CrossRef]
  28. Louisiana Coastal Protection and Restoration Authority. Louisiana’s Comprehensive Master Plan for a Sustainable Coast. Louisiana Coastal Protection and Restoration Authority, Baton Rouge. 2012. Available online: https://coastal.la.gov/2012-coastal-master-plan/ (accessed on 4 May 2020).
  29. Louisiana Coastal Protection and Restoration Authority. Louisiana’s Comprehensive Master Plan for a Sustainable Coast. Louisiana Coastal Protection and Restoration Authority, Baton Rouge. 2017. Available online: http://coastal.la.gov/our-plan/2017-coastal-master-plan/ (accessed on 4 May 2020).
  30. Young, C.B.; Morrissey, M.L.; Krajewski, W.F.; Bradley, A.A.; Kruger, A. Evaluating NEXRAD Multisensor Precipitation Estimates for operational hydrological forecasting. J. Hydrometeorol. 2000, 1, 241–254. [Google Scholar] [CrossRef] [Green Version]
  31. Zhang, Y.; Reed, S.; Kitzmiller, D. Effects of retrospective gage-based readjustment of multisensor precipitation estimates on hydrological simulations. J. Hydrometeorol. 2010, 12, 429–443. [Google Scholar] [CrossRef] [Green Version]
  32. Lopez, P. Direct 4D-Var assimilation of NCEP Stage IV radar and gage precipitation data at ECMWF. Month. Weath. Rev. 2011, 139, 2098–2116. [Google Scholar] [CrossRef]
  33. Smalley, M.; L’Ecuyer, T.; Lebsock, M.; Haynes, J. A comparison of precipitation occurrence from the NCEP Stage IV QPE product and the CloudSat cloud profiling radar. J. Hydrometeorol. 2013, 15, 444–458. [Google Scholar] [CrossRef]
  34. Reed, S.M.; Maidment, D.R. Coordinate Transformations for Using NEXRAD Data in GIS-based Hydrological Modeling. J. Hydrol. Eng. 1999, 4, 174–182. [Google Scholar] [CrossRef]
  35. Fulton, R.A.; Miller, D.A.; Seo, D.-J.; Breidenbach, J.P.; O’Bannon, T. The WSR-88D rainfall algorithm. Weather. Forecast. 1998, 13, 377–395. [Google Scholar] [CrossRef]
  36. Qi, Y.; Martinaitis, S.; Zhang, J.; Cocks, S. A real-time automated quality control of hourly rain gage data based on multiple sensors in MRMS system. J. Hydrometeorol. 2016, 17, 1675–1691. [Google Scholar] [CrossRef]
  37. Lewis, E.; Quinn, N.; Blenkinsop, S.; Fowler, H.J.; Freer, J.; Tanguy, M.; Hitt, O.; Coxon, G.; Bates, P.; Woods, R. A rule based quality control method for hourly rainfall data and a 1 km resolution gridded hourly rainfall dataset for Great Britain: CEH-GEAR1hr. J. Hydrol. 2018, 564, 930–943. [Google Scholar] [CrossRef]
  38. Hamada, A.; Arakawa, O.; Yatagai, A. An automated quality control method for daily rain-gage data. Glob. Environ. Res. 2011, 15, 183–192. [Google Scholar]
  39. Blenkinsop, S.; Lewis, E.; Chan, S.C.; Fowler, H.J. Quality-control of an hourly rainfall dataset and climatology of extremes for the UK. Int. J. Climatol. 2016, 37, 722–740. [Google Scholar] [CrossRef] [Green Version]
  40. Villarini, G.; Mandapaka, P.V.; Krajewski, W.F.; Moore, R.J. Rainfall and sampling uncertainties: A rain gage perspective. J. Geophys. Res. Atmos. 2008, 113, 1–12. [Google Scholar] [CrossRef]
  41. Habib, E.; Krajewski, W.F. Uncertainty analysis of the TRMM ground-validation radar-rainfall products: Application to the TEFLUN-B field campaign. J. App. Meteorol. 2002, 41, 558–572. [Google Scholar] [CrossRef]
  42. Ciach, G.J.; Krajewski, W.F.; Villarini, G. Product-error-driven uncertainty model for probabilistic quantitative precipitation estimation with NEXRAD data. J. Hydrometeorol. 2007, 8, 1325–1347. [Google Scholar] [CrossRef]
  43. Jayakrishnan, R.; Srinivasan, R.; Arnold, J.G. Comparison of raingage and WSR-88D Stage III precipitation data over the Texas-Gulf basin. J. Hydrol. 2004, 292, 135–152. [Google Scholar] [CrossRef]
  44. Yilmaz, K.K.; Hogue, T.S.; Hsu, K.; Sorooshian, S.; Gupta, H.V.; Wagner, T. Intercomparison of rain gauge, radar, and satellite-based precipitation estimates with emphasis on hydrological forecasting. J. Hydrometeor. 2005, 6, 497–517. [Google Scholar] [CrossRef]
  45. Over, T.M.; Murphy, E.A.; Ortel, T.W.; Ishii, A.L. Comparisons between NEXRAD radar and tipping-bucket gage rainfall data: A case study for DuPage county, Illinois. In Proceedings of the World Environmental and Water Resources Congress, Tampa, FL, USA, 15–19 May 2007. [Google Scholar]
  46. Young, C.B.; Brunsell, N.A. Evaluating NEXRAD estimates for the Missouri River basin: Analysis using daily raingauge data. J. Hydrol. Eng. 2008, 13, 549–553. [Google Scholar] [CrossRef] [Green Version]
  47. Wang, X.; Xie, H.; Sharif, H.; Zeitler, J. Validating NEXRAD MPE and Stage III precipitation products for uniform rainfall on the Upper Guadalupe River Basin of the Texas Hill Country. J. Hydrol. 2008, 348, 73–86. [Google Scholar] [CrossRef]
  48. Nelson, B.R.; Seo, D.-J.; Kim, D. Multisensor Precipitation Reanalysis. J. Hydrometeor. 2010, 11, 666–682. [Google Scholar] [CrossRef]
  49. Kursinski, A.L.; Mullen, S.L. Spatiotemporal variability of hourly precipitation over the eastern contiguous United States from Stage IV multisensor analyses. J. Hydrometeorol. 2008, 9, 3–21. [Google Scholar] [CrossRef]
  50. Boyles, R.; Raman, S.; Sims, A.; Schwab, S.; Horgan, K.; Brooks, M.; Frazier, A. January Evaluation and applications of NCEP stage II and stage IV gage-corrected radar precipitation estimates over the Carolinas. In Proceedings of the 20th Conference on Hydrology, Atlanta, GA, USA, 30 January 2006. [Google Scholar]
  51. Westcott, N.E.; Knapp, H.V.; Hilberg, S.D. Comparison of gage and multi-sensor precipitation estimates over a range of spatial and temporal scales in the Midwestern United States. J. Hydrol. 2008, 351, 1–12. [Google Scholar] [CrossRef]
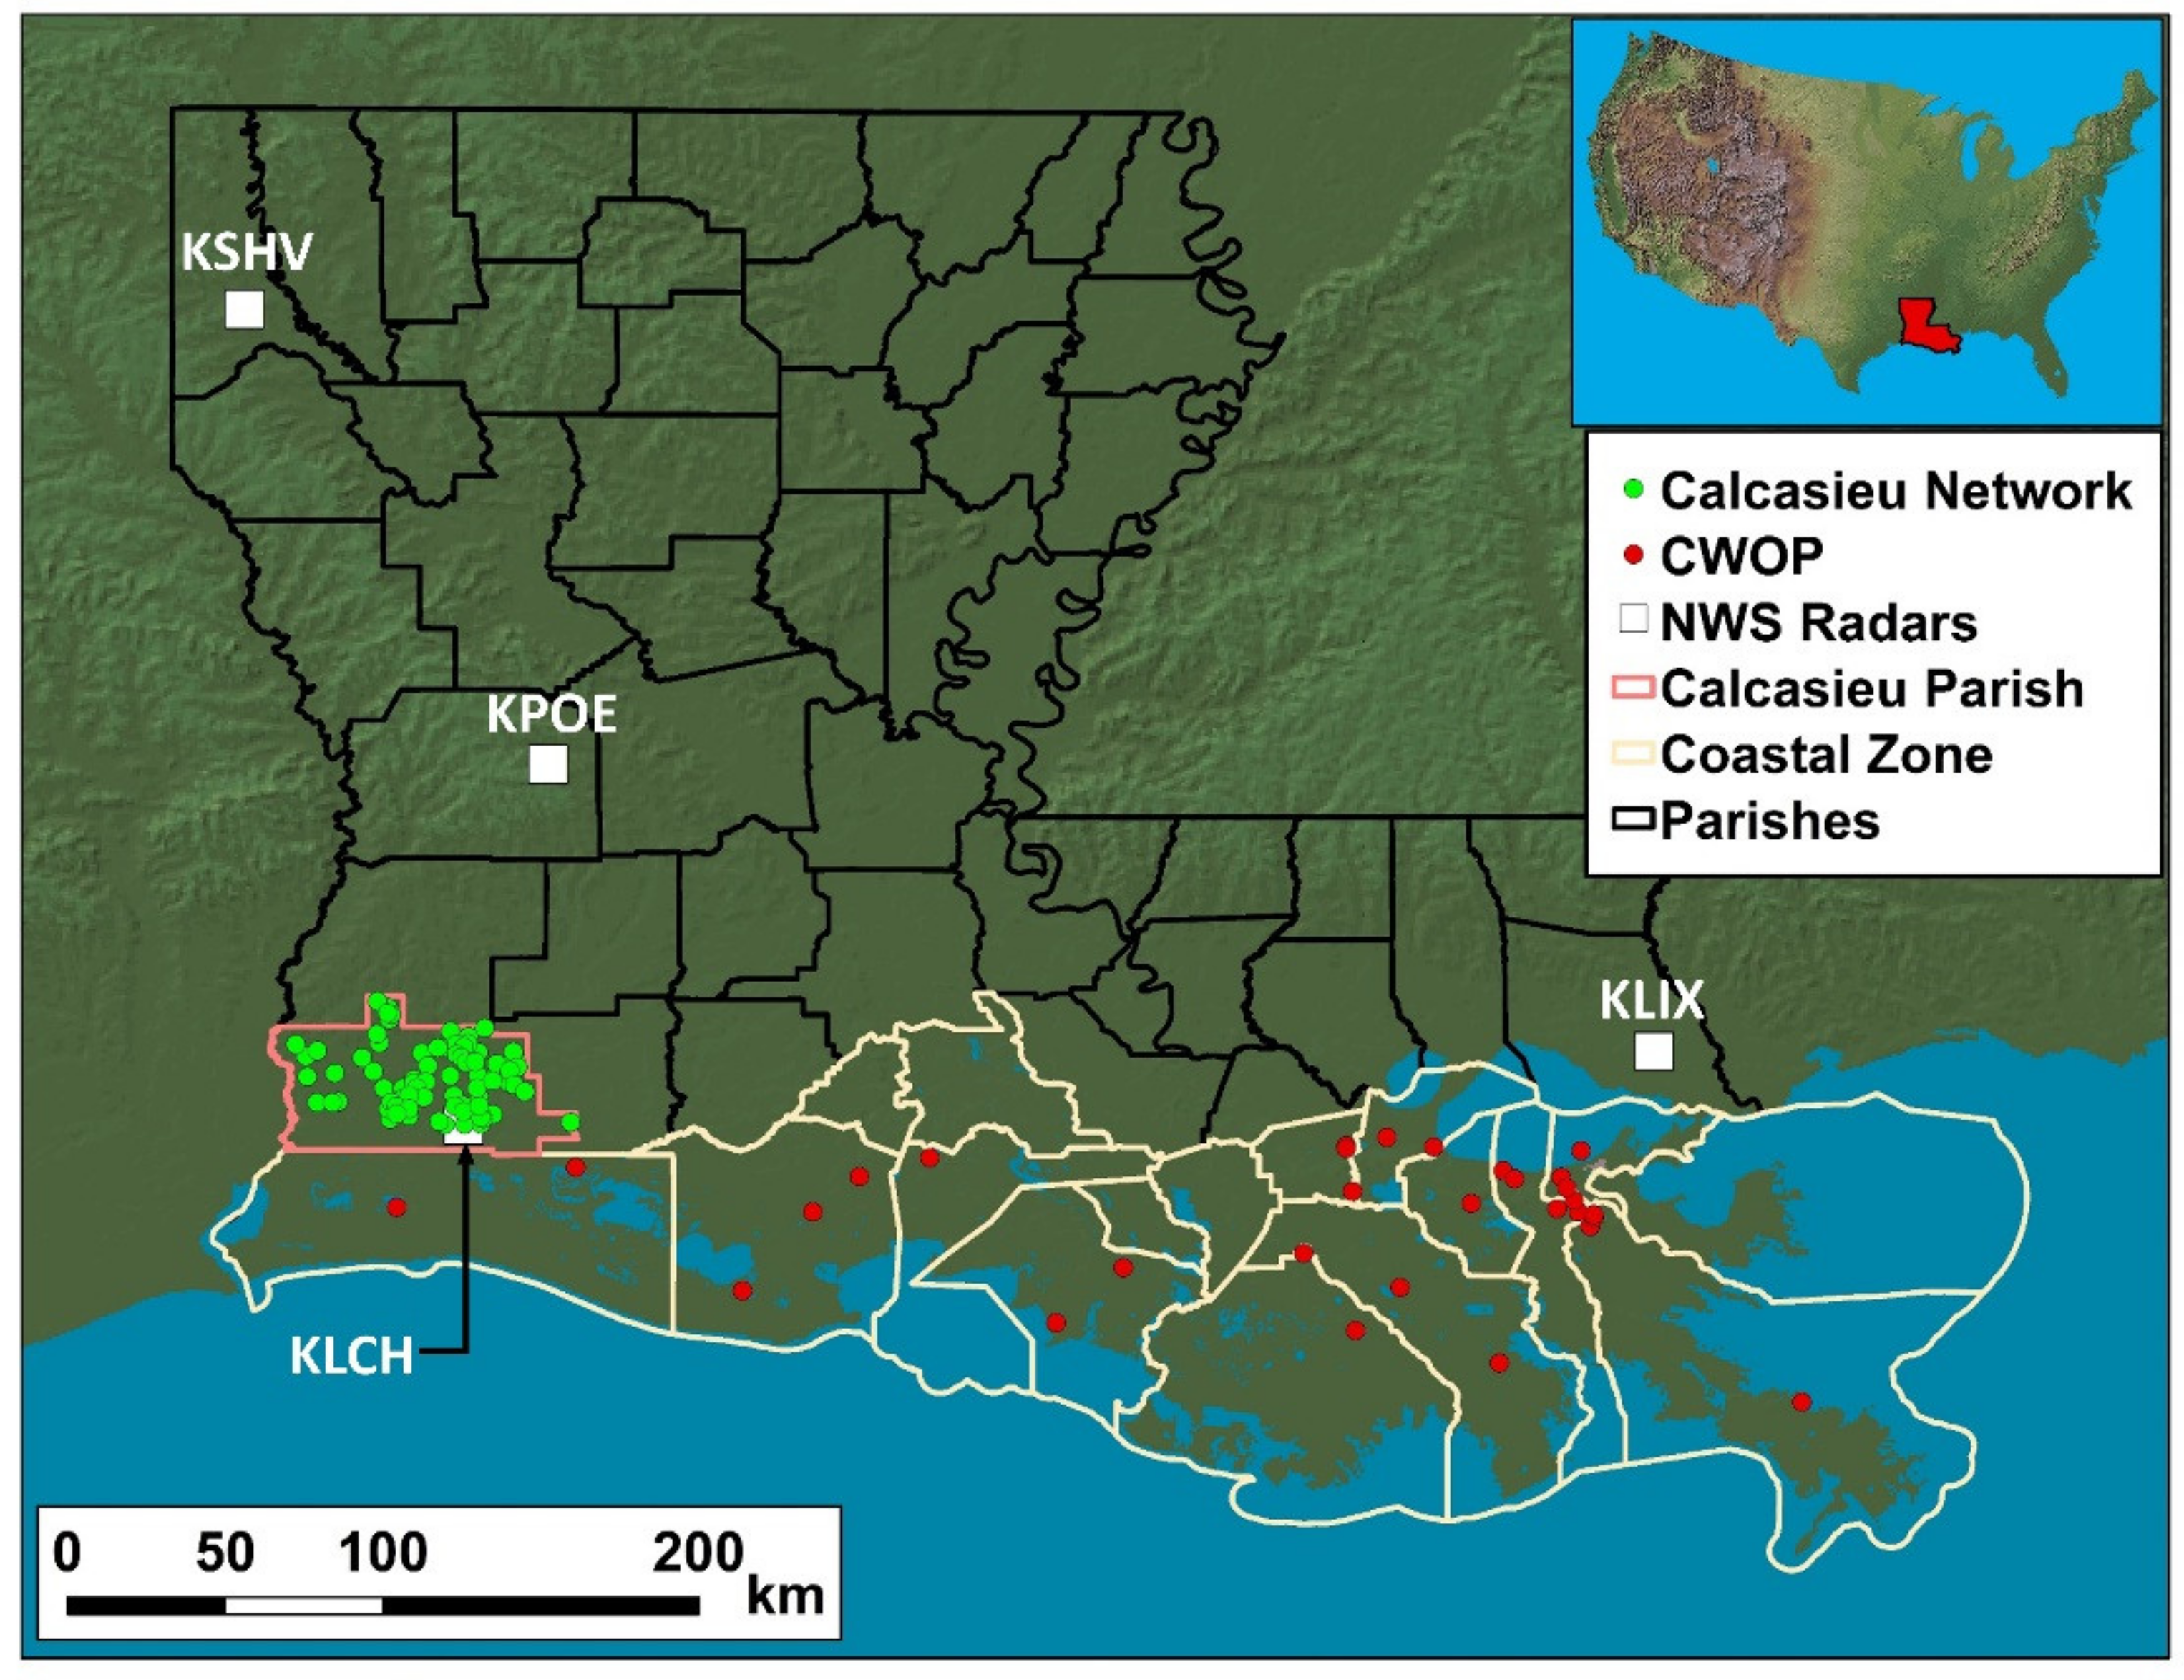
Figure 1. Map showing the Calcasieu Parish network (green dots) and the Citizen Weather Observer Program (CWOP) network (red dots) over coastal Louisiana. The white squares depict the locations of the NWS Doppler radars (WSR-88D) in Lake Charles (KLCH), Slidell (KLIX), Fort Polk (KPOE) and Shreveport (KSHV).
Remotesensing 12 01477 g001
Figure 2. Empirical spatial correlation function of rainfall at hourly (left) and daily (right) scales using the Calcasieu network observations over the study period (January 2017 through August 2018).
Remotesensing 12 01477 g002
Figure 3. Stage IV spatial rainfall accumulation maps in millimeters for the years 2012 through 2016 over the state of Louisiana. The white dots represent the locations of the different NWS NEXRAD radars.
Remotesensing 12 01477 g003
Figure 4. Spatial rainfall accumulation maps in millimeters of Stage IV (left) and Multi-Radar Multi-(MRMS), (right), for the year 2017.
Remotesensing 12 01477 g004
Figure 5. Spatial rainfall accumulation maps (millimeters) of Stage IV (left) and MRMS (right) for the period January through August of 2018.
Remotesensing 12 01477 g005
Figure 6. Scatter plots of the radar products (Stage IV and MRMS) versus surface reference rainfall for the Calcasieu network (top panel) and Citizen Weather Observation Program (CWOP), (bottom panel), at hourly (left), daily (middle), and monthly (left) scales.
Remotesensing 12 01477 g006
Figure 7. Correlation coefficient and normalized root mean square error (NRMSE) of radar and gage estimates as a function of different temporal scales.
Remotesensing 12 01477 g007
Figure 8. Comparison of probability of exceedance of rainfall intensities for the Stage IV and MRMS products against the surface rainfall networks. The comparison is performed for hourly (left column) and daily (right column) scales.
Remotesensing 12 01477 g008
Figure 9. Decomposition of the total bias of radar-rainfall products (Stage IV and MRMS) into three components (hit, missed, and false rain bias) for the Calcasieu and CWOP networks. The decomposed bias components are expressed as percentages of the total rainfall depth.
Remotesensing 12 01477 g009
Figure 10. Conditional bias and standard deviation of the radar estimation error as a function of surface reference rain rate for Calcasieu and CWOP networks.
Remotesensing 12 01477 g010
Table 1. Basic statistical skill scores for both radar-rainfall products over the entire study period (January 2017 through August 2018).
Average Rainfall Depth (mm)Bias (mm/Unit Time)Standard Deviation of Error (mm/Unit Time)Correlation CoefficientNRMSE
Calcasieu Network Stage IV Hourly 4.76 0.03 4.78 0.79 0.86
Daily 14.70 0.17 9.22 0.93 0.58
Monthly 146.85 0.55 35.63 0.96 0.24
MRMS Hourly 5.03 0.33 4.88 0.79 0.88
Daily 15.37 0.39 9.46 0.92 0.60
Monthly 150.57 3.82 37.41 0.96 0.26
CWOP Network Stage IV Hourly 5.09 0.14 5.39 0.700.87
Daily14.151.539.15 0.88 0.60
Monthly135.7015.5439.470.930.34
MRMSHourly5.430.325.400.710.86
Daily15.021.959.090.890.61
Monthly138.7918.8739.590.930.36